Next Article in Journal
An In-Orbit Measurement Method for Elevation Antenna Pattern of MEO Synthetic Aperture Radar Based on Nano Calibration Satellite
Previous Article in Journal
Modelling of Greek Lakes Water Quality Using Earth Observation in the Framework of the Water Framework Directive (WFD)
 
 
remotesensing-logo
Article Menu
Correction published on 18 March 2022, see Remote Sens. 2022, 14(6), 1459.
Article

The Brazilian Soil Spectral Service (BraSpecS): A User-Friendly System for Global Soil Spectra Communication

by
José A. M. Demattê
1,*,
Ariane Francine da Silveira Paiva
1,
Raul Roberto Poppiel
1,
Nícolas Augusto Rosin
1,
Luis Fernando Chimelo Ruiz
1,
Fellipe Alcantara de Oliveira Mello
1,
Budiman Minasny
2,
Sabine Grunwald
3,
Yufeng Ge
4,
Eyal Ben Dor
5,
Asa Gholizadeh
6,
Cecile Gomez
7,
Sabine Chabrillat
8,9,
Nicolas Francos
5,
Shamsollah Ayoubi
10,
Dian Fiantis
11,
James Kobina Mensah Biney
6,
Changkun Wang
12,
Abdelaziz Belal
13,
Salman Naimi
10,
Najmeh Asgari Hafshejani
10,
Henrique Bellinaso
1,
Jean Michel Moura-Bueno
14 and
Nélida E. Q. Silvero
1
add Show full author list remove Hide full author list
1
Department of Soil Science, Luiz de Queiroz College of Agriculture, University of São Paulo, Pádua Dias Avenue, 11, Piracicaba 13418-900, Brazil
2
School of Life and Environmental Sciences, The University of Sydney, Sydney, NSW 2006, Australia
3
Soil and Water Sciences Department, University of Florida, 2181 McCarty Hall, P.O. Box 110290, Gainesville, FL 32611, USA
4
Department of Biological Systems Engineering, University of Nebraska-Lincoln, Lincoln, NE 68583, USA
5
Department of Geography, Porter School of Environmental and Earth Science, Faculty of Exact Science, Tel Aviv University, P.O. Box 39040, Tel Aviv 6997801, Israel
6
Department of Soil Science and Soil Protection, Faculty of Agrobiology, Food and Natural Resources, Czech University of Life Sciences Prague, 16500 Prague, Czech Republic
7
Laboratoire d’Etude des Interactions entre Sol-Agrosystème-Hydrosystème, University of Montpellier, National Research Institute for Agriculture, Food and Environment, Institute of Research for Development, Montpellier SupAgro, 34060 Montpellier, France
8
Helmholtz Center Potsdam GFZ German Research Centre for Geosciences, Remote Sensing and Geoinformatics, Telegrafenberg, 14473 Potsdam, Germany
9
Institute of Soil Science, Germany Leibniz University Hannover, Herrenhäuser Straße 2, 30419 Hannover, Germany
10
Department of Soil Science, College of Agriculture, Isfahan University of Technology, Isfahan 84156-83111, Iran
11
Department of Soil Science, Faculty of Agriculture, Universitas Andalas, Padang 25163, Indonesia
12
State Key Laboratory of Soil and Sustainable Agriculture, Institute of Soil Science, Chinese Academy of Sciences, Nanjing 210008, China
13
Agriculture Application, Soil and Marine Division, National Authority for Remote Sensing and Space Sciences (NARSS), Alfmaskan, Cairo P.O. Box 1564, Egypt
14
Department of Agronomy, University of Cruz Alta, Highway Jacob Della Méa, km 5.6, Cruz Alta 98005-972, Brazil
*
Author to whom correspondence should be addressed.
Remote Sens. 2022, 14(3), 740; https://doi.org/10.3390/rs14030740
Submission received: 19 January 2022 / Revised: 31 January 2022 / Accepted: 2 February 2022 / Published: 5 February 2022 / Corrected: 18 March 2022
(This article belongs to the Topic Computational Intelligence in Remote Sensing)

Abstract

:
Although many Soil Spectral Libraries (SSLs) have been created globally, these libraries still have not been operationalized for end-users. To address this limitation, this study created an online Brazilian Soil Spectral Service (BraSpecS). The system was based on the Brazilian Soil Spectral Library (BSSL) with samples collected in the Visible–Near–Short-wave infrared (vis–NIR–SWIR) and Mid-infrared (MIR) ranges. The interactive platform allows users to find spectra, act as custodians of the data, and estimate several soil properties and classification. The system was tested by 500 Brazilian and 65 international users. Users accessed the platform (besbbr.com.br), uploaded their spectra, and received soil organic carbon (SOC) and clay content prediction results via email. The BraSpecS prediction provided good results for Brazilian data, but performed variably for other countries. Prediction for countries outside of Brazil using local spectra (External Country Soil Spectral Libraries, ExCSSL) mostly showed greater performance than BraSpecS. Clay R2 ranged from 0.5 (BraSpecS) to 0.8 (ExCSSL) in vis–NIR–SWIR, but BraSpecS MIR models were more accurate in most situations. The development of external models based on the fusion of local samples with BSSL formed the Global Soil Spectral Library (GSSL). The GSSL models improved soil properties prediction for different countries. Nevertheless, the proposed system needs to be continually updated with new spectra so they can be applied broadly. Accordingly, the online system is dynamic, users can contribute their data and the models will adapt to local information. Our community-driven web platform allows users to predict soil attributes without learning soil spectral modeling, which will invite end-users to utilize this powerful technique.

1. Introduction and Contextualization

Soil is an important component of the environment as it offers vital services such as food production, clean water, and carbon sequestration [1]. To achieve sustainable use of these resources, the world’s soil community must form partnerships and seek reliable methods for obtaining its information. So far, the traditional soil laboratory has been the most common way to obtain soil data, but it is not environmentally friendly, and it becomes expensive when large amount of samples need to be analyzed [2]. This is especially crucial in developing countries, where farmers either do not conduct soil analysis due to high costs or the absence of locally accessible laboratory services. Despite the disadvantages, traditional laboratory analysis is, and will continue to be, the most suitable way to obtain soil data. However, alternatives such as soil spectroscopy have proved to be a convenient way to optimize soil analysis and a rapid alternative to disseminate the results to all interested parties. Indeed, a recent study [3] proved that wet laboratories’ analysis results have more variation between laboratories than between spectral sensors.
Soil spectroscopy is well-documented in the literature with a strong background in science and evidence [4,5,6,7]. Understanding the infrared phenomena on soil has provided researchers with confidence in its use to quantify soil properties, with much research conducted post-2000. Soil researchers are encouraged by the power of the infrared technique and seek a global communication tool, such as the so-called Soil Spectral Libraries (SSLs). The first publication on developing an SSL with global soil reflectance data was presented by Stoner and Baumgartner in 1981 [8], followed by others, [9,10]. The latter example had 92 participating countries. In addition, countries have developed their own SSLs, such as the Brazilian Soil Spectral Library (BSSL) [11,12], the Czech Republic [13], France [14], Denmark [15], Mozambique [16], Spain [17], Australia [18], China [19,20,21], USA [22,23,24], New Zealand [25], and Tajikistan [26].
Soil spectroscopy is mostly understood by researchers and has gathered hundreds of papers in the last 60 years [6,7]. Despite the substantial research, the technique has not advanced to the end-users. Traditional wet chemistry soil analysis has continued to be performed since early 1800. There is no doubt regarding the importance of conventional wet chemistry lab analysis, but the demand for soil analysis is increasing and the dependency on wet chemistry is not be sustainable [27].
Many researchers have demonstrated the efficiency of soil spectroscopy and robust predictive capabilities for multiple soil properties [28], summarized in [7]. In addition, the MIR spectral range has been proven to provide superior prediction compared to vis–NIR–SWIR spectra [29,30,31]. The SSLs, thus, are important research initiatives [10] but the data are only available through scientific journal publications. Other initiatives have adopted an ‘open spectra’ approach. This includes regional programs such as the ICRAF-ISRIC Soil VNIR Spectral Library [32], the LUCAS framework (Land Use/Cover Area Frame Survey; http://eusoils.jrc.ec.europa.eu/projects/Lucas accessed on 12 January 2022) [33] with data from 23 countries in Europe [34], African Soil Information System (AFSIS) [35] and the GEOCRADLE with samples from 9 countries in the Balkans, Middle East, north and central Africa [36], the Open Soil spectral Library [37] promoted by the Soil Spectroscopy for a Global Good, based on the Rapid Carbon Assessment [38] spectral data from USA and Africa [32,35]. In both cases, the closed and open spectra data still lack operationalization to make them readily available to end-users, such as farmers and land managers.
Spectral data require scientific expertise to infer soil properties using complex processing algorithms not available to the general public. Moreover, there are variations in spectra aroused from different measurement protocols [39]. As an analogy, when satellite imagery was available for free for the first time, it was not widely adopted. Most users lacked computational competencies in pre-processing issues (e.g., atmospheric correction and georeferencing) and the complexity in supervised and unsupervised classification methods [40]. These shortcomings were removed when the images were made available to general users in pre-processed and georeferenced data format. Nowadays, we have a similar situation, where many SSLs and software processing are available [41] but did not make the bridge to making their use easier for the end-users, and thus they (farmers, consulters, others) cannot see the importance. As the first step on a learning curve, why not start delivering the spectral soil products directly to users? Such a win-win approach would boost even more research aimed at providing the best possible spectral-derived soil data and at the same time benefit end-users.
In this study, we present a free online platform called the Brazilian Soil Spectral Service (BraSpecS) for soil properties prediction using visible–Near–Short Wave Infrared (vis–NIR–SWIR) and Mid-Infrared (MIR) spectral ranges. This platform is a pioneering initiative, which aims to demonstrate its application for predicting many soil attributes, but here with a focus on soil organic carbon (SOC) and clay contents with spectral data from Brazil and the world. Furthermore, by establishing its direct application, we hope to foster a new generation of collaboration towards building a global online service for soil analysis.

2. Materials and Methods

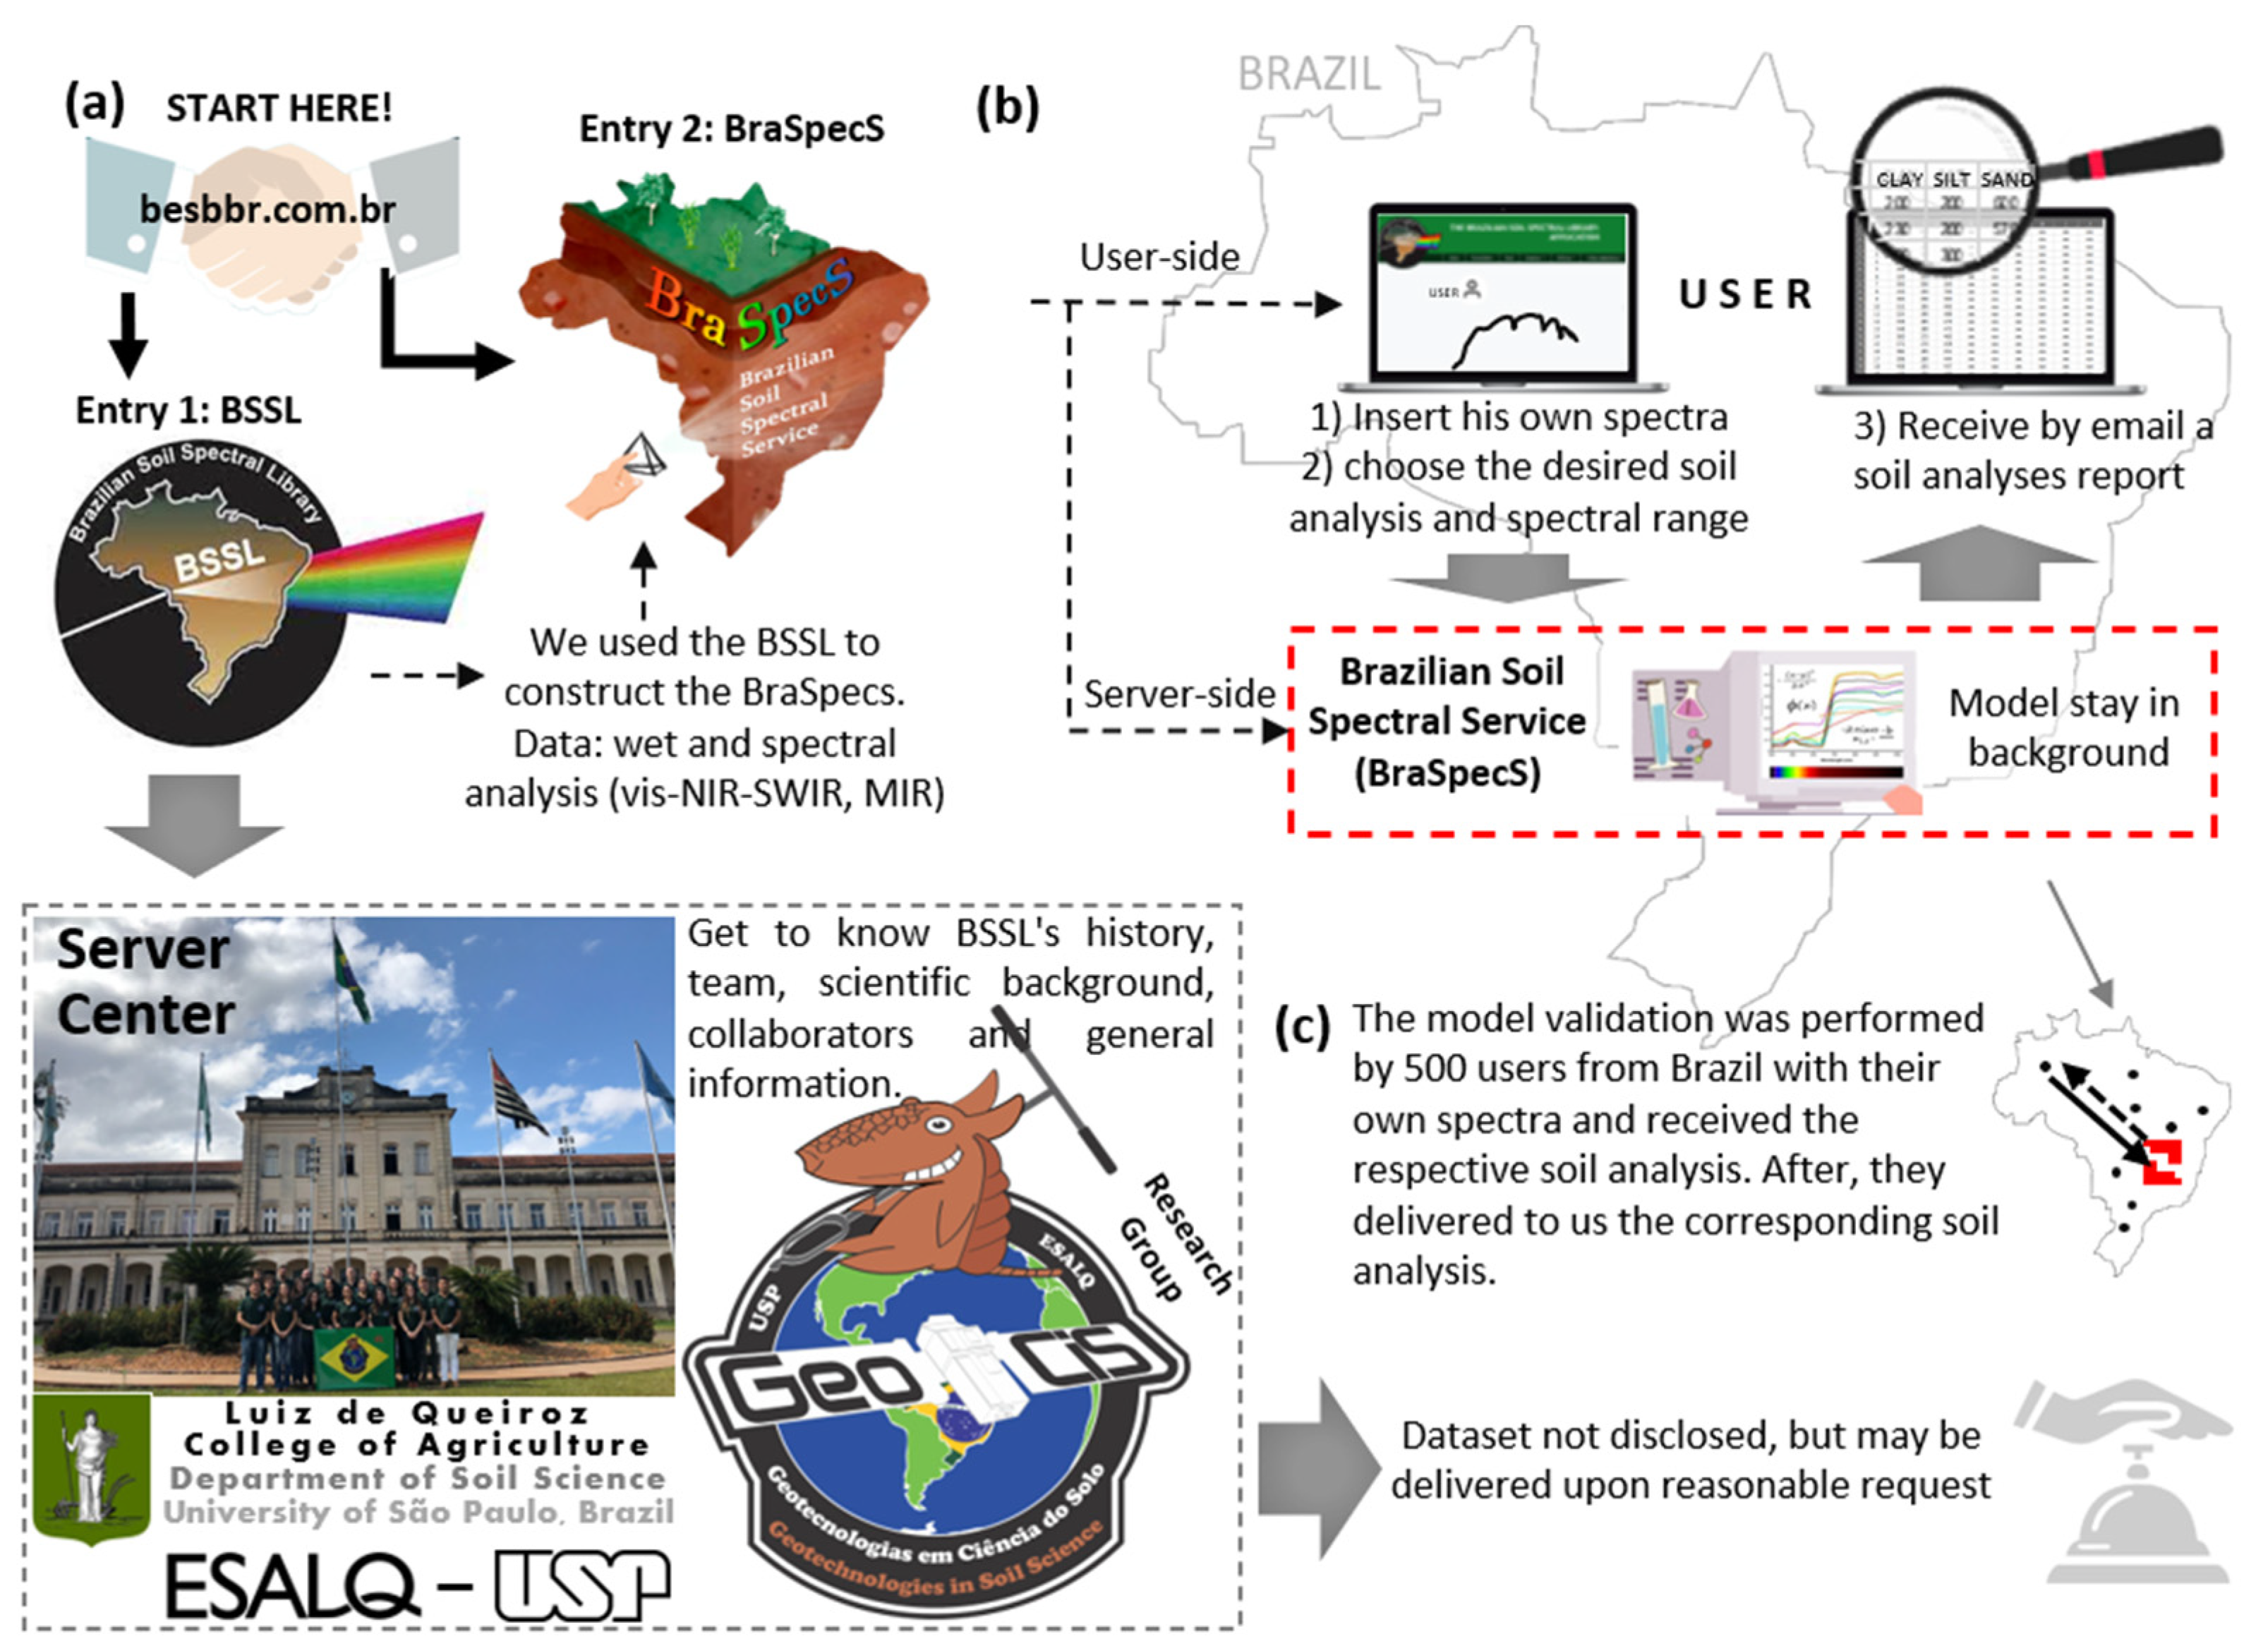
2.1. The Brazilian Soil Spectral Service (BraSpecS) Construction

We developed an online service called The BraSpecS (Brazilian Soil Spectral Service) with support of the Geotechnologies in Soil Science Group (GEOCIS, https://esalqgeocis.wixsite.com/english accessed on 30 January 2022) Laboratory at the Luiz de Queiroz College of Agriculture (ESALQ), University of São Paulo (USP). The web interface of the platform BraSpecS was created in JavaScript language. JavaScript is a lightweight, interpreted and object-based language, mainly used in building web interfaces [34]. BraSpecS is divided into three complementary modules: data localization, soil data visualization, and soil processing and quantification (Figure 1). The web platform can be accessed at http://besbbr.com.br/ (accessed on 30 January 2022).
In the data locations module, the user visualizes the number of samples by Brazilian states and identifies the authors and partner institutions. The map interaction of the Brazilian states was elaborated using the Leaflet library [42]. The soil data visualization module shows soil spectra in the vis–NIR–SWIR, and MIR bands filtered by classifications, orders, groups, layers, and textures.
All spectra and models are kept inside the system, maintaining data privacy and not publicly disclosed. Scripts for modeling are in the system’s backend, so the user only needs to choose the desired properties to quantify. The system delivers the following soil properties which user can choose: soil color (Hue, Value and Chroma), clay, sand, silt, SOC, pH in water, exchangeable/available contents (Ca2+, Mg2+, K+, Al3+, H + Al, and P), sum of bases (SB = Ca2+ + Mg2+ + K+), cation exchange capacity (CEC = SB + H+Al), base saturation (V% = SB/CEC × 100), aluminum saturation (m% = Al3+/(SB + Al3+) × 100), pseudo-total contents (Fe2O3, TiO2, MnO, SiO2, Al2O3), and Ki weathering index (Ki = SiO2/Al2O3 × 1.7).
This system was prepared only for the BraSpecS as an experimental prototype. The predictive models were prepared in R software [43]. The steps of the soil processing and quantification module are described in the sections: soil dataset construction (Section 2.2) and data processing, models, and validation (Section 2.3). The baseline of the system functional architecture is illustrated in Figure 1.
For the web server, a workstation was acquired with 2 XEON 5120T processor hardware, with 14 cores each, and a video card with 4000 GPU’s, which are essential for the application of the predictive models. The web server was created using the Apache software [44] and PHP programming language [45,46]. Apache is an open-source Hypertext Transfer Protocol (HTTP) server project to provide a secure, efficient, and extensible web server on HTTP standards. PHP is a fast and flexible scripting language, mainly used in web development [47]. The R scripts used in the soil processing and quantification module were integrated into the Apache web server through rApache software. The rApache allows the execution of scripts developed in the R programming language on Apache web servers [48].
Soil processing and quantification is a task that requires high computational resources [49], and to meet this requirement, we employed tools for organizing the spectral data submitted by users in queues and distributing them to other computers. The First-In-First-Out (FIFO) [50] model was selected and implemented on the server, allowing for a dynamic queue data structure that allows the removal and insertion of processing on the server. A high-performance processing cluster was created and thus made it possible to distribute the processes with low-cost computers in the R environment.

2.2. Internal Soil Dataset of BraSpecS

As mentioned, the BraSpecS is a service based on the soil dataset from the BSSL [12] where details of soil sampling and spectra can be achieved. In summary, soil samples are from different depths (cm)—A (0–20), B (40–60), C (80–100) and D (100–120)—which were acquired by auger or inside pits. Using these data, we constructed the platform with vis– NIR–SWIR, resulting in 49,753 soil samples donated by 81 collaborators, representing 69 institutions from all over the country (https://bibliotecaespectral.wixsite.com/english/lista-de-cedentes, accessed on 30 January 2022). The BraSpecS in the MIR range comprises 4951 soil samples.
The BraSpecS contains laboratory analysis for several soil attributes in vis–NIR–SWIR and MIR regions. In this paper, we focused only on clay and SOC. The total content of SOC was determined according to a modification of the Walkley–Black method [51] where SOC is oxidized with potassium dichromate (K2Cr2O7) in the presence of sulfuric acid (H2SO4), and the heat released in the acid dilution is used to catalyze the redox reaction. After digestion, the remaining unreduced K2Cr2O7 is titrated with ferrous ammonium sulfate (Fe(NH4)2(SO4)26H2O). The methodological procedure for this analysis was followed as described by [52]. For clay, in general the informed method was determined by measurements from [53]. For the vis–NIR–SWIR analysis, the soil samples were dried at 45 °C for 48 h, crushed, sieved with a 2 mm mesh, and homogeneously distributed in petri dishes prior to the measurement of the spectra in the 400–2500 nm range [12]. The spectral data were acquired using the Fieldspec 3 spectroradiometer (Analytical Spectral Devices, ASD, Boulder, CO, USA). The sampling interval was 1 nm, reporting 2151 channels. The light source was provided by two external 50-W halogen lamps, which were positioned at a distance of 35 cm from the sample (non-collimated rays and a zenithal angle of 30°) with an angle of 90° between them. The sensor is calibrated using a white Spectralon plate (Lab-sphere, North Sutton, NH, USA) representing a 100% reflectance standard (reflectance factor 1.0). The reflectance of each sample was calculated as the radiance ratio between the soil sample and the Spectalon reference.
For spectral analysis in the MIR, the soil samples were ground and passed through 100 mesh. Reflectance spectra were obtained with the Alpha Sample Compartment RT-DLaTGS ZnSe (Bruker Optik GmbH, Ettlingen, Germany) equipped with an accessory for acquiring Diffuse Reflectance Infrared Fourier Transform (DRIFT). The sensor has a HeNe laser positioned inside the equipment and a calibration pattern for each wavelength. It has a KBr beam allowing a high amplitude of the incident radiance to penetrate the sample. Spectra were acquired between 4000 to 600 cm−1 (which is about 2500–16,667 nm) with a spectral resolution of 5 cm−1 and 32 scans per minute per spectrum. A gold reference plate was used as standard, and the sensor was calibrated every four measurements.

2.3. Data Modeling Provided by BraSpecS

Different pre-processing methods were evaluated for the vis–NIR–SWIR range and those that presented the best results for each soil property was selected. The Standard Normal Variable (SNV) and the Continuous Removal (CR) were used for clay and SOC, respectively, and all calculations were done using the ‘prospectr’ package in R [34]. In order to minimize the influence of noise at the tail ends of measured spectra, the ranges from 350 to 420 nm and from 2480 to 2500 nm were removed to have the spectra range from 420 to 2480 nm. Finally, we resampled the spectra at a resolution of 10 nm to reduce spectral multicollinearity and processing time and improve the modeling efficiency for this large dataset [54,55]. For the MIR spectral range, the Savitzky–Golay first Derivative (SGD) with a first-order polynomial and a window size of 9 nm and SNV were applied.
The datasets for each soil property were randomly split into a calibration (training; 70%) and a validation (testing; 30%) datasets, independently for each property. The complete BraSpecS dataset was used to calibrate spectroscopy models using the cubist machine learning algorithm [56]. Cubist is a rules-based algorithm that applies the M5 (Model Tree) approach to create categorical decision trees to deal with continuous classes. The algorithm produces ‘trees’ through rules that use boost training [56]. Reinforcement training is based on converting weak learners into strong learners, in addition to giving stronger learners more weight [57]. Cubist has been successfully applied to model clay and SOC from vis–NIR–SWIR spectra in numerous other studies (e.g., [10,21,58,59]). According to a comprehensive review by [60], Cubist stood out as a method, among other machine learning methods, to predict SOC reliably from vis–NIR–SWIR spectra with R2 between 0.76–0.89 and residual prediction deviation (RPD) between 1.99–2.88 in several studies.
The final model is regulated by a set of nodes along the tree and two hyperparameters (committees and neighbors), which improve the model’s performance. The model construction and estimation process were performed by the caret package in R [61], which has a set of functions that seek to simplify the process of creating predictive models. The first criteria used to select the optimal models was the Coefficient of Determination (R2). However, the Root Mean Square Error (RMSE) and Ratio of Performance to Interquartile Distance (RPIQ) also were used for interpretation of results.
The online system was tested by users using their own spectra with a total of 500 Brazilian participants recruited along a spectroscopy course (https://esalqgeocis.wixsite.com/english/probase, accessed on 30 January 2022) composed by laboratory technicians, researchers, students, farmers, consultants, and distributed along 20 states of the federation (two spectra per user, total of 1000 spectra) for the vis–NIR–SWIR and 200 samples for MIR using equipment and protocol equal to that used for the construction of BraSpecS. The spectral soil predictions for clay and SOC were made on-the-fly immediately after submission of the spectra. These blind set soil predictions were compared post-hoc after retrieval of participants’ soil analytical lab data to evaluate deviations. Users were also invited to provide critiques of the system for further improvement.

2.4. Data Modeling Provided by BraSpecS

We compared clay and SOC models derived using the world, national (BraSpecS), and local vis–NIR–SWIR and MIR datasets. The following approaches were used: (a) We entered the world spectral data to predict clay and SOC using the BraSpecS soil models. The global data entailed 28,598 soil samples with vis–NIR–SWIR scans from 65 countries and 8039 samples from 4 countries with MIR scans (390 from Australia, 170 from Iran, 2728 from the USA, and 4751 from Brazil); (b) we created for each of the 65 countries Local Models (ExCSSL) with their spectral population and predicted clay and SOC locally; (c) finally, we merged the BraSpecS with the spectra from the other 65 countries and generated a GSSL.
The processing was the same as the previously described for the BraSpecS, that is, random data split with 70% for model calibration (training) and 30% for validation (testing) and modeling using the machine learning algorithms. Finally, we compared the results from the BraSpecS tested by other countries and compared them with the developed ExCSSL, BraSpecS and GSSL models were compared with the same 65 countries. This made it possible to evaluate the differences between global, national, and local datasets on the quantification of soil properties. The workflow process is illustrated in Figure 2. The number of samples per country is provided in Supplementary Materials.

3. Results

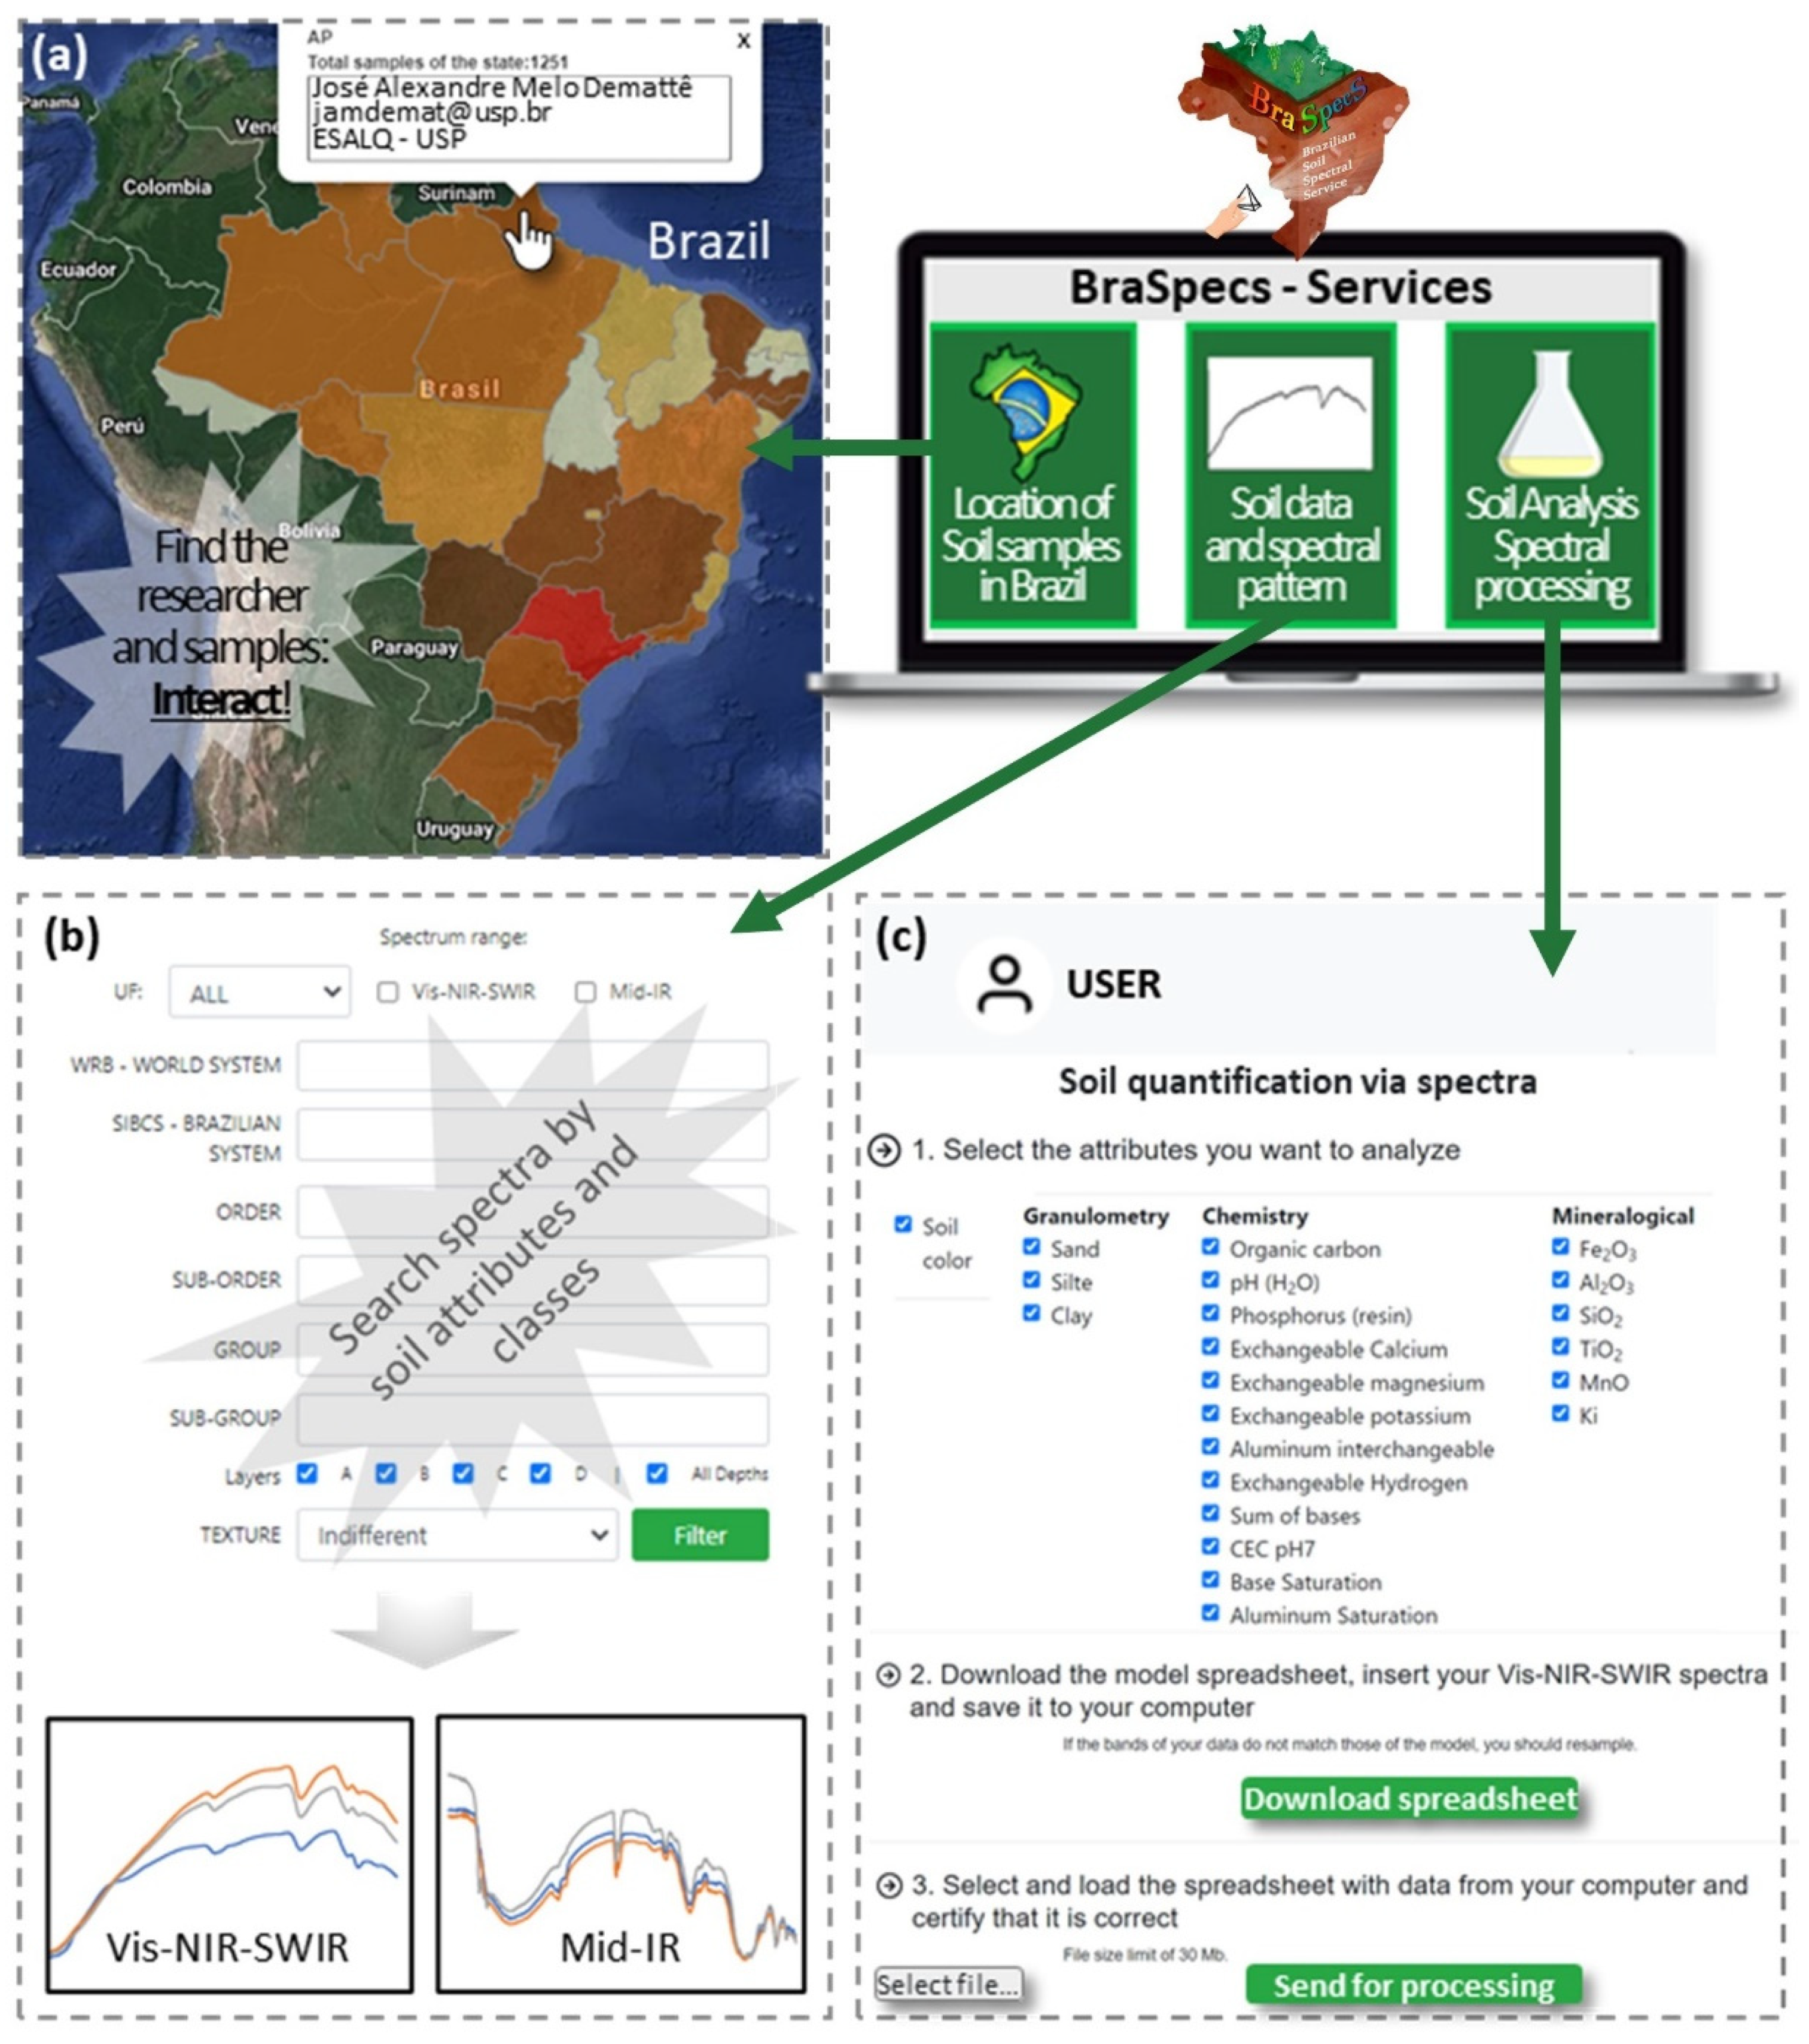
3.1. Online Interaction Experience

The website is available on “besbbr.com.br” (accessed on 12 January 2022) and brings together spectral information in vis–NIR–SWIR and MIR ranges (Figure 3). This is a user-friendly interface intended to provide a favorable experience for users. The web is designed for: (a) end-users, who want the soil analysis; (b) researchers and academic employees, who want to test and evaluate their models; (c) students who are interested to learn; (d) pedologists and soil scientists to test and have new insights and view the soil spectral signatures patterns; (e) startups to create their own market.
The website presents the following sequence (Figure 3). First, a user registers in the system. Afterward, the user can view the general information on how the BraSpecS was developed or go directly to BraSpecS-related services.
The tool offers three services (Figure 3), which are as follows. First, (1) an alignment tool, where the user can search for the owners for spectral data and personal contact information. With this information, users can contact the data provider directly and ask for specific datasets to initiate a collaboration. Furthermore, the user will see where to find potential users on spectroscopy. The idea was to stimulate users to interact and create a new collaboration. The interactive map of contributors allows one to search for specific institutions or researchers and visualize Brazilian State spectral data. The map also allows the interaction between researchers and that leads to spectral data sharing and partnerships. Second, (2) users find several examples of soil types of patterns. One may ask for a specific soil class, for example, a Ferralsol, and the system will filter and show the average of all Ferralsols in the dataset or from a specific state. Users can run searches by specific criteria, such as soil depth, soil type, and specific soil property. For example, the user can ask to retrieve vis–NIR–SWIR samples of sandy soils at surface depth and in a specific state, owner, region, or the whole library. The result of the search is the average of soil spectra regarding the chosen characteristic. Depending on the number of soil spectra falling under specific criteria, the process may take some time. As an example, we selected the São Paulo (SP) state, the vis–NIR–SWIR spectra, the sandy textural class from the first layer (A), with no indications for soil classification. This query took about 3 min. Figure 3 gives detail on spectral patterns that users have access. Users can see the spectra regarding clay content or soil classification and compare them with their spectra.
Finally, (3) we have the Soil Analysis Spectral Service. Here the user has spectral data and wants to make a soil prediction anywhere in the world. To access the prediction module, the user must register on the platform with an email address to receive the results. Afterward, the user must log into his/her account in the platform to: (1) download the template to organize the soil spectra; (2) upload the file (.csv format) with the soil spectra; (3) select the attributes to be predicted; and (4) send the data for processing in the platform. Thus, the user uploads the spectra, and chooses among vis–NIR–SWIR or MIR spectral range and the desired soil properties, and then runs the processing. The system runs all scripts in the background, not displayed on the web but presented in this paper. After about 15 minutes, depending on the filtering and number of samples chosen, the user will receive a report by email. The report entails all soil analyses of the specific spectra, method (cubist), and statistical performance metrics of the backend. The user also has the option to provide feedback online and share the wet soil analytics of user spectra, so the system will be recharged with new data and will increase the dataset.

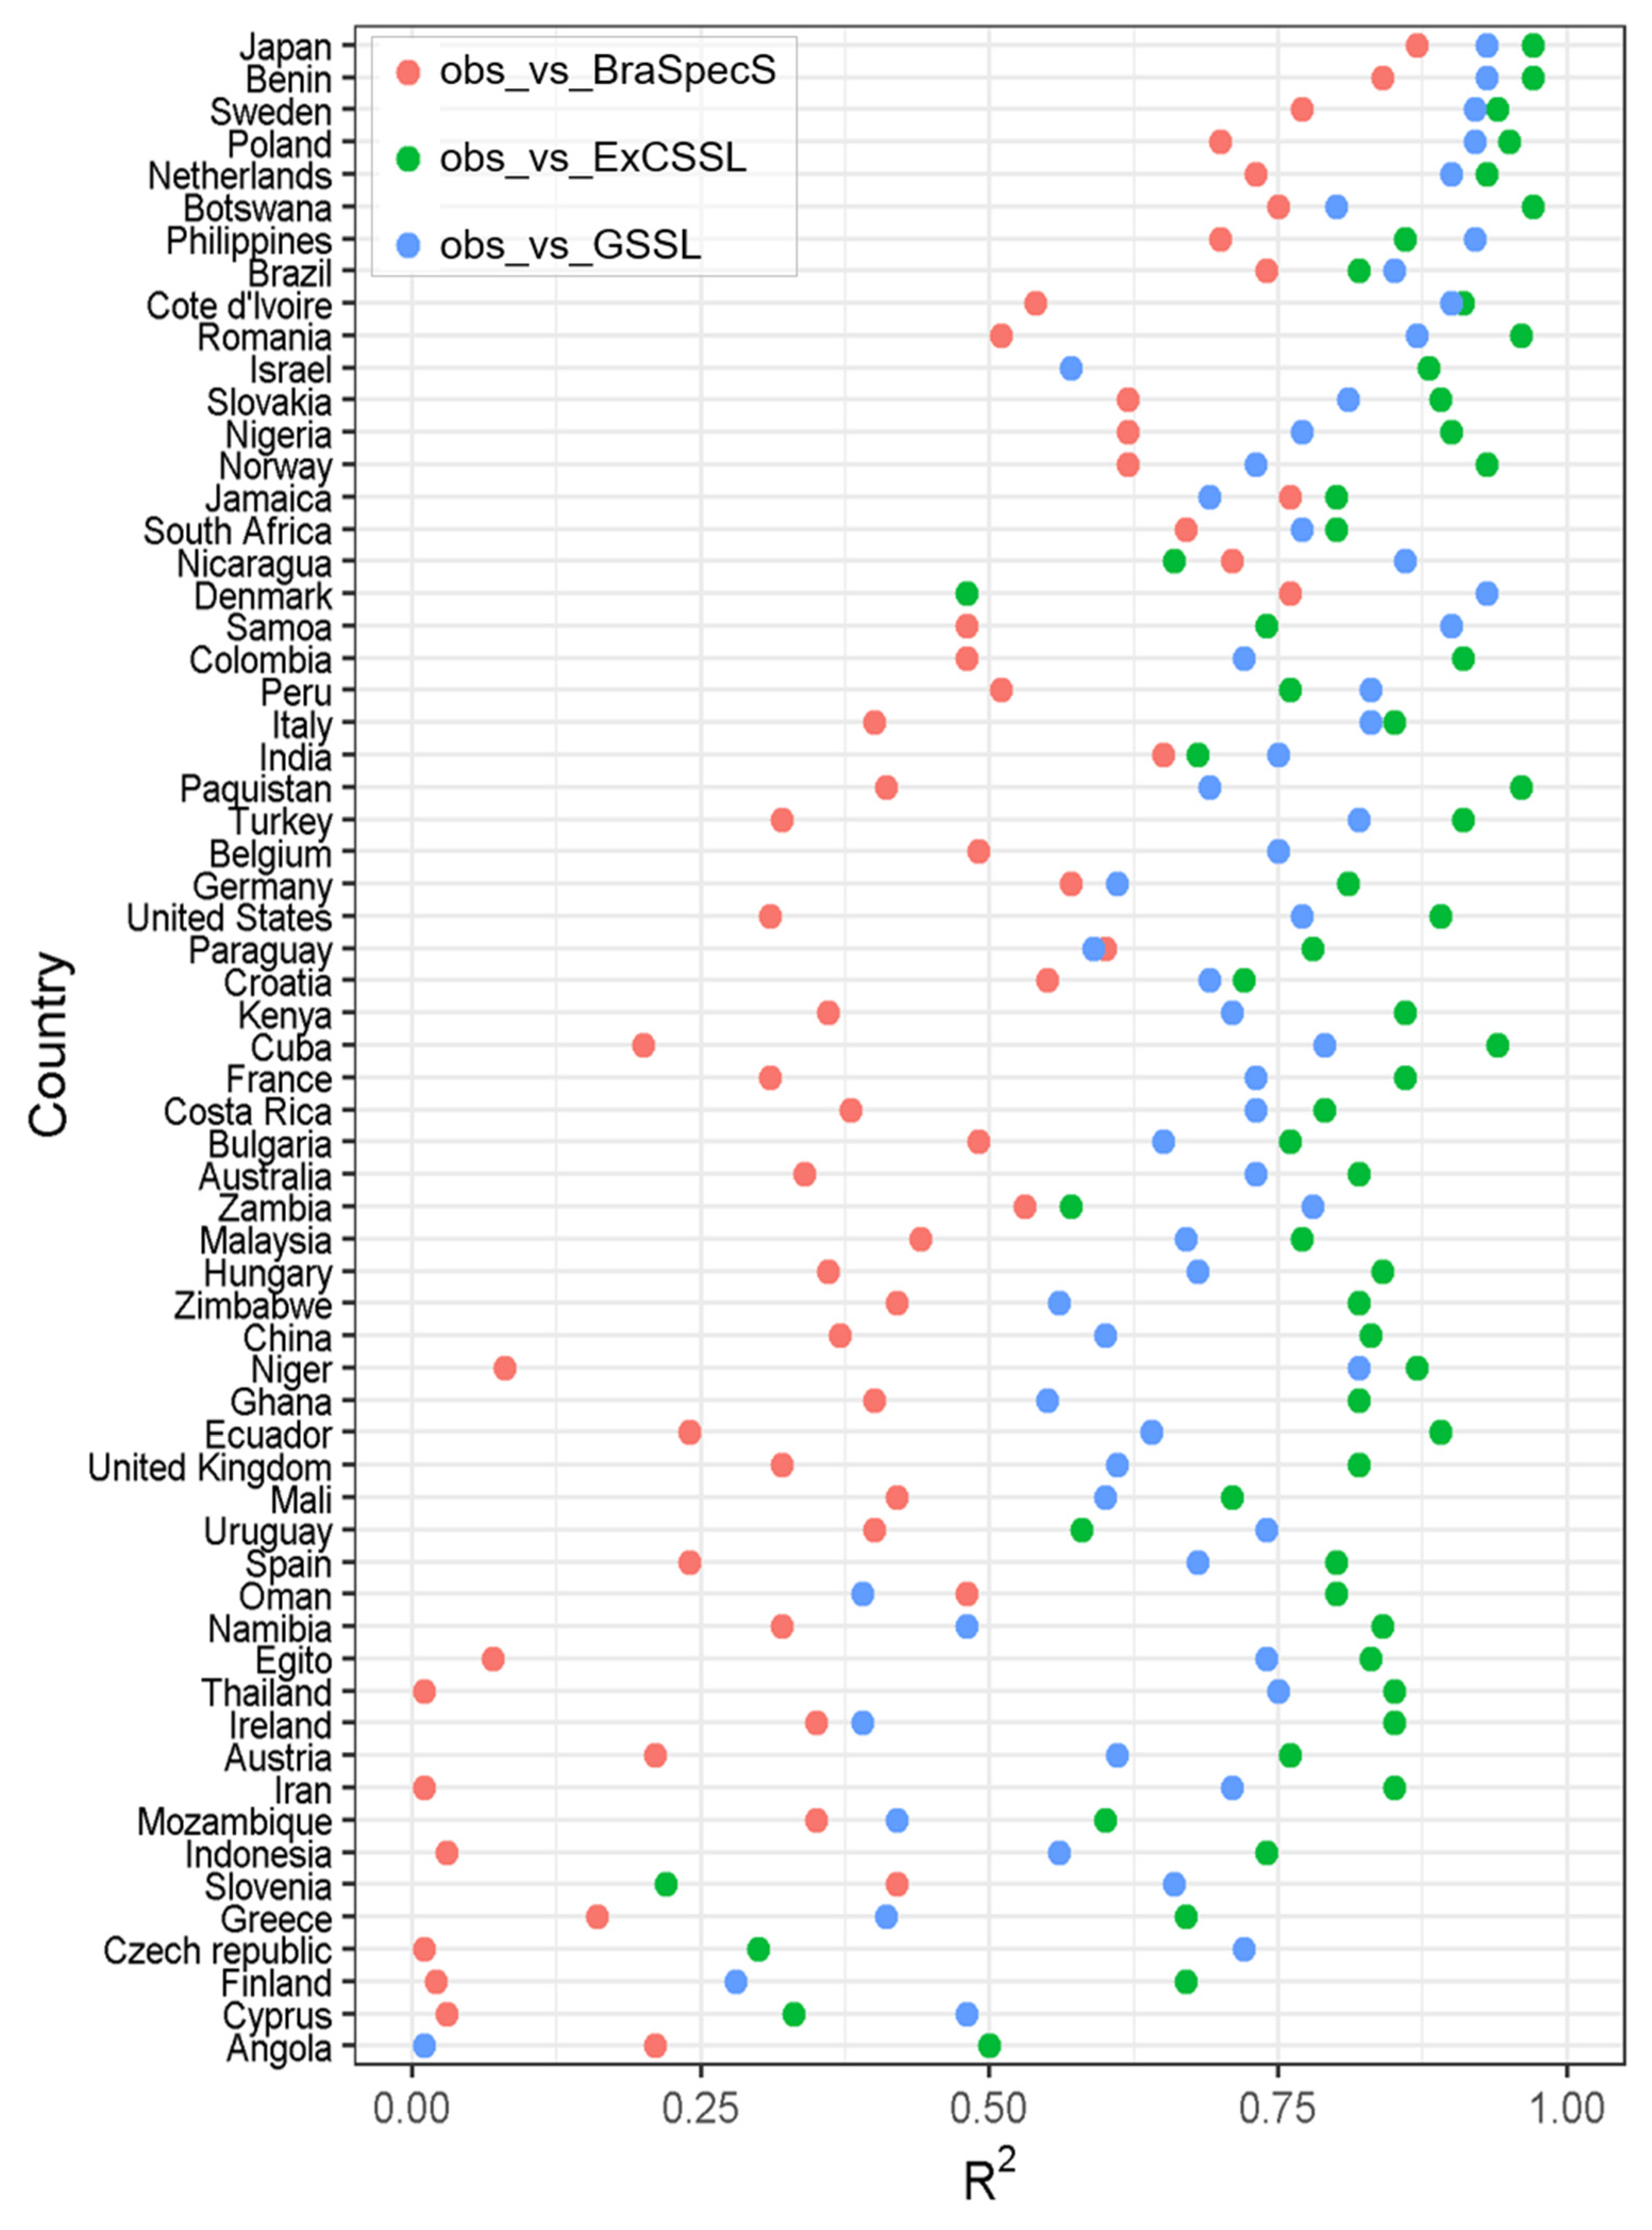
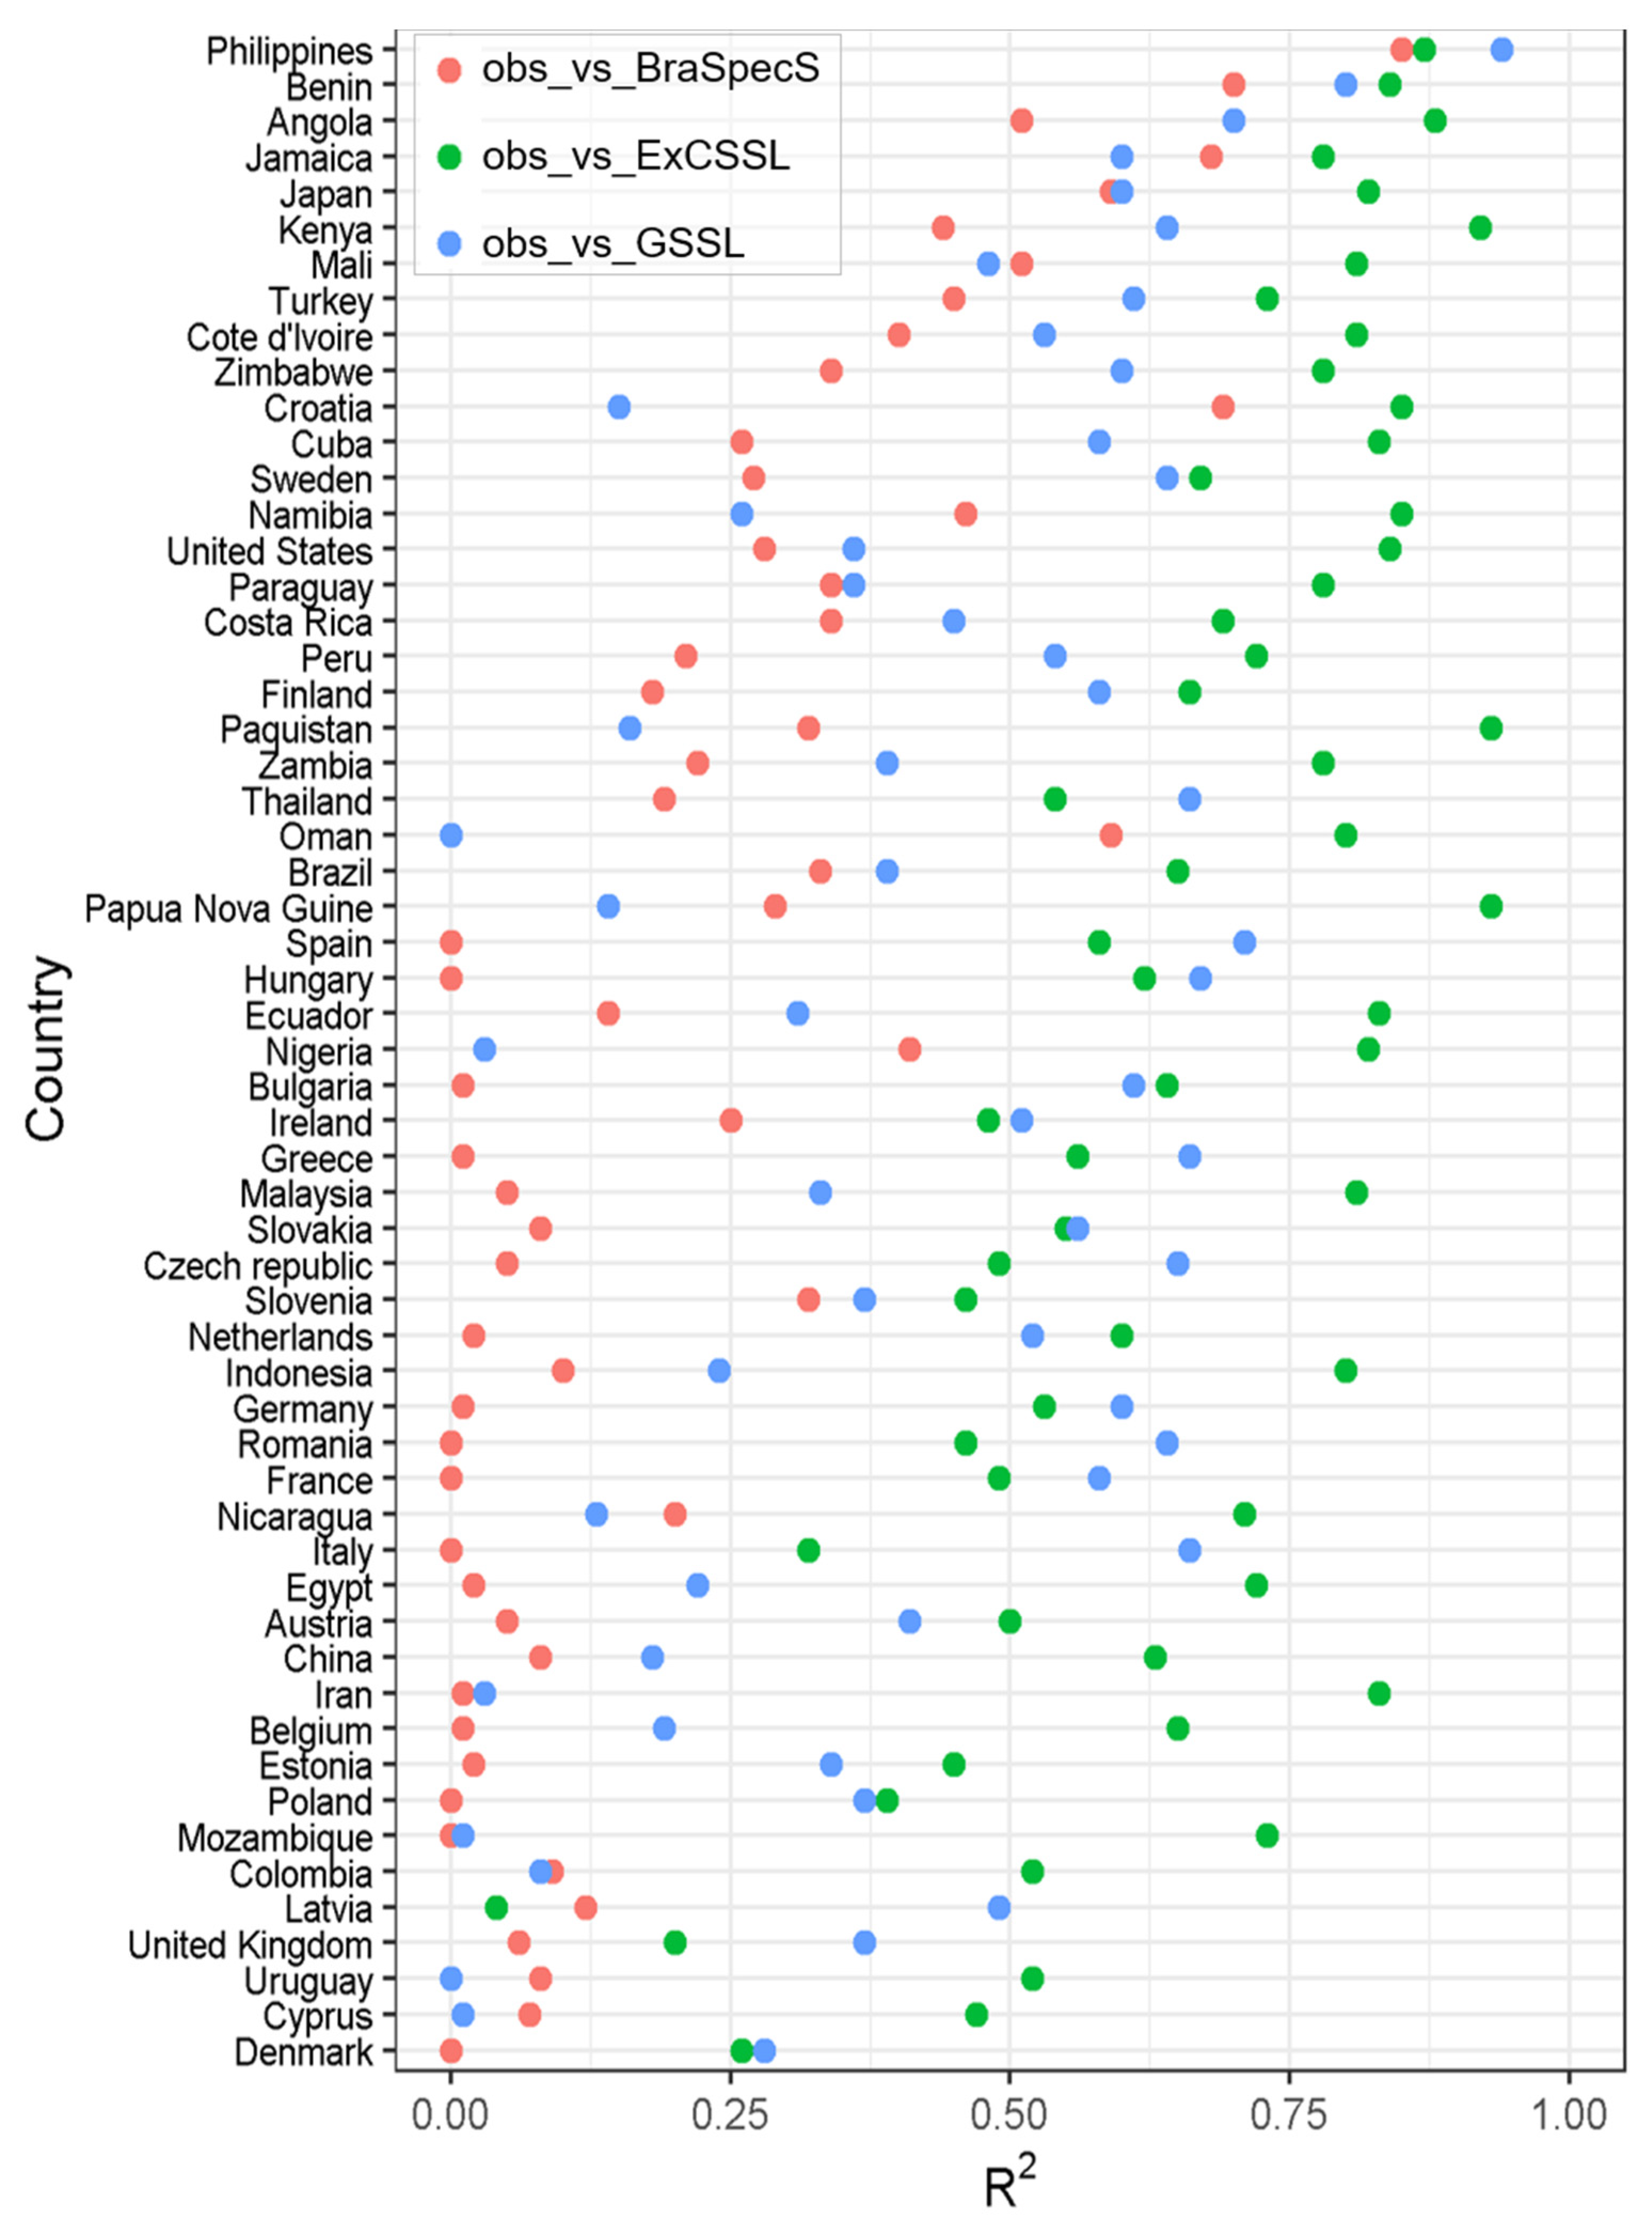
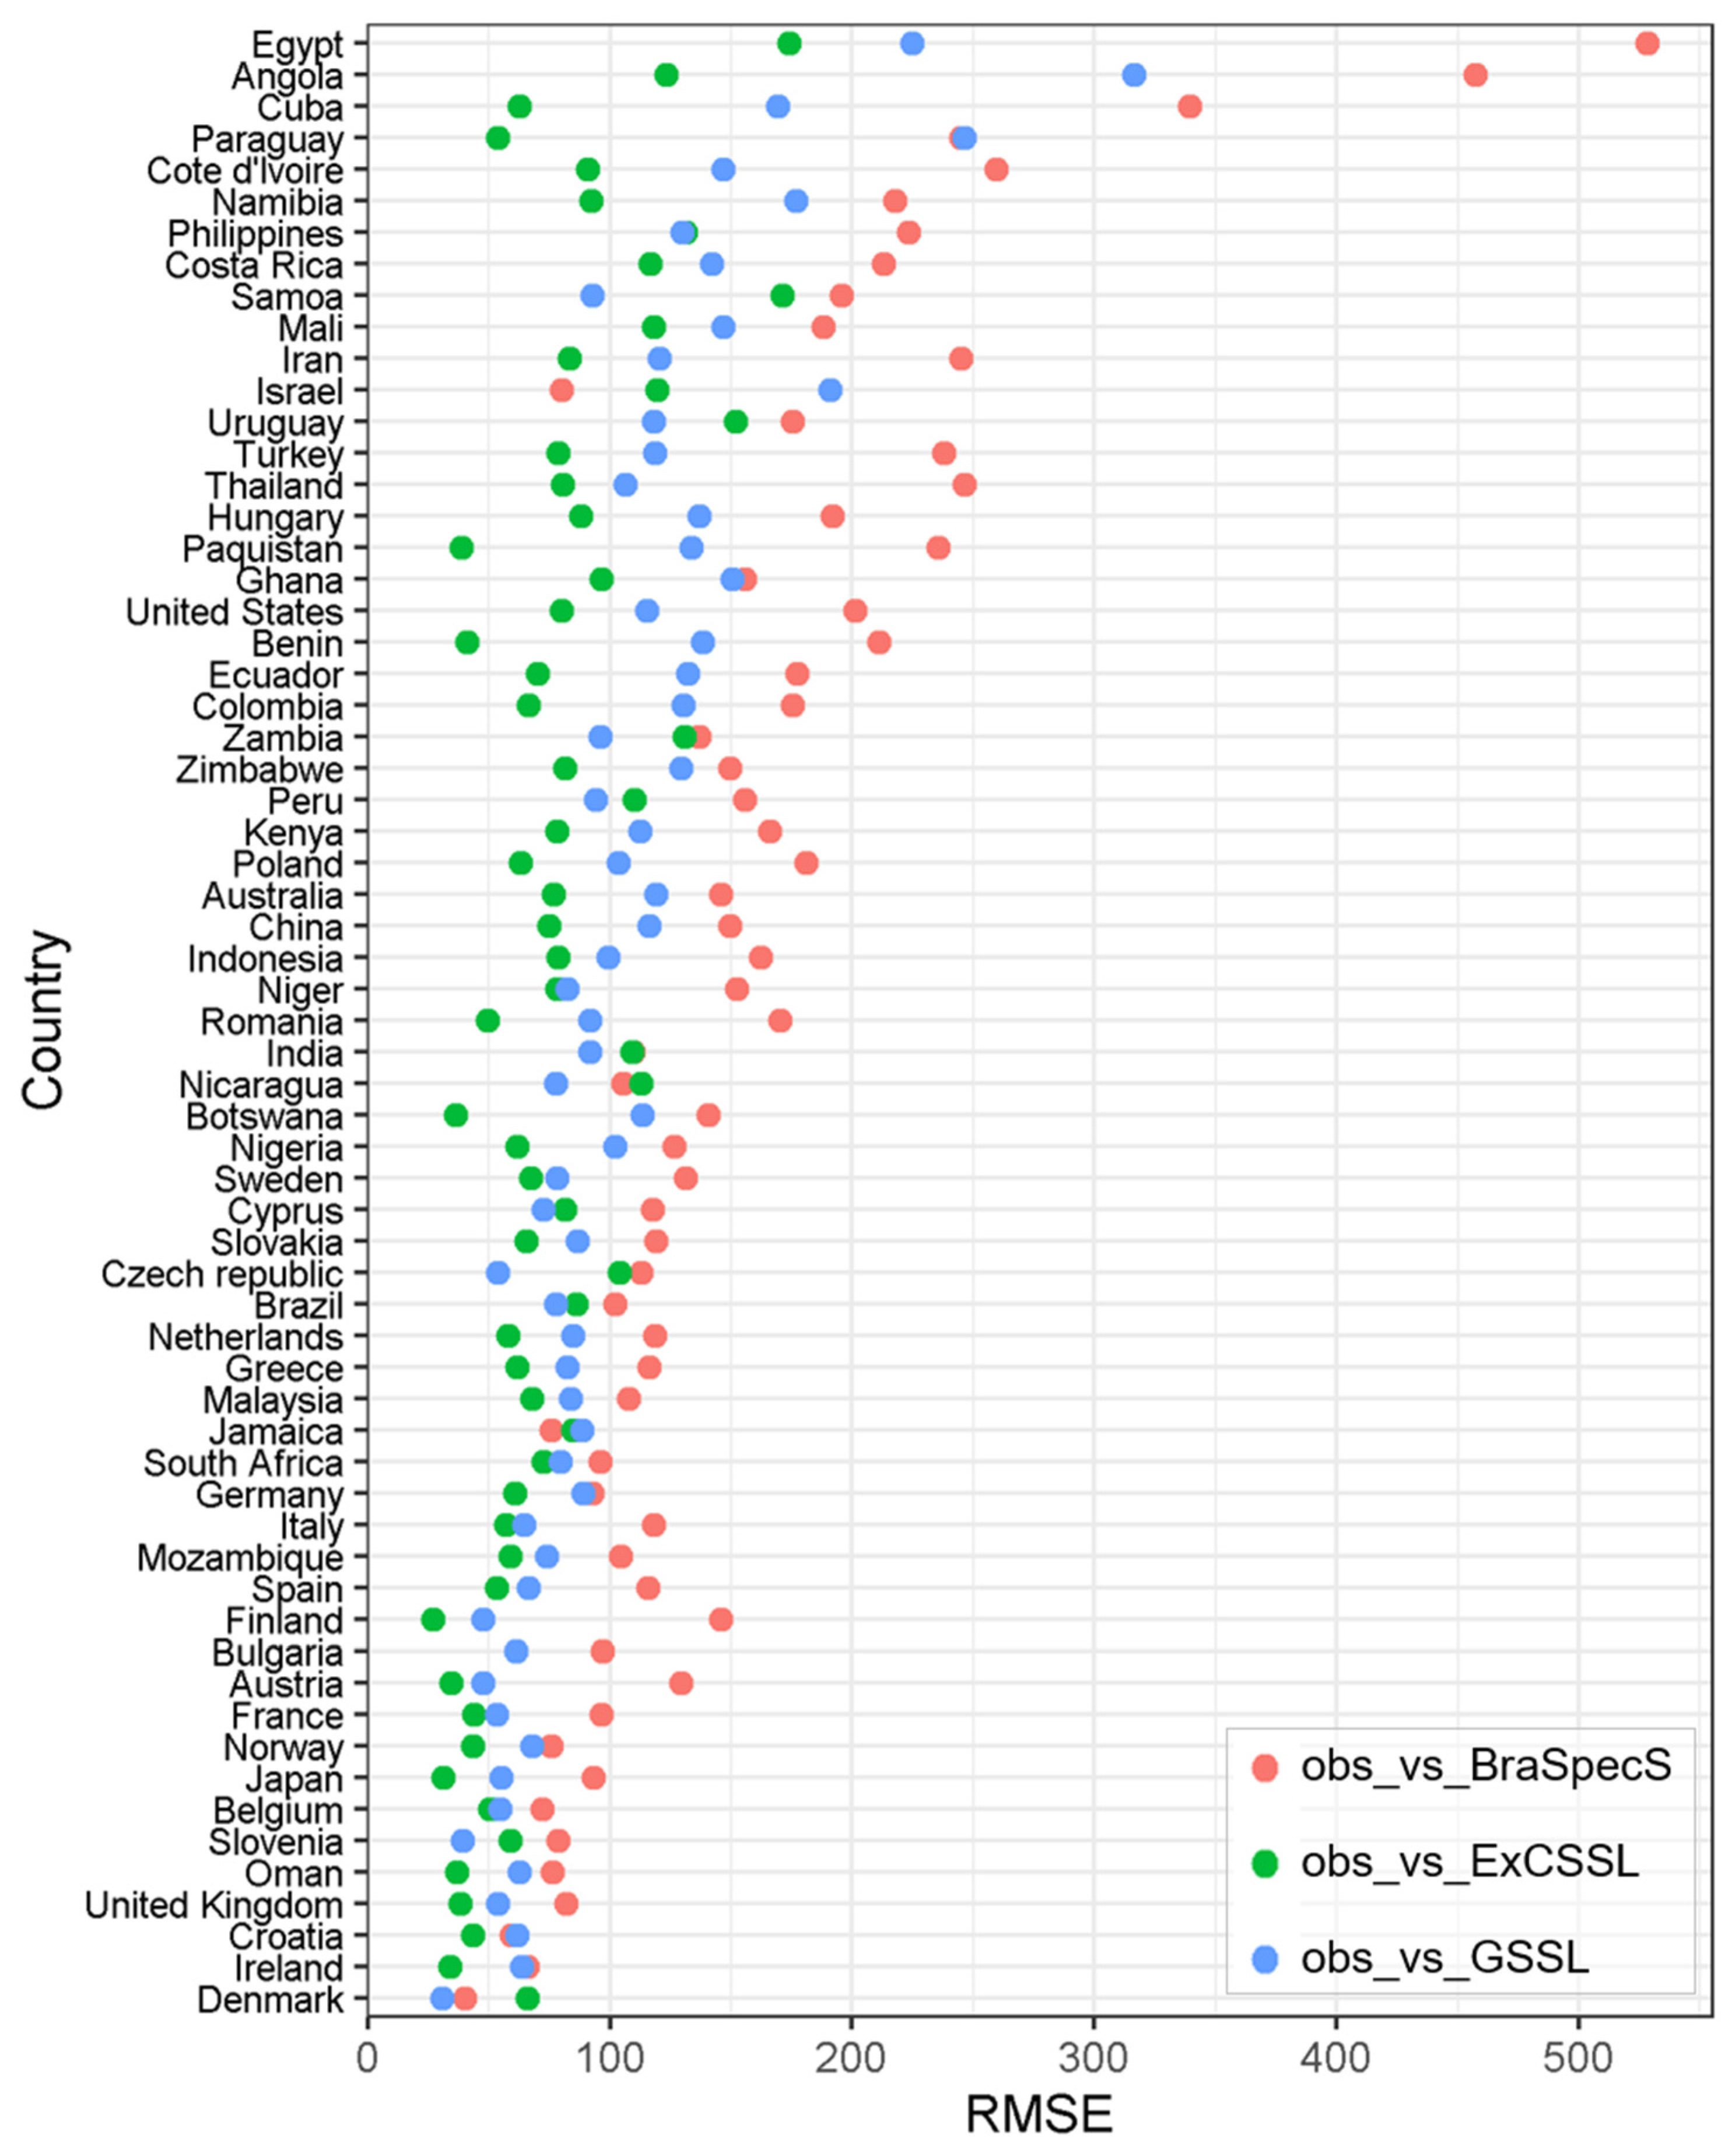
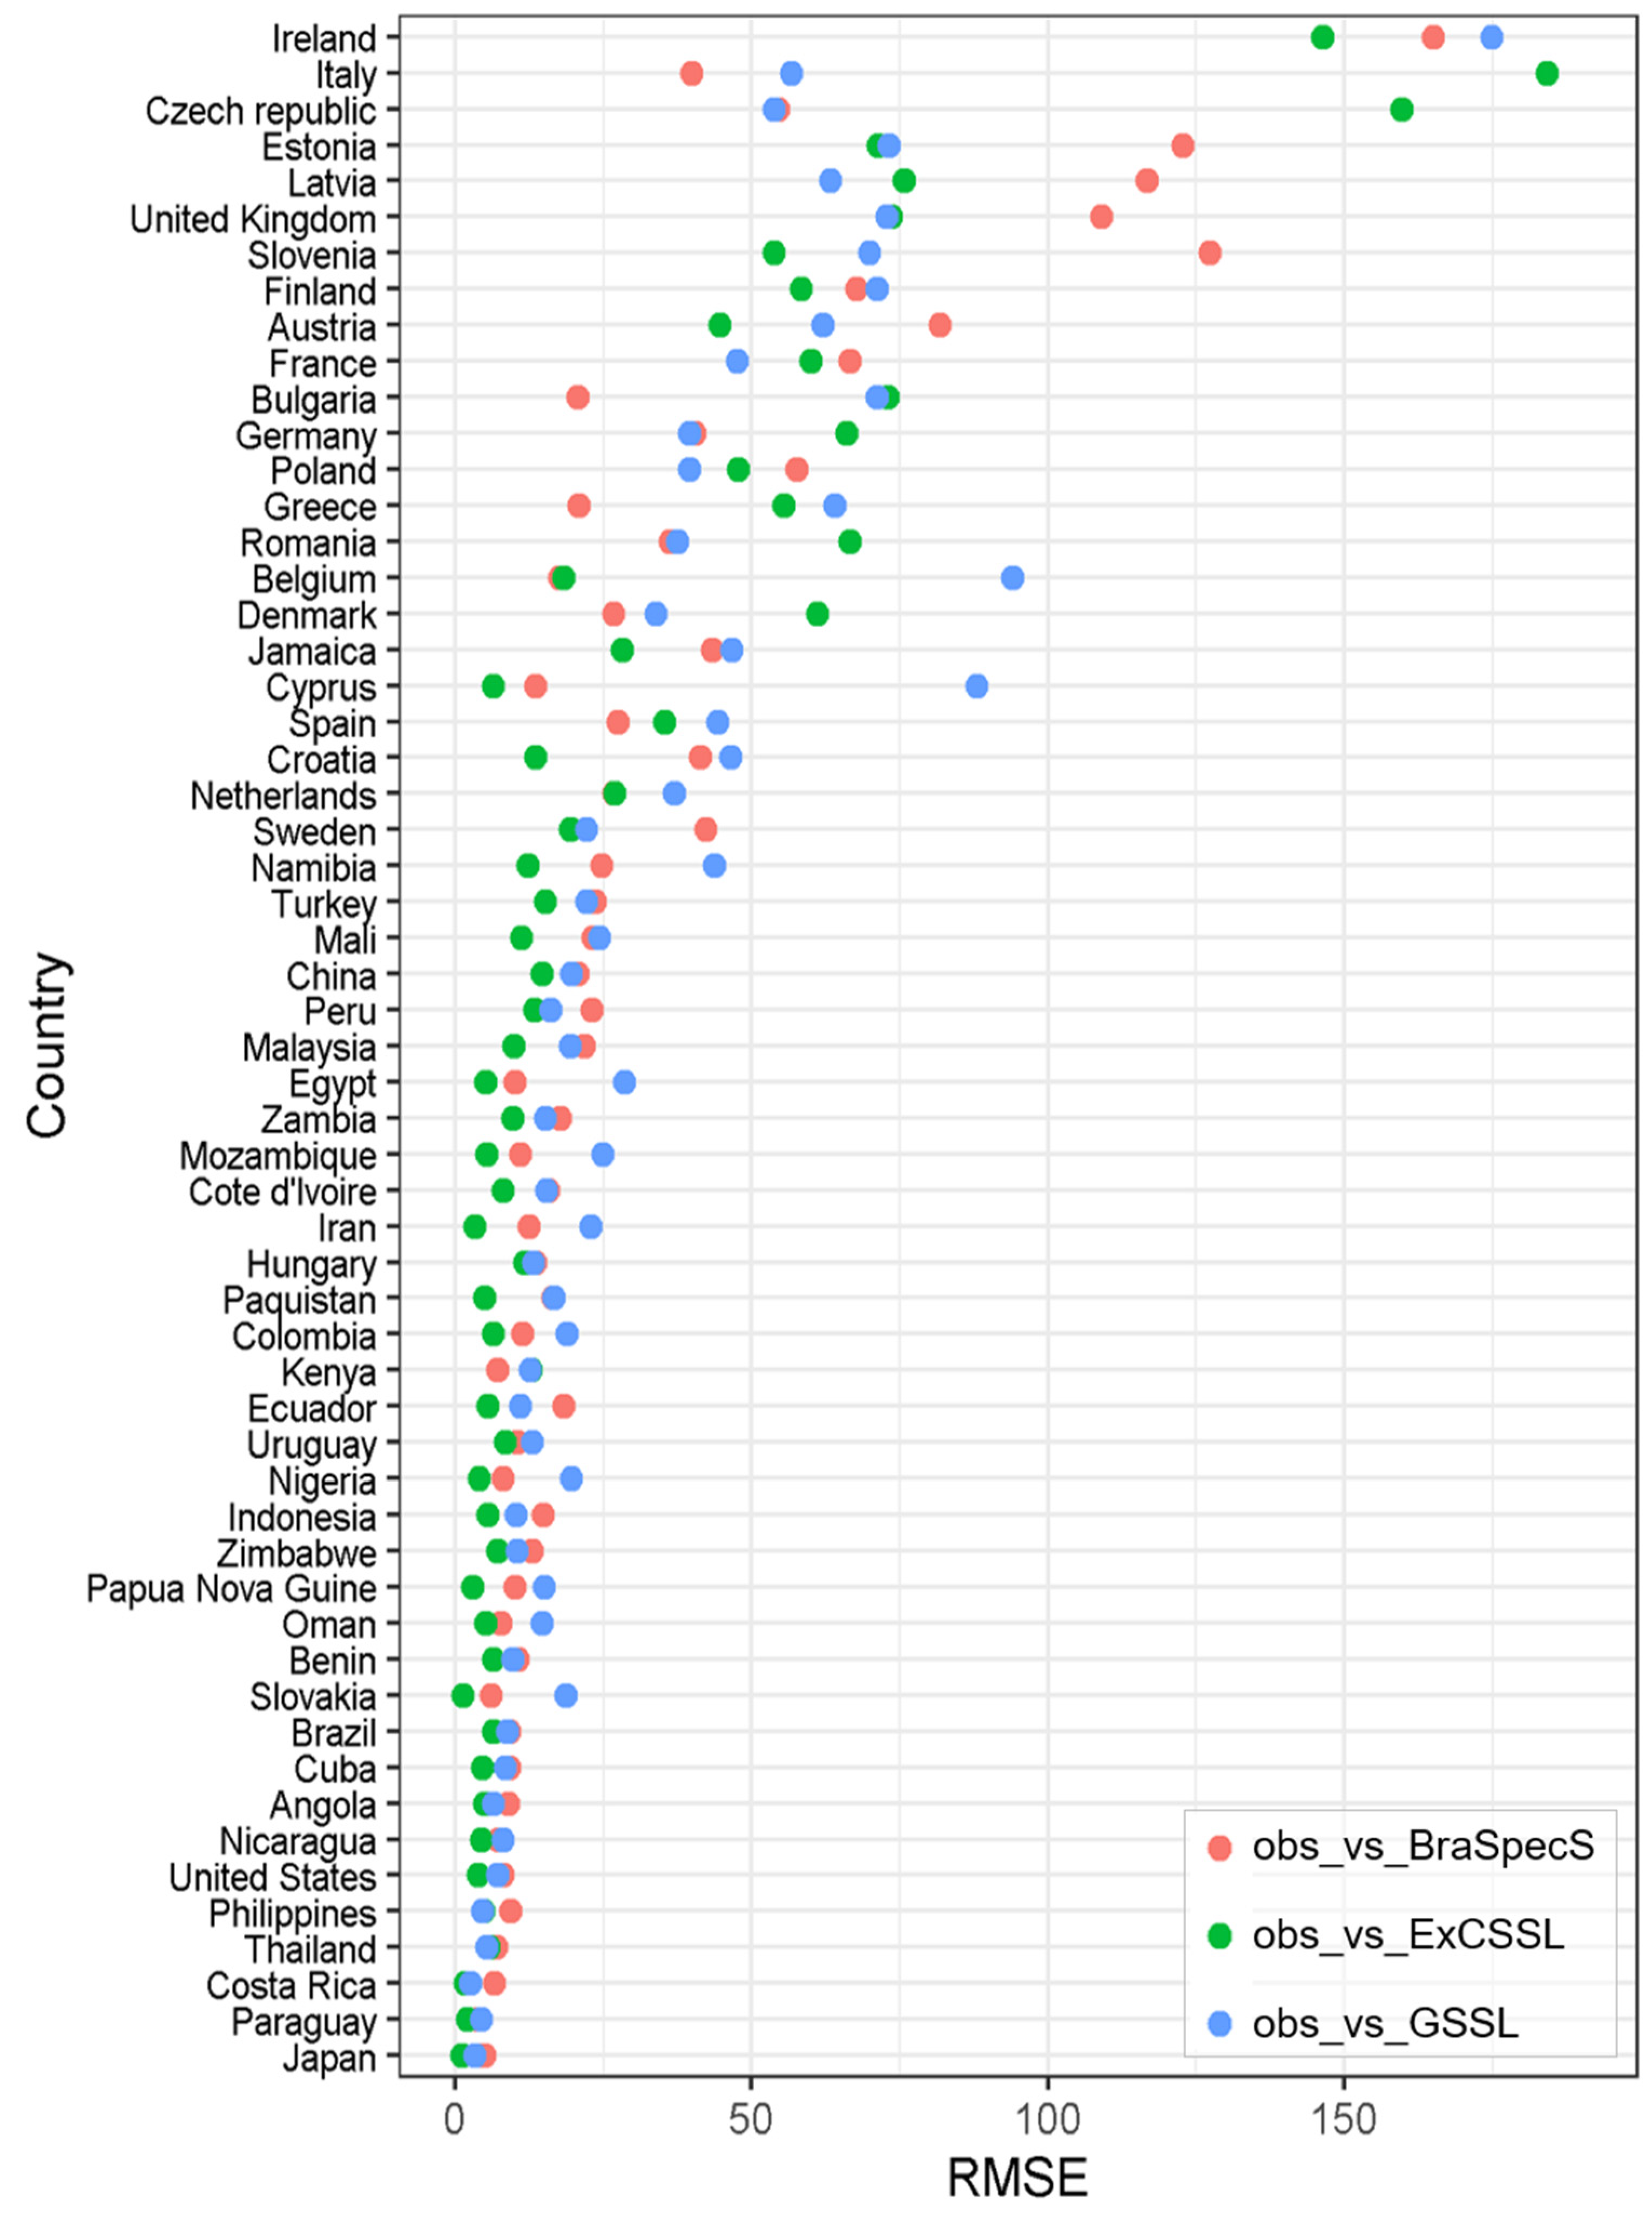
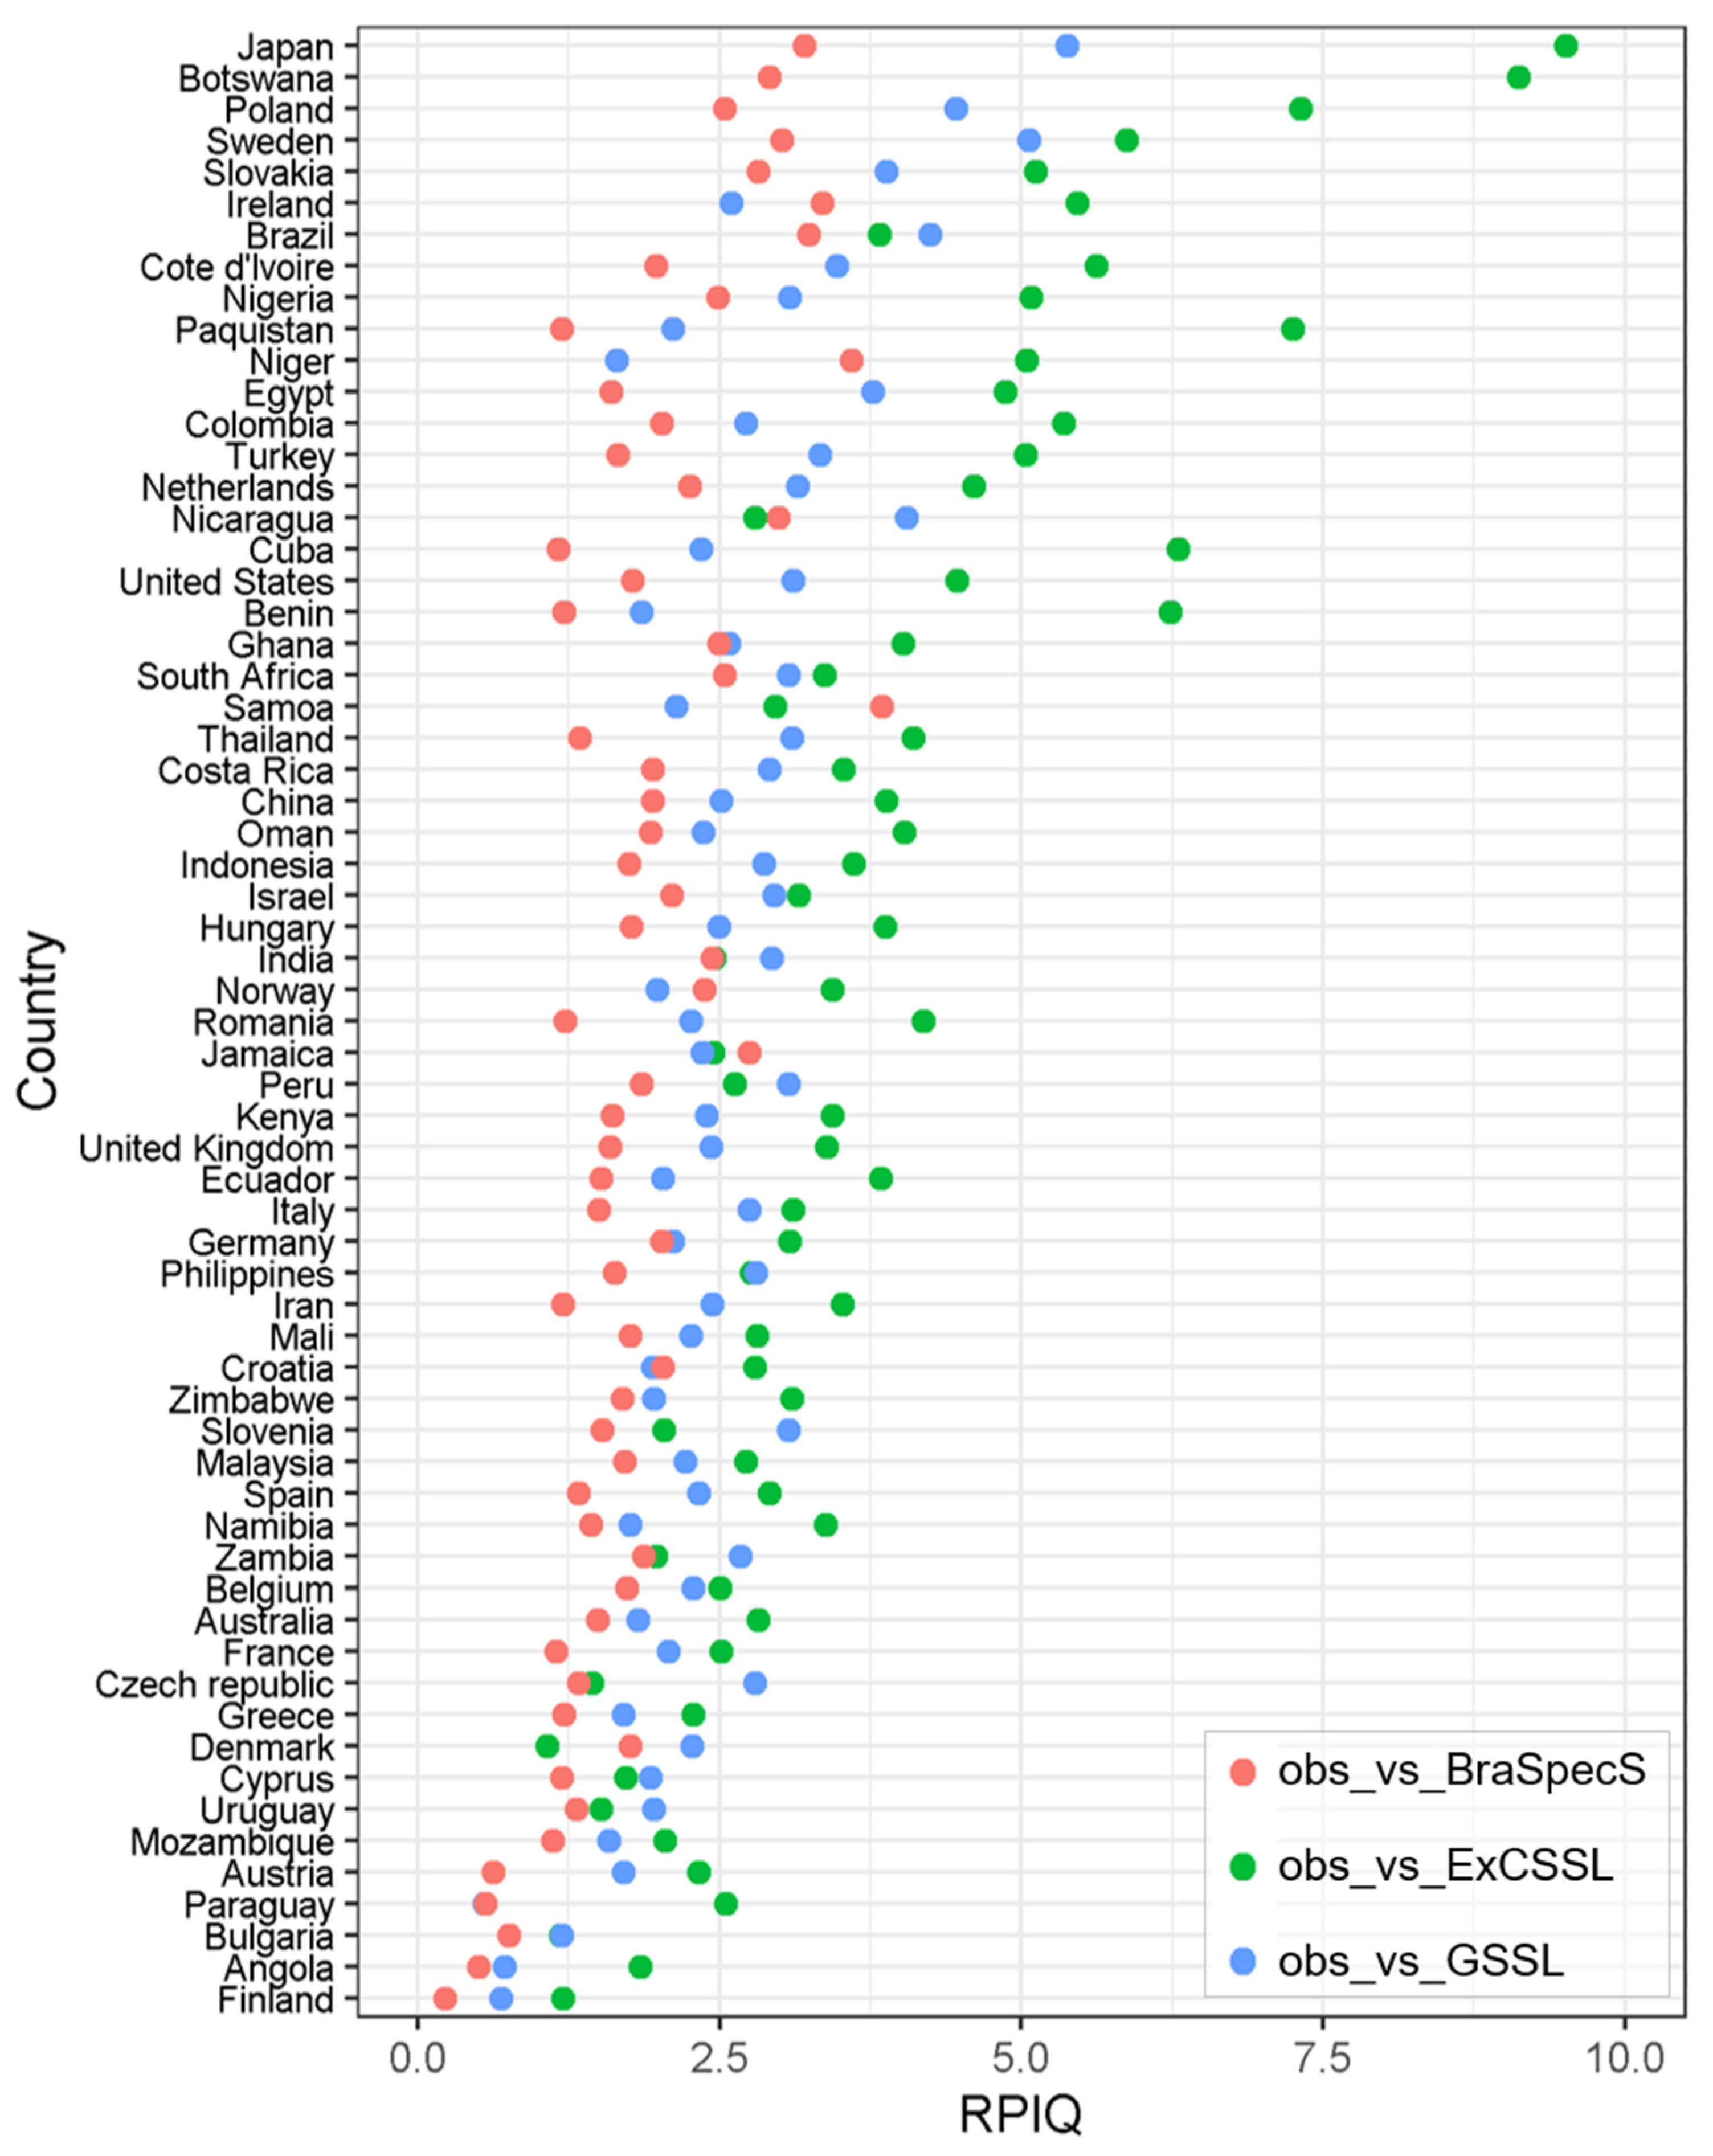
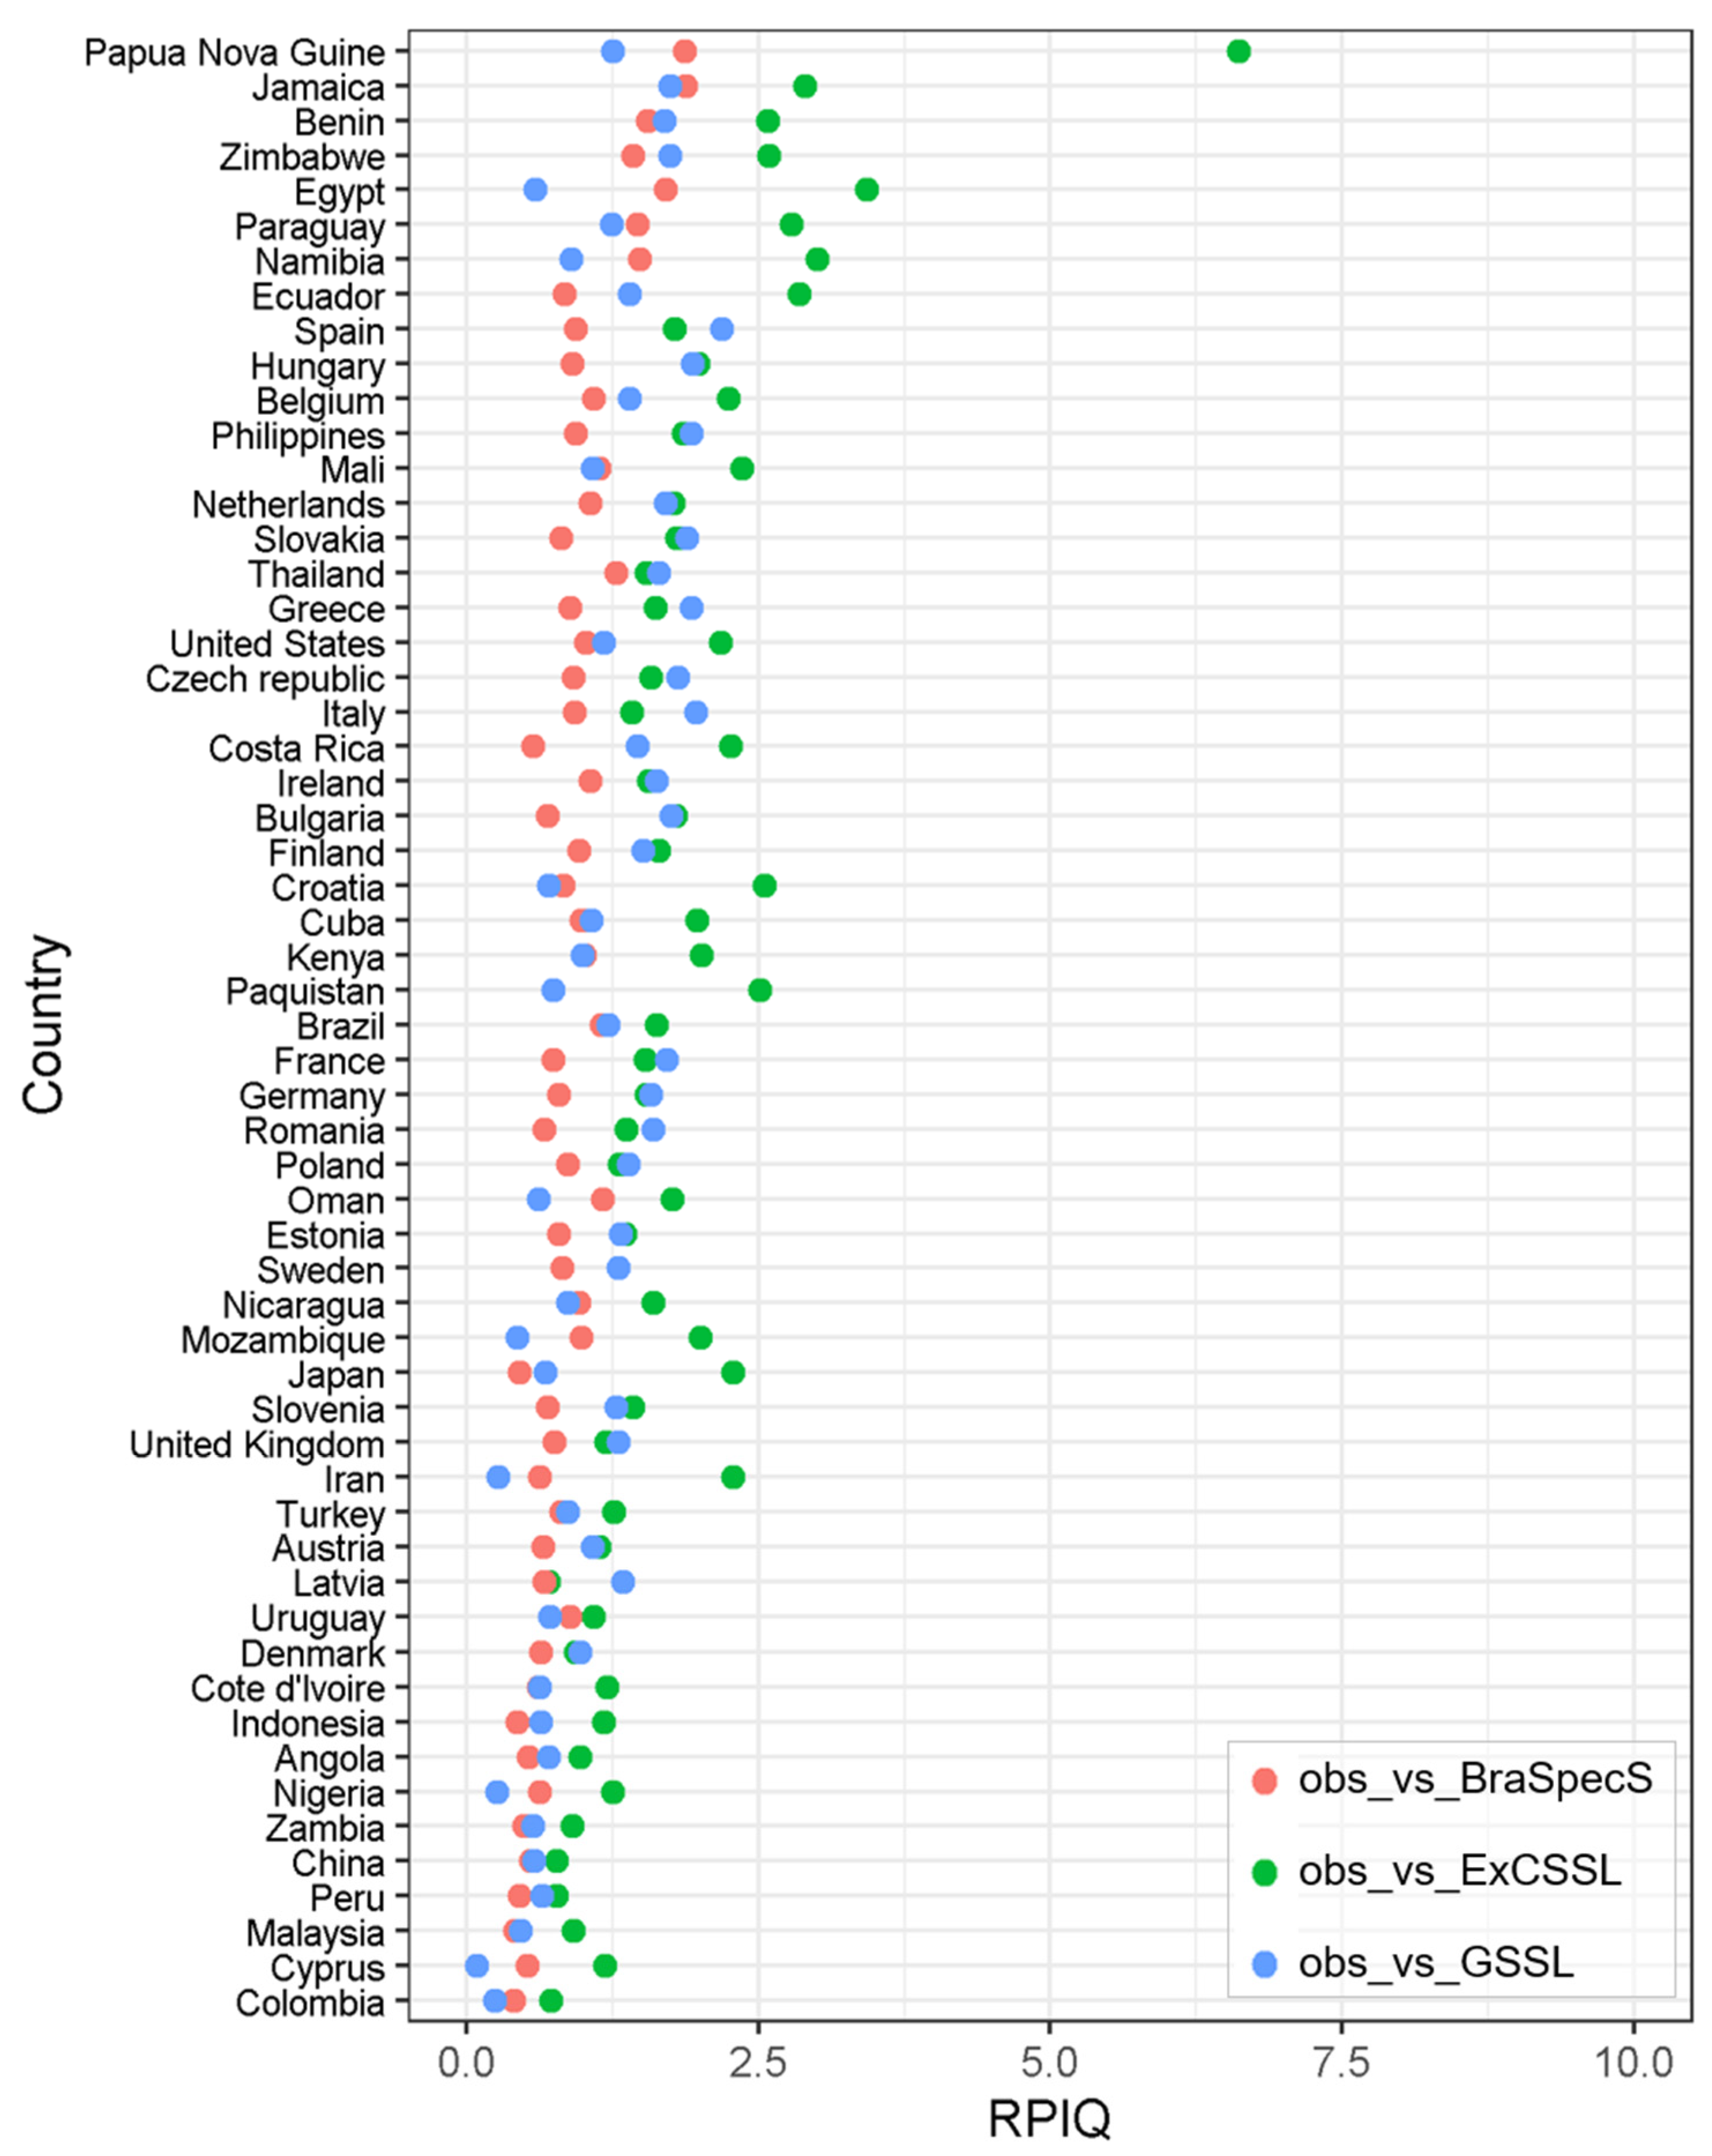
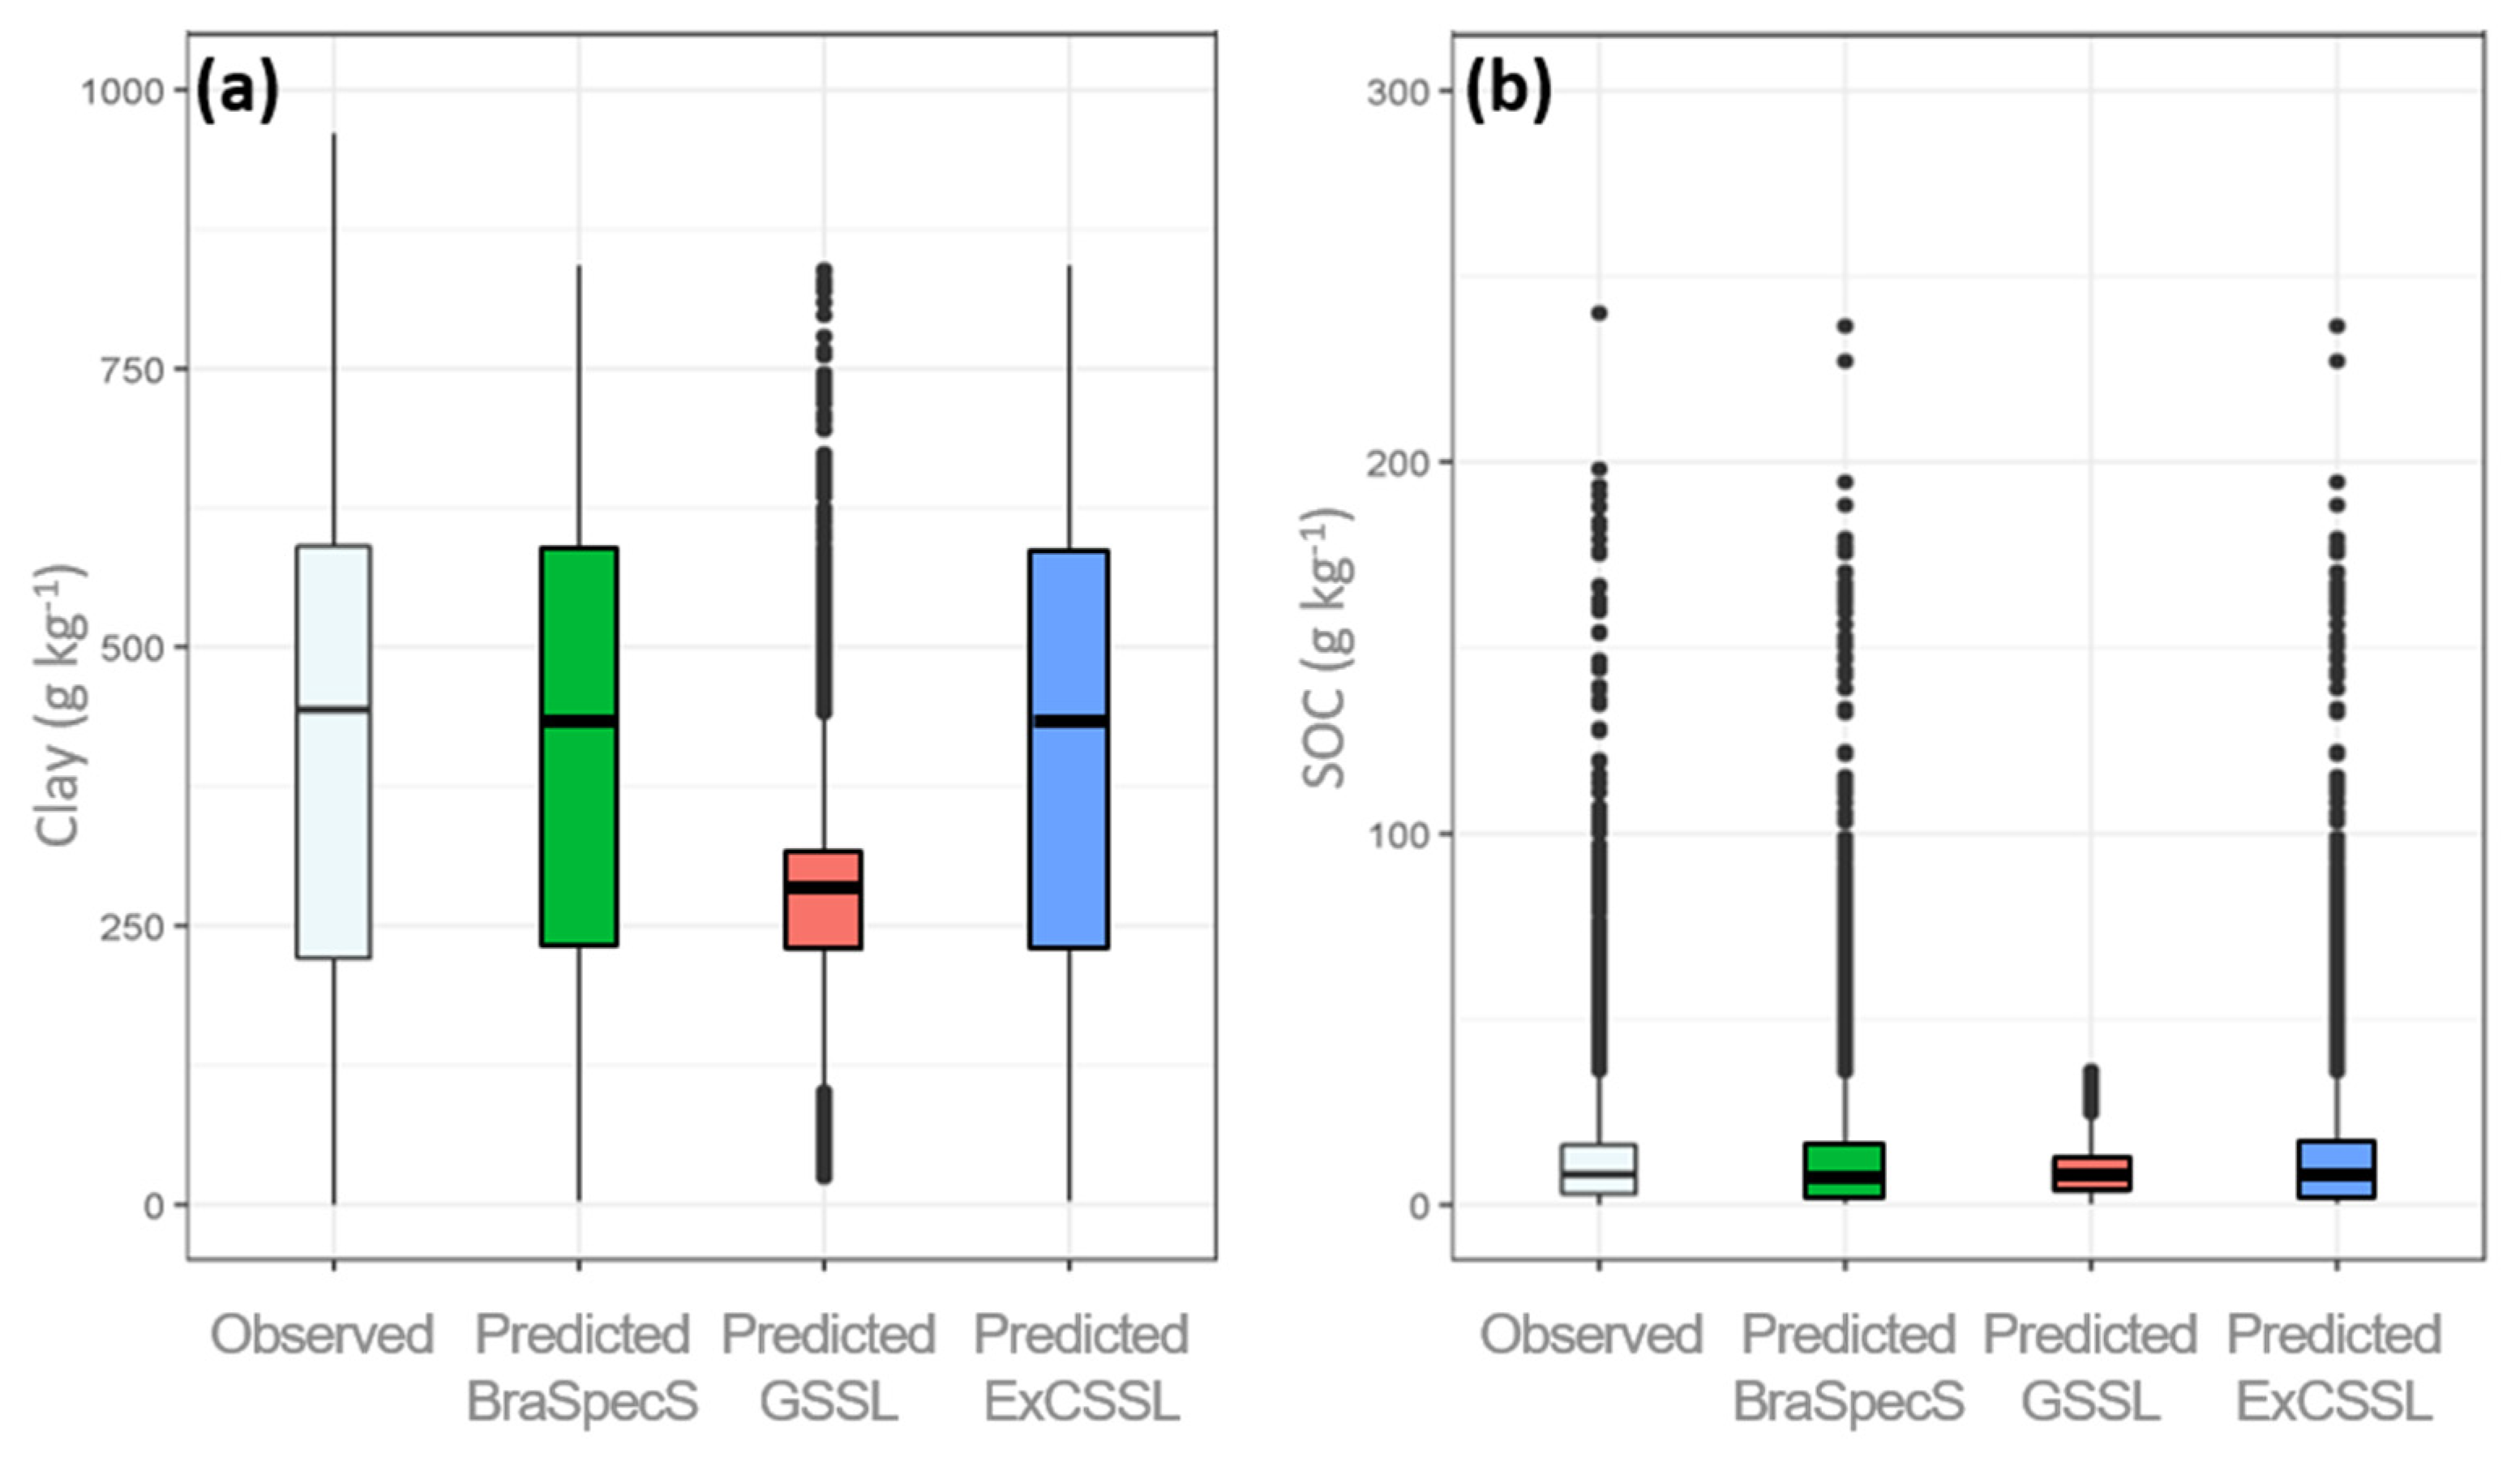
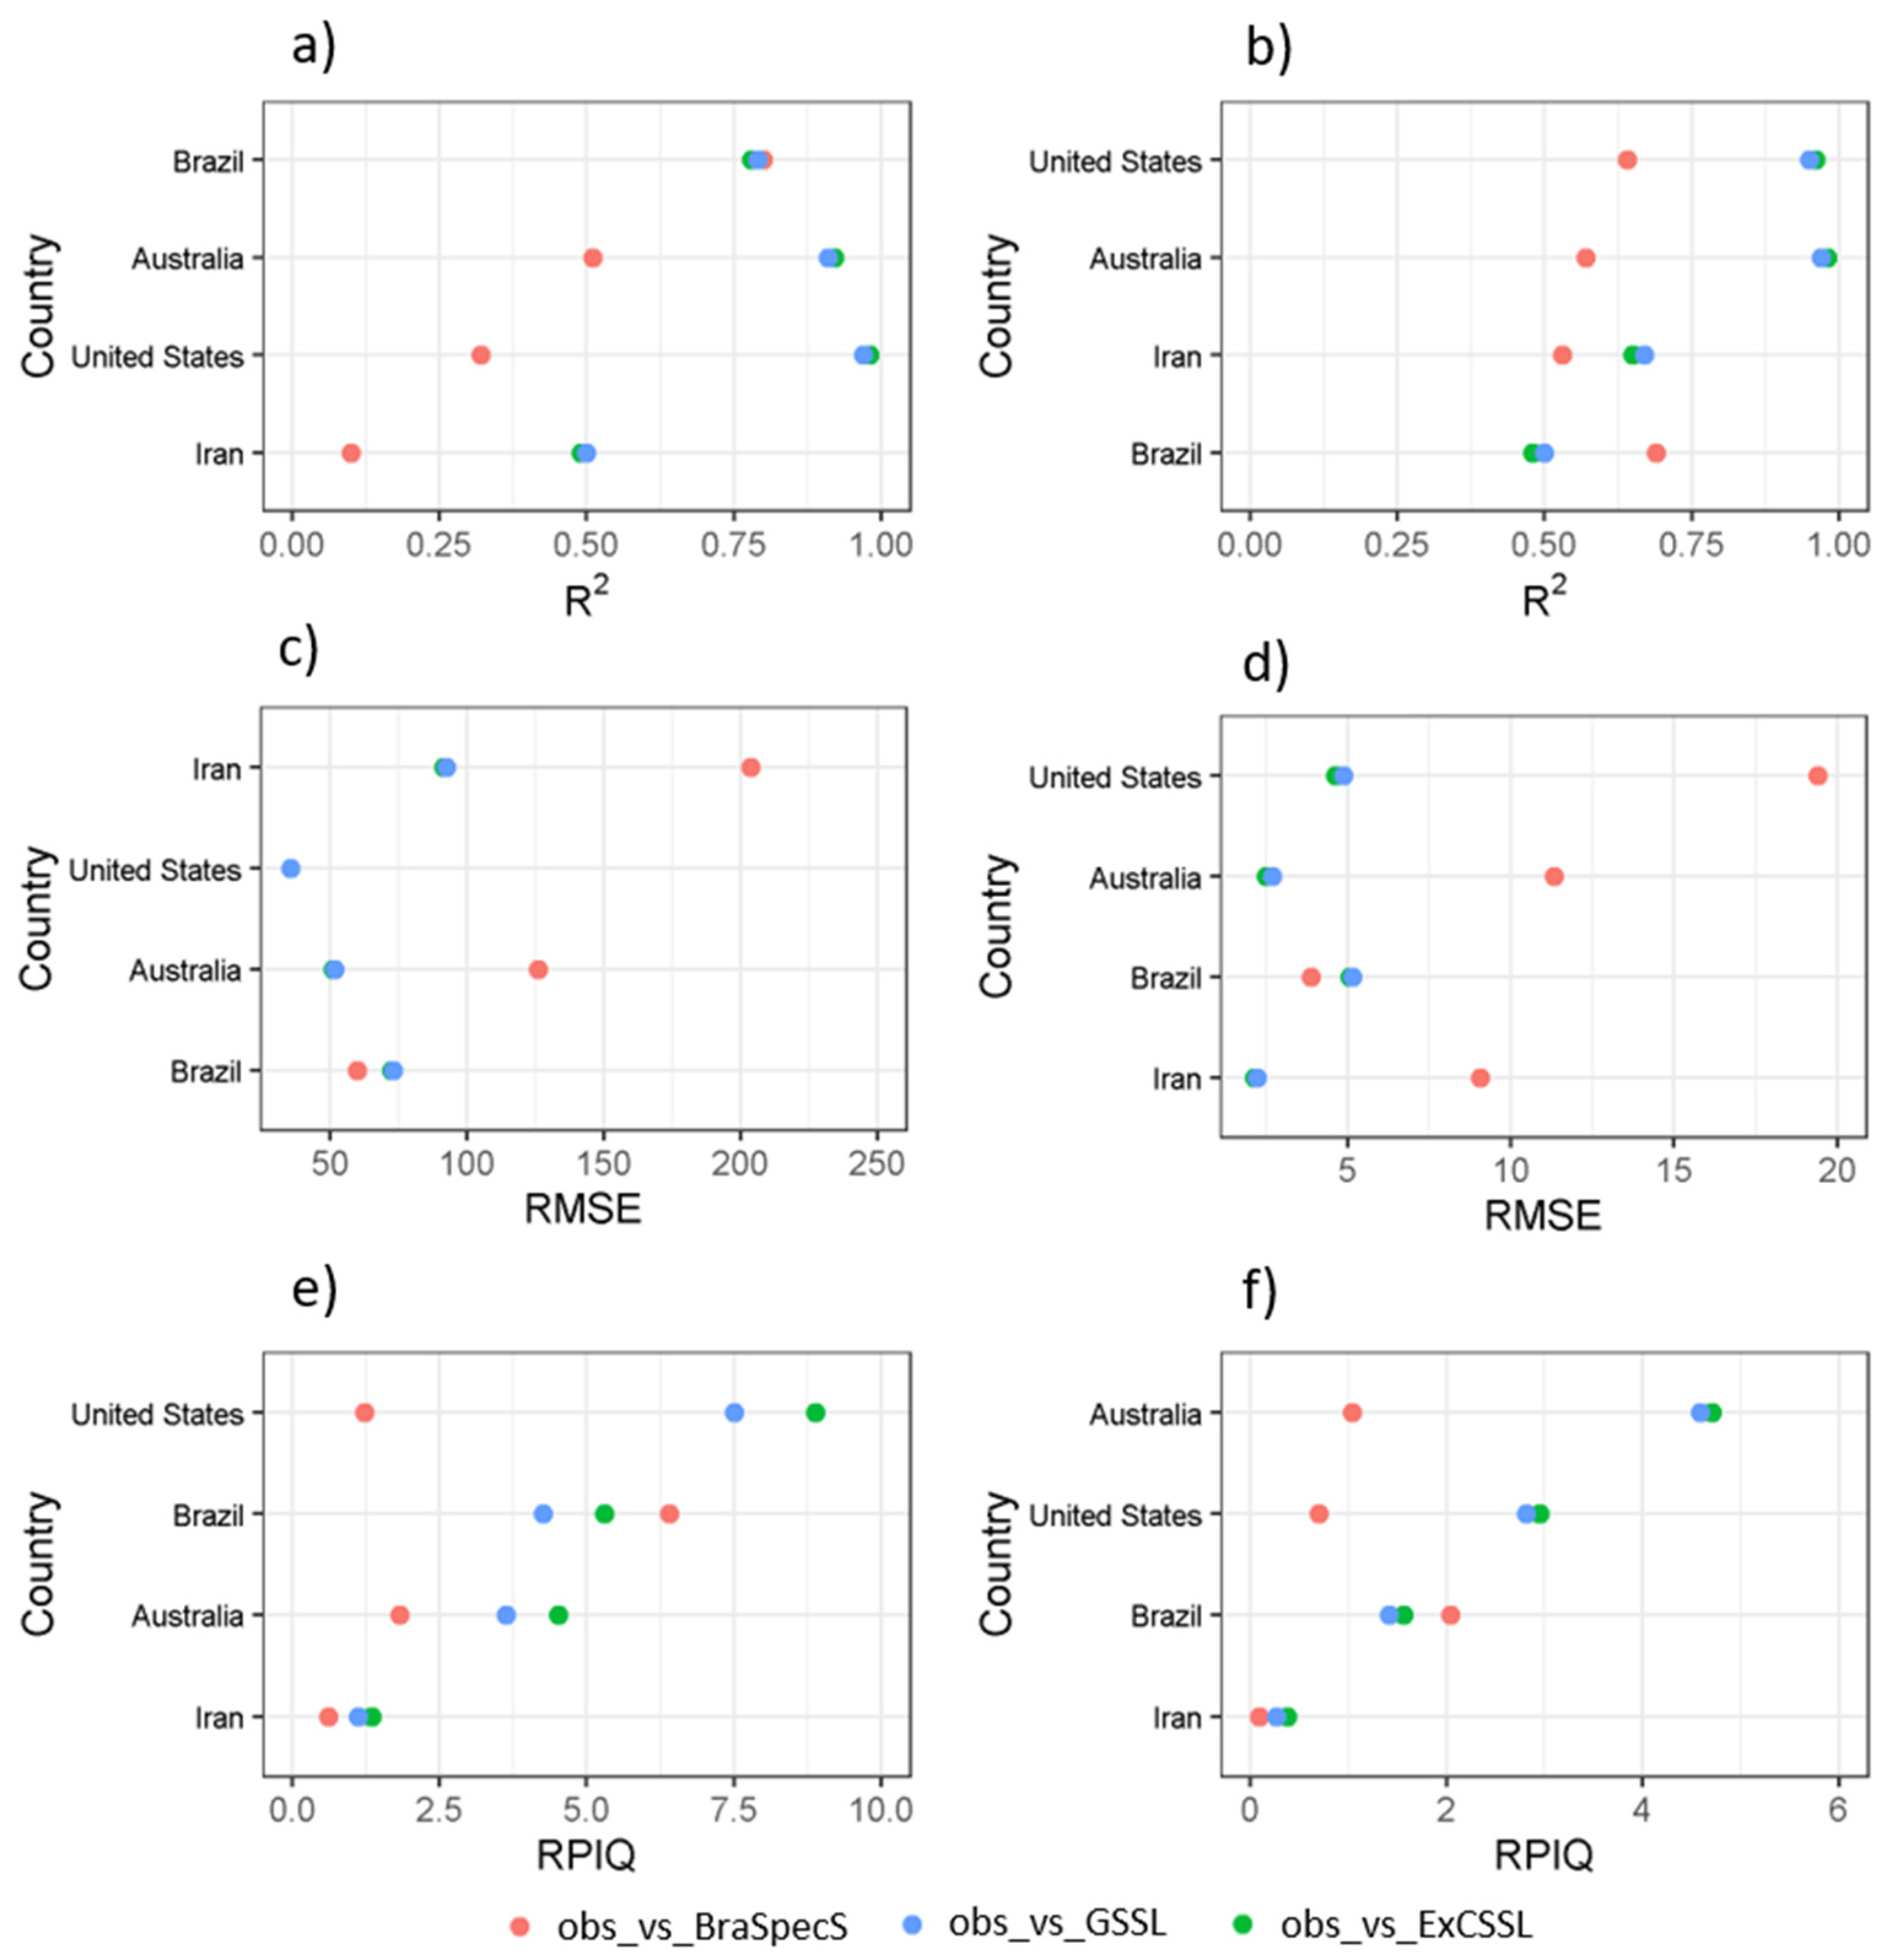
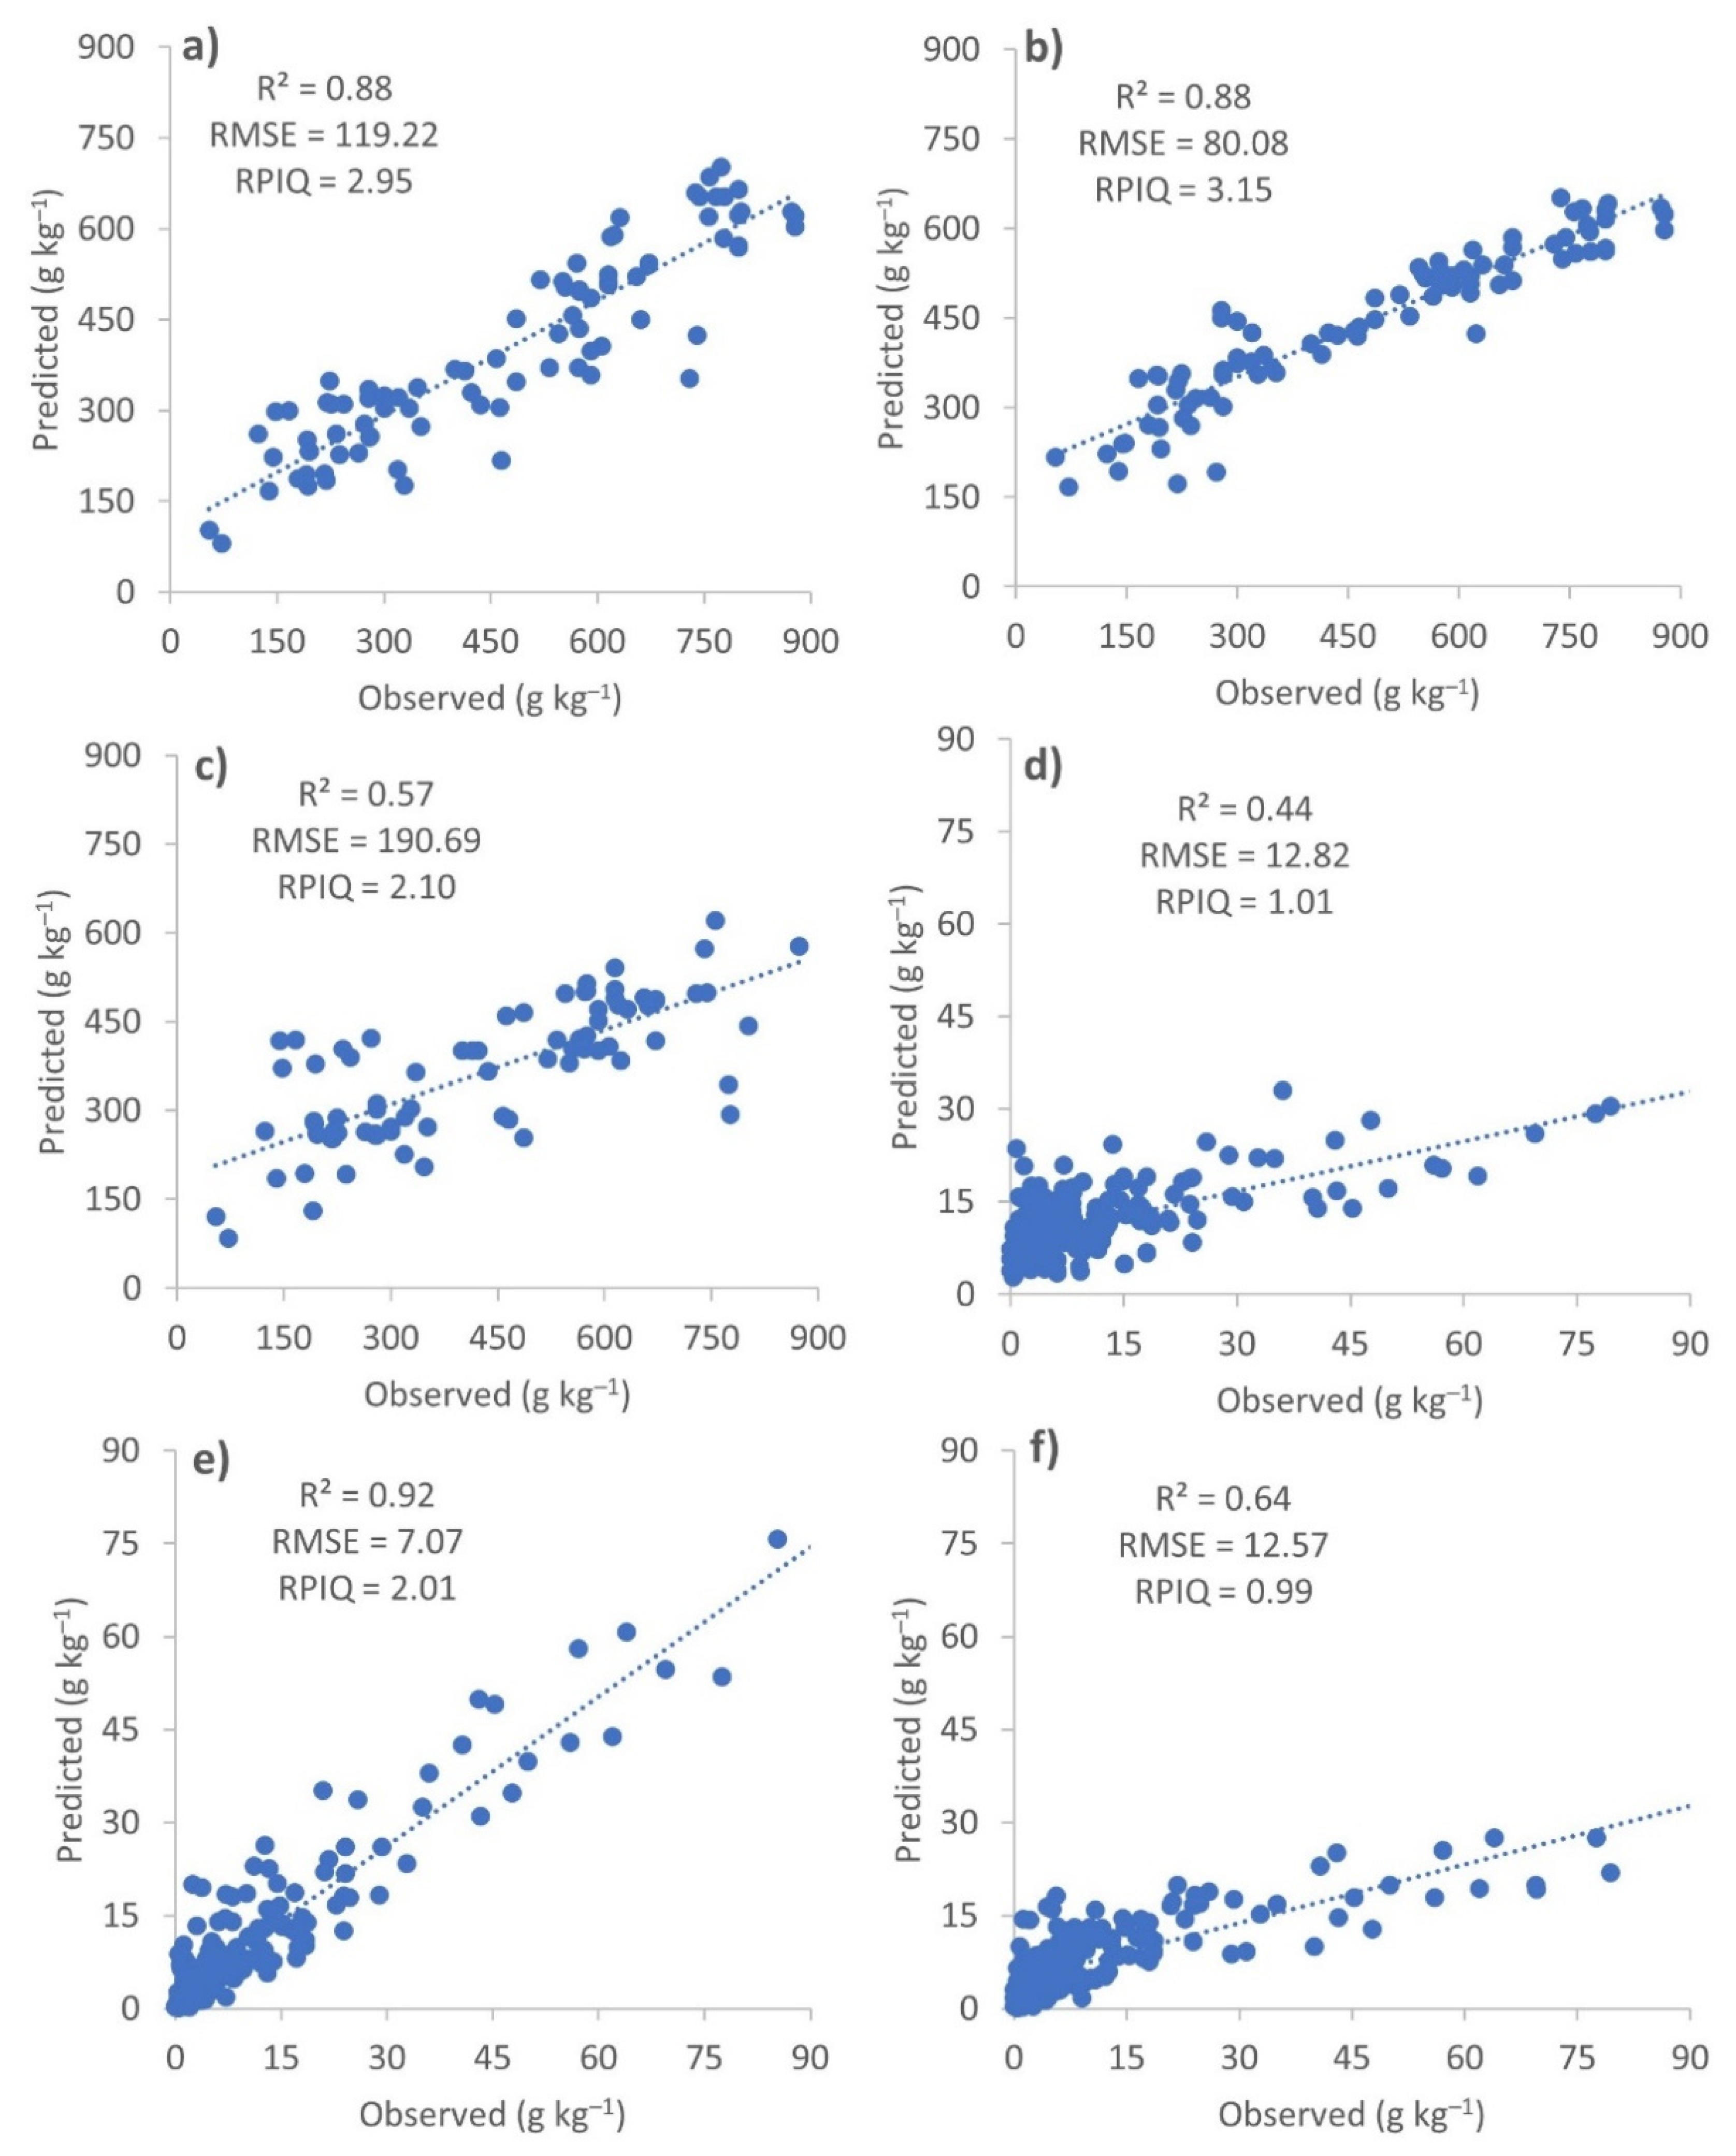
3.2. The Quantification

The descriptive metrics for spectroscopy clay content and SOC estimated concentrations using different population models, that is the BraSpecS, GSSL, and the ExCSSL are shown in Figure 4. For clay, the predicted content standard of all models w very similar with the observed distribution, with 90% of the population ranging mainly from 150 to 400 g·kg−1. For SOC, the predicted value distributions obtained from the GSSL and the ExCSSL were in accordance with the observed values, with 90% of the population ranging mainly from 10 to 180 g·kg−1. However, the BraSpecS model underestimated SOC values compared to SOC observations.

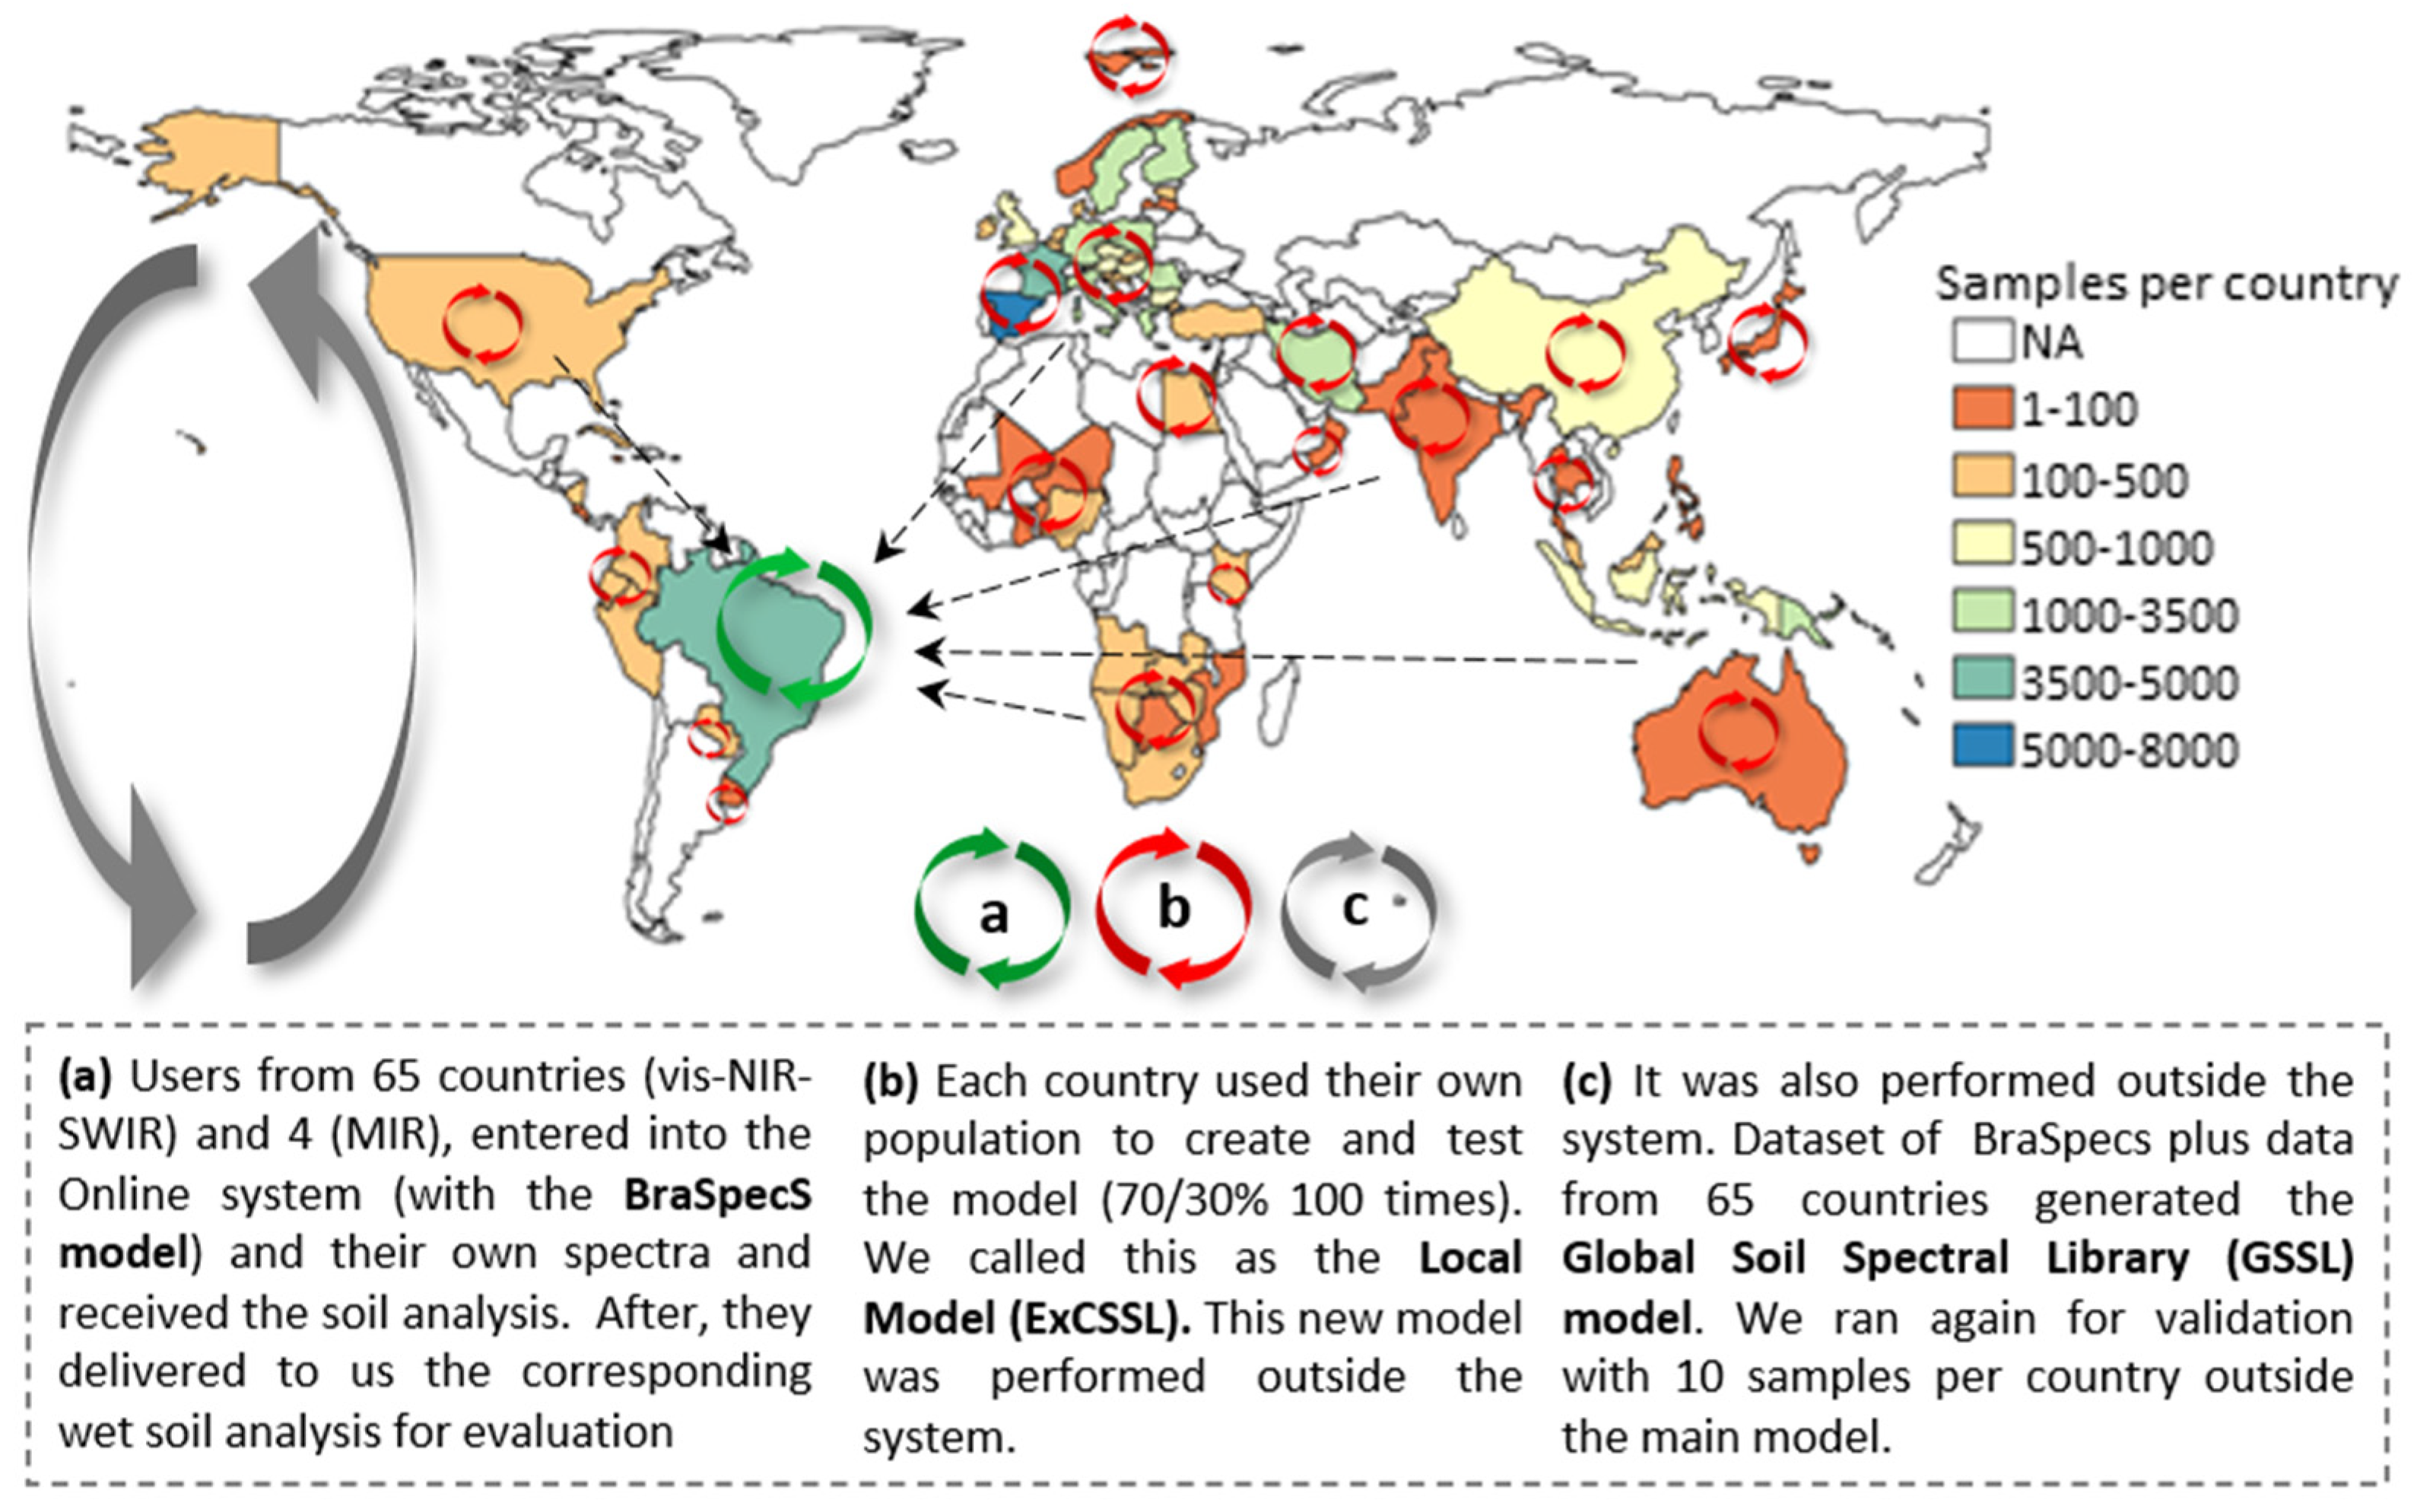
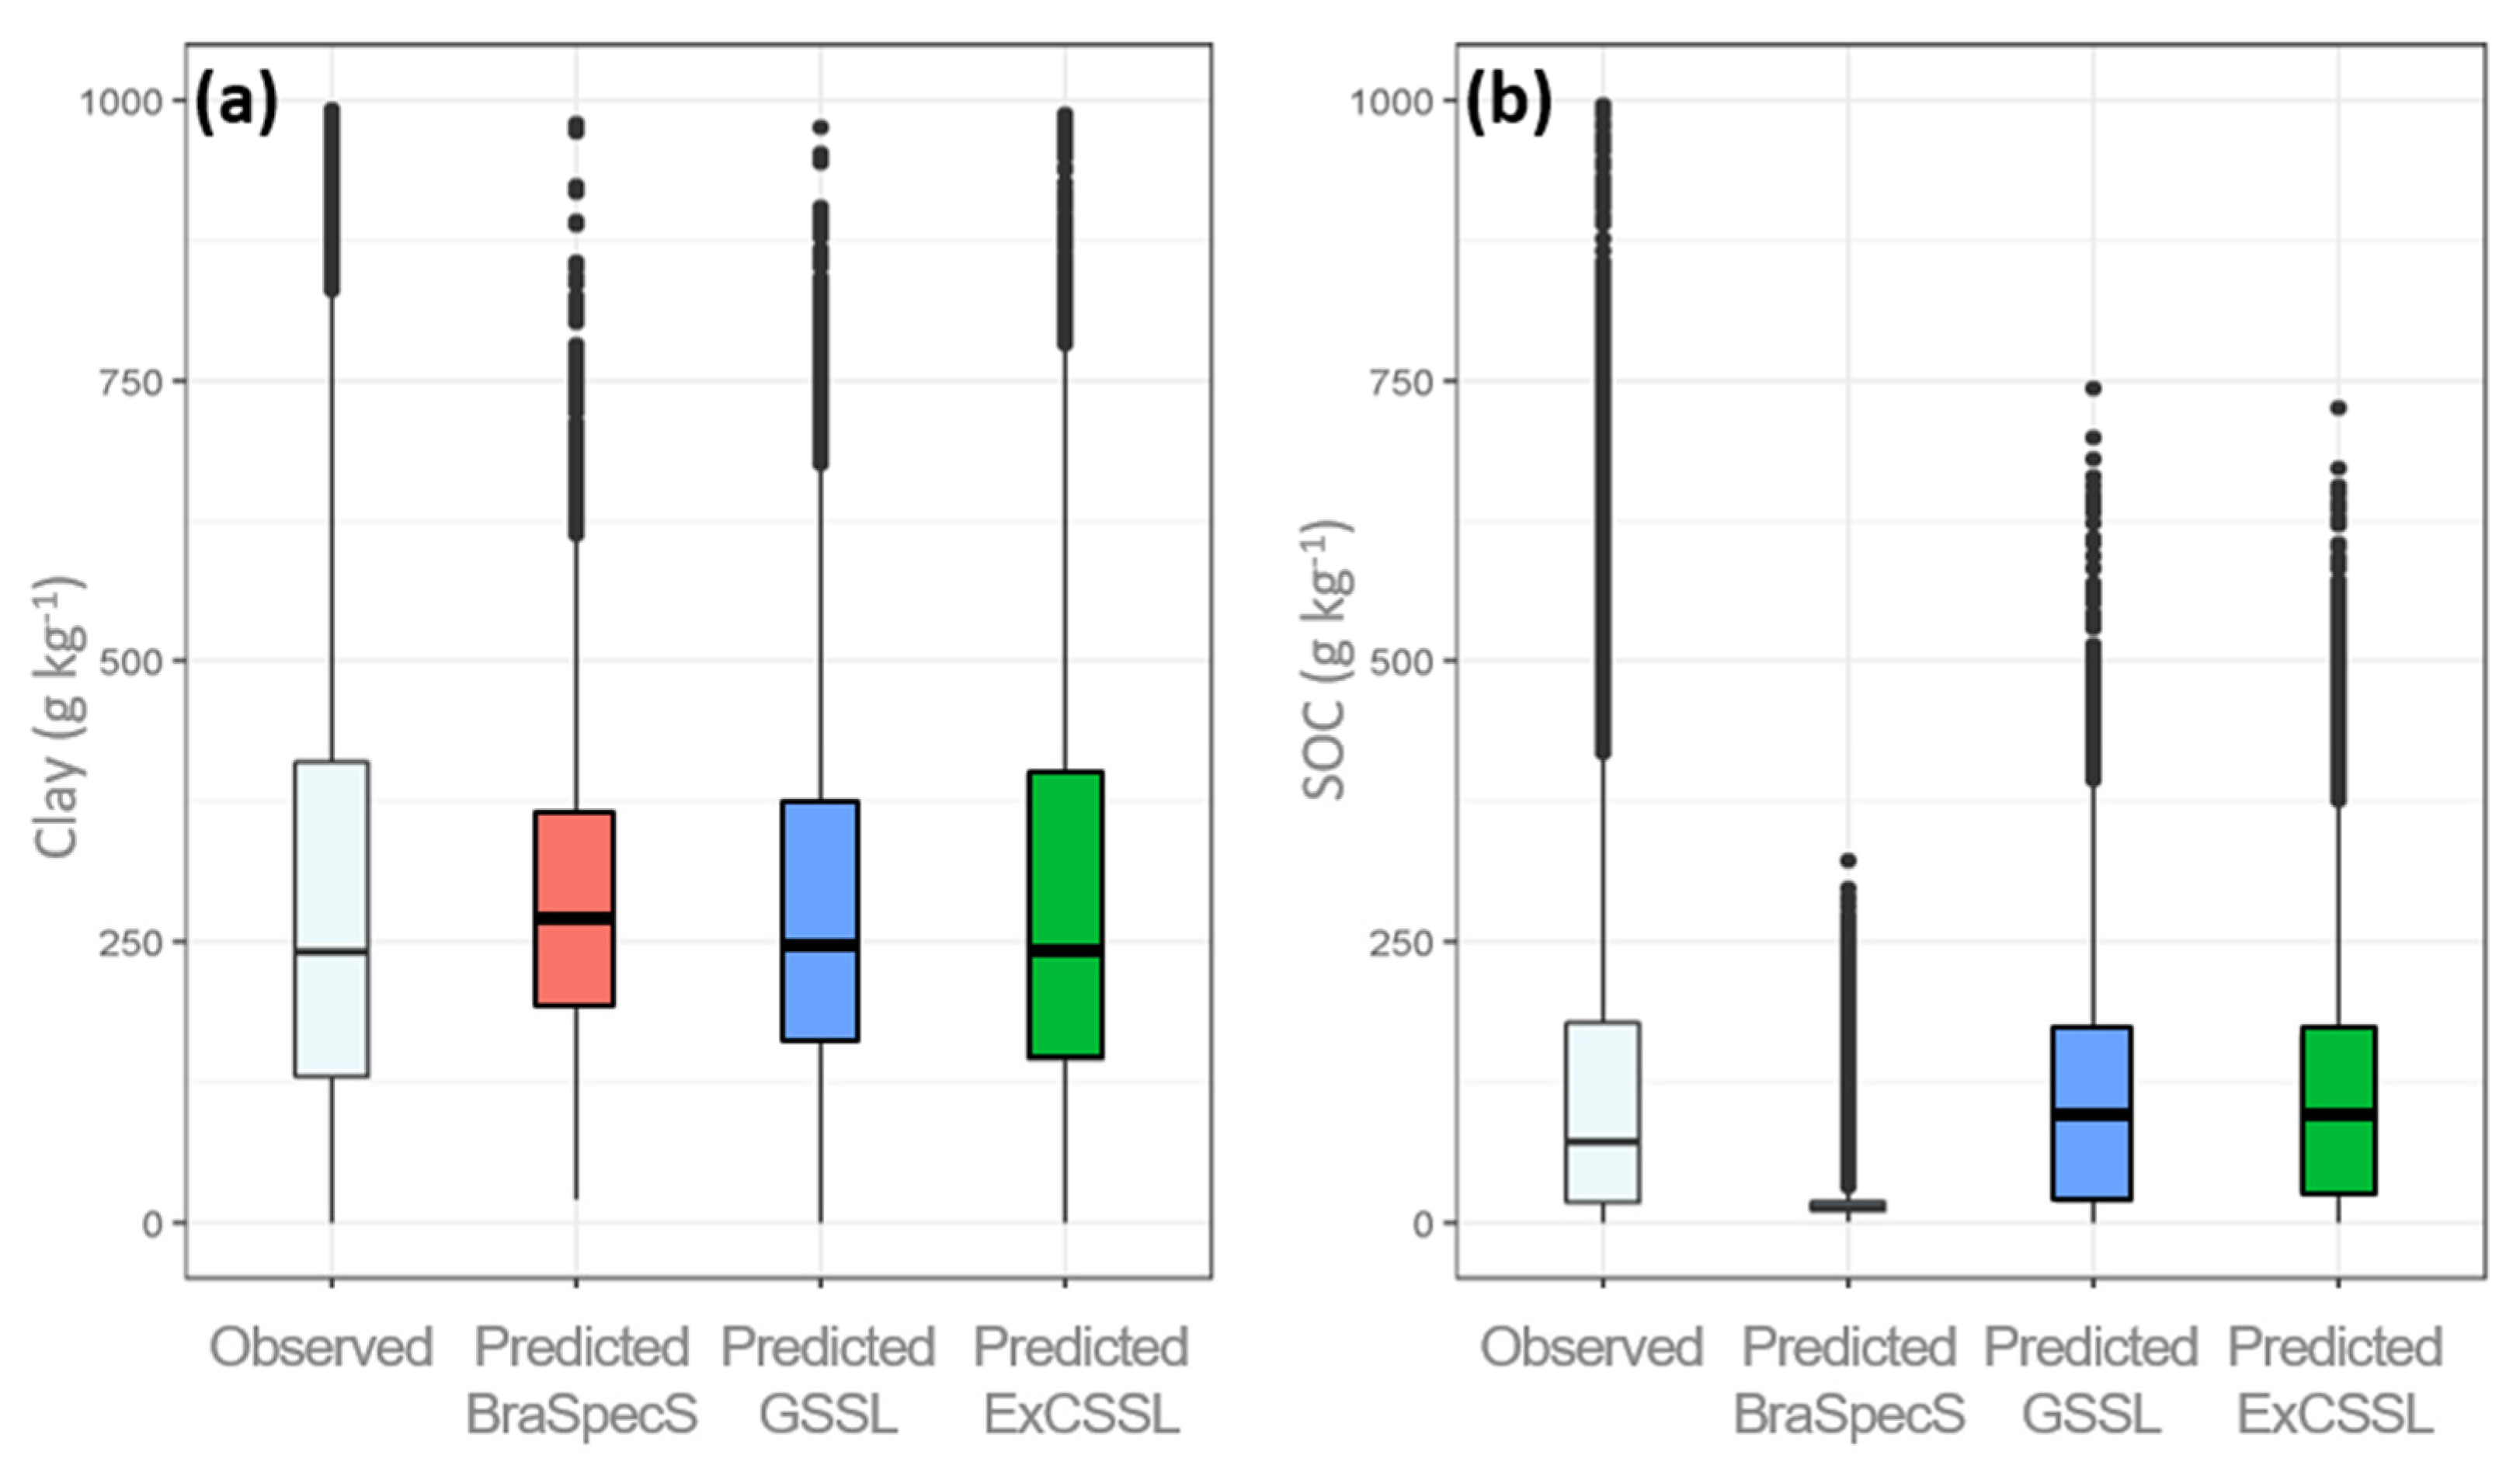
3.3. Prediction Models Based on Different Populations

Figure 5 and Figure 6 present the R2 values of the vis–NIR–SWIR models results for clay and SOC using the different models (ExCSSL, BraSpecS and GSSL) while the RMSEs and RPIQ of clay and SOC models are shown in Figure 7, Figure 8, Figure 9, Figure 10, respectively. ExCSSL presented better results followed by the global and the BraSpecS models. The BraSpecS model was very good for Brazilian samples, but not for other countries.
The BraSpecS model showed a very different value from the ExCSSL in other countries for both clay and SOC in the MIR range (Figure 11 and Figure 12). Prediction values derived from MIR closely matched the observed properties’ distributions, except for clay predictions using BraSpecS. Interestingly, the R2 for clay validation models mirrored the results of vis–NIR–SWIR. However, for SOC, the R2 derived from MIR spectra were substantially better than those derived from vis–NIR–SWIR using the BraSpecS.
Spectra from a large country such as Brazil has advantages due to its high variability in soils and biomes. Table 1 shows that, using the BraSpecS model, 24 countries achieved an R2 of greater than 0.5 for clay with vis–NIR–SWIR data. When the BraSpecS model was applied in 16 different African countries, 7 had R2 score over 0.5, which means that BraSpecS was feasible. In fact, many countries from Africa have similar soils as Brazil. In contrast, the BraSpecS models did not perform well on spectra from Asia. Using ExCSSL, 11 models in Asia achieved R2 ≥ 0.7. The GSSL models outperformed the BraSpecS models, but did not perform as well as the ExCSSL. In total, 54 countries achieved an R2 higher than 0.5 for clay estimation using GSSL compared to only 24 countries using the BraSpecS.
In summary, the best clay model performance was obtained for ExCSSL > GSSL > BraSpecS irrespective of different continents with ExCSSL clay models showing R2 larger than 0.5 in 59 countries. Interestingly, even in South America, BraSpecS clay models were outperformed by GSSL and ExCSSL models. What also stands out is the high performance of ExCSSL clay models in Europe, with 13 countries out of 23 achieving a R2 > 0.8. Another interesting point is that 4 countries from Europe had the same R2 (0.7–0.8) with all models (BraSpecS, ExCSSL and GSSL).
For SOC, the results for R2 in validation mode using vis–NIR–SWIR data were less promising, when using the BraSpecS (Table 2) but maintained the trend of better for the GSSL and the best for the ExCSSLs. The BraSpecS and somewhat GSSL SOC models performed especially poorly in European countries. Indeed, these ones have very different mineralogy and carbon contents.

4. Discussion

4.1. The Web Service Advantages and Limitations

The BraSpecS online platform presented here overcomes some practical limitations and makes soil spectra a service accessible to anyone, democratizing its usage. Although a highly complex, state-of-the-art machine learning method (Cubist) was used in this study, our platform frees the end-user from having to learn spectral modeling. A user only needs to upload a spectrum and will receive the soil analysis. This may start to bring years of infrared research directly to the public.
The spectral platform approach enhances equity of making spectral soil models and knowledge readily available to the global community at no cost. The data-driven knowledge engrained in soil models, such as ExCSSL, BraSpecS, and GSSL, developed from vis–NIR–SWIR and MIR spectral data is shared with users who become participants to co-create larger and larger global soil spectral libraries that serve the greater good.
The web services on the spectral platform are user-friendly, fast, and facilitate the formation of an active and engaged community of experts, soil scientists, students, farmers, consultants, and other stakeholders. As a living technology platform, suggestions from the user community can be readily integrated. People who belong to a global soil spectral community can also benefit by retrieving soil analytics from their uploaded spectral data.
While other global and continental soil spectral models were driven by researchers and professional soil databases. Other global spectral communities are also making similar efforts as our work which will increase the spectroscopy efforts (e.g., Soil-Spec4GG). On the other side, there are vertical groups with researchers subsuming people’s spectral data without a data sharing policy that fully acknowledges and credits the user’s labor and costs of field data collection. Works such as from [10], the European LUCAS dataset modeled by [62,63], as well as the U.S. soil spectral data modeled by [23,64,65], were important to show the community the importance and potential of the technique. A free repository such as by [66] have great importance to make this grow since users have access to data. Therefore, our initiative demonstrates the importance of providing online results to end-users and this may encourage other working groups to improve similar new systems.
One of the reasons the accuracy varies between SSLs is the difference in measurement protocol used by the SSL owners. This issue needs to be resolved in the near future with an initiative to establish an agreed standard and protocols amongst the global users. This effort is being carried out by the IEEE SA P4005 working group.
In addition to the service, developing a soil-spectral data web platform that is anticipated to grow even further in the future with the submission of new spectra provides a virtual space to build community. Due to data ownership, the system used a non-disclosed dataset idea. If one is interested in the data, the system indicates the data owner, and encourages the user to contact the data custodian, increasing community knowledge.
The pedometric and soil modeler community have become quite specialized in AI, scripting, modeling, and high-end data processing, which has somewhat disconnected them from work with field pedologists and farmers cropping the fields. Thus, our soil-spectral web platform helps bridge the gap between modelers and users of soil data. Our tool offers people to collaborate, form partnerships, get to know others who are interested in soil spectroscopy, and better understand soils in all regions of the globe. Reconnecting soil modelers and soil spectral data collectors offers new avenues to build community. In essence, new connections can be made between “the machine” that models soils and people with interest in soils.
To understand the usefulness of shared SSL, consider the following example: Stakeholders (farmers or researchers) could send their soil samples to a central SSL (e.g., national, or global SSL), where they would be scanned and the spectral data stored, or they could send already acquired soil spectra. Local SSL can be explored for personal interests or to meet other needs (e.g., soil monitoring) and feed the global SSL, growing a global repository. Once a global SSL is trained and evaluated, spectra from a profile of an unknown type can be compared with spectra in the global SSL and a preliminary soil classification or specific soil properties, such as SOC or clay content, can be estimated. Global, regional, and local SSL can co-exist because they serve different needs and purposes. While local SLs are customized to specific soil regions, they tend to perform better to predict SOC and clay than regional (BraSpecS) and global (GSSL) models, as demonstrated in our study. However, the outlook for SSL is that as more soil-spectral data pairs are added, global prediction performances using more advanced analysis are expected to become better at modelling local soil variations. Growing a global SSL will eventually converge to a saturation level at which regional soil variabilities are well represented; thus, it is expected that global SSL using AI technology will provide as robust and accurate soil prediction models as local SSL in the future.
One requirement for a robust model is that the dataset must be standardized with the same spectral bands and the same soil analysis method. This is because the interaction between wet analytical data and spectra can be different when spectral models are trained using unharmonized spectra and SOC data. This could increase the predictive uncertainty and reduce the interpretability of the model. Data quality is crucial for superior results, although it is difficult to achieve with legacy datasets. Thus, it is imperative to start using agreed-upon standards and protocols on careful and agreed spectral soil measurements with the quality of soil wet chemistry analysis, which are the basis for success in delivering accurate model estimates for soil properties.
Another limitation is that end-users will need to acquire or gain access to spectroradiometers to collect soils’ vis–NIR–SWIR and/or MIR data. These limitations are viewed as temporary since soil sensor technology has become more widespread with the advent of precision agriculture and “smart” agricultural management. In addition, regional cooperatives or centers may serve farmers and end-users in more resource-limited settings.

4.2. Brazilian Users of the BraSpecS

For the Brazilian vis–NIR–SWIR dataset, clay content presented good results using the platform, with R2 = 0.75. In contrast, SOC presented lower values (R2 of 0.45). These results indicate that the SOC is more dependent on so many factors such as biomes, land use, mineralogy [12,67], and has great dynamics due to climate and microorganisms that mean its quantification can become a challenge. This agrees with past studies, e.g., [6]. In this scenario, the use of SSL and local models can be a strategy for the online service to return more accurate estimates to end-users. Moreover, SOC spectral estimation has been a challenge in Brazilian agricultural areas because of the low soil carbon content. The SOC results using MIR were significantly better than vis–NIR–SWIR, since they reached R2 of 0.8 and 0.7 for clay and SOC, respectively, in agreement with past studies [68,69,70]. Thus, the BraSpecS online platform can be used as an important service for soil analysis over Brazil, considering the level of accuracy and the clay and SOC property.

4.3. International Users of the BraSpecS Based on the Internal BraSpecS

International users from several countries submitted spectra via the online platform to identify whether their local samples could be predicted by the BraSpecS service. We observed that for clay, three countries from Africa, two from Asia, four from Europe and two from North America showed R2 values of over 0.7. Despite that, in Europe there were still five countries with models in the R2 range of 0.5–0.7 for clay. The results were less satisfactory for SOC, which agrees that this property is more dependent on other factors such as biomes, land use, and others [10]. In the case of clay, results indicated that the BraSpecS model presented good results for some countries. For example, spectra from Thailand, Benin, Denmark, Jamaica, Japan, The Netherlands, Nicaragua, Poland, Philippines, South Africa, and Sweden reached R2 over 0.7. This indicates that for clay, a model built using spectra from a large, diverse country can quantify spectra from other countries. On the other hand, many countries reached low values. This gives two indications: (1) a country model can assist other countries but not all of them; (2) the user will have the opportunity to choose the SSL depending on soil similarity. For example, if the user lives in a country that does not have an SSL, the user can choose a global one or another region with similar soil. These limitations can be added to the online spectrum service platform, enabling the user to make the decision to use local or global models based on the accuracy of the estimates required for each application of the results.

4.4. International Users of the BraSpecS Based on Local Datasets

SSLs may adopt several approaches and levels: a farm [71], a region [72] a country [12,19], a continent [33], or the world [10]. The present paper presented different approaches to understand soil population specific modeling (ExCSSL, BraSpecS, and GSSL).
We observed that ExCSSL were clearly better at quantifying clay and SOC in almost all cases and continents. The user-specific ExCSSL preserved the main characteristics of their regional soils, parent materials, biomes, and other information which spectra carry. This finding agrees with [73], for whom the transfer of vis–NIR–SWIR models from global to local scale, the latter were the best. In our study, better model performances for both clay and SOC were observed in local models when compared to the GSSL, irrespective of different continents with diverse soils. We observed only a few cases in Europe where model performances were quite low for both SOC and clay (R2 < −0.3).
Our results clearly demonstrate that the GSSL model performed better than the BraSpecS model for both SOC and clay content, while the local country-specific models outperformed both BraSpecS and GSSL models.
The caveat is that local datasets had different sample sizes (unbalanced sampling design) which may have influenced model performances. The issue of unbalanced datasets in testing the transfer of soil spectral models was addressed by [74] who used a standardized balanced sampling design; however, in their study the transferability and scalability of spectral models (local to regional scale, and vice versa) for soil carbon were inconclusive. The study found that the transferability and up- and downscaling of the soil spectral models were limited by the following factors: (a) the spectral data domain; (b) soil attribute domain; (c) methods (e.g., machine learning or deep learning AI methods) that describe the relations between vis-NIR-SWIR and soil carbon; and (d) environmental domain space of attributes that control soil carbon dynamics.
Other soil spectral studies, such as [75,76], showed that spiking libraries improved the performance of soil prediction models. These spiking studies suggest that building larger spectral libraries (continental and world libraries) achieves better results to model soil properties than regional and local libraries. However, [76,77] pointed out that local model calibrations customized and optimally fitted to field/farm/local soilscapes are the best to model soil properties, even with small datasets with as few as 25 samples. Whether local or global soil spectral models perform better may be more a question of homogenization of data to reduce the variability in soil, spectral, and/or associated soil-environmental characteristics. A study [60] found for soils in southern Brazil that the stratification of a large spectral library into more homogeneous sample groups by environmental criteria (physiographic regions and land-use/land-cover) improved the accuracy of SOC predictions compared to pedological (soil texture) and vis–NIR–SWIR spectral (spectral classes) criteria. Subsetting can be considered as an approach to localize and homogenize soil spectral sample populations, but it is not always successful and depends on the soil and environmental conditions [78]. In another study [79], they found that stratification by mineralogical uniform clusters improved predictive performance of clay content, irrespective of the geographic region, using a large tropical soil spectral set.
There are several factors that play a role in building world soil spectral libraries that have contradictory effects on modeling of soil properties. First, adding soil spectral data may introduce noise to the global library, specifically if the data quality is of poor quality due to incorrect measurement, or different protocols. Second, adding redundant soil spectral data that are already present in the world library is unlikely to boost model performance of soil properties. Indeed, studies demonstrated that more soil data in a spectral library does not necessarily mean better soil predictions. According to [80], there was relatively little significant increase in prediction capacity of soil attributes with the use of an entire data set compared to a smaller subset, which increased the R² from 0.63 to 0.72 for SOC and R² from 0.71 to 0.73 for clay, respectively. On the other hand, representing the actual soil variability exhaustively of every region of the globe—including cold regions, mountainous or wetland regions that are difficult access, or politically restricted regions—would ensure that data gaps are filled, and all soil types are included in a global dataset. Such efforts are underway, though have been hampered by investment in new soil sample campaigns and standardized analytics and spectral protocols to ensure high data quality.
The issue of legacy datasets that have dominated national and global soil libraries and the lack of a consistent global soil monitoring network are noteworthy; [81,82] stressed that although striking global soil maps have been generated, future soil mapping and modeling efforts will depend on data mining all existing soil data and an increase in soil monitoring efforts. A suggestion to use an internal soil sample (ISS) that is disseminated between all laboratories and align all measurements to this ISS was proposed and validated by [39]. Various users successfully adopted this method using different spectrometers [83] and measurement conditions [84]. This direction may minimize the variation between many new SSLs and help better use our system in the global domain as demonstrated by [85].
The GSSL of clay compared to the ExCSSL, agrees with [86], who presented a methodological framework for using vis–NIR–SWIR spectroscopy at local and global scales by spectral treatment and regression methods. In our study, MIR-based predictions of clay showed the highest R2 for ExCSSL, followed by GSSL and last BraSpecS. MIR data (and pooled MIR + vis-NIR-SWIR) compared to solely using vis-NIR-SWIR data have shown superior results to predict SOC and/or clay in numerous studies (e.g., [64,78,87,88]). Although MIR spectra have fingerprinting capabilities to trace fundamental spectral elemental bonds, vis-NIR-SWIR is limited to identifying overtones in spectra. However, the former is much more costly and laborious to use. This explains the rapid growth of national and continental vis-NIR-SWIR libraries, while large MIR libraries that cover the variability of soils around the globe are still limited.
Figure 13 shows an example of application. The Israel dataset was inserted in BraSpecS and reached an R2 of 0.88. When using the local model, the performance was still at 0.88 with a lower error. For SOC in Kenya, BraSpecS reached 0.44, and with the local model, 0.92. As both datasets were inserted in the GSSL, results varied; the Israel prediction became worse but it improved for Kenya. The examples indicate that BraSpecS can be used depending on the country and soil similarity. This may be the track for SSLs of the world, a user can seek SSL that provides the best result for its spectral data. For example, ‘if’ Israel did not have any SSL, which SSL would they choose to use: BraSpecS or a global one? As we suggest for the future, the user can test both and use the best one according to the user’s objective. We need to have global, continental, country, and local SSLs. To alleviate the problem of the current model of central data custodian, SSLs need to have a distributed model where users can contribute towards a global SSL but their data ownership and privacy are preserved [49]. In the future, distributed SSLs linked via a system such as a blockchain would ensure data ownership is respected, yet users can still access the global dataset.

5. Conclusions and Final Considerations

It was possible to construct a platform where its importance can cover resource-limited regions which may consider the opportunity to submit spectra and retrieve estimated soil data in an established online service, such as BraSpecS. End-users can already interact with infrared technology.
The BraSpecS system facilitates dynamic communication between worldwide users and delivers important soil information. The presented system can be applied for several purposes, including research, farming, soil analytical laboratories, industries, consulting companies, creation of startups, teaching, pedology research, digital soil mapping, precision agriculture, and more. The system is user-friendly and does not require the user to have competency and literacy in soil spectral modeling. Users simply insert the soil spectra into the system and receive soil estimates with statistical metrics information. The user also has the ability to find the owners of spectra, request data, get in contact, and build partnerships. The platform also allows users to view spectral patterns of soil classes, soil texture, SOC content, and many other soil properties. Finally, the user receives a report of the soil model results for spectra that were submitted to the web platform. Nevertheless, this system is not without drawbacks and limitations, which will be resolved once the system is in use and feedback is received from worldwide users.
In the case of clay and SOC quantification, vis–NIR–SWIR presented reasonable data (best for clay) and MIR reached the best in both cases. In terms of data model population, statistics increased as follows: Global Model—BraSpecS model—Local model.
The cascading future growth of GSSL holds much promise through the pooling of local and regional soil spectral data to represent the global soil variability. End-user and stakeholder engagement in the BraSpecS will be profoundly important to build a robust and sustainable global soil spectral library that serves the greater good of soils. Our approach of a community-driven GSSL in which people and stakeholders participate in collecting new soil samples and spectra that represent actual soil conditions will overcome some of the limitations of global SOC and clay maps/grids derived via digital soil mapping that were mainly produced from legacy soil data representing historic soil conditions. Monitoring soil change is profoundly important in an age of multi-hazard natural disasters (such as wildfires and flooding), global climate change, and interconnected soil, food, social, economic, and ecological dilemmas. The need for up-to-date SOC, clay, and other soil properties is imminent. BraSpecS has operationalized soil spectroscopy to address these urgent needs for accurate and current soil information as well as assessment of soil change around the globe.

6. Future Works

The quality of model performances is influenced by multiple factors including: (a) quality and consistency of spectral data (absence of an agreed protocol); (b) quality and consistency of soil wet laboratory analysis (method and accuracy); and (c) soil forming factors, mineralogy, biome, and other environmental factors that influence soil genesis. These should be addressed in future studies to achieve the best results to assess soils. We would like to stress that community-driven global soil spectral libraries allow the contributors to construct clay, SOC, and other soil property models of various kinds. This work paves the way to investigate spectra modeling using spectra similarities from a global or regional SSL. Similarities of soil and environmental factors between regions matter when transferring spectral models overseas is certainly the best approach, as indicated in our work.
An important direction for the future should be a filter inside the system, which would achieve the best spectra to create the model (i.e., spectral fitting). Thus, for each spectrum (and for each soil attribute), the user could have a different model, increasing the use worldwide. Looking at the same ideas, the system of soil classification (which is also presented here) could be improved with photo and soil description, to assist pedologists and soil survey. Along these insights, the system could also allow pre and post-processing which would gather other end-users in a larger community such as researchers, consultants, and industries.
Web sites
(1)
The Brazilian Soil spectral Service (BraSpecS): besbbr.com.br or http://143.107.213.227/layout/_en/apresenta_temp.php. (Accessed on 2 February 2022)
(2)
The Brazilian Soil Spectral Library (BSSL): https://bibliotecaespectral.wixsite.com/english or http://143.107.213.227/layout/. (Accessed on 2 February 2022)
(3)
The Group that developed, Geotehnologies on Soil Science Group (GeoCis): https://esalqgeocis.wixsite.com/english. (Accessed on 2 February 2022)
(4)
Corresponding author profile: https://jamdemat.wixsite.com/dematte (Accessed on 2 February 2022)

Supplementary Materials

The following supporting information can be downloaded at: https://www.mdpi.com/article/10.3390/rs14030740/s1, Table S1: Number of samples and contact of researchers of other countries (The open access databases mentioned: Lucas and ICRAF are available in http://esdac.jrc.ec.europa.eu/content/lucas-2009-topsoil-data (accessed on 21 February 2022) and https://doi.org/10.34725/DVN/MFHA9C (accessed on 21 February 2022), respectively.).

Author Contributions

Conceptualization, J.A.M.D.; methodology, A.F.d.S.P.; software, A.F.d.S.P.; writing—original draft preparation, J.A.M.D., A.F.d.S.P., R.R.P., N.A.R., L.F.C.R.; writing—review and editing, J.A.M.D., A.F.d.S.P., R.R.P., N.A.R., L.F.C.R., F.A.d.O.M., B.M., S.G., Y.G., E.B.D., A.G., C.G., S.C., N.F., S.A., D.F., J.K.M.B., C.W., A.B., S.N., N.A.H., H.B., J.M.M.-B., N.E.Q.S.; visualization, R.R.P.; supervision, J.A.M.D.; project administration, J.A.M.D.; funding acquisition, J.A.M.D. All authors have read and agreed to the published version of the manuscript.

Funding

This research was funded by São Paulo Research Foundation (FAPESP) (grant numbers 2014/22262-0, 2016/26176-6, and 2020/04306-0).

Institutional Review Board Statement

Not applicable.

Informed Consent Statement

Not applicable.

Data Availability Statement

Not applicable.

Acknowledgments

We are grateful to the Geotechnologies in Soil Science Group (GeoCiS/ESALQ-USP; http://esalqgeocis.wixsite.com/english accessed on 30 January 2022) for team support. We are grateful to Sérgio Ricardo Scagnolato, Luciano Brandine de Negreiros and Fábio Chaddad for the site technical support. We specially knowledge all participants that delivered spectra and dataset to make this work possible, in special the ones that can be found in the Brazilian Soil Spectral Library (https://bibliotecaespectral.wixsite.com/english/lista-de-cedentes accessed on 30 January 2022; [16]) and the overseas ones whose countries are indicated in the tables and in the site (https://gossats.wixsite.com/home accessed on 30 January 2022). This work was supported by the São Paulo Research Foundation (FAPESP) (grant numbers 2014/22262-0 2016/26176-6, and 2020/04306-0).

Conflicts of Interest

The authors declare no conflict of interest.

References

  1. Lal, R.; Bouma, J.; Brevik, E.; Dawson, L.; Field, D.J.; Glaser, B.; Hatano, R.; Hartemink, A.E.; Kosaki, T.; Lascelles, B.; et al. Soils and sustainable development goals of the United Nations: An international union of soil sciences perspective. Geoderma Reg. 2021, 25, e00398. [Google Scholar] [CrossRef]
  2. Rossel, R.A.V.; McBratney, A.B. Soil chemical analytical accuracy and costs: Implications from precision agriculture. Aust. J. Exp. Agric. 1998, 38, 765. [Google Scholar] [CrossRef]
  3. Demattê, J.A.M.; Dotto, A.C.; Bedin, L.G.; Sayão, V.M.; Souza, A.B. E Soil analytical quality control by traditional and spectroscopy techniques: Constructing the future of a hybrid laboratory for low environmental impact. Geoderma 2019, 337, 111–121. [Google Scholar] [CrossRef]
  4. Viscarra Rossel, R.A.; Cattle, S.R.; Ortega, A.; Fouad, Y. In situ measurements of soil colour, mineral composition and clay content by vis—NIR spectroscopy. Geoderma 2009, 150, 253–266. [Google Scholar] [CrossRef]
  5. Ben-Dor, E.; Chabrillat, S.; Demattê, J.A.M.; Taylor, G.R.; Hill, J.; Whiting, M.L.; Sommer, S. Using imaging spectroscopy to study soil properties. Remote Sens. Environ. 2009, 113, S38–S55. [Google Scholar] [CrossRef]
  6. Soriano-Disla, J.M.; Janik, L.J.; Viscarra Rossel, R.A.; MacDonald, L.M.; McLaughlin, M.J. The performance of visible, near and mid-infrared reflectance spectroscopy for prediction of soil physical, chemical, and biological properties. Appl. Spectrosc. Rev. 2014, 49, 139–186. [Google Scholar] [CrossRef]
  7. Nocita, M.; Stevens, A.; van Wesemael, B.; Aitkenhead, M.; Bachmann, M.; Barthès, B.; Ben Dor, E.; Brown, D.J.; Clairotte, M.; Csorba, A.; et al. Soil spectroscopy: An alternative to wet chemistry for soil monitoring. In Advances in Agronomy; Elsevier: Amsterdam, The Netherlands, 2015; pp. 139–159. [Google Scholar]
  8. Stoner, E.R.; Baumgardner, M.F. Characteristic variations in reflectance of surface soils. Soil Sci. Soc. Am. J. 1981, 45, 1161–1165. [Google Scholar] [CrossRef]
  9. Brown, D.J.; Shepherd, K.D.; Walsh, M.G.; Dewayne Mays, M.; Reinsch, T.G. Global soil characterization with VNIR diffuse reflectance spectroscopy. Geoderma 2006, 132, 273–290. [Google Scholar] [CrossRef]
  10. Viscarra Rossel, R.A.; Behrens, T.; Ben-Dor, E.; Brown, D.J.; Demattê, J.A.M.; Shepherd, K.D.; Shi, Z.; Stenberg, B.; Stevens, A.; Adamchuk, V.; et al. A global spectral library to characterize the world’s soil. Earth Sci. Rev. 2016, 155, 198–230. [Google Scholar] [CrossRef]
  11. Bellinaso, H.; Demattê, J.A.M.; Romeiro, S.A. Soil spectral library and its use in soil classification. Rev. Bras. Ciência Solo 2010, 34, 861–870. [Google Scholar] [CrossRef]
  12. Demattê, J.A.M.; Dotto, A.C.; Paiva, A.F.; Sato, M.V.; Dalmolin, R.S.; Maria do Socorro, B.; da Silva, E.B.; Nanni, M.R.; ten Caten, A.; Noronha, N.C.; et al. The Brazilian Soil Spectral Library (BSSL): A general view, application and challenges. Geoderma 2019, 354, 113793. [Google Scholar] [CrossRef]
  13. Brodský, L.; Klement, A.; Penížek, V.; Kodešová, R.; Borůvka, L. Building soil spectral library of the Czech soils for quantitative digital soil mapping. Soil Water Res. 2011, 6, 165–172. [Google Scholar] [CrossRef]
  14. Gogé, F.; Joffre, R.; Jolivet, C.; Ross, I.; Ranjard, L. Optimization criteria in sample selection step of local regression for quantitative analysis of large soil NIRS database. Chemom. Intell. Lab. Syst. 2012, 110, 168–176. [Google Scholar] [CrossRef]
  15. Knadel, M.; Deng, F.; Thomsen, A.; Greve, M. Development of a Danish national Vis-NIR soil spectral library for soil organic carbon determination. In Digital Soil Assessments and Beyond; CRC Press: Boca Raton, FL, USA, 2012; pp. 403–408. [Google Scholar]
  16. Cambule, A.H.; Rossiter, D.G.; Stoorvogel, J.J.; Smaling, E.M.A. Building a near infrared spectral library for soil organic carbon estimation in the Limpopo National Park, Mozambique. Geoderma 2012, 183, 41–48. [Google Scholar] [CrossRef]
  17. Bas, M.V.; Meléndez-Pastor, I.; Navarro-Pedreño, J.; Gómez, I.; Mataix-Solera, J.; Hernández, E. Saline soils spectral library as a tool for digital soil mapping. In Proceedings of the EGU General Assembly Conference Abstracts, Vienna, Austria, 7–12 April 2013. [Google Scholar]
  18. Viscarra Rossel, R.A. Fine-resolution multiscale mapping of clay minerals in Australian soils measured with near infrared spectra. J. Geophys. Res. 2011, 116, F04023. [Google Scholar] [CrossRef]
  19. Shi, Z.; Wang, Q.; Peng, J.; Ji, W.; Liu, H.; Li, X.; Viscarra Rossel, R.A. Development of a national VNIR soil-spectral library for soil classification and prediction of organic matter concentrations. Sci. China Earth Sci. 2014, 57, 1671–1680. [Google Scholar] [CrossRef]
  20. Ji, W.; Li, S.; Chen, S.; Shi, Z.; Viscarra Rossel, R.A.; Mouazen, A.M. Prediction of soil attributes using the Chinese soil spectral library and standardized spectra recorded at field conditions. Soil Tillage Res. 2016, 155, 492–500. [Google Scholar] [CrossRef]
  21. Liu, S.; Shen, H.; Chen, S.; Zhao, X.; Biswas, A.; Jia, X.; Shi, Z.; Fang, J. Estimating forest soil organic carbon content using vis-NIR spectroscopy: Implications for large-scale soil carbon spectroscopic assessment. Geoderma 2019, 348, 37–44. [Google Scholar] [CrossRef]
  22. Condit, H.R. The spectral reflectance of American soils. Photogramm. Eng. 1970, 36, 955–966. [Google Scholar]
  23. Wijewardane, N.K.; Ge, Y.; Wills, S.; Loecke, T. Prediction of soil carbon in the conterminous United States: Visible and near infrared reflectance spectroscopy analysis of the rapid carbon assessment Project. Soil Sci. Soc. Am. J. 2016, 80, 973–982. [Google Scholar] [CrossRef]
  24. Wijewardane, N.K.; Ge, Y.; Wills, S.; Libohova, Z. Predicting physical and chemical properties of US Soils with a mid-infrared reflectance spectral library. Soil Sci. Soc. Am. J. 2018, 82, 722–731. [Google Scholar] [CrossRef]
  25. Baldock, J.A.; McNally, S.R.; Beare, M.H.; Curtin, D.; Hawke, B. Predicting soil carbon saturation deficit and related properties of New Zealand soils using infrared spectroscopy. Soil Res. 2019, 57, 835. [Google Scholar] [CrossRef]
  26. Hergarten, C.; Nazarmavloev, F.; Wolfgramm, B. Building a soil spectral library for Tajikistan comparing local and global modeling approaches. In Proceedings of the 3rd Global Workshop on Proximal Soil Sensing, Potsdam, Germany, 26–29 May 2013; pp. 265–269. [Google Scholar]
  27. Tuğrul, K.M. Soil management in sustainable agriculture. In Soil Management and Plant Nutrition for Sustainable Crop Production; Hasanuzzaman, M., Teixeira Filho, M.C.M., Nogueira, T.A., Eds.; IntechOpen: London, UK, 2019; pp. 111–126. [Google Scholar]
  28. Stenberg, B.; Viscarra Rossel, R.A.; Mouazen, A.M.; Wetterlind, J. Visible and near infrared spectroscopy in soil science. Adv. Agron. 2010, 107, 163–215. [Google Scholar]
  29. Dangal, S.; Sanderman, J.; Wills, S.; Ramirez-Lopez, L. Accurate and precise prediction of soil properties from a large mid-infrared spectral library. Soil Syst. 2019, 3, 11. [Google Scholar] [CrossRef]
  30. Baumann, P.; Helfenstein, A.; Gubler, A.; Keller, A.; Meuli, R.G.; Wächter, D.; Lee, J.; Viscarra Rossel, R.; Six, J. Developing the Swiss mid-infrared soil spectral library for local estimation and monitoring. SOIL 2021, 7, 525–546. [Google Scholar] [CrossRef]
  31. Ng, W.; Minasny, B.; Jeon, S.H.; McBratney, A. Mid-infrared spectroscopy for accurate measurement of an extensive set of soil properties for assessing soil functions. Soil Secur. 2022, 6, 100043. [Google Scholar] [CrossRef]
  32. World Agroforestry (ICRAF). International Soil Reference and Information Centre (ISRIC) ICRAF-ISRIC Soil VNIR Spectral Library. Available online: https://data.worldagroforestry.org/dataset.xhtml?persistentId=doi:10.34725/DVN/MFHA9C (accessed on 11 November 2021).
  33. Orgiazzi, A.; Ballabio, C.; Panagos, P.; Jones, A.; Fernández-Ugalde, O. LUCAS Soil, the largest expandable soil dataset for Europe: A review. Eur. J. Soil Sci. 2018, 69, 140–153. [Google Scholar] [CrossRef]
  34. Stevens, A.; Nocita, M.; Tóth, G.; Montanarella, L.; van Wesemael, B. Prediction of soil organic carbon at the european scale by visible and near infrared reflectance spectroscopy. PLoS ONE 2013, 8, e66409. [Google Scholar] [CrossRef]
  35. Vågen, T.-G.; Winowiecki, L.; Tondoh, J.E.; Desta, L.T.; Gumbricht, T. Mid-Infrared Spectra (MIRS) from ICRAF Soil and Plant Spectroscopy Laboratory: Africa Soil Information Service (AfSIS) Phase I 2009–2013. Available online: https://data.worldagroforestry.org/dataset.xhtml?persistentId=doi:10.34725/DVN/QXCWP1 (accessed on 25 January 2022).
  36. Tziolas, N.; Tsakiridis, N.; Ben-Dor, E.; Theocharis, J.; Zalidis, G. A memory-based learning approach utilizing combined spectral sources and geographical proximity for improved VIS-NIR-SWIR soil properties estimation. Geoderma 2019, 340, 11–24. [Google Scholar] [CrossRef]
  37. Woodwell Climate Research Center (OSSL). Open Soil Spectroscopy Library. Available online: https://www.woodwellclimate.org/open-soil-spectral-library/ (accessed on 10 December 2021).
  38. United States Department of Agriculture (USDA). Rapid Carbon Assessment (RaCA) Project. Available online: https://www.nrcs.usda.gov/wps/portal/nrcs/detail/soils/survey/?cid=nrcs142p2_054164 (accessed on 22 September 2021).
  39. Ben Dor, E.; Ong, C.; Lau, I.C. Reflectance measurements of soils in the laboratory: Standards and protocols. Geoderma 2015, 245, 112–124. [Google Scholar] [CrossRef]
  40. Bunting, P. Pre-processing of remotely sensed imagery. In The Roles of Remote Sensing in Nature Conservation; Diaz-Delgado, R., Lucas, R., Hurford, C., Eds.; Springer: Manhattan, NY, USA, 2017; pp. 39–63. [Google Scholar]
  41. Dotto, A.C.; Dalmolin, R.S.D.; Caten, A.T.; Gris, D.J.; Ruiz, L.F.C. AlradSpectra: A quantification tool for soil properties using spectroscopic data in R. Rev. Bras. Ciência Solo 2019, 43, e0180263. [Google Scholar] [CrossRef]
  42. Sang, K.; Piovan, S.; Fontana, G.L. A WebGIS for Visualizing historical activities based on photos: The project of Yunnan–Vietnam railway web map. Sustainability 2021, 13, 419. [Google Scholar] [CrossRef]
  43. R Development Core Team. The R Project for Statistical Computing. Available online: https://www.r-project.org (accessed on 6 June 2021).
  44. Apache Software Foundation Community-Led Development “The Apache Way”. Available online: https://www.apache.org/ (accessed on 23 July 2020).
  45. Abeysinghe, S. PHP Team Development; Packt Publishing: Birmingham, UK, 2009. [Google Scholar]
  46. Tasneem, S.; Ammar, R. Performance study of a distributed web server: An analytical approach. J. Softw. Eng. Appl. 2012, 05, 855–863. [Google Scholar] [CrossRef]
  47. Mitchell, L.J. PHP Web Services: APIs for the Modern Web; O’Reilly Media: Newton, MA, USA, 2016. [Google Scholar]
  48. Horner, J. RApache: Web Application Development with R and Apache. Available online: http://www.rapache.net/ (accessed on 25 June 2021).
  49. Padarian, J.; Minasny, B.; McBratney, A.B. Machine learning and soil sciences: A review aided by machine learning tools. SOIL 2020, 6, 35–52. [Google Scholar] [CrossRef]
  50. Manohar, H.M.; Appaiah, S. Stabilization of FIFO system and inventory management. Iternational Res. J. Eng. Technol. 2017, 4, 5631–5638. [Google Scholar]
  51. Walkley, A.; Black, I.A. An examination of the degtjareff method for determining soil organic matter, and a proposed modification of the chromic acid titration method. Soil Sci. 1934, 37, 29–38. [Google Scholar] [CrossRef]
  52. Van Raij, B.; Andrade, J.C.; Cantarella, H.; Quaggio, J.A. Análise Química para Avaliação da Fertilidade de Solos Tropicais; IAC: Campinas, Brazil, 2001; ISBN 9788585564056. [Google Scholar]
  53. Teixeira, P.C.; Donagema, G.K.; Fontana, A.; Teixeira, W.G. Manual de Métodos de Análise de Solo, 3rd ed.; EMBRAPA: Brasília, Brazil, 2017. [Google Scholar]
  54. Zhang, X.; Huang, B.; Ji, J.F.; Hu, W.Y.; Sun, W.X.; Zhao, Y.C. Quantitative prediction of soil salinity content with visible-near infrared hyper-spectra in Northeast China. Spectrosc. Spectr. Anal. 2012, 32, 2075–2079. [Google Scholar]
  55. Zhang, X.; Huang, B. Prediction of soil salinity with soil-reflected spectra: A comparison of two regression methods. Sci. Rep. 2019, 9, 5067. [Google Scholar] [CrossRef]
  56. Quinlan, J. Learning with continuous classes. In Proceedings of the AI’92, 5th Australian Conference on Artificial Intelligence, Hobart, Tasmania, 16–18 November 1992; Adams, A., Sterling, L., Eds.; World Scientific: Singapore, 1992; pp. 343–348. [Google Scholar]
  57. Khaledian, Y.; Miller, B.A. Selecting appropriate machine learning methods for digital soil mapping. Appl. Math. Model. 2020, 81, 401–418. [Google Scholar] [CrossRef]
  58. Xiong, X.; Grunwald, S.; Myers, D.B.; Kim, J.; Harris, W.G.; Comerford, N.B. Holistic environmental soil-landscape modeling of soil organic carbon. Environ. Model. Softw. 2014, 57, 202–215. [Google Scholar] [CrossRef]
  59. Moura-Bueno, J.M.; Dalmolin, R.S.D.; Horst-Heinen, T.Z.; Grunwald, S.; ten Caten, A. Environmental covariates improve the spectral predictions of organic carbon in subtropical soils in southern Brazil. Geoderma 2021, 393, 114981. [Google Scholar] [CrossRef]
  60. Angelopoulou, T.; Balafoutis, A.; Zalidis, G.; Bochtis, D. From laboratory to proximal sensing spectroscopy for soil organic carbon estimation—A Review. Sustainability 2020, 12, 443. [Google Scholar] [CrossRef]
  61. Kuhn, M. Caret: Classification and Regression Training. R Package Version 6.0-90. 2010. Available online: https://CRAN.R-project.org/package=caret (accessed on 20 March 2020).
  62. Tsakiridis, N.L.; Keramaris, K.D.; Theocharis, J.B.; Zalidis, G.C. Simultaneous prediction of soil properties from VNIR-SWIR spectra using a localized multi-channel 1-D convolutional neural network. Geoderma 2020, 367, 114208. [Google Scholar] [CrossRef]
  63. Yang, J.; Wang, X.; Wang, R.; Wang, H. Combination of convolutional neural networks and recurrent neural networks for predicting soil properties using Vis—NIR spectroscopy. Geoderma 2020, 380, 114616. [Google Scholar] [CrossRef]
  64. Ng, W.; Minasny, B.; Montazerolghaem, M.; Padarian, J.; Ferguson, R.; Bailey, S.; McBratney, A.B. Convolutional neural network for simultaneous prediction of several soil properties using visible/near-infrared, mid-infrared, and their combined spectra. Geoderma 2019, 352, 251–267. [Google Scholar] [CrossRef]
  65. Sequeira, C.H.; Wills, S.A.; Grunwald, S.; Ferguson, R.R.; Benham, E.C.; West, L.T. Development and update process of VNIR-based models built to predict soil organic carbon. Soil Sci. Soc. Am. J. 2014, 78, 903–913. [Google Scholar] [CrossRef]
  66. Summerauer, L.; Baumann, P.; Ramirez-Lopez, L.; Barthel, M.; Bauters, M.; Bukombe, B.; Reichenbach, M.; Boeckx, P.; Kearsley, E.; Van Oost, K.; et al. The central African soil spectral library: A new soil infrared repository and a geographical prediction analysis. SOIL 2021, 7, 693–715. [Google Scholar] [CrossRef]
  67. Moura-Bueno, J.M.; Dalmolin, R.S.D.; Horst-Heinen, T.Z.; ten Caten, A.; Vasques, G.M.; Dotto, A.C.; Grunwald, S. When does stratification of a subtropical soil spectral library improve predictions of soil organic carbon content? Sci. Total Environ. 2020, 737, 139895. [Google Scholar] [CrossRef]
  68. Terra, F.S.; Demattê, J.A.M.; Viscarra Rossel, R.A. Spectral libraries for quantitative analyses of tropical Brazilian soils: Comparing vis–NIR and mid-IR reflectance data. Geoderma 2015, 255–256, 81–93. [Google Scholar] [CrossRef]
  69. Clairotte, M.; Grinand, C.; Kouakoua, E.; Thébault, A.; Saby, N.P.A.; Bernoux, M.; Barthès, B.G. National calibration of soil organic carbon concentration using diffuse infrared reflectance spectroscopy. Geoderma 2016, 276, 41–52. [Google Scholar] [CrossRef]
  70. Dotto, A.C.; Dalmolin, R.S.D.; ten Caten, A.; Grunwald, S. A systematic study on the application of scatter-corrective and spectral-derivative preprocessing for multivariate prediction of soil organic carbon by Vis-NIR spectra. Geoderma 2018, 314, 262–274. [Google Scholar] [CrossRef]
  71. Ramirez-Lopez, L.; Wadoux, A.M.J.-C.; Franceschini, M.H.D.; Terra, F.S.; Marques, K.P.P.; Sayão, V.M.; Demattê, J.A.M. Robust soil mapping at the farm scale with vis–NIR spectroscopy. Eur. J. Soil Sci. 2019, 70, 378–393. [Google Scholar] [CrossRef]
  72. Rizzo, R.; Medeiros, L.G.; Mello, D.C.; de Marques, K.P.P.; de Souza Mendes, W.; Quiñonez Silvero, N.E.; Dotto, A.C.; Bonfatti, B.R.; Demattê, J.A.M. Multi-temporal bare surface image associated with transfer functions to support soil classification and mapping in southeastern Brazil. Geoderma 2020, 361, 114018. [Google Scholar] [CrossRef]
  73. Brown, D.J. Using a global VNIR soil-spectral library for local soil characterization and landscape modeling in a 2nd-order Uganda watershed. Geoderma 2007, 140, 444–453. [Google Scholar] [CrossRef]
  74. Grunwald, S.; Yu, C.; Xiong, X. Transferability and scalability of soil total carbon prediction models in Florida, USA. Pedosphere 2018, 28, 856–872. [Google Scholar] [CrossRef]
  75. Sankey, J.B.; Brown, D.J.; Bernard, M.L.; Lawrence, R.L. Comparing local vs. global visible and near-infrared (VisNIR) diffuse reflectance spectroscopy (DRS) calibrations for the prediction of soil clay, organic C and inorganic C. Geoderma 2008, 148, 149–158. [Google Scholar] [CrossRef]
  76. Wetterlind, J.; Stenberg, B. Near-infrared spectroscopy for within-field soil characterization: Small local calibrations compared with national libraries spiked with local samples. Eur. J. Soil Sci. 2010, 61, 823–843. [Google Scholar] [CrossRef]
  77. Ng, W.; Minasny, B.; Jones, E.; McBratney, A. To spike or to localize? Strategies to improve the prediction of local soil properties using regional spectral library. Geoderma 2022, 406, 115501. [Google Scholar] [CrossRef]
  78. McDowell, M.L.; Bruland, G.L.; Deenik, J.L.; Grunwald, S.; Knox, N.M. Soil total carbon analysis in Hawaiian soils with visible, near-infrared and mid-infrared diffuse reflectance spectroscopy. Geoderma 2012, 189, 312–320. [Google Scholar] [CrossRef]
  79. Araújo, S.R.; Wetterlind, J.; Demattê, J.A.M.; Stenberg, B. Improving the prediction performance of a large tropical vis-NIR spectroscopic soil library from Brazil by clustering into smaller subsets or use of data mining calibration techniques. Eur. J. Soil Sci. 2014, 65, 718–729. [Google Scholar] [CrossRef]
  80. Debaene, G.; Niedźwiecki, J.; Pecio, A.; Żurek, A. Effect of the number of calibration samples on the prediction of several soil properties at the farm-scale. Geoderma 2014, 214–215, 114–125. [Google Scholar] [CrossRef]
  81. Grunwald, S.; Thompson, J.A.; Boettinger, J.L. Digital soil mapping and modeling at continental scales: Finding solutions for global issues. Soil Sci. Soc. Am. J. 2011, 75, 1201–1213. [Google Scholar] [CrossRef]
  82. McBratney, A.; de Gruijter, J.; Bryce, A. Pedometrics timeline. Geoderma 2019, 338, 568–575. [Google Scholar] [CrossRef]
  83. Kopačková, V.; Ben-Dor, E. Normalizing reflectance from different spectrometers and protocols with an internal soil standard. Int. J. Remote Sens. 2016, 37, 1276–1290. [Google Scholar] [CrossRef]
  84. Chabrillat, S.; Gholizadeh, A.; Neumann, C.; Berger, D.; Milewski, R.; Ogen, Y.; Ben-Dor, E. Preparing a soil spectral library using the internal soil standard (ISS) method: Influence of extreme different humidity laboratory conditions. Geoderma 2019, 355, 113855. [Google Scholar] [CrossRef]
  85. Gholizadeh, A.; Carmon, N.; Klement, A.; Ben-Dor, E.; Borůvka, L. Agricultural soil spectral response and properties assessment: Effects of measurement protocol and data mining technique. Remote Sens. 2017, 9, 1078. [Google Scholar] [CrossRef]
  86. Genot, V.; Colinet, G.; Bock, L.; Vanvyve, D.; Reusen, Y. Near infrared reflectance spectroscopy for estimating soil characteristics valuable in the diagnosis of soil fertility. J. Near Infrared Spectrosc. 2011, 19, 117–138. [Google Scholar] [CrossRef]
  87. Knox, N.M.; Grunwald, S.; McDowell, M.L.; Bruland, G.L.; Myers, D.B.; Harris, W.G. Modelling soil carbon fractions with visible near-infrared (VNIR) and mid-infrared (MIR) spectroscopy. Geoderma 2015, 239, 229–239. [Google Scholar] [CrossRef]
  88. Riedel, F.; Denk, M.; Müller, I.; Barth, N.; Gläßer, C. Prediction of soil parameters using the spectral range between 350 and 15,000 nm: A case study based on the permanent soil monitoring program in saxony, Germany. Geoderma 2018, 315, 188–198. [Google Scholar] [CrossRef]
Figure 1. Flowchart of the directions inside the system: (a) Cover page, Entry directions, System functional architecture, Group, Server center, dataset, (BSSL, Demattê et al., 2018); (b) Dynamics of the system; (c) Evaluation–Validation procedure.
Remotesensing 14 00740 g001
Figure 2. World participants. Exploiting different populations and models to quantify soil properties, (a) spectra from 65 countries were tested into the BraSpecS model, (b) the Local model, (c) the Global Soil Spectral Model.
Remotesensing 14 00740 g002
Figure 3. BraSpecS Services description: (a) find researchers that have data; (b) observe patterns of spectra per soil attribute and per soil classification, filtering per state, per researcher, per soil type and others; (c) Insert your spectra, choose the desired soil analysis (Granulometric, chemistry and mineralogical) and receive the report by email with statistics.
Remotesensing 14 00740 g003
Figure 4. Boxplots of observed and predicted (a) clay and (b) SOC using different spectral libraries’ vis–NIR–SWIR range.
Remotesensing 14 00740 g004
Figure 5. R2 for clay models per country using vis–NIR-—range.
Remotesensing 14 00740 g005
Figure 6. R2 for SOC models per country using vis–NIR–SWIR range.
Remotesensing 14 00740 g006
Figure 7. RMSE for clay models per country using vis–NIR–SWIR range.
Remotesensing 14 00740 g007
Figure 8. RMSE for SOC models per country using vis–NIR–SWIR range.
Remotesensing 14 00740 g008
Figure 9. RPIQ for clay models per country using vis–NIR–SWIR data.
Remotesensing 14 00740 g009
Figure 10. RPIQ for SOC models per country using vis–NIR–SWIR data.
Remotesensing 14 00740 g010
Figure 11. Boxplots of (a) clay and (b) SOC using MIR dataset per country.
Remotesensing 14 00740 g011
Figure 12. R2 for (a) clay and (b) soil organic carbon (SOC) models, RMSE (c) clay and (d) soil organic carbon (SOC) models and RPIQ (e) clay and (f) soil organic carbon (SOC) models per country using MIR data.
Remotesensing 14 00740 g012
Figure 13. Israel scatter plots for Clay: (a) Observed × Predicted by the BraSpecS model, (b) Observed × Predicted ExCSSL, and (c) Observed × Predicted GSSL. Kenya scatter plots for SOC: (d) Observed × Predicted by the BraSpecS model, (e) Observed × Predicted ExCSSL, and (f) Observed × Predicted GSSL.
Remotesensing 14 00740 g013
Table 1. Number of countries with R2 for clay model using vis–NIR–SWIR data.
ModelR2TotalAfricaAsiaEuropeNorth AmericaOceaniaSouth America
ExCSSL Clay0–0.31001000
0.3–0.53003000
0.5–0.78312101
0.7–0.811124112
>0.84011913313
BraSpecS Clay0–0.314336101
0.3–0.525658222
0.5–0.712415002
0.7–0.89114201
>0.83210000
GSSL Clay0–0.33111000
0.3–0.56213000
0.5–0.718348102
0.7–0.818534312
>0.818437112
Table 2. Number of countries with R2 for Soil Organic Carbon (SOC) models using vis–NIR–SWIR data.
ModelR2TotalAfricaAsiaEuropeNorth AmericaOceaniaSouth America
ExCSSL SOC0–0.33003000
0.3–0.59009000
0.5–0.7170211103
0.7–0.89410400
>0.819771211
BraSpecS SOC0–0.3383522314
0.3–0.511521102
0.5–0.76221100
0.7–0.81001000
>0.81010000
GSSL SOC0–0.317454112
0.3–0.514216203
0.5–0.7223313201
0.7–0.82101000
>0.82110000
Publisher’s Note: MDPI stays neutral with regard to jurisdictional claims in published maps and institutional affiliations.

