
Predicting Dynamics of the Potential Breeding Habitat of Larus saundersi by MaxEnt Model under Changing Land-Use Conditions in Wetland Nature Reserve of Liaohe Estuary, China


Abstract
:1. Introduction
2. Methods
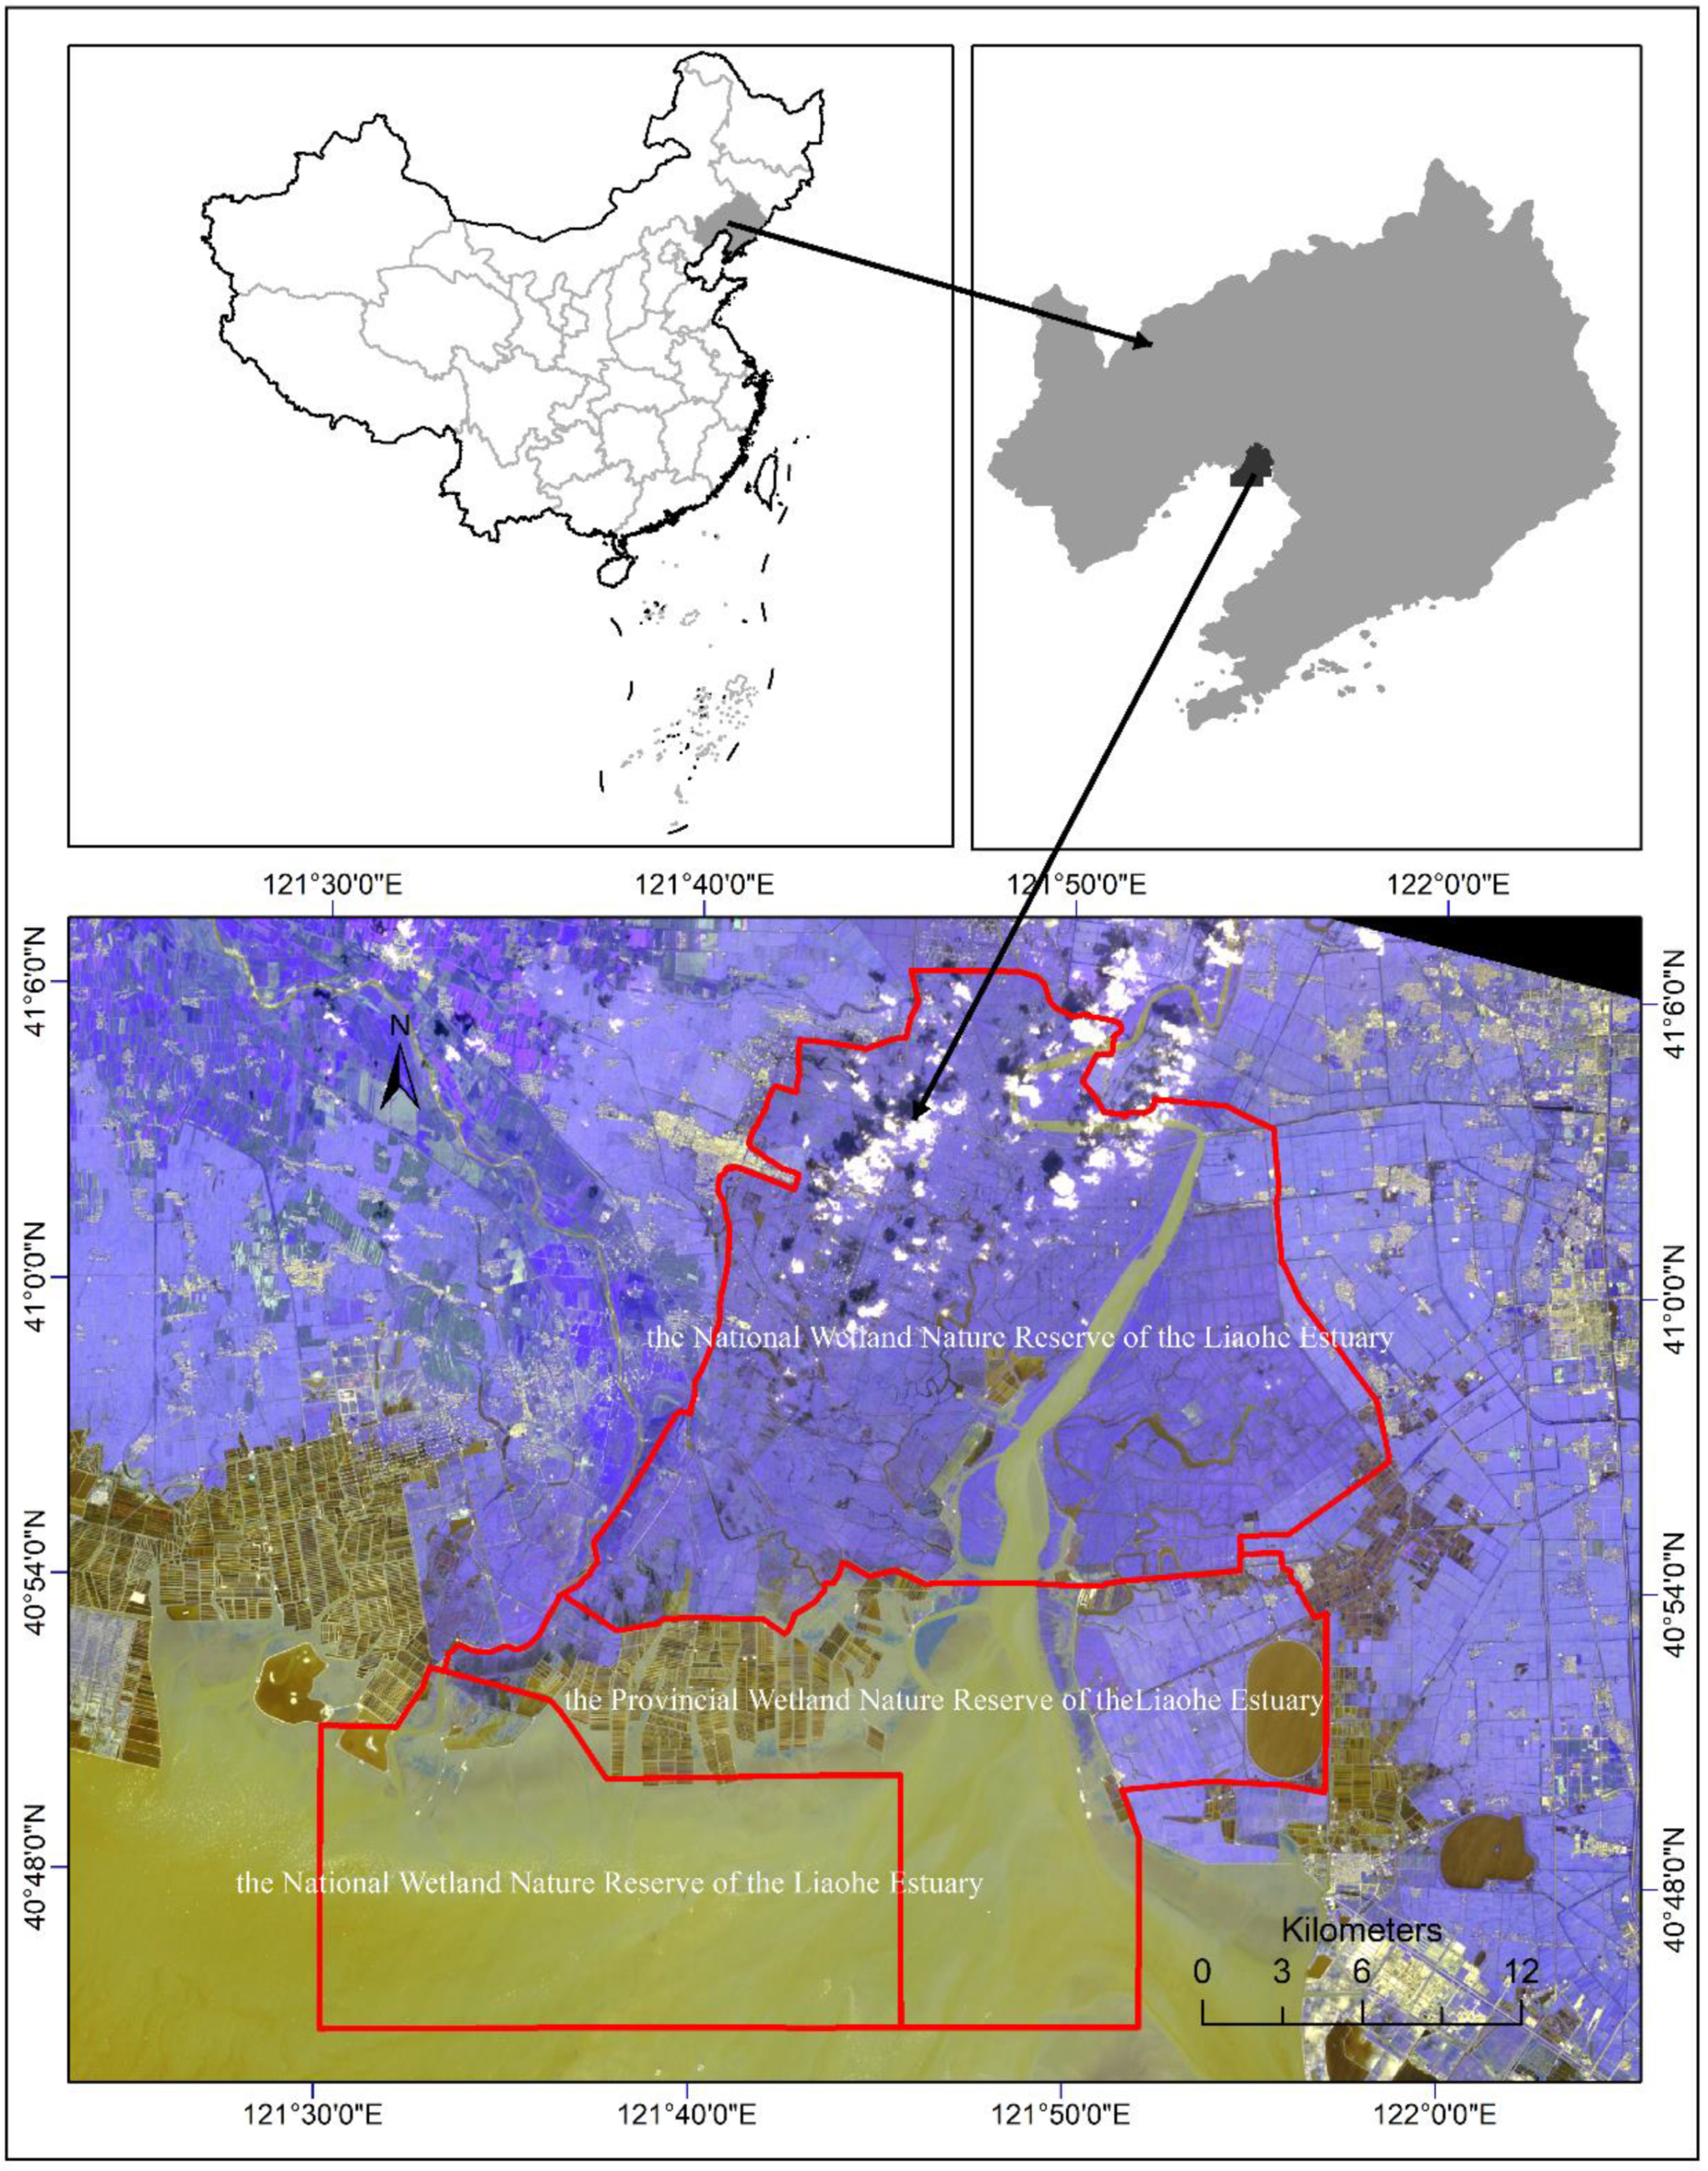
2.1. Study Area
2.2. Larus Saundersi Occurrence Dataset
2.3. Environmental Variable Selection and Processing
2.4. MaxEnt Model Parameter Settings
2.5. Evaluation of Model Performance
2.6. Redundancy Analysis
3. Results
3.1. Land-Use Change
3.2. Evaluation of MaxEnt Model Performance
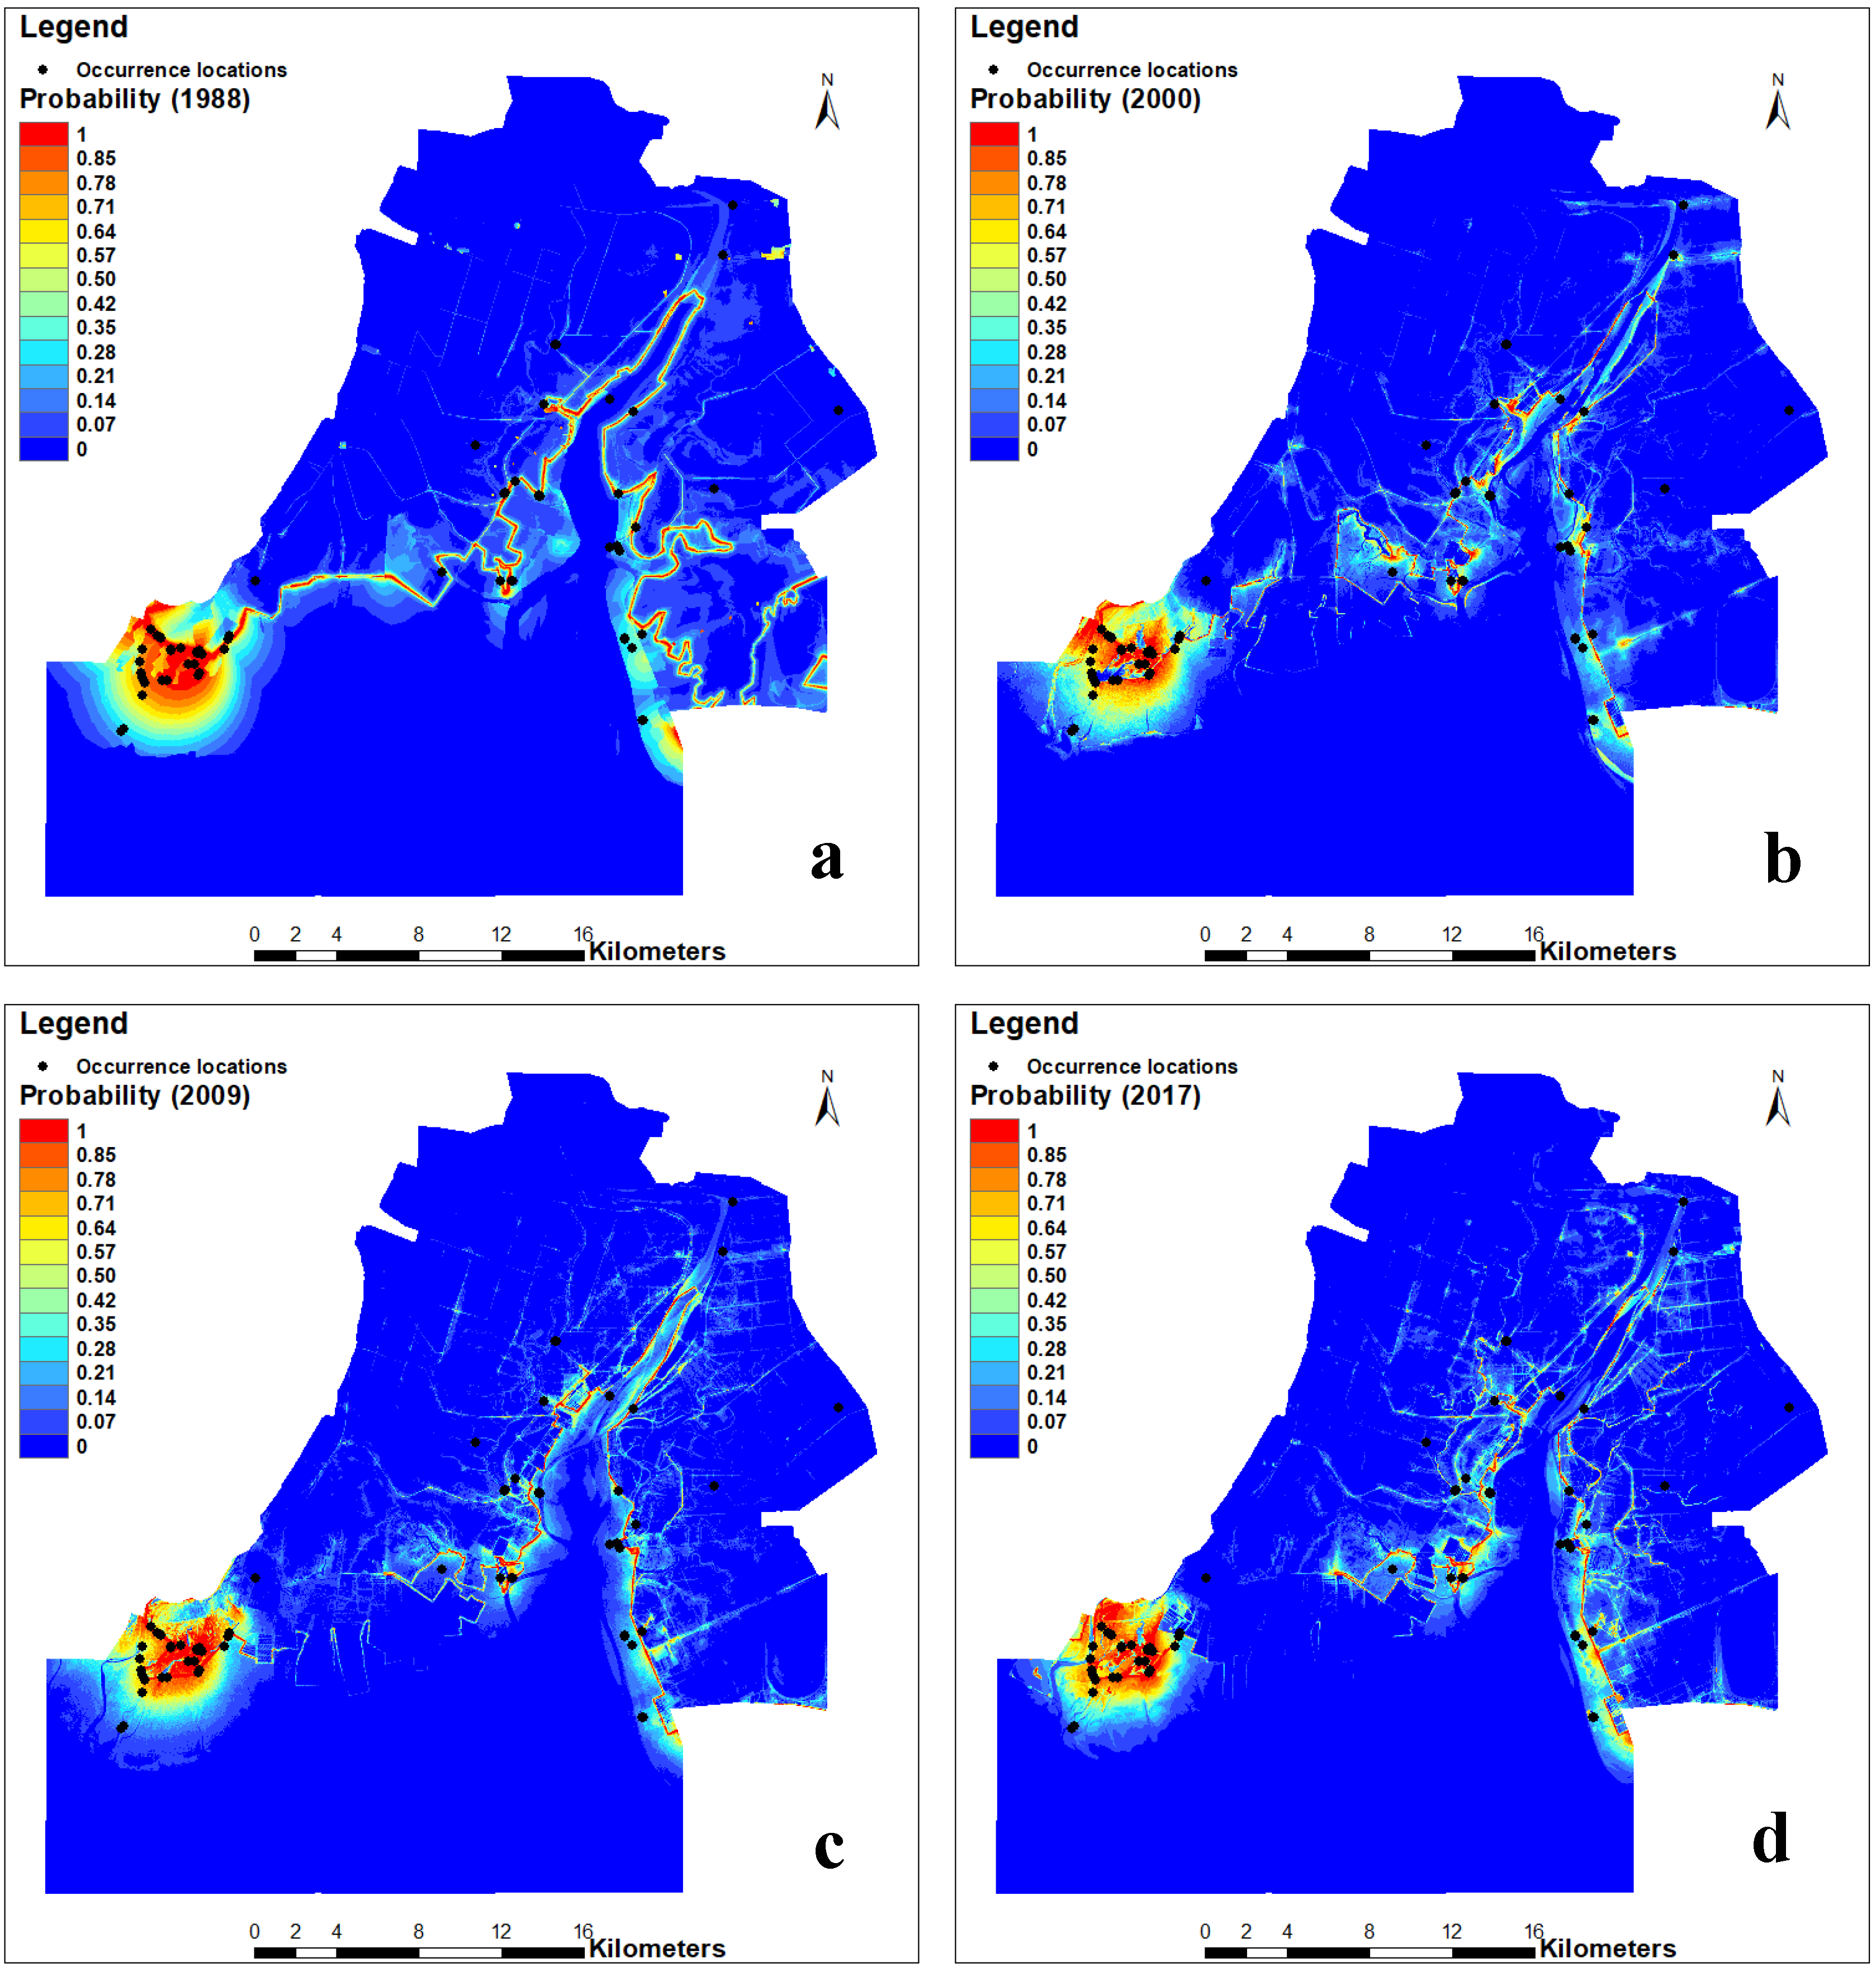
3.3. Changes in the Habitat Suitability of Larus saundersi
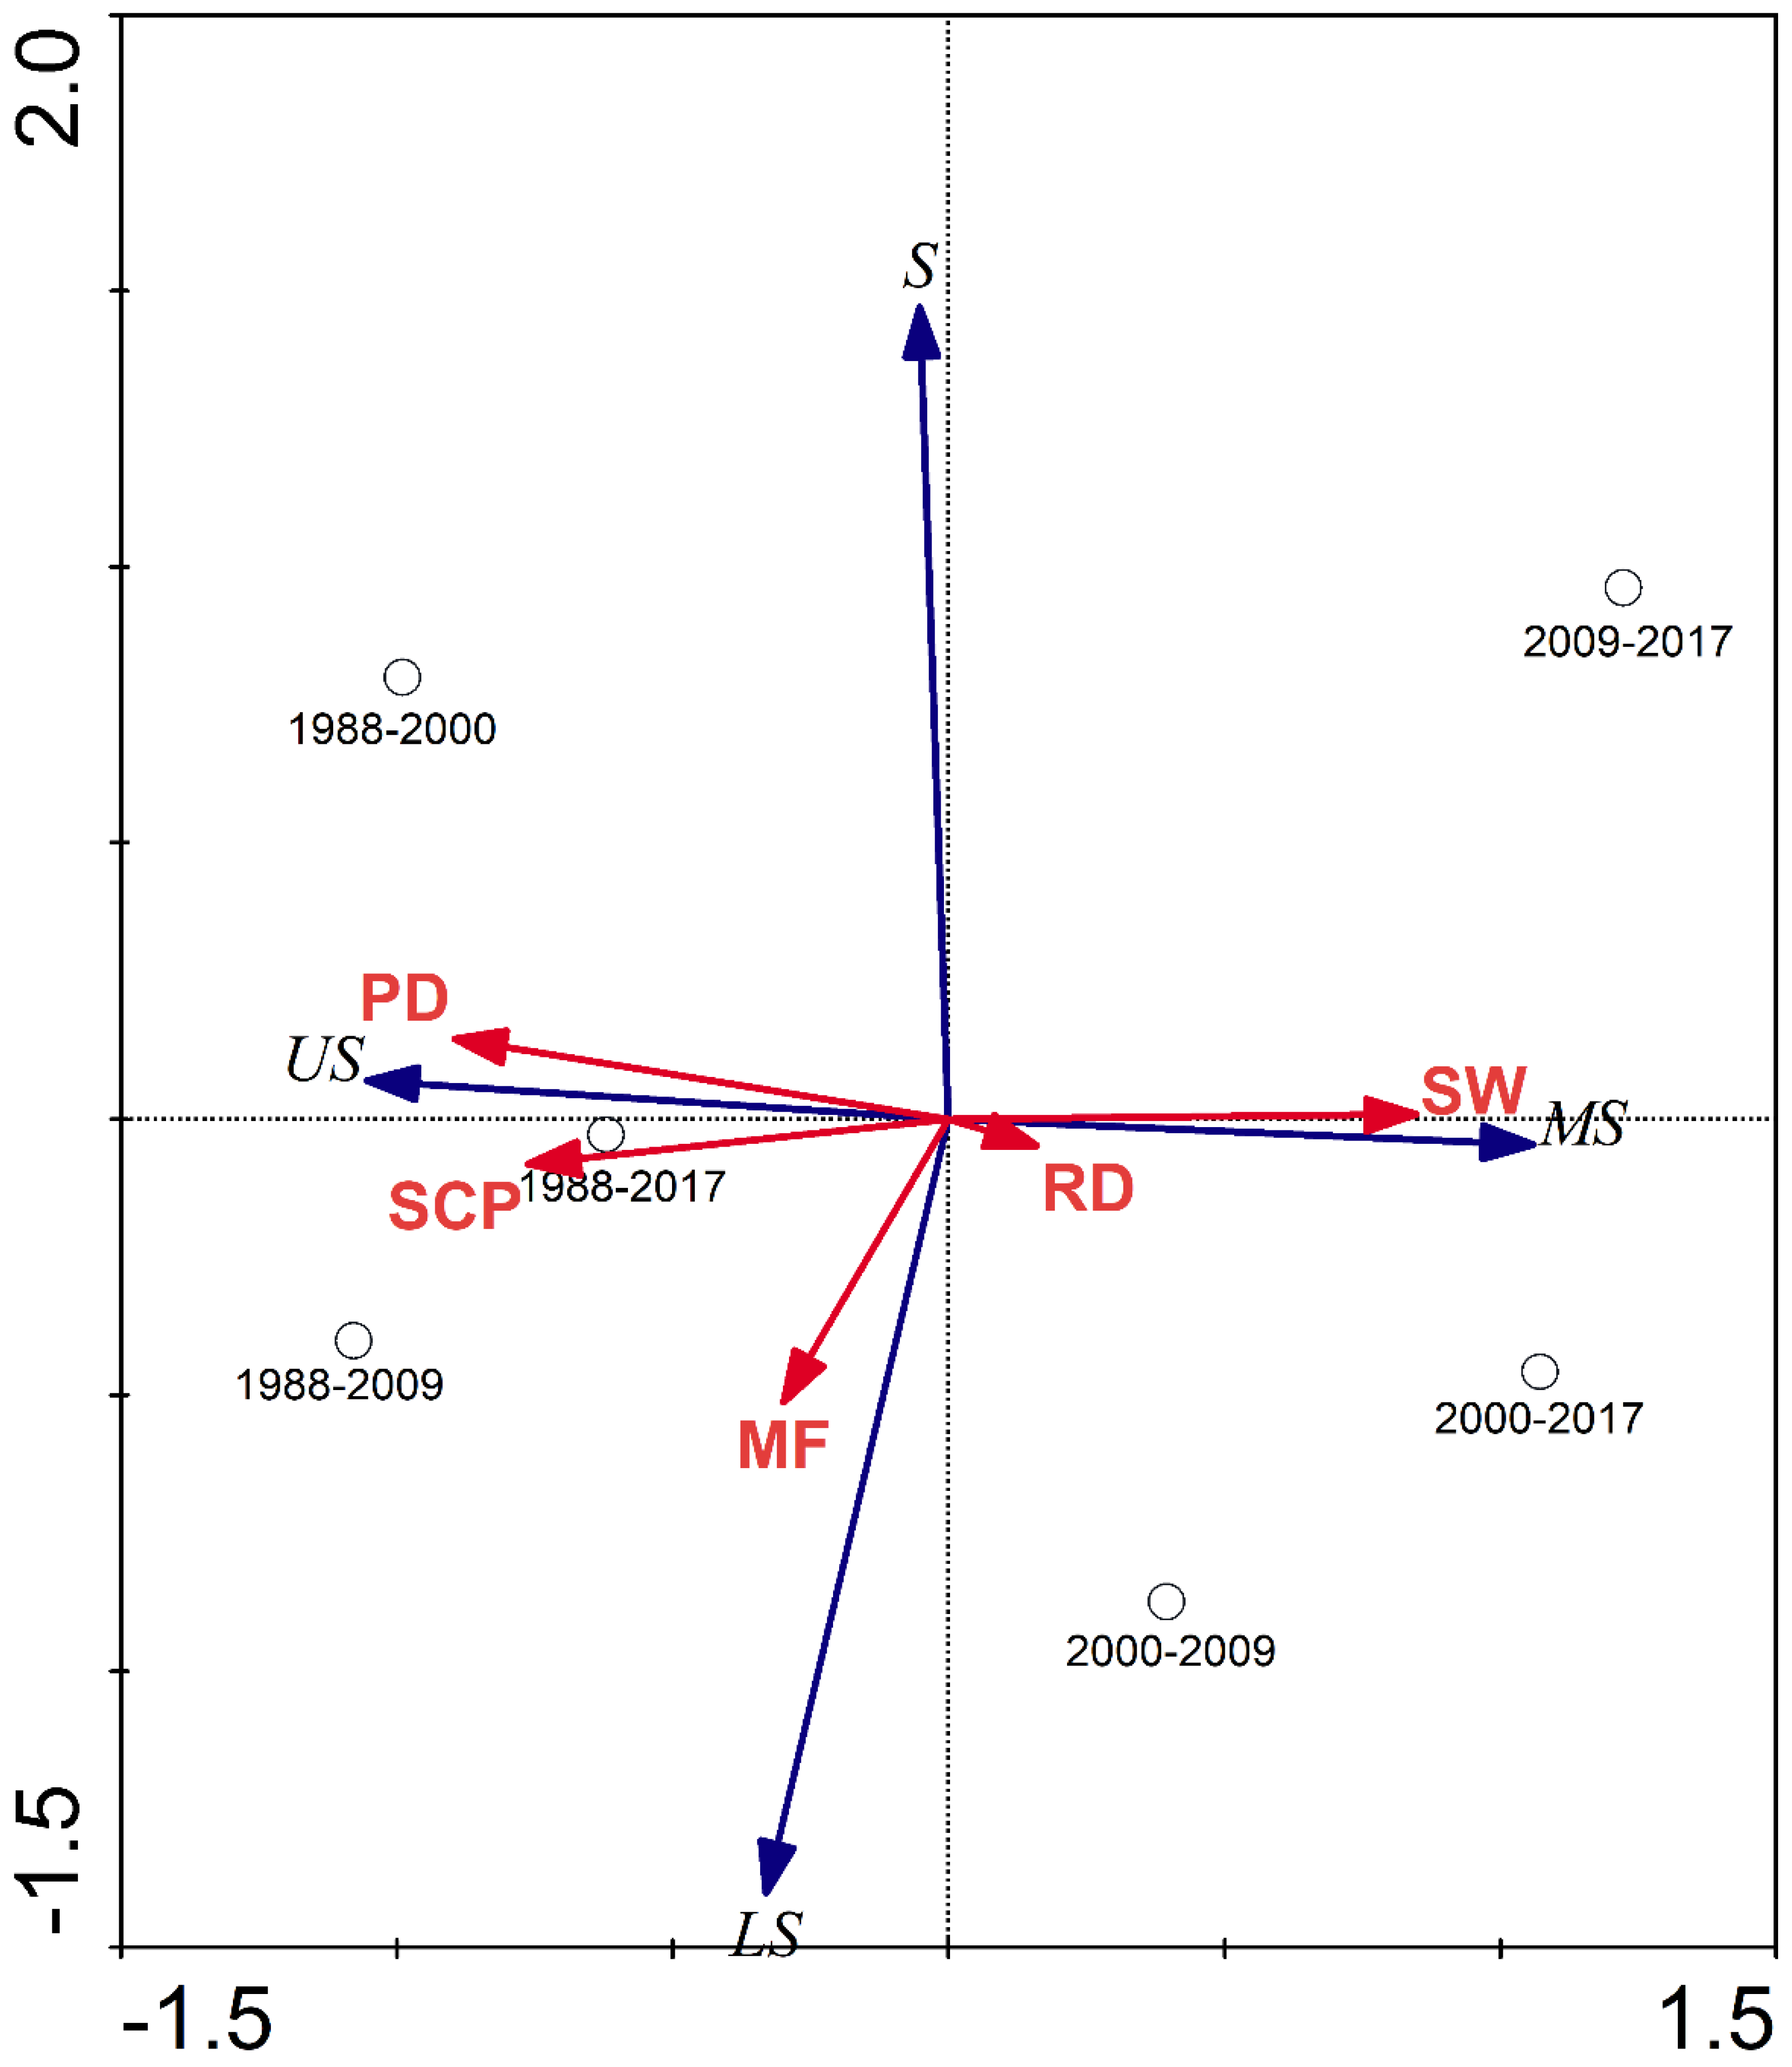
3.4. Factors Influencing the Habitat Suitability of Larus saundersi
3.5. The Impact of Land-Use Change on the Habitat Suitability of Larus saundersi
4. Discussion
4.1. Factors Influencing the Habitat Suitability of Larus saundersi
4.2. Land-Use Change and Habitat Suitability Dynamics of Larus saundersi
4.3. Implications for Effective Conservation of Larus saundersi
5. Limitations
6. Conclusions
Supplementary Materials
Author Contributions
Funding
Data Availability Statement
Acknowledgments
Conflicts of Interest
References
- Xiao, D.; Deng, L.; Kim, D.-G.; Huang, C.; Tian, K. Carbon budgets of wetland ecosystems in China. Glob. Chang. Biol. 2019, 25, 2061–2076. [Google Scholar] [CrossRef] [PubMed]
- Sutton-Grier, A.; Howard, J. Coastal wetlands are the best marine carbon sink for climate mitigation. Front. Ecol. Environ. 2018, 16, 73–74. [Google Scholar] [CrossRef]
- Hopkinson, C.S.; Cai, W.-J.; Hu, X. Carbon sequestration in wetland dominated coastal systems—A global sink of rapidly diminishing magnitude. Curr. Opin. Environ. Sustain. 2012, 4, 186–194. [Google Scholar] [CrossRef]
- Xiu, L.; Yan, C.; Li, X.; Qian, D.; Feng, K. Changes in wetlands and surrounding land cover in a desert area under the influences of human and climatic factors: A case study of the Hongjian Nur region. Ecol. Indic. 2019, 101, 261–273. [Google Scholar] [CrossRef]
- Dixon, M.J.R.; Loh, J.; Davidson, N.C.; Beltrame, C.; Freeman, R.; Walpole, M. Tracking global change in ecosystem area: The Wetland Extent Trends index. Biol. Conserv. 2016, 193, 27–35. [Google Scholar] [CrossRef]
- Copeland, H.E.; Tessman, S.A.; Girvetz, E.H.; Roberts, L.; Enquist, C.; Orabona, A.; Patla, S.; Kiesecker, J. A geospatial assessment on the distribution, condition, and vulnerability of Wyoming’s wetlands. Ecol. Indic. 2010, 10, 869–879. [Google Scholar] [CrossRef]
- Hu, S.; Niu, Z.; Chen, Y.; Li, L.; Zhang, H. Global wetlands: Potential distribution, wetland loss, and status. Sci. Total Environ. 2017, 586, 319–327. [Google Scholar] [CrossRef]
- Bai, Q.; China Coastal Waterbird Census Group; Chen, J.; Chen, Z.; Dong, G.; Dong, J.; Dong, W.; Fu, V.W.K.; Han, Y.; Lu, G.; et al. Identification of coastal wetlands of international importance for waterbirds: A review of China Coastal Waterbird Surveys 2005–2013. Avian Res. 2015, 6, 12. [Google Scholar] [CrossRef] [Green Version]
- Fardila, D.; Kelly, L.T.; Moore, J.L.; McCarthy, M.A. A systematic review reveals changes in where and how we have studied habitat loss and fragmentation over 20years. Biol. Conserv. 2017, 212, 130–138. [Google Scholar] [CrossRef]
- Yu, H.; Li, L.; Zhu, W.; Piao, D.; Cui, G.; Kim, M.; Jeon, S.W.; Woo-Kyun Lee, W.-K. Drought monitoring of the wetland in the Tumen River Basin between 1991 and 2016 using Landsat TM/ETM+. Int. J. Remote Sens. 2019, 40, 1445–1459. [Google Scholar] [CrossRef]
- Cao, C.X.; Zhao, J.; Gong, P.; Ma, G.R.; Bao, D.M.; Tian, K.; Tian, R.; Niu, Z.G.; Zhang, H.; Xu, M.; et al. Wetland changes and droughts in southwestern China. Geomat. Nat. Hazards Risk 2011, 3, 79–95. [Google Scholar] [CrossRef]
- Heintzman, L.J.; McIntyre, N.E. Quantifying the effects of projected urban growth on connectivity among wetlands in the Great Plains (USA). Landsc. Urban Plan. 2019, 186, 1–12. [Google Scholar] [CrossRef]
- Mondal, B.; Dolui, G.; Pramanik, M.; Maity, S.; Biswas, S.S.; Pal, R. Urban expansion and wetland shrinkage estimation using a GIS-based model in the East Kolkata Wetland, India. Ecol. Indic. 2017, 83, 62–73. [Google Scholar] [CrossRef]
- Murray, N.J.; Clemens, R.S.; Phinn, S.R.; Possingham, H.P.; Fuller, R.A. Tracking the rapid loss of tidal wetlands in the Yellow Sea. Front. Ecol. Environ. 2014, 12, 267–272. [Google Scholar] [CrossRef] [Green Version]
- Davis, C.L.; Miller, D.A.W.; Campbell Grant, E.H.; Halstead, B.J.; Kleeman, P.M.; Walls, S.C.; Barichivich, W.J. Linking variability in climate to wetland habitat suitability: Is it possible to forecast regional responses from simple climate measures? Wetl. Ecol. Manag. 2019, 27, 39–53. [Google Scholar] [CrossRef]
- Fu, B.; Pollino, C.A.; Cuddy, S.M.; Andrews, F. Assessing climate change impacts on wetlands in a flow regulated catchment: A case study in the Macquarie Marshes, Australia. J. Environ. Manag. 2015, 157, 127–138. [Google Scholar] [CrossRef] [PubMed]
- Schuerch, M.; Spencer, T.; Temmerman, S.; Kirwan, M.L.; Wolff, C.; Lincke, D.; McOwen, C.J.; Pickering, M.D.; Reef, R.; Vafeidis, A.T.; et al. Future response of global coastal wetlands to sea-level rise. Nature 2018, 561, 231–234. [Google Scholar] [CrossRef]
- Cellone, F.; Carol, E.; Tosi, L. Coastal erosion and loss of wetlands in the middle Río de la Plata estuary (Argentina). Appl. Geogr. 2016, 76, 37–48. [Google Scholar] [CrossRef]
- Eppink, F.V.; van den Bergh, J.C.J.M.; Rietveld, P. Modelling biodiversity and land use: Urban growth, agriculture and nature in a wetland area. Ecol. Econ. 2004, 51, 201–216. [Google Scholar] [CrossRef]
- Harrison, P.A.; Berry, P.M.; Henriques, C.; Holman, I.P. Impacts of socio-economic and climate change scenarios on wetlands: Linking water resource and biodiversity meta-models. Clim. Chang. 2008, 90, 113–139. [Google Scholar] [CrossRef]
- Sica, Y.V.; Quintana, R.D.; Radeloff, V.C.; Gavier-Pizarro, G.I. Wetland loss due to land use change in the Lower Paraná River Delta, Argentina. Sci. Total Environ. 2016, 568, 967–978. [Google Scholar] [CrossRef] [PubMed]
- Mao, D.; Luo, L.; Wang, Z.; Wilson, M.C.; Zeng, Y.; Wu, B.; Wu, J. Conversions between natural wetlands and farmland in China: A multiscale geospatial analysis. Sci. Total Environ. 2018, 634, 550–560. [Google Scholar] [CrossRef] [PubMed]
- Zheng, X.J.; Sun, P.; Zhu, W.H.; Xu, Z.; Fu, J.; Man, W.D.; Li, H.L.; Zhang, J.; Qin, L. Landscape dynamics and driving forces of wetlands in the Tumen River Basin of China over the past 50 years. Landsc. Ecol. Eng. 2017, 13, 237–250. [Google Scholar] [CrossRef]
- Fickas, K.C.; Cohen, W.B.; Yang, Z. Landsat-based monitoring of annual wetland change in the Willamette Valley of Oregon, USA from 1972 to 2012. Wetl. Ecol. Manag. 2016, 24, 73–92. [Google Scholar] [CrossRef]
- Song, K.; Wang, Z.; Du, J.; Liu, L.; Zeng, L.; Ren, C. Wetland Degradation: Its Driving Forces and Environmental Impacts in the Sanjiang Plain, China. Environ. Manag. 2014, 54, 255–271. [Google Scholar] [CrossRef]
- Xia, S.; Yu, X.; Millington, S.; Liu, Y.; Jia, Y.; Wang, L.; Hou, X.; Jiang, L. Identifying priority sites and gaps for the conservation of migratory waterbirds in China’s coastal wetlands. Biol. Conserv. 2017, 210, 72–82. [Google Scholar] [CrossRef]
- Konoff, M.D.; Royle, J.A. Modeling wetland change along the United States Atlantic Coast. Ecol. Model. 2004, 177, 41–59. [Google Scholar] [CrossRef]
- Jiang, H.X.; Hou, Y.Q.; Chu, G.Z.; Qian, F.W.; Wang, H.; Zhang, G.G.; Zheng, G.M. Breeding population dynamics and habitat transition of Saunders’s Gull Larus saundersi in Yancheng National Nature Reserve, China. Bird Conserv. Int. 2010, 20, 13–24. [Google Scholar] [CrossRef] [Green Version]
- Yang, F.; Li, Y.; Chao, X.; Yang, Y.; Li, X.; Yunfeng, L. Biodiversity and Developing Strategy of Shuantaihekou Nature Reserve. J. Liaoning For. Sci. Technol. 1998, 5, 15–20. [Google Scholar]
- Zhou, J.; Li, D.; Ren, J.; Liu, D. The Dynamic Changes, Preservation and Restoration of Larus saundersi ’s Breeding Habitat in Liao Estuary Wetland. China Gard. For. 2017, 33, 123–128. (In Chinese) [Google Scholar]
- Yan, L.; Lv, J. Investugation on the breeding stutus of Saunders’s Gulls. J. Shandong For. Sci. Technol. 1994; 26–28. (In Chinese) [Google Scholar]
- Ma, T.; Li, X.; Bai, J.; Cui, B. Habitat modification in relation to coastal reclamation and its impacts on waterbirds along China’s coast. Glob. Ecol. Conserv. 2019, 17, e00585. [Google Scholar] [CrossRef]
- Liu, C.Y.; Qing, Z.S.; Jiang, H.X.; Li, X.F.; Na, X.D.; Wen, Z.F. Remote sensing monitoring on dynamic of nesting habitats of Saunders′s Gul l Larus saundersi. Acta Ecol. Sin. 2009, 29, 4285–4294. [Google Scholar]
- GB/T 21010-2017; National Standards for Land Use Classification. Standardization Administration of the P. R. China: Beijing, China, 2017.
- Yan, H.; Feng, L.; Zhao, Y.; Feng, L.; Zhu, C.; Qu, Y.; Wang, H. Predicting the potential distribution of an invasive species, Erigeron canadensis L., in China with a maximum entropy model. Glob. Ecol. Conserv. 2020, 21, e00822. [Google Scholar] [CrossRef]
- Yang, X.-Q.; Kushwaha, S.P.S.; Saran, S.; Xu, J.; Roy, P.S. Maxent modeling for predicting the potential distribution of medicinal plant, Justicia adhatoda L. in Lesser Himalayan foothills. Ecol. Eng. 2013, 51, 83–87. [Google Scholar] [CrossRef]
- Di Pasquale, G.; Saracino, A.; Bosso, L.; Russo, D.; Moroni, A.; Bonanomi, G.; Allevato, E. Coastal Pine-Oak Glacial Refugia in the Mediterranean Basin: A Biogeographic Approach Based on Charcoal Analysis and Spatial Modelling. Forests 2020, 11, 673. [Google Scholar] [CrossRef]
- Du, Z.; He, Y.; Wang, H.; Wang, C.; Duan, Y. Potential geographical distribution and habitat shift of the genus Ammopiptanthus in China under current and future climate change based on the MaxEnt model. J. Arid Environ. 2021, 184, 104328. [Google Scholar] [CrossRef]
- Almalki, M.; Alrashidi, M.; O’Connell, M.J.; Shobrak, M.; Szekely, T. Modelling the distribution of wetland birds on the red sea coast in the kingdom of saudi arabia. Appl. Ecol. Environ. Res. 2015, 13, 67–84. [Google Scholar]
- Morán-Ordóñez, A.; Lahoz-Monfort, J.J.; Elith, J.; Wintle, B.A. Evaluating 318 continental-scale species distribution models over a 60-year prediction horizon: What factors influence the reliability of predictions? Glob. Ecol. Biogeogr. 2017, 26, 371–384. [Google Scholar] [CrossRef]
- Fournier, A.; Barbet-Massin, M.; Rome, Q.; Courchamp, F. Predicting species distribution combining multi-scale drivers. Glob. Ecol. Conserv. 2017, 12, 215–226. [Google Scholar] [CrossRef]
- Meynard, C.N.; Quinn, J.F. Predicting species distributions: A critical comparison of the most common statistical models using artificial species. J. Biogeogr. 2007, 34, 1455–1469. [Google Scholar] [CrossRef]
- Phillips, S.J.; Anderson, R.P.; Schapire, R.E. Maximum entropy modeling of species geographic distributions. Ecol. Model. 2006, 190, 231–259. [Google Scholar] [CrossRef] [Green Version]
- Elith, J.; Phillips, S.J.; Hastie, T.; Dudík, M.; Chee, Y.E.; Yates, C.J. A statistical explanation of MaxEnt for ecologists. Divers. Distrib. 2011, 17, 43–57. [Google Scholar] [CrossRef]
- Phillips, S.J.; Anderson, R.P.; Dudík, M.; Schapire, R.E.; Blair, M.E. Opening the black box: An open-source release of Maxent. Ecography 2017, 40, 887–893. [Google Scholar] [CrossRef]
- Na, X.; Zhou, H.; Zang, S.; Wu, C.; Li, W.; Li, M. Maximum Entropy modeling for habitat suitability assessment of Red-crowned crane. Ecol. Indic. 2018, 91, 439–446. [Google Scholar] [CrossRef]
- Zhang, K.; Zhang, Y.; Zhou, C.; Meng, J.; Sun, J.; Zhou, T.; Tao, J. Impact of climate factors on future distributions of Paeonia ostii across China estimated by MaxEnt. Ecol. Inform. 2019, 50, 62–67. [Google Scholar] [CrossRef]
- Yamada, Y.; Itagawa, S.; Yoshida, T.; Fukushima, M.; Ishii, J.; Nishigaki, M.; Ichinose, T. Predicting the distribution of released Oriental White Stork (Ciconia boyciana) in central Japan. Ecol. Res. 2019, 34, 277–285. [Google Scholar] [CrossRef]
- Li, Y.; Cao, W.; He, X.; Chen, W.; Sheng, X. Prediction of Suitable Habitat for Lycophytes and Ferns in Northeast China: A Case Study on Athyrium brevifrons. Chin. Geogr. Sci. 2019, 20, 1011–1023. [Google Scholar] [CrossRef] [Green Version]
- Habibzadeh, N.; Storch, I.; Ludwig, T. Differential habitat associations in peripheral populations of threatened species: The case of the Caucasian grouse. Ecol. Res. 2019, 34, 309–319. [Google Scholar] [CrossRef]
- Remya, K.; Ramachandran, A.; Jayakumar, S. Predicting the current and future suitable habitat distribution of Myristica dactyloides Gaertn. using MaxEnt model in the Eastern Ghats, India. Ecol. Eng. 2015, 82, 184–188. [Google Scholar] [CrossRef]
- Liu, C.; Berry, P.M.; Dawson, T.P.; Pearson, R.G. Selecting thresholds of occurrence in the prediction of species distributions. Ecography 2005, 28, 385–393. [Google Scholar] [CrossRef]
- Narouei-Khandan, H.A.; Worner, S.P.; Viljanen, S.L.H.; van Bruggen, A.H.C.; Jones, E.E. Projecting the suitability of global and local habitats for myrtle rust (Austropuccinia psidii) using model consensus. Plant Pathol. 2020, 69, 17–27. [Google Scholar] [CrossRef]
- Merow, C.; Smith, M.J.; Silander, J.A. A practical guide to MaxEnt for modeling species’ distributions: What it does, and why inputs and settings matter. Ecography 2013, 36, 1058–1069. [Google Scholar] [CrossRef]
- West, A.M.; Kumar, S.; Brown, C.S.; Stohlgren, T.J.; Bromberg, J. Field validation of an invasive species Maxent model. Ecol. Inform. 2016, 36, 126–134. [Google Scholar] [CrossRef] [Green Version]
- Zhang, Y.; Tang, J.; Ren, G.; Zhao, K.; Wang, X. Global potential distribution prediction of Xanthium italicum based on Maxent model. Sci. Rep. 2021, 11, 16545. [Google Scholar] [CrossRef]
- Liu, H. Propagation Study of Saundersus Gull at Shandong Yellow River Delta. Shandong For. Sci. Technol. 2015, 5, 86–87,103. [Google Scholar]
- Baaloudj, A.; Bouzid, A.; Nedjah, R.; Samraoui, F.; Samizaoui, B. Distribution and breeding of the slender-billed gull chroicocephalus genei, common tern sterna hirundo and little tern sternula albifrons in algeria. Rev. Ecol.-Terre Vie 2018, 73, 385–395. [Google Scholar]
- Dai, S.; Feng, D.L.; Xu, B. Monitoring potential geographical distribution of four wild bird species in China. Environ. Earth Sci. 2016, 75, 10. [Google Scholar] [CrossRef]
- Wang, X.; Jiang, H.X.; Zhang, Y.N.; Chen, L.X.; Song, C.Z.; Li, Y.X. Diet composition of Saunders’s Gull (Larus saundersi) determined using stable isotope analysis at the Shuangtaihekou National Nature Reserve, China. Acta Ecol. Sin. 2017, 37, 1796–1804. [Google Scholar]
- Yoon, J.; Yoon, H.-J.; Go, B.-G.; Joo, E.-J.; Park, S.-R. Tide associated incubation and foraging behaviour of Saunders’s Gulls Larus saundersi. Ardea 2013, 101, 99–104. [Google Scholar] [CrossRef]
- Liu, C.; Jiang, H.; Hou, Y.; Zhang, S.; Su, L.; Li, X.; Pan, X.; Wen, Z. Habitat Changes for Breeding Waterbirds in Yancheng National Nature Reserve, China: A Remote Sensing Study. Wetlands 2010, 30, 879–888. [Google Scholar] [CrossRef]
- Wyman, K.E.; Cuthbert, F.J. Black tern (Chlidonias niger) breeding site abandonment in U.S. Great Lakes coastal wetlands is predicted by historical abundance and patterns of emergent vegetation. Wetl. Ecol. Manag. 2017, 25, 583–596. [Google Scholar] [CrossRef]
- Anton, A.G.; Garza, V.; Justribo, J.H.; Traba, J. Factors affecting Dupont’s lark distribution and range regression in Spain. PLoS ONE 2019, 14, 22. [Google Scholar]
- Yorio, P.; Petracci, P.; Garcia Borboroglu, P. Current status of the threatened Olrog’s Gull Larus atlanticus: Global population, breeding distribution and threats. Bird Conserv. Int. 2013, 23, 477–486. [Google Scholar] [CrossRef] [Green Version]
- Warwick-Evans, V.C.; Atkinson, P.W.; Robinson, L.A.; Green, J.A. Predictive Modelling to Identify Near-Shore, Fine-Scale Seabird Distributions during the Breeding Season. PLoS ONE 2016, 11, 17. [Google Scholar] [CrossRef] [Green Version]
- Cong, P.; Chen, K.; Qu, L.; Han, J. Dynamic Changes in the Wetland Landscape Pattern of the Yellow River Delta from 1976 to 2016 Based on Satellite Data. Chin. Geogr. Sci. 2019, 29, 372–381. [Google Scholar] [CrossRef] [Green Version]
- Xing, L.; Niu, Z. Mapping and analyzing China’s wetlands using MODIS time series data. Wetl. Ecol. Manag. 2019, 27, 693–710. [Google Scholar] [CrossRef]
- Brambilla, M.; Gustin, M.; Vitulano, S.; Falco, R.; Bergero, V.; Negri, I.; Bogliani, G.; Celada, C. Sixty years of habitat decline: Impact of land-cover changes in northern Italy on the decreasing ortolan bunting Emberiza hortulana. Reg. Environ. Change 2017, 17, 323–333. [Google Scholar] [CrossRef]
- Jiang, H.-X.; Chu, G.-Z.; Hou, Y.-Q.; Qian, F.-W.; Wang, H.; Zhang, G.-G.; Zheng, G.-M. Spatiotemporal variation of nesting sites of the Saunders’ s gull Larus saundersi. Acta Zool. Sin. 2008, 54, 191–200. [Google Scholar]
- Wang, Y.; Liu, R.; Gao, H.; Bai, J.; Ling, M. Degeneration Mechanism Research of Suaeda Heteroptera Wetland of the Shuangtaizi Estuary National Nature Reserve in China. Procedia Environ. Sci. 2010, 2, 1157–1162. [Google Scholar] [CrossRef] [Green Version]
- Lu, W.; Xiao, J.; Lei, W.; Du, J.; Li, Z.; Cong, P.; Hou, W.; Zhang, J.; Chen, L.; Zhang, Y.; et al. Human activities accelerated the degradation of saline seepweed red beaches by amplifying top-down and bottom-up forces. Ecosphere 2018, 9, e02352. [Google Scholar] [CrossRef] [Green Version]
- Ma, Z.; Li, B.; Li, W.; Han, N.; Chen, J.; Watkinson, A.R. Conflicts between biodiversity conservation and development in a biosphere reserve. J. Appl. Ecol. 2009, 46, 527–535. [Google Scholar] [CrossRef]
- Wang, X.; Kuang, F.; Tan, K.; Ma, Z. Population trends, threats, and conservation recommendations for waterbirds in China. Avian Res. 2018, 9, 14. [Google Scholar] [CrossRef] [Green Version]
- Gilbert, G.; Tyler, G.A.; Dunn, C.J.; Smith, K.W. Nesting habitat selection by bitterns Botaurus stellaris in Britain and the implications for wetland management. Biol. Conserv. 2005, 124, 547–553. [Google Scholar] [CrossRef]
- Ma, Z.; Cai, Y.; Li, B.; Chen, J. Managing Wetland Habitats for Waterbirds: An International Perspective. Wetlands 2010, 30, 15–27. [Google Scholar] [CrossRef]
- Bateman, B.L.; Pidgeon, A.M.; Radeloff, V.C.; Flather, C.H.; VanDerWal, J.; Akakaya, H.R.; Thogmartin, W.E.; Albright, T.P.; Vavrus, S.J.; Heglund, P.J. Potential breeding distributions of US birds predicted with both short-term variability and long-term average climate data. Ecol. Appl. 2016, 26, 2718–2729. [Google Scholar] [CrossRef]


| Variables | Variance Explained by the Variables Selected | F-Value | p-Value |
|---|---|---|---|
| PD | 0.72 | 10.4 | 0.0020 |
| MF | 0.92 | 7.06 | 0.0700 |
| RD | 0.99 | 15.86 | 0.0580 |
| SCP | 1.00 | 4.79 | 0.1800 |
| SW | 1.00 | 0.00 | 1.0000 |
| Land-Use Type | 1988 | 2000 | 2009 | 2017 | ||||
|---|---|---|---|---|---|---|---|---|
| Area (ha) | Percent (%) | Area (ha) | Percent (%) | Area (ha) | Percent (%) | Area (ha) | Percent (%) | |
| Non-irrigated farmland | 98.66 | 0.10 | 148.66 | 0.15 | 200.07 | 0.20 | 399.50 | 0.40 |
| Paddy field | 964.55 | 0.97 | 6794.52 | 6.75 | 6358.55 | 6.37 | 6399.99 | 6.40 |
| Reed marsh | 43,948.33 | 40.02 | 41,716.19 | 41.42 | 40,753.22 | 40.82 | 38,153.68 | 38.17 |
| Seepweed marsh | 6490.27 | 6.50 | 1081.05 | 1.07 | 1537.82 | 1.54 | 6600.79 | 6.60 |
| Artificial facility | 195.09 | 0.20 | 347.72 | 0.35 | 420.32 | 0.42 | 359.43 | 0.36 |
| Water body | 2068.55 | 2.07 | 2636.09 | 2.62 | 2915.49 | 2.92 | 3323.22 | 3.32 |
| Mudflat | 16,577.82 | 16.60 | 14,777.34 | 14.67 | 21,754.75 | 21.79 | 12,704.79 | 12.71 |
| Shrimp and crab pond | 773.47 | 0.77 | 2982.01 | 2.96 | 5289.31 | 5.30 | 6078.73 | 6.08 |
| Shallow sea | 28,708.90 | 28.76 | 30,226.96 | 30.01 | 20,598.39 | 20.63 | 25,941.58 | 25.95 |
| Suitable Class | 1988 | 2000 | 2009 | 2017 | ||||
|---|---|---|---|---|---|---|---|---|
| Area (ha) | Percent (%) | Area (ha) | Percent (%) | Area (ha) | Percent (%) | Area (ha) | Percent (%) | |
| Unsuitable | 80,280.09 | 80.42 | 83,799.09 | 83.94 | 83,073.96 | 83.22 | 82,895.13 | 83.04 |
| Less suitable | 13,492.80 | 13.52 | 11,530.44 | 11.55 | 12,620.16 | 12.64 | 12,320.46 | 12.34 |
| Suitable | 2316.42 | 2.32 | 2033.46 | 2.04 | 1733.94 | 1.74 | 1848.96 | 1.85 |
| Most suitable | 3686.94 | 3.69 | 2465.55 | 2.47 | 2400.48 | 2.40 | 2763.99 | 2.77 |
| Total | 99,828.54 | 100.00 | 99,828.54 | 100.00 | 99,828.54 | 100.00 | 99,828.54 | 100.00 |
Publisher’s Note: MDPI stays neutral with regard to jurisdictional claims in published maps and institutional affiliations. |
© 2022 by the authors. Licensee MDPI, Basel, Switzerland. This article is an open access article distributed under the terms and conditions of the Creative Commons Attribution (CC BY) license (https://creativecommons.org/licenses/by/4.0/).
Share and Cite
Chang, Y.; Chang, C.; Li, Y.; Liu, M.; Lv, J.; Hu, Y. Predicting Dynamics of the Potential Breeding Habitat of Larus saundersi by MaxEnt Model under Changing Land-Use Conditions in Wetland Nature Reserve of Liaohe Estuary, China. Remote Sens. 2022, 14, 552. https://doi.org/10.3390/rs14030552
Chang Y, Chang C, Li Y, Liu M, Lv J, Hu Y. Predicting Dynamics of the Potential Breeding Habitat of Larus saundersi by MaxEnt Model under Changing Land-Use Conditions in Wetland Nature Reserve of Liaohe Estuary, China. Remote Sensing. 2022; 14(3):552. https://doi.org/10.3390/rs14030552
Chicago/Turabian StyleChang, Yu, Chang Chang, Yuxiang Li, Miao Liu, Jiujun Lv, and Yuanman Hu. 2022. "Predicting Dynamics of the Potential Breeding Habitat of Larus saundersi by MaxEnt Model under Changing Land-Use Conditions in Wetland Nature Reserve of Liaohe Estuary, China" Remote Sensing 14, no. 3: 552. https://doi.org/10.3390/rs14030552