
A Comprehensive Analysis of Ultraviolet Remote Sensing for Aerosol Layer Height Retrieval from Multi-Angle Polarization Satellite Measurements

 , , , , ,
Abstract
:1. Introduction
2. Materials and Methods
2.1. Optimal Estimation Theory
2.2. Radiative Transfer Simulation
3. Instrument and Simulation Assumptions
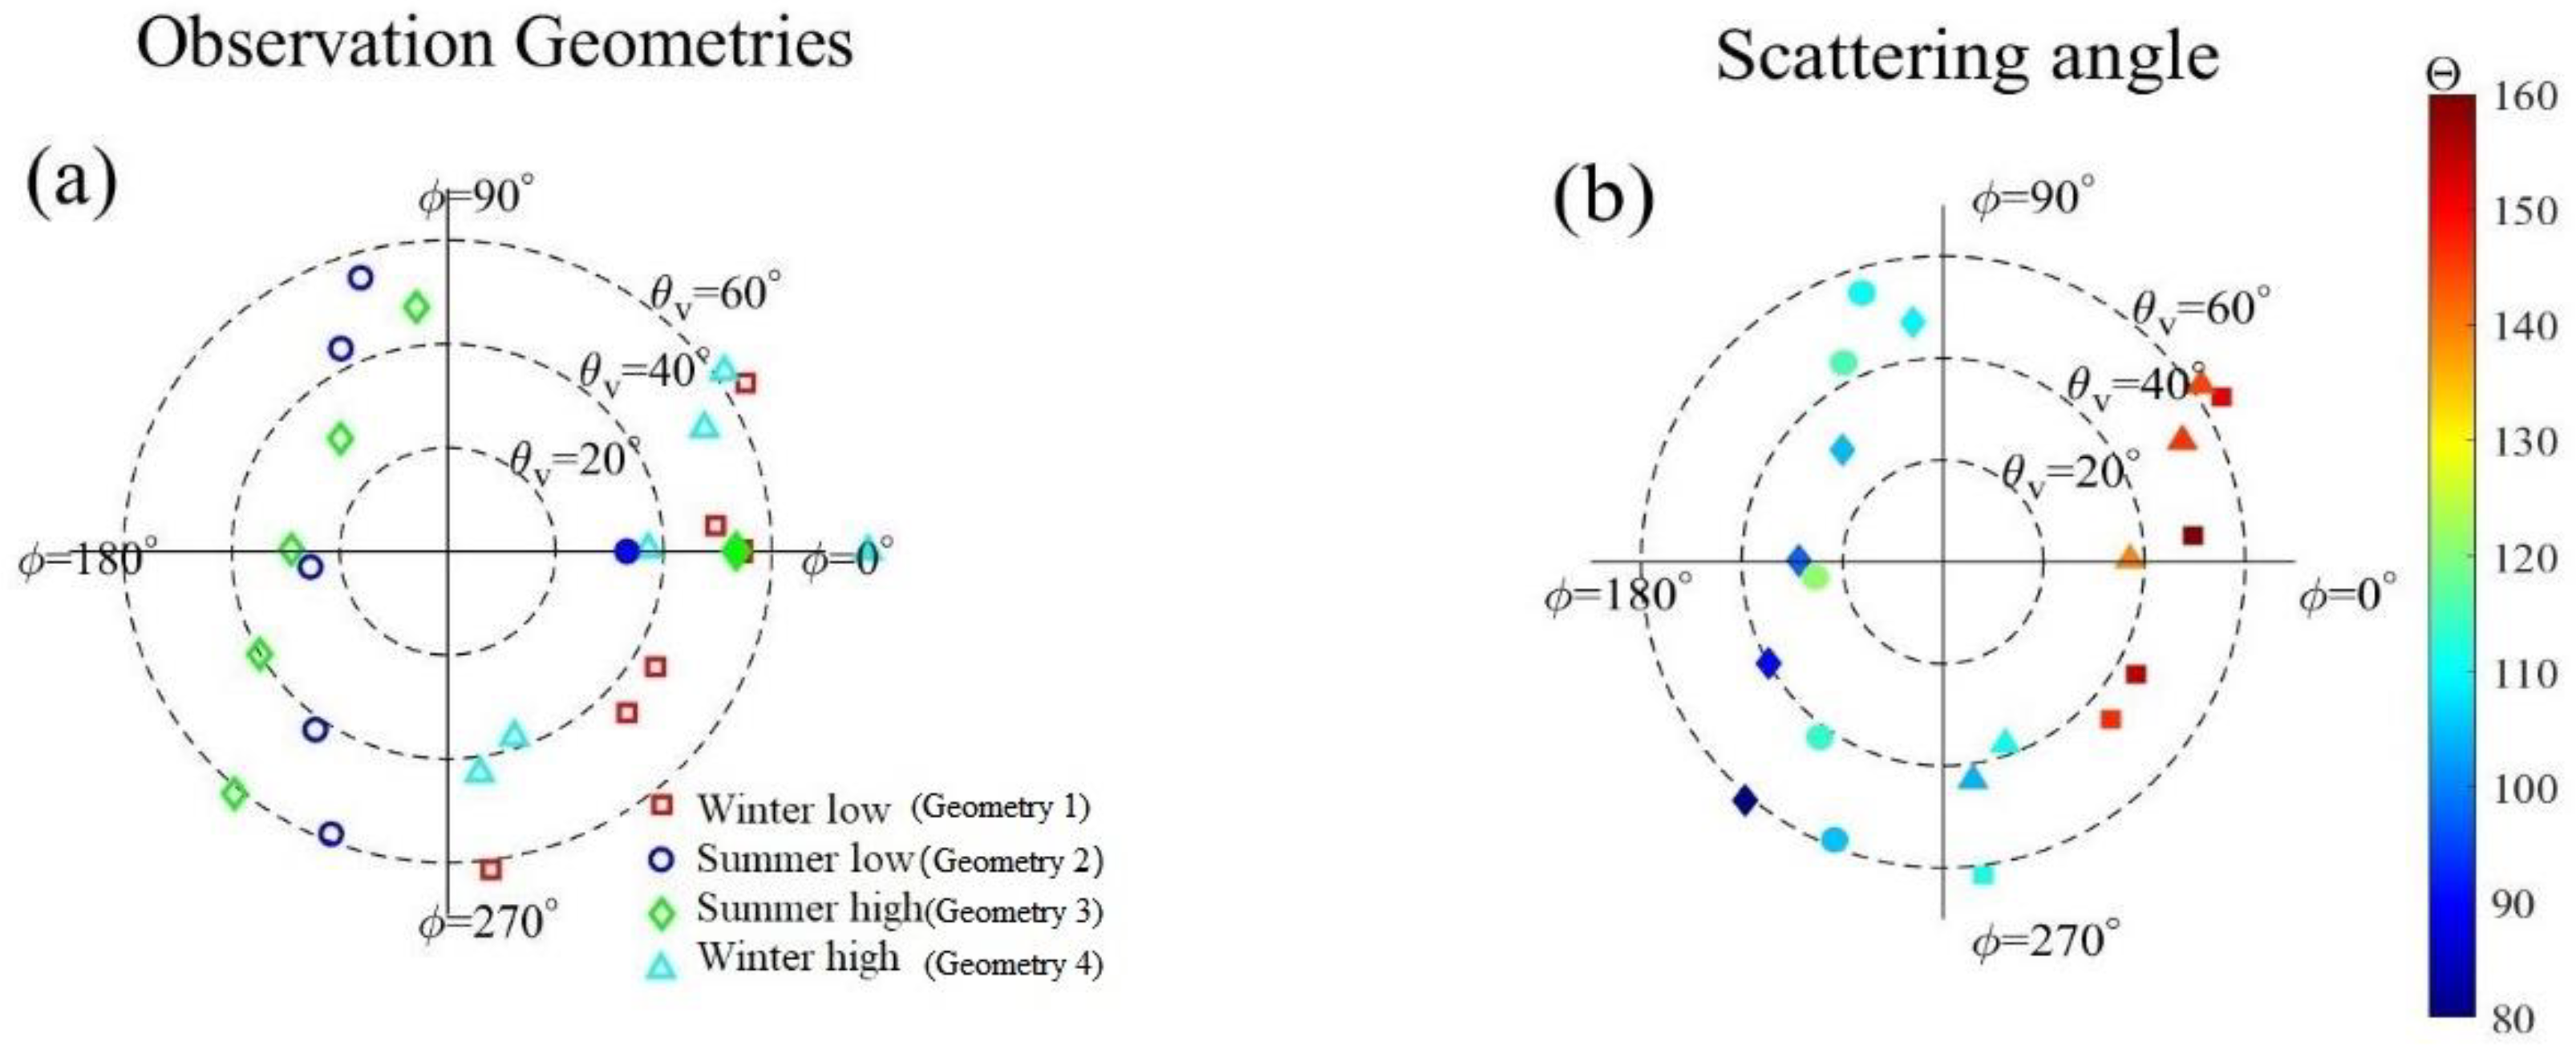
3.1. Observation Geometry Setting
3.2. Simulation Assumptions
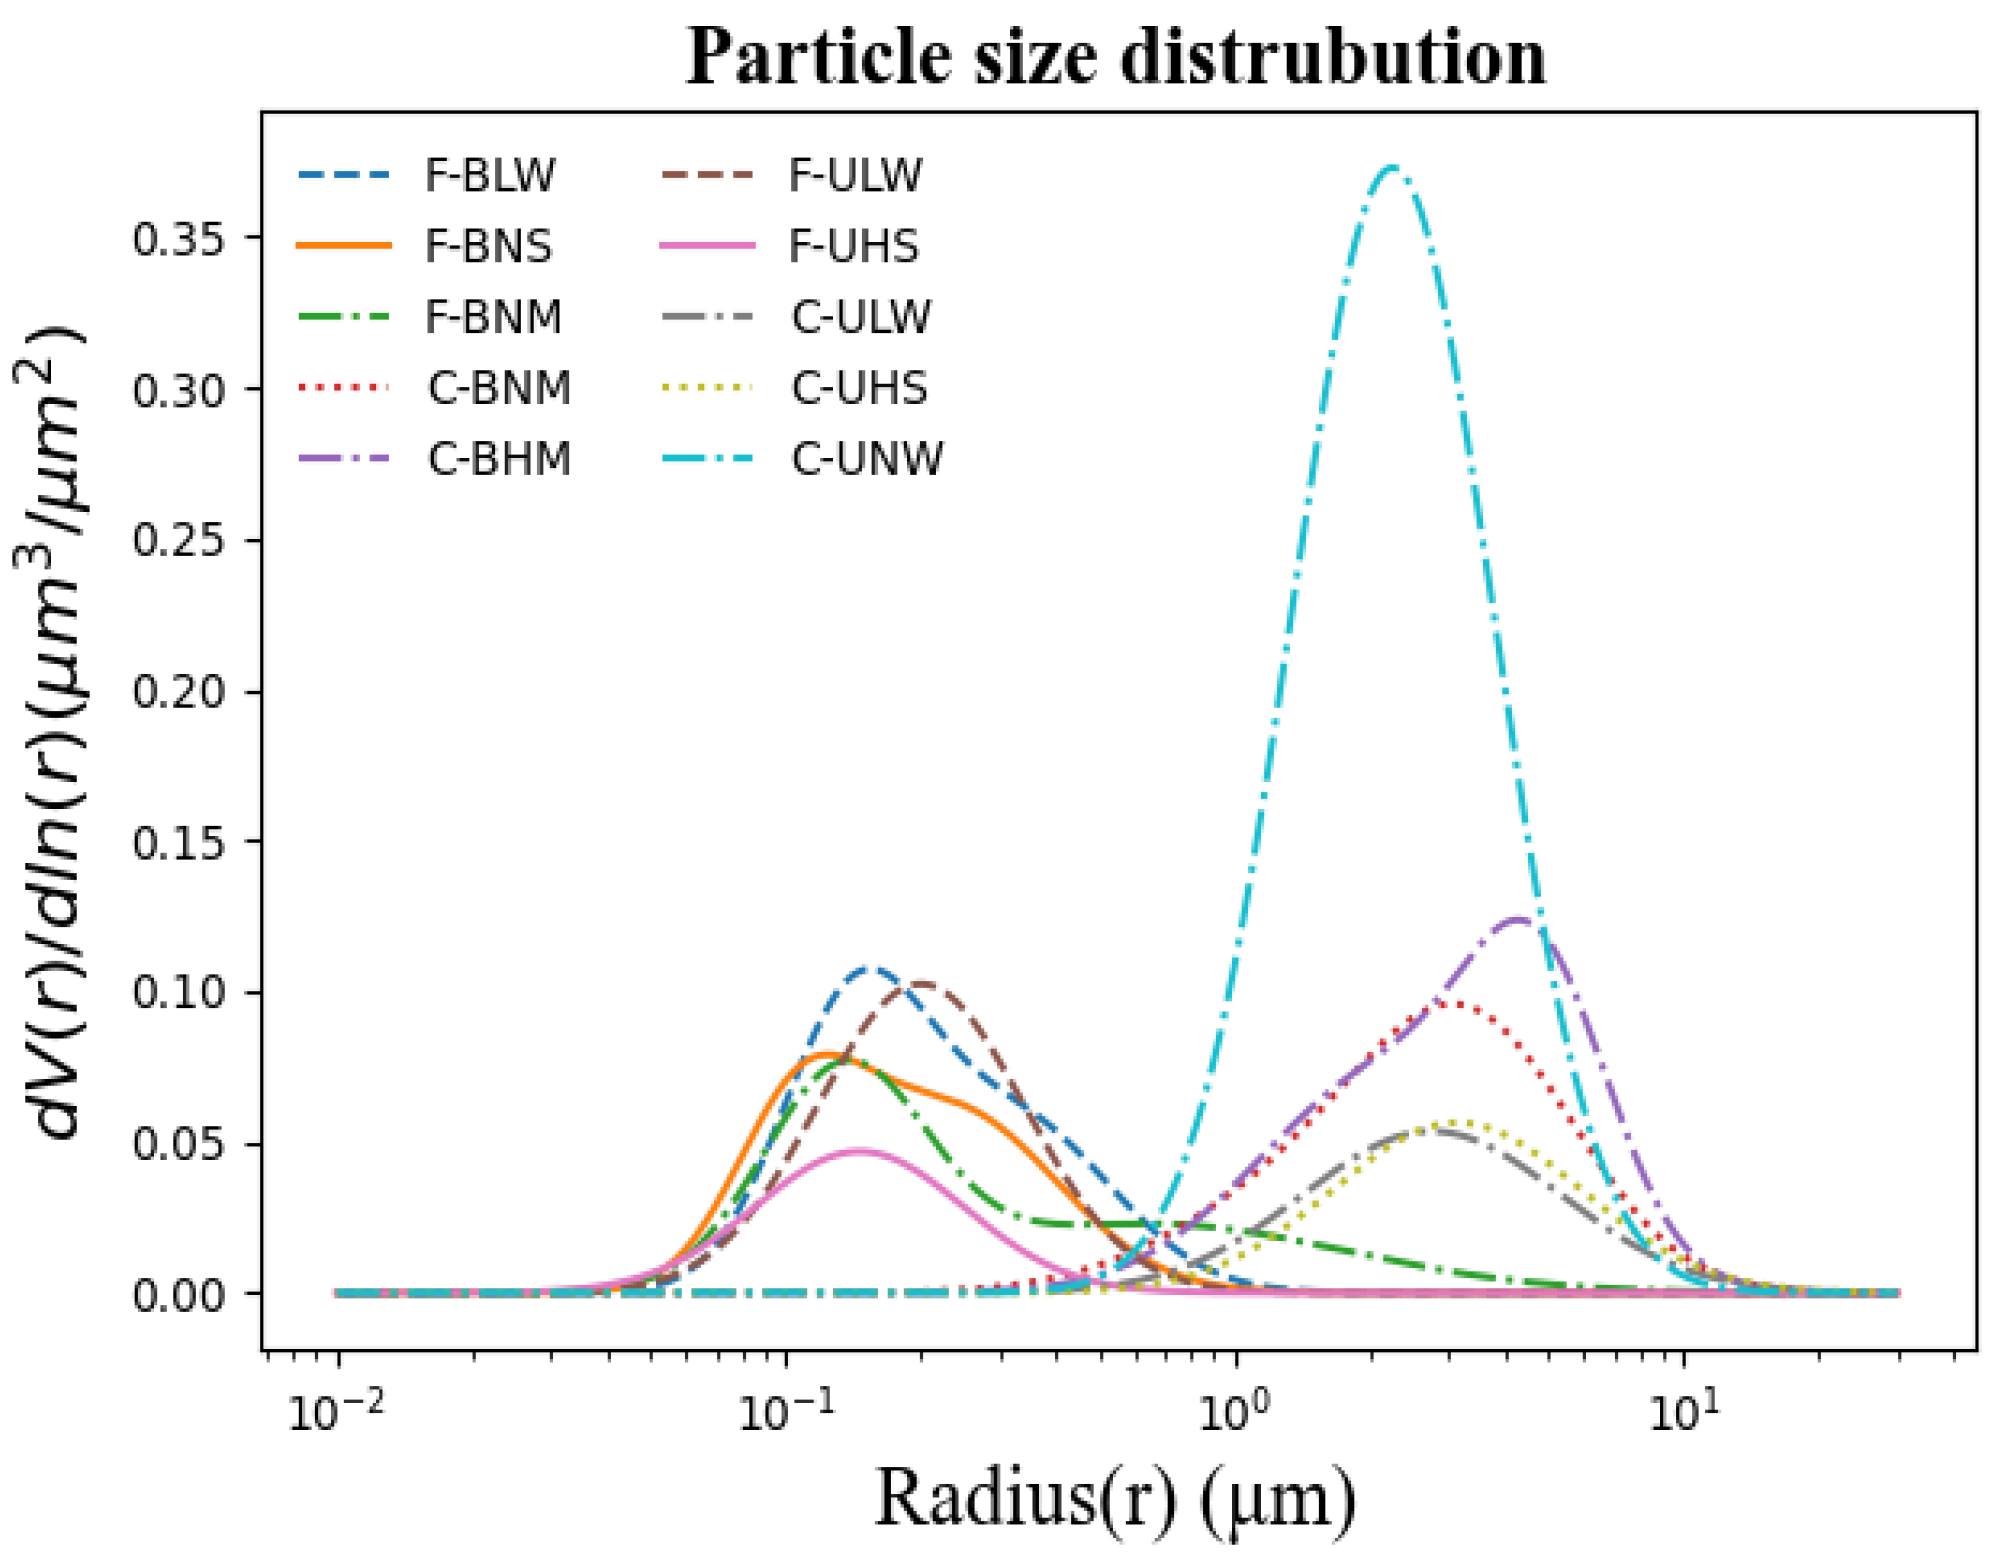
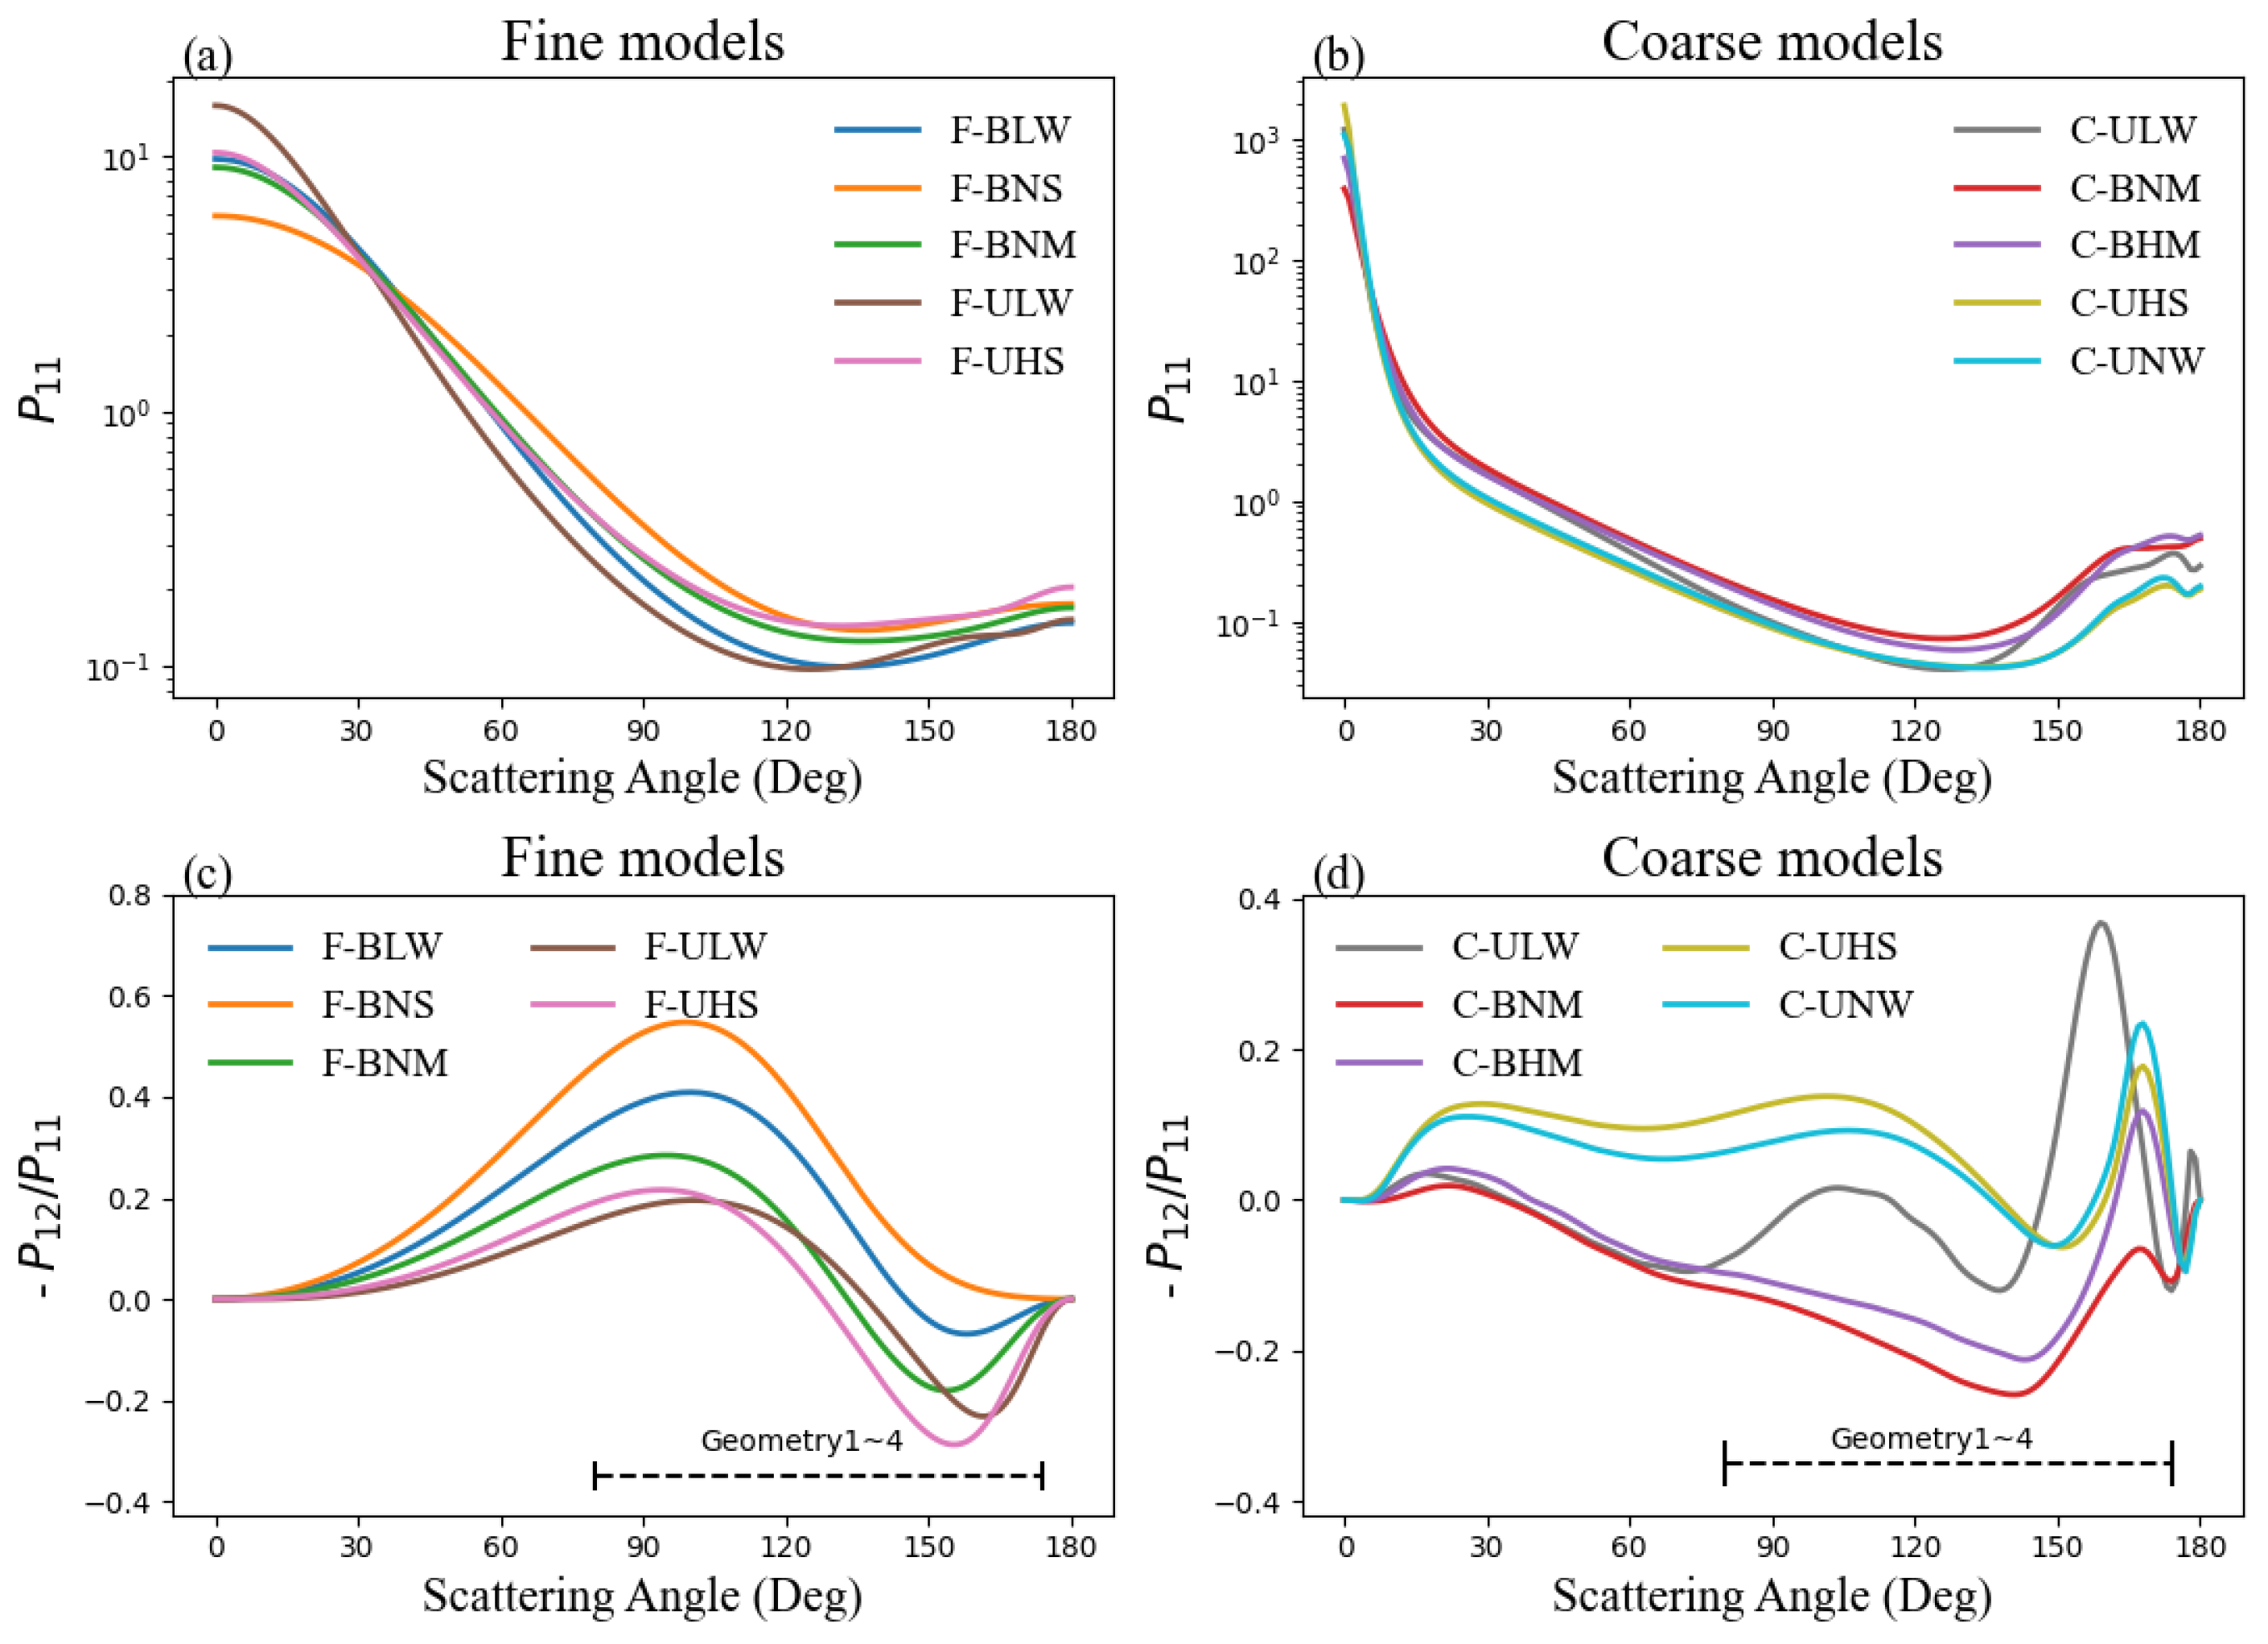
3.2.1. Aerosol Model
3.2.2. Surface Model
3.2.3. Error Covariance Matrix
4. Results
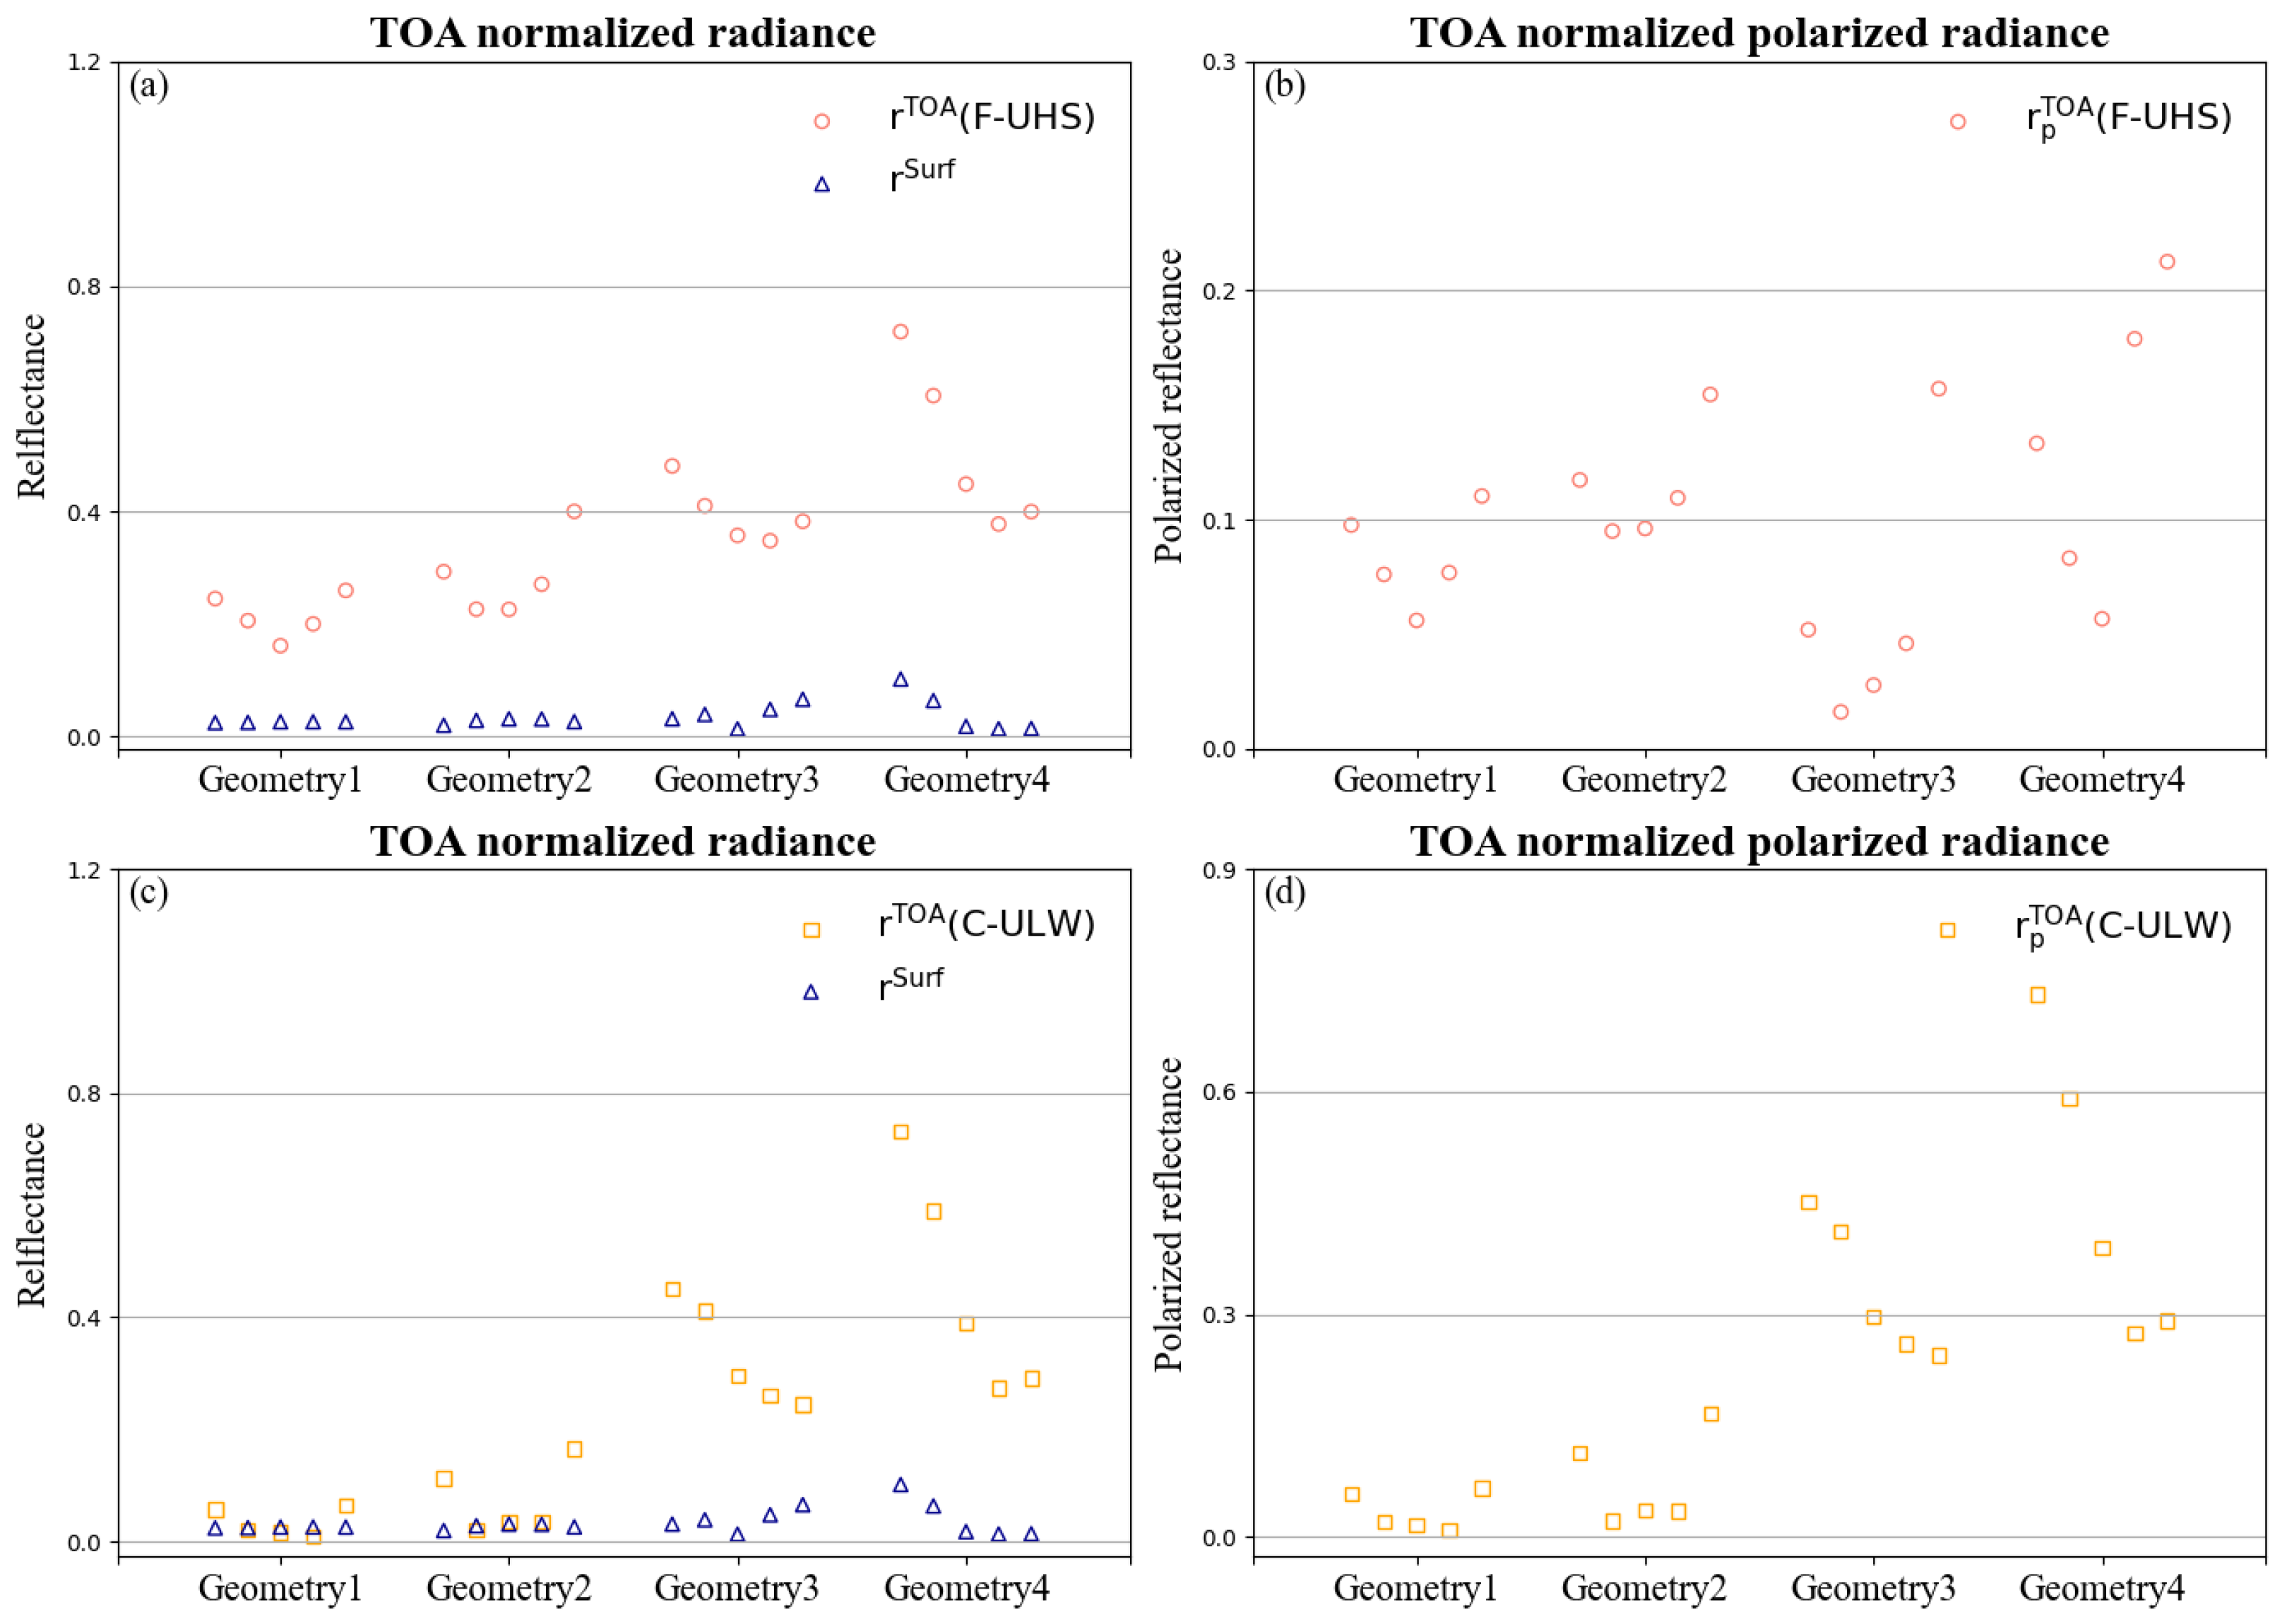
4.1. Simulated TOA Results
4.2. ALH Retrieval Capability for Typical Cases
- (1)
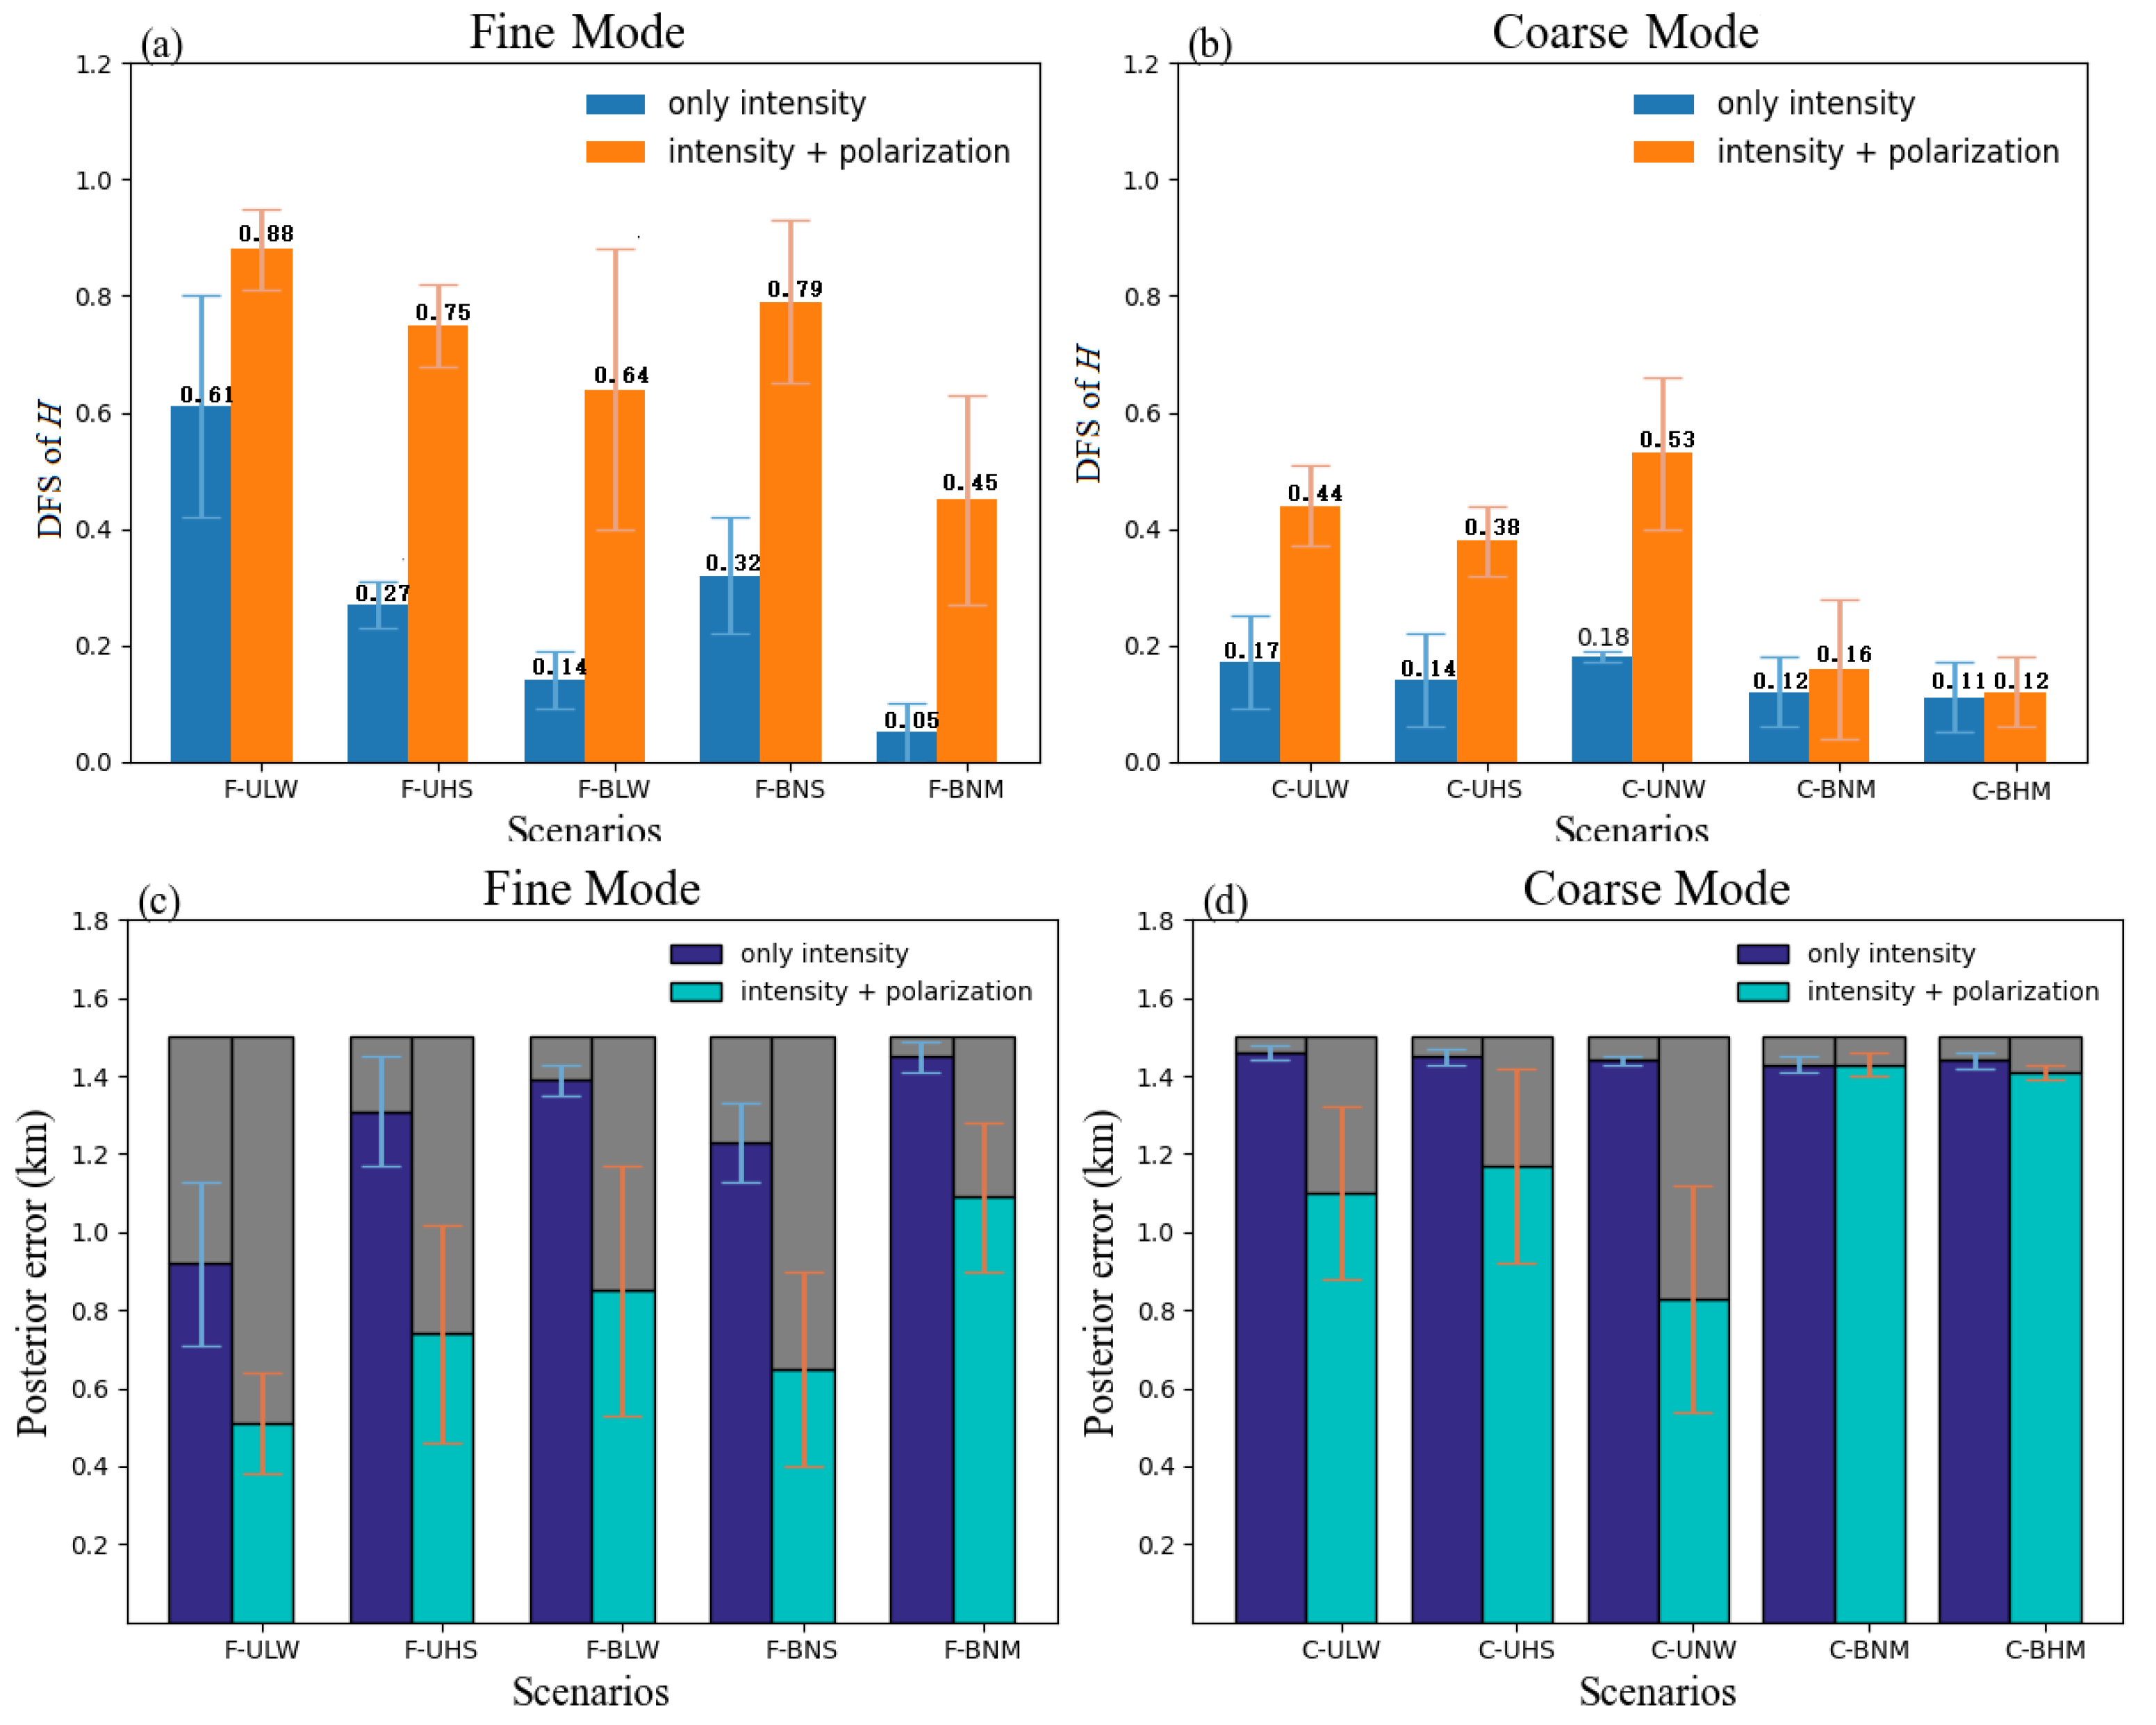
- The results show that the multi-angle polarization measurements of ALH retrieval performed well (DFS > 0.5) in the UV band for the main aerosol models. Previous studies have shown that the surface reflectance on the information content of ALH often has more impact than the optical aerosol properties [29]. It can be seen that the optical properties of aerosols also play crucial roles in ultraviolet ALH retrieval.
- (2)
- The determination of ALH for the coarse mode is relatively difficult compared with the fine mode, and the information content of ALH is closely related to the scattering and absorption characteristics of the aerosol model. Combined with the aerosol model SSA presented in Section 3.2.1, the fly ash pollution type (F-BNM) has the strongest scattering characteristics in the five fine modes, as a result of having the lowest DFS result, which is even lower than that found for some coarse modes. Similarly, the difference between the primary dust type (C-UNW) with the highest DFS and background dust with the lowest DFS is 0.07, and the difference grew further to above 0.4 after adding the polarization measurements. The result also indicates a better performance of the MAPMU observations for absorbing aerosol in ALH retrieval.
- (3)
- Comparing intensity observation and polarization observation, it can be seen that, regardless of the type of aerosol (except F-ULW), it is difficult to retrieve the scale height parameter using only the intensity observation in the UV band, and the addition of polarization observation information effectively improves ALH retrieval. We supplement and test the information related to ALH retrieval under different aerosol conditions in Section 5.1 and evaluate the improvement produced by adding polarization measurements.
- (4)
- As shown in Figure 5c,d, due to the different aerosol models, when only the intensity measurements are included, the posterior error for fine mode is in the range of 1.45 km to 0.92 km; however, once polarization measurements are included, the posterior error can drop to a range of 1.09 km to 0.51 km. For Coarse mode, the posterior error is in the range of 1.46 km to 1.43 km when just intensity measurements are used, while it is in the range of 1.43 km to 0.62 km when polarization measurements are added. In summary, the DFS of the ALH is significantly improved with the addition polarization measurements, and the posterior error is gradually reduced.
5. Discussion
5.1. The Influence of Adding Polarization Measurements
- (1)
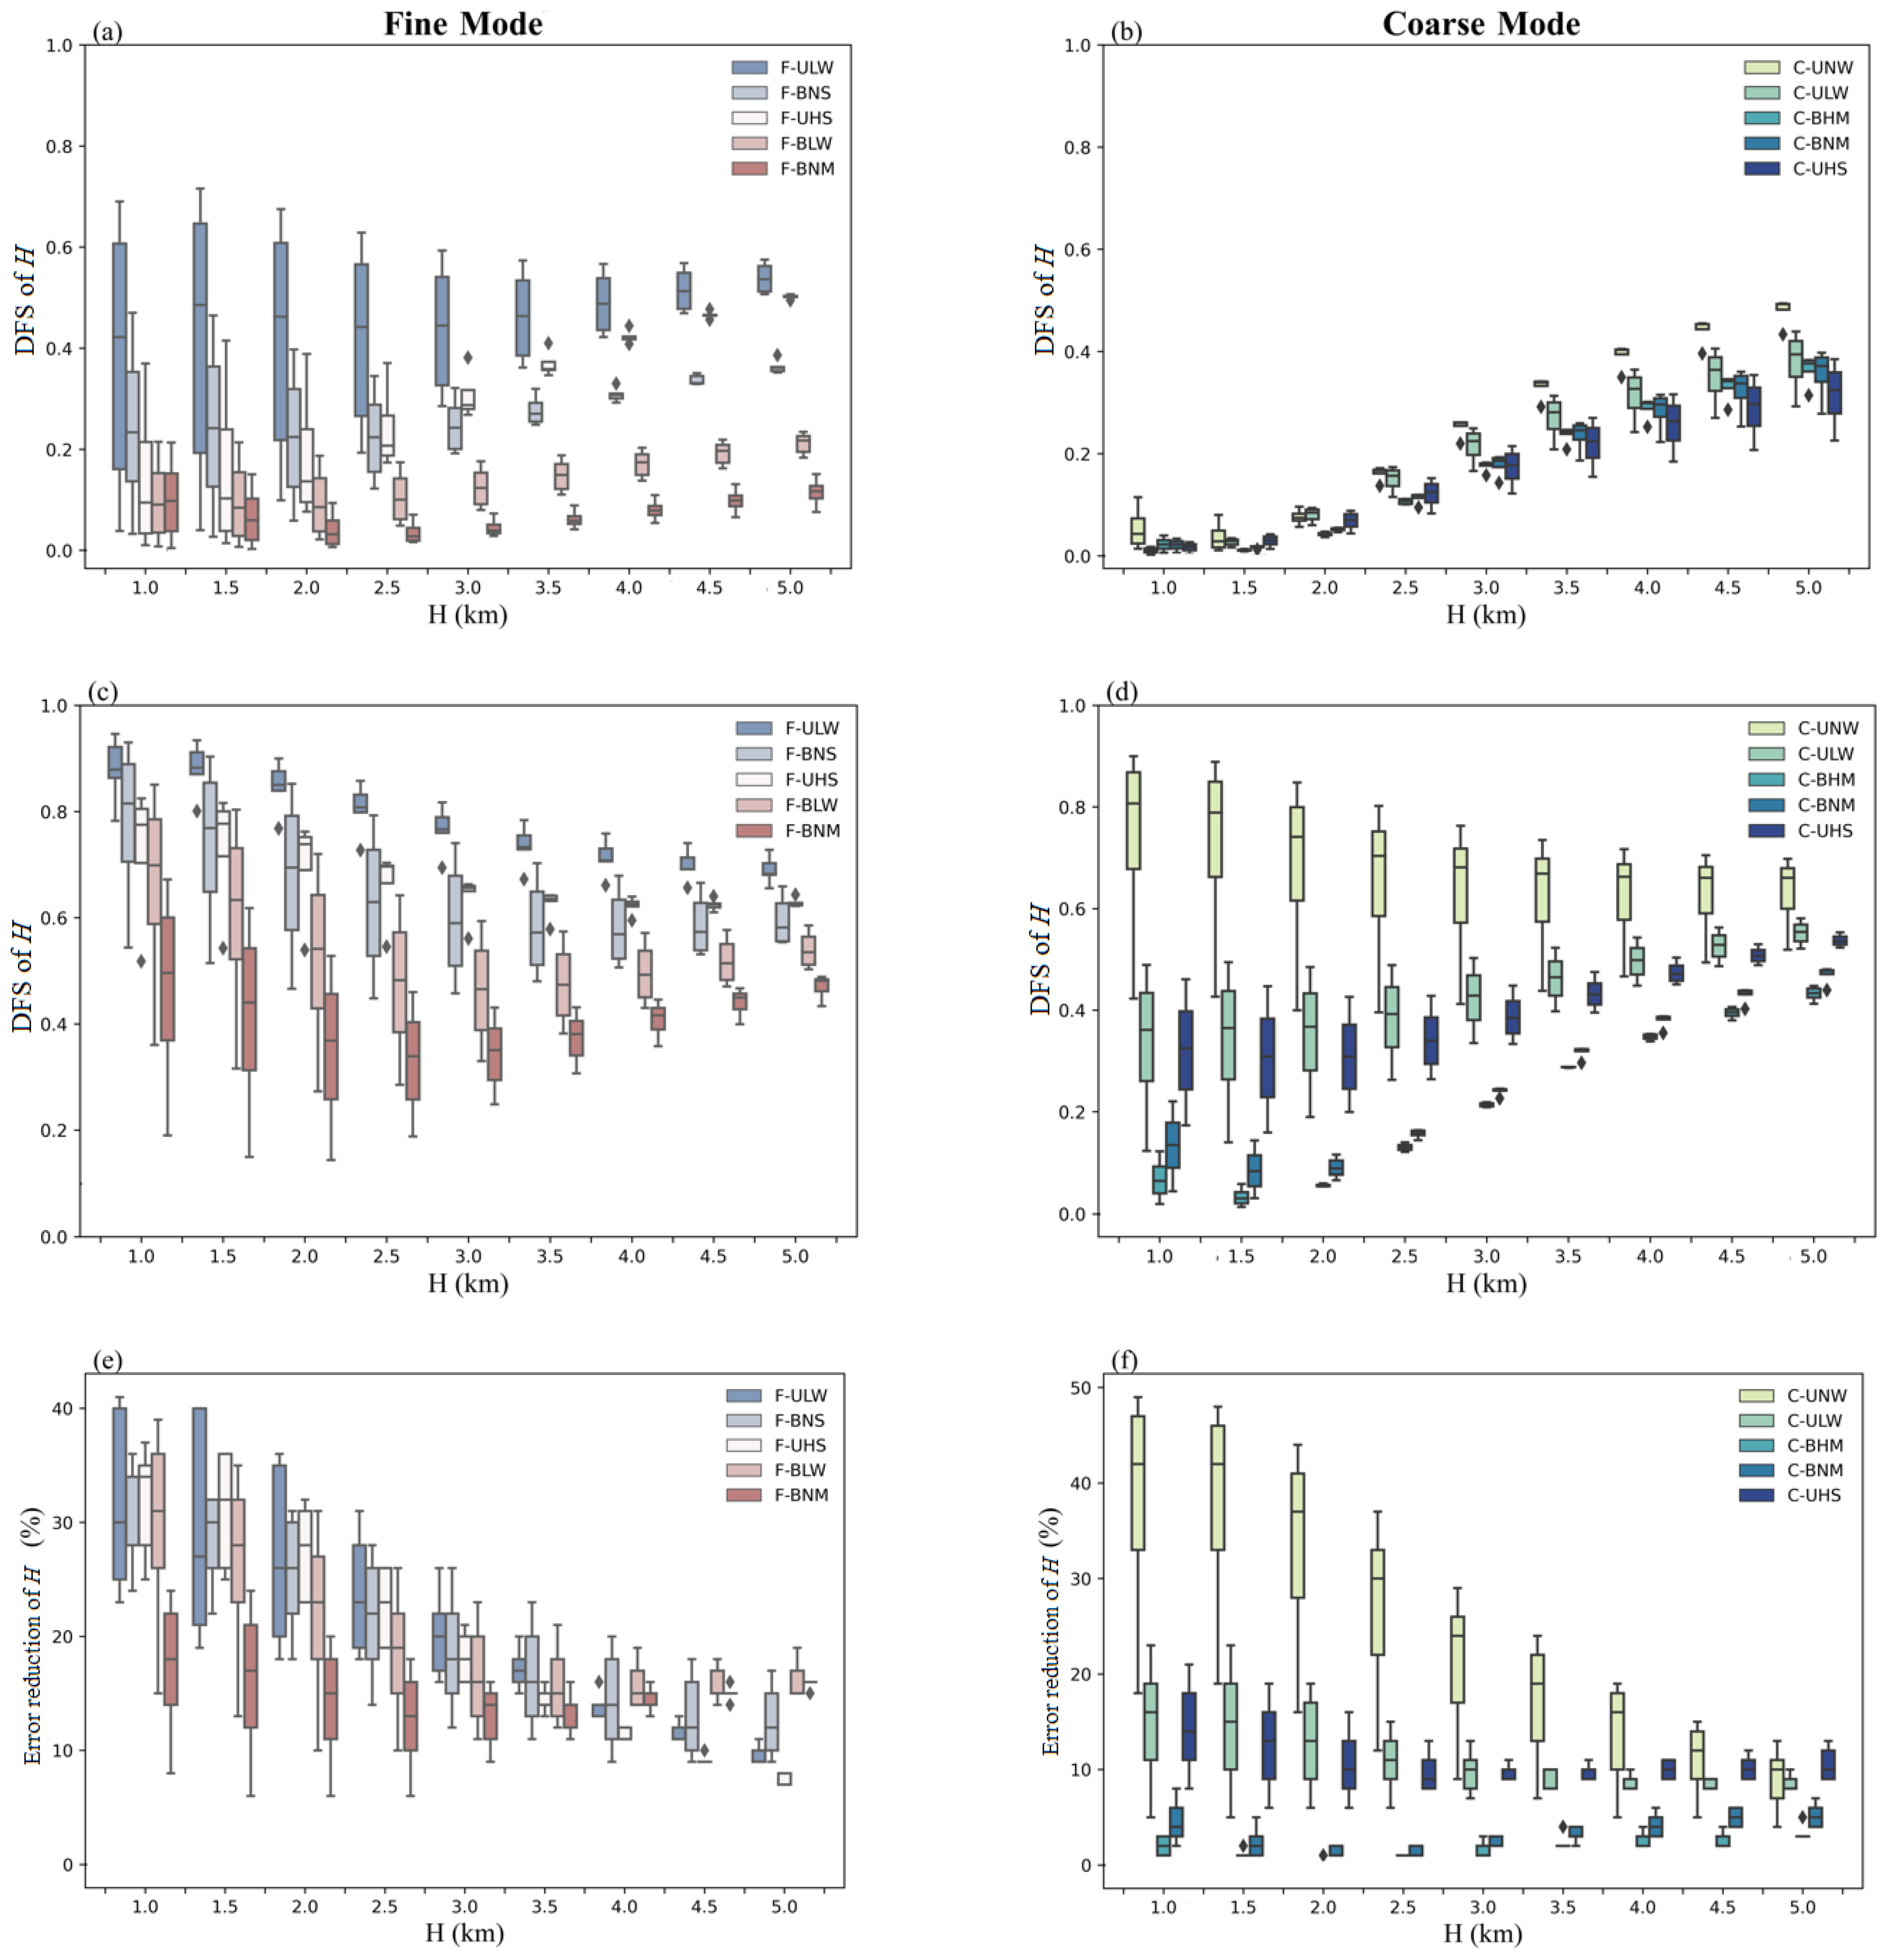
- Comparing Figure 7a–d, it can be seen that no matter which aerosol model is used, the DFS of ALH increases at larger AOD values. For the intensity measurements, the DFS increases gradually with the increase in H. After adding the polarization measurements, the DFS gradually decreases, but the overall value is much higher than that of the intensity measurements. The polarization especially improves the ALH retrieval when the prior setting of the scale height is less than 3 km. At the same time, the difference between aerosol models has a greater impact on DFS than the changes in AOD and H, which is especially obvious for the coarse modal aerosol types.
- (2)
- As shown in Figure 7e,f, the influence of polarization measurements on ALH retrieval gradually decreases. This is because the troposphere contains more height information, and the detection accuracy of the aerosol height is relatively high in this range. As H increases, the enhancement effect of polarization gradually weakens. Similar to the study presented in [33], DoLP measurements increase the sensitivity to H, and polarization multi-angle observations offer a high potential for ALH detection, but the polarization improvement shows obvious differences between aerosol models.
- (3)
- The comparison of different models shows that the difference between the fine-mode aerosol types is small, while the difference is generally higher than that for the coarse mode aerosols. The ALH retrieval uncertainty can be reduced by 10–39% at most through the addition of polarized measurements for F-ULW, but it can only be reduced by 6–24% for F-BNM. In contrast, the differences among the coarse mode aerosol types affected by polarization are large. For instance, when the scale height is 1 km, the uncertainty reduction might change by as much as 49%, but the H retrieval uncertainty will only be reduced by 1–5% (1–8%) for C-BHM(C-BNM). It can be seen that the polarization enhancement effect is very limited for the above two coarse mode aerosol types with a moderate particle radius and weak absorption in the UV band.
5.2. The Influence of Multi-Angle Measurements
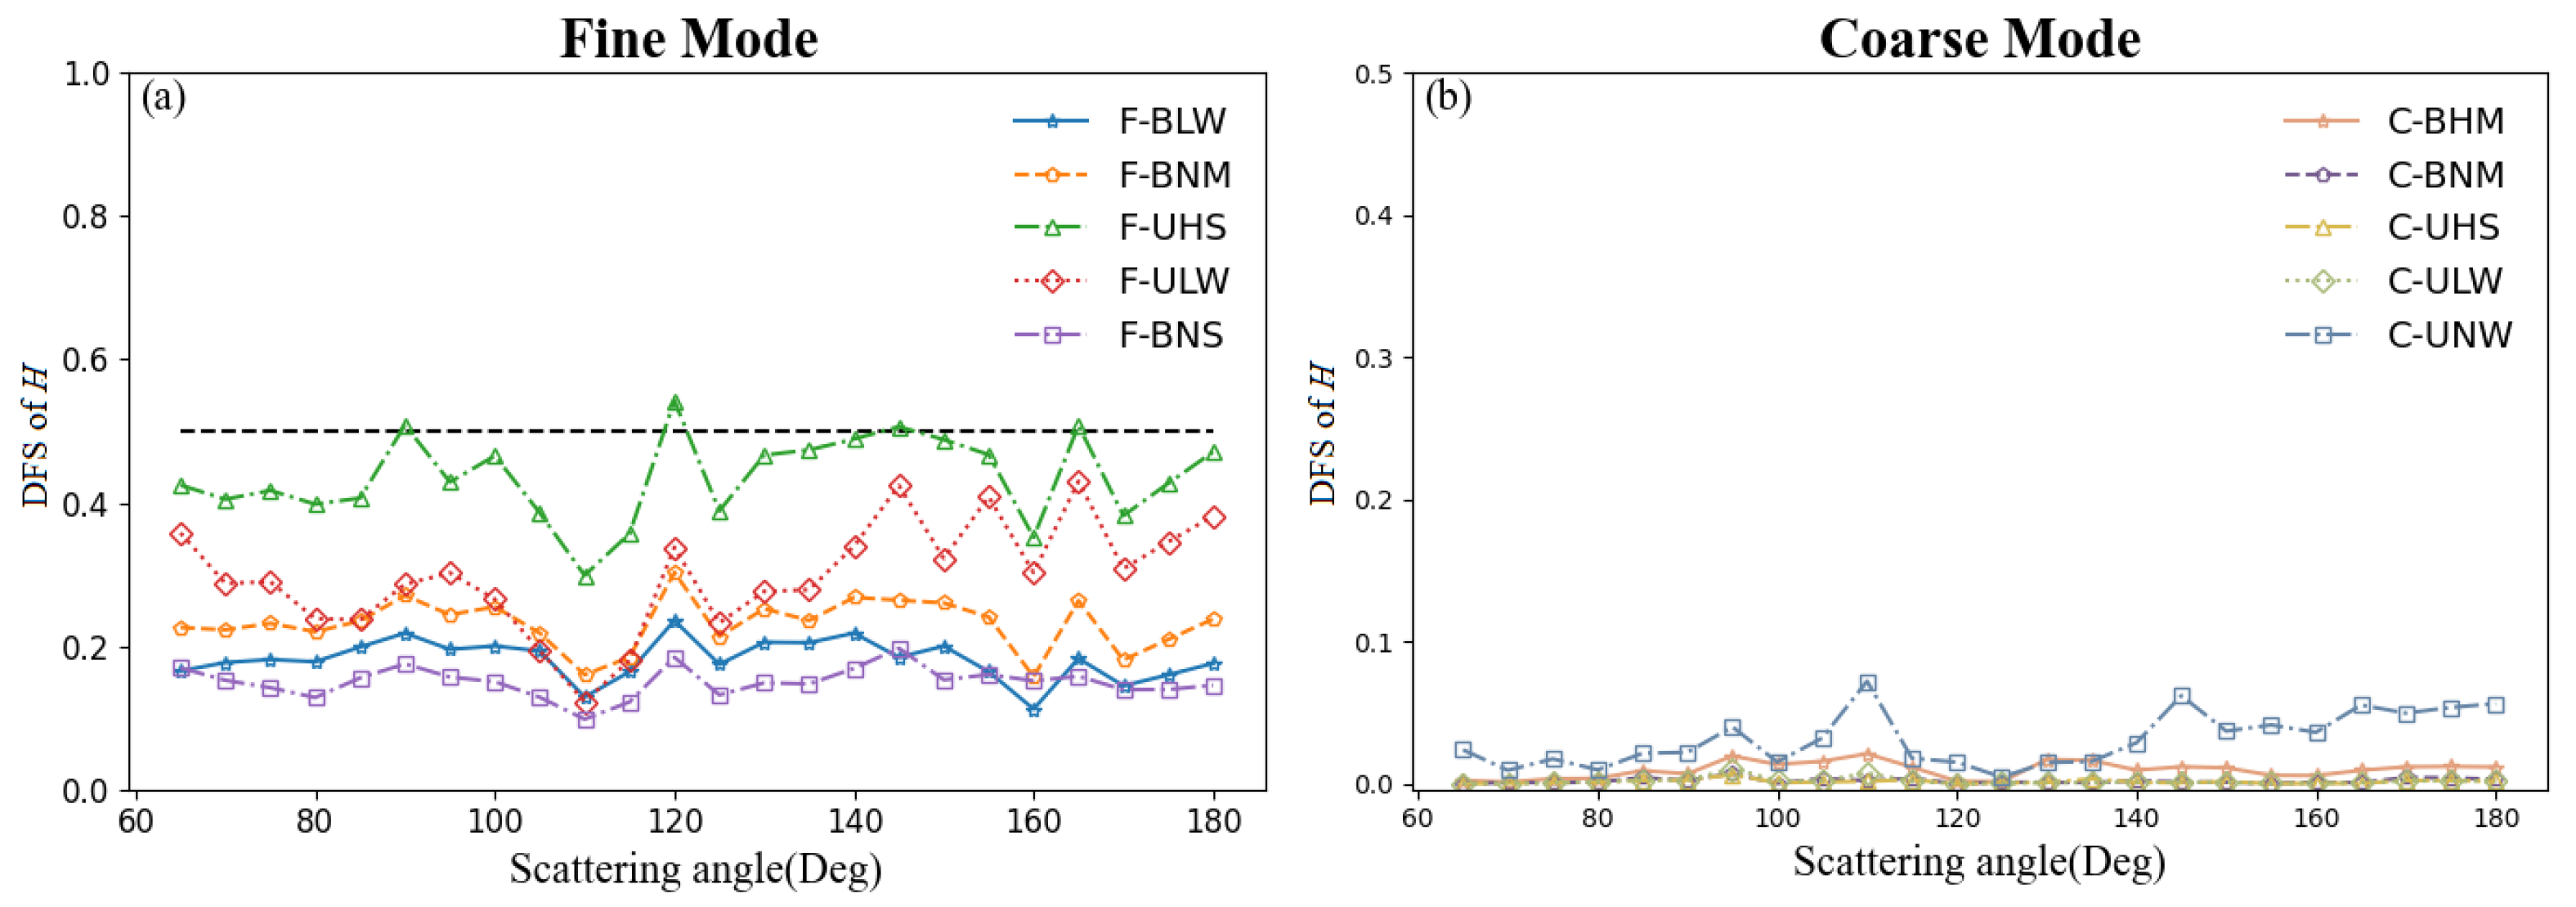
- (1)
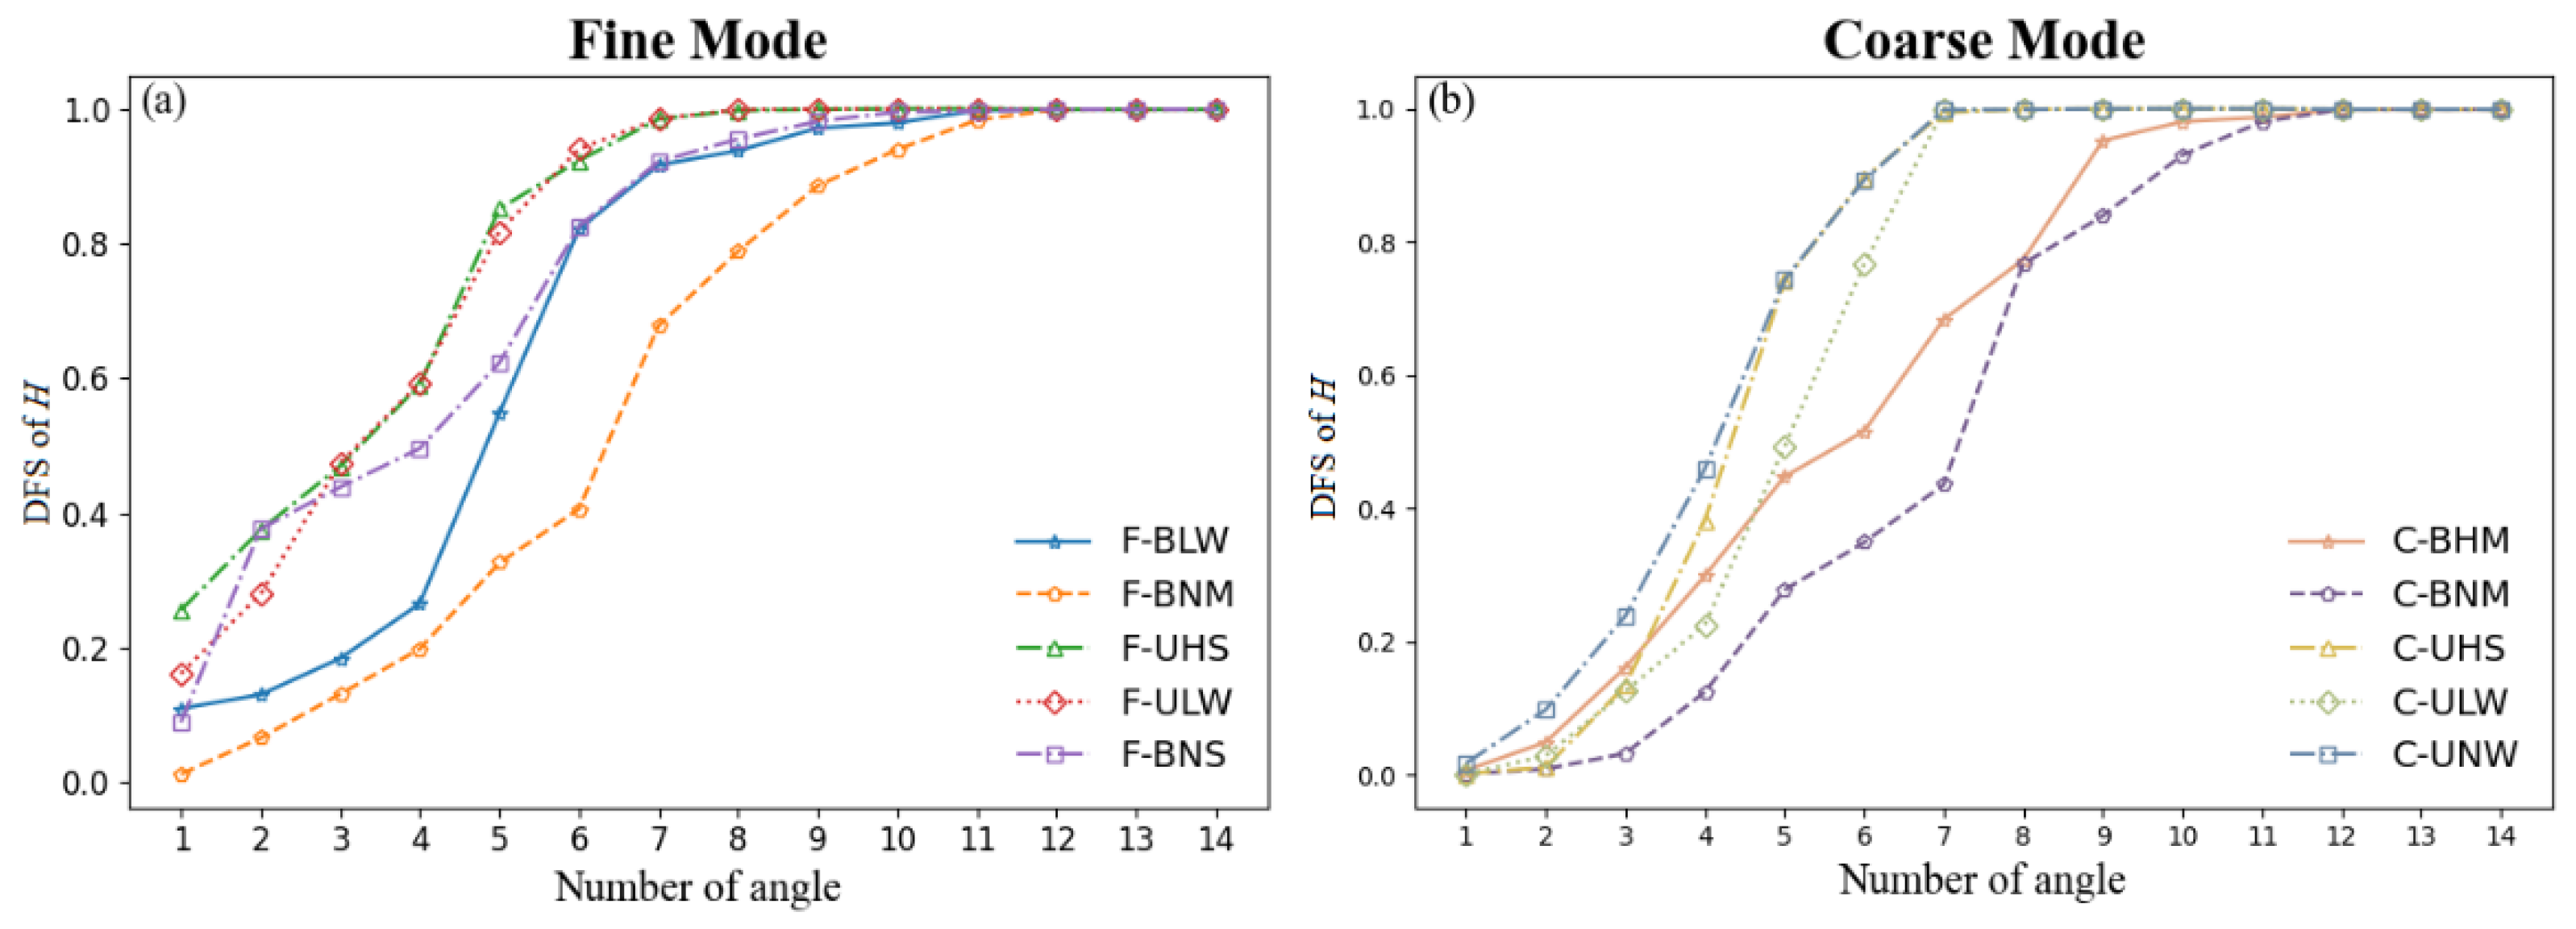
- Figure 8a,b show that the increase in the DFS with the angle number in fine mode is larger than that in coarse mode. When the angle number is 1, even in the F-UHS type with the highest DFS for fine mode, the value is only 0.28. Combined with the single-angle observation presented in Figure 9, it can be seen that, under the same conditions, when the scattering angle is around 90° and F-UHS is 120–150°, the DFS can approach 0.5. In that case, the use of single-angle polarization measurements to retrieve ALH is often limited, so the development of multi-angle polarization sensors has great significance for ALH retrieval in the UV band.
- (2)
- In addition, given the constrained observation period in the actual multi-angle observation mode, if numerous angles focus on the same object, the target’s spatial coverage or the overall number of targets will be decreased [29]. Therefore, it is necessary to find the optimal number of angles to reduce the observation time of each target while maintaining a high level of ALH information. It can be seen that, as the observation angle increases, the increase in DFS gradually decreases, but as the number of observation angles rises from 1 to 5, it basically meets the requirements of ALH retrieval (DFS > 0.5) for the main aerosol models. Even for the two aerosol types with limited polarization enhancement, C-BNM and C-BHM, the DFS is significantly improved when the observation angles increased to about 7–8. This also shows that the multi-angle observation is an effective way to improve the ALH retrieval of weak absorbing aerosol types at the UV band.
- (3)
- As the observation angle continues to increase, the DFS increase gradually slows down with the number of angles and finally converges, which means that as the number of angles continues to increase, the inversion framework constructed in this study is easily extensible. In a future study, we will add to and evaluate the potential for retrieving more aerosol properties from the UV band through the addition of multi-angle measurements.

5.3. The Influence of Model Errors
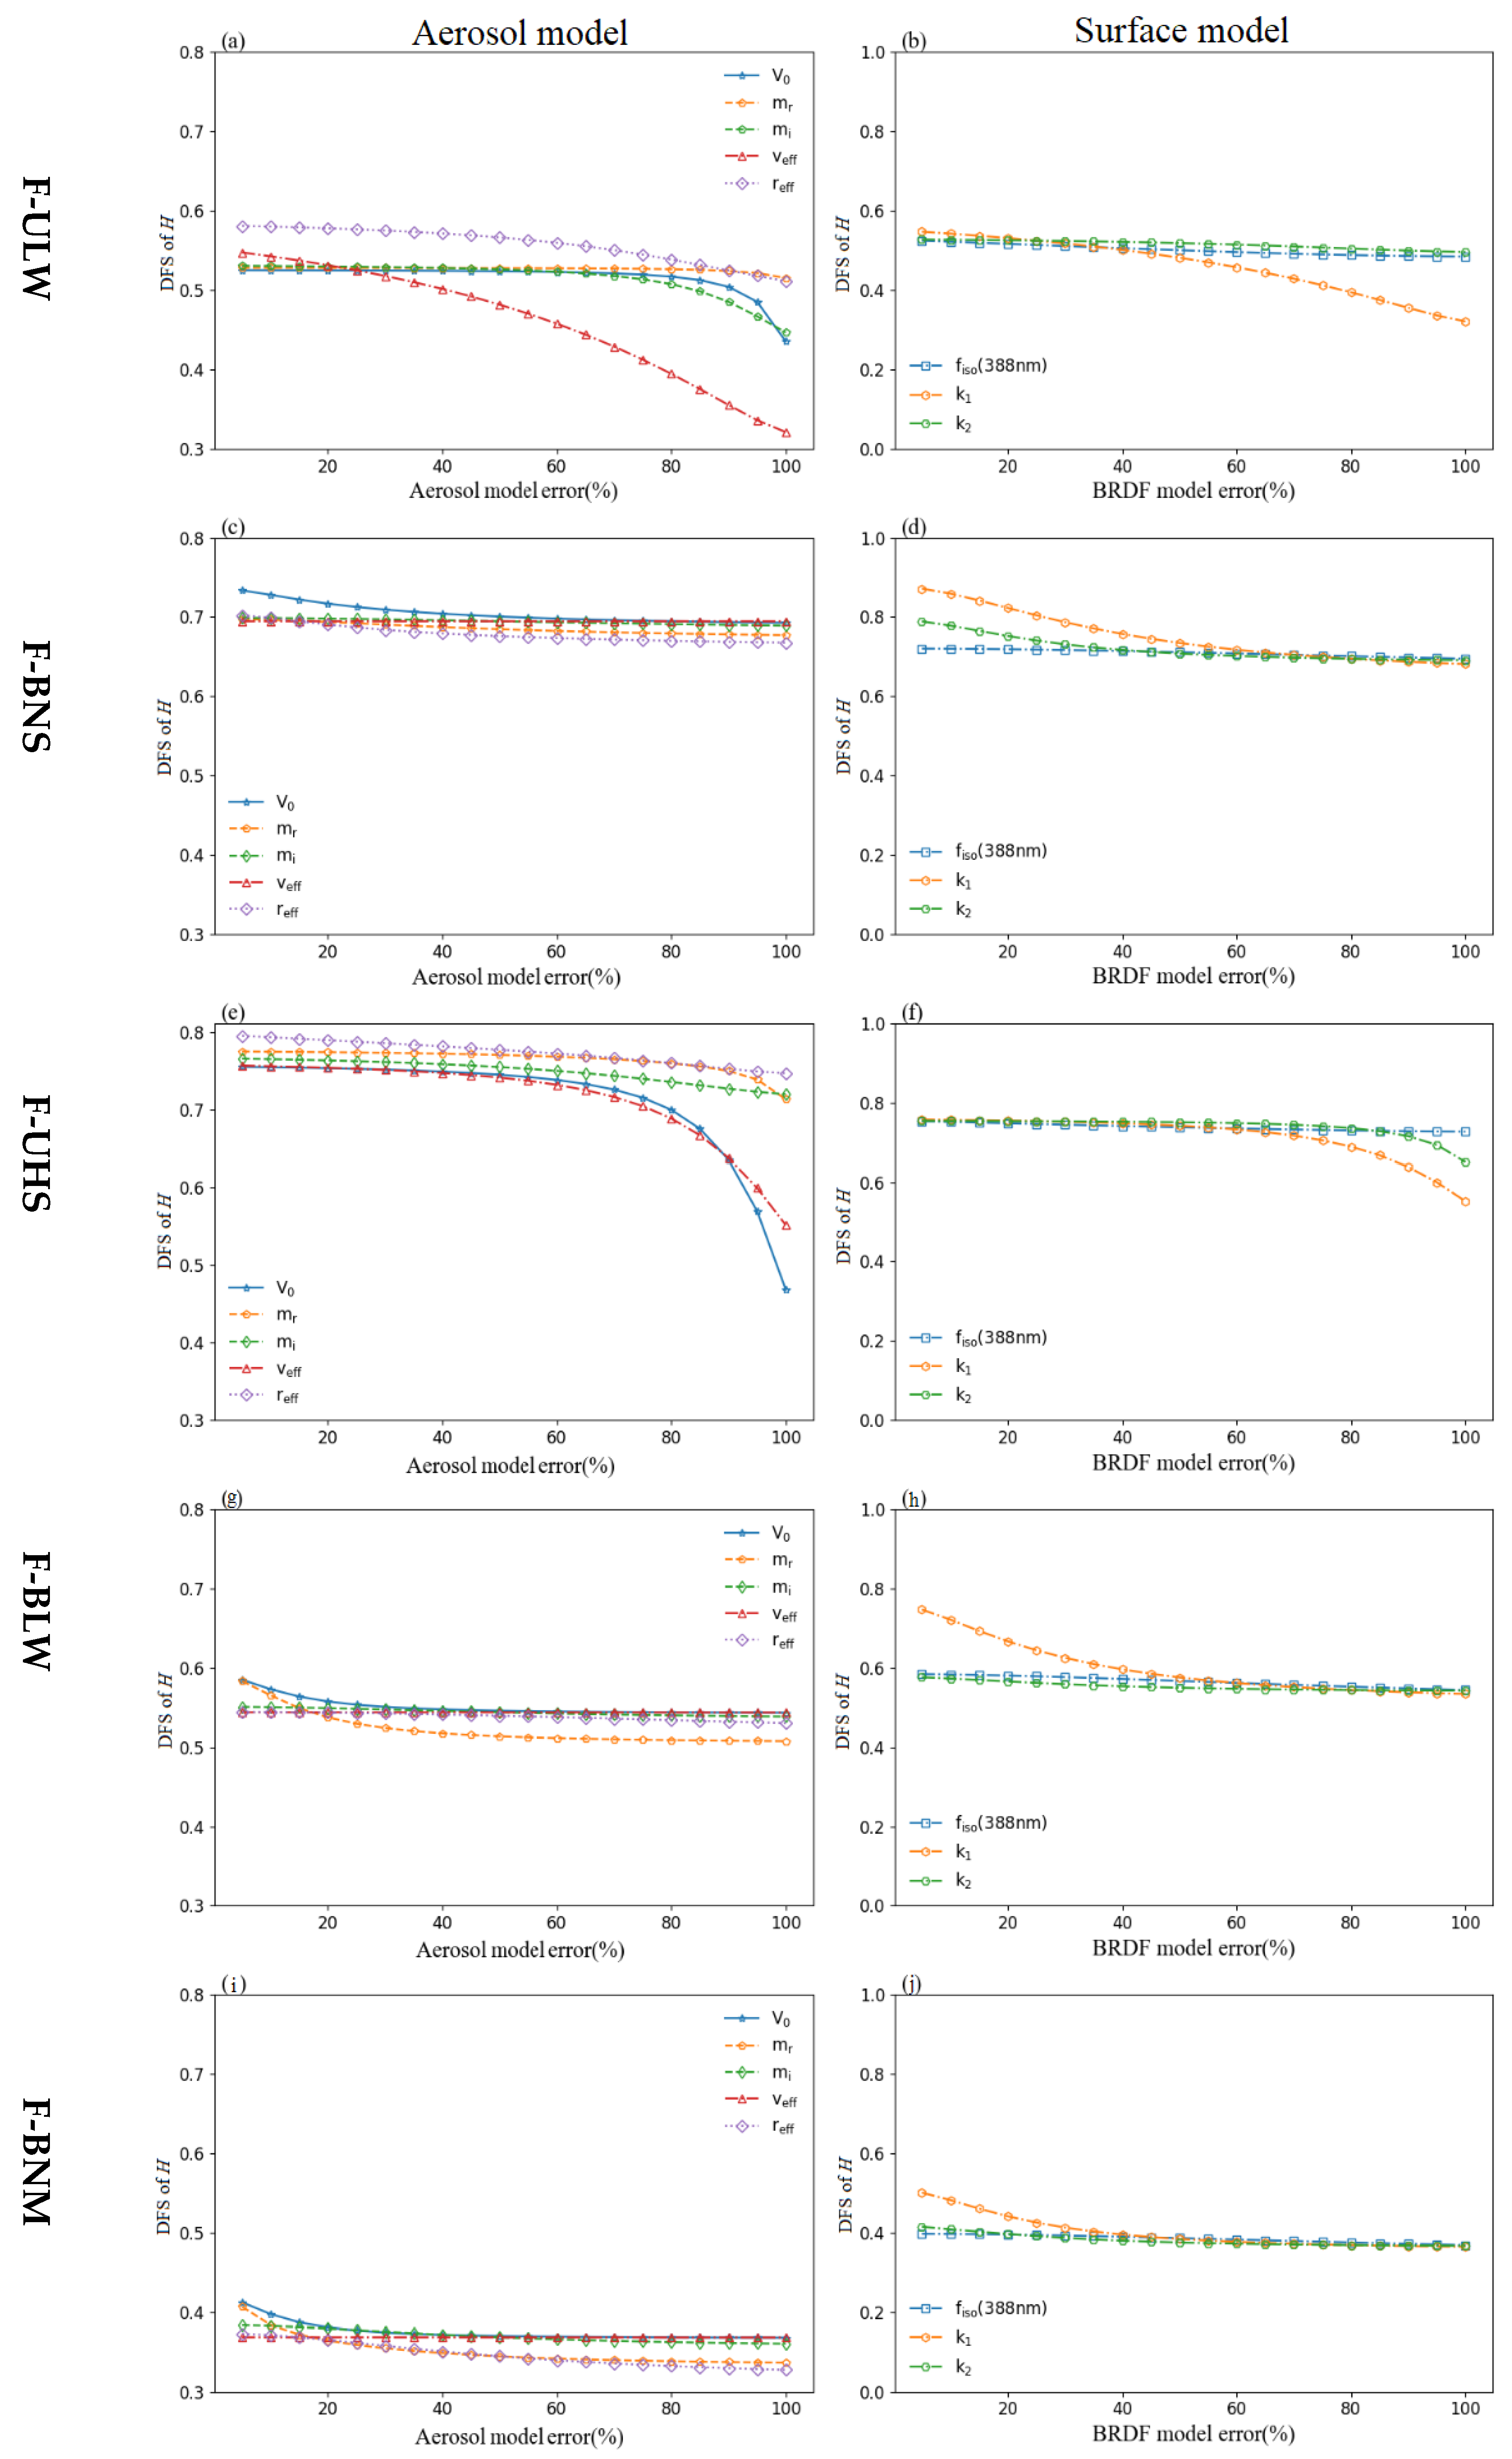
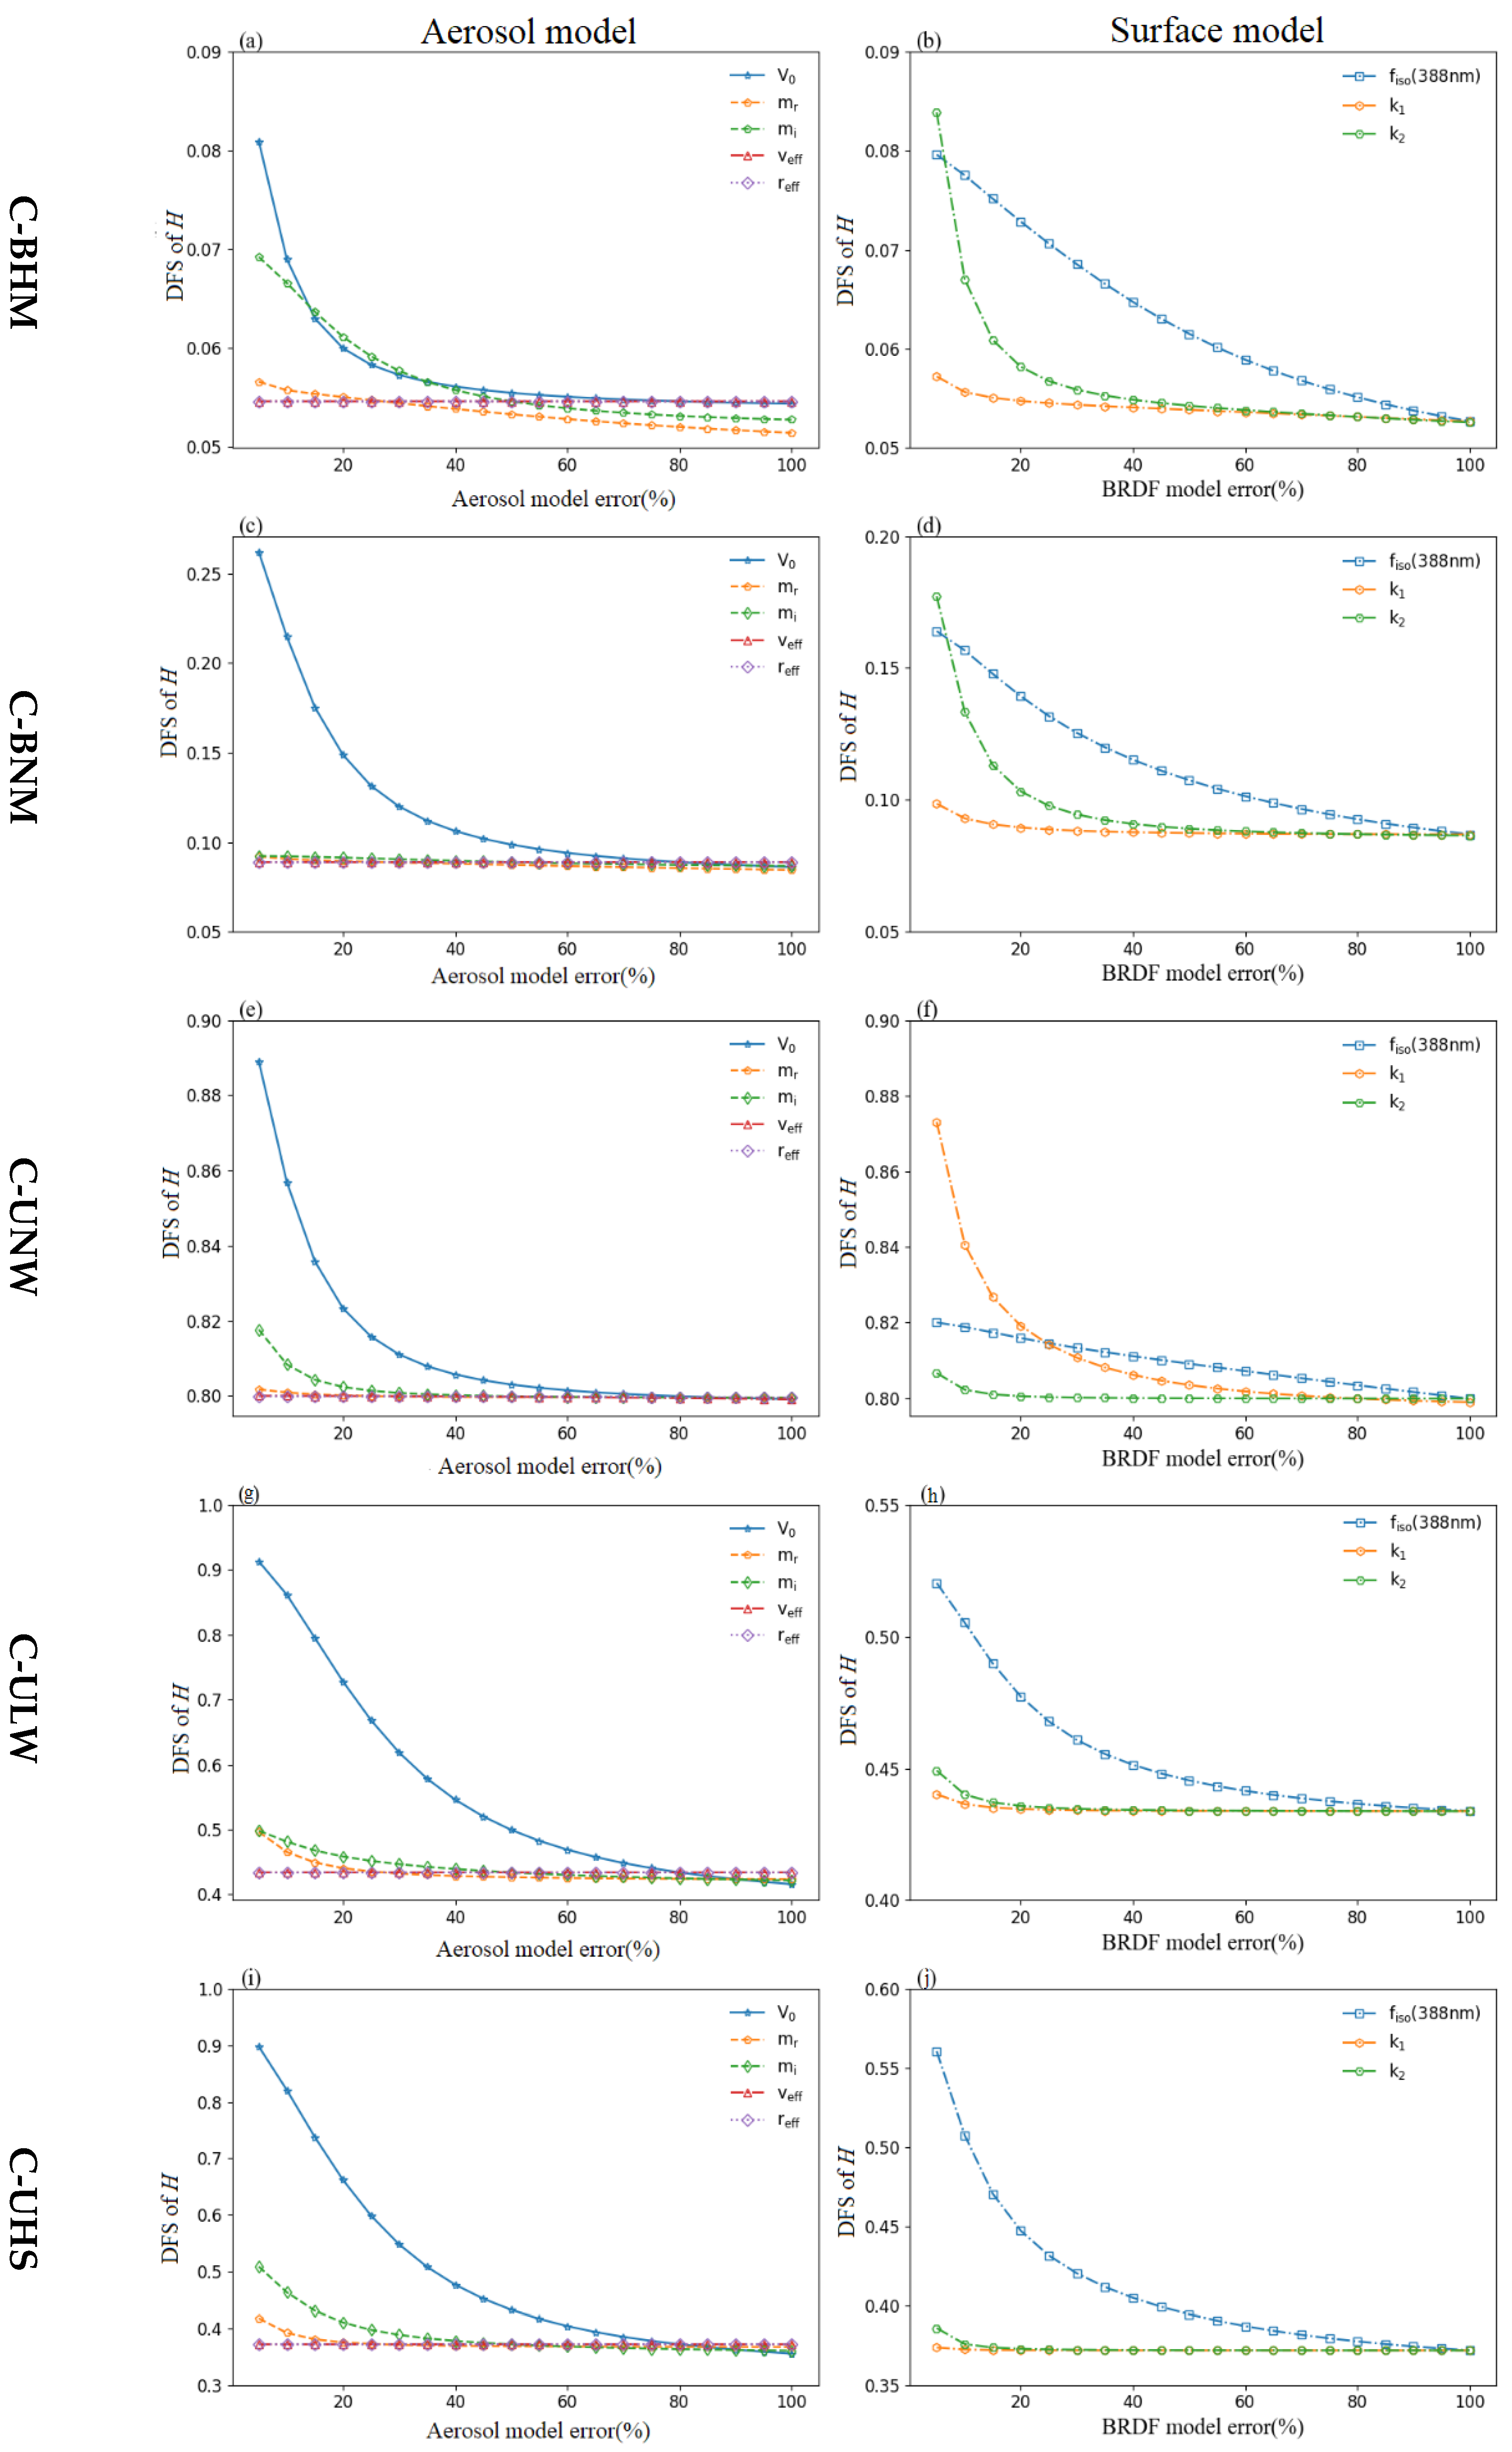
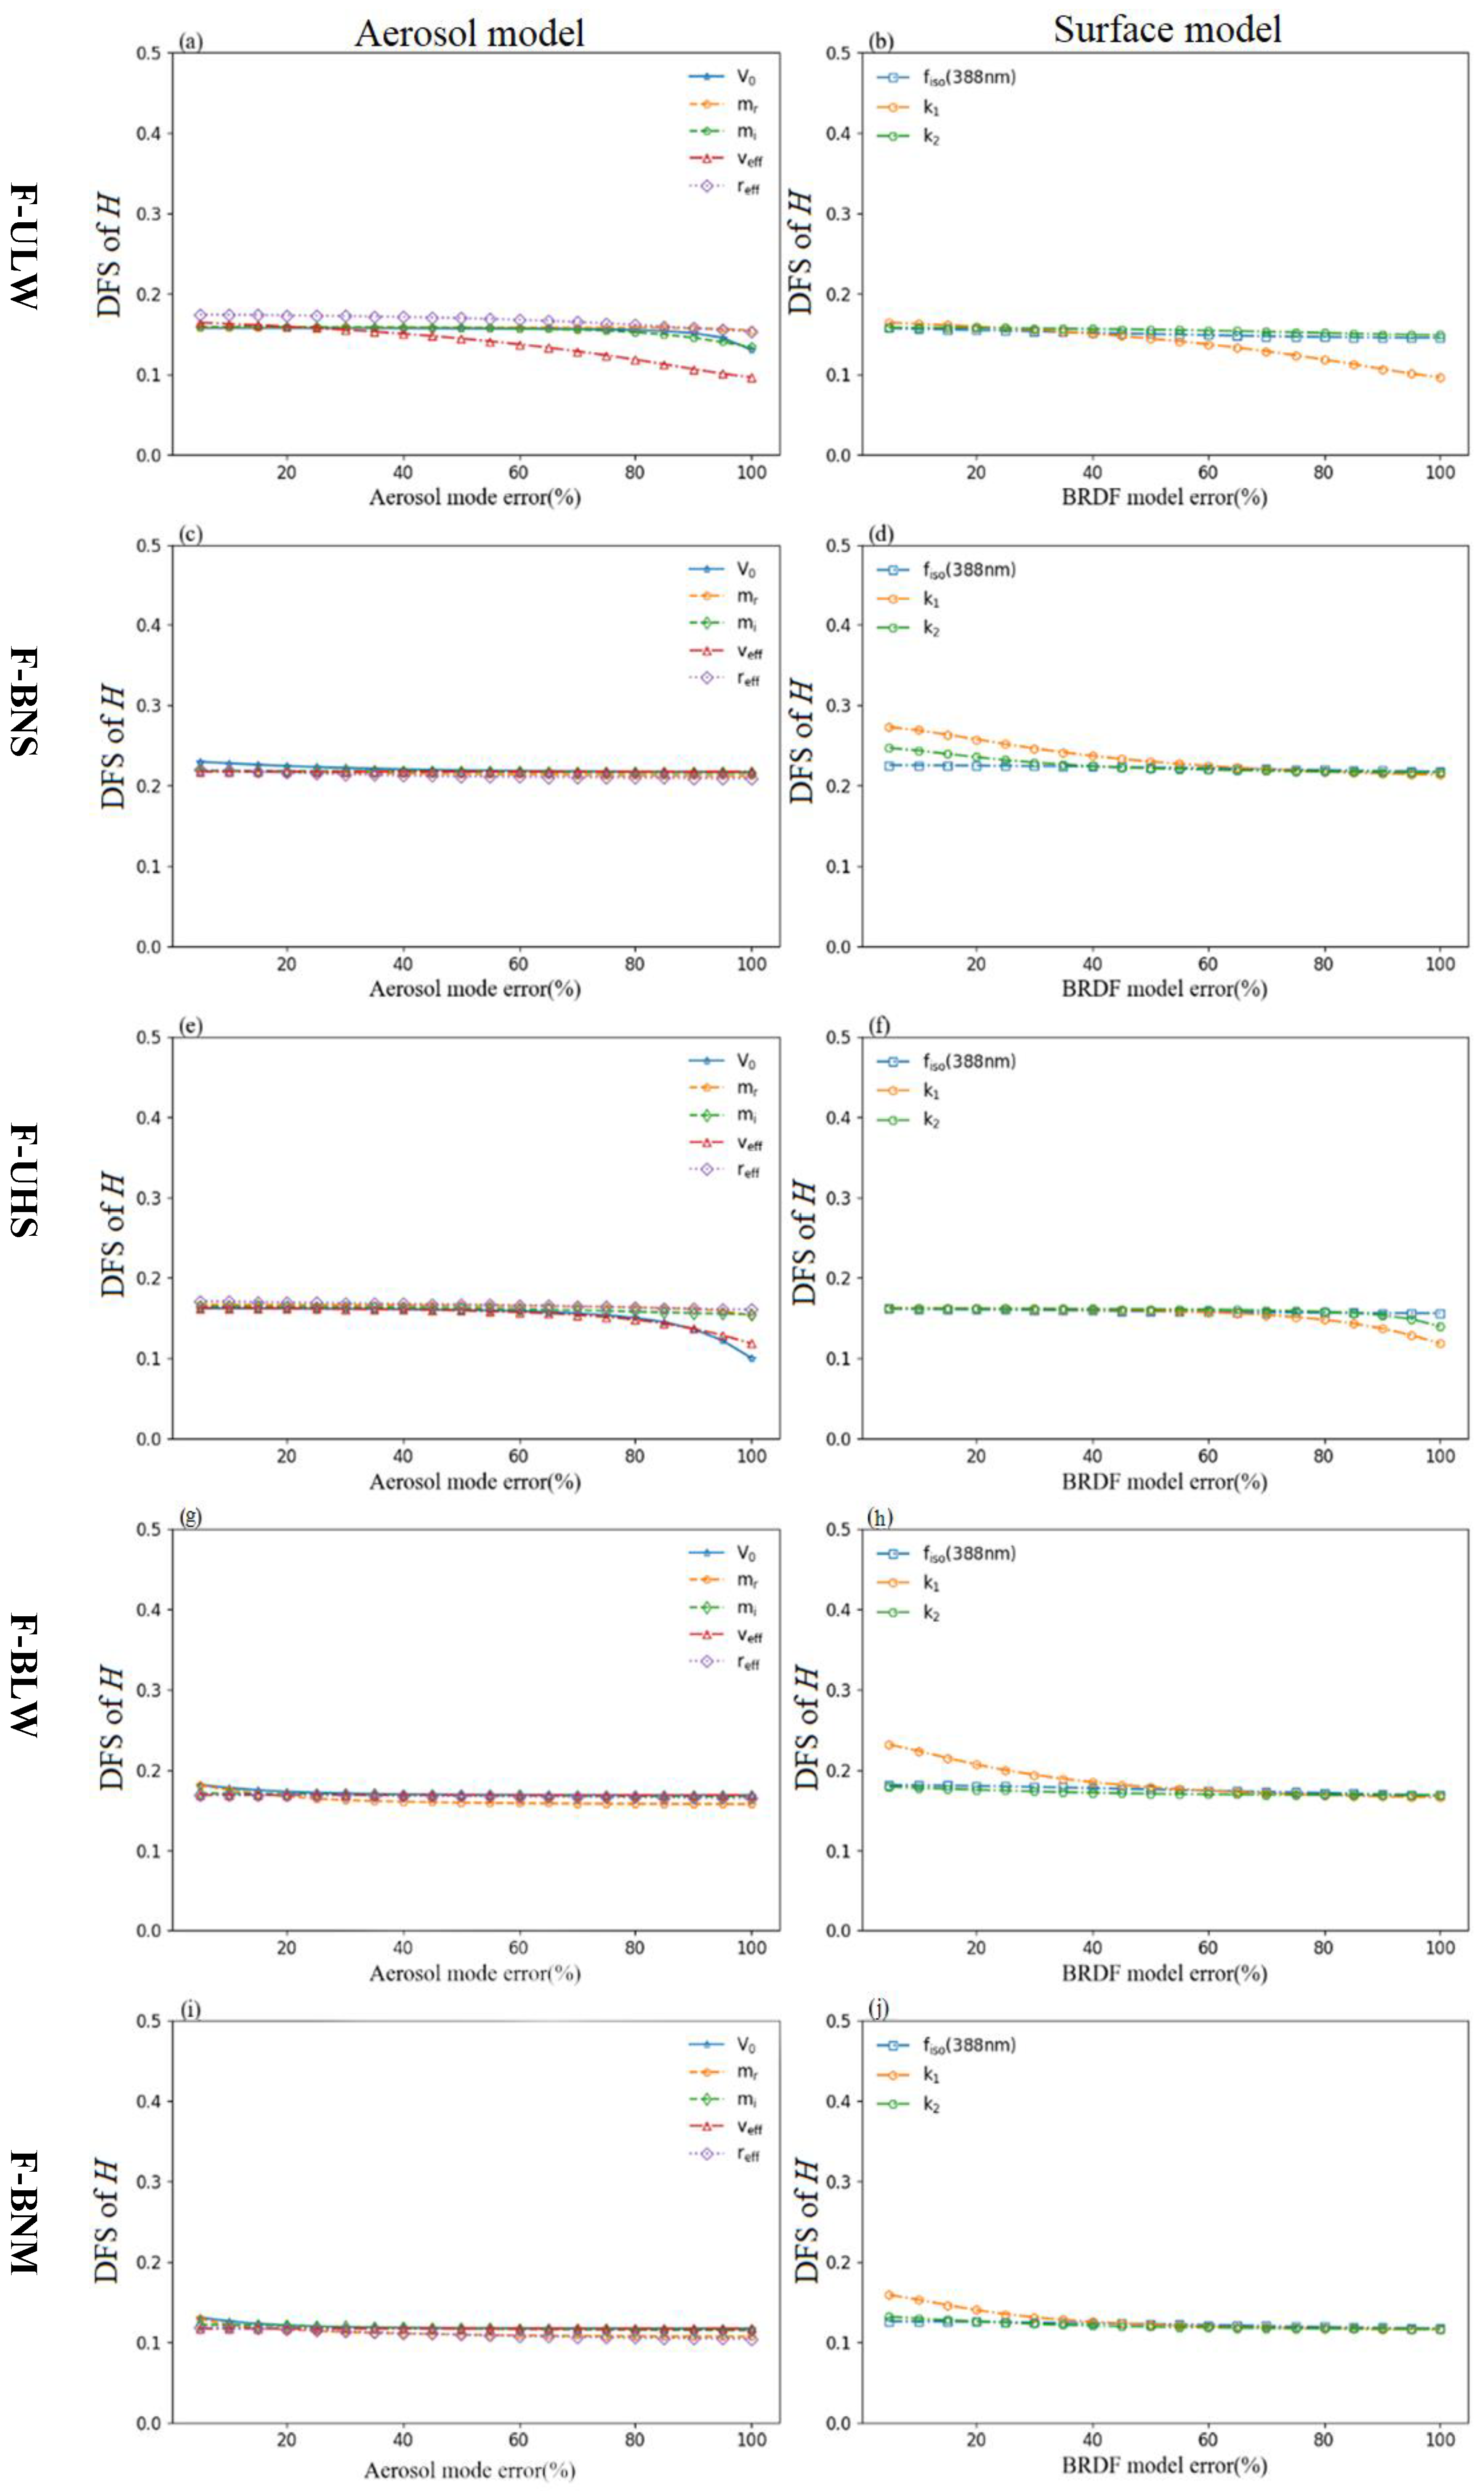
- (1)
- For aerosol model parameters, the F-ULW and F-UHS aerosol types, the total aerosol volume, and the effective radius have the greatest influences, and decreases in DFS are all above 0.3. For the other three fine particle aerosol types, although the real part of the complex refractive index is an important factor that affects the scattering, the difference in DFS caused by the change of aerosol parameters is controlled within 0.1 (Figure 10). However, for the five coarse mode aerosol types, the influence of the total aerosol volume and the imaginary part of refractive index on the DFS occupies the main role (Figure 11).
- (2)
- Similarly, for fine-mode aerosol types, the error of of surface parameters has the greatest influence on the DFS of ALH retrieval. In coarse mode, the DFS is much more affected by the surface BRDF error than the other two parameters.
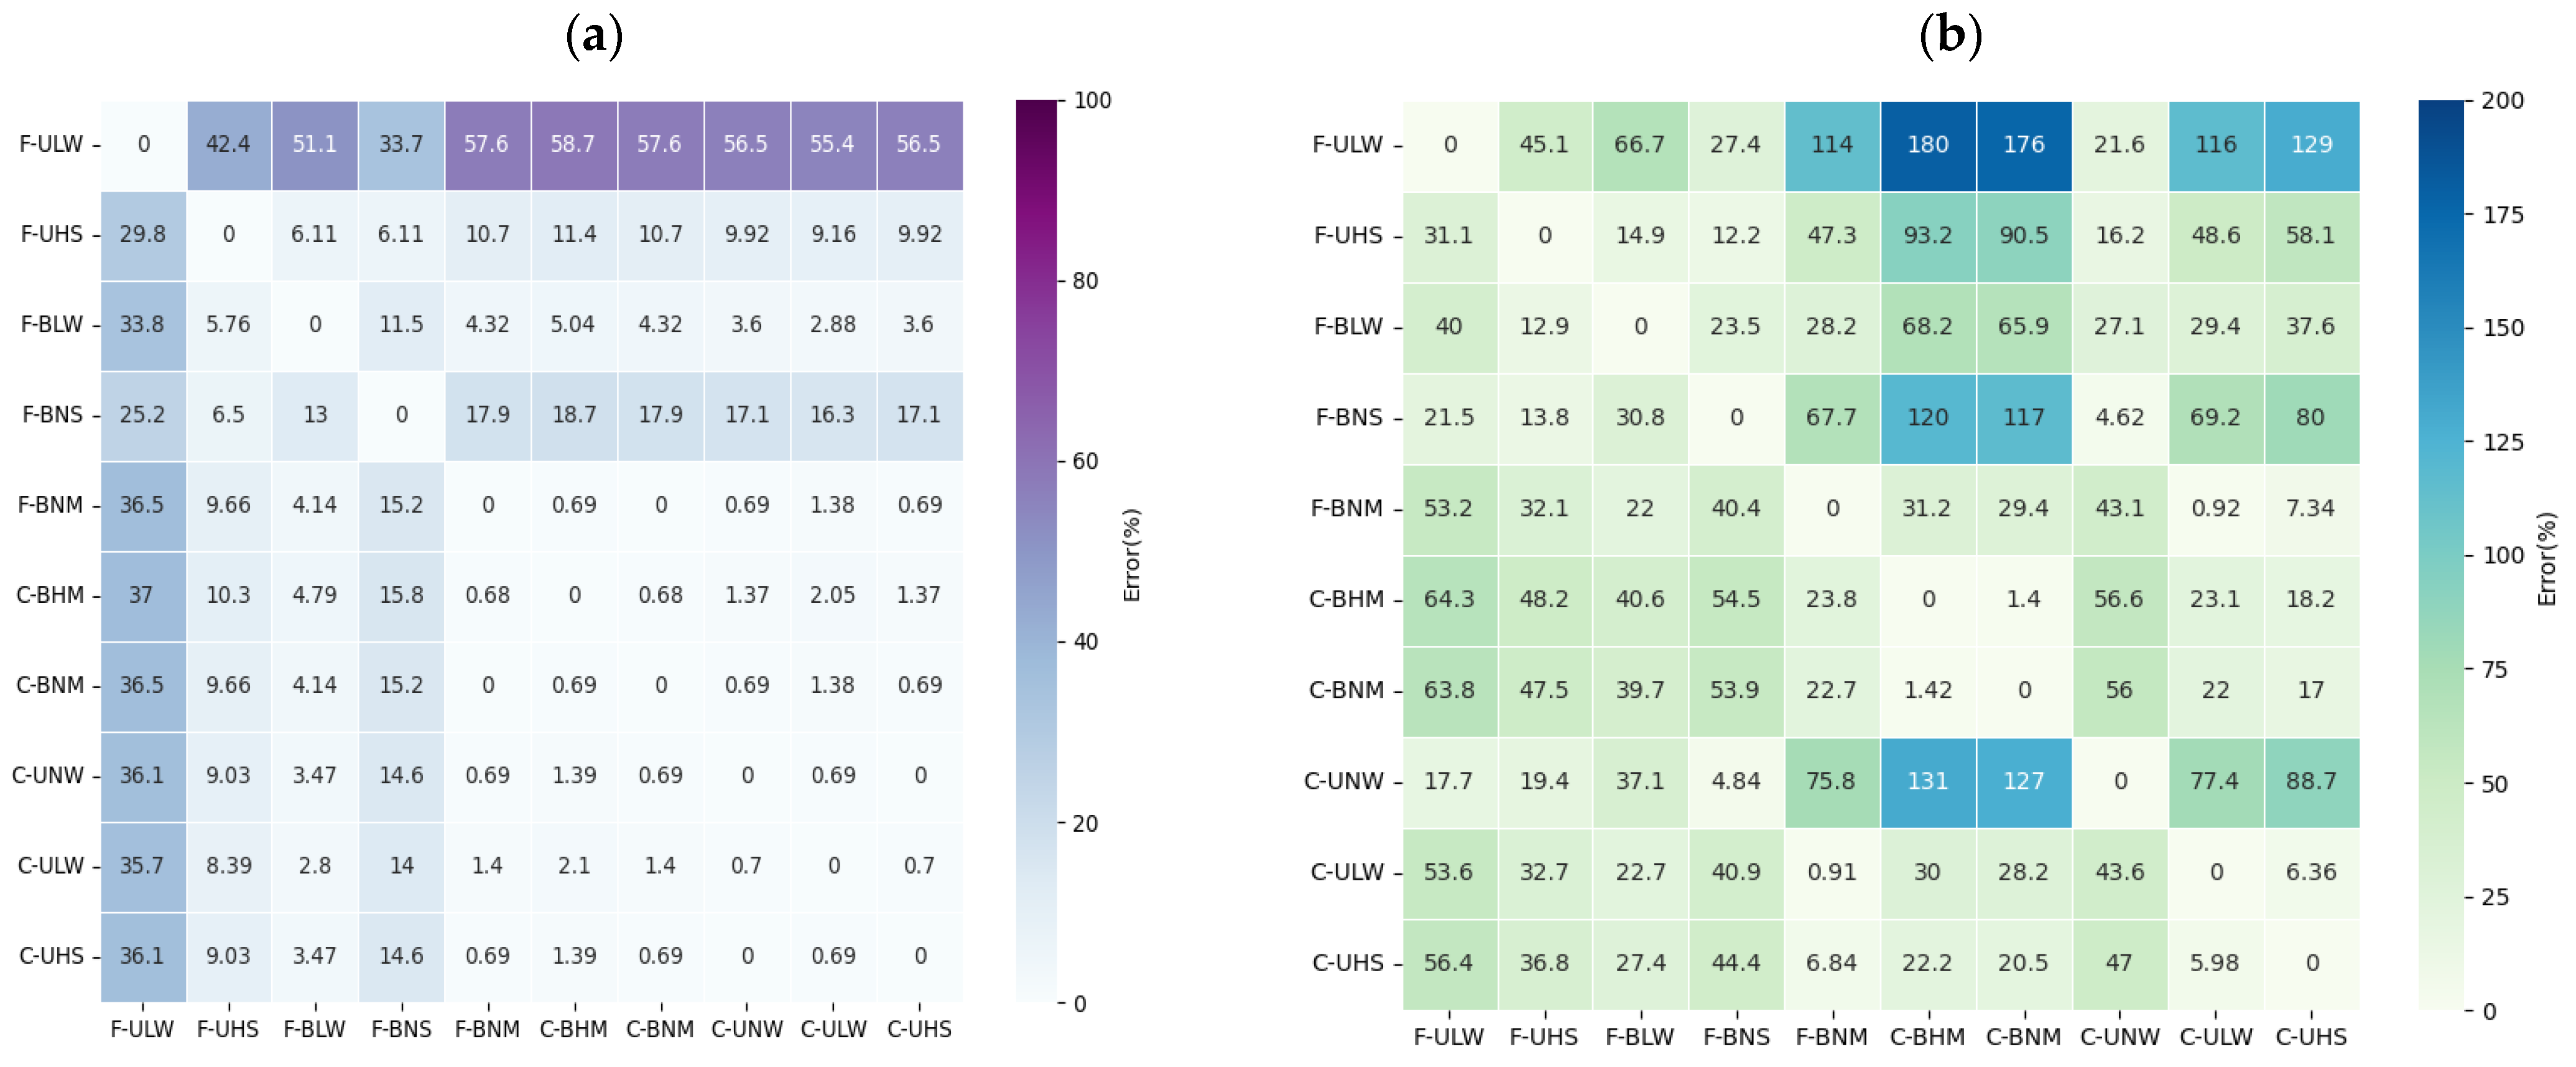
- (3)
- When combined, the aerosol model coappearance probability is greater than 5% (F-ULW, F-UHS, F-BLW, C-BHM, C-UHS and C-ULW). For the ten typical aerosol models used in China, an iteration procedure among several predefined typical aerosol models has been designed to further decrease the probability of choosing a very bad value for the actual retrieval, and priority should be given to reducing the retrieval errors of three key parameters: the aerosol volume column concentration, effective variance, and imaginary part of the refractive index in the aerosol model, as well as the surface BRDF and parameters will effectively improve the DFS of the aerosol retrieval in the UV band.


6. Conclusions
- (1)
- The extended ultraviolet 388 nm band is an important information source for passive remote sensing ALH retrieval. With additional constraints, such as the aerosol single scattering albedo and AOD from independent sources (thought to be obtained by retrieval from other channels), MAPMU can theoretically retrieve ALH under different conditions by combining polarization measurements with multi-angle measurements.
- (2)
- Polarization measurements have important impacts on ALH retrieval at the UV band, but the improvement is different for each typical aerosol model due to their different optical properties. For example, the reduction in posterior uncertainties of ALH retrieval is 6–39% for the fine mode aerosol types following the addition of polarization measurements. However, the improvement for coarse mode aerosol types is relatively small, especially for C-BHM and C-BNM which characterize the types of dust found in North China and have larger median radii and low absorption rates in the UV band. The retrieved reduction of posterior uncertainties is only 1–8%.
- (3)
- Compared with single-angle polarization observations, which have difficulty retrieving the ALH for coarse mode aerosol types, the multi-angle observation mode effectively improves the DFS of ALH retrieval. In particular, for the ALH retrieval of C-BHM and C-BNM, the combination of polarization and multi-angle measurements could be used to improve the aerosol layer height information. When the number of viewing angles is increased to 6, the DFS increment is above 0.4, on average, for different aerosol types.
- (3)
- The predefined model errors include the error of the total aerosol volume and the effective radius and the imaginary part of the complex refractive index as well as the error of the surface reflectivity and the parameter, which will lead to the largest change in the DFS of ALH retrieval. The effect of other parameter errors on the aerosol and surface models is relatively small.
Author Contributions
Funding
Data Availability Statement
Acknowledgments
Conflicts of Interest
Appendix A

| Number | Geometry 1 | Geometry 2 | Geometry 3 | Geometry 4 |
|---|---|---|---|---|
| NO. 1 | [54.12, 64.09, 30.44] | [32.8, 59.78, 104.02] | [53.08, 57.8, 88.40] | [77.63, 61.87, 34.08] |
| NO. 2 | [54.17, 60.77, 26.19] | [32.86, 55.18, 106.99] | [53.13, 52.95, 92.08] | [77.67, 57.78, 30.81] |
| NO. 3 | [54.22, 57.20, 20.87] | [32.92, 49.86, 111.05] | [53.18, 47.42, 97.15] | [77.72, 53.14, 26.5] |
| NO. 4 | [54.27, 53.52, 14.19] | [32.98, 43.81, 116.83] | [53.23, 41.29, 104.48] | [77.76, 47.98, 20.64] |
| NO. 5 | [54.33, 49.95, 5.78] | [33.04, 37.22, 125.53] | [53.28, 34.99, 115.55] | [77.80, 42.47, 12.4] |
| NO. 6 | [54.38, 46.90, 355.42] | [33.10, 30.78, 139.24] | [53.33, 29.63, 132.40] | [77.85, 37.15, 0.65] |
| NO. 7 | [54.43, 44.89, 343.23] | [33.16, 26.16, 160.34] | [53.38, 27.11, 155.45] | [77.89, 33.09, 344.34] |
| NO. 8 | [54.48, 44.39, 330.03] | [33.22, 25.59, 186.76] | [53.43, 28.80, 179.32] | [77.94, 31.67, 324.35] |
| NO. 9 | [54.53, 45.52, 317.10] | [33.28, 29.43, 209.63] | [53.48, 33.72, 197.55] | [77.90, 33.52, 304.71] |
| NO. 10 | [54.58, 47.99, 305.6] | [33.34, 35.61, 224.89] | [53.53, 39.92, 209.64] | [78.03, 37.83, 289.07] |
| NO. 11 | [54.63, 51.28, 296.03] | [33.4, 42.23, 234.53] | [53.58, 46.11, 217.59] | [78.08, 43.20, 277.9] |
| NO. 12 | [54.69, 54.92, 288.36] | [33.47, 48.42, 240.86] | [53.64, 51.76, 223.04] | [78.12, 48.65, 270.06] |
| NO. 13 | [54.74, 58.56, 282.26] | [33.53, 53.89, 245.23] | [53.69, 56.74, 226.94] | [78.17, 53.73, 264.45] |
| NO. 14 | [54.79, 62.01, 277.41] | [33.59, 58.64, 248.41] | [53.74, 61.06, 229.85] | [78.21, 59.06, 257.35] |
Appendix B

References
- Mishra, A.K.; Koren, I.; Rudich, Y. Effect of Aerosol Vertical Distribution on Aerosol-Radiation Interaction: A Theoretical Prospect. Heliyon 2015, 1, e00036. [Google Scholar] [CrossRef] [Green Version]
- Gordon, H.R. Atmospheric Correction of Ocean Color Imagery in the Earth Observing System Era. J. Geophys. Res. 1997, 102, 17081–17106. [Google Scholar] [CrossRef]
- Duforêt, L.; Frouin, R.; Dubuisson, P. Importance and Estimation of Aerosol Vertical Structure in Satellite Ocean-Color Remote Sensing. Appl. Opt. 2007, 46, 1107. [Google Scholar] [CrossRef] [PubMed] [Green Version]
- Butz, A.; Guerlet, S.; Hasekamp, O.; Schepers, D.; Galli, A.; Aben, I.; Frankenberg, C.; Hartmann, J.-M.; Tran, H.; Kuze, A.; et al. Toward Accurate CO2 and CH4 Observations from GOSAT: GOSAT CO2 AND CH4 VALIDATION. Geophys. Res. Lett. 2011, 38, n/a-n/a. [Google Scholar] [CrossRef] [Green Version]
- Zhang, Y.; Li, Z. Remote Sensing of Atmospheric Fine Particulate Matter (PM2.5) Mass Concentration near the Ground from Satellite Observation. Remote Sens. Environ. 2015, 160, 252–262. [Google Scholar] [CrossRef]
- Wang, H.; Li, Z.; Lv, Y.; Xu, H.; Li, K.; Li, D.; Hou, W.; Zheng, F.; Wei, Y.; Ge, B. Observational Study of Aerosol-Induced Impact on Planetary Boundary Layer Based on Lidar and Sunphotometer in Beijing. Environ. Pollut. 2019, 252, 897–906. [Google Scholar] [CrossRef]
- Hou, W.Z.; Wang, H.F.; Li, Z.Q.; Qie, L.L.; Ge, B.Y.; Fan, C.; Li, S. PRELIMINARY SENSITIVITY STUDY OF AEROSOL LAYER HEIGHT FROM SYNTHETIC MULTIANGLE POLARIMETRIC REMOTE SENSING MEASUREMENTS. Int. Arch. Photogramm. Remote Sens. Spat. Inf. Sci. 2019, XLII-3/W9, 63–69. [Google Scholar] [CrossRef] [Green Version]
- Kahn, R.A.; Chen, Y.; Nelson, D.L.; Leung, F.-Y.; Li, Q.; Diner, D.J.; Logan, J.A. Wildfire Smoke Injection Heights: Two Perspectives from Space. Geophys. Res. Lett. 2008, 35, L04809. [Google Scholar] [CrossRef] [Green Version]
- Yang, Z.; Wang, J.; Ichoku, C.; Hyer, E.; Zeng, J. Mesoscale Modeling and Satellite Observation of Transport and Mixing of Smoke and Dust Particles over Northern Sub-Saharan African Region: DUST AND SMOKE MIXING OVER SAHEL. J. Geophys. Res. Atmos. 2013, 118, 12139–12157. [Google Scholar] [CrossRef] [Green Version]
- Wu, L.; Hasekamp, O.; van Diedenhoven, B.; Cairns, B.; Yorks, J.E.; Chowdhary, J. Passive Remote Sensing of Aerosol Layer Height Using Near-UV Multiangle Polarization Measurements. Geophys. Res. Lett. 2016, 43, 8783–8790. [Google Scholar] [CrossRef]
- Yu, H.; Chin, M.; Winker, D.M.; Omar, A.H.; Liu, Z.; Kittaka, C.; Diehl, T. Global View of Aerosol Vertical Distributions from CALIPSO Lidar Measurements and GOCART Simulations: Regional and Seasonal Variations. J. Geophys. Res. 2010, 115, D00H30. [Google Scholar] [CrossRef] [Green Version]
- Winker, D.M.; Vaughan, M.A.; Omar, A.; Hu, Y.; Powell, K.A.; Liu, Z.; Hunt, W.H.; Young, S.A. Overview of the CALIPSO Mission and CALIOP Data Processing Algorithms. J. Atmos. Ocean. Technol. 2009, 26, 2310–2323. [Google Scholar] [CrossRef]
- Zeng, J.; Han, Q.; Wang, J. High-Spectral Resolution Simulation of Polarization of Skylight: Sensitivity to Aerosol Vertical Profile. Geophys. Res. Lett. 2008, 35, L20801. [Google Scholar] [CrossRef] [Green Version]
- Chen, X.; Wang, J.; Xu, X.; Zhou, M.; Zhang, H.; Castro Garcia, L.; Colarco, P.R.; Janz, S.J.; Yorks, J.; McGill, M.; et al. First Retrieval of Absorbing Aerosol Height over Dark Target Using TROPOMI Oxygen B Band: Algorithm Development and Application for Surface Particulate Matter Estimates. Remote Sens. Environ. 2021, 265, 112674. [Google Scholar] [CrossRef]
- Fisher, D.; Muller, J.-P.; Yershov, V.N. Automated Stereo Retrieval of Smoke Plume Injection Heights and Retrieval of Smoke Plume Masks from AATSR and Their Assessment with CALIPSO and MISR. IEEE Trans. Geosci. Remote Sens. 2014, 52, 1249–1258. [Google Scholar] [CrossRef]
- Zakšek, K.; Hort, M.; Zaletelj, J.; Langmann, B. Monitoring Volcanic Ash Cloud Top Height through Simultaneous Retrieval of Optical Data from Polar Orbiting and Geostationary Satellites. Atmos. Chem. Phys. 2013, 13, 2589–2606. [Google Scholar] [CrossRef] [Green Version]
- Hasekamp, O.P.; Landgraf, J. Retrieval of Aerosol Properties over the Ocean from Multispectral Single-Viewing-Angle Measurements of Intensity and Polarization: Retrieval Approach, Information Content, and Sensitivity Study. J. Geophys. Res. 2005, 110, D20207. [Google Scholar] [CrossRef]
- Kalashnikova, O.V.; Garay, M.J.; Davis, A.B.; Diner, D.J.; Martonchik, J.V. Sensitivity of Multi-Angle Photo-Polarimetry to Vertical Layering and Mixing of Absorbing Aerosols: Quantifying Measurement Uncertainties. J. Quant. Spectrosc. Radiat. Transf. 2011, 112, 2149–2163. [Google Scholar] [CrossRef]
- Torres, O.; Tanskanen, A.; Veihelmann, B.; Ahn, C.; Braak, R.; Bhartia, P.K.; Veefkind, P.; Levelt, P. Aerosols and Surface UV Products from Ozone Monitoring Instrument Observations: An Overview. J. Geophys. Res. 2007, 112, D24S47. [Google Scholar] [CrossRef] [Green Version]
- Lei, X.; Zhu, S.; Li, Z.; Hong, J.; Liu, Z.; Tao, F.; Zou, P.; Song, M.; Li, C. Integration Model of POSP Measurement Spatial Response Function. Opt. Express 2020, 28, 25480. [Google Scholar] [CrossRef]
- Lei, X.; Liu, Z.; Tao, F.; Hou, W.; Huang, H.; Xie, Y.; Zhao, X.; Dong, H.; Zou, P.; Song, M.; et al. Geolocation Error Estimation Method for the Wide Swath Polarized Scanning Atmospheric Corrector Onboard HJ-2 A/B Satellites. IEEE Trans. Geosci. Remote Sens. 2022, 60, 1–9. [Google Scholar] [CrossRef]
- Li, Z.; Xie, Y.; Hou, W.; Liu, Z.; Bai, Z.; Hong, J.; Ma, Y.; Huang, H.; Lei, X.; Sun, X.; et al. In-Orbit Test of the Polarized Scanning Atmospheric Corrector (PSAC) Onboard Chinese Environmental Protection and Disaster Monitoring Satellite Constellation HJ-2 A/B. IEEE Trans. Geosci. Remote Sens. 2022, 60, 1–17. [Google Scholar] [CrossRef]
- Shi, Z.; Li, Z.; Hou, W.; Mei, L.; Sun, L.; Jia, C.; Zhang, Y.; Li, K.; Xu, H.; Liu, Z.; et al. Aerosol Optical Depth Retrieval Based on Neural Network Model Using Polarized Scanning Atmospheric Corrector (PSAC) Data. IEEE Trans. Geosci. Remote Sens. 2022, 60, 1–18. [Google Scholar] [CrossRef]
- Ge, B.; Li, Z.; Chen, C.; Hou, W.; Xie, Y.; Zhu, S.; Qie, L.; Zhang, Y.; Li, K.; Xu, H.; et al. An Improved Aerosol Optical Depth Retrieval Algorithm for Multiangle Directional Polarimetric Camera (DPC). Remote Sens. 2022, 14, 4045. [Google Scholar] [CrossRef]
- Satheesh, S.K.; Torres, O.; Remer, L.A.; Babu, S.S.; Vinoj, V.; Eck, T.F.; Kleidman, R.G.; Holben, B.N. Improved Assessment of Aerosol Absorption Using OMI-MODIS Joint Retrieval. J. Geophys. Res. 2009, 114, D05209. [Google Scholar] [CrossRef] [Green Version]
- Rodgers, C.D. Inverse Methods for Atmospheric Sounding: Theory and Practice; World Scientific: Singapore, 2000; ISBN 978-981-4498-68-5. [Google Scholar]
- Hou, W.; Wang, J.; Xu, X.; Reid, J.S.; Han, D. An Algorithm for Hyperspectral Remote Sensing of Aerosols: 1. Development of Theoretical Framework. J. Quant. Spectrosc. Radiat. Transf. 2016, 178, 400–415. [Google Scholar] [CrossRef]
- Hou, W.; Wang, J.; Xu, X.; Reid, J.S. An Algorithm for Hyperspectral Remote Sensing of Aerosols: 2. Information Content Analysis for Aerosol Parameters and Principal Components of Surface Spectra. J. Quant. Spectrosc. Radiat. Transf. 2017, 192, 14–29. [Google Scholar] [CrossRef]
- Chen, X.; Xu, X.; Wang, J.; Diner, D.J. Can Multi-Angular Polarimetric Measurements in the Oxygen-A and B Bands Improve the Retrieval of Aerosol Vertical Distribution? J. Quant. Spectrosc. Radiat. Transf. 2021, 270, 107679. [Google Scholar] [CrossRef]
- Zhu, Y.; Gelaro, R. Observation Sensitivity Calculations Using the Adjoint of the Gridpoint Statistical Interpolation (GSI) Analysis System. Mon. Weather Rev. 2008, 136, 335–351. [Google Scholar] [CrossRef]
- Mlawer, E.J.; Payne, V.H.; Moncet, J.-L.; Delamere, J.S.; Alvarado, M.J.; Tobin, D.C. Development and Recent Evaluation of the MT_CKD Model of Continuum Absorption. Phil. Trans. R. Soc. A. 2012, 370, 2520–2556. [Google Scholar] [CrossRef]
- Xu, X.; Wang, J. UNL-VRTM, A Testbed for Aerosol Remote Sensing: Model Developments and Applications. In Springer Series in Light Scattering; Kokhanovsky, A., Ed.; Springer Series in Light Scattering; Springer International Publishing: Cham, Switzerland, 2019; pp. 1–69. ISBN 978-3-030-20586-7. [Google Scholar]
- Hess, M.; Koepke, P.; Schult, I. Optical Properties of Aerosols and Clouds: The Software Package OPAC. Bull. Amer. Meteor. Soc. 1998, 79, 831–844. [Google Scholar] [CrossRef]
- Hou, W.; Wang, J.; Xu, X.; Reid, J.S.; Janz, S.J.; Leitch, J.W. An Algorithm for Hyperspectral Remote Sensing of Aerosols: 3. Application to the GEO-TASO Data in KORUS-AQ Field Campaign. J. Quant. Spectrosc. Radiat. Transf. 2020, 253, 107161. [Google Scholar] [CrossRef]
- Li, Z.; Zhang, Y.; Xu, H.; Li, K.; Dubovik, O.; Goloub, P. The Fundamental Aerosol Models Over China Region: A Cluster Analysis of the Ground-Based Remote Sensing Measurements of Total Columnar Atmosphere. Geophys. Res. Lett. 2019, 46, 4924–4932. [Google Scholar] [CrossRef]
- Wang, J.; Xu, X.; Ding, S.; Zeng, J.; Spurr, R.; Liu, X.; Chance, K.; Mishchenko, M. A Numerical Testbed for Remote Sensing of Aerosols, and Its Demonstration for Evaluating Retrieval Synergy from a Geostationary Satellite Constellation of GEO-CAPE and GOES-R. J. Quant. Spectrosc. Radiat. Transf. 2014, 146, 510–528. [Google Scholar] [CrossRef] [Green Version]
- Li, Z.; Hou, W.; Hong, J.; Zheng, F.; Luo, D.; Wang, J.; Gu, X.; Qiao, Y. Directional Polarimetric Camera (DPC): Monitoring Aerosol Spectral Optical Properties over Land from Satellite Observation. J. Quant. Spectrosc. Radiat. Transf. 2018, 218, 21–37. [Google Scholar] [CrossRef]
- Baldridge, A.M.; Hook, S.J.; Grove, C.I.; Rivera, G. The ASTER Spectral Library Version 2.0. Remote Sens. Environ. 2009, 113, 711–715. [Google Scholar] [CrossRef]
- USGS Spectral Library Version 7; Data Series; USGS: Reston, VA, USA, 2017; p. P67.
- Litvinov, P.; Hasekamp, O.; Dubovik, O.; Cairns, B. Model for Land Surface Reflectance Treatment: Physical Derivation, Application for Bare Soil and Evaluation on Airborne and Satellite Measurements. J. Quant. Spectrosc. Radiat. Transf. 2012, 113, 2023–2039. [Google Scholar] [CrossRef]
- Ma, Y.; Li, Z.; Li, Z.; Xie, Y.; Fu, Q.; Li, D.; Zhang, Y.; Xu, H.; Li, K. Validation of MODIS Aerosol Optical Depth Retrieval over Mountains in Central China Based on a Sun-Sky Radiometer Site of SONET. Remote Sens. 2016, 8, 111. [Google Scholar] [CrossRef] [Green Version]
- Li, Z.Q.; Xu, H.; Li, K.T.; Li, D.H.; Xie, Y.S.; Li, L.; Zhang, Y.; Gu, X.F.; Zhao, W.; Tian, Q.J.; et al. Comprehensive Study of Optical, Physical, Chemical, and Radiative Properties of Total Columnar Atmospheric Aerosols over China: An Overview of Sun–Sky Radiometer Observation Network (SONET) Measurements. Bull. Am. Meteorol. Soc. 2018, 99, 739–755. [Google Scholar] [CrossRef]


| Parameter | Value | Parameter | Value |
|---|---|---|---|
| Spatial res. (m) | 500 (vertical resolution) | Multi-angle | 5 |
| Instrument FOV | ±45° | Polarized angle | 0°, 60°,120° |
| Pol. Cal. Error | ≤2% | Stokes parameters | I, Q, U |
| Rad. Cal. Error | ≤5% | Band width (nm) | 20, 20, 20, 20, 10, 40, 20, 40, 40, 40, 40 |
| Central wavelength/nm | 388 (P), 443, 490 (P), 670 (P), 555, 865 (P), 910, 1045, 1370 (P), 1640 (P), 2140 (P) |
| Geometry Scenarios | Solar Zenith Range (°) | Viewing Zenith Range (°) | Relative Azimuth Range (°) | Scattering Angle Range (°) |
|---|---|---|---|---|
| Geometry 1 | 54.12~54.79 | 44.39~64.09 | 5.78~330.03 | 137.76~173.68 |
| Geometry 2 | 32.86~33.59 | 25.59~58.64 | 106.99~248.41 | 105.05~121.30 |
| Geometry 3 | 53.18~53.74 | 28.8~61.06 | 97.15~229.85 | 80.28~109.40 |
| Geometry 4 | 77.63~78.08 | 37.15~61.87 | 0.65~298.07 | 104.04~145.82 |
| Mode | Aerosol Type | Description of characteristics |
|---|---|---|
| Fine Mode | Urban polluted (F-ULW) | Urban-polluted fine-mode aerosols with high particle concentrations |
| Continental background (F-UHS) | Background fine-mode aerosols with low particle concentrations | |
| Secondary polluted (F-BLW) | Secondary aerosols containing mainly polluted particles with low refractivity and a higher scattering capacity | |
| Combined polluted (F-BNS) | Mixture of direct anthropogenic emissions and secondary aerosols with high light absorption | |
| Polluted fly ash (F-BNM) | Mixture of anthropogenic-polluted particles and fine fly ash particles with large submicron fine particles | |
| Coarse Mode | Summer fly ash (C-ULW) | Background of fly ash coarse particles with low light absorption, for example, natural emissions of primary organic aerosols |
| Winter fly ash (C-UHS) | Background of fly ash coarse particles with high light absorption, for example, fly ash polluted by anthropogenic components | |
| Primary dust (C-UNW) | Coarse particles of natural dust with a very high volume concentration | |
| Transported dust (C-BNM) | Dust particles after long-term transportation and sedimentation | |
| Background dust (C-BHM) | Background dust suspended over continental regions with a large coarse standard mode |
| Fine Modes | |||||||||
| Type | Refractive Index | Refractivity | Absorptivity | ||||||
| F-ULW | 0.175 | \ | 0.300 | \ | 1.414-0.007i | 0.136 | \ | Low | Weak |
| F-UHS | 0.126 | \ | 0.334 | \ | 1.515-0.014i | 0.063 | \ | High | Strong |
| F-BLW | 0.132 | 0.283 | 0.152 | 0.257 | 1.392-0.007i | 0.087 | 0.069 | Low | Weak |
| F-BNS | 0.103 | 0.204 | 0.089 | 0.334 | 1.459-0.016i | 0.046 | 0.089 | Normal | Strong |
| F-BNM | 0.124 | 0.387 | 0.189 | 1.766 | 1.477-0.011i | 0.073 | 0.058 | Normal | Moderate |
| Coarse Modes | |||||||||
| C-ULW | 2.208 | \ | 0.522 | \ | 1.437-0.006i | 0.089 | \ | Low | Weak |
| C-UHS | 2.558 | \ | 0.500 | \ | 1.522-0.015i | 0.090 | \ | High | Strong |
| C-UNW | 1.970 | \ | 0.305 | \ | 1.495-0.003i | 0.482 | \ | Normal | Weak |
| C-BNM | 1.211 | 2.973 | 0.345 | 0.552 | 1.492-0.009i | 0.059 | 0.105 | Normal | Moderate |
| C-BHM | 1.626 | 4.481 | 0.552 | 0.142 | 1.518-0.008i | 0.121 | 0.076 | High | Moderate |
| SSA | F-BLW | F-BNS | F-NM | F-ULW | F-UHS | C-ULW | C-BNM | C-BHM | C-UHS | C-UNW |
|---|---|---|---|---|---|---|---|---|---|---|
| SSA (388 nm) | 0.9541 | 0.9020 | 0.9572 | 0.9277 | 0.9413 | 0.7642 | 0.7906 | 0.7666 | 0.6194 | 0.6338 |
| SSA (443 nm) | 0.9498 | 0.8895 | 0.9569 | 0.9261 | 0.9377 | 0.7817 | 0.8082 | 0.7842 | 0.6333 | 0.6496 |
Publisher’s Note: MDPI stays neutral with regard to jurisdictional claims in published maps and institutional affiliations. |
© 2022 by the authors. Licensee MDPI, Basel, Switzerland. This article is an open access article distributed under the terms and conditions of the Creative Commons Attribution (CC BY) license (https://creativecommons.org/licenses/by/4.0/).
Share and Cite
Gu, H.; Zhang, Y.; Fan, C.; Li, Z.; Hou, W.; Liu, Z.; Xie, Y.; Xu, H.; Zhang, L.; Ma, J. A Comprehensive Analysis of Ultraviolet Remote Sensing for Aerosol Layer Height Retrieval from Multi-Angle Polarization Satellite Measurements. Remote Sens. 2022, 14, 6258. https://doi.org/10.3390/rs14246258
Gu H, Zhang Y, Fan C, Li Z, Hou W, Liu Z, Xie Y, Xu H, Zhang L, Ma J. A Comprehensive Analysis of Ultraviolet Remote Sensing for Aerosol Layer Height Retrieval from Multi-Angle Polarization Satellite Measurements. Remote Sensing. 2022; 14(24):6258. https://doi.org/10.3390/rs14246258
Chicago/Turabian StyleGu, Haoran, Yuhuan Zhang, Cheng Fan, Zhengqiang Li, Weizhen Hou, Zhenhai Liu, Yisong Xie, Hua Xu, Luo Zhang, and Jinji Ma. 2022. "A Comprehensive Analysis of Ultraviolet Remote Sensing for Aerosol Layer Height Retrieval from Multi-Angle Polarization Satellite Measurements" Remote Sensing 14, no. 24: 6258. https://doi.org/10.3390/rs14246258