Article

Seismo-Lineaments in Egypt: Analysis and Implications for Active Tectonic Structures and Earthquake Magnitudes

by
Sayed S. R. Moustafa
,
Mohamed S. Abdalzaher
* and
H. E. Abdelhafiez
Egyptian National Seismic Network (ENSN), Department of Seismology, National Research Institute of Astronomy and Geophysics, Cairo 11421, Egypt
*
Author to whom correspondence should be addressed.
Remote Sens. 2022, 14(23), 6151; https://doi.org/10.3390/rs14236151
Submission received: 13 October 2022 / Revised: 18 November 2022 / Accepted: 28 November 2022 / Published: 4 December 2022

Abstract

:
Quiescent faults may be capable of creating catastrophic earthquakes in locations with moderate and/or low seismic activity, such as Egypt. This study combines structural, remote sensing ( R S ), geophysical, and seismic activity data to examine and analyze the relationship between tectonic structures and seismotectonic activity in Egypt. In a new seismo-lineaments map of Egypt, tectonic lineaments of the Egyptian mainland were delineated and classified. The database contains 8000 lineaments that were divided into distinct geographical zones using statistical analysis and general features. Delineated lineaments were integrated with digitized geological and geophysical surface and subsurface faults and geographic information systems ( G I S ) processing techniques were applied to produce 4249 faults. The spatial distribution of seismic activity was determined to extract 1968 competent faults out of 4249 capable faults (i.e., greater than 10 km and suitably orientated concerning the existing stress field). Maximum expected magnitudes ( M m a x ) were calculated for distinct seismogenic locations in Egypt, taking into account the nature of the regional rupture. At the national scale, empirical scaling relations between fault lengths and earthquake magnitude were employed for all mapped faults in Egypt. The findings concerning the faults were highly consistent with traditional geological information. The results suggest that our technique for estimating the highest predicted magnitudes produces similar values and might be used to evaluate Egypt’s possible future seismic hazard. The results were compared to seismic databases. The similarity of our results with those reported in the catalogs lends confidence to the proposed scheme.

1. Introduction

Earthquakes, which typically occur along fault lines, abruptly release the gradual building up of elastic strain in the crust. Surface rupturing, whether co-seismic or creep-induced, can cause catastrophic damage, especially when vital lifelines pass through it. Surface faulting danger assessment takes into account any surface consequences caused by capable faults reactivating (i.e., the active faults that can achieve considerable surface ruptures or probable deformations). Surface faulting, landslides, liquefaction, hydrological abnormalities, and other environmental hazards of competent faults play a critical role in seismic hazard assessment [1,2]. This is mostly owing to their relationships with the earthquake’s greatest expected magnitude ( M m a x ) and the location of seismogenic sources [3,4,5,6,7,8]. As a result, identifying and characterizing capable faults is an important part of any risk mitigation study [9].
Traditional fault-mapping methods need extensive fieldwork surveys. Fieldwork, on the other hand, is typically time-demanding and might take years to accomplish, depending on the extent and/or accessibility of the region under investigation [10,11]. Fault identification in the field is influenced by topography, erosion, vegetation overgrowth, the geologist’s experience, and several other variables [12].
Remote sensing ( R S ), on the other hand, has the benefit of delivering regional overviews; as a result, it can immediately determine the properties of geological structures across broad areas [13,14,15,16]. R S combined with image-processing techniques is a less time-consuming and cost-effective tool for structural identification than field investigations. Nevertheless, such methods do not replace field studies; rather, they complement one another. Satellite images frequently indicate faults as linear or curved traces. These image lines of varying contrast are known as l i n e a m e n t s [17,18], and they may range in length from a few meters to tens or even hundreds of kilometers [14,19,20,21]. Furthermore, R S technology has been shown to be a particularly efficient technique for data collection, whilst computer methodologies, such as computer-based geographic information systems ( G I S ), have created new horizons for data storage, combination, analysis, and presentation. For much geological research, such as fault mapping, R S and G I S integration supports an optimal solution. R S and G I S capabilities have been highlighted in several studies to improve geological information, amend current geological maps, and find previously unmapped faults [13,14,15,22]. As a result, we chose to employ R S and G I S to supplement our characterization of fault activity to assess the possibility of surface faulting. Moreover, R S can be correlated with seismicity [14,20,23].
It has been determined that the lineaments possess characteristics such as mappability, linearity, simplicity, Earth structure alignments, and geomorphologic subsequences [24,25]. The collection and processing of lineament data are extremely useful in groundwater research, mineral resource mapping, and environmental defect monitoring, such as landslides and gully erosion [23]. Linear features are generally created by tiny brightness and contrast changes in the image, which produce edges. These edges are expressions of change in the composition of natural items on the earth. As a result, the edges can reflect land cover borders, i.e., plant height and its type, stratigraphic data, and shifts in soil tone. Furthermore, the edges imply sudden changes in the topography and utilities, such as bridges, and roads [24]. The extraction and analysis of lineaments from space-borne data are used to derive tectonic conclusions concerning regional-scale rock deformation [24]; accurately defined lineament analysis and mapping can reveal the tectonic features and seismicity. Moreover, lineament investigation is beneficial for seismic hazard assessment [14,23,26].
Egypt is bordered in the west by Libya and in the south by Sudan. Figure 1a shows the Egyptian borders. It is located between the Mediterranean Sea, the Red Sea, the Gulf of Suez, and the Gulf of Aqaba. Egypt is primarily a desert nation apart from the Nile Valley and Delta [27]. Egypt’s geography from east to west comprises the Sinai Peninsula, the Gulf of Suez and Suez Canal, the Red Sea coastal and offshore areas, the Eastern Desert, the Nile valley, and the Western Desert [28]. The African Eurasian plate boundary, the Red Sea plate margin and the Levant transform fault represent Egypt’s tectonic boundaries (Figure 1b). The current tectonic deformation in Egypt is linked to interactions and relative movements along these boundaries, and has far-reaching impacts inside Egypt [29].
Insights into the strain and velocity fields as well as the geodynamic evolution of an area have been provided by the development of global navigation satellite system ( G N S S ) technology, which is an important tool in the study of crustal deformation [30,31]. G N S S data analysis is the primary method used to analyze tectonic deformation, which is connected to movements along the tectonic plates. Crustal deformation results from the accumulation of elastic strain; when a threshold is crossed, nearly all of the elastic deformation transforms into permanent deformation via fault rupture [32], which leads to earthquake generation. By integrating G N S S with seismicity, it is possible to map and measure strain rates with high spatial resolution and coverage, which is crucial for assessing the seismic hazard unique to a certain fault [31,33]. Geological, seismological, and geodetic techniques, alone or in combination, can be used to determine the strain rate [34,35,36].
As a result, a high to moderate level of risk can be anticipated. The seismic characteristics (i.e., maximum predicted magnitude) of all competent faults in Egyptian territory are required for long-term seismic hazard calculations. There has been a scarcity of paleoseismic investigations for slow-activity faults, on the other hand, and the majority of these faults have yet to be paleoseismologically examined or diagnosed. The lack of paleoseismological data on some faults, or the difficulty in obtaining proof, does not rule out the possibility that these faults are active.
Given the significance of lineaments, an attempt was undertaken to analyze the seismicity of Egypt as a whole by creating a lineament map (with a length of more than 10 km) using satellite R S data and linking earthquake epicenters with them [38]. Details from past geological, geophysical, and seismological studies were included in this map to improve it. Rose diagrams, depicting lineament frequency and cumulative length, were created. Data on earthquakes (spatial epicenteral distribution/magnitude) were collected and combined with the lineaments, resulting in the identification of lineaments with a strong correlation to earthquake occurrence. We used various geophysical anomaly data and locations of reported historical and instrumental seismic activities to confirm our findings and learn more about the connections between geological and geomorphological elements and hazardous seismic activity. This seismo-lineament data will be utilized to enhance development of the structural framework of Egypt, and their corresponding lengths will be used to determine the maximum predicted magnitude impacting the area’s numerous tectonic zones. Eventually, paleoseismologists and tectonic geomorphologists attempting to document active faults in the area using trenching and/or LiDAR-based geomorphic analysis might benefit from the study’s outcomes.
The rest of the paper is structured as follows: Section 2 presents the geological aspects and structure setting of Egypt. Then, the regional tectonics and seismicity in the mapped area are discussed in Section 3. Section 4 describes the various geological, geophysical and seismoclogical data collection and surface lineament extraction methods implemented, while Section 5 evaluates the capable faulting potential. Section 6 presents the results and discussion, indicating the maximum expected magnitude estimation for the capable faults of Egypt. Finally, the paper is concluded in Section 7 and future recommendations are provided.

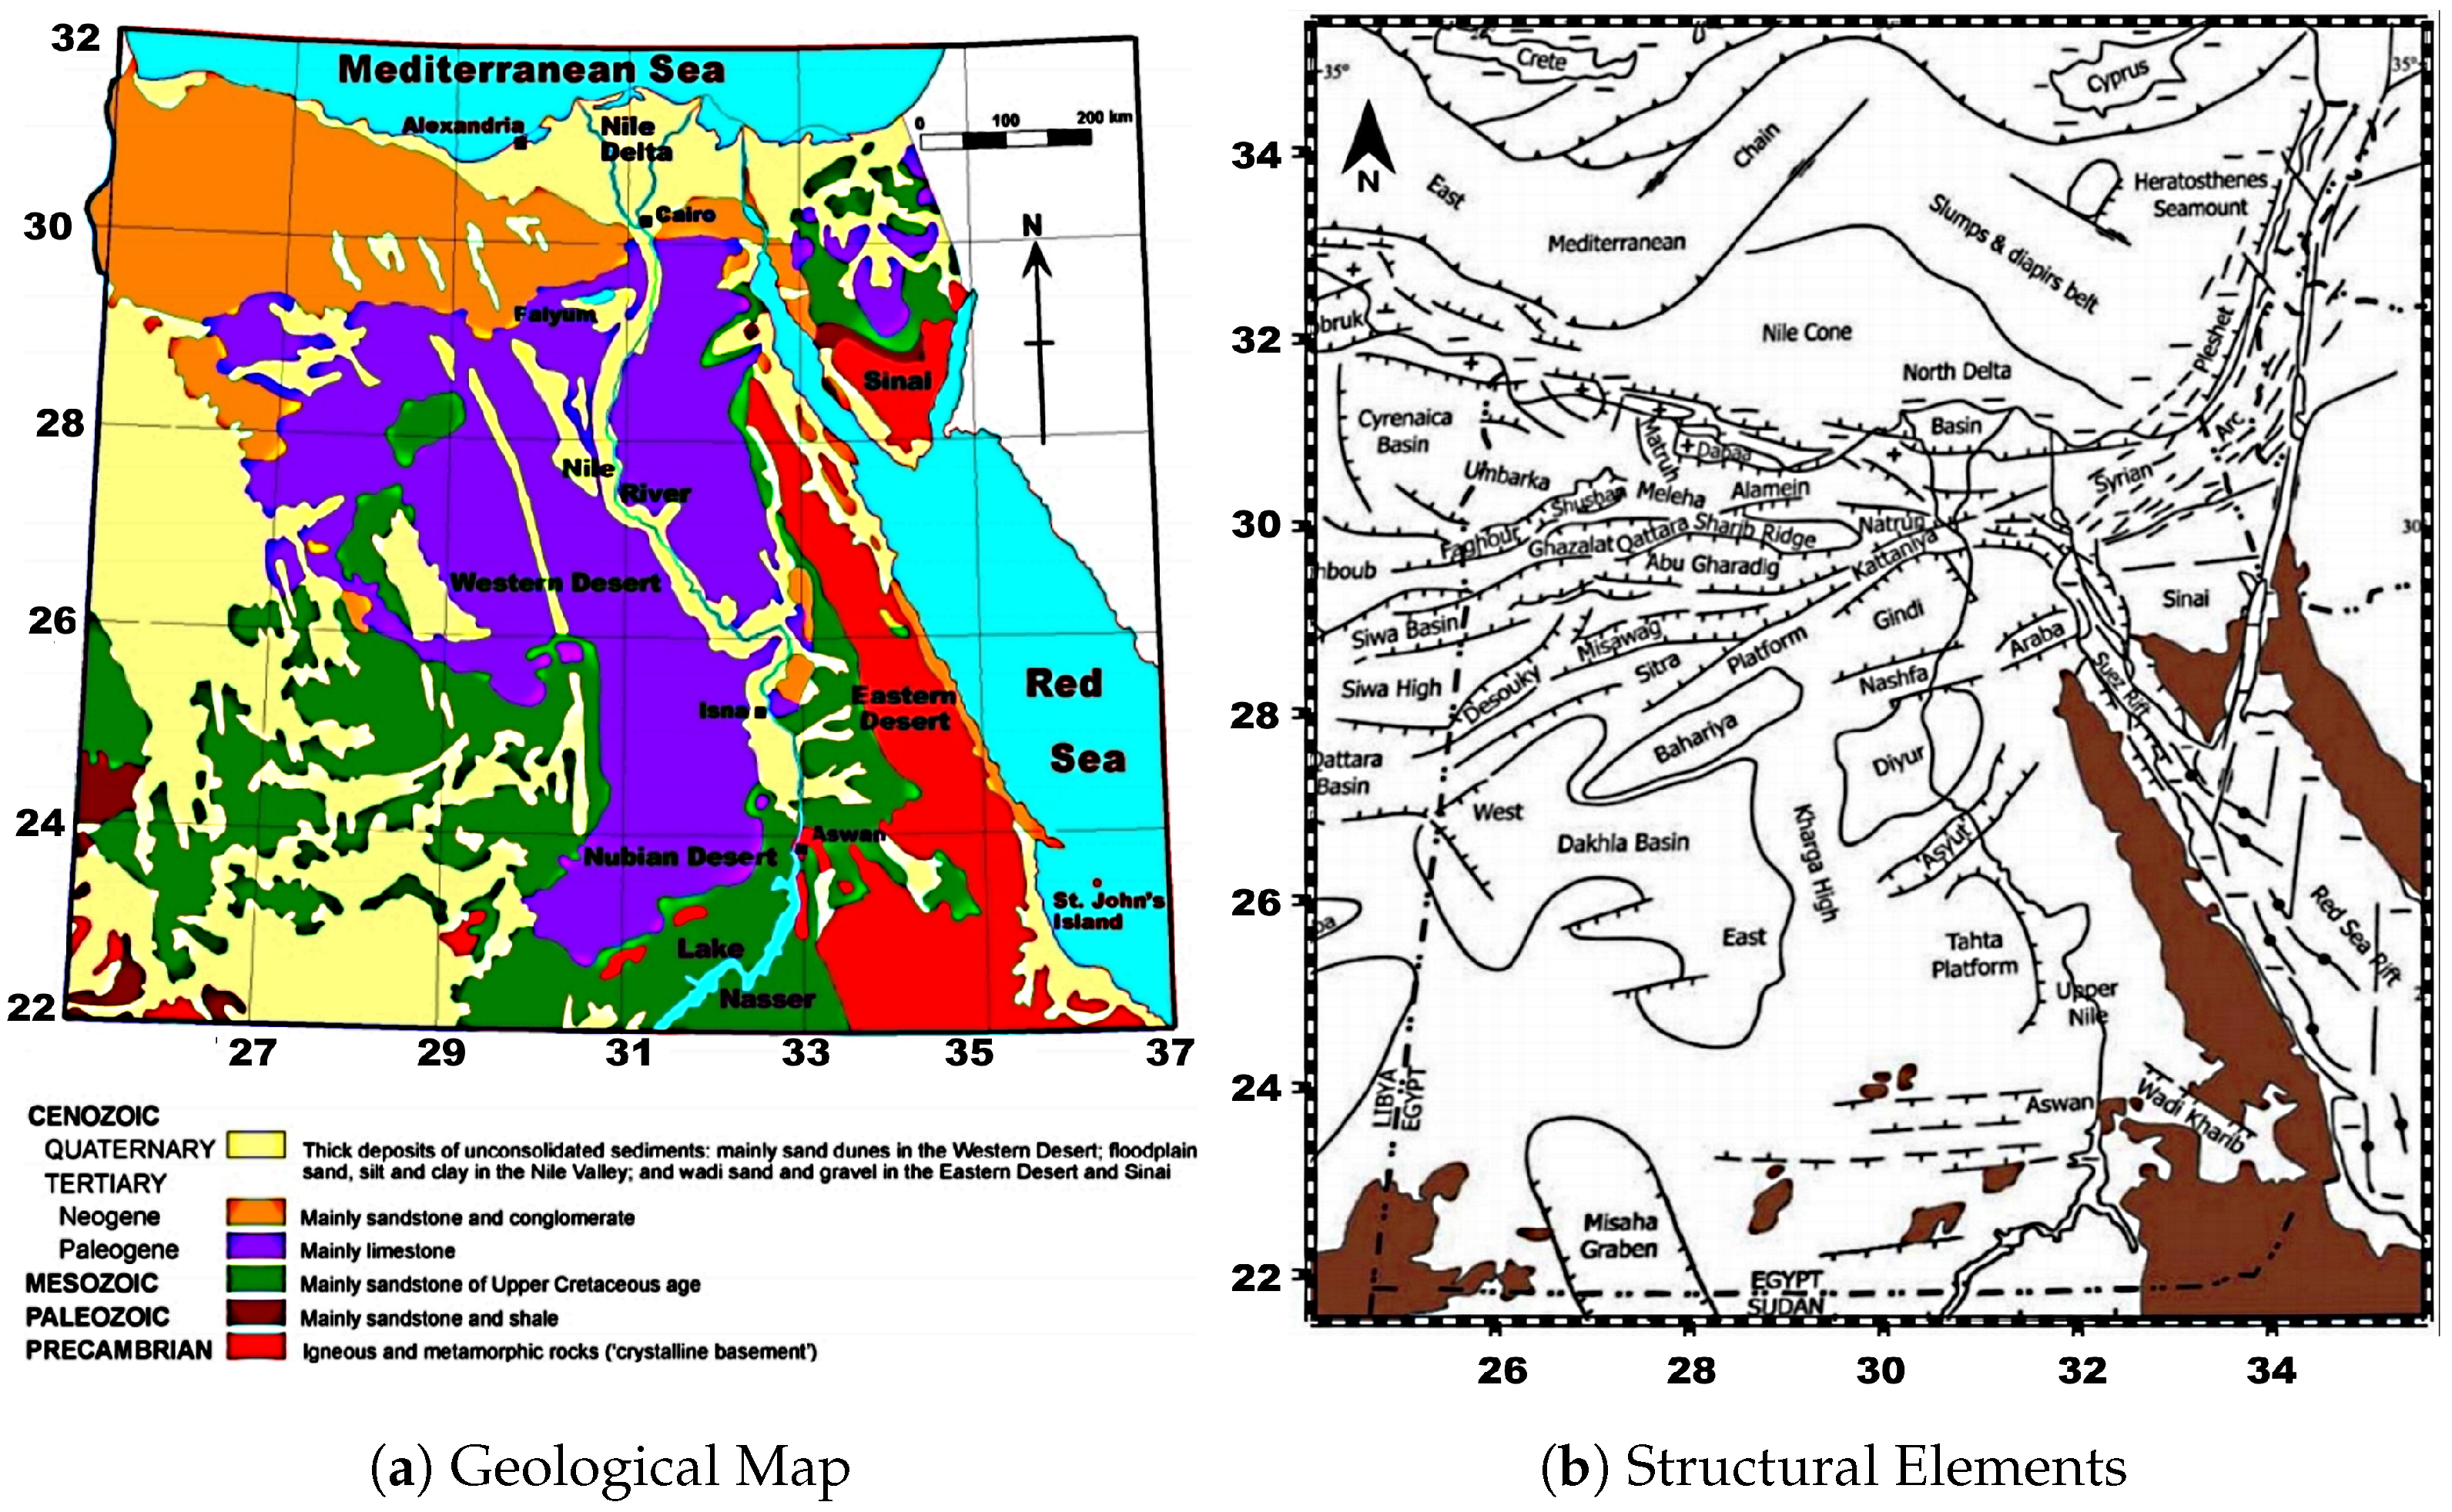
2. Geological and Structural Settings

The majority of Egypt is underlain by deep pre-Cambrian basement rocks, although they are exposed at the surface in some places, such as Gebel Uweinat, Aswan, and the Red Sea Hills (see Figure 2a). This is most likely due to the area being lifted above sea level over such a long period. Egypt was gradually flooded from the north by the Tethys Sea over the Mesozoic Era (from ∼ 240 to 65 Mya) [28]. The majority of the land areas were completely submerged by the time the Cretaceous period began (∼150 Mya) [28]. Nubian sandstone is the most visible formation, covering most of Egypt. It is produced from sediments deposited in the Tethys Sea during this period [39]. The Cenozoic is possibly the most important epoch, since it was when the limestone that covers much of Egypt (see Figure 2a) was put down under vast tropical seas. Significant depths of limestone were put down over the Egyptian mainland as the Eocene (∼57 Mya) proceeded and the coastlines of the Tethys withdrew to the north. The continuous northward retreat of the Tethys is assumed to have been caused by earth movements throughout the Oligocene that lifted the north African mainland (∼36 Mya). As the continent continued to rise, drainage from the higher elevated areas in the east resulted in the creation of rivers in Egypt’s east and north [39]. The run-off from the Red Sea Hills had evolved to the point that it produced an immense southern-flowing river system known as the Qena River by the mid-to-late Miocene (∼5 Mya). The Tethys had reduced so much by the late Miocene (∼5 Mya) as a result of the continuous uplift of the African continent, but also probably owing to a worldwide fall in sea level, that it appears to have dried out throughout significant sections of the Mediterranean basin [40]. From the Pliocene to the Quaternary, the Paleonile was the oldest real river to run through the Eonile Canyon (from ∼3.5 Mya to ∼1.8 Mya). The deep Eonile canyon was nearly filled with marine, estuarine, and, ultimately, river material by the end of the Paleonile era [28]. The dry event that brought the Paleonile phase of Nile development to a close was followed by a wet period that initiated the Protonile phase [28]. The Prenile stage concluded in yet another era of relative aridity, with flow from Ethiopia blocked and replaced by flow from the Red Sea Hills and the Eastern Desert’s system of wadis [40].
Egypt has been separated structurally into two main parts: the Arabo-Nubian massif and the shelf regions [28]. The Arabo-Nubian massif represents a settled tectonic block that includes exposed foundation rocks in the Eastern Desert, the Sinai Peninsula’s southern section, and isolated outcrops in southern Egypt [28]. The stable shelf, unstable shelf, hinge zone, and miogeosyncline are the four units that make up the shelf (Figure 2b). The stable shelf is a pivot that extends from southern Egypt to the Sinai Peninsula in the north. It is characterized by low structural relief, distorted by many sets of regional folds [41,42]. The unsettled shelf spans virtually all of northern Egypt and is characterized by a northward-thinning sedimentary layer underlain by high basement relief due to block faulting [43]. The hinge zone, which separates the unstable shelf from the miogeosynclinal basinal region, roughly corresponds to the current Mediterranean coastline area. According to Kulke [27], Egypt may be classified into five primary morpho-structural units, namely, the Mediterranean fault zone, the north Sinai fold belt (Syrian Arc), the Suez-Red Sea grabens, the southern Egypt intracratonic basins, and a band of linear uplifts and half-grabens, as depicted in Figure 2b.

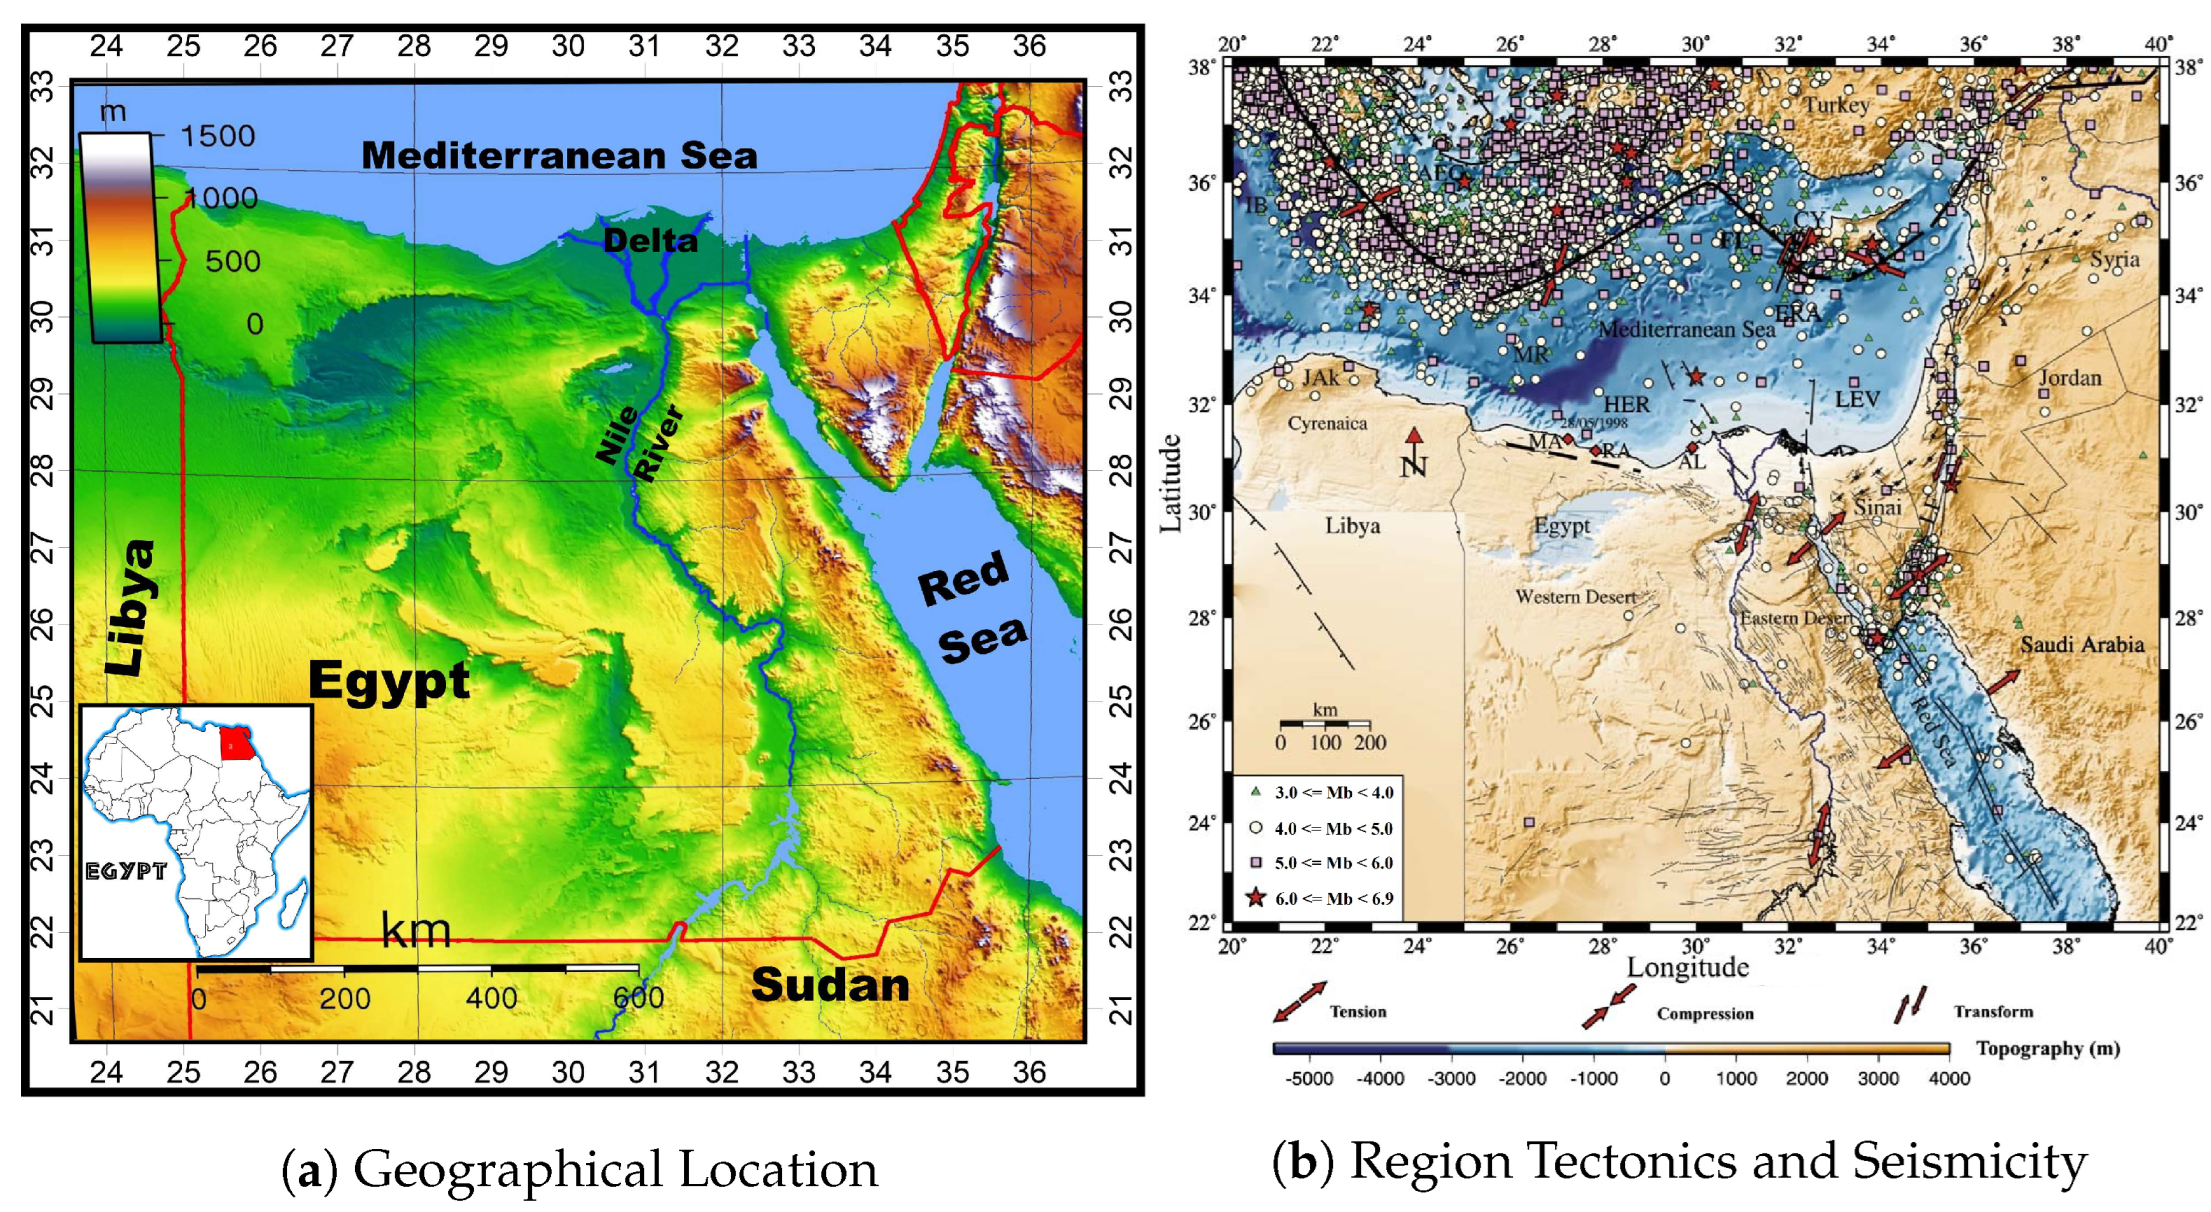
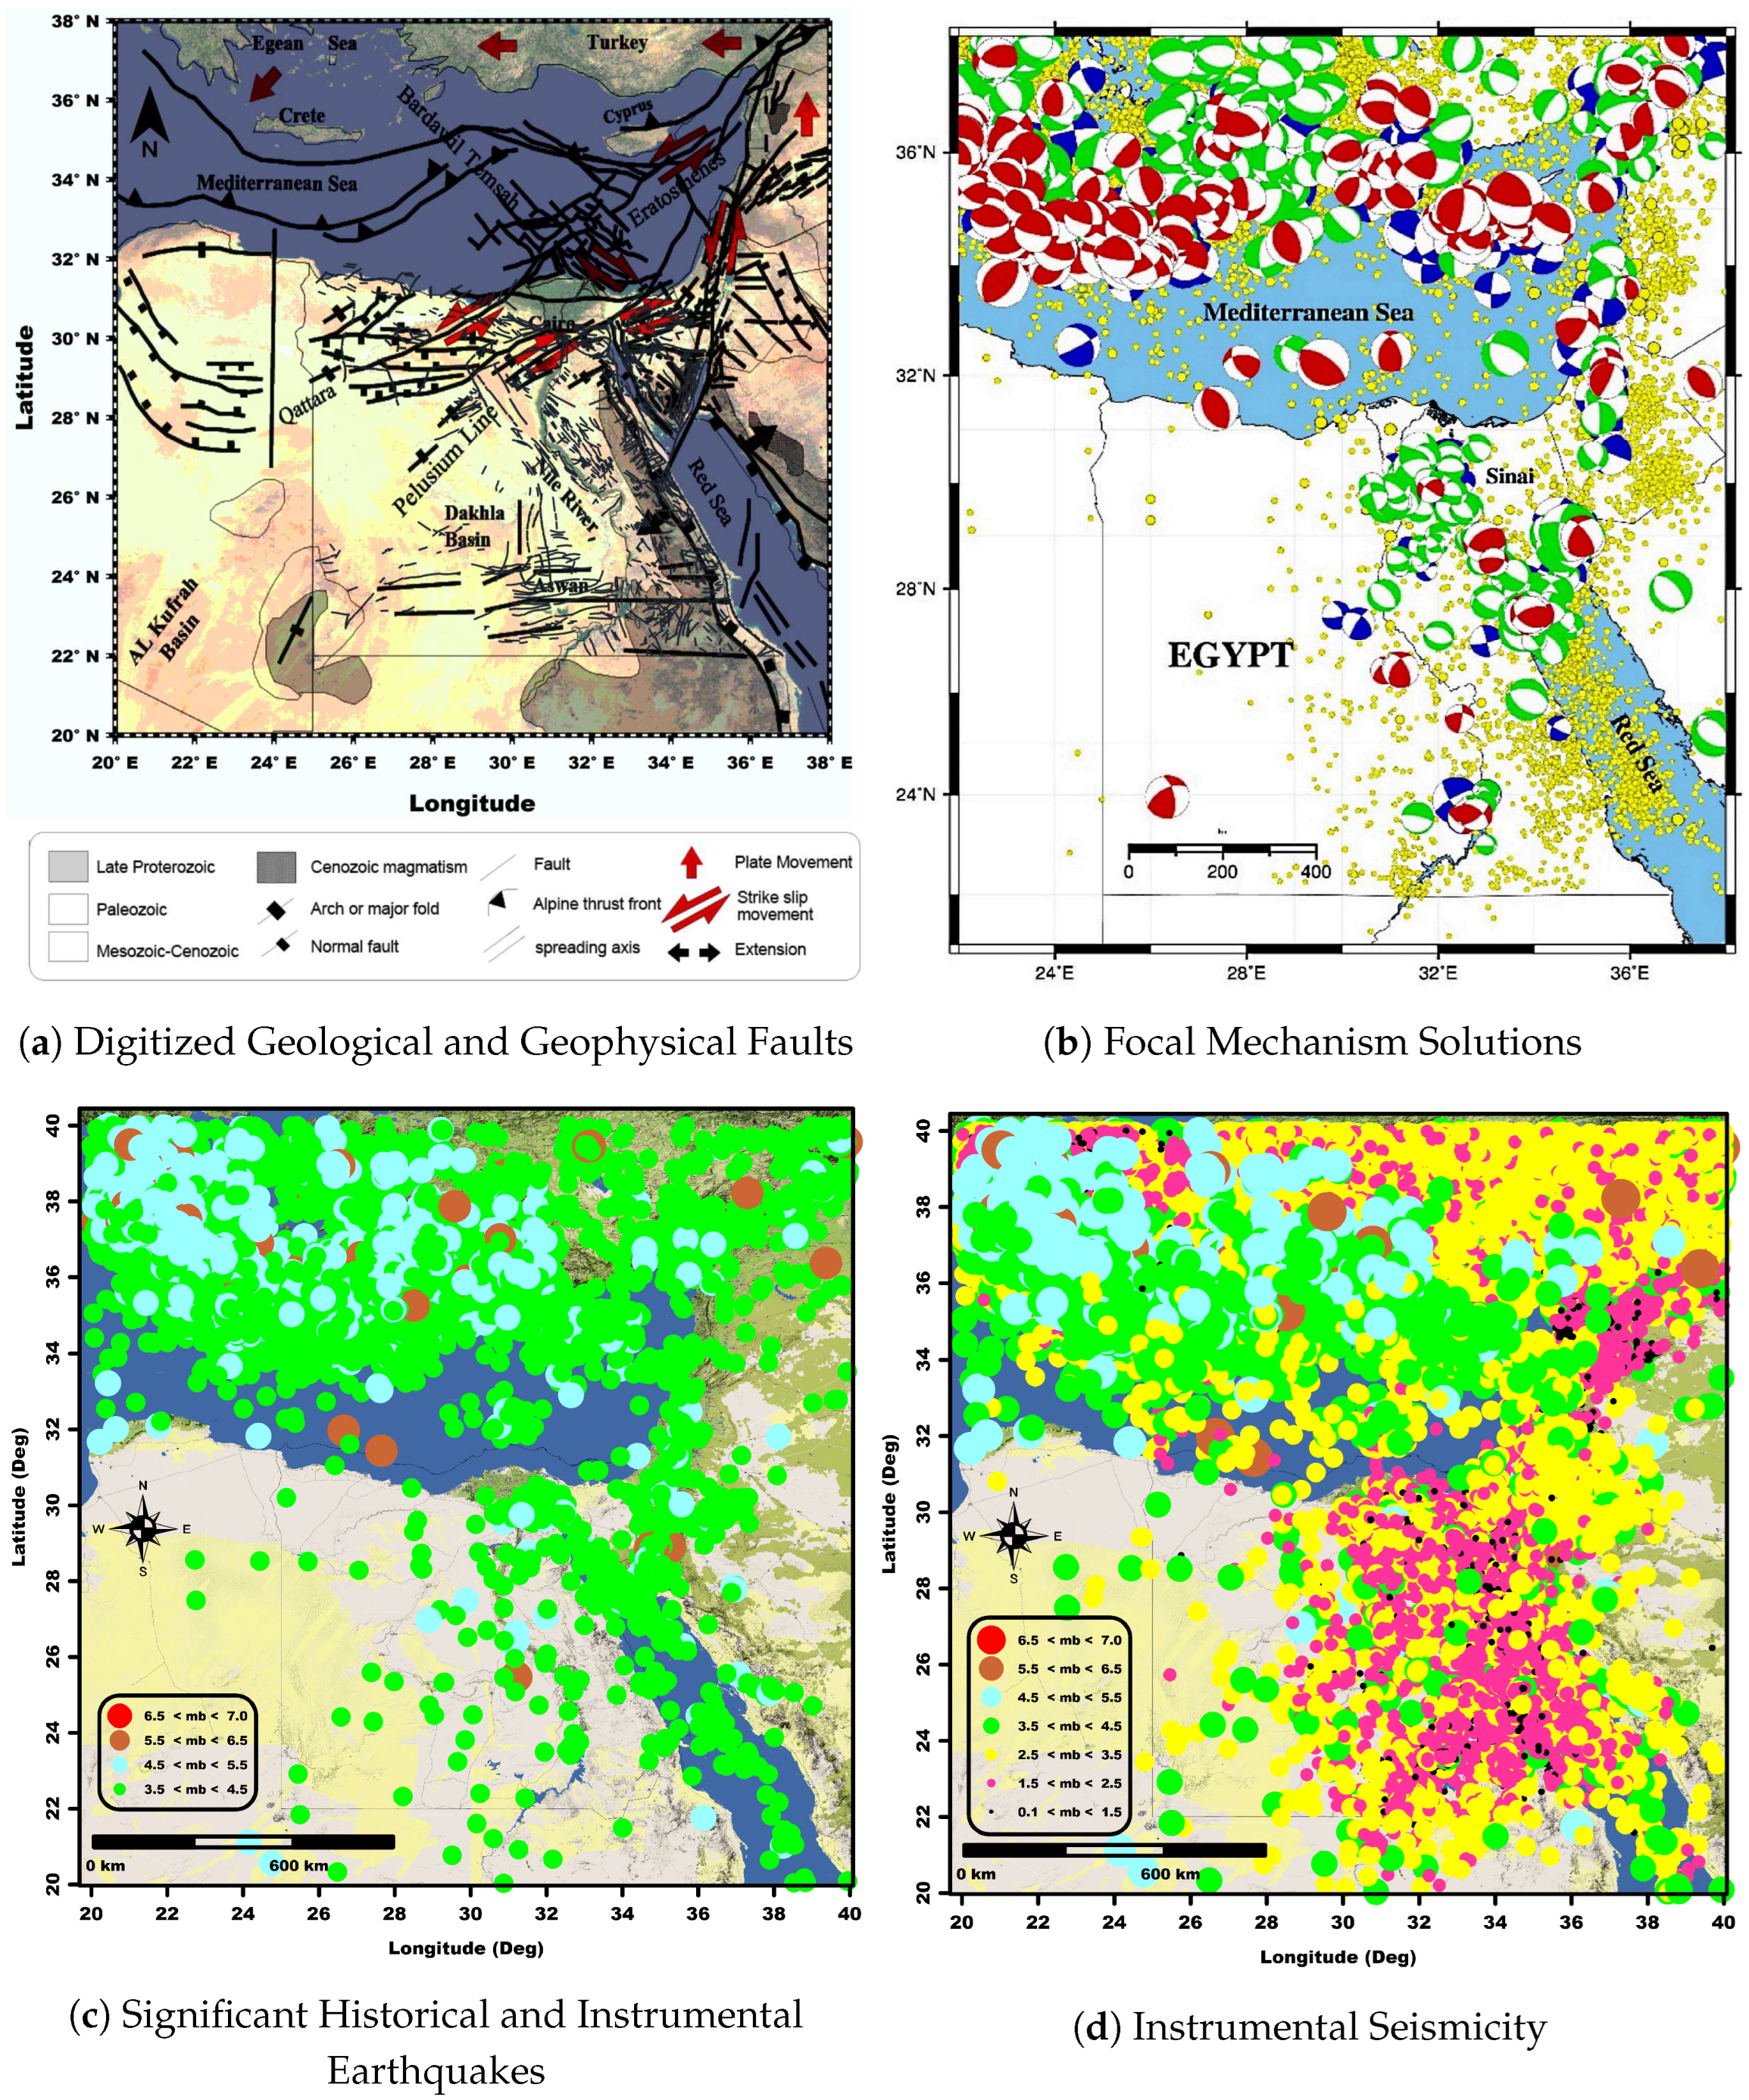
3. Regional Tectonics And Seismicity

Egypt is located near the southeastern boundary of the eastern Mediterranean area, on the northeastern corner of the African Plate (see index map in Figure 1a). These areas have undergone lengthy and complex tectonic processes [29]. Horizontal motions, rifting, and moderate-to-intense folding were among the tectonic processes that impacted this large area over geologic time and laid the foundation for today’s physiographic pattern. The Gulf of Suez–Red Sea Rift and the Gulf of Aqaba–Dead Sea–Jordan Valley Rift both show evidence of considerable tectonic processes. Through divergent and convergent plate borders, they interact with the Arabian and Eurasian plates, respectively [44]. Since the early Mesozoic, a succession of rifting events has molded these areas, forming the northeastern border of the once-continuous Afro-Arabian continent. The Red Sea plate margin, the African-Eurasian plate margin, and the Levant transform fault are the principal tectonic components impacting Egypt [45]. In the geodynamic reconstructions of Egypt (Figure 1b), several plates are involved. The first one is the Sinai sub-plate which is a minor component of the Middle East’s greater regional and basic tectonics. Its base stretches along the Cyprian Arc (CA) and the southwestern section of the East Anatolian fault in the north [46], while its apex lies near the point of the Sinai Peninsula in the south, forming an inverted triangle. The Suez Rift (SR) is the only known component of the second arm, whereas the Dead Sea transform (DST) is a well-defined arm of the triangle. The majority of the seismicity and seismic moments occur along a seismogenic zone that runs along the DST, the CA, and the Suez Rift [42,47,48]. Seismic activity has stopped north of the Gulf of Suez, showing the link between the region and the African Plate [49]. The Aqaba Transform fault separates the Gulf of Suez from the Red Sea, creating a northwest-trending intracratonic basin. The Gulf of Suez Rift is made up of three distinct tectonic territories, split by two zones. The northern accommodation zone is oriented toward the east, whereas the southern zone is oriented toward the west [50]. The regional SW dip is characteristic of the northern and southern tectonic provinces, whereas the regional NE dip is characteristic of the central tectonic province. The N-S faults that run along the southern margin of the Gulf of Suez represent the transition between the shallow-water Suez basin and the deep northern Red Sea basin [50,51]. The Aqaba–Levant fault zone is a large left-lateral strike-slip fault that allows Africa and Arabia to move together. It connects the northern Red Sea’s expansion zone to the Taurus collision zone to the north. The primary faults in this zone are N-S to NNE-SSW in orientation. They may be found in the Gulf, as well as in the Sinai and Arabian deformed coastal areas [26,52].
The Red Sea’s northern province denotes an active rift in the last phases of continental rifting when the shift to oceanic seafloor spreading has begun. It is defined by a broad main trough that is bordered by steep continental slopes [53,54]. Except for the northernmost portion (Gubal, Tiran), which has an E-W slope, the continental slopes are generally NW-SE. The tectonic movements that are now active are defined by a concentration of extension and deformation in the axial depression, as well as by the emplacement of many massive intrusions [26,55]. In the eastern Mediterranean, the Cyprian Arc is a portion of the plate boundary between Eurasia and Afro-Arabia. The Cyprian Arc and its extension on land, according to most studies of the eastern Mediterranean, define a plate boundary. Seismic activity and gravity anomalies show that the process of the western part congregation of the Cyprian Arc is a northward sinking of oceanic material associated with movement of the African Plate beneath the Turkish Plate [46,56]. The collision of the Eratosthenes Seamount with the core part of the Cyprian Arc interrupts subduction and creates a zone of extreme deformation.

4. Materials and Methods

The data and methods used in lineament extraction are quite important. Figure 3 shows the method for extracting, processing, and analyzing lineaments in detail [24,57].

4.1. Geological and Geophysical Data

One of the most convincing arguments or pieces of evidence for fault activity is the crosscutting or non-crosscutting relationship with a datable unit. The structural aspects of young geologic units adjacent to faults may also provide information about the activity of a fault. Adjacent units may be brecciated and shattered, have open fissures, be tilted or warped, or have secondary effects of faulting and show liquefaction effects (e.g., sand boils and sand dikes). Geological data were utilized in the identification and mapping of faults. Geological paper (Figure 2a) and main structural elements maps (Figure 2b) were digitized and utilized to create vector maps of the geological structure layer, which were then compared to remote-sensing data to improve and clean the outlined lineaments. Recognition and precise mapping of faults in many zones of neotectonic activity, particularly at or near plate boundaries, is possible using the geological map (Figure 2a) and the main structural element maps (Figure 2b), which has led to recent advancements in the identification of capable faults. Regional tectonic data (Figure 4a) was also included in the construction of the final capable faults map. The African-Eurasian plate margin, the Red Sea plate margin, and the Levant transform fault are the principal tectonic components impacting Egypt. These plates have played a role in Egypt’s geodynamic reconstructions. The last integrated layer to determine capable faults that impact Egypt is the geophysical layer, which was created via scanning and georeferencing numerous published research maps. Recent fault detection and delineation investigations have employed a variety of geophysical methods. Gravity techniques are best for investigating fault zones if there is a significant density difference between the materials on each side of the fault. These techniques are particularly useful in areas where extensional faulting is present. Surface magnetic, aeromagnetic, and microwave survey methods may be used to discover and outline faults that have been hidden by recent sediments, as well as to contour the thickness of basin fill at low cost [14,15,20,39,41,53,54,58,59,60,61,62,63,64].

4.2. Collected Seismic Activity
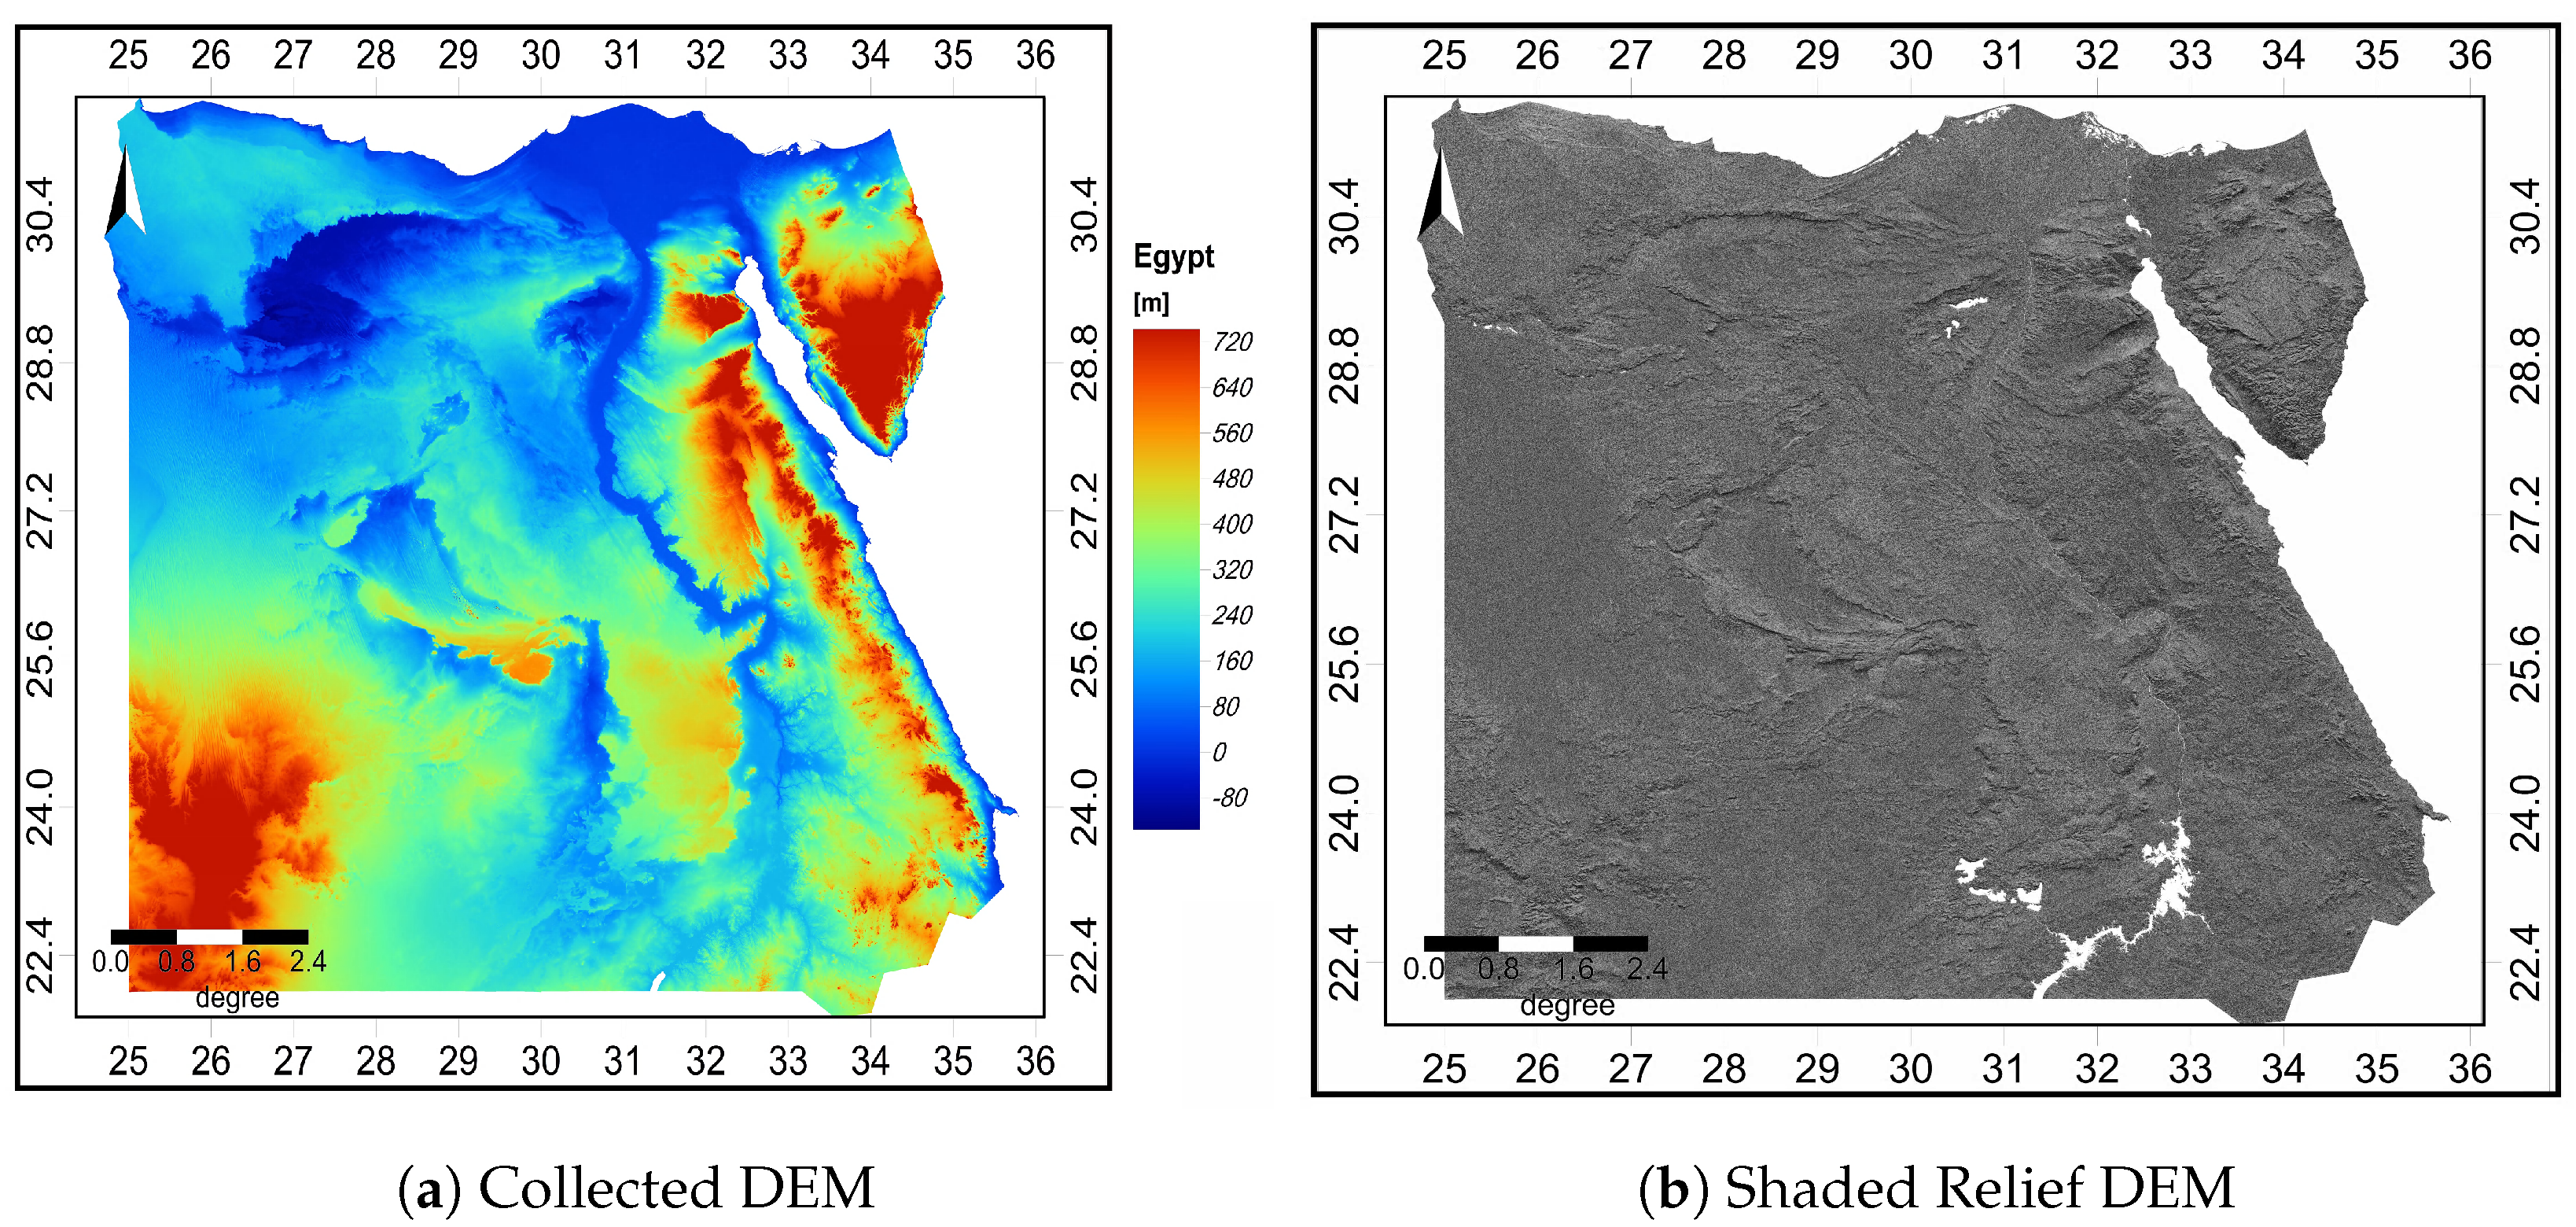
To examine how earthquakes are distributed in terms of time, geography, and magnitude, an area must have a comprehensive and consistent earthquake database. The approaching motion and contact of the plates of Eurasia, Africa, and Arabia cause seismic activity in Egypt (Figure 4a). It has a four-millennia-long historical record of earthquakes [69]. Data on focal mechanisms were gathered into a single database [65,66] after being investigated using various local and international sources (Figure 4b). In Egypt and its surrounds, more than 600 focal mechanism solutions were gathered, encompassing various seismically active zones. A magnitude of three or above characterizes the majority of them. Based on a uniform collected earthquake inventory [68], the current investigation identifies and characterizes regional seismic source zones. Egypt’s historical seismicity (Figure 4c) has been documented over the last 4800 years. Around 83 historical events happened in and around Egypt, causing varying degrees of devastation in various places [67]. Several significant incidents occurred around the Red Sea’s edge and the Gulf of Suez. The epicentral distribution map (Figure 4c) reveals that seismic activity in the northern Red Sea is concentrated around the Gulf of Suez’s entrance, and that activity in the middle of the Red Sea is continuous southward [70,71]. The junction of NW (Gulf of Suez-Red Sea) faults with the Aqaba trend, as well as plutonic activity, might explain the cluster of activity at this location. Few occurrences occur along the transform faults that span the rift axis in the middle Red Sea. The first is near the Gulf of Suez’s southern end. The second is in the Egyptian Red Sea Hills. Both have been identified as hotspots for micro-earthquakes. Along the Suez Rift, the seismic activity extends to the north, including the northern section of the Eastern Desert. This seismic trend is the most active within Egypt’s landmass, extending northwest toward Cairo and Alexandria in the Mediterranean Sea. The Red Sea rifting, as well as multiple active faults with NNW tendencies parallel to the Red Sea-Gulf of Suez direction and its continuation toward the east Mediterranean, are responsible for the activity of this trend [70]. The most active seismic zone in the Gulf of Suez is the southern section, which is the location of the greatest event, which occurred in 1969. The relatively high degree of local seismicity along the Gulf of Suez-Cairo-Alexandria Zone indicates tectonic activity, as evidenced by a long historical record that includes multiple large-magnitude shocks. In the Gulf of Suez, seismicity data shows two distinct NW-SE patterns [51,68,72]. The occurrences of the two trends might be linked to the Precambrian outcrops of southern Sinai and the Gulf of Suez depression’s bounding faults (Figure 4d). The occurrence of swarms is the major feature of seismicity in the Gulf of Aqaba. Before 1995, the Gulf area was hit by several swarms over the previous 12 years (Figure 4c,d). The ones that stand out are those that happened in 1983, 1990 and 1993. The prevalence of earthquake swarms in the Aqaba Gulf appeared to be spreading southward. It should be noted that the devastating earthquake of November 22, 1995 ( M w = 7.2) occurred close to the 1993 swarm location in the Aragonese Deep’s eastern border. The main shock in the Gulf of Aqaba in November 1995, and its subsequent aftershock series, were significantly more catastrophic than any previously known seismic sequence with a main-shock–aftershock pattern. An NNE-SSW linear trend may be seen in the epicentral distribution of its aftershocks [50]. Although Egypt is classified as having low to moderate seismicity, it has been subjected to a variety of severe earthquakes throughout its history. An earthquake of a magnitude of M b = 6.3 , which is equivalent to M s = 6.9 , struck the Gulf of Suez’s entrance on March 31, 1969, inflicting serious destruction in Egypt and being felt strongly in Saudi Arabia. On November 14, 1981, an earthquake of a magnitude of M b = 5.3 , which is equivalent to M s = 5.6 , struck the Aswan region. In the epicentral region, eleven structures were damaged and surface faulting was noted [73]. The most recent destructive earthquake occurred on 12 October 1992, near Cairo, with a magnitude of M b = 5.9 , which is equivalent to M s = 5.3 . It was one of Egypt’s most devastating earthquakes this century. In the Cairo region alone, at least 541 people were killed, 6500 were wounded, and 8300 houses were destroyed. Damages were estimated to be around USD 300 million based on preliminary estimates [74]. Many ancient structures (such as mosques, pyramids, and temples) were damaged by the earthquake, according to reports [63]. Figure 4c depicts the significant events that have impacted Egypt.

4.3. R S Data Acquisition

Because of its synoptic vision and capacity to gather information across a span of wavelengths, Landsat and other satellite images have often been suggested as the appropriate data source for lineament extraction and structural development. For fault segment susceptibility mapping (possible fault zone mapping) in the research region, a 30 m spatial resolution of the digital elevation model D E M was utilized, which reflects the surface topography measured in a regular grid. Bare-earth DEMs are used to identify geomorphological characteristics and map topographic lineaments as they depict the Earth’s surface after man-made items and plants have been removed [20,75,76,77,78].
The DEMs were generated from the Shuttle Radar Topography Mission S R T M . Because of its superior vertical accuracy [79,80,81,82], which aids in the extraction of lineaments in rugged terrain and has been successfully employed in lineament studies, particularly for highlighting geologic structures and fractures controlled by topography [83,84,85,86], SRTM-DEM is preferred over other satellite data, such as the ASTER-GDEM. It is of note that SRTM-DEM with 30 m spatial resolution has been obtained from the United States Geological Survey (USGS) and has been subjected to shaded relief mapping to enhance the perception of the structural features [87]. Accordingly, it sharpens the boundary between the adjacent areas and assists in identifying the various lineament features. The ASTER SRTM-DEM is a collection of 1° by 1° tiles that spans 22°N and 31°N and has an estimated precision of 20 m for vertical data and 30 m for horizontal data at 95 percent confidence [88]. The SRTM-DEM is a GeoTIFF file with a 1 arc-second (30 m) grid, as shown in Figure 5a. When picking DEM visualizations for lineament mapping, care should be taken. A basic gray-scale or color image of a DEM illustrates the broad topography of the ground, but it lacks fine details, making it unsuitable for lineament mapping. Different visualization approaches have proven successful in augmenting terrain characteristics to facilitate lineament extraction, particularly shaded relief representations of DEMs [89]. The prepared shaded-relief image that will be utilized for automatic lineament extraction is shown in Figure 5b. Shaded-relief images were produced by applying analytical hill shading [90]. By inputting both altitude and azimuth parameters, it is possible to replicate topographic lighting under various artificial light directions. The brightness of a grid cell in a shaded relief depiction is governed by the angle between the surface normal and lighting direction, producing the appearance of a landscape lit by a user-defined sun position. The solar elevation angle (angle from the horizon) and the solar illumination angle or azimuth (direction of the sun’s beams in relation to the north) are the two basic inputs for constructing a hill shadow map. Lower sun angles were more efficient in highlighting small topography changes in low relief zones in the research area [91]. More shadows emerged from the decreased light angle, making lineament detection easier.

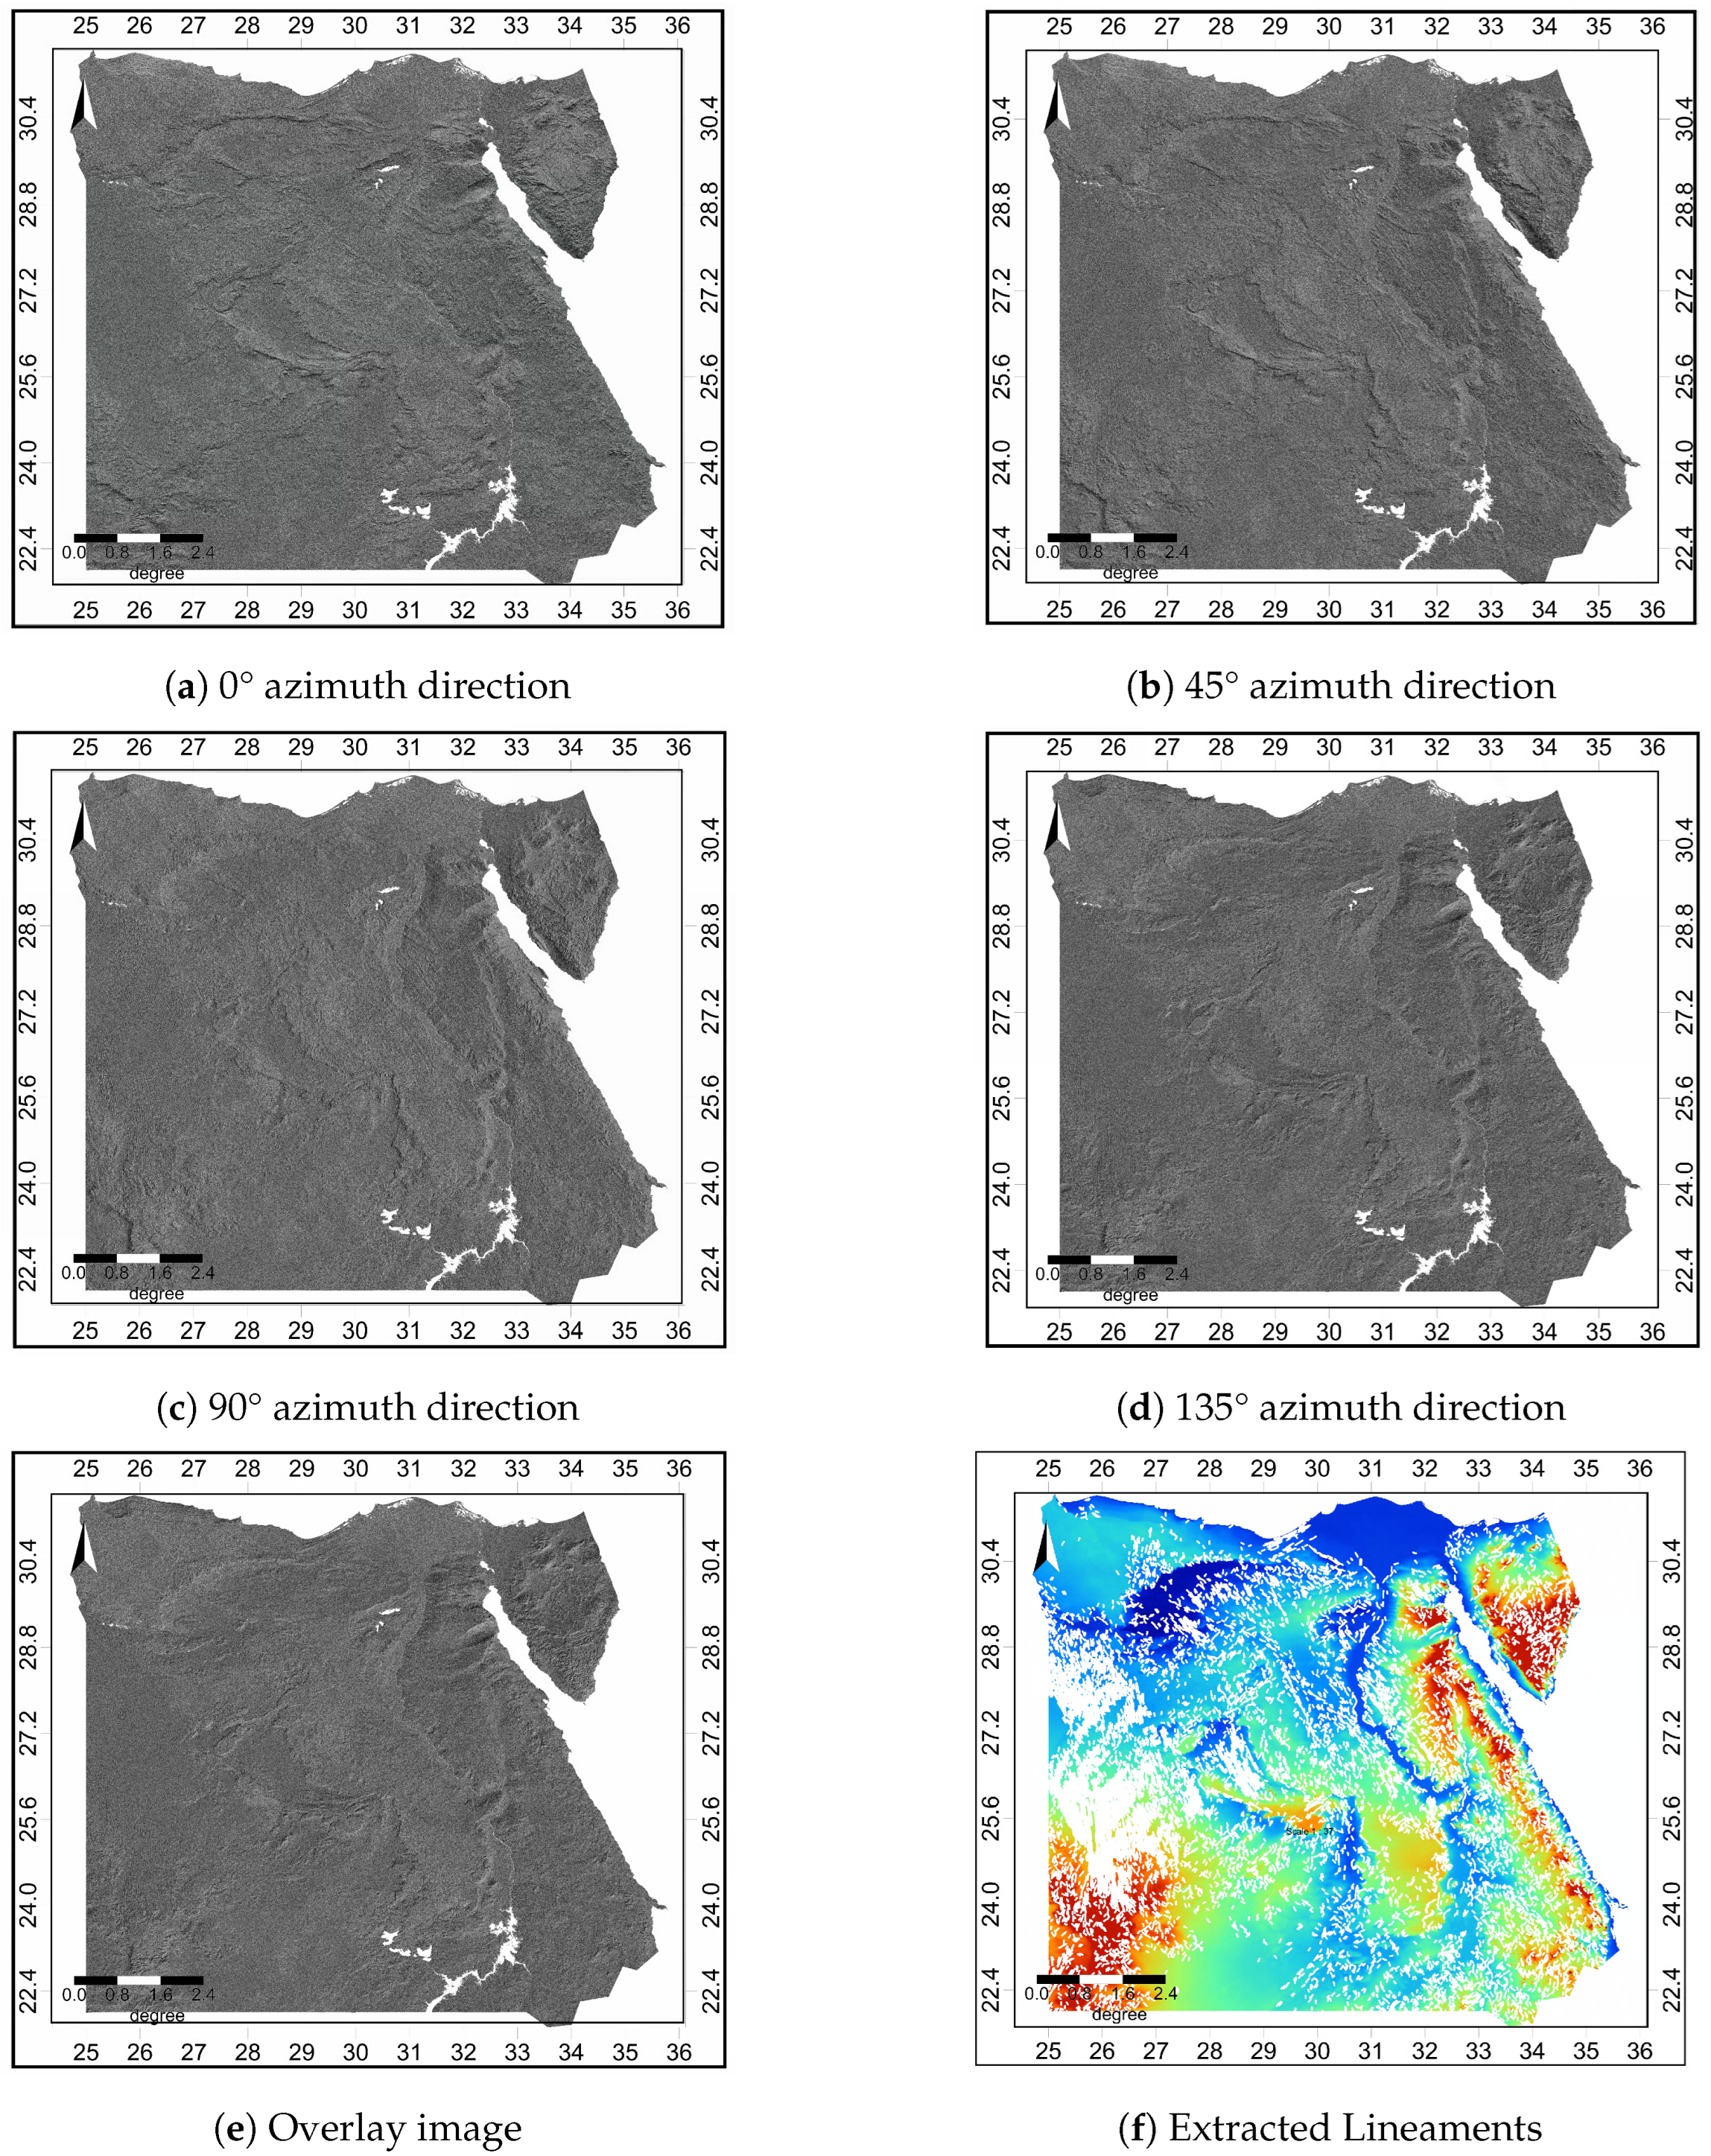
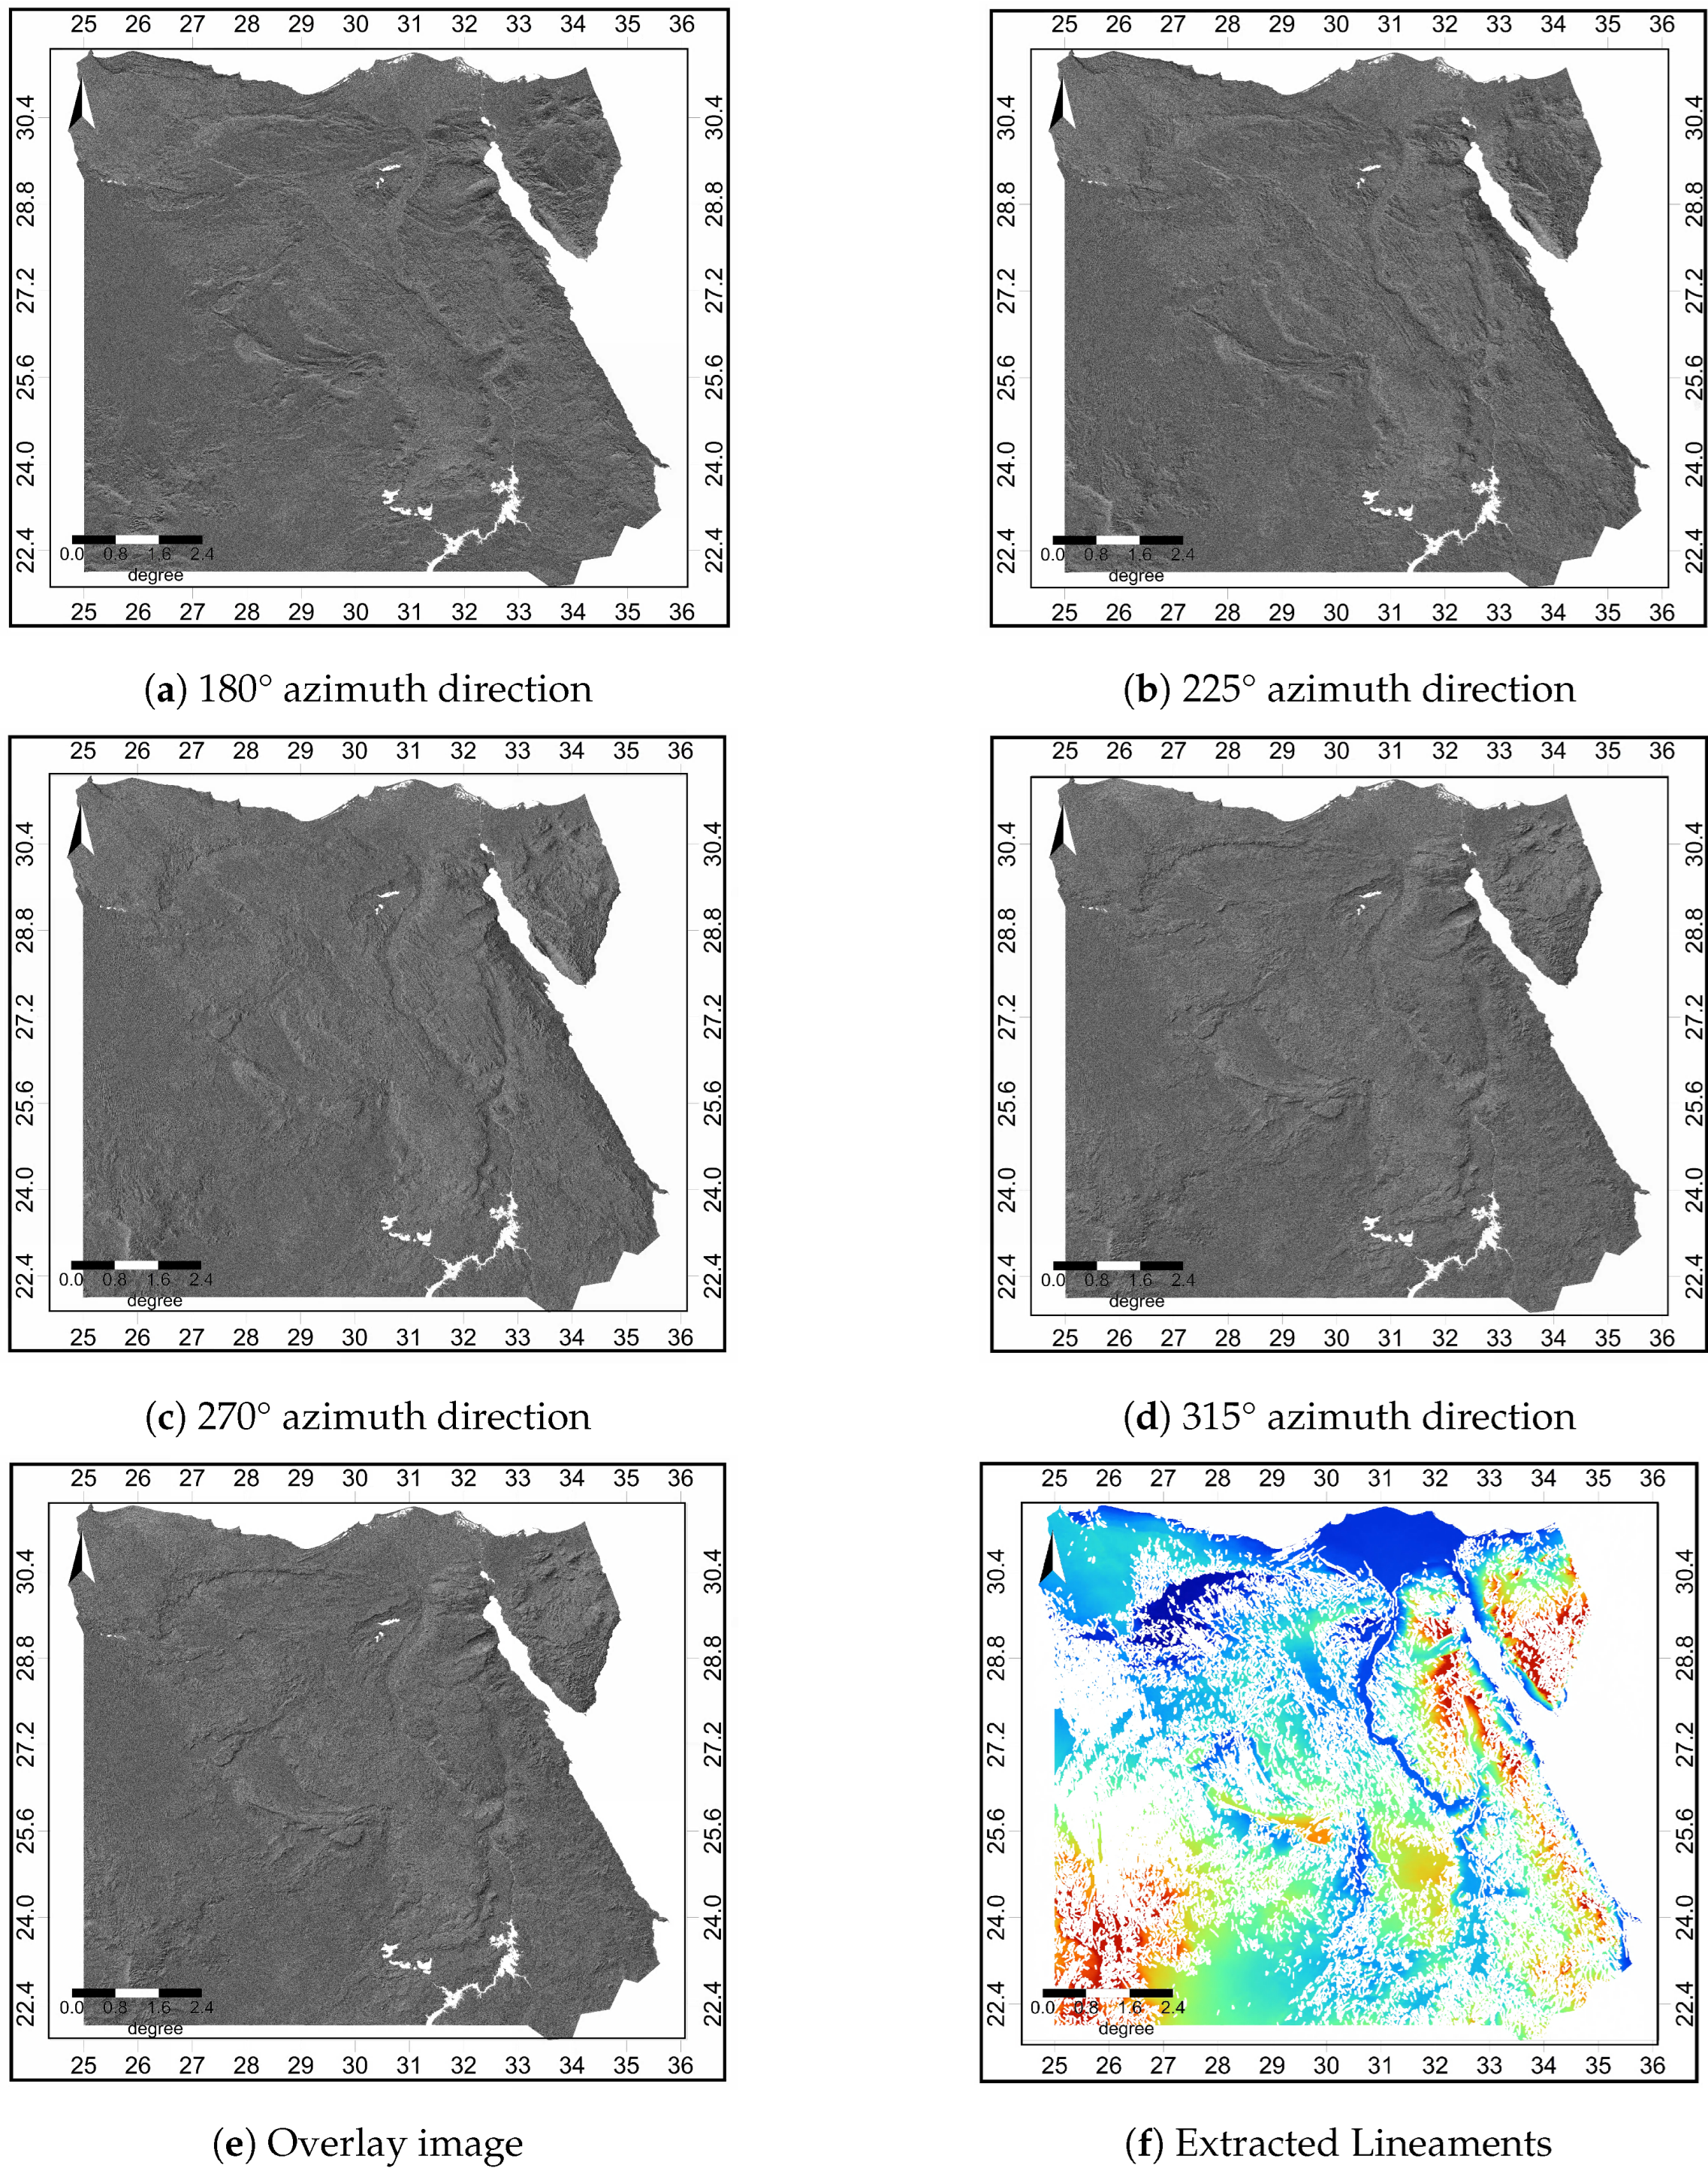
4.4. Automatic Surface Lineaments Extraction

Several lineament researchers have used either an automated or a manual technique to generate lineaments [24].
The azimuthal directions of the utilized DEM were varied across a variety of orientations, including 0°, 45°, 90°, 135°, 180°, 225°, 270°, and 315°. These azimuthal directions were chosen to allow for comprehensive lineament extraction throughout a 360° orientation. An ambient light setting of 0.07 with a light direction of 25° aided the creation of shaded relief images. The hillshading shadow darkness and hillshading from direct light were both kept at 0, whereas the vertical exaggeration was retained at 2.0. Eight shaded-relief images were spatially created from DEM based on azimuthal directions. The generated shaded-relief images (see Figure 6 and Figure 7) that were generated from DEM data are not influenced by weathering or other factors, and have a high level of precision and capacity to indicate the Earth’s surface vertical extension [24,84,87].
Computer-assisted software is used to perform automated lineament extraction. Enhancement, filtering, edge recognition, and lineament extraction are all part of automated processing. The noise, threshold, size, and orientation of linear features are all taken into account by an automatic lineament extraction technique [24,84]. The initial phase to extract linear topographic features from the DEM was the creation of eight different shaded-relief mosaics, shown in Figure 6 and Figure 7, which were then blended into a single image (Figure 6e and Figure 7e) using a G I S overlay approach.
In recent years, the Geomatica software L I N E module has become the industry standard for automated geological lineament extraction [83,92]. Using edge detection, thresholding, and curve extraction of the LINE module can extract the lineaments and change them into vector format depending on the input parameters. These parameters are: filter radius ( R A D I ), with recommended values of 3–8 pixel, edge gradient threshold ( G T H R ), with acceptable values of 10–70, curve length threshold ( L T H R ), with a common value of 10 pixel in most cases, line-fitting error threshold ( F T H R ), with recommended values of 2–5, angular difference threshold ( A T H R ), with an appropriate angle of 3–20 degrees, and linking distance threshold ( D T H R ), with efficient values between 10 and 45 pixels [84,92].
In the current study, the suggested values for filter radius ( R A D I ), edge gradient threshold ( G T H R ), curve length threshold ( L T H R ), line-fitting error threshold ( F T H R ), angular difference threshold ( A T H R ), and linking distance threshold ( D T H R ) were selected based on several trail and error tests. The utilized threshold values of the six parameters controlling extraction of the lineaments are given in Table 1. To obtain the optimum threshold values, general features of lineaments, such as length, curvature, segmentation, separation, and so on are taken into account.
There are three steps in the L I N E module detection technique. The input image is first filtered with a Gaussian function, the radius of which is determined by the R A D I parameter. Then, the gradient is calculated using the filtered image. Finally, pixels with non-local maximum gradients are suppressed where the edge strength =   0 . To obtain a binary image, a threshold is employed for the edge strength image in the second stage. An edge element is represented by each pixel in the binary image. The G T H R parameter determines the threshold value. Curves are recovered from the binary edge image in the third stage. There are multiple sub-steps in this phase. To create pixel-wide skeleton curves, a thinning procedure is first performed on the binary edge image. The image is then used to extract a series of pixels for each curve. If a curve has a pixel number less than the parameter value L T H R , it is no longer processed. Piecewise line segments are fitted to an extracted pixel curve to transform it into vector form. The generated polyline is a close approximation of the original pixel curve, with the F T H R parameter defining the maximum fitting error (distance between the two). Finally, the technique connects polyline pairs when the two polyline end segments face each other and have a similar orientation (the angle between the two segments is smaller than the parameter A T H R ) and the two end-segments are near each other (the distance between the end points is less than the parameter D T H R ). The automatically extracted lineaments for the first four angles mosaic are shown in Figure 6f, while the extracted lineaments for the remaining four angles are shown in Figure 7f.

5. Capable Faulting Potential Assessment

Visual inspection of the final produced lineaments maps (Figure 6f and Figure 7f) indicated that all of the lineaments are organized and follow consistent directions. The regional trends of the significant lineaments are dominated by two major directions: the NNW–SSE direction, which runs parallel to the Red Sea coastline line, and the ENE–WSW direction, which runs approximately perpendicular to the preceding one. The numerous lineament orientations are generally congruent with faults and lithological connections according to the geological map [28] of Egypt.
It is not always easy to evaluate or identify capable faults, especially with respect to determining their seismic potential. Numerous factors hinder the recognition of capable faults, such as poor surface exposure, plastic deformation of near-surface materials, conflicting or incomplete geologic, seismologic, or geophysical observations, and basic assumptions about fault activity or non-activity. Several thematic layers were selected, scanned, and georeferenced in the current study to be included in the G I S geodatabase of capable faults. The entire process utilized to define the capable faults is depicted in Figure 3.
The intersections of all input layers were computed using the pairwise Intersect tool. Instead of considering all possible combinations of characteristics, intersections were calculated based on pairs of features. Pairwise intersection takes one feature from the first input and intersects it with the features in the second input with which it overlaps. The distribution of major surface and subsurface faults are shown in Figure 8a and are included as a thematic layer in the G I S database.
All the structural data acquired to describe fault activity in Egypt are depicted in Figure 8. The locations of reported historical and instrumental seismic activities, as well as field surveys, were used to validate our findings and to enable better understanding of the relationships between geological and geomorphological features and large-scale seismic activity, after integrating various geophysical anomaly data.
Mainland faults are predominantly normal or strike-slip faults, with lengths that typically range from a few to a couple of tens of km and generate seismic hazards from shallow earthquakes. Their importance in seismic hazard assessment is great, since they commonly bound fault valleys (grabens) in which the largest percentage of Egypt’s population lives. Therefore, their size is not such an important factor for assessment of seismic hazard, as is their proximity to populated places. A characteristic example is the Ms 5.9 Dahshour earthquake in 1992, which was produced by a relatively small fault; it did, however, inflict severe damage to hundreds of buildings and had fatal consequences.
Offshore faults can be of any kind, lthough they tend to be normal or strike-slip faults in the Red Sea and the Mediterranean Sea. Depending on their type, they can be from a few to several tens of km long. They are the sources of the largest earthquakes observed in Egypt, as they are commonly directly or indirectly associated with tectonic activity.

6. Results and Discussion

One of the most important activities for assessing seismic danger in any location is estimation of the M m a x earthquake. M m a x is defined as the seismic regime in an underlying tectonic setup that is physically capable of happening within a specific seismic regime [93]. M m a x is usually calculated using one of two methods: deterministic or probabilistic. When the historical seismological record is longer than the recurrence interval of M m a x , or when the seismicity rate in the mapped region is high, it is determined deterministically by adding an increment value to the greatest magnitude detected in the region [94,95]. Kijko [96] described numerous approaches for estimating M m a x statistically or probabilistically using seismic data from a specific location.

Estimation of Maximum Magnitude for the Capable Faults of Egypt

The basic goal of every tectonic investigation is to estimate the size of the greatest earthquake that might be caused by a given fault. According to Klügel [97], we should utilize geology and seismic history to identify earthquake sources and interpret the largest earthquake that each source is capable of creating, independent of the time for seismic hazard assessment [1,23,76,98,99,100,101,102]. These are the greatest earthquakes that may be realistically predicted, or the maximum credible earthquakes (MCEs). The regional rupture characteristic and potential earthquake zones were taken into account while estimating the M m a x forecast for Egypt’s competent faults. Past earthquake rupture lengths were calculated and utilized to determine the region’s rupture nature.
Earthquakes, according to the energy release idea, relieve the strain energy that builds up on faults, therefore they should be more likely to occur in locations where there has been little or no seismic activity for a long period [103]. In areas where no major earthquakes have occurred, but small earthquakes have been documented, potential seismogenic sources have been found (Figure 8). These sources have not entirely released the stored energy, indicating the possibility of future earthquakes. These areas are understood to be the region’s most likely earthquake zones. In and around Egypt, 2967 such possible locations have been found (Figure 8). The regional rupture nature and the length of the seismogenic source adjacent to the zone are used to determine the maximum typical earthquake magnitude.
Because the objective of most mapping is not to find flaws, the veracity of the map created might be questioned. As a result, the lineament map’s total accuracy is 38.69 percent. When examined for the region around the Egypt fault zone, this accuracy rises to 50.28.
Numerous empirical connections have been developed from various datasets [104,105], implying that the empirical relationship chosen should take into account the dataset’s properties, such as the geological condition and seismicity. The recently determined relationship [104] between the maximum moment magnitude and the surface rupture length (SRL) was employed in the current investigation. Once again, the maximum characteristic earthquake magnitude is estimated by considering the regional rupture character and the length of the seismogenic source close to the zone. Figure 9a illustrates the delineated capable faults, while Figure 9b depicts the spatial distribution of M m a x in the mapped area. To test the reliability of the estimated M m a x values, they were compared with M m a x determined from the most recent seismic source zones in Egypt proposed by [65,106,107]. Table 2 lists the comparison values of M m a x .

7. Conclusions and Recommendations

This study involved the analysis of the regional tectonic properties of rocks inside the Egyptian mainland using DEM-derived lineaments. DEM is useful for creating and analyzing the deformation associated with regional scale tectonic activity in several places, especially, in rocks. Topographical information collected from DEM has been connected to numerous structural effects, such as faulting, folds, and fractures. Lineaments are geomorphological structures that are surface manifestations of structural characteristics. By locating and ground-truthing lineaments, faults that were previously ignored because of their delicate features may be recognized and mapped.
The interpretation of the deformational properties of the seismotectonic evolution of Egypt requires detailed study and delineation of tectonic faults on the Egyptian mainland. The disclosure of these tectonics that is evident at the surface can aid in their mapping utilizing various geographical data. Although DEM has been employed in lineament production and extraction in the past, the use of a hybrid multi-directional lineament extraction procedure is unique and may be used to extract lineaments inside seismo-tectonic activity zones.
The major conclusions of this study are as follows:
  • The automated lineament extraction failed to detect the faults or fault zones that exist in the region. Moreover, the length and pattern of the defects were the issues that this study had to deal with. Consequently, we conducted further studies using the manually derived lineaments.
  • A manual approach was anticipated to be successful in extracting the lineaments in the mapped area. The fault map of the area derived from the literature was compared to the resultant lineament map.
  • According to the lineament maps, any fault zones in the plotted region exist with equivalent densities to the Egypt fault zone. These zones may be found in the area’s southwestern, northeastern, and southern regions. The middle areas of the area, it was found, had more faults than the fault map of the area indicated. Due to extensive foliage and rugged topography, these faults are unlikely to be mapped. In the area, a fault trend different than the NE-SW direction (the Egypt fault zone pattern) is stressed. This is an NW-SE tendency that is typically seen in the area’s central areas.
  • Satellite R S techniques can be used to examine active faults in a weakly active tectonic region, contributing to significant engineering projects and neotectonic research.
Accordingly, the following recommendations are provided for stakeholders:
  • Field investigations (ground truth studies) are recommended as the most effective method of determining the correctness of the extracted lineaments.
  • There is no consensus on how to choose the best band for manual lineament extraction. As a result, it is suggested that the geology, topographic, and vegetation cover of the chosen location be taken into consideration.
  • Manual lineament extraction is a technique that is entirely reliant on the user. The expert’s knowledge improves the map’s overall trustworthiness.

Author Contributions

Conceptualization, S.S.R.M., M.S.A., and H.E.A.; methodology, S.S.R.M. and M.S.A.; investigation, M.S.A.; writing—original draft preparation, S.S.R.M.; writing—review and editing, M.S.A.; supervision, S.S.R.M., M.S.A. and H.E.A.; resources, S.S.R.M. and M.S.A.; data curation, S.S.R.M., M.S.A. and H.E.A.; visualization, M.S.A. All authors have read and agreed to the published version of the manuscript.

Funding

This research received no external funding.

Acknowledgments

This work was funded by the National Research Institute of Astronomy and Geophysics (NRIAG), Helwan, Cairo, Egypt. The authors, therefore, acknowledge with thanks NRIAG technical and financial support. The authors would like to thank the Egyptian National Seismic Network for making the seismic activity data available. The authors would also like to thank the Cement Project for its help and support.

Conflicts of Interest

The authors declare no conflict of interest.

References

  1. Moustafa, S.S.; Abdalzaher, M.S.; Naeem, M.; Fouda, M.M. Seismic hazard and site suitability evaluation based on multicriteria decision analysis. IEEE Access 2022, 10, 69511–69530. [Google Scholar] [CrossRef]
  2. Moustafa, S.S.; Abdalzaher, M.S.; Khan, F.; Metwaly, M.; Elawadi, E.A.; Al-Arifi, N.S. A Quantitative Site-Specific Classification Approach Based on Affinity Propagation Clustering. IEEE Access 2021, 9, 155297–155313. [Google Scholar] [CrossRef]
  3. Angelier, J.; Chu, H.T.; Lee, J.C.; Hu, J.C. Active faulting and earthquake hazard: The case study of the Chihshang fault, Taiwan. J. Geodyn. 2000, 29, 151–185. [Google Scholar] [CrossRef]
  4. Baker, J.W.; Abrahamson, N.A.; Whitney, J.W.; Board, M.P.; Hanks, T.C. Use of fragile geologic structures as indicators of unexceeded ground motions and direct constraints on probabilistic seismic hazard analysis. Bull. Seismol. Soc. Am. 2013, 103, 1898–1911. [Google Scholar] [CrossRef]
  5. Butler, R.; Spencer, S.; Griffiths, H. Transcurrent fault activity on the Dead Sea Transform in Lebanon and its implications for plate tectonics and seismic hazard. J. Geol. Soc. 1997, 154, 757–760. [Google Scholar] [CrossRef]
  6. Cello, G.; Mazzoli, S.; Tondi, E.; Turco, E. Active tectonics in the central Apennines and possible implications for seismic hazard analysis in peninsular Italy. Tectonophysics 1997, 272, 43–68. [Google Scholar] [CrossRef]
  7. Giona Bucci, M.; Schoenbohm, L.M. Tectono-Geomorphic Analysis in Low Relief, Low Tectonic Activity Areas: Case Study of the Temiskaming Region in the Western Quebec Seismic Zone (WQSZ), Eastern Canada. Remote Sens. 2022, 14, 3587. [Google Scholar] [CrossRef]
  8. Abdalzaher, M.S.; El-Hadidy, M.; Gaber, H.; Badawy, A. Seismic hazard maps of Egypt based on spatially smoothed seismicity model and recent seismotectonic models. J. Afr. Earth Sci. 2020, 170, 103894. [Google Scholar] [CrossRef]
  9. Abdalzaher, M.S.; Elsayed, H.A. Employing data communication networks for managing safer evacuation during earthquake disaster. Simul. Model. Pract. Theory 2019, 94, 379–394. [Google Scholar] [CrossRef]
  10. Machette, M.N. Active, capable, and potentially active faults—a paleoseismic perspective. J. Geodyn. 2000, 29, 387–392. [Google Scholar] [CrossRef]
  11. Skobelev, S.; Hanon, M.; Klerkx, J.; Govorova, N.; Lukina, N.; Kazmin, V. Active faults in Africa: A review. Tectonophysics 2004, 380, 131–137. [Google Scholar] [CrossRef]
  12. Bossennec, C.; Frey, M.; Seib, L.; Bär, K.; Sass, I. Multiscale Characterisation of Fracture Patterns of a Crystalline Reservoir Analogue. Geosciences 2021, 11, 371. [Google Scholar] [CrossRef]
  13. Arnous, M.O.; Green, D.R. GIS and remote sensing as tools for conducting geo-hazards risk assessment along Gulf of Aqaba coastal zone, Egypt. J. Coast. Conserv. 2011, 15, 457–475. [Google Scholar] [CrossRef]
  14. Elmahdy, S.I.; Mohamed, M.M. Mapping of tecto-lineaments and investigate their association with earthquakes in Egypt: A hybrid approach using remote sensing data. Geomat. Nat. Hazards Risk 2016, 7, 600–619. [Google Scholar] [CrossRef] [Green Version]
  15. Rabie, S.I.; Ammar, A.A. Pattern of the main tectonic trends from remote geophysics, geological structures and satellite imagery, Central Eastern Desert, Egypt. Int. J. Remote Sens. 1990, 11, 669–683. [Google Scholar] [CrossRef]
  16. Abdalzaher, M.S.; Elsayed, H.A.; Fouda, M.M. Employing Remote Sensing, Data Communication Networks, AI, and Optimization Methodologies in Seismology. IEEE J. Sel. Top. Appl. Earth Obs. Remote Sens. 2022, 15, 9417–9438. [Google Scholar] [CrossRef]
  17. Nath, B.; Singh, R.P.; Gahalaut, V.K.; Singh, A.P. Dynamic Relationship Study between the Observed Seismicity and Spatiotemporal Pattern of Lineament Changes in Palghar, North Maharashtra (India). Remote Sens. 2021, 14, 135. [Google Scholar] [CrossRef]
  18. Liu, Z.; Han, L.; Du, C.; Cao, H.; Guo, J.; Wang, H. Fractal and multifractal characteristics of lineaments in the Qianhe Graben and its tectonic significance using remote sensing images. Remote Sens. 2021, 13, 587. [Google Scholar] [CrossRef]
  19. Kokinou, E.; Panagiotakis, C. Automatic Pattern Recognition of Tectonic Lineaments in Seafloor Morphology to Contribute in the Structural Analysis of Potentially Hydrocarbon-Rich Areas. Remote Sens. 2020, 12, 1538. [Google Scholar] [CrossRef]
  20. Masoud, A.; Koike, K. Tectonic architecture through Landsat-7 ETM+/SRTM DEM-derived lineaments and relationship to the hydrogeologic setting in Siwa region, NW Egypt. J. Afr. Earth Sci. 2006, 45, 467–477. [Google Scholar] [CrossRef]
  21. Moustafa, S.S.; Alarifi, N.; Naeem, M.; Jafri, M.K. An integrated technique for delineating groundwater contaminated zones using geophysical and remote sensing techniques: A case study of Al-Quway’iyah, central Saudi Arabia. Can. J. Earth Sci. 2014, 51, 797–808. [Google Scholar] [CrossRef]
  22. Valkanou, K.; Karymbalis, E.; Papanastassiou, D.; Soldati, M.; Chalkias, C.; Gaki-Papanastassiou, K. Assessment of neotectonic landscape deformation in Evia Island, Greece, using GIS-based multi-criteria analysis. ISPRS Int. J. Geo-Inf. 2021, 10, 118. [Google Scholar] [CrossRef]
  23. Moustafa, S.S.; Al-Arifi, N.S.; Jafri, M.K.; Naeem, M.; Alawadi, E.A.; Metwaly, M.A. First level seismic microzonation map of Al-Madinah province, western Saudi Arabia using the geographic information system approach. Environ. Earth Sci. 2016, 75, 251. [Google Scholar] [CrossRef]
  24. Ahmadi, H.; Pekkan, E. Fault-based geological lineaments extraction using remote sensing and GIS—A review. Geosciences 2021, 11, 183. [Google Scholar] [CrossRef]
  25. Javhar, A.; Chen, X.; Bao, A.; Jamshed, A.; Yunus, M.; Jovid, A.; Latipa, T. Comparison of multi-resolution optical Landsat-8, Sentinel-2 and radar Sentinel-1 data for automatic lineament extraction: A case study of Alichur area, SE Pamir. Remote Sens. 2019, 11, 778. [Google Scholar] [CrossRef] [Green Version]
  26. Elhadidy, M.; Abdalzaher, M.S.; Gaber, H. Up-to-date PSHA along the Gulf of Aqaba-Dead Sea transform fault. Soil Dyn. Earthq. Eng. 2021, 148, 106835. [Google Scholar] [CrossRef]
  27. Kulke, H. Regional Petroleum Geology of the World. Part II, Africa, America, Australia and Antarctica; G. Borntraeger: Berlin, Germany, 1995. [Google Scholar]
  28. Said, R. The Geology of Egypt; Routledge: London, UK, 2017. [Google Scholar]
  29. Selim, E.S.; Abouad, E.; Moustafa, S.S.; Al-Arifi, N.S. Active tectonic trends and crustal modeling of the eastern Mediterranean Sea deduced from geophysical data. Environ. Earth Sci. 2016, 75, 1–13. [Google Scholar] [CrossRef]
  30. Lazos, I.; Papanikolaou, I.; Sboras, S.; Foumelis, M.; Pikridas, C. Geodetic Upper Crust Deformation Based on Primary GNSS and INSAR Data in the Strymon Basin, Northern Greece—Correlation with Active Faults. Appl. Sci. 2022, 12, 9391. [Google Scholar] [CrossRef]
  31. Wilkinson, M.W.; McCaffrey, K.J.; Jones, R.R.; Roberts, G.P.; Holdsworth, R.E.; Gregory, L.C.; Walters, R.J.; Wedmore, L.; Goodall, H.; Iezzi, F. Near-field fault slip of the 2016 Vettore Mw 6.6 earthquake (Central Italy) measured using low-cost GNSS. Sci. Rep. 2017, 7, 1–7. [Google Scholar] [CrossRef]
  32. Mcclusky, S.; Balassanian, S.; Barka, A.; Demir, C.; Ergintav, S.; Georgiev, I.; Gurkan, O.; Hamburger, M.; Hurst, K.; Kahle, H.; et al. Global Positioning System constraints on plate kinematics and dynamics in the eastern Mediterranean and Caucasus. J. Geophys. Res. Solid Earth 2000, 105, 5695–5719. [Google Scholar] [CrossRef]
  33. Müller, M.; Geiger, A.; Kahle, H.G.; Veis, G.; Billiris, H.; Paradissis, D.; Felekis, S. Velocity and deformation fields in the North Aegean domain, Greece, and implications for fault kinematics, derived from GPS data 1993–2009. Tectonophysics 2013, 597, 34–49. [Google Scholar] [CrossRef]
  34. Hollenstein, C.; Müller, M.; Geiger, A.; Kahle, H.G. Crustal motion and deformation in Greece from a decade of GPS measurements, 1993–2003. Tectonophysics 2008, 449, 17–40. [Google Scholar] [CrossRef]
  35. Nyst, M.; Thatcher, W. New constraints on the active tectonic deformation of the Aegean. J. Geophys. Res. Solid Earth 2004, 109. [Google Scholar] [CrossRef] [Green Version]
  36. Reilinger, R.; McClusky, S.; Paradissis, D.; Ergintav, S.; Vernant, P. Geodetic constraints on the tectonic evolution of the Aegean region and strain accumulation along the Hellenic subduction zone. Tectonophysics 2010, 488, 22–30. [Google Scholar] [CrossRef]
  37. Hussein, H.; Abou Elenean, K.; Marzouk, I.; Korrat, I.; El-Nader, I.A.; Ghazala, H.; ElGabry, M. Present-day tectonic stress regime in Egypt and surrounding area based on inversion of earthquake focal mechanisms. J. Afr. Earth Sci. 2013, 81, 1–15. [Google Scholar] [CrossRef]
  38. Ghamry, E.; Mohamed, E.K.; Abdalzaher, M.S.; Elwekeil, M.; Marchetti, D.; De Santis, A.; Hegy, M.; Yoshikawa, A.; Fathy, A. Integrating pre-earthquake signatures from different precursor tools. IEEE Access 2021, 9, 33268–33283. [Google Scholar] [CrossRef]
  39. Stern, R.J.; Gottfried, D.; Hedge, C.E. Late Precambrian rifting and crustal evolution in the Northeastern Desert of Egypt. Geology 1984, 12, 168–172. [Google Scholar] [CrossRef]
  40. Tassy, A.; Crouzy, E.; Gorini, C.; Rubino, J.L. Mesozoic carbonate-siliciclastic platform to basin systems of a South Tethyan margin (Egypt, East Mediterranean). In Proceedings of the EGU General Assembly Conference Abstracts, Vienna, Austria, 12–17 April 2015; p. 3720. [Google Scholar]
  41. Abd-Allah, A.M.; Aal, M.H.A.; Ghandour, A. Structural characteristics and tectonic evolution of the northwestern margin of the Nile Delta, Egypt. J. Afr. Earth Sci. 2012, 68, 82–95. [Google Scholar] [CrossRef]
  42. Moustafa, A.R. Structural architecture and tectonic evolution of the Maghara inverted basin, Northern Sinai, Egypt. J. Struct. Geol. 2014, 62, 80–96. [Google Scholar] [CrossRef]
  43. Fergany, E.; Mekkawi, M.; Azeem, M.A.; Khalil, A. Integrated geologic and geophysical studies of north unstable shelf seismicity, Egypt. Arab. J. Geosci. 2015, 8, 5475–5490. [Google Scholar] [CrossRef]
  44. Sestini, G. Tectonic and sedimentary history of the NE African margin (Egypt—Libya). Geol. Soc. Lond. Spec. Publ. 1984, 17, 161–175. [Google Scholar] [CrossRef]
  45. Collins, A.S.; Blades, M.L.; Merdith, A.S. The Arabian–Nubian Shield Within the Neoproterozoic Plate Tectonic Circuit. In The Geology of the Arabian-Nubian Shield; Springer: Berlin/Heidelberg, Germany, 2021; pp. 195–202. [Google Scholar]
  46. Asim, K.M.; Moustafa, S.S.; Niaz, I.A.; Elawadi, E.A.; Iqbal, T.; Martínez-Álvarez, F. Seismicity analysis and machine learning models for short-term low magnitude seismic activity predictions in Cyprus. Soil Dyn. Earthq. Eng. 2020, 130, 105932. [Google Scholar] [CrossRef]
  47. Azer, M.K. Tectonic significance of Late Precambrian calc-alkaline and alkaline magmatism in Saint Katherina area, southern Sinai, Egypt. Geol. Acta Int. Earth Sci. J. 2007, 5, 255–272. [Google Scholar]
  48. Kröner, A.; Krüger, J.; Rashwan, A.e.A.A. Age and tectonic setting of granitoid gneisses in the Eastern Desert of Egypt and south-west Sinai. Geol. Rundsch. 1994, 83, 502–513. [Google Scholar] [CrossRef]
  49. Fowler, A.; Hassen, I.; Hassan, M. Tectonic evolution and setting of the Sa’al Complex, southern Sinai, Egypt: A Proterozoic continental back-arc rift model. J. Afr. Earth Sci. 2015, 104, 103–131. [Google Scholar] [CrossRef]
  50. Morsy, M.; Hussein, H.; Abou Elenean, K.; El-Hady, S. Stress field in the central and northern parts of the Gulf of Suez area, Egypt from earthquake fault plane solutions. J. Afr. Earth Sci. 2011, 60, 293–302. [Google Scholar] [CrossRef]
  51. Omran, M.A.; El Sharawy, M.S. Tectonic evolution of the Southern Gulf of Suez, Egypt: A comparison between depocenter and near peripheral basins. Arab. J. Geosci. 2014, 7, 87–107. [Google Scholar] [CrossRef]
  52. Steinberg, J.; Gvirtzman, Z.; Garfunkel, Z. Flexural response of a continental margin to sedimentary loading and lithospheric rupturing: The mountain ridge between the Levant Basin and the Dead Sea Transform. Tectonics 2014, 33, 166–186. [Google Scholar] [CrossRef]
  53. El Khrepy, S.; Koulakov, I.; Al-Arifi, N. Crustal structure in the area of the Cannon Earthquakes of Abu Dabbab (northern Red Sea, Egypt), from seismic tomography inversion. Bull. Seismol. Soc. Am. 2015, 105, 1870–1882. [Google Scholar] [CrossRef]
  54. Hosny, A.; Nyblade, A. Crustal structure in southeastern Egypt: Symmetric thinning of the northern Red Sea rifted margins. Geology 2014, 42, 219–222. [Google Scholar] [CrossRef]
  55. Khalil, S.; McClay, K. Extensional fault-related folding, northwestern Red Sea, Egypt. J. Struct. Geol. 2002, 24, 743–762. [Google Scholar] [CrossRef]
  56. Papadopoulos, G. Subduction-related large tsunamis in the Mediterranean Sea: A review. In Proceedings of the AGU Spring Meeting Abstracts, Cancun, Mexico, 14–17 May 2013; Volume 2013, p. NH41A–04. [Google Scholar]
  57. Tende, A.W.; Mustapha, T.; Fru, M.I.N.; Gajere, J.N.; Aminu, M.D. Hybrid extraction of tectonic lineaments from digital elevation model. Appl. Geomat. 2022, 1–18. [Google Scholar] [CrossRef]
  58. Gharib, A.A. Crustal structure of Tushka Region, Abu-Simbel, Egypt, inferred from spectral ratios of P waves of local earthquakes. Acta Geophys. 2006, 54, 361–377. [Google Scholar] [CrossRef]
  59. Mostafa, M.E.; Bishta, A.Z. Significance of lineament patterns in rock unit classification and designation: A pilot study on the Gharib-Dara area, northern Eastern Desert, Egypt. Int. J. Remote Sens. 2005, 26, 1463–1475. [Google Scholar] [CrossRef]
  60. Saleh, S. 3D crustal structure and its tectonic implication for Nile delta and greater Cairo regions, Egypt, from geophysical data. Acta Geod. Geophys. Hung. 2012, 47, 402–429. [Google Scholar] [CrossRef]
  61. Araffa, S.A.S. Delineation of groundwater aquifer and subsurface structures on North Cairo, Egypt, using integrated interpretation of magnetic, gravity, geoelectrical and geochemical data. Geophys. J. Int. 2013, 192, 94–112. [Google Scholar] [CrossRef] [Green Version]
  62. Badawy, A. Status of the crustal stress in Egypt as inferred from earthquake focal mechanisms and borehole breakouts. Tectonophysics 2001, 343, 49–61. [Google Scholar] [CrossRef]
  63. Sakr, K. Crustal deformation associated with the earthquake activity at Dahshour area, Southwest Cairo, Egypt. J. Geol. Soc. India 2007, 69, 397–401. [Google Scholar]
  64. Sultan, S.A.; Santos, F.A.M. Evaluating subsurface structures and stratigraphic units using 2D electrical and magnetic data at the area north Greater Cairo, Egypt. Int. J. Appl. Earth Obs. Geoinf. 2008, 10, 56–67. [Google Scholar] [CrossRef]
  65. Sawires, R.; Peláez, J.; Fat-Helbary, R.; Ibrahim, H.; García-Hernández, M. An updated seismic source model for Egypt. In Earthquake Engineering—From Engineering Seismology to Optimal Seismic Design of Engineering Structures; InTech: Rijeka, Croatia, 2015; pp. 1–51. [Google Scholar]
  66. Sawires, R.; Ibrahim, H.; Fat-Helbary, R.; Peláez, J. A seismological database for Egypt including updated seismic and focal mechanism catalogues. In Proceedings of the 8th Spanish-Portuguese Assembly of Geodesy and Geophysics, Évora, Portugal, 29–31 January 2014; pp. 29–31. [Google Scholar]
  67. Badawy, A. Historical seismicity of Egypt. Acta Geod. Et Geophys. Hung. 1999, 34, 119–135. [Google Scholar]
  68. Moustafa, S.S.; Mohamed, G.E.A.; Metwaly, M. Production of a homogeneous seismic catalog based on machine learning for northeast Egypt. Open Geosci. 2021, 13, 1084–1104. [Google Scholar] [CrossRef]
  69. Mazza, R. The Supposed Egyptian Earthquakes of 184 and 95 BC Critical Review and Some Lines of Research in Historical Seismology Using Greek Papyri from Egypt. 1998. Available online: https://doaj.org/article/5526e619df8d42eb9ea4fe610d3917b2 (accessed on 1 March 2022).
  70. El-Isa, Z. Seismicity and seismotectonics of the Red Sea Region. Arab. J. Geosci. 2015, 8, 8505–8525. [Google Scholar] [CrossRef]
  71. Youssef, S.E.H. Seismicity and seismotectonic setting of the Red Sea and adjacent areas. In The Red Sea; Springer: Berlin/Heidelberg, Germany, 2015; pp. 151–159. [Google Scholar]
  72. Hurukawa, N.; Seto, N.; Inoue, H.; Nishigami, K.; Marzouk, I.; Megahed, A.; Ibrahim, E.; Murakami, H.; Nakamura, M.; Haneda, T.; et al. Seismological observations in and around the southern part of the Gulf of Suez, Egypt. Bull. Seismol. Soc. Am. 2001, 91, 708–717. [Google Scholar] [CrossRef]
  73. Awad, M.; Mizoue, M. Earthquake activity in the Aswan region, Egypt. Pure Appl. Geophys. 1995, 145, 69–86. [Google Scholar] [CrossRef]
  74. Badawi, H.S.; Mourad, S.A. Observations from the 12 October 1992 Dahshour earthquake in Egypt. Nat. Hazards 1994, 10, 261–274. [Google Scholar] [CrossRef]
  75. Tsimi, C.; Ganas, A. Using the ASTER global DEM to derive empirical relationships among triangular facet slope, facet height and slip rates along active normal faults. Geomorphology 2015, 234, 171–181. [Google Scholar] [CrossRef]
  76. Moustafa, S.S. Application of the analytic hierarchy process for evaluating geo-hazards in the Greater Cairo area, Egypt. Electron. J. Geotech. Eng. 2015, 20, 1921–1938. [Google Scholar]
  77. Rahnama, M.; Gloaguen, R. TecLines: A MATLAB-based toolbox for tectonic lineament analysis from satellite images and DEMs, part 1: Line segment detection and extraction. Remote Sens. 2014, 6, 5938–5958. [Google Scholar] [CrossRef] [Green Version]
  78. Rahnama, M.; Gloaguen, R. Teclines: A MATLAB-based toolbox for tectonic lineament analysis from satellite images and DEMs, part 2: Line segments linking and merging. Remote Sens. 2014, 6, 11468–11493. [Google Scholar] [CrossRef] [Green Version]
  79. Elkhrachy, I. Vertical accuracy assessment for SRTM and ASTER Digital Elevation Models: A case study of Najran city, Saudi Arabia. Ain. Shams Eng. J. 2018, 9, 1807–1817. [Google Scholar] [CrossRef]
  80. Andreani, L.; Stanek, K.P.; Gloaguen, R.; Krentz, O.; Domínguez-González, L. DEM-based analysis of interactions between tectonics and landscapes in the Ore Mountains and Eger Rift (East Germany and NW Czech Republic). Remote Sens. 2014, 6, 7971–8001. [Google Scholar] [CrossRef] [Green Version]
  81. Chen, R.F.; Lin, C.W.; Chen, Y.H.; He, T.C.; Fei, L.Y. Detecting and characterizing active thrust fault and deep-seated landslides in dense forest areas of southern Taiwan using airborne LiDAR DEM. Remote Sens. 2015, 7, 15443–15466. [Google Scholar] [CrossRef] [Green Version]
  82. Liu, Z.; Han, L.; Yang, Z.; Cao, H.; Guo, F.; Guo, J.; Ji, Y. Evaluating the vertical accuracy of DEM generated from ZiYuan-3 stereo images in understanding the tectonic morphology of the Qianhe Basin, China. Remote Sens. 2021, 13, 1203. [Google Scholar] [CrossRef]
  83. Farahbakhsh, E.; Chandra, R.; Olierook, H.K.; Scalzo, R.; Clark, C.; Reddy, S.M.; Müller, R.D. Computer vision-based framework for extracting tectonic lineaments from optical remote sensing data. Int. J. Remote Sens. 2020, 41, 1760–1787. [Google Scholar] [CrossRef]
  84. Shetty, S.; Umesh, P.; Shetty, A. Lineament Extraction from Open-Source Digital Elevation Models: A Comparative Analysis. In Proceedings of the 2021 IEEE International Conference on Distributed Computing, VLSI, Electrical Circuits and Robotics (DISCOVER), Online, 19–20 November 2021; pp. 66–71. [Google Scholar]
  85. Abdullah, A.; Akhir, J.M.; Abdullah, I. Automatic mapping of lineaments using shaded relief images derived from digital elevation model (DEMs) in the Maran-Sungi Lembing area, Malaysia. Electron. J. Geotech. Eng. 2010, 15, 949–958. [Google Scholar]
  86. Ha, S.; Son, M.; Seong, Y.B. Active Fault Trace Identification Using a LiDAR High-Resolution DEM: A Case Study of the Central Yangsan Fault, Korea. Remote Sens. 2022, 14, 4838. [Google Scholar] [CrossRef]
  87. Suzen, M.; Toprak, V. Filtering of satellite images in geological lineament analyses: An application to a fault zone in Central Turkey. Int. J. Remote Sens. 1998, 19, 1101–1114. [Google Scholar] [CrossRef]
  88. Fujisada, H.; Bailey, G.B.; Kelly, G.G.; Hara, S.; Abrams, M.J. Aster dem performance. IEEE Trans. Geosci. Remote Sens. 2005, 43, 2707–2714. [Google Scholar] [CrossRef]
  89. Das, S.; Pardeshi, S.D. Comparative analysis of lineaments extracted from Cartosat, SRTM and ASTER DEM: A study based on four watersheds in Konkan region, India. Spat. Inf. Res. 2018, 26, 47–57. [Google Scholar] [CrossRef]
  90. Yoeli, P. The mechanisation of analytical hill shading. Cartogr. J. 1967, 4, 82–88. [Google Scholar] [CrossRef]
  91. Oguchi, T.; Aoki, T.; Matsuta, N. Identification of an active fault in the Japanese Alps from DEM-based hill shading. Comput. Geosci. 2003, 29, 885–891. [Google Scholar] [CrossRef]
  92. Geomatica, P. PCI Geomatica User’s Guide Version 12.0.2; Richmond Hill: Calgary, Alberta, 2012. [Google Scholar]
  93. Mohapatra, A.K.; Mohanty, W.K.; Verma, A.K. Estimation of maximum magnitude (M max): Impending large earthquakes in northeast region, India. J. Geol. Soc. India 2014, 83, 635–640. [Google Scholar] [CrossRef]
  94. Båth, M. Earthquake magnitude—recent research and current trends. Earth-Sci. Rev. 1981, 17, 315–398. [Google Scholar] [CrossRef]
  95. Wheeler, R.L. Methods of Mmax estimation east of the Rocky Mountains. US Geol. Surv. Open-File Rep. 2009, 1018, 44. [Google Scholar]
  96. Kijko, A.; Singh, M. Statistical tools for maximum possible earthquake magnitude estimation. Acta Geophys. 2011, 59, 674–700. [Google Scholar] [CrossRef] [Green Version]
  97. Klügel, J.U. Problems in the application of the SSHAC probability method for assessing earthquake hazards at Swiss nuclear power plants. Eng. Geol. 2005, 78, 285–307. [Google Scholar] [CrossRef]
  98. Abdalzaher, M.S.; Soliman, M.S.; El-Hady, S.M.; Benslimane, A.; Elwekeil, M. A deep learning model for earthquake parameters observation in IoT system-based earthquake early warning. IEEE Internet Things J. 2021, 9, 8412–8424. [Google Scholar] [CrossRef]
  99. Hamdy, O.; Gaber, H.; Abdalzaher, M.S.; Elhadidy, M. Identifying exposure of urban area to certain seismic hazard using machine learning and GIS: A case study of greater Cairo. Sustainability 2022, 14, 10722. [Google Scholar] [CrossRef]
  100. Moustafa, S.S.; Abdalzaher, M.S.; Yassien, M.H.; Wang, T.; Elwekeil, M.; Hafiez, H.E.A. Development of an optimized regression model to predict blast-driven ground vibrations. IEEE Access 2021, 9, 31826–31841. [Google Scholar] [CrossRef]
  101. Abdalzaher, M.S.; Moustafa, S.S.; Abdelhafiez, H.; Farid, W. An Optimized Learning Model Augment Analyst Decisions for Seismic Source Discrimination. IEEE Trans. Geosci. Remote Sens. 2022, 60, 5920212. [Google Scholar] [CrossRef]
  102. Abdalzaher, M.S.; Moustafa, S.S.; Abd-Elnaby, M.; Elwekeil, M. Comparative performance assessments of machine-learning methods for artificial seismic sources discrimination. IEEE Access 2021, 9, 65524–65535. [Google Scholar] [CrossRef]
  103. Day, R.W. Geotechnical Earthquake Engineering Handbook; McGraw-Hill Education: Toronto, ON, Canada, 2002. [Google Scholar]
  104. Wells, D.L.; Coppersmith, K.J. New empirical relationships among magnitude, rupture length, rupture width, rupture area, and surface displacement. Bull. Seismol. Soc. Am. 1994, 84, 974–1002. [Google Scholar]
  105. Anbazhagan, P.; Bajaj, K.; Moustafa, S.S.; Al-Arifi, N.S. Maximum magnitude estimation considering the regional rupture character. J. Seismol. 2015, 19, 695–719. [Google Scholar] [CrossRef]
  106. Mohamed, A.E.E.A.; El-Hadidy, M.; Deif, A.; Abou Elenean, K. Seismic hazard studies in Egypt. NRIAG J. Astron. Geophys. 2012, 1, 119–140. [Google Scholar] [CrossRef] [Green Version]
  107. El-Eraki, M.A.; Mostafa, S.I.; Abd el-aal, A.e.-a.K. Multi-seismotectonic models, present-day seismicity and seismic hazard assessment for Suez Canal and its surrounding area, Egypt. Bull. Eng. Geol. Environ. 2016, 75, 503–517. [Google Scholar] [CrossRef]
Figure 1. (a) Digital elevation model ( D E M ) of Egypt’s geographical location map and its corresponding distinct regions. (b) Tectonic boundaries of Egypt and the eastern Mediterranean region and shallow regional seismicity pattern (focal depth ≤ 60 km) [37]. Aegean Sea ( A E G ); Alexandria ( A l ) City; Cyprus ( C Y ); Eratosthenes ( E R A ) Seamount; Florence ( F L ); Ionian Basin ( I B ); Mediterranean Ridge ( M R ); Levantine Basin ( L E V ); Levant Fault ( L F ).
Remotesensing 14 06151 g001
Figure 2. (a) A simplified geological map of Egypt [28], (b) Map of Egypt and the southeastern Mediterranean Sea with the essential structural elements and sedimentary basins [27].
Remotesensing 14 06151 g002
Figure 3. (a) The adopted analysis process in this study. (b) The LINE module’s processing flow [24].
Remotesensing 14 06151 g003
Figure 4. (a) Digitized surface traces of geological faults from [14,15,20,39,41,53,54,58,59,60,61,62,63,64]. The thin lines represent the geological identified faults and the thick lines represent the geophysical faults. (b) Distribution of the focal mechanism solutions in and around Egypt [65,66]. Symbols and focal sphere sizes are in proportion to the moment magnitude. Focal sphere colours refer to different fault types (blue: strike-slip; green: normal; red: reverse). (c) Significant historical and instrumental events have affected the area. Historical events are compiled from [67]. Dark lines are geological faults. (d) Compiled seismic activity catalog based on Egyptian instrumental seismicity [68].
Remotesensing 14 06151 g004
Figure 5. (a) ASTER SRTM-DEM with 30 m spatial resolution by the USGS. (b) Shaded-relief images utilized for automatic lineament mapping.
Remotesensing 14 06151 g005
Figure 6. Enhanced shaded-relief images generated from a DEM: (a) for azimuth direction of 0°; (b) for 45°; (c) for 90°; (d) for 135°; (e) for automatic lineament mapping, (f) automatic extracted lineaments.
Remotesensing 14 06151 g006
Figure 7. Enhanced shaded-relief images from DEM: (a) for azimuth direction of 180°; (b) for 225°; (c) for 270°; (d) for 315°; (e) overlay image for automatic lineament mapping, (f) automatic extracted lineaments.
Remotesensing 14 06151 g007
Figure 8. (a) Distribution of major surface and subsurface faults. Compiled and redrawn from [14,15,20,39,41,53,54,58,59,60,61,62,63,64], (b) Kernel density map for all lineaments, surface and subsurface faults.
Remotesensing 14 06151 g008
Figure 9. (a) Map of capable faults identified in Egypt, (b) Spatial distribution of M m a x for capable faults of Egypt using fault lengths and earthquake magnitude regression.
Remotesensing 14 06151 g009
Table 1. The parameters of filter radius ( R A D I ), edge gradient threshold ( G T H R ), curve length threshold ( L T H R ), line-fitting error threshold ( F T H R ), angular difference threshold ( A T H R ), and linking distance threshold ( D T H R ) implemented in Geomatica software’s L I N E module [92] to extract surface lineaments.
ParameterValueParameterValue
RADI3 (pixel)FTHR2 (pixel)
GTHR15ATHR10
LTHR10 (pixel)DTHR20 (pixel)
Table 2. M m a x Comparison.
Seismogenic
Zone Number
M max by [106] M max of Current Study M max by [107] M max of Current Study M max by [65] M max of Current Study
16.446.215.725.94.45.5
25.35.036.0267.26.89
376.644.885VIII-IX6.2
44.94.526.896.24.55.2
56.66.434.955.26.1
66.56.076.196.54.85
74.84.594.925.1VIII5.8
84.14.024.385.2XI6.7
93.93.64.925X6
104.23.835.416VIII5.7
116.15.774.955.5IX-X7
124.94.776.56.9VI-VII5.9
135.75.64.925.34.75.2
146.135.776.546.855.2
155.65.394.7266.86.7
165.95.436.246.56.26
176.26.055.415.76.66.1
184.23.845.077.54.55.3
196.76.677.347.33.95.6
207.26.936.46.54.75.6
216.367.027.26.26.3
226.66.385.425.75.86.1
23665.35VIII5.8
246.66.35.75.5IX-X6.1
257.77.395.795.6X6.5
265.65.596.535.96.56.5
277.57.316.626.5VIII5.7
285.24.95.9265.36.1
294.24.016.716.3
304.94.676.766.7
314.44.196.86.7
327.57.455.195.3
337.27.146.036
346.86.4877
356.56.336.796.8
366.66.198.017.9
377.77.367.137.2
385.14.694.646.5
397.77.34
407.36.96
417.27.14
427.67.34
436.56.51
446.96.87
456.16.03
467.26.93
476.26.11
485.65.25
495.85.74
5076.85
Publisher’s Note: MDPI stays neutral with regard to jurisdictional claims in published maps and institutional affiliations.

