Communication

Improved Understanding of Typhoon-Induced Immediate Chlorophyll-A Response Using Advanced Himawari Imager (AHI) Onboard Himawari-8

Department of Earth Science, National Taiwan Normal University, No. 88, Sec. 4, Tingzhou Rd., Wenshan District, Taipei 11677, Taiwan
*
Author to whom correspondence should be addressed.
Remote Sens. 2022, 14(23), 6055; https://doi.org/10.3390/rs14236055
Submission received: 13 September 2022 / Revised: 30 October 2022 / Accepted: 26 November 2022 / Published: 29 November 2022

Abstract

:
The biological response triggered by a tropical cyclone (TC) passage has attracted much attention due to its possible impacts on regional oceanic, ecological environment, and regional climate balance. However, the detailed progress of TC-induced chlorophyll-a (Chl-a) responses (TICRs) remains unclear due to the inherent limitation of observations in ocean color with polar-orbiting satellites as used in previous studies. The appearance of the Advanced Himawari Imager (AHI) onboard the Himawari-8 geostationary satellite opens the opportunity of correcting all our understanding of TICRs due to its hyper temporal image acquisition capability. In this study, the more real relationship between Chl-a response and TC is further clarified. Results show an essentially different reacting progress of TICRs given by AHI/Himawari-8. It shows a much quicker response relative to previous understanding. Chl-a concentrations reached the highest value on the first day under the severe influences of typhoons. The averaged Chl-a response (0–3 days behind TC passage) observed by AHI is approximately three (2.95) times stronger than that observed by the Moderate Resolution Imaging Spectrometer onboard the National Aeronautics and Space Administration Terra/Aqua satellites. The spatial characteristics of TICRs by AHI show marked differences. Overall, the rapid and strong response sheds new light on the role of TICRs in influencing the regional oceanic environment, marine ecosystem, and local climate. Whole new estimations for the impacts of TICRs on the aforementioned issues are needed urgently.

1. Introduction

The biological response to tropical cyclone (TC) passage has attracted much attention due to its impacts on oceanic, ecological environment, and regional climate balance [1,2,3]. Lin et al. quantified the enhancement of ocean primary production responding to TC passages by using a suite of satellite data [1]. They indicated that typhoon Kai-Tak induces about a 30-fold increase in upper-layer chlorophyll-a (Chl-a) concentration relative to its initial state during its passage over the South China Sea (SCS). The carbon fixation, sourcing from this event was estimated to be about 0.8 Mt, which is 2–4% of the annual new production of SCS. This finding implies that the contribution of TCs to the annual new production of SCS can be as much as 20–30%, with the assumption of an average of 14 TCs passing over the SCS (per year).
Babin et al. [4] examined the passages of 13 hurricanes through the Sargasso Sea in the North Atlantic from 1998 to 2001 based on eight-day composite ocean color images. Their results showed that increased Chl-a within the cold wakes of the hurricanes responded mainly to the injection of nutrients or biogenic pigments entering the upper-layer oligotrophic waters. The wake of increased Chl-a coincided with the distribution of sea surface temperature (SST) cooling. The increase in post storm Chl-a concentration lasted 2–3 weeks before it returned to prehurricane level. These findings by Babin et al. [4] served as the baseline for the systematical understanding of Chl-a response to hurricanes or TC passages [5,6,7,8,9,10].
Babin et al. [4] also indicated that they cannot ensure their observed changes in Chl-a due to hurricane-induced nutrient injections or other effects, such as upwelling or entrainment of waters with pre-existing high Chl-a concentrations. This condition brings out the importance of a timely and reliable satellite observation that can resolve the immediate Chl-a response to TC passage, which is mostly inaccessible by using the data derived from ocean color imagers (OCIs) onboard polar-orbiting satellites. The progression of Chl-a changes in responding to TC passage remains strongly controversial. Many previous studies indicated that the Chl-a response behind typhoon passage has a time delay of 3–6 days [8,11,12]. However, Shropshire et al. [13] indicated that the delay of Chl-a response is only one day after they filled in the missing values using a method of Data INterpolating Empirical Orthogonal Function (DINEOF). The immediate responses or changes of Chl-a underlying TC passages, which have rarely been studied in the past, are important in contributing to a reduction in this uncertainty.
On the basis of the aforementioned studies, the Chl-a responses tied to TC passages (TICRs) are particularly important given their possible impacts on upper ocean ecology, biogeochemical cycling, and global climate change. However, detailed progress of the generation of TICRs, particularly the immediate response behind TC passage, remains largely unresolved because of the inherent limitation of observations in ocean color with polar-orbiting satellites. Given the high spectral and spatial resolutions with hyper temporal image acquisition capability, the appearance of Advanced Himawari Imager (AHI) on board the Himawari-8 geostationary satellite opens the opportunity of correcting all our understanding of TICRs systematically.
In this study, the relationships between Chl-a responses and TC passages are re-examined by advanced measurements of ocean colors by AHI/Himawari-8. By using AHI images, the more real relationship between Chl-a responses and TCs is further clarified. The results help to correct our understanding of TICRs and shed new light on the role of TICRs play in influencing the regional oceanic environment, marine ecosystem, and local climate. The rest of this paper is organized as follows. Section 2 describes the data used in this study and the processing methods used to conduct the analysis. Section 3 presents the main analysis results. Section 4 provides the conclusions, remarks, and future work.

2. Data and Methods

The study area of this research is the western North Pacific, which is the region with the most TCs striking in the world. The typhoon screening range is 0–60N and 80–180E (Figure 1). Our research period is designed to be from 2016 to 2021 to match the operation period of Himawari-8. Typhoon data, including the latitude, longitude of typhoon centers, and maximum sustained wind speed corresponding to every 3 h intervals were derived from the International Best Track Archive for Climate Stewardship (IBTrACS) Project (through https://www.ncdc.noaa.gov/ibtracs/, accessed on 11 September 2022) and used here. Saffir–Simpson hurricane wind scale from 1 to 5 was used as the intensity category. During the study period, 158 typhoons with Saffir–Simpson wind scale category greater than 0 passed the study area. The intensities and central positions of all typhoon cases are shown in Figure 1.
In this study, daily Chl-a concentrations were retrieved from two different sources of AHI/Himawari-8 and Moderate Resolution Imaging Spectrometer (MODIS) for comparison. The level 3 daily composite product of Himawari-8, the geostationary meteorological satellite [14,15], was collected with a spatial resolution of 5 km. Before the AHI, geostational meteorological sensors hardly observed ocean color because of only one broadband in visible wavelengths and relatively large radiometric noise. However, in addition to ten thermal infrared bands, AHI has six spectral bands from visible to shortwave infrared wavelengths. Thus, their radiometric noise can be essentially reduced by temporal average since AHI observes the full disk by every 10 minutes [15].
The Chl-a concentration observed by AHI was provided by the P-Tree System, Japan Aerospace Exploration Agency (JAXA) through https://earth.jaxa.jp, accessed on 11 September 2022. The Chl-a concentration retrieved from MODIS was composed of the daily level-3 Chl-a products of Terra and Aqua, with 4 km spatial resolution. The Chl-a concentration by Aqua and Terra was provided by NASA Goddard Space Flight Center, Ocean Ecology Laboratory, Ocean Biology Processing Group (https://oceandata.sci.gsfc.nasa.gov/, accessed on 11 September 2022). It is worth noting that the optical telemetry of Chl-a is not only susceptible to cloud factors, but also to instrument noise and imperfect atmospheric correction (e.g., sun glint, whitecap corrections, and stray light contamination). The default chlorophyll algorithm for both MODIS and AHI data employs the standard OCx band ratio algorithm with the color index algorithm (CIA) to reduce artifacts and biases resulting from residual glint, stray light, white or spectrally linear bias, and atmospheric correction errors [15]. The temporal resolution of Chl-a by AHI/Himawari-8 is 10 times more than that of sensors onboard polar-orbiting satellites (e.g., MODIS) [9]. Given its hyper temporal image acquisition capability, the missing values in a daily composited AHI image are remarkably reduced relative to MODIS products (Figure 2).
SST was obtained from daily optimally interpolated SST released by REMSS through ftp.remss.com/sst/daily/mw_ir/v05.0/netcdf, accessed on 11 September 2022. The product combines microwave data with 25 km resolution and infrared data with 9 km resolution. It has a more complete daily coverage (~9 km resolution) because it retains the capability of cloud penetration and higher spatial resolution simultaneously.
Equations 1 and 2 are used to represent the certain daily change rates of Chl-a and SST (δCHLn and δSSTn) in the region relative to pre-typhoon conditions. Equations 3 and 4 are used to represent the average TICRs and SST responses responding to TC passages by calculating the differences in Chl-a and SST in the area before (average of 5 days before typhoon arrives) and after (temporal average of 0–3 days after the typhoon passage) the typhoon passages (δCHLdiff and δSSTdiff).
δ C H L n = ( C H L n ¯ C H L 5 b ¯ ) / C H L 5 b ¯
δ S S T n = ( S S T n ¯ S S T 5 b ¯ ) / S S T 5 b ¯
δ C H L d i f f = ( C H L 0 3 ¯ C H L 5 b ¯ ) / C H L 5 b ¯
δ S S T d i f f = ( S S T 0 3 ¯ S S T 5 b ¯ ) / S S T 5 b ¯
where C H L n ¯ is the spatial average calculated by taking the area of 2° from the center of typhoon. Subscript n represents the days after typhoon from 0 to 14 (0 denotes the moment underlying the impact of typhoon). CHL5b and SST5b represent the background value calculated from the temporal average of 5 days before the typhoon arrives. CHL0–3 and SST0–3 are the values corresponding to the temporal average of 0–3 days after the typhoon passage.
CH(i, j) was calculated to represent the spatial characteristic of daily Chl-a response responding to typhoon passage (Equation (5)).
C H L n ( i ,   j ) = C H L n ( i ,   j ) C H L 5 b ( i ,   j )
CH(i, j) is the Chl-a concentration at a certain position (i, j) on the nth day, and CHL5b(i, j) is the averaged Chl-a concentration 5 days before the typhoon passage at (i, j).

3. New Understanding of TICRs by AHI

3.1. Why Does AHI Help?

The time-varying ratios of daily missing values to all pixels are calculated by using Equation (5) and subtracting the missing values of land area, as shown in Figure 3. AHI and MODIS have the highest missing ratio on the 0th day. This finding is intuitively attributed to the severe weather condition underlying the typhoon center passage. The eye-wall region has strong thunderstorms and deep convective clouds [16]. The ratio of the missing value of MODIS is close to one on day 0, that is, no observation by MODIS is available that day. On the contrary, AHI/Himawari-8 provides ~30–50% data coverage for the period we are interested in (0–1 day). This condition is because Himawari-8 is a geostationary meteorological satellite with hyper-temporal image acquisition capability. The daily image provides sufficient spatial coverage with fewer missing values after compositing. MODIS retrieves data twice a day and is affected seriously by heavy clouds surrounding the eye center tied to the TC passage.
Although the missing ratio of MODIS decreased in the next few days, it is approximately 60% higher relative to AHI observations. The hyper temporal image acquisition capability of sensor AHI largely improves the data coverage in the temporal and spatial frames. With the 10 times repeated observations, our results suggest that the results given by AHI are statistically more robust.

3.2. Continuous Progression of Chl-A Changes Responding to Typhoon Passage

As noted in previous sections, satellite-observed TICRs are either the result of TC-induced nutrient injections or effects, such as entrainment or upwelling of waters with pre-existing high Chl-a concentrations cannot be identified adequately due to the limitation of observations in ocean color with sensors onboard polar-orbiting satellites used in previous studies [4]. The real progression of Chl-a changes in responding to TC passages is still strongly controversial due to the inherent limitation of observations in ocean color with polar-orbiting satellites. Given its hyper-temporal image acquisition capability, AHI images with a large improvement in temporal and spatial coverages (as shown in previous sections) open the opportunity to quantify the Chl-a changes in responding to TC passages, in particular the immediate responses underlying the TC passages.
Figure 4 shows the composited temporal progressions of Chl-a (and SST) changes in response to TC passage with different reacting times (0–14 days after the typhoon passage). The black solid line shows the results calculated by AHI observations. The dashed line shows the progression reflected by MODIS observations. The blue line shows the corresponding progression of physical responses (sea surface cooling). Shading in different colors denotes the 95% confidence intervals from the mean values of δCHLn (by AHI and MODIS) and δSSTn corresponding to different days. The δCHLn value of MODIS peaks at ~3–4 days after the typhoon passage with an increase of 40% relative to its original state. The progression of Chl-a change by MODIS composites (dashed line) shows great consistency with those results demonstrated in previous studies [4,11,12]. For the period of 3–14 days after the TC passage, the Chl-a responses shown by MODIS and AHI composites demonstrate great consistency.
For the period of 0–3 days (the immediate response behind the TC passage), the TICRs from AHI and MODIS show totally different scenarios. The marked differences are attributed to the poorer data coverage tied to OCIs onboard polar-orbiting satellites (e.g., MODIS) inherently relative to the observations by AHI (Figure 2 and Figure 3 and previous studies, such as Babin et al. [4]; Chen et al. [7]; Liu et al. [8]; Iwasaki [9]). The δCHLn value of AHI peaks at 0–1 day after the typhoon passage with an increase of 95% relative to its original state. The rapid response of δCHLn is consistent with the result shown in Shropshire et al. [13] but in an indirect manner of bad values filling with DINEOF. The TICR by AHI composites shows a much quicker response relative to the previous understanding (e.g., Zheng and Tang [11]; Liu et al. [8]; Wang [12]). The immediate enhancement of TICR behind the TC passage (0–3 days) by AHI is approximately three (2.95) times stronger than that observed by the MODIS. The total increase in δCHLn to a certain TC event passage retrieved by AHI is approximately 1.5 times stronger than that estimated by MODIS composites. The quick and strong Chl-a response reaches the highest value on the first day under the severe influences of a typhoon, implying that the long-pending uncertainty noted in previous studies [4,17] that the TICRs observed is whether the result of TC-induced nutrient injections or effect, such as entrainment (or upwelling) bringing waters with pre-existing high Chl-a concentrations entering the euphotic zone is unveiled. This finding suggests that the observed TICRs are more similar to the product of a direct pump or injection of waters with pre-existing higher Chl-a concentration or pigment rather than an influx of nutrients that need the consequential biological process to convert them into new Chl-a. This condition is because the conversion of nutrients into Chl-a takes time [11,18]. The results demonstrated in this section provide a whole new understanding of the strength and the temporal progression in responding to TC passages, which supports the notion that the appearance of AHI largely opens the opportunity of correcting our understanding of TICRs.
In terms of SST (blue line in Figure 4), δSSTn reaches its maximum value one day after the typhoon passage. The cooling progression of SST shows good agreement with previous findings [19,20,21]. The above inference that the observed TICRs are mainly the product of direct pump or injection of waters with higher pre-existing Chl-a concentration or pigment rather than an influx of nutrients and consequential biological process is supported by comparing the progression of physical response (SST cooling) to that of Chl-a. For the physical response to TC, the key mechanisms triggering sea surface cooling can be either entrainment mixing or upwelling, depending on the translation speed of certain TC cases [22,23]. The two mechanisms need a longer reacting time for causing sea surface cooling (shown in SST drops) relative to pumping or injecting higher Chl-a concentration waters below the euphotic zone entering the euphotic water column, which is the scanned zone of ocean color imagers.

3.3. Updated Understanding of the Spatial Characteristics of TICRs

The rightward bias (in the northern hemisphere) of enhanced TICR in the wake of a TC was well documented in previous studies [1,4,10,24,25]. Vertical mixing and upwelling were hypothesized as the mechanisms for enhanced TICRs [1,4,24,26,27]. However, the majority of aforementioned studies made their conclusions with multiday composites retrieved from ocean color imagers (polar orbiting) without really immediate measurements (Figure 3). In other words, the spatial characteristics and corresponding temporal progression of TICRs were never resolved completely.
With the AHI images, the spatial characteristic of TICRs with immediate response (underlying the severe impacts of TCs) and their temporal progression were re-examined. To reveal the normalized spatial characteristics of TICR, we corrected △CH(i, j) with the typhoon path and rotated it into a polar coordinate with typhoon moving toward due north. The correction was processed by taking the center of the typhoon as the criterion. Subsequently, the image was converted into the polar coordinate in accordance with the direction of the typhoon. All observations were filled back into the matrix with the same resolution for compositing. A schematic plot (taking Typhoon Nepartak in 2016 for example) of the procedure is shown in Figure 5. Corresponding products of the spatial characteristic of TICRs in polar coordinates are demonstrated in Figure 6.
Figure 6 shows the complete progression of the spatial characteristic of TICRs in polar coordinates processed and calculated from △CHL(i, j) (Equation (5)) responding to typhoon passages in different stages. Dots mark the areas with statistically significant values, satisfying the two-tailed t-test at a 95% confidence level. The spatial composites of TICRs retrieved from AHI images show marked differences relative to the results derived from MODIS, in particular, for the period of 0–3 days behind the TC passages. For AHI, the average Chl-a concentration peaks on the 0–1st day with a concentration of ~0.085mg/m3, and the influence range is wider than on other days. Subsequently, the composited TICR decreases gradually over the next 2 weeks and recovers to its initial state before the TC passage. The spatial characteristic of TICRs in AHI composites shows distinct rightward bias, as shown in previous studies [1,4,10,25].
The △CH(i, j) value of MODIS peaks on the fourth day after the typhoon passage with a concentration of 0.0476 mg/m3. The composited TICR gradually reduces back to the initial state. The temporal progression of TICR by MODIS is consistent with those shown in previous studies derived from multiday composites [4,10,17] that peak Chl-a concentration attains to maximum about four days after a certain TC passage (e.g., Wang and Xiu [10]). The rightward bias is observed in the MODIS TICR spatial composites from days 3 to 6 after the typhoon passages. The spatial peaks of TICRs in AHI and MODIS composites shift from the right side to the left side consistently after day 7. Such spatial distributed pattern shows a consistent scenario as reported in Lin and Oey [28], who concluded that the migration of enhanced blooming can be due to heavier (left-side) rainfall freshening the near-surface water. The most marked differences between the spatial characteristics of AHI and MODIS are observed from day 0 to day 3 after the TC passage, which is the period of images collected from sensors onboard polar-orbiting satellites with the worst spatial coverages due to severe weather conditions shortly after the TC passages.

3.4. TICRs Versus Wind Forcing

In previous studies, vertical mixing and upwelling were considered the key mechanisms for TC triggering stronger phytoplankton bloom [1,4,24,26,27]. The two mechanisms are tightly related to TC wind forcing. Stronger wind forcing leads to stronger mixing and upwelling, and consequential TICRs (e.g., Lin et al. [1]; Babin et al. [4]; Zheng et al. [24]). The TICRs corresponding to different wind forcing strengths in the AHI and MODIS datasets are calculated by using Equation (3) to further explore the more real relationship between wind forcing and consequential TICRs with updated AHI composites, as shown in Figure 7a,b. In accordance with the characteristics and differences of AHI and MODIS shown in previous analyses, the averaged Chl-a change in the period of 0–3 days after typhoon passage was considered the change in Chl-a due to typhoon influences.
Referring to Figure 7a,b, the ratios of averaged TICRS calculated from AHI and MODIS corresponding to different wind forcing strengths are 5.7 (30–40 knots), 2.8 (40–50 knots), 2.1 (50–60 knots), 1.6 (60–70 knots), 1.6 (70–80 knots), 1.6 (80–90 knots), and 1.5 (90–100 knots). This finding implies that the impacts of wind forcing on the generations of TICRs are largely underestimated in previous assessments by MODIS, in particular for weaker wind situations. Despite the trends of stronger wind forcing leading to stronger TICRs, which are consistent with previous understanding (e.g., Lin et al. [1]; Babin et al. [4]; Zheng et al. [24]), they are well documented in AHI and MODIS results.
The TICRs increase with wind speed strengths (under 100 knots) linearly in the two datasets. However, they stop rising with wind speeds above 100 knots. Similar scenarios can be observed in Babin et al. [4] and Iwasaki [9]. The rising slopes of δCHLdiff (corresponding to wind forcing strengths from 30 knots to 100 knots) for MODIS and AHI are 0.08 and 0.09, respectively. Similar upper limits can be observed in the SST responses to TCs (e.g., Black [20]; Dare and McBride [21]). Mei et al. [29] pointed out that such an upper limit is because the translation speed increases with the increase in the intensity, and a higher translation speed suppresses the cooling of the SST. However, more investigations on this issue are needed.
The same analysis was applied to SST responses (Figure 7c). The SST drop shows the same turning point corresponding to wind forcing of 100 knots. The synchronized responses of Chl-a (δCHLdiff) and SST (δSSTdiff) to different wind forcing strengths demonstrate the tight relationship between Chl-a changes and physical processes (leading to SST drops), and can serve as indirect evidence supporting the inference that the immediate Chl-a response to TC passage is mainly the product of physical driven processes (e.g., direct pump or injection of waters with high Chl-a concentration or pigment) rather than an influx of nutrients needing extra help from the biological process that occur subsequently.

4. Conclusions and Remarks

TICRs have attracted much attention due to their possible impacts on regional oceanic, ecological environment, and regional climate balance. However, the detailed progress of TICRs remains unclear due to the inherent limitation of observations in ocean colors with sensors onboard polar-orbiting satellites as used in previous studies. The appearance of the AHI on board the Himawari-8 geostationary satellite opens the opportunity to systematically correct all our understanding of TICRs given its hyper temporal image acquisition capability, which is 10 times more than that of sensors onboard polar-orbiting satellites.
In this study, the more real relationship between Chl-a responses and TCs is further clarified by using AHI images. The results show an essentially different reacting progress of TICRs given by AHI relative to that by MODIS, showing a much quicker response relative to previous understanding. The spatial characteristics of TICRs demonstrate marked differences. New understandings of TICRs by AHI are summarized as follows.
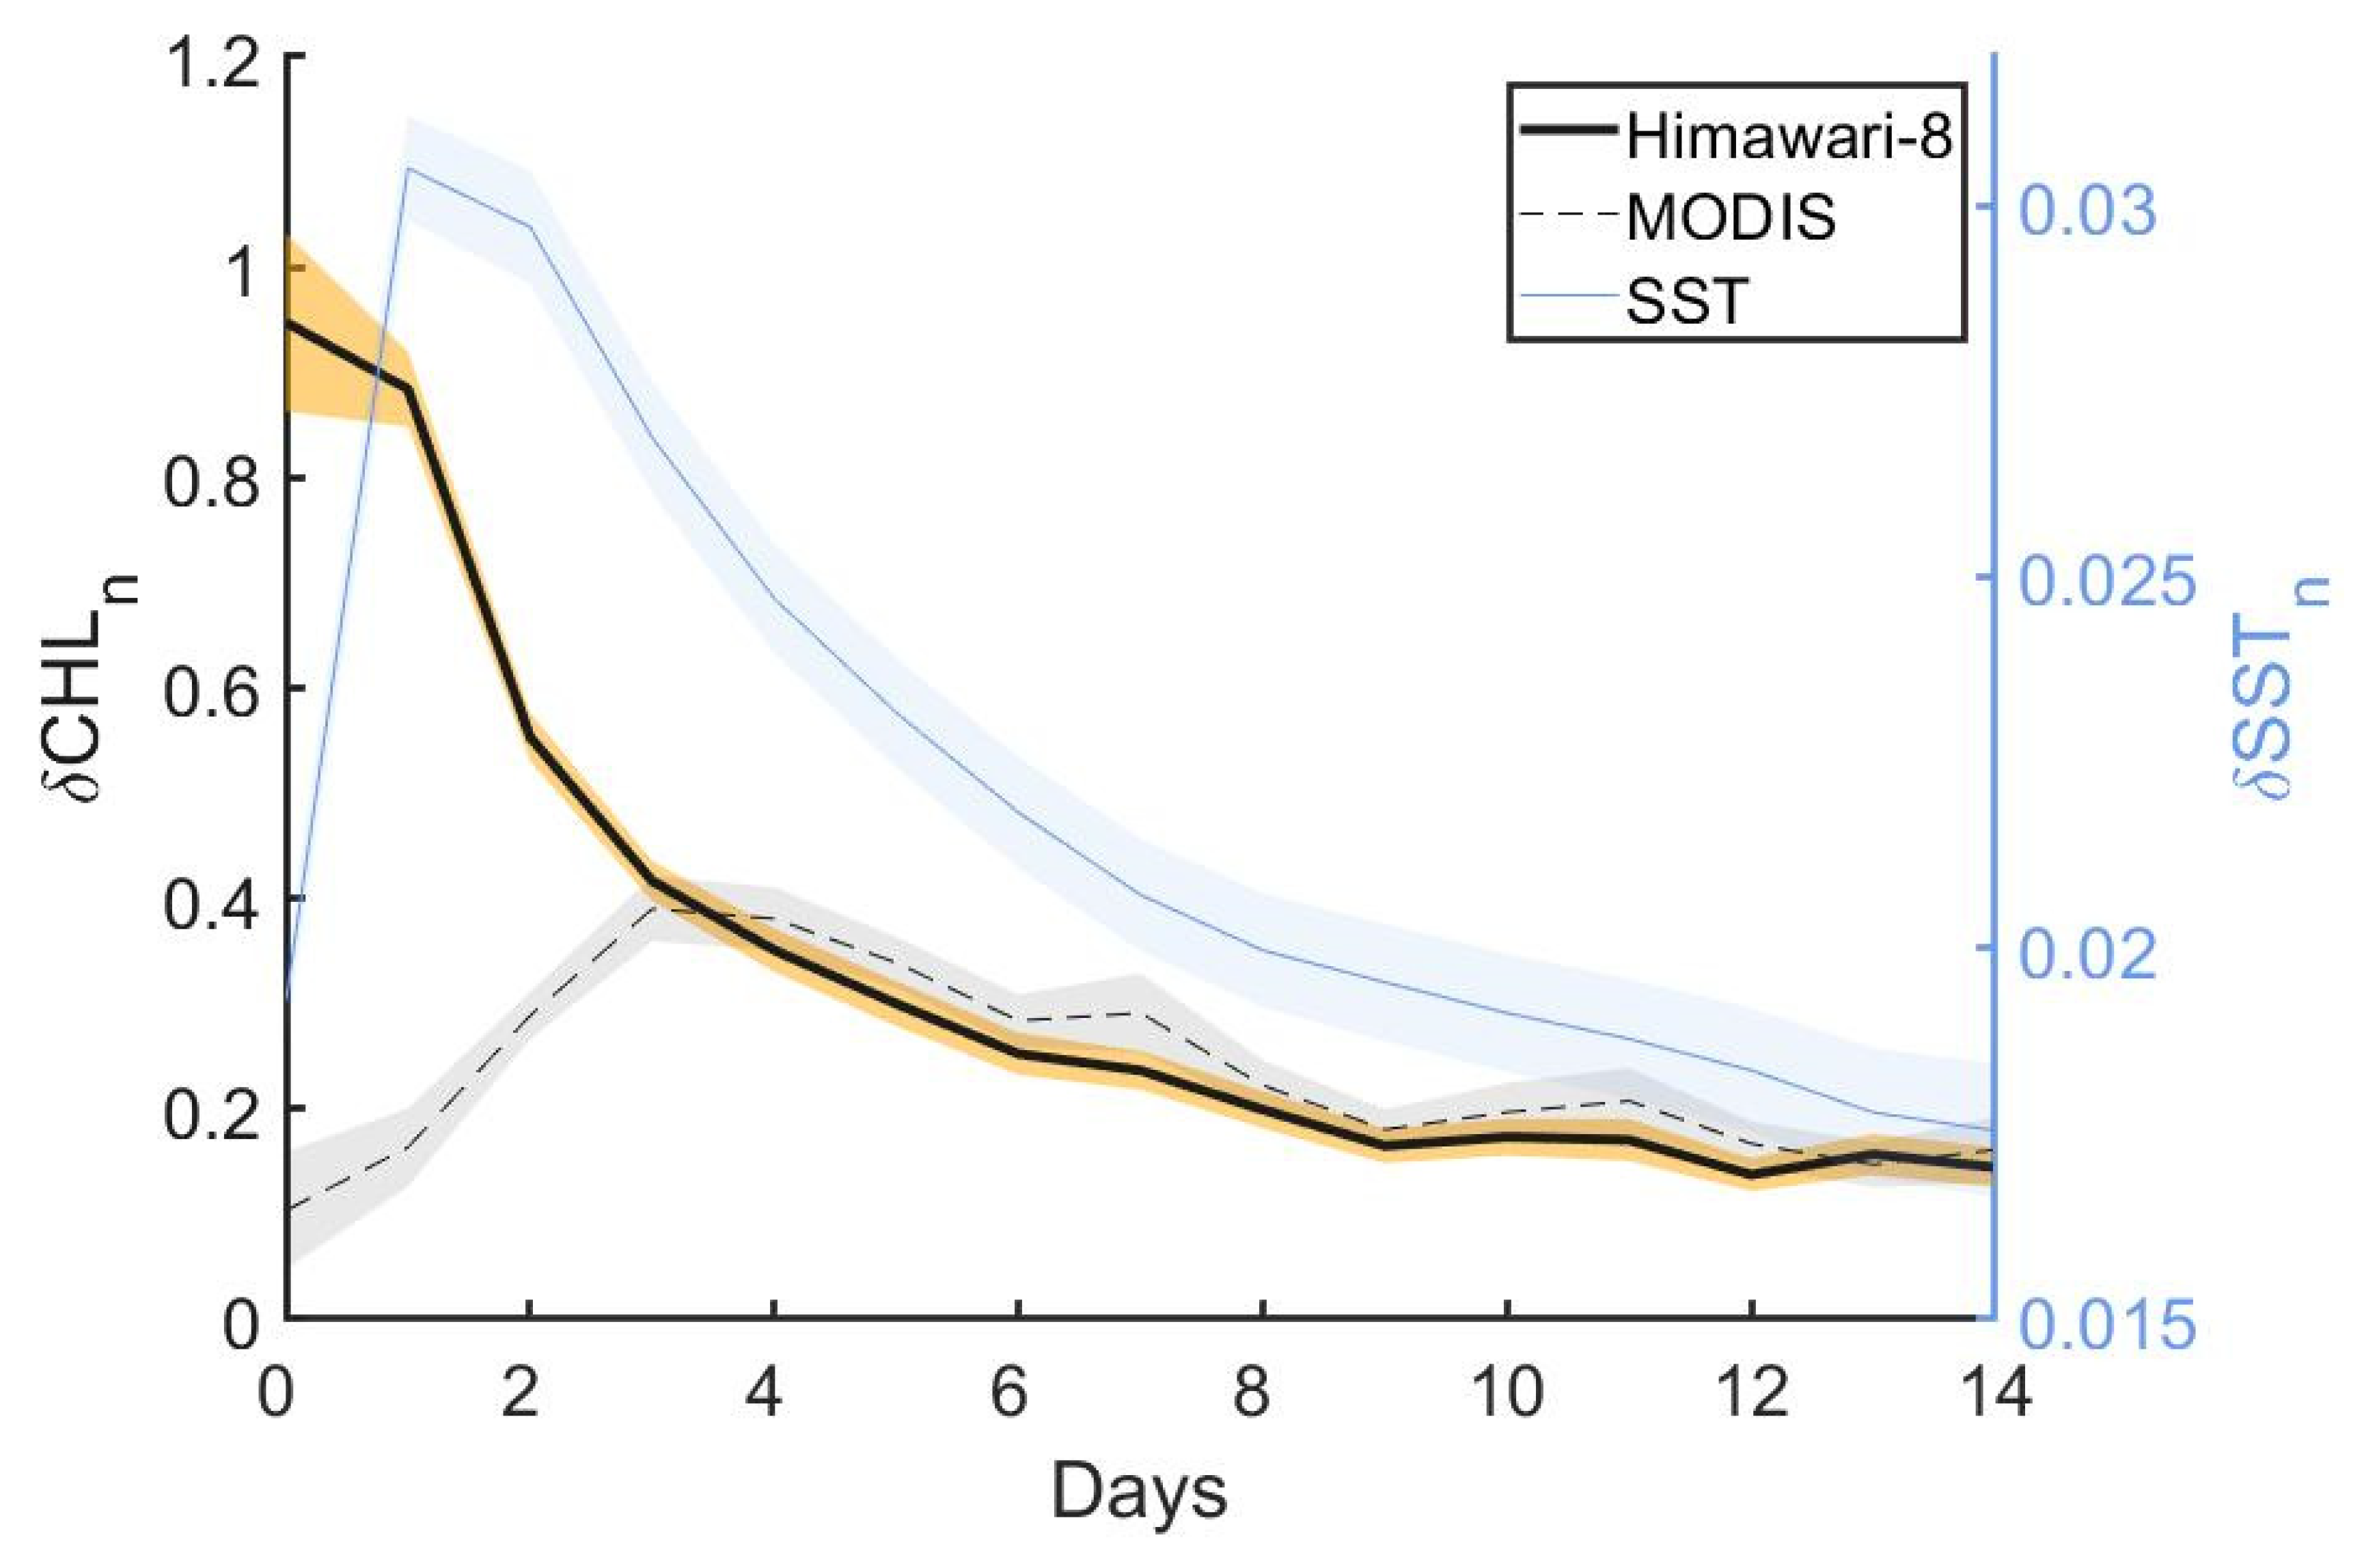
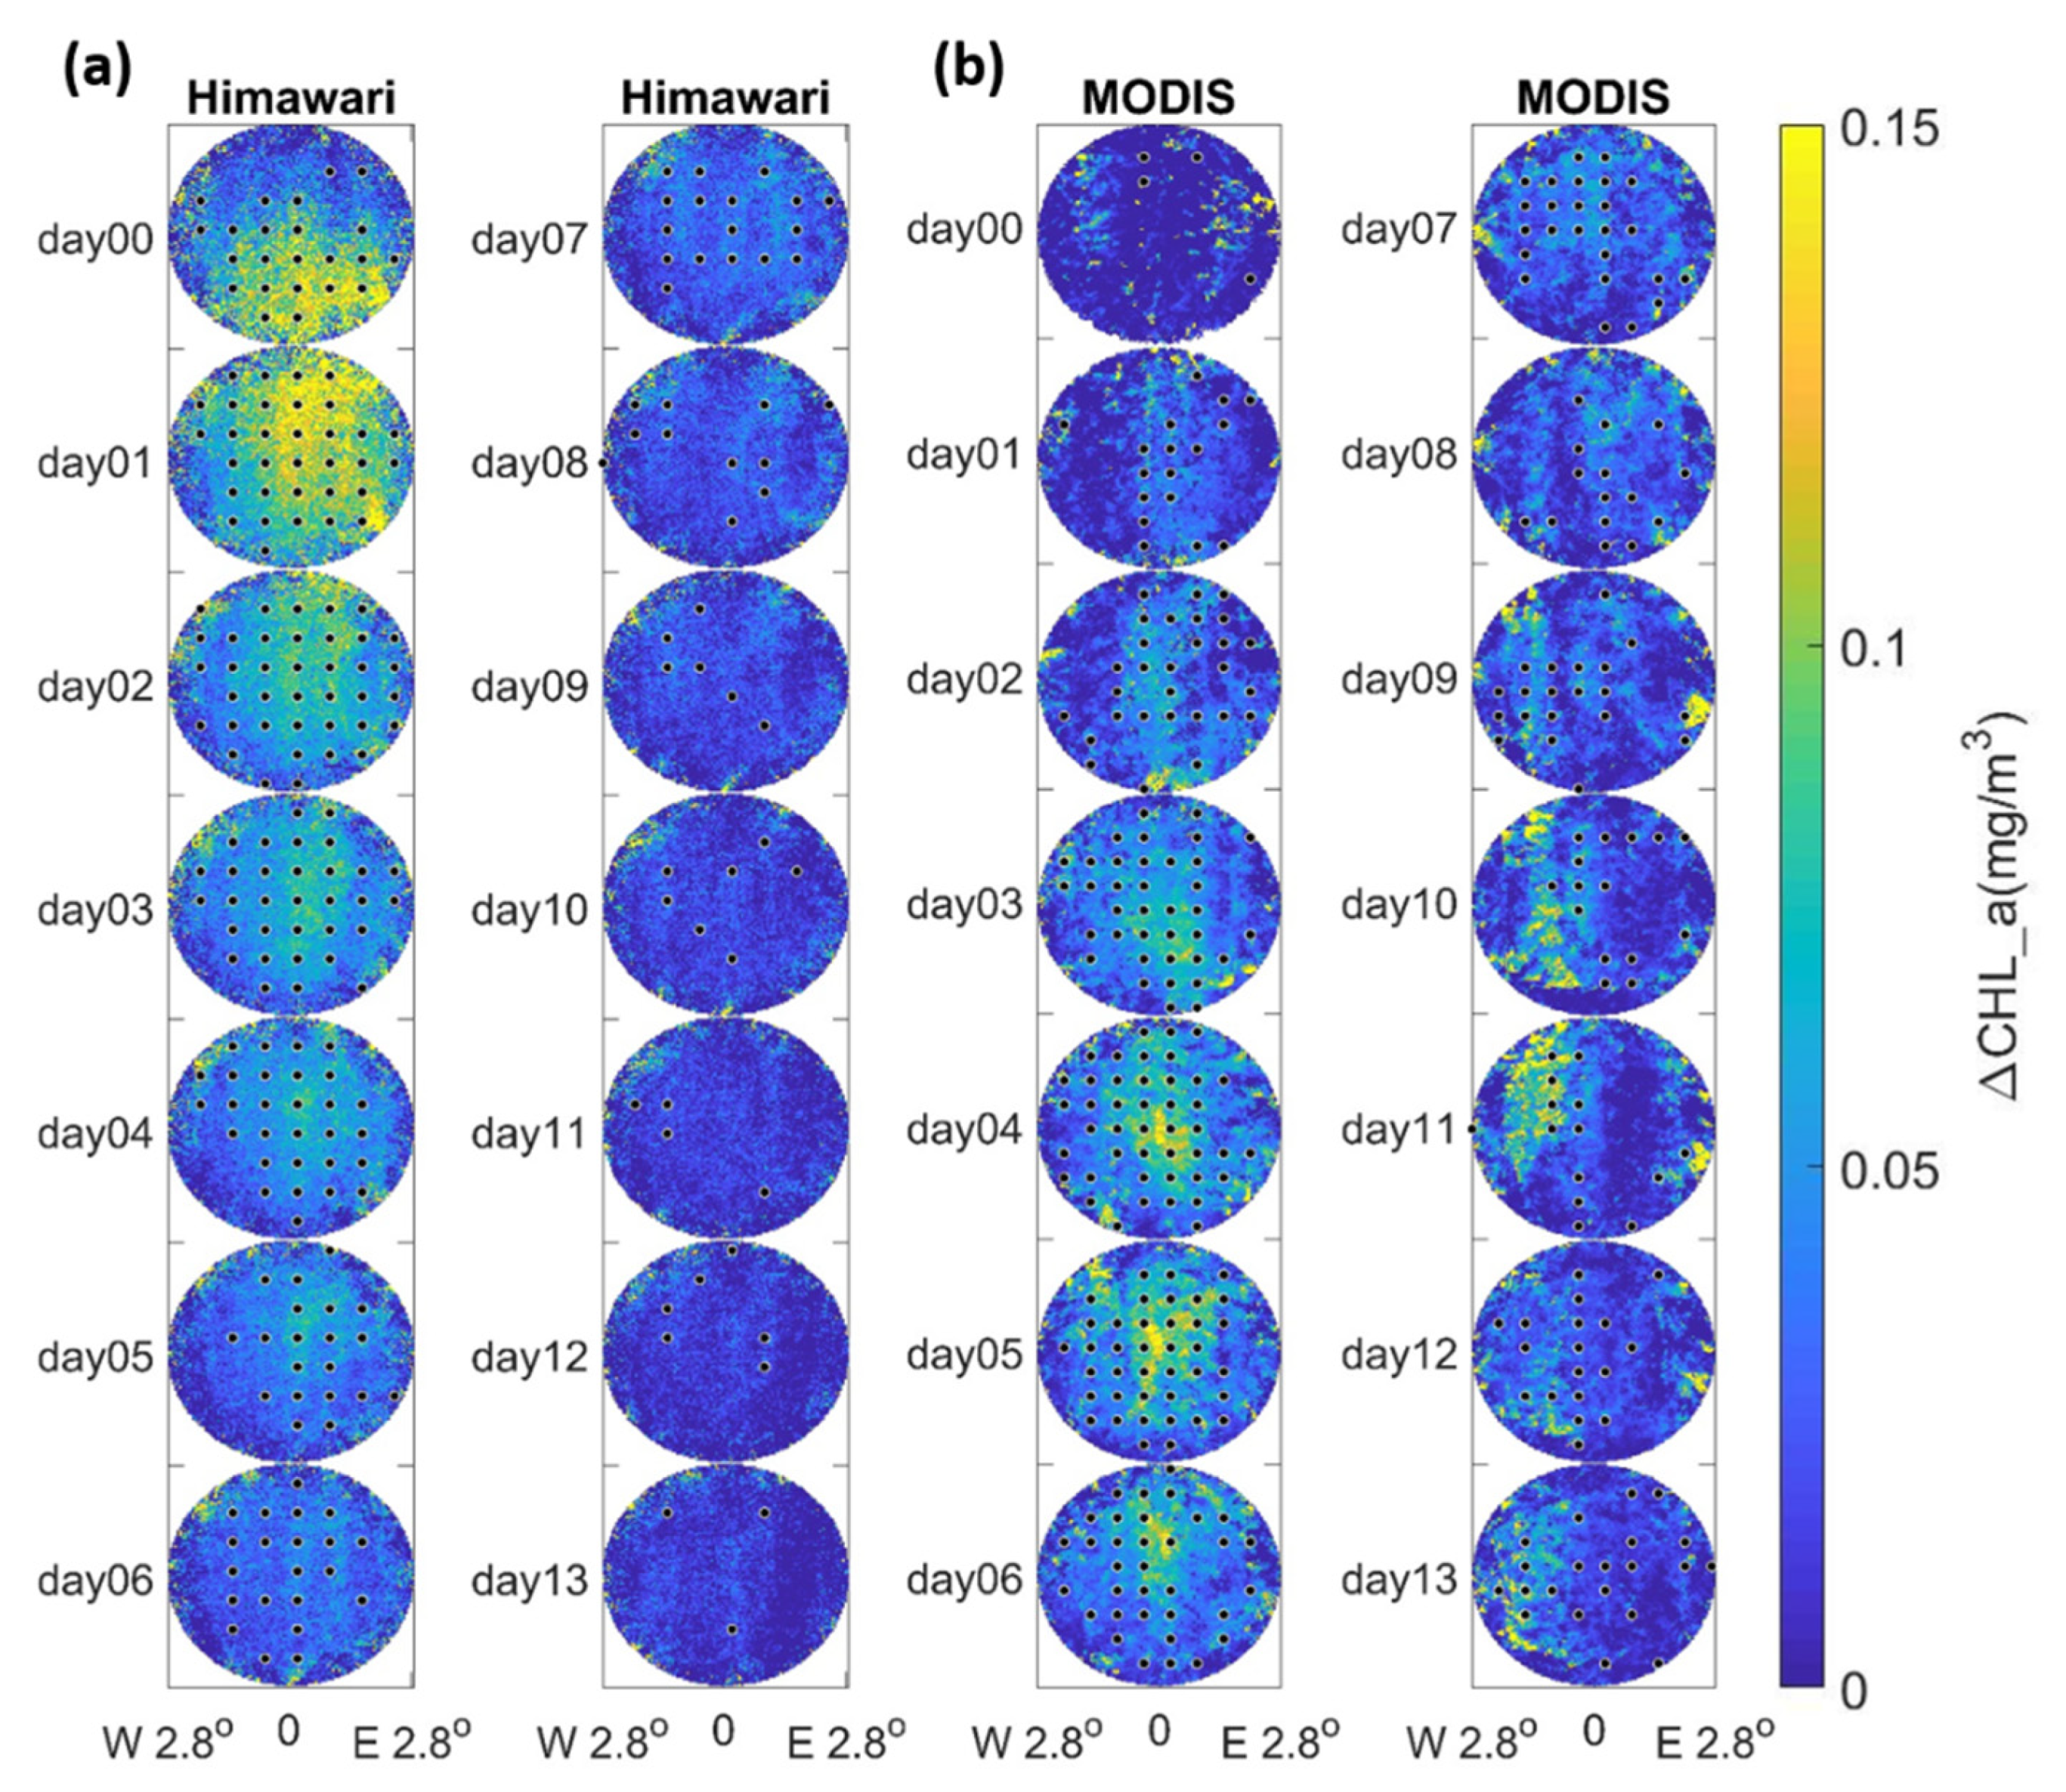
  • The maximum Chl-a response peaks at 0–1 day after the typhoon passage by compensating for the lack of observations with high temporal resolution observations. The immediate increase in TICR behind the TC passage (0–3 days) is 2.95 times stronger than that estimated by MODIS composites. The total increase in TICR to a certain TC event passage retrieved by AHI is approximately 1.5 times stronger than that estimated by MODIS. This finding implies that whole new estimations of the impacts of TICR on the regional oceanic environment, ecological system, and climate are needed urgently.
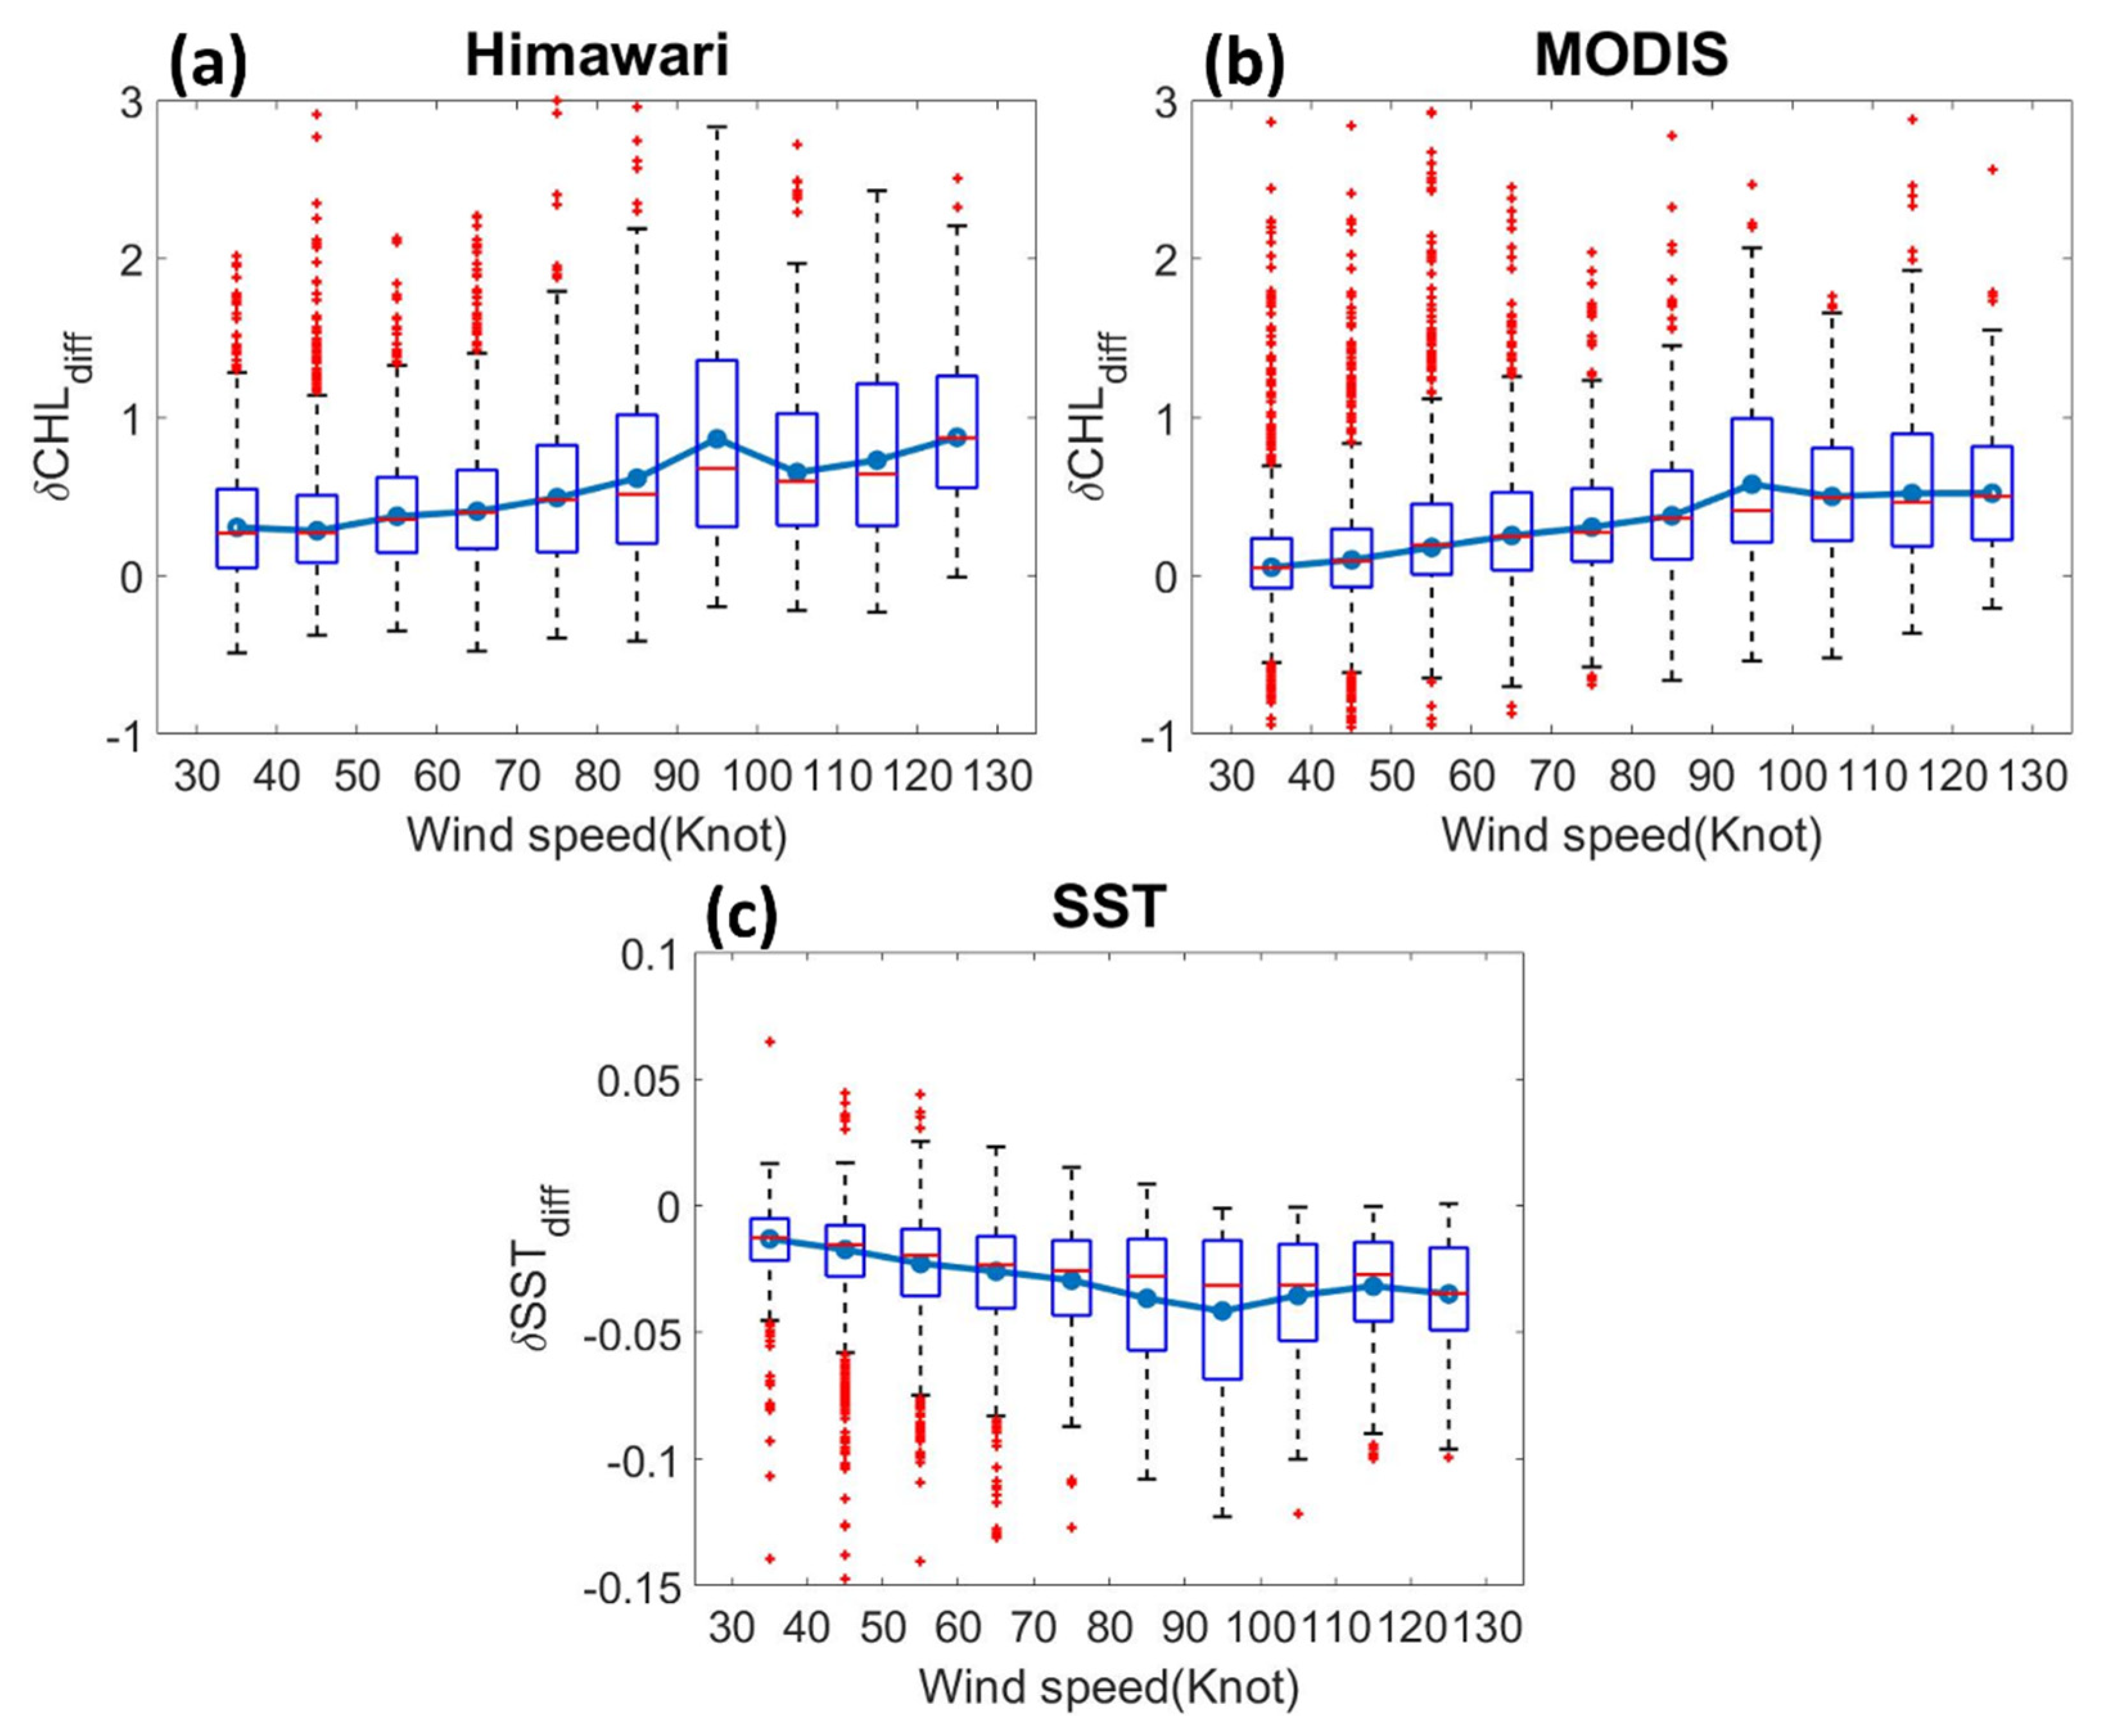
  • The comparison of all TICRs responding to different wind forcing strengths indicates that the impacts of wind forcing on the generations of TICRs are largely underestimated in previous assessments by MODIS, in particular for weaker wind situations. This condition implies the short-term Chl-a changes caused by typhoons in the past are underestimated remarkably, that is, typhoons have a much more remarkable impact on regional Chl-a changes.
  • The quick response of TICR revealed by updated AHI composites is slightly faster than the peak of SST response. Such evidence tends to support that the rapid change of Chl-a after typhoons is caused mainly by direct pump or injection of waters with high Chl-a concentration or pigment rather than an influx of nutrients and consequential biological process, which is a long-pending issue due to the inherent observation limitation tied to ocean color imagers on board polar-orbiting satellites.
Overall, the results shown in this study help to correct our understanding of TICRs. The unexpected rapid and almost three times stronger response sheds a whole new light on the role of TICRs play in influencing the regional oceanic environment, marine ecosystem, and local climate. Recall the key role of TICRs play in annual new production and regional climate balance through carbon fixation [1]. Oceanic primary production is extraordinarily important in the earth system because it is the base of the ocean food chain. In addition, it affects the uptake of carbon dioxide, which is an important greenhouse gas tied to climate change [1]. This indicates that a whole new and comprehensive estimation for the long-underestimated contribution of TICRs on the aforementioned issues is needed urgently.
On the other hand, with comprehensive and sufficient AHI image coverage as new inputs, a reliable coupled physical–biological ocean modeling system becomes possible. In this way, more detailed information helping the interpretation of typhoon-induced upper ocean biological response can be retrieved. Further understanding of the physical process leading to the Chl-a changes in responding to typhoon passage is realized. The integration of advanced CubeSat (with eight times the spatial resolution of SeaWiFS) for ocean color measurement gives another possibility for a better understanding of TICR variations given its ultrahigh spatial resolutions, which can serve as a complement to AHI images with hyper temporal image acquisition capability but relatively lower spatial resolution.

Author Contributions

J.-Y.L. and Z.-W.Z. conceived and designed the study. H.H. helped with writing and provided thorough editing. J.-Y.L. and Z.-W.Z. contributed to the writing and data interpretation. Data analyses were conducted mainly by J.-Y.L. and H.H. All authors have read and agreed to the published version of the manuscript.

Funding

This research was funded by Taiwan’s Ministry of Science and Technology (MOST) under 108-2628-M-003-001-MY3.

Acknowledgments

The authors would like to thank the two anonymous reviewers and editor for their very constructive comments. Their valuable comments and suggestions largely improve the presentation of this work. Thanks to NASA Goddard Space Flight Center, Japan Aerospace Exploration Agency (JAXA), International Best Track Archive for Climate Stewardship (IBTrACS) Project, and REMSS scientific teams for processing and providing the essential data sets.

Conflicts of Interest

The authors declare no conflict of interest.

References

  1. Lin, I.-I.; Liu, W.T.; Wu, C.-C.; Wong, G.T.F.; Hu, C.; Chen, Z.; Liang, W.-D.; Yang, Y.; Liu, K.-K. New evidence for enhanced ocean primary production triggered by tropical cyclone. Geophys. Res. Lett. 2003, 30. [Google Scholar] [CrossRef] [Green Version]
  2. Shang, S.; Li, L.; Sun, F.; Wu, J.; Hu, C.; Chen, D.; Ning, X.; Qiu, Y.; Zhang, C.; Shang, S. Changes of temperature and bio-optical properties in the South China Sea in response to Typhoon Lingling, 2001. Geophys. Res. Lett. 2008, 35, L10602. [Google Scholar] [CrossRef] [Green Version]
  3. Yu, J.; Tang, D.; Li, Y.; Huang, Z.; Chen, G. Increase in fish abundance during two typhoons in the South China Sea. Adv. Space Res. 2013, 51, 1734–1749. [Google Scholar] [CrossRef]
  4. Babin, S.M.; Carton, J.A.; Dickey, T.D.; Wiggert, J.D. Satellite evidence of hurricane-induced phytoplankton blooms in an oceanic desert. J. Geophys. Res. Oceans 2004, 109. [Google Scholar] [CrossRef] [Green Version]
  5. Walker, N.D.; Leben, R.R.; Balasubramanian, S. Hurricane-forced upwelling and chlorophyll-a enhancement within cold-core cyclones in the Gulf of Mexico. Geophys. Res. Lett. 2005, 32, L18610. [Google Scholar] [CrossRef]
  6. Lin, I.-I. Typhoon-induced phytoplankton blooms and primary productivity increase in the western North Pacific subtropical ocean. J. Geophys. Res. Oceans 2012, 117, 2635–2649. [Google Scholar] [CrossRef]
  7. Chen, D.; He, L.; Liu, F.; Yin, K. Effects of typhoon events on chlorophyll and carbon fixation in different regions of the East China Sea. Estuar. Coasl. Shelf Sci. 2017, 194, 229–239. [Google Scholar] [CrossRef]
  8. Liu, Y.; Tang, D.; Evgeny, M. Chlorophyll Concentration Response to the Typhoon Wind-Pump Induced Upper Ocean Processes Considering Air-Sea Heat Exchange. Remote Sens. 2019, 11, 1825. [Google Scholar] [CrossRef] [Green Version]
  9. Iwasaki, S. Daily Variation of Chlorophyll-A Concentration Increased by Typhoon Activity. Remote Sens. 2020, 12, 1259. [Google Scholar] [CrossRef] [Green Version]
  10. Wang, Y.; Xiu, P. Typhoon footprints on ocean surface temperature and chlorophyll-a in the South China Sea. Sci. Total Environ. 2022, 840, 156686. [Google Scholar] [CrossRef]
  11. Zheng, G.M.; Tang, D. Offshore and nearshore chlorophyll increases induced by typhoon winds and subsequent terrestrial rainwater runoff. Mar. Ecol. Prog. Ser. 2007, 333, 61–74. [Google Scholar] [CrossRef] [Green Version]
  12. Wang, Y. Composite of typhoon-induced sea surface temperature and chlorophyll-a responses in the South China Sea. J. Geophys. Res. Oceans 2020, 125, e2020JC016243. [Google Scholar] [CrossRef]
  13. Shropshire, T.; Li, Y.; He, R. Storm impact on sea surface temperature and chlorophyll a in the Gulf of Mexico and Sargasso Sea based on daily cloud-free satellite data reconstructions. Geophys. Res. Lett. 2016, 43, 12199–12207. [Google Scholar] [CrossRef] [Green Version]
  14. Bessho, K.; Date, K.; Hayashi, M.; Ikeda, A.; Imai, T.; Inoue, H.; Okuyama, A. An introduction to Himawari-8/9-Japan’s new-generation geostationary meteorological satellites. J. Meteorol. Soc. Jpn. Ser. II 2016, 94, 151–183. [Google Scholar] [CrossRef] [Green Version]
  15. Murakami, H. Ocean color estimation by Himawari-8/AHI. Proc. SPIE 2016, 9878, 987810. [Google Scholar] [CrossRef]
  16. Zhang, W.; Zhang, Y.; Zheng, D.; Zhou, X. Lightning Distribution and Eyewall Outbreaks in Tropical Cyclones during Landfall. Mon. Weather Rev. 2012, 140, 3573–3586. [Google Scholar] [CrossRef]
  17. Davis, A.; Yan, X.-H. Hurricane forcing on chlorophyll-a concentration off the northeast coast of the U.S. Geophys. Res. Lett. 2004, 31. [Google Scholar] [CrossRef]
  18. Pan, G.; Chai, F.; Tang, D.; Wang, D. Marine phytoplankton biomass responses to typhoon events in the South China Sea based on physical-biogeochemical model. Ecol. Modell. 2017, 356, 38–47. [Google Scholar] [CrossRef]
  19. Bender, M.A.; Ginis, I.; Kurihara, Y. Numerical simulations of tropical cyclone-ocean interaction with a high-resolution coupled model. J. Geophys. Res. Atmos. 1993, 98, 23245–23263. [Google Scholar] [CrossRef]
  20. Black, P.G. Ocean Temperature Changes Induced by Tropical Cyclones. Ph.D. Dissertation, University Park, Pennsylvania State University, State College, PA, USA, 1983; p. 278. [Google Scholar]
  21. Dare, R.A.; McBride, J.L. Sea Surface Temperature Response to Tropical Cyclones. Mon. Weather Rev. 2011, 139, 3798–3808. [Google Scholar] [CrossRef]
  22. Price, J.F. Upper Ocean Response to a Hurricane. J. Phys. Oceanogr. 1981, 11, 153–175. [Google Scholar] [CrossRef]
  23. Lin, I.-I.; Wu, C.-C.; Pun, I.-F.; Ko, D.-S. Upper-Ocean Thermal Structure and the Western North Pacific Category 5 Typhoons. Part I: Ocean Features and the Category 5 Typhoons’ Intensification. Mon. Weather Rev. 2008, 136, 3288–3306. [Google Scholar] [CrossRef] [Green Version]
  24. Zheng, Z.-W.; Ho, C.-R.; Zheng, Q.; Kuo, N.-J.; Lo, Y.-T. Satellite observation and model simulation of upper ocean biophysical response to Super Typhoon Nakri. Cont. Shelf Res. 2010, 30, 1450–1457. [Google Scholar] [CrossRef]
  25. Huang, S.-M.; Oey, L.-Y. Right-side cooling and phytoplankton bloom in the wake of a tropical cyclone. J. Geophys. Res. Oceans 2015, 120, 5735–5748. [Google Scholar] [CrossRef]
  26. Son, S.; Platt, T.; Bouman, H.; Lee, D.; Sathyendranath, S. Satellite observation of chlorophyll and nutrients increase induced by Typhoon Megi in the Japan/East Sea. Geophys. Res. Lett. 2006, 33. [Google Scholar] [CrossRef]
  27. Shi, W.; Wang, M. Observations of a Hurricane Katrina-induced phytoplankton bloom in the Gulf of Mexico. Geophys. Res. Lett. 2007, 34. [Google Scholar] [CrossRef]
  28. Lin, Y.-C.; Oey, L.-Y. Rainfall-enhanced blooming in typhoon wakes. Sci. Rep. 2016, 6, 31310. [Google Scholar] [CrossRef] [Green Version]
  29. Mei, W.; Pasquero, C.; Primeau, F. The effect of translation speed upon the intensity of tropical cyclones over the tropical ocean. Geophys. Res. Lett. 2012, 39. [Google Scholar] [CrossRef]
Figure 1. Intensities (referring to different color shadings) and central positions of all typhoon cases (in 3 h intervals) used in this study.
Remotesensing 14 06055 g001
Figure 2. Daily Chl-a composites on 31 July 2017 retrieved from (a) AHI/Himawari-8 and (b) merged MODIS Aqua-Terra.
Remotesensing 14 06055 g002
Figure 3. Characteristics of the ratios of missing values of Himawari-8 AHI images (bars in orange) and MODIS images (bars in yellow). The error bars represent the 95% confidence intervals from the mean values on different days for the two datasets.
Remotesensing 14 06055 g003
Figure 4. Temporal progression of Chl-a (and SST) changes in response to TC passage with different reacting times. The black solid line shows the results of Himawari-8 AHI observations. The dashed line shows the progression calculated by MODIS observations. The blue line shows the corresponding progression of physical responses (sea surface cooling, −δSSTn). Shading in different colors denotes the 95% confidence intervals of δCHLn (by AHI and MODIS) and δSSTn corresponding to different days.
Remotesensing 14 06055 g004
Figure 5. Schematic plot of the procedure for processing and compositing a normalized spatial characteristic of TICR (in a polar coordinate system). Black dots represent the track of typhoon Nepartak, and red texts are the dates of images from Himawari-8 for compositing.
Remotesensing 14 06055 g005
Figure 6. Continuous progression of the spatial characteristics of TICRs processed and calculated from △CH(i, j) of (a) AHI/Himawari-8 and (b) MODIS responding to typhoon passages in different stages. Dots denote the areas with values that are statistically significant, satisfying the two-tailed t-test at 95% confidence level.
Remotesensing 14 06055 g006
Figure 7. Typhoon-induced Chl-a changes (δCHLdiff) corresponding to different wind forcing strengths calculated on the basis of Equation (3) for (a) AHI and (b) MODIS composites. The change rate of SST (δSSTdiff) corresponding to different wind forcing is shown in (c). The lowest and highest sides of the blue rectangles denote the lower quartile (25th percentile) and upper quartile (75th percentile), respectively. The red line in the rectangles denotes the median. The minimum and maximum bars denote the lower quartile −1.5 × IQR and upper quartile +1.5 × IQR, respectively, where IQR denotes the upper quartile–lower quartile. The red plus signs denote the outliers. Light blue lines connect the means of each interval removing outliers.
Remotesensing 14 06055 g007
Publisher’s Note: MDPI stays neutral with regard to jurisdictional claims in published maps and institutional affiliations.

