Article

Self-Attention and Convolution Fusion Network for Land Cover Change Detection over a New Data Set in Wenzhou, China

1
Wenzhou Institute of Geotichnical Investigation and Surveying Co., Ltd., Wenzhou 325002, China
2
School of Electronic Engineering, Xidian University, Xi’an 710121, China
3
Academy of Advanced Interdisciplinary Research, Xidian University, Xi’an 710071, China
*
Author to whom correspondence should be addressed.
Remote Sens. 2022, 14(23), 5969; https://doi.org/10.3390/rs14235969
Submission received: 12 October 2022 / Revised: 16 November 2022 / Accepted: 18 November 2022 / Published: 25 November 2022
(This article belongs to the Topic Computational Intelligence in Remote Sensing)

Abstract

:
With the process of increasing urbanization, there is great significance in obtaining urban change information by applying land cover change detection techniques. However, these existing methods still struggle to achieve convincing performances and are insufficient for practical applications. In this paper, we constructed a new data set, named Wenzhou data set, aiming to detect the land cover changes of Wenzhou City and thus update the urban expanding geographic data. Based on this data set, we provide a new self-attention and convolution fusion network (SCFNet) for the land cover change detection of the Wenzhou data set. The SCFNet is composed of three modules, including backbone (local–global pyramid feature extractor in SLGPNet), self-attention and convolution fusion module (SCFM), and residual refinement module (RRM). The SCFM combines the self-attention mechanism with convolutional layers to acquire a better feature representation. Furthermore, RRM exploits dilated convolutions with different dilation rates to refine more accurate and complete predictions over changed areas. In addition, to explore the performance of existing computational intelligence techniques in application scenarios, we selected six classical and advanced deep learning-based methods for systematic testing and comparison. The extensive experiments on the Wenzhou and Guangzhou data sets demonstrated that our SCFNet obviously outperforms other existing methods. On the Wenzhou data set, the precision, recall and F1-score of our SCFNet are all better than 85%.

1. Introduction

With the development of economy and science and technology, China’s urbanization process has achieved a continuously significant increase [1]. One of the main features of the continuous acceleration of urbanization is the rapid expansion of urban land types and scales caused by the increase in urban population [2]. Therefore, the timely and effective detection of urban land use/cover changes has potential value for practical applications, such as dynamic monitoring of geographic conditions [3], urban development planning [4], and urban expansion trend analysis [5,6]. In this context, change detection techniques based on multi-temporal remote sensing images were applied to obtain quantitative or qualitative information on land use and land cover changes [7,8,9,10].
In recent decades, many change detection techniques have made remarkable progress. In the early stage, change detection can be achieved in two steps, i.e., difference image generation and difference image segmentation. Common difference image generation methods include image difference [11,12], image ratio [13,14], and change vector analysis (CVA) [15,16,17]. Difference map segmentation can usually be achieved by choosing a suitable threshold (e.g., Otsu [18]), or by using clustering algorithm (e.g., k-means [19,20], fuzzy c-means [21], support vector machine (SVM) [22]). Accordingly, many methods have been widely used in practical applications [23]. For example, a method based on spectral CVA is applied to extract the change information of Wuhan city [24]. In [25], change detection and geographic information system based on remote sensing is used to analyze the land use changes during fifteen-year time period of 1991–2006; The change detection based on CVA is employed to acquire change information in Himachal Pradesh, India [26]; In [5], the author promoted a modified ratio operator to generate a change image; Urban change information can be obtained by using this method based on multitemporal synthetic aperture radar (SAR) images in Beijing and Shanghai, China; A land cover change detection method based on SVM was developed to map urban growth in the Algerian capital [27]. Various applications can be found in [28,29]. Although these approaches have been used in practical applications, they still require manual re-editing due to their low accuracy and efficiency. Moreover, with the popularization of very-high resolution (VHR) remote sensing images and rapid urban expansion, there is an urgent need to propose more timely and effective change detection methods to obtain more accurate information on land use and land cover changes [8,14].
With the popularity of deep learning (DL) technology in the field of computer vision, the technology has attracted continuous attention in the field of remote sensing [30,31,32]. Many DL-based methods have been applied to many remote sensing tasks, such as: change detection [33,34], hyperspectral classification [35,36], remote sensing scene classification [37], semantic segmentation [38], and object detection [39], etc. Under this situation, DL-based change detection has made some progress [40,41]. In the early stage, DL was used to achieve difference image segmentation in change detection due to its excellent classification performance. Zhao et al. proposed a deep neural network to classify the difference image into a binary change map [42]. Lei et al. promoted a change detection network for landslide inventory mapping [43]. The method was first to generate a difference image, and it was denoised by multivariate morphological reconstruction. Then, a fully convolutional network within pyramid pooling was devised to segment the difference image into a change map. In the following years, in order to avoid the noise introduced by traditional difference image generation methods, many DL-based methods are further proposed for change detection. For example, Gong et al. presented a novel DL-based change detection method, which can omit the process of a difference image generation. This method can effectively avoid using the traditional difference image generation method and reduce its adverse effect on the change map. Similarly, Lv et al. employed a dual-path fully convolutional network to directly obtain the landslide map without calculating the change magnitude image. The landslide mapping performance of this method was verified on real landslide sites on Lantau Island in Hong Kong, China. Although these DL-based methods have achieved significantly better performance than traditional methods, these methods are still limited by the amount of experimental data in the data set and are difficult to extend to various practical applications on a large scale.
In recent years, more advanced DL-based end-to-end change detection methods have been proposed to alleviate the limitation of the amount of data [40]. These methods usually implement end-to-end change detection by treating the change detection task as a semantic segmentation task. In [44], three architectures based on a fully convolutional network are presented for end-to-end change detection, including fully convolutional early fusion (FC-EF), fully convolutional Siamese concatenation (FC-Siam-Conc), and fully convolutional Siamese difference (FC-Siam-Diff). According to this, many researchers have proposed many advanced end-to-end change detection networks based on these architectures. In recent years, to further expand the application of DL-based change detection, many researchers have constructed and open-sourced many advanced change detection networks and the large data sets of many different application scenarios. For instance, Ji et al. opened a data set, named the WHU data set, which includes a high-quality multi-source data set for building extraction, building instance segmentation and building change detection [45]. Meanwhile, the paper proposed a Siamese U-Net (SiUnet) for building extraction [45]. The network can also provide competitive results on the WHU data set. Chen et al. released a large-scale data set, named LEVIR-CD [46], which is composed of 637 Google Earth remote sensing image pairs of 1024 × 1024 (0.5 m/pixel). In [46], a Siamese spatial-temporal attention neural network is also devised and applied to the LEVIR-CD for building change detection. Similar large-scale data sets are S2looking in [47]. After that, many new models were proposed for these data sets. An attention-guided change detection network is devised for these data sets in [48], and devoted to achieve a better accuracy of building change detection. Liu et al. designed a Siamese local–global pyramid network (SLGPNet) and transfer learning for building change detection, which achieves excellent performance in detecting building changes [49]. The above studies have shown that deep learning-based change detection methods have made some progress in urban scenarios, especially building change detection. However, only developing a building change detection approach cannot satisfy the change detection requirements of urban land use and land cover in complex urban scenarios.
Recently, to further promote the practical application of DL-based change detection methods [50,51], some general urban change detection data sets containing changes in different ground objects were created and released. In [52], a Google Earth data set was published, which is a more challenging data set as it covers various changes in different cities in China (Beijing, Shenzhen, Chongqing, Wuhan, and Xi’an). Moreover, the paper also provided a deeply supervised image fusion network for this Google Earth data set and obtained a better detection performance. In addition, Peng et al. created a publicly VHR Google Earth data set (named Guangzhou data set), which covers the suburban areas of Guangzhou City [53]. For the Guangzhou data set, the changes are mainly caused by the urbanization process in China in the past decade, mainly including the following changes: buildings, waters, roads, farmland, bare land, forests, ships, etc. As the above large-scale urban change detection data set becomes available, more state-of-the-art (SOTA) methods have been proposed for the change detection task of complex urban scenes. For instance, a high-frequency attention Siamese network was proposed in [54], which can improve the performance by exploiting a high-frequency attention block; In [55], Fang et al., designed an SNUNet, which combines the Siamese network and the NestedUNet. The SNUNet can perform better than other SOTA change detection methods on a large-scale change detection data set with season-varying. In addition, transformer-based networks have reached SOTA performance in computer vision. Recently, transformer-based networks have attracted the attention of many researchers in the field of remote sensing, especially change detection. In this context, some transformer-based change detection networks have been proposed. A bitemporal image transformer (BIT) was developed for change detection [56], which can capture the contextual information within the spatial-temporal domain. This network can accomplish the SOTA performance compared to several recent attention-based models. Similar methods can be found in [57,58].
Despite the fact that these methods achieved convincing performance in many public urban change detection data sets, they currently face some limitations. Firstly, almost all of these SOTA approaches rely on a large number of labelled samples for network training. Secondly, in general, the performance of each method on different data sets is still not sufficiently stable. Finally, there is a lack of reliability validation for using these methods in practical applications. In this situation, two key points need to be noticed in the practical application of change detection [59].
  • The usability and generalization of DL-based change detection methods in practical application scenarios still need to be verified.
  • It is potentially meaningful to flexibly and comprehensively use one or more of the existing methods to meet the goal of real-change detection application scenarios.
In this paper, we create a new and challenging urban change detection data set oriented by practical applications, named the Wenzhou data set. The purpose of the Wenzhou data set is to achieve geographic surveying and mapping dynamic update by urban change detection, thereby providing a solid geographic information basis for the development of Wenzhou’s “smart city”. Driven by this purpose, we systematically test and compare the existing popular SOTA approaches using the Wenzhou data set, including two classical methods (FC-EF [44] and FC-Siam-Conc [44]) and four SOTA methods (SiUnet [45], SNUNet [55], SLGPNet [49], and BIT [56]). In addition, in order to meet the performance requirements of the Wenzhou data set in practical applications, we propose a self-attention and convolution fusion network (SCFNet) by combining multiple existing change detection networks or modules. The SCFNet consists of three modules. First, the backbone network of our SCFNet is the local–global pyramid feature extractor in SLGPNet [49], which can effectively capture multi-scale features. Then, a self-attention and convolution fusion module (SCFM) [60] is employed to replace the position attention module in the backbone network. The SCFM aims to capture the non-local features. Finally, a residual refinement module (RRM) [61] is deployed after the output of our backbone network. The RRM is composed of multiple residual convolutions with different dilation rates, which can refine the initial change results at the original image scale. The significant contributions of this paper are summarized as follows:
(1)
We created a new and challenging Wenzhou change detection data set, which is mainly used to acquire timely and effective land cover changes induced by urbanization in Wenzhou city, China. Based on the Wenzhou data set, we systematically tested the adaptability and performance of some existing popular and SOTA change detection approaches.
(2)
We constructed a self-attention and convolution fusion network (SCFNet) for land cover change detection, which can integrate multiple existing change detection networks or modules to enhance the performance of the model further. The constructed SCFNet can basically meet the practical application requirements of land cover change detection in Wenzhou city, China.
(3)
Compared with other SOTA methods, experiments on our created Wenzhou data set demonstrated that our SCFNet can acquire better and more balanced precision and recall. That is, the precision and recall both reach an accuracy of more than 85%. Furthermore, the effectiveness of our SCFNet is also validated on the public Guangzhou data set and achieves a good performance.
The rest of this paper is arranged as follows. In Section 2, the materials and methodology are described in detail. Section 3 presents the experiments and results. Finally, the conclusions and future works are provided in Section 5.

2. Materials and Methodology
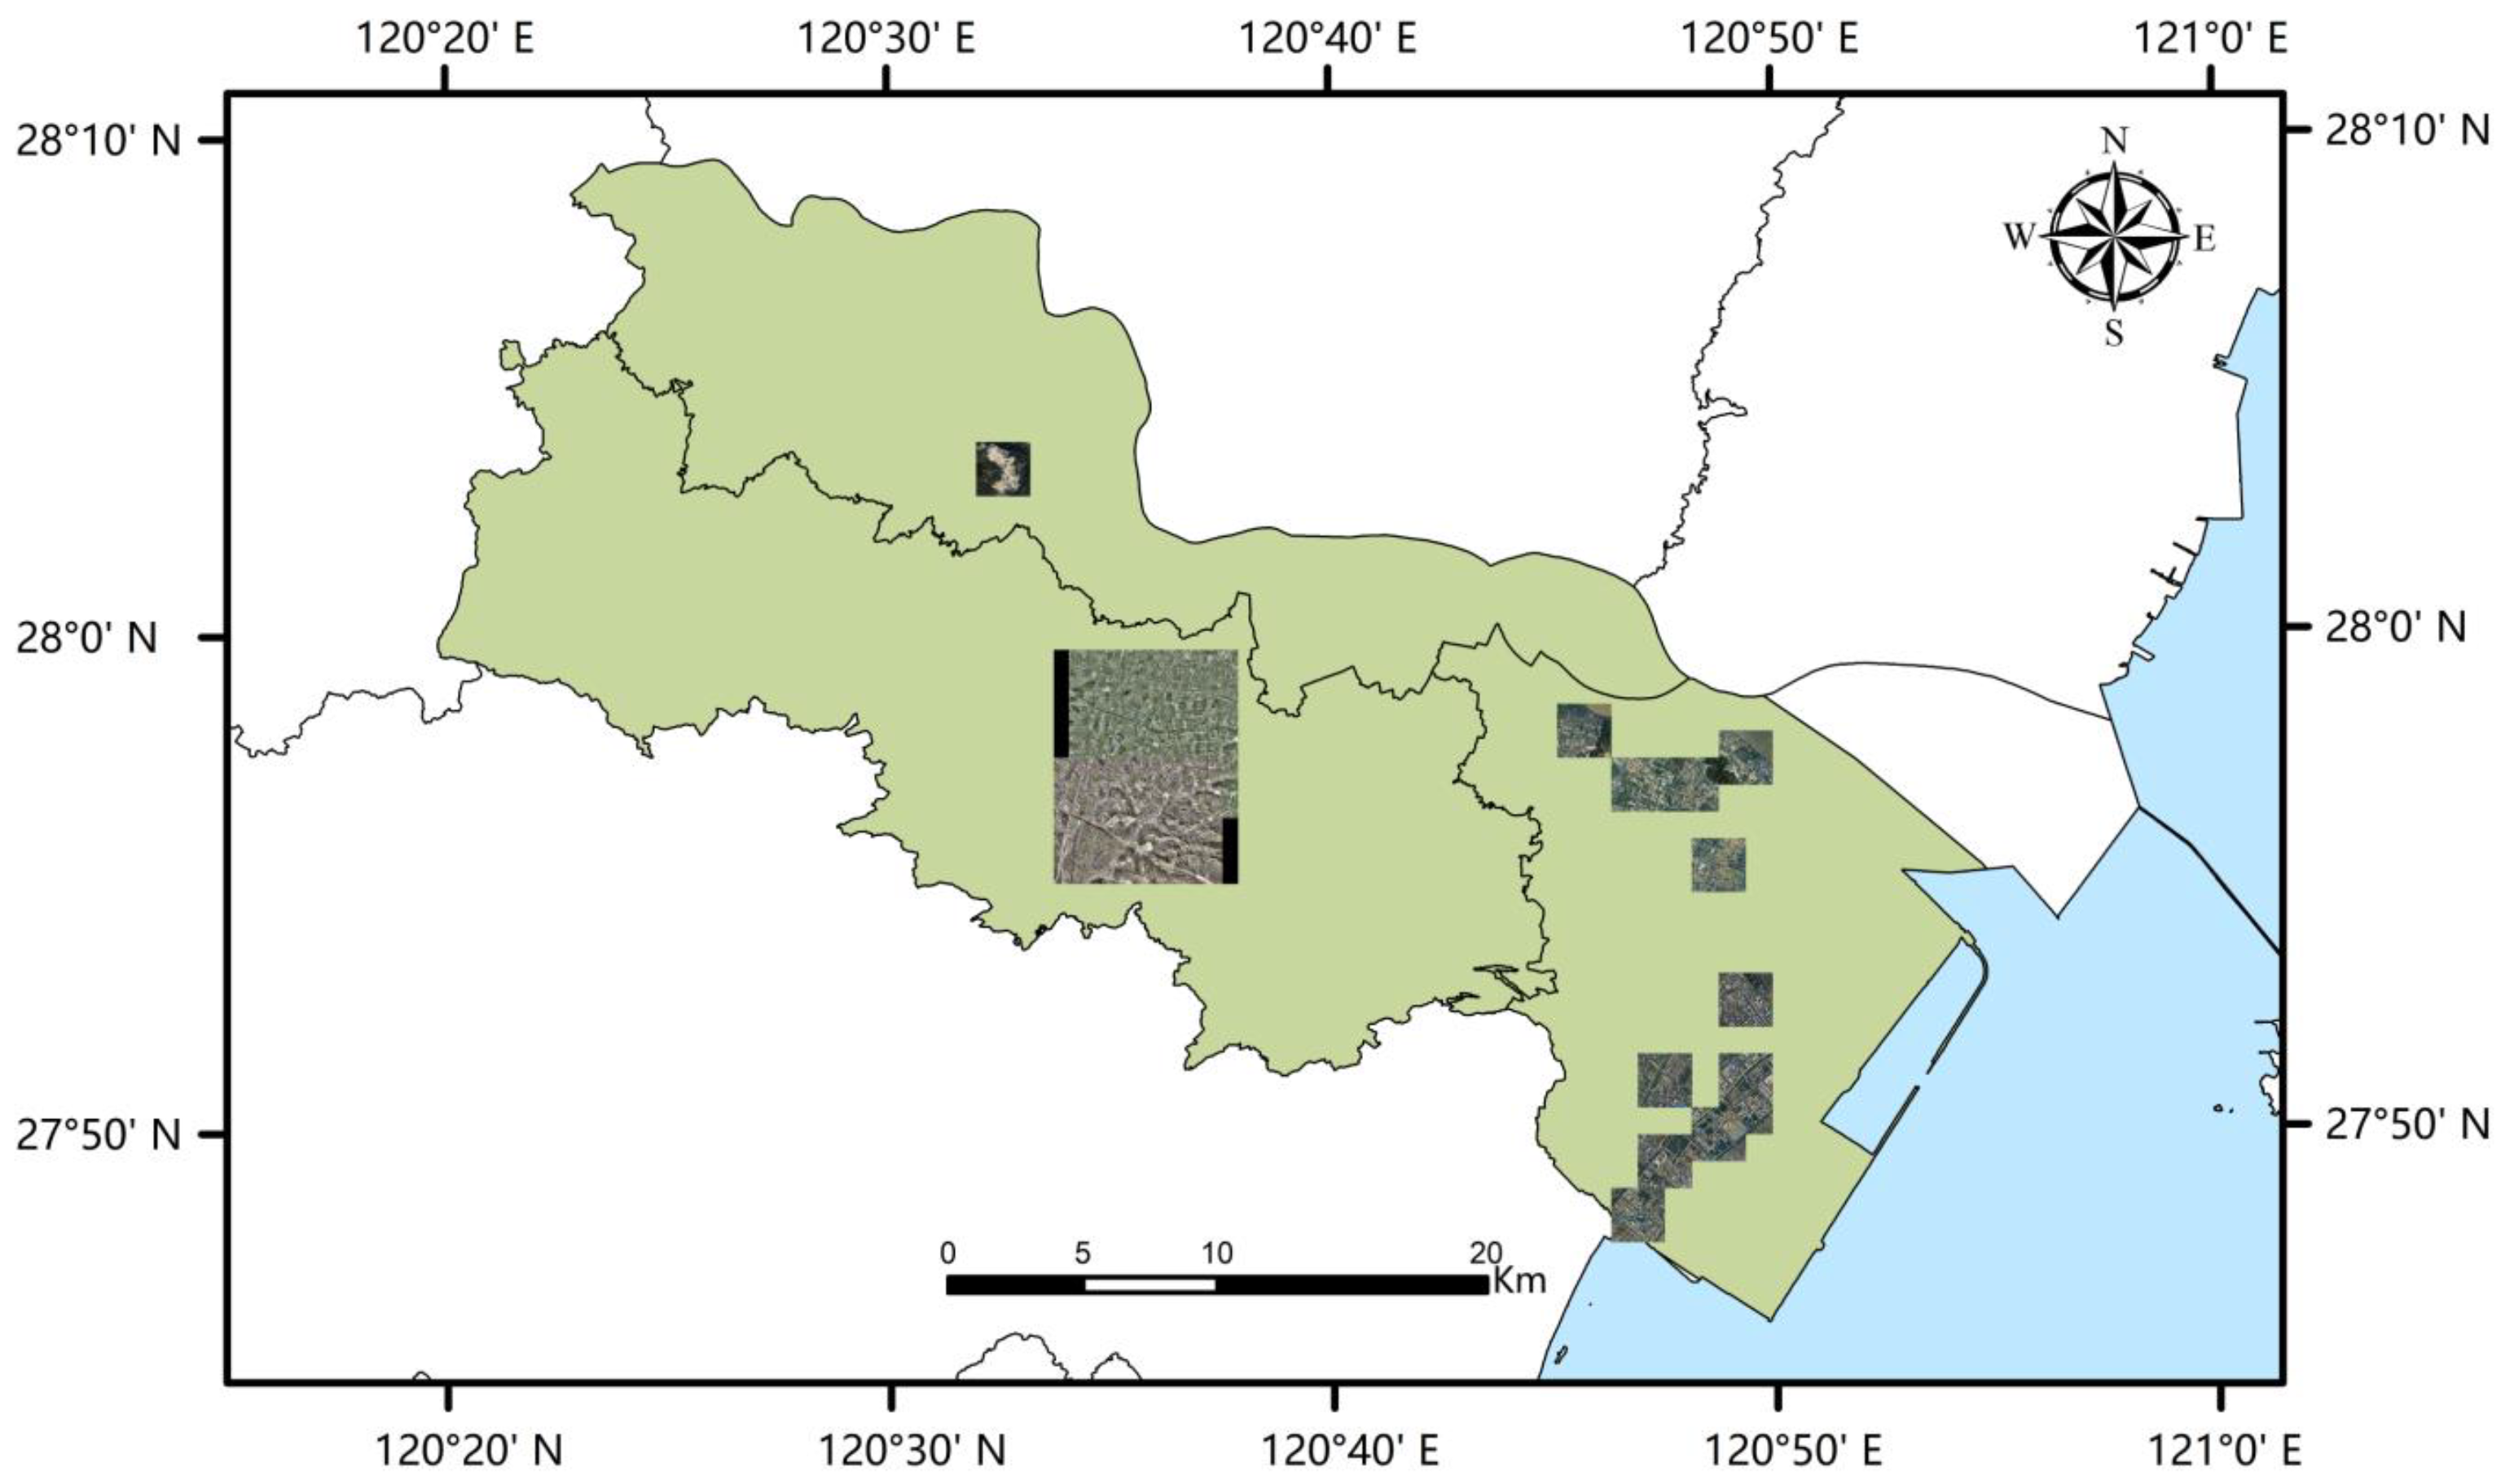
In this section, we present a detailed presentation of the materials and methodology used in this study. First of all, the details of the study area and data set are described in Section 2.1. Subsequently, in Section 2.2, the methodology is introduced in detail. In particular, an overview of the constructed SCFNet is provided in Section 2.2.1. Section 2.2.2 and Section 2.2.3 illustrate the SCFM and the RRM, respectively.

2.1. Study Area

In this paper, we chose Wenzhou city as the study area, as shown in Figure 1. Wenzhou city is located in the middle of the coastline of the Pacific Rim (approximately 18,000 km) in mainland China, in the southeast of Zhejiang Province. The urban area of Wenzhou is approximately 1054 km2, with mountains, forests, water bodies, and various surface types. In recent years, with the rapid and stable development of Wenzhou’s urbanization process, the urban landscape of Wenzhou city has undergone tremendous changes. Consequently, the research and application of the DL-based land cover change detection approach is performed to provide a geographic information basis for Wenzhou’s “smart city” construction, natural resource management, and urban geographic dynamic update.
In this study, we selected some representative areas (as shown in the rectangular area in Figure 1) from Wenzhou City to create our data set, named Wenzhou data set. Some representative examples of this data set are presented in Figure 2. The Wenzhou data set was captured between 2017 and 2021 by an aviation aircraft equipped with a Digital Mapping Camera III at an altitude of approximately 4.44 km. The spatial resolution was 0.2 m/pixel after re-sampling. This data set covers an area of approximately 112.026 km2. The purpose of our created Wenzhou data set was to update the geographical data of urban expansion. Hence, it is mainly focused on land cover from natural objects to become related to urban construction areas (such as the changes in natural objects into buildings, bridges, roads, and other places related to urban expansion, without paying attention to changes in waters etc.). It is worth mentioning that the core changing features are built-up areas because of urbanization. The main challenges and requirements of this data set lie in the four following aspects.
(1)
Bi-temporal images of the Wenzhou data set were collected from multiple periods (from 2017 to 2021). This may increase the difficulty of change detection since the bi-temporal images are shot under different atmospheric conditions, such as the sun height and moisture, etc.
(2)
The changes in the built-up area of the Wenzhou data set are complex. Due to a large number of demolition and reconstruction projects in the Wenzhou urban area, the old and new houses in the old urban area and “urban villages” alternate, and high-rise buildings and low-rise buildings coexist. These conditions make land cover change detection in the Wenzhou data set more challenging.
(3)
Since the primary type of change in the Wenzhou data set is a built-up area, and other types of changes are relatively small, this may lead to an imbalance in the number of different types of ground objects.
(4)
To avoid secondary manual editing in practical applications, DL-based change detection methods require both precision and recall to be higher than 85%.
To sum up, according to the above characteristics, the Wenzhou data set is very suitable for systematically testing existing DL-based change detection methods. Furthermore, there is potential value in providing a reliable and satisfying solution for the Wenzhou data set. Hence, this study will further promote the practical application of DL-based change detection methods.

2.2. Methodology

In this section, the proposed method is demonstrated in detail in three different parts. In the first part, the overall framework of SCFNet is briefly illustrated. In the second part, a mixed module of self-attention and convolution, SCFM, is introduced in detail. Finally, an employed performance refinement module, RRM, is illustrated in the third part.

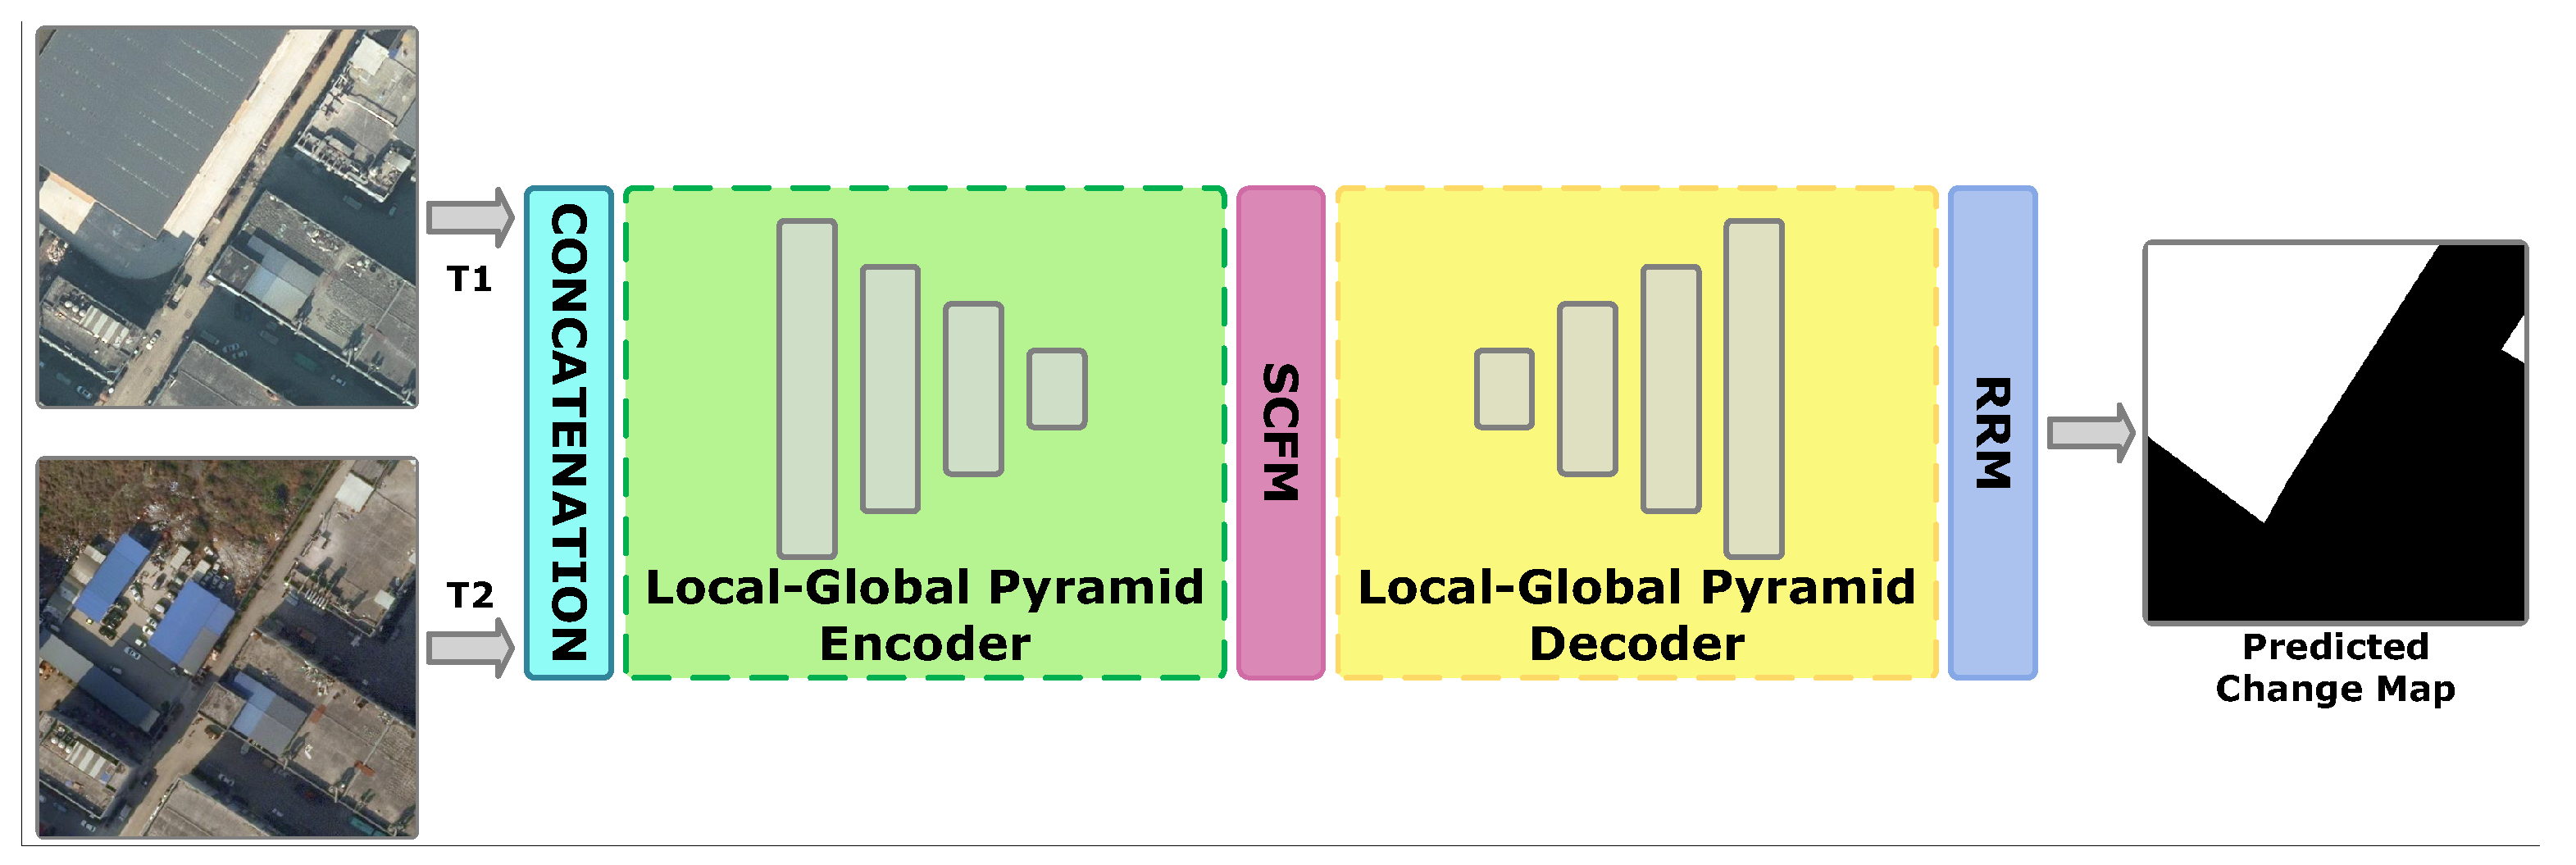
2.2.1. Overview of Self-Attention and Convolution Fusion Network

A proper backbone is significant for correctly detecting building changes in the remote sensing data that are not perfectly orthophotos. Through extensive experiments, we found it difficult for many conventional state-of-the-art deep neural networks to acquire acceptable results over the new constructed data set. To tackle non-orthophoto bi-temporal images and the corresponding annotations, we employed a modified Siamese local–global pyramid network (SLGPNet) [49], which has been tested in similar tasks, as the backbone of the proposed SCFNet. The SLGPNet utilizes two different feature pyramids to better capture the local and global relationships between building objects over bi-temporal images, resulting in excellent results. Based on this fact, the encoder and decoder of SLGPNet are exploited in our work to acquire more accurate annotations of changed buildings over the study area. Additionally, another two network modules, SCFM and RRM, are introduced in the proposed network for finer performance.
Given the information below, the proposed method can be explained as follows: As shown in Figure 3, the bi-temporal remote sensing images are firstly concatenated and input into the local–global pyramid encoder to acquire the deep representative change information. Then, we exploit SCFM to refine the extracted feature through the fusion of the self-attention mechanism and convolutional layers. At the decoding stage, deep change information is gathered and integrated layer-by-layer. Finally, the change map is acquired after being refined by RRM.

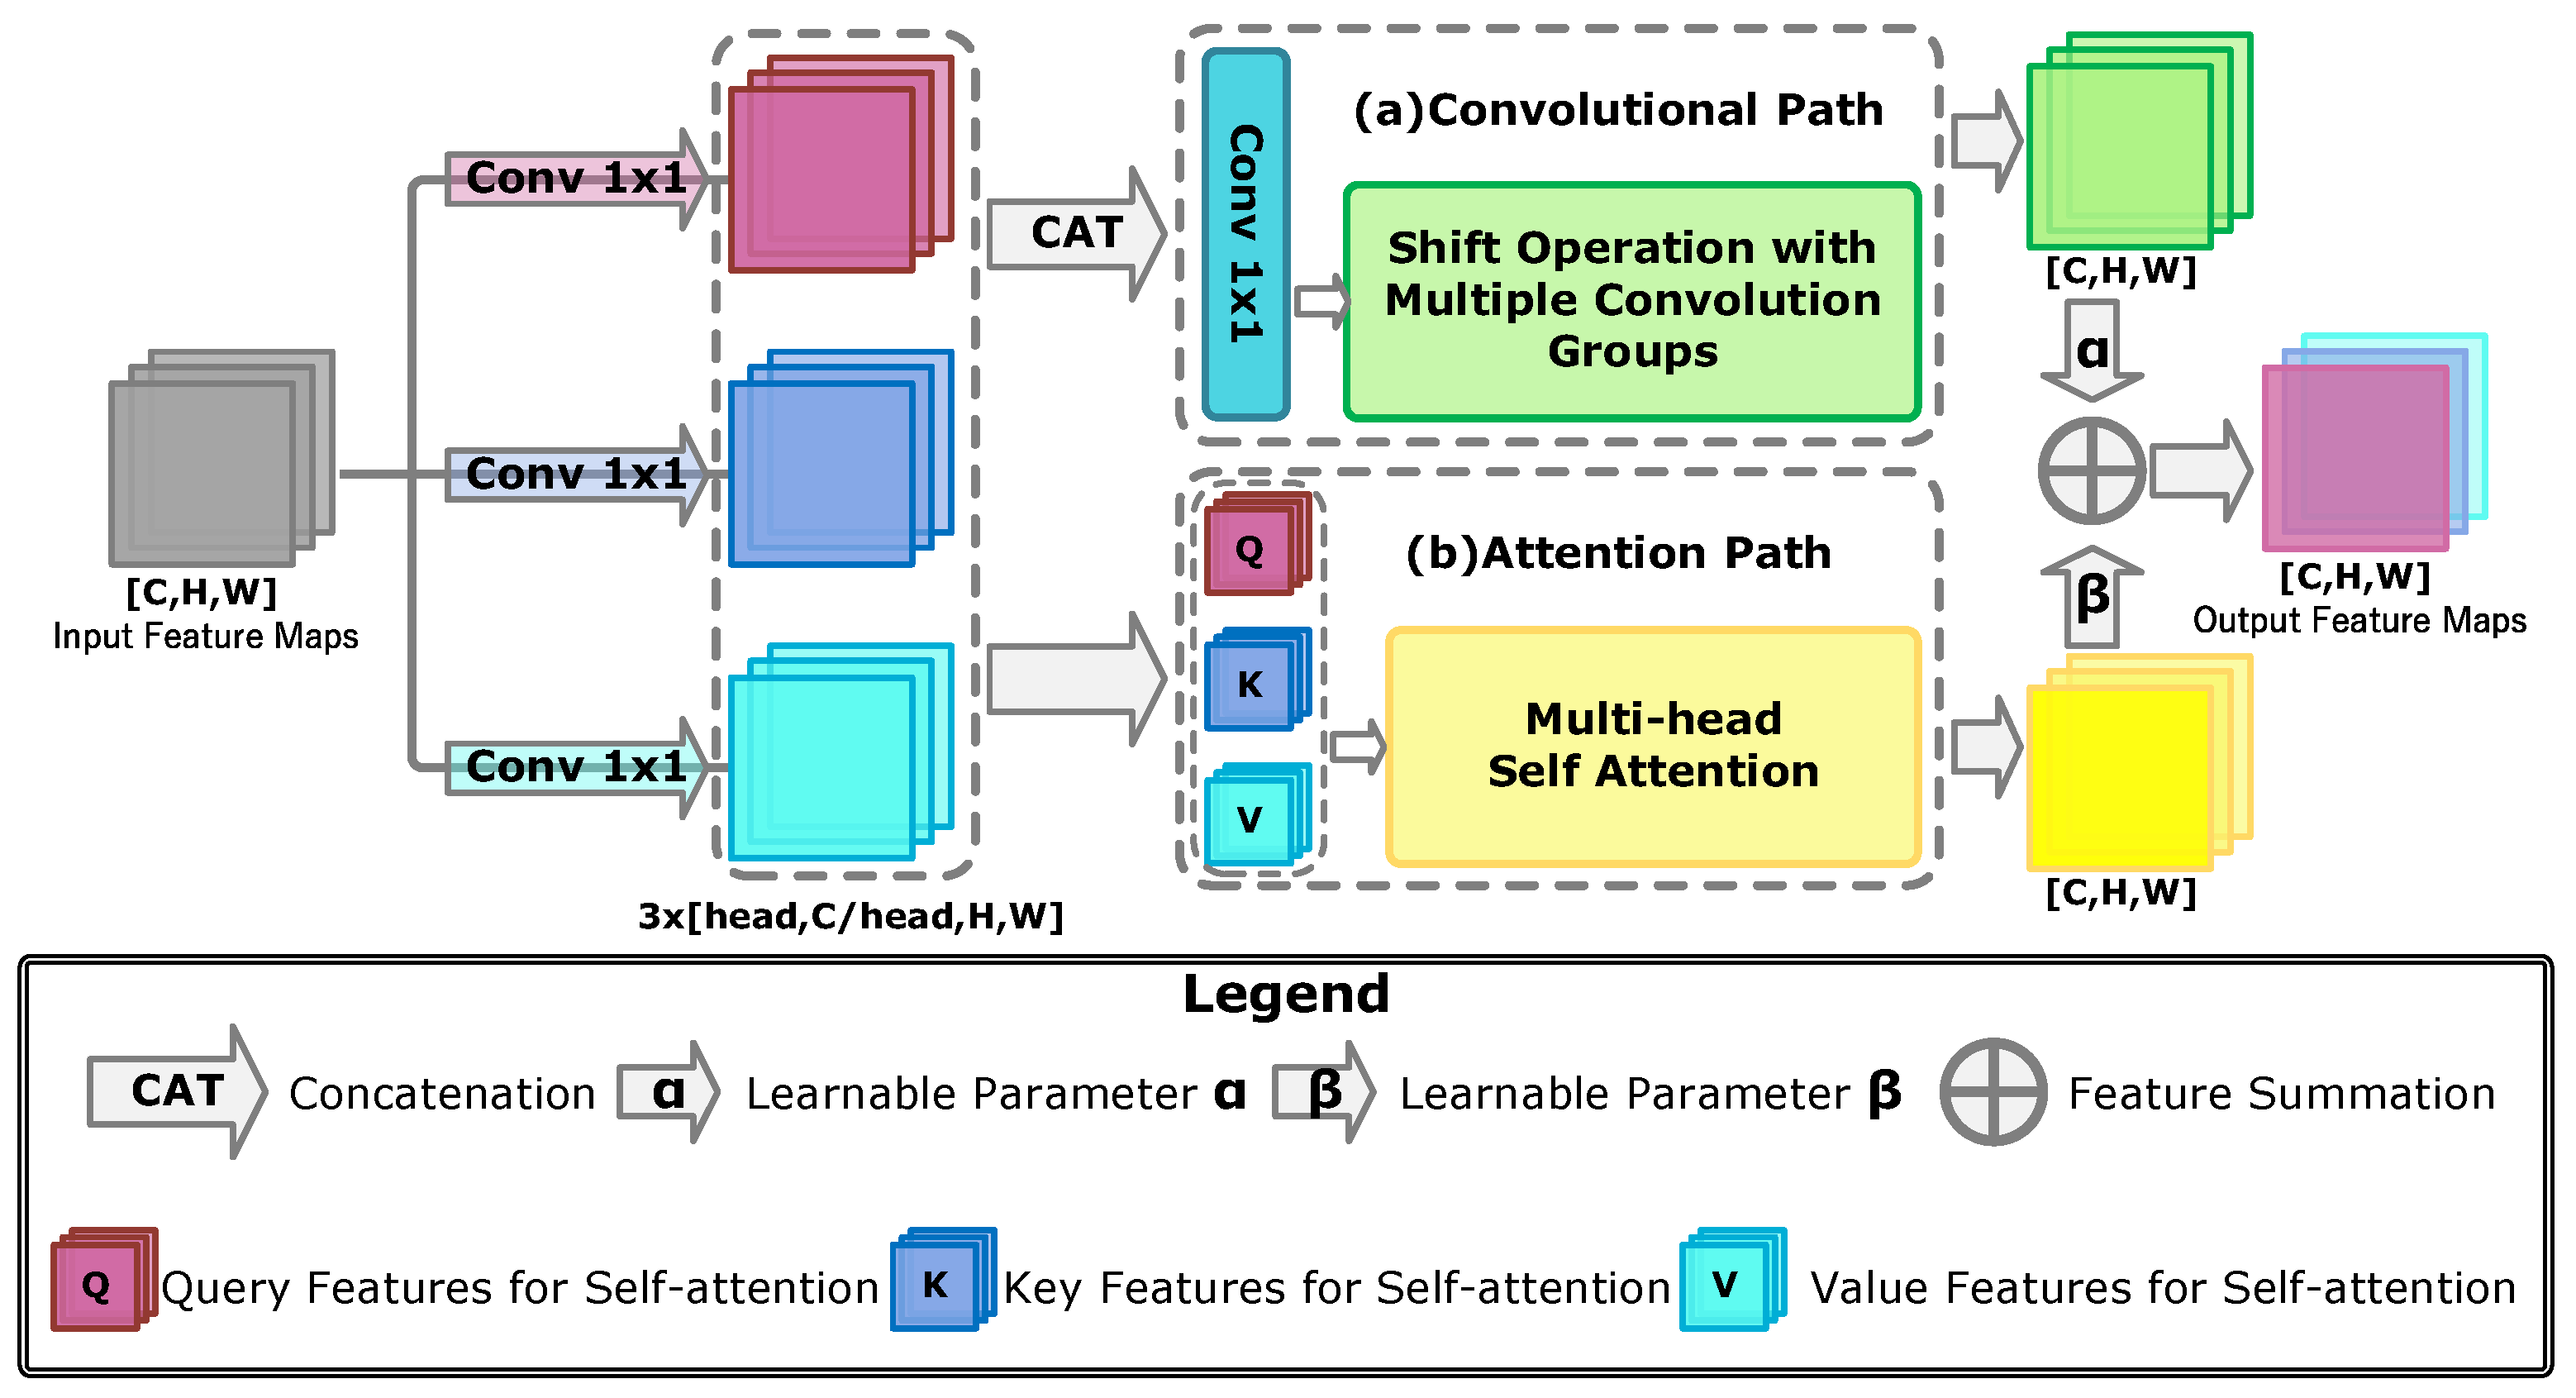
2.2.2. Self-Attention and Convolution Fusion Module

The fusion of self-attention and convolutional layers have been proven helpful for deep learning-based image processing [60]. Inspired and encouraged by its success, similar techniques are introduced in the proposed method for better feature representation. In the SCFNet, the SCFM is employed to replace a self-attention-based module in the SLGPNet to better capture the semantic and location mapping of varied buildings in the study area, since there is an extra convolution path in the SCFM compared to the replaced module. Additionally, the SCFM can contribute to overcoming a specific challenge of the proposed data set, which is the commonly occurring non-orthophoto data. That is because there is a learnable shift operation-based convolution path in SCFM, which has the potential to better fit the non-orthophoto data set through the feature-level shift. As a result, the SCFM is introduced for a better feature representation and a finer annotation of non-orthophoto change information, and its brief process is depicted in Figure 4. With the illustration in Figure 4, the SCFM can be better described in the mathematical style below.
Firstly, the input feature maps of SCFM, F i n p u t R C i n p u t × H × W , comes from and was processed by the previous encoder layers of SCFNet, where H × W , and C i n p u t are the spatial and channel sizes of F i n p u t , respectively. Then, F i n p u t are transformed into three different parts with the size of R h e a d × C o u t p u t / h e a d × H × W , which can be described as follows:
F Q = R e s h a p e c o n v 1 × 1 1 F i n p u t
F K = R e s h a p e c o n v 1 × 1 2 F i n p u t
F V = R e s h a p e c o n v 1 × 1 3 F i n p u t
where c o n v 1 × 1 i | i = 1 , 2 , 3 and Reshape indicates the convolutions with the kernel size of 1 × 1 and a shape transformation from C o u t p u t × H × W to h e a d × C o u t p u t / h e a d × H × W , respectively. The head represents the head number of multi-head attention in the SCFM, which is a fixed number of 4 in our method. At the next stage of SCFM, these features will be processed by two different paths, i.e., (a) convolutional path and (b) attention path, which can be illustrated as follows:
(a) Convolutional Path: In this path, features will be firstly gathered and projected by a feature concatenation and a 1 × 1 convolution, respectively. Then, a learnable shift operation will be conducted to the extracted feature maps, which is a multi-group convolutional layer with a set of reinitialized kernels. In this case, the extracted feature maps will firstly be shifted to several different fixed directions for a wider but rough cognition of non-orthophoto building objects. Then, the shift operation can be adjusted to a finer condition with these learnable kernels during supervised learning. The output of the convolutional path, F c o n v R C o u t p u t × H × W , can be represented as follows:
F c o n v = s h i f t _ o p e r a t i o n c o n v 1 × 1 4 C A T F Q , F K , F V
where CAT indicates the feature concatenation, and c o n v 1 × 1 4 represents a 1 × 1 convolutional layer. The s h i f t _ o p e r a t i o n denotes the multi-group convolutional layer with the kernel size of 3.
(b) Attention Path: In the attention path, the extracted query, key, and value features are processed by a multi-head self-attention mechanism for a better feature representation, which can be briefly denoted as follows:
F a t t = s e l f _ a t t e n t i o n F Q , F K , F V
in which F a t t R C o u t p u t × H × W is the output of attention path in SCFM, and s e l f _ a t t e n t i o n indicates the aforementioned multi-head self-attention with the head number of 4. Notably, positional encoding is also utilized in this stage for better location mapping.
With the output of both paths acquired, two learnable parameters are employed to generate F o R C o u t p u t × H × W , and the final output of SCFM can be represented as:
F o = α F c o n v + β F a t t
where α and β are the learnable adjustment parameter for convolutional and attention paths, respectively. They are utilized to acquire a more stable and reliable output for SCFM.

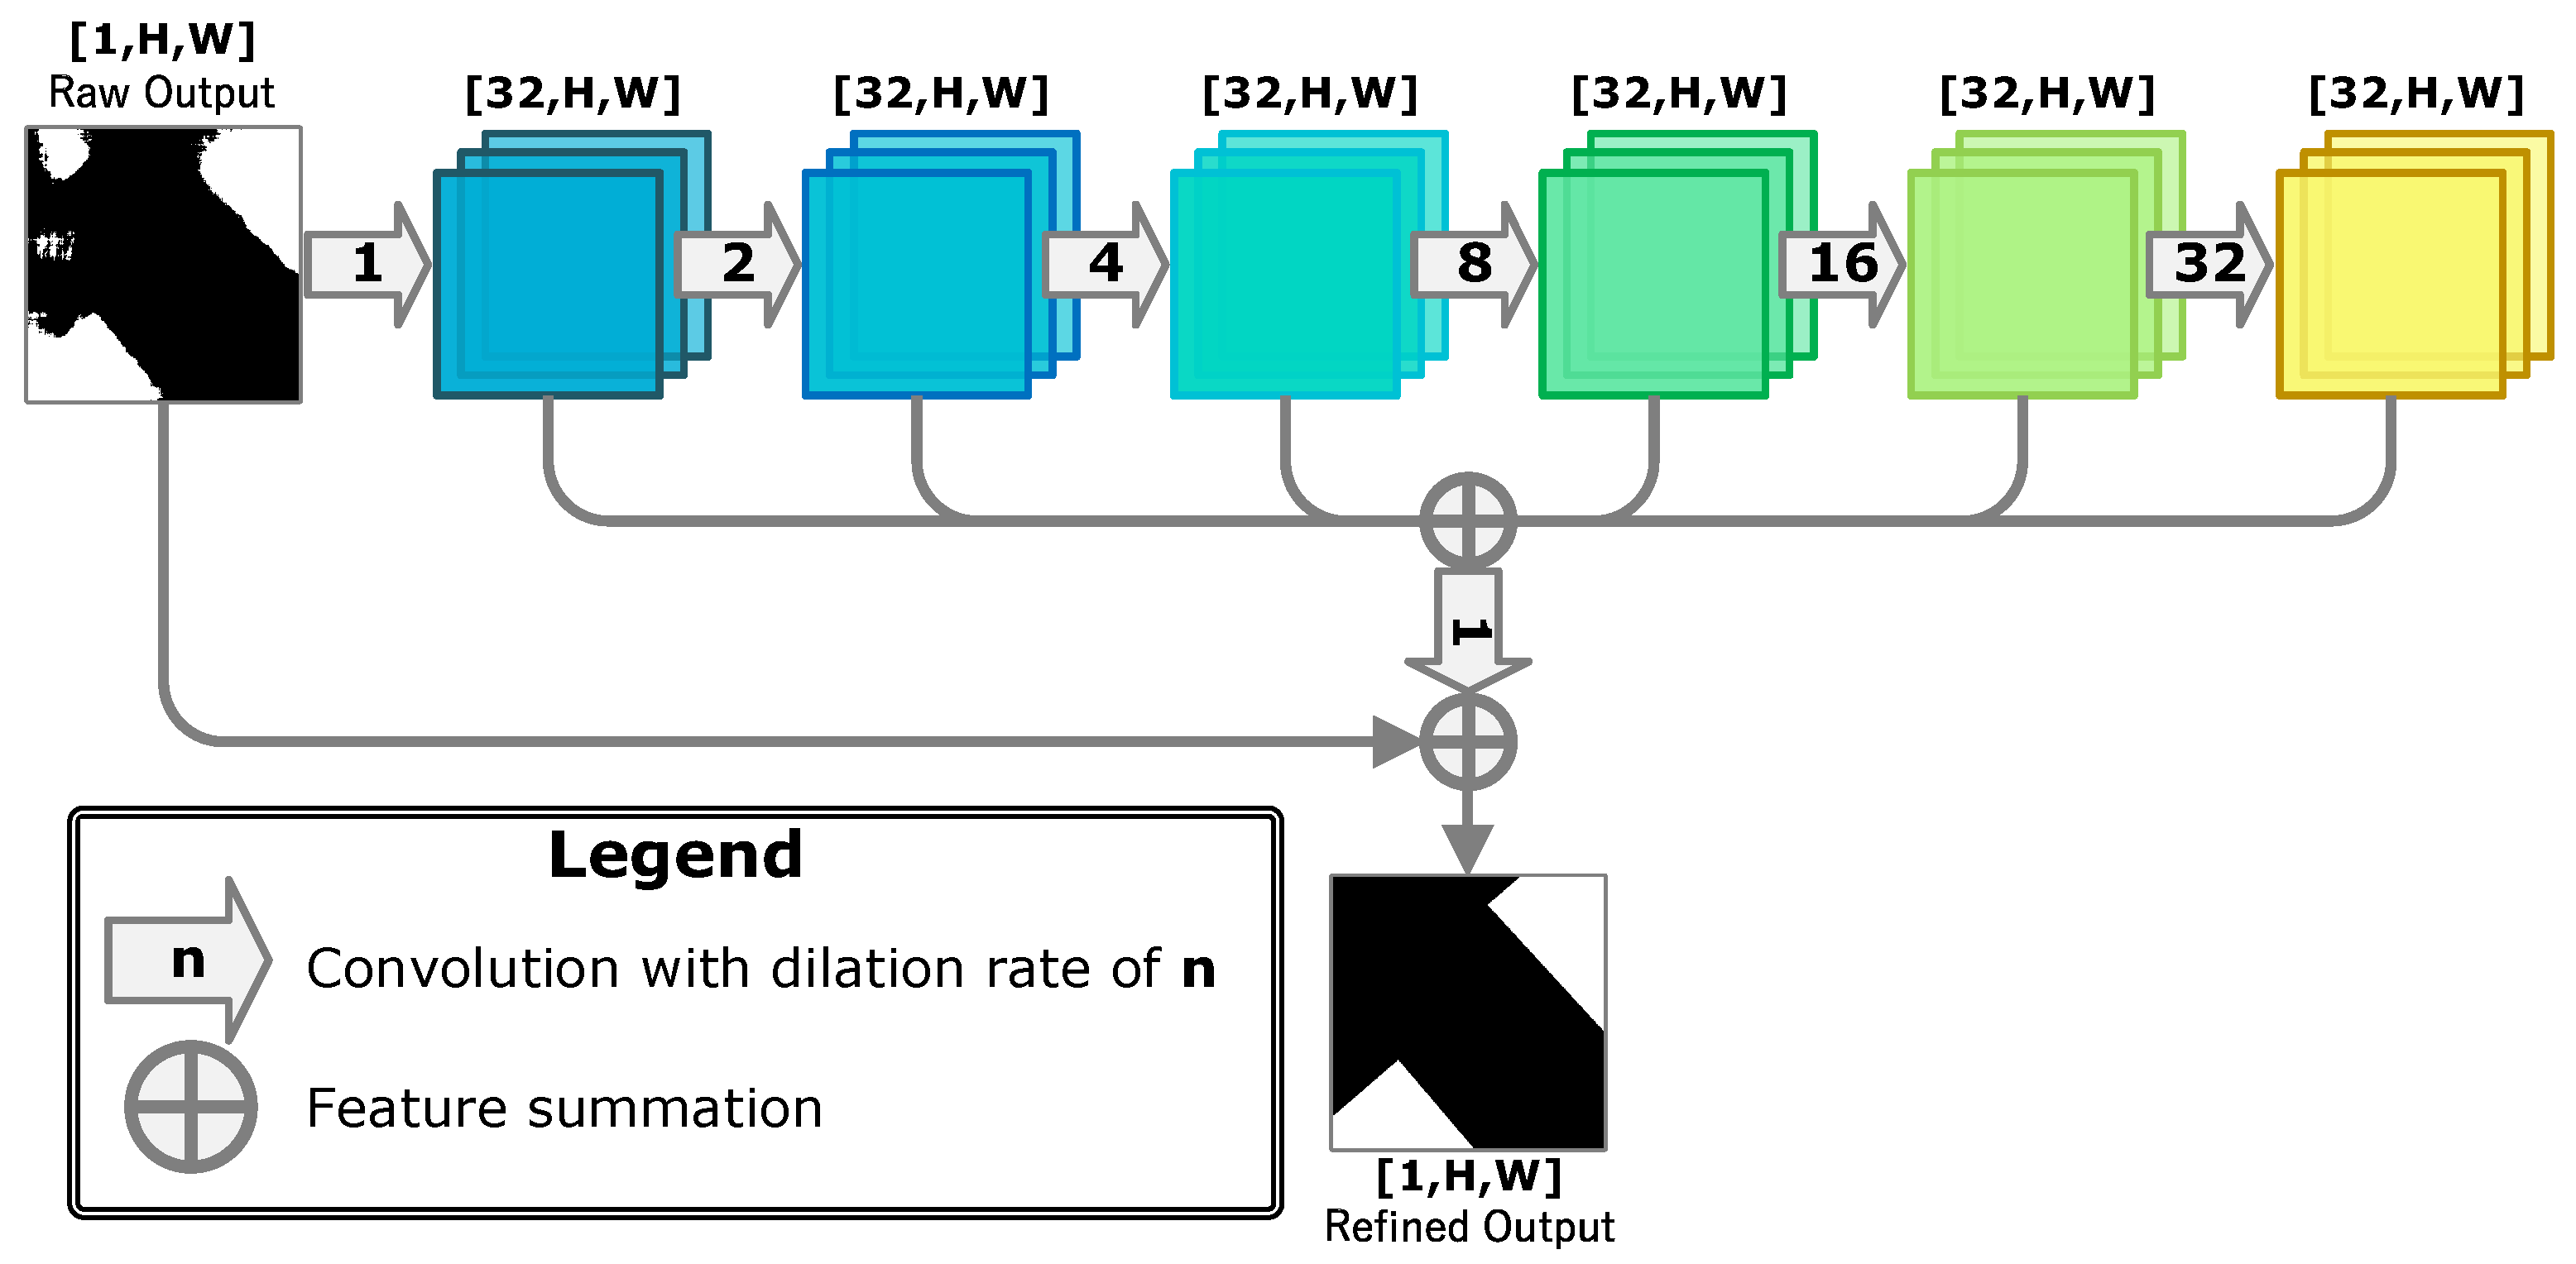
2.2.3. Residual Refinement Module

In the proposed data set, large-scale building change areas are almost everywhere, which can be discovered in Figure 2. However, the predicted annotations can be incomplete for the deep learning-based method. More than that, in the application scene of this work, the completeness and correctness of the detected change areas are equally significant. Driven by this additional requirement, the RRM, which is inspired by [61], is introduced in the proposed method for more complete land cover detection. As shown in Figure 5, the RRM employs a series of dilated convolutions to refine the raw output of SCFNet to seek more complete annotations, which can be represented as outlined below.
Let F 0 R H × W be the raw output waiting for the refinement of RRM, where H, W denotes the height and width, respectively. Then, a set of extracted features, F i R 32 × H × W where i = 1 , 2 , 3 , 4 , 5 , can be denoted as:
F i + 1 = d i l a t e d _ c o n v 3 × 3 i F i
where d i l a t e d _ c o n v 3 × 3 i indicates 3 × 3 convolutions with different dilation rates. Then, these features are gathered and fused by a feature-wise summation and a convolutional layer, which can be demonstrated as:
F m = c o n v 3 × 3 F 1 + F 2 + F 3 + F 4 + F 5
Finally, the refined output F r o can be acquired as:
F r o = F m + F 0

3. Experiments and Results

3.1. Experimental Settings

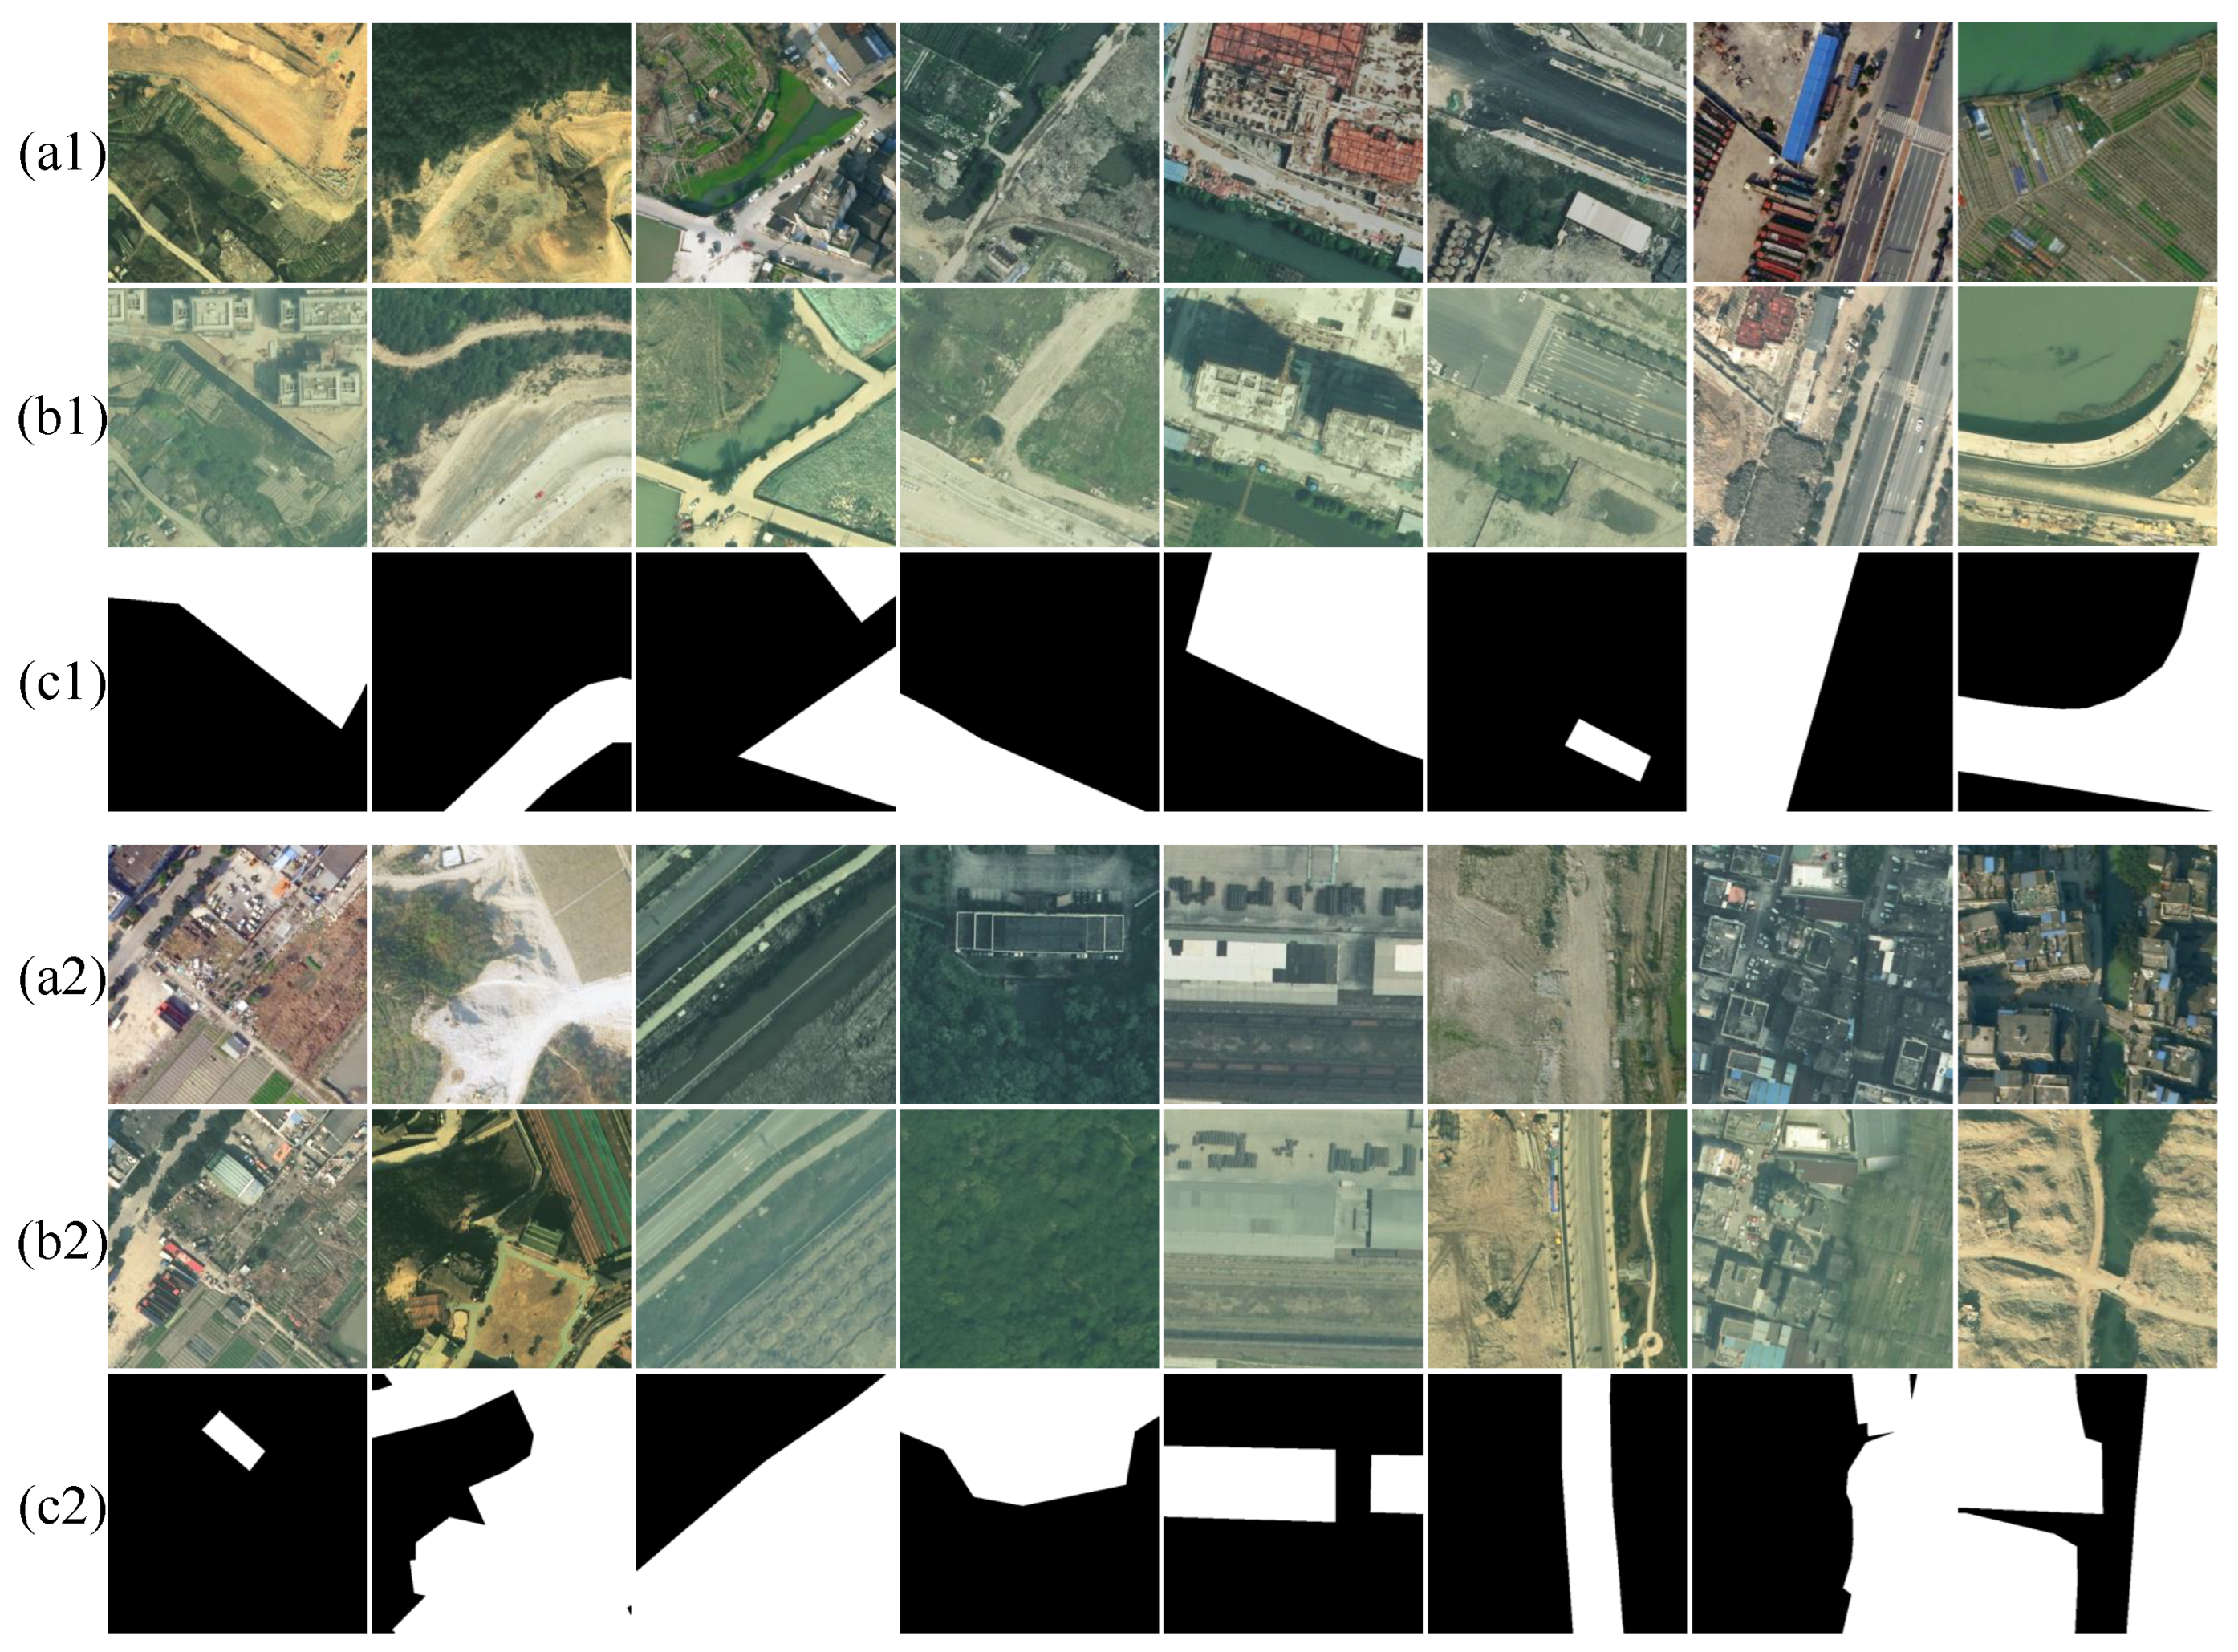
3.1.1. Data Set Descriptions

Wenzhou Data Set: For our created Wenzhou data set, to adapt the memory of the graphics card, the images for the entire study area are cropped into 4442 non-overlapping pairs of 512 × 512 pixels. We randomly divided all images into a training set (3554 tiles), a validation set (117 tiles), and a testing set (771 tiles). As such, all models were systematically tested and evaluated on the Wenzhou data set.
Guangzhou Data Set: This data set focuses on the land cover changes that occurred in the suburban areas of Guangzhou City, China, which share some similarities with the application scene in Wenzhou. Both of them depict the urbanization process that happened around the urban area. The remote sensing data of the Guangzhou data set is captured by Google Earth, between 2006 and 2019, with a spatial resolution of 0.55 m. In detail, it has 19 VHR bi-temporal image pairs with the sizes ranging from 1006 × 1168 to 4936 × 5224 , which includes a large number of complicated scenes in different areas around Guangzhou. In our experiments, they are cropped into 3130 non-overlapping image pairs with the size of 256 × 256 . We used 2191 of them for training. Furthermore, the rest of them are utilized as the testing data.

3.1.2. Evaluation Metrics

In the experiments, four widely used evaluation metrics were selected for the quantitative assessment and comparison of land cover change detection, including P r e c i s i o n , R e c a l l , F 1 - S c o r e , and intersection over union ( I o U ) [49,54,56]. These four evaluation metrics can be calculated by the following formula.
P r e c i s i o n = T P T P + F P
R e c a l l = T P T P + F N
F 1 - S c o r e = 2 × P r e c i s i o n × R e c a l l P r e c i s i o n + R e c a l l
I o U = T P T P + F P + F N
where T P , T N , F P , and F N denote true positive pixels, true negative pixels, false positive pixels, and false negative pixels, respectively. The confusion matrix can obtain T P , T N , F P , and F N based on the binary classification. Here, the P r e c i s i o n represents the proportion of correctly detected changed pixels among the detected as changed pixels. The R e c a l l represents the proportion of correctly detected changed pixels among the truly changed pixels. The F 1 - s c o r e is an indicator that takes into account both precision and recall, because F 1 can be regarded as the harmonic average of precision and recall. Additionally, the I o U represents the ratio of the intersection and union between pixels detected as changed and true changed pixels.

3.1.3. Benchmark Methods

To systematically evaluate and compare the performance of the existing DL-based change detection methods and our SCFNet, six benchmark methods were selected in the experiments. These approaches are presented as follows:
(1)
FC-EF [44]: This method is a benchmark change detection model, which is a simplified U-shaped network. It employs an early fusion strategy to fuse bi-temporal images for change detection. This is a widespread end-to-end change detection framework.
(2)
FC-Siam-Conc [44]: The model is also a U-shaped network. The difference is that it adopts a post-fusion strategy to fuse the features of bi-temporal images. Specifically, this model first extracts the deep features of the bi-temporal images by means of a Siamese encoder. Then, these deep features can be fused by the concatenation operation, and input into the decoder to obtain the change detection results. This is another attractive Siamese-based end-to-end change detection framework.
(3)
SiUnet [45]: The method is a Siamese U-Net framework for building extraction. It uses a down-sampled counterpart of original bi-temporal images to enhance the multi-scale features of the network, resulting in improved detection performance. To this end, we adopted an early fusion strategy to deploy the SiUnet for the change detection task.
(4)
SNUNet [55]: The model is constructed by the combination of Siamese network and NestedUNet, which can reduce the loss of localization information [55]. This method can achieve the SOTA performance on the CDD data set [55,62].
(5)
SLGPNet [49]: This approach is an end-to-end Siamese-based building change detection network, which devises a local–global pyramid structure for building feature extraction. It obtains the best accuracy on WHU [45] and LEVIR-CD [46] data sets for change detection.
(6)
BIT [56]: The model is a SOTA transformer-based change detection network. It exploits a transformer encoder and decoder to build the contexts within the spatial-temporal domain for change detection. This network acquires a promising performance on the LEVIR-CD [46], WHU [45], and DSIFN [52] data sets.

3.1.4. Implementation Details

In the experiments, all models were deployed based on the PyTorch platform. These models were trained on an NVIDIA RTX 3090 graphics card (Nvidia, Santa Clara, CA, USA). The hyper-parameters of these benchmark methods are set to the optimal configuration. For our SCFNet, we employed the Adam optimizer with a weight decay rate of 1 × 10⁻⁵, and the learning rate is initialized to 1 × 10⁻⁴. Furthermore, binary cross entropy was adopted as the loss function for network training. The batch size of all models was set to 4 on both the Wenzhou and Guangzhou data sets. It is worth noting that not all models exploit a data augmentation strategy. All models are trained and tested based on these settings for land cover change detection.

3.2. Results

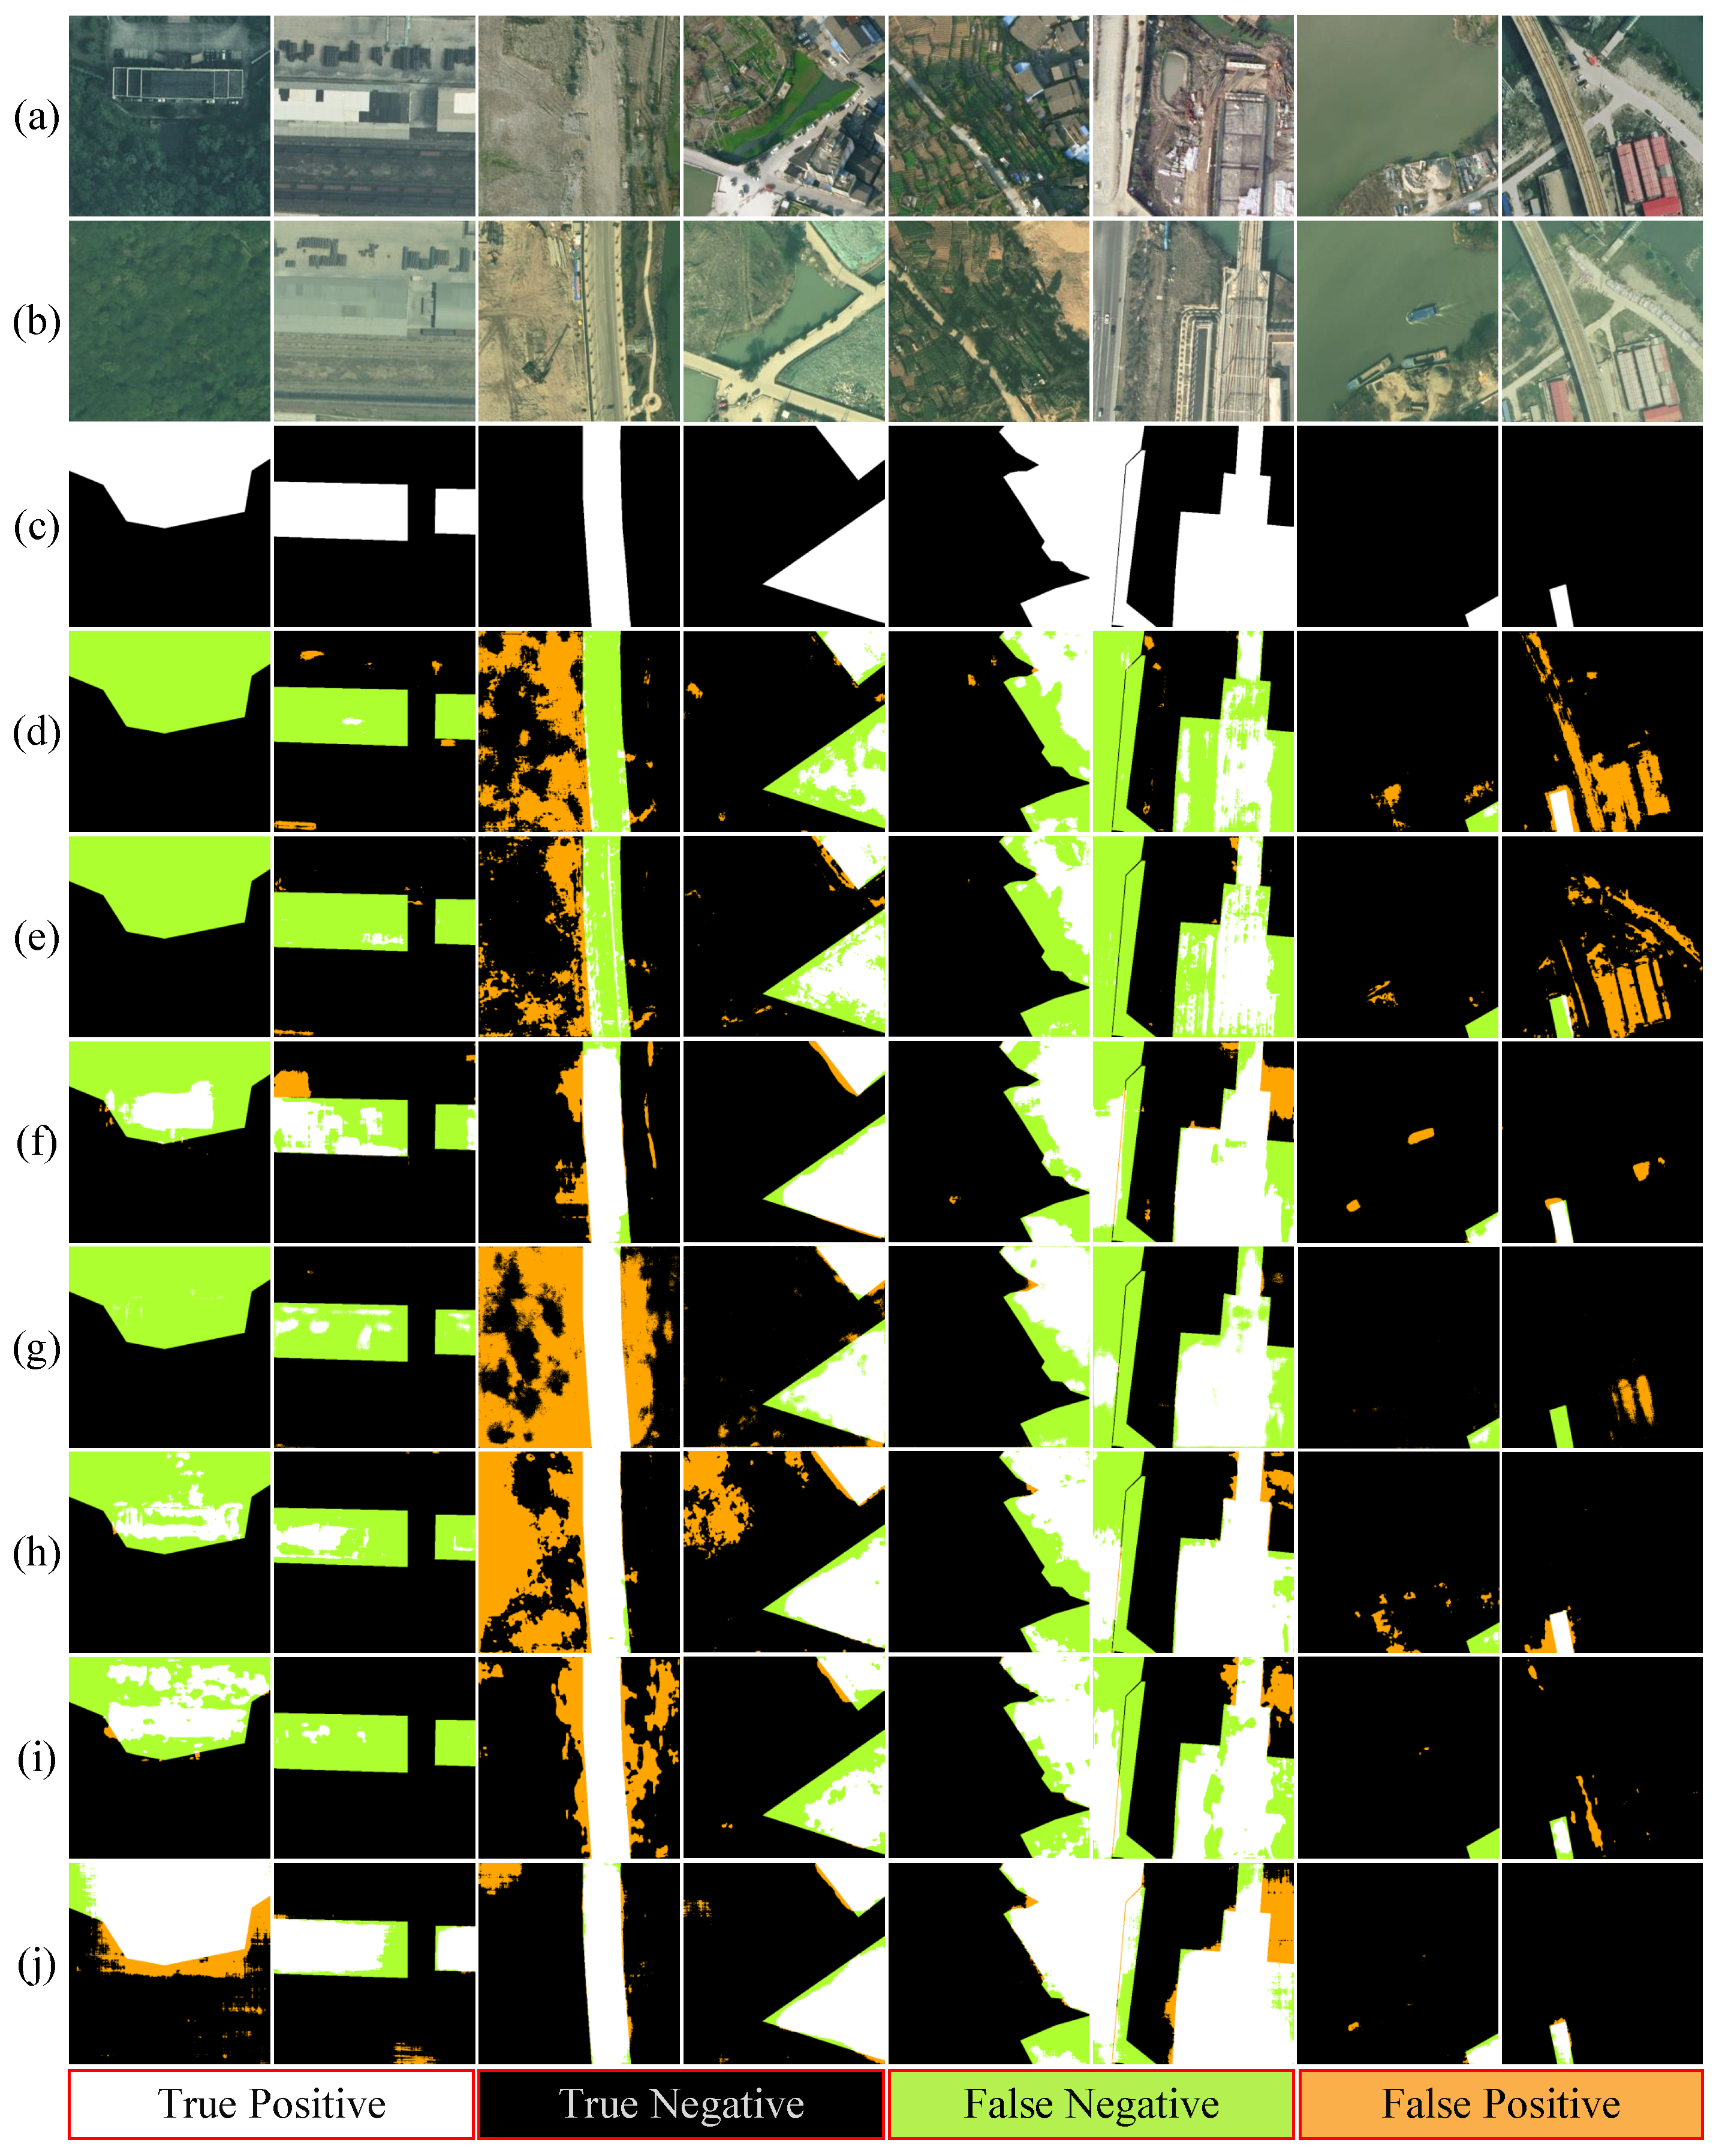
3.2.1. Results on Wenzhou Data Set

As shown in Figure 6a, the confusion matrix of the proposed method is acquired on the Wenzhou data set. This confusion matrix indicates the overall performance of our method, especially on the changed and unchanged classes. Concretely, the quantitative results over Wenzhou data set indicate that the proposed method achieves an overwhelming advantage in all evaluation metrics compared to other benchmark methods, as listed in Table 1. Especially in IoU, the proposed SCFNet achieves the best performance of 75.36%, which is over 10% more than the second-best method. Moreover, both the Recall and Precision of SCFNet are over 85%, which achieves the requirement of this application scene in Wenzhou. Since our approach achieves the best recall and precision, it also has the best F1 performance over these benchmark methods, which suggests that our method can compete with current SOTA methods. These advantages in the Wenzhou data set can also be discovered in the corresponding visual results, as depicted in Figure 7. Generally, the proposed method can obtain more accurate change maps with less missed and false alarms. For example, in the fourth pair, the proposed SCFNet almost entirely detects two build-up areas with less false positive pixels than other methods. In this scene, BIT achieves a relatively low false alarm level, but the missed alarm is hard to ignore. To conclude, the proposed method outperforms these SOTA benchmark methods with significant advantages.

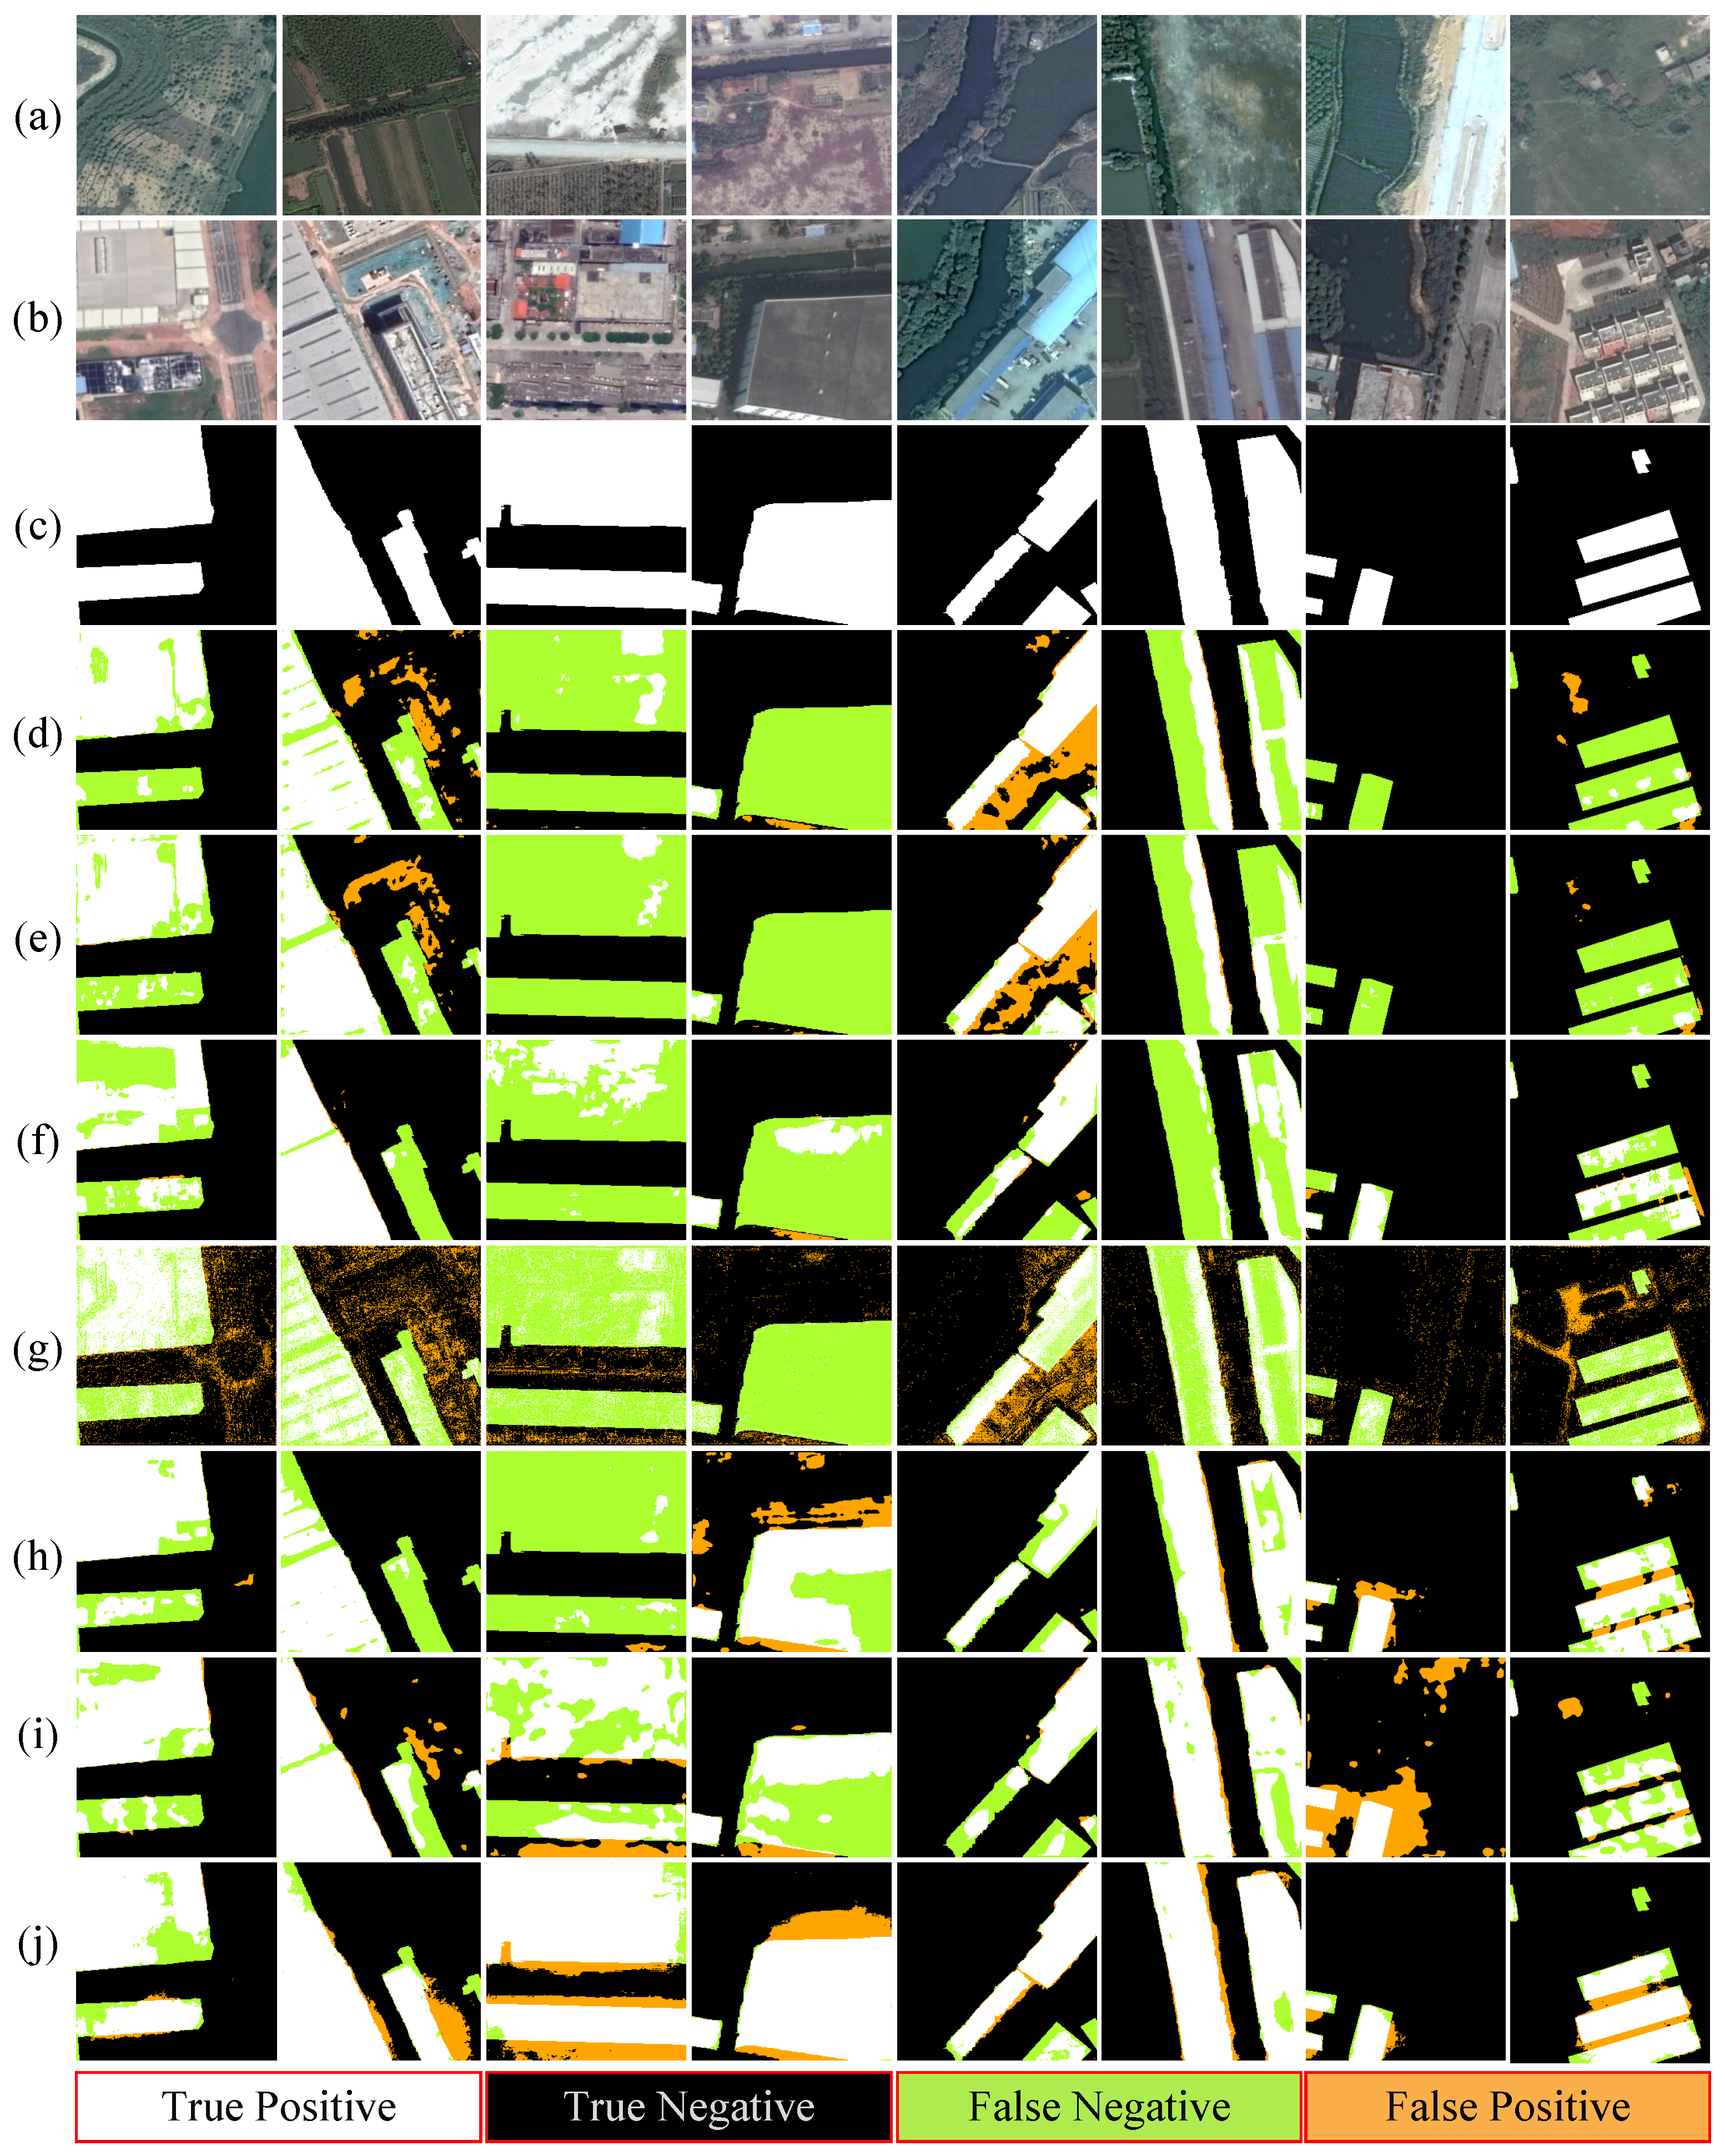
3.2.2. Results on Guangzhou Data Set
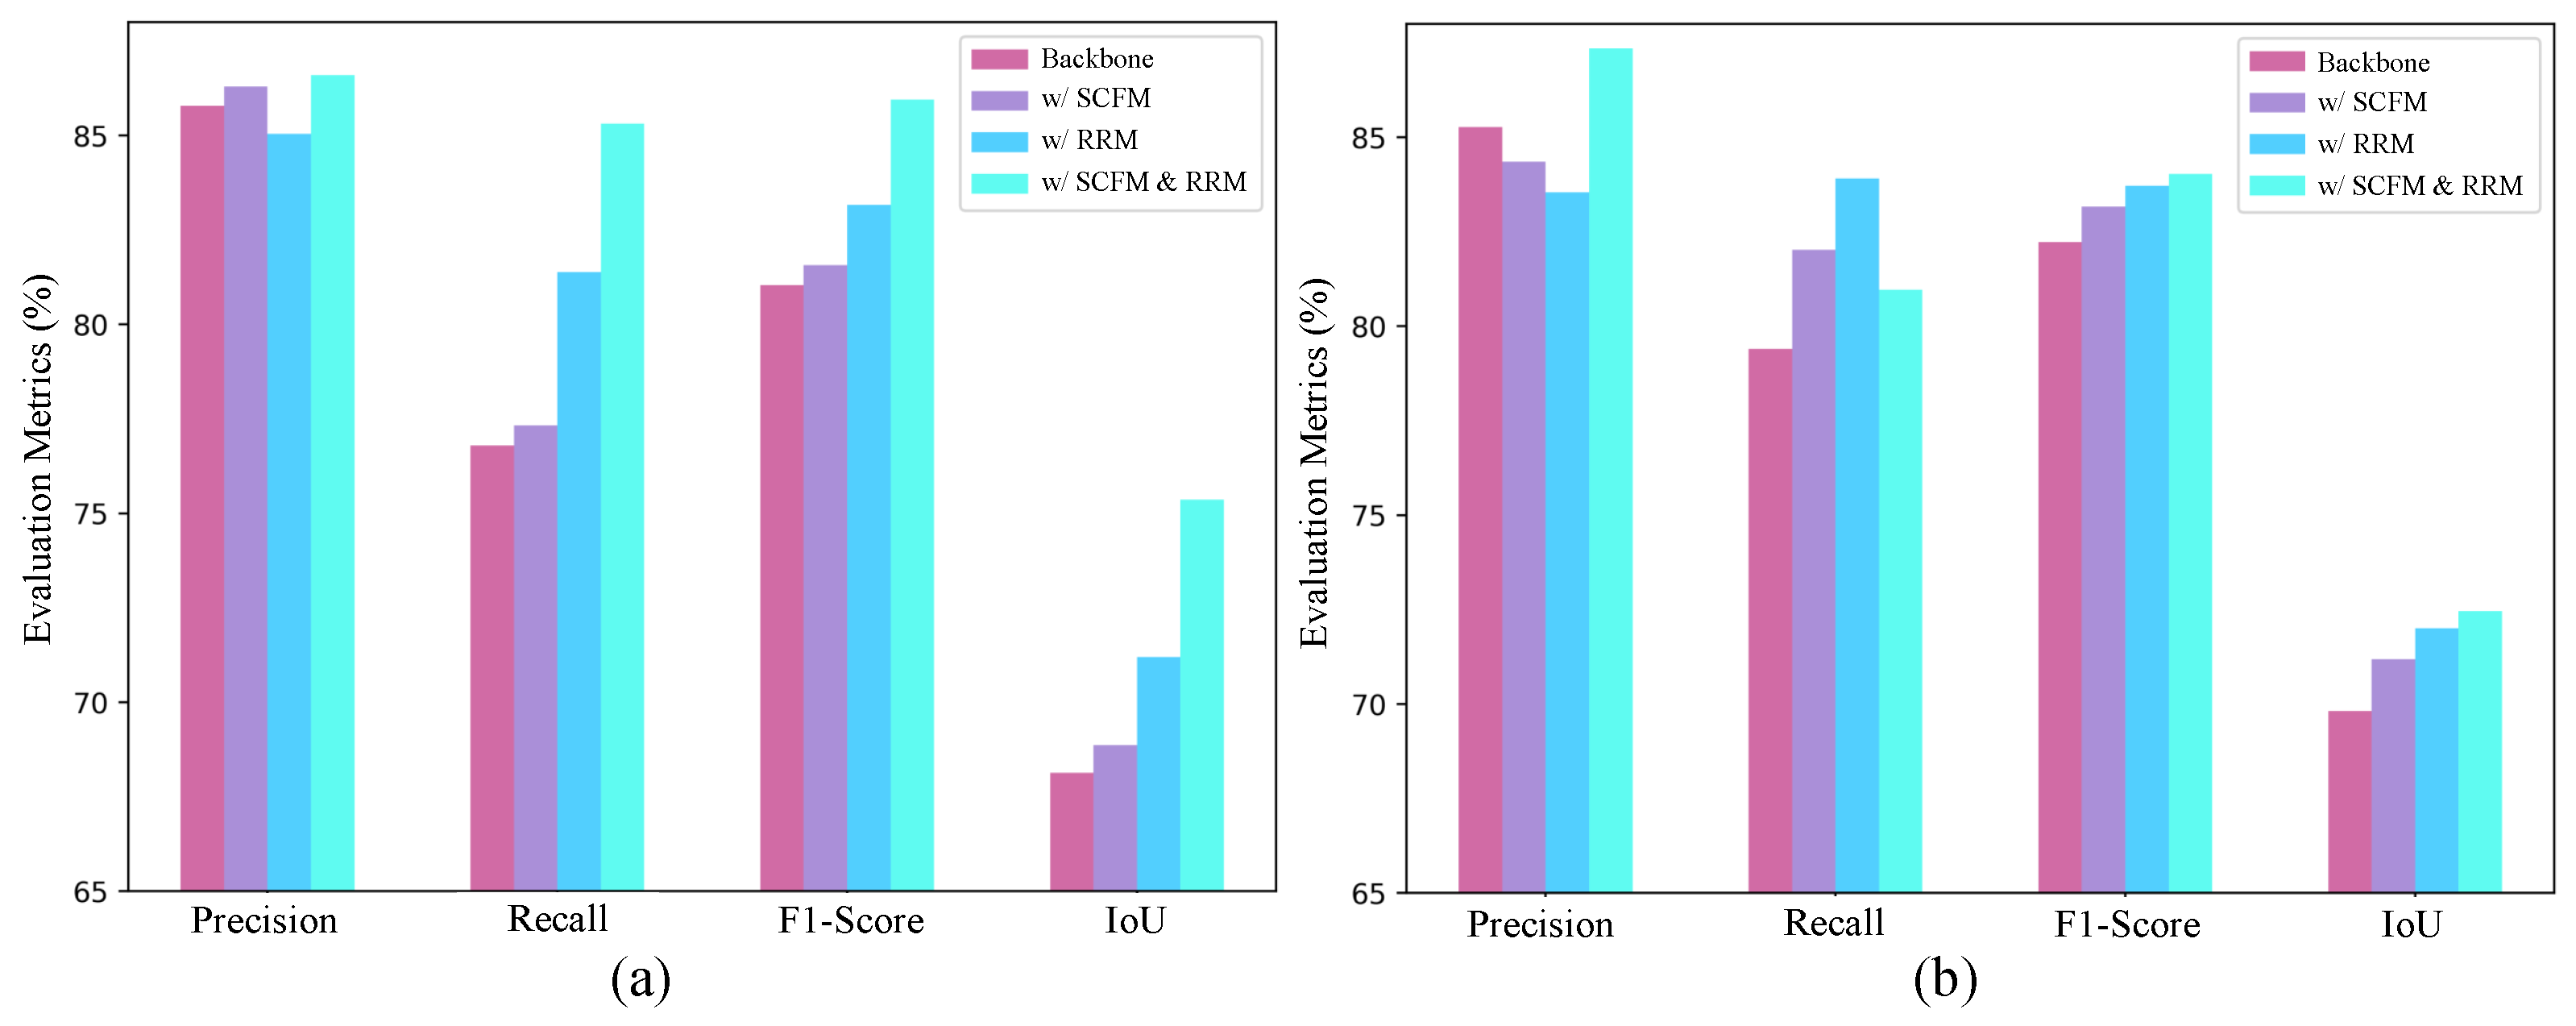
As shown in Figure 6b, the confusion matrix of the proposed SCFNet is obtained on the Guangzhou data set, which shows the overall accuracy. In addition, the quantitative experimental results on the Guangzhou data set are listed in Table 2. In the aspects of main evaluation metrics, i.e., F1 and IoU, the proposed SCFNet still has significant advantages compared to other benchmark methods, which are over 1%. In terms of precision and recall, the performance advantages of SCFNet are not that significant. However, the proposed SCFNet can have both higher precision and recall, which can be challenging for other methods, thus contributing to the best F1 of SCFNet. In contrast, although BIT achieves the highest precision, it fails to achieve a higher F1 and IoU, since BIT has a relatively low recall performance. Similar conclusions can be discovered from the visual results shown in Figure 8. For instance, the proposed method can obtain more complete and accurate building annotations in the sixth pair of visual results over the Guangzhou data set. Generally, these visual results indicate that RRM helps the proposed method achieve a more complete annotation of changed land cover.

3.3. Ablation Study

In our SCFNet, three modules, including backbone in SLGPNet [49], SCFM, and RRM, are integrated into the SCFNet for land cover change detection on the Wenzhou data set. Previous experimental results show that our SCFNet can achieve a convincing performance. In this section, we further implemented the ablation experiment on Wenzhou and Guangzhou data sets to analyze each component’s effect in the SCFNet.
To achieve this, the quantitative results of networks with different module combinations were obtained for both data sets, as listed in Table 3 and Table 4. For the experimental results in the Wenzhou data set, the accuracy obtained with the backbone alone is obviously insufficient. When the SCFM and the backbone were combined, the four evaluation indicators (precision, recall, F1-score, and IoU) were improved by 0.50%, 0.53%, 0.53%, and 0.74%, respectively. Here, SCFM only replaced the position attention module in the backbone, so the improvement obtained is slight. Similarly, the performance of combining the RRM and the backbone is more prominent. For example, compared with using backbone alone, the F1-score and IoU metrics were improved by 2.13% and 3.07%, respectively; compared with the network combining the backbone and the SCFM, the F1-Score and IoU metrics obtained 1.60% and 2.33% improvements, respectively. This is because the RRM can employ a larger receptive field to refine the initial change detection maps. According to this, the introduction of RRM can significantly improve the accuracy. Finally, when these three modules were deployed simultaneously, our SCFNet could achieve the best performance on four evaluation metrics. Notably, precision, recall and F1-score are higher than 85% after the full SCFNet is implemented for the Wenzhou data set.
The experimental results on the Guangzhou data set report similar conclusions. The SCFM and RRM successfully improved the F1-score by 0.94% and 1.49% for the bare backbone in this data set, respectively. When used together, the complete SCFNet achieves the best F1-score in the Guangzhou data set. In addition, for a more intuitive comparison, Figure 9 presents the performance of different model combinations on different evaluation metrics. Figure 9 shows that our SCFNet combined with SCFM and RRM can effectively improve recall without reducing precision in the Wenzhou data set. To sum up, our SCFNet consists of these two modules in the existing network that can further improve the change detection performance.

4. Discussion

To further discover the relation between the computational cost and performance for recent DL-based methods, we count the FLOPs and parameters (Params) of each model in Table 5. Basically, a model with higher computational costs usually leads to better performance. Although the proposed method has a higher computational cost, it achieves the best performance. Moreover, our SCFNet outperforms SLGPNet with a lower computational cost. Based on the computational cost and related performance shown in Table 5, we systematically discuss the performance of each benchmark method as follows:
(1)
FC-EF [44] and FC-Siam-Conc [44]: FC-EF [44] can achieve a better performance than FC-Siam-Conc on the Wenzhou data set, while FC-Siam-Conc [44] has higher accuracy than FC-EF [44] on the Guangzhou data set. Overall, these two models performed poorly on both the Wenzhou and Guangzhou data sets. This is because the capacity of these two models is too small to handle complex data sets.
(2)
SiUnet [45]: it achieves the second- and third-best performance on Wenzhou and Guangzhou data sets, respectively. The SiUnet [45] exploits the down-sampled counterpart of the original bi-temporal images as a branch of the Siamese network, enhancing the network’s ability to represent multi-scale features. Hence, SiUnet [45] is a simple and effective model for the Wenzhou and Guangzhou data sets compared with other benchmark methods. This strategy is worthy of follow-up research.
(3)
SNUNet [55]: Surprisingly, SNUNet [55] did not perform satisfactorily on the both Wenzhou and Guangzhou data sets. Although SNUNet [55] combines the Siamese network and NestedUNet to reduce the loss of localization, NestedUNet may introduce too many shallow features leading to incorrect semantic discrimination for facing the complex scene.
(4)
SLGPNet [49]: SLGPNet [49] can reach a relatively stable accuracy on both the Wenzhou and Guangzhou data sets. This model is composed of a local–global pyramid feature extractor and a change detection head. The local–global pyramid feature extractor combines the position attention module, local feature pyramid, and global spatial pyramid, which has a robust multi-scale feature representation ability for change detection. However, the accuracy of this method still has some limitations for practical applications. The reason may be that the change detection head of this method contains only a few parameters, which makes the feature fusion of the final bi-temporal image insufficient for change detection.
(5)
BIT [56]: Furthermore, BIT [56] is a SOTA transformer-based network for change detection. This model acquires the third-best and second-best accuracy on the Wenzhou and Guangzhou data sets, respectively. That is because BIT [56] can employ a transformer encoder to build the context of semantic tokens and exploit a Siamese transformer decoder to project semantic tokens into the pixel space for effective feature extraction. Nonetheless, BIT [56] is difficult to balance between P and R. This limits the overall performance of BIT [56].
(6)
Proposed SCFNet: Unlike the above methods, our SCFNet achieves the best performance on the both Wenzhou and Guangzhou data sets. Moreover, our SCFNet obtains precision and recall balanced accuracy on the Wenzhou data set, and its precision, recall, and F1-Score are higher than 85%. The core reasons include two aspects. First, the introduction of SCFM can improve the feature extraction capability of complex scenes. Second, the RRM deployed in SCFNet is able to refine the initial change results to obtain more accurate and complete change detection maps. Based on the above discussion, there are still some limitations in extending the existing methods to practical applications, such as the Wenzhou data set.
According to the performance of our method, the comprehensive utilization of existing methods is an effective solution to promote DL-based change detection toward practical application. We hope this discussion provides a meaningful reference for subsequent related methods and applications.

5. Conclusions

This paper conducted an application-oriented study over the expanding built-up areas of Wenzhou City, China. A large scale of high-resolution bi-temporal remote sensing data was captured and annotated to obtain the land cover change information of Wenzhou between 2017 and 2021. With the help of these data, a new deep learning-based approach, SCFNet, was proposed for automatic land cover change detection over the study area. It employs the local–global pyramid encoder and decoder to build the backbone, and another two modules, i.e., SCFM and RRM, to further improve the performance. The SCFM combines the self-attention mechanism with convolutional layers to acquire a better feature representation. Furthermore, RRM employs dilated convolutions with different dilation rates to obtain more complete predictions over changed areas. In addition, a widely used open change detection data set, Guangzhou data set, and several current SOTA change detection methods were utilized to test the proposed method further. Furthermore, extensive experimental results indicated that SCFNet can outperform other benchmark methods in both large-scale data sets, i.e., the Wenzhou and Guangzhou data sets. As for future work, self-supervised and semi-supervised learning techniques can be utilized in our method to reduce the dependence on large-scale annotated data, which can lower the cost of collecting and constructing data.

Author Contributions

Conceptualization, Y.Z. and G.J.; methodology, Y.Z., G.J., T.L. and H.Z.; validation, T.L., H.Z. and M.Z.; investigation, Y.Z., G.J. and M.Z.; writing—original draft preparation, T.L. and H.Z.; writing—review and editing, Y.Z., G.J., J.L., S.L. and L.L. All authors have read and agreed to the published version of the manuscript.

Funding

This work was supported by the Natural Science Foundation of Shaanxi Province in China under Grant No. 2021JQ-209 and No. 2020JQ-313; the Fundamental Research Funds for the Central Universities, Grant No. JB210210 and No. XJS210216.

Data Availability Statement

Not applicable.

Conflicts of Interest

The authors declare no conflict of interest.

References

  1. Yu, Z.; Yao, Y.; Yang, G.; Wang, X.; Vejre, H. Spatiotemporal patterns and characteristics of remotely sensed region heat islands during the rapid urbanization (1995–2015) of Southern China. Sci. Total. Environ. 2019, 674, 242–254. [Google Scholar] [CrossRef] [PubMed]
  2. Liu, F.; Zhang, X.; Murayama, Y.; Morimoto, T. Impacts of land cover/use on the urban thermal environment: A comparative study of 10 megacities in China. Remote Sens. 2020, 12, 307. [Google Scholar] [CrossRef] [Green Version]
  3. Ridd, M.K.; Liu, J. A comparison of four algorithms for change detection in an urban environment. Remote Sens. Environ. 1998, 63, 95–100. [Google Scholar] [CrossRef]
  4. Wang, N.; Li, W.; Tao, R.; Du, Q. Graph-based block-level urban change detection using Sentinel-2 time series. Remote Sens. Environ. 2022, 274, 112993. [Google Scholar] [CrossRef]
  5. Ban, Y.; Yousif, O.A. Multitemporal spaceborne SAR data for urban change detection in China. IEEE J. Sel. Top. Appl. Earth Obs. Remote Sens. 2012, 5, 1087–1094. [Google Scholar] [CrossRef]
  6. Lv, Z.; Wang, F.; Cui, G.; Benediktsson, J.A.; Lei, T.; Sun, W. Spatial-Spectral Attention Network Guided With Change Magnitude Image for Land Cover Change Detection Using Remote Sensing Images. IEEE Trans. Geosci. Remote Sens. 2022, 60, 1–12. [Google Scholar] [CrossRef]
  7. Sun, Y.; Lei, L.; Guan, D.; Li, M.; Kuang, G. Sparse-constrained adaptive structure consistency-based unsupervised image regression for heterogeneous remote-sensing change detection. IEEE Trans. Geosci. Remote Sens. 2021, 60, 1–14. [Google Scholar] [CrossRef]
  8. Lv, Z.; Liu, T.; Benediktsson, J.A.; Falco, N. Land cover change detection techniques: Very-high-resolution optical images: A review. IEEE Geosci. Remote Sens. Mag. 2021, 10, 44–63. [Google Scholar] [CrossRef]
  9. Viana, C.M.; Girão, I.; Rocha, J. Long-term satellite image time-series for land use/land cover change detection using refined open source data in a rural region. Remote Sens. 2019, 11, 1104. [Google Scholar] [CrossRef] [Green Version]
  10. Sun, Y.; Lei, L.; Li, X.; Sun, H.; Kuang, G. Nonlocal patch similarity based heterogeneous remote sensing change detection. Pattern Recognit. 2021, 109, 107598. [Google Scholar] [CrossRef]
  11. Bruzzone, L.; Prieto, D.F. Automatic analysis of the difference image for unsupervised change detection. IEEE Trans. Geosci. Remote Sens. 2000, 38, 1171–1182. [Google Scholar] [CrossRef] [Green Version]
  12. Lv, Z.; Liu, T.; Zhang, P.; Atli Benediktsson, J.; Chen, Y. Land cover change detection based on adaptive contextual information using bi-temporal remote sensing images. Remote Sens. 2018, 10, 901. [Google Scholar] [CrossRef] [Green Version]
  13. Lu, D.; Mausel, P.; Brondizio, E.; Moran, E. Change detection techniques. Int. J. Remote Sens. 2004, 25, 2365–2401. [Google Scholar] [CrossRef]
  14. Ban, Y.; Yousif, O. Change detection techniques: A review. Multitemporal Remote Sens. 2016, 19–43. [Google Scholar]
  15. Liu, S.; Du, Q.; Tong, X.; Samat, A.; Bruzzone, L.; Bovolo, F. Multiscale morphological compressed change vector analysis for unsupervised multiple change detection. IEEE J. Sel. Top. Appl. Earth Obs. Remote Sens. 2017, 10, 4124–4137. [Google Scholar] [CrossRef]
  16. Zhuang, H.; Deng, K.; Fan, H.; Yu, M. Strategies combining spectral angle mapper and change vector analysis to unsupervised change detection in multispectral images. IEEE Geosci. Remote Sens. Lett. 2016, 13, 681–685. [Google Scholar] [CrossRef]
  17. ZhiYong, L.; Wang, F.; Xie, L.; Sun, W.; Falco, N.; Benediktsson, J.A.; You, Z. Diagnostic analysis on change vector analysis methods for LCCD using remote sensing images. IEEE J. Sel. Top. Appl. Earth Obs. Remote Sens. 2021, 14, 10199–10212. [Google Scholar] [CrossRef]
  18. Otsu, N. A threshold selection method from gray-level histograms. IEEE Trans. Syst. Man. Cybern. 1979, 9, 62–66. [Google Scholar] [CrossRef] [Green Version]
  19. Celik, T. Unsupervised change detection in satellite images using principal component analysis and k-means clustering. IEEE Geosci. Remote Sens. Lett. 2009, 6, 772–776. [Google Scholar] [CrossRef]
  20. Lv, Z.; Liu, T.; Shi, C.; Benediktsson, J.A.; Du, H. Novel land cover change detection method based on K-means clustering and adaptive majority voting using bitemporal remote sensing images. IEEE Access 2019, 7, 34425–34437. [Google Scholar] [CrossRef]
  21. Shao, P.; Shi, W.; He, P.; Hao, M.; Zhang, X. Novel approach to unsupervised change detection based on a robust semi-supervised FCM clustering algorithm. Remote Sens. 2016, 8, 264. [Google Scholar] [CrossRef]
  22. Bovolo, F.; Bruzzone, L.; Marconcini, M. A novel approach to unsupervised change detection based on a semisupervised SVM and a similarity measure. IEEE Trans. Geosci. Remote Sens. 2008, 46, 2070–2082. [Google Scholar] [CrossRef] [Green Version]
  23. Lv, Z.; Wang, F.; Sun, W.; You, Z.; Falco, N.; Benediktsson, J.A. Landslide Inventory Mapping on VHR Images via Adaptive Region Shape Similarity. IEEE Trans. Geosci. Remote Sens. 2022, 60, 1–11. [Google Scholar] [CrossRef]
  24. Xiaolu, S.; Bo, C. Change detection using change vector analysis from Landsat TM images in Wuhan. Procedia Environ. Sci. 2011, 11, 238–244. [Google Scholar] [CrossRef] [Green Version]
  25. Singh, P.; Khanduri, K. Land use and land cover change detection through remote sensing & GIS technology: Case study of Pathankot and Dhar Kalan Tehsils, Punjab. Int. J. Geomat. Geosci. 2011, 1, 839–846. [Google Scholar]
  26. Singh, S.; Sood, V.; Taloor, A.K.; Prashar, S.; Kaur, R. Qualitative and quantitative analysis of topographically derived CVA algorithms using MODIS and Landsat-8 data over Western Himalayas, India. Quat. Int. 2021, 575, 85–95. [Google Scholar] [CrossRef]
  27. Nemmour, H.; Chibani, Y. Multiple support vector machines for land cover change detection: An application for mapping urban extensions. ISPRS J. Photogramm. Remote Sens. 2006, 61, 125–133. [Google Scholar] [CrossRef]
  28. Lv, Z.; Liu, T.; Shi, C.; Benediktsson, J.A. Local histogram-based analysis for detecting land cover change using VHR remote sensing images. IEEE Geosci. Remote Sens. Lett. 2020, 18, 1284–1287. [Google Scholar] [CrossRef]
  29. Liu, T.; Gong, M.; Jiang, F.; Zhang, Y.; Li, H. Landslide Inventory Mapping Method Based on Adaptive Histogram-Mean Distance with Bitemporal VHR Aerial Images. IEEE Geosci. Remote Sens. Lett. 2021, 19, 1–5. [Google Scholar] [CrossRef]
  30. Wen, D.; Huang, X.; Bovolo, F.; Li, J.; Ke, X.; Zhang, A.; Benediktsson, J.A. Change detection from very-high-spatial-resolution optical remote sensing images: Methods, applications, and future directions. IEEE Geosci. Remote Sens. Mag. 2021, 9, 68–101. [Google Scholar] [CrossRef]
  31. Shafique, A.; Cao, G.; Khan, Z.; Asad, M.; Aslam, M. Deep learning-based change detection in remote sensing images: A review. Remote Sens. 2022, 14, 871. [Google Scholar] [CrossRef]
  32. Zhu, X.X.; Tuia, D.; Mou, L.; Xia, G.S.; Zhang, L.; Xu, F.; Fraundorfer, F. Deep learning in remote sensing: A comprehensive review and list of resources. IEEE Geosci. Remote Sens. Mag. 2017, 5, 8–36. [Google Scholar] [CrossRef]
  33. Wu, Y.; Li, J.; Yuan, Y.; Qin, A.K.; Miao, Q.G.; Gong, M.G. Commonality Autoencoder: Learning Common Features for Change Detection from Heterogeneous Images. IEEE Trans. Neural Netw. Learn. Syst. 2022, 33, 4257–4270. [Google Scholar] [CrossRef] [PubMed]
  34. Gong, M.; Jiang, F.; Qin, A.K.; Liu, T.; Zhan, T.; Lu, D.; Zheng, H.; Zhang, M. A Spectral and Spatial Attention Network for Change Detection in Hyperspectral Images. IEEE Trans. Geosci. Remote Sens. 2021, 60, 1–14. [Google Scholar] [CrossRef]
  35. Lv, Z.; Li, G.; Jin, Z.; Benediktsson, J.A.; Foody, G.M. Iterative training sample expansion to increase and balance the accuracy of land classification from VHR imagery. IEEE Trans. Geosci. Remote Sens. 2020, 59, 139–150. [Google Scholar] [CrossRef]
  36. Wu, Y.; Mu, G.; Qin, C.; Miao, Q.; Ma, W.; Zhang, X. Semi-supervised hyperspectral image classification via spatial-regulated self-training. Remote Sens. 2020, 12, 159. [Google Scholar] [CrossRef] [Green Version]
  37. Gong, M.; Li, J.; Zhang, Y.; Wu, Y.; Zhang, M. Two-Path Aggregation Attention Network with Quad-Patch Data Augmentation for Few-Shot Scene Classification. IEEE Trans. Geosci. Remote Sens. 2022, 60, 1–16. [Google Scholar] [CrossRef]
  38. Zhang, J.; Lin, S.; Ding, L.; Bruzzone, L. Multi-scale context aggregation for semantic segmentation of remote sensing images. Remote Sens. 2020, 12, 701. [Google Scholar] [CrossRef] [Green Version]
  39. Li, K.; Wan, G.; Cheng, G.; Meng, L.; Han, J. Object detection in optical remote sensing images: A survey and a new benchmark. ISPRS J. Photogramm. Remote Sens. 2020, 159, 296–307. [Google Scholar] [CrossRef]
  40. Jiang, H.; Peng, M.; Zhong, Y.; Xie, H.; Hao, Z.; Lin, J.; Ma, X.; Hu, X. A Survey on Deep Learning-Based Change Detection from High-Resolution Remote Sensing Images. Remote Sens. 2022, 14, 1552. [Google Scholar] [CrossRef]
  41. Shi, W.; Zhang, M.; Zhang, R.; Chen, S.; Zhan, Z. Change detection based on artificial intelligence: State-of-the-art and challenges. Remote Sens. 2020, 12, 1688. [Google Scholar] [CrossRef]
  42. Zhao, J.; Gong, M.; Liu, J.; Jiao, L. Deep learning to classify difference image for image change detection. In Proceedings of the 2014 International Joint Conference on Neural Networks (IJCNN), Beijing, China, 6–11 July 2014; pp. 411–417. [Google Scholar]
  43. Lei, T.; Zhang, Y.; Lv, Z.; Li, S.; Liu, S.; Nandi, A.K. Landslide inventory mapping from bitemporal images using deep convolutional neural networks. IEEE Geosci. Remote Sens. Lett. 2019, 16, 982–986. [Google Scholar] [CrossRef]
  44. Daudt, R.C.; Le Saux, B.; Boulch, A. Fully convolutional siamese networks for change detection. In Proceedings of the 2018 25th IEEE International Conference on Image Processing (ICIP), Athens, Greece, 7–10 October 2018; pp. 4063–4067. [Google Scholar]
  45. Ji, S.; Wei, S.; Lu, M. Fully convolutional networks for multisource building extraction from an open aerial and satellite imagery data set. IEEE Trans. Geosci. Remote Sens. 2018, 57, 574–586. [Google Scholar] [CrossRef]
  46. Chen, H.; Shi, Z. A spatial-temporal attention-based method and a new dataset for remote sensing image change detection. Remote Sens. 2020, 12, 1662. [Google Scholar] [CrossRef]
  47. Shen, L.; Lu, Y.; Chen, H.; Wei, H.; Xie, D.; Yue, J.; Chen, R.; Lv, S.; Jiang, B. S2Looking: A satellite side-looking dataset for building change detection. Remote Sens. 2021, 13, 5094. [Google Scholar] [CrossRef]
  48. Song, K.; Jiang, J. AGCDetNet: An attention-guided network for building change detection in high-resolution remote sensing images. IEEE J. Sel. Top. Appl. Earth Obs. Remote Sens. 2021, 14, 4816–4831. [Google Scholar] [CrossRef]
  49. Liu, T.; Gong, M.; Lu, D.; Zhang, Q.; Zheng, H.; Jiang, F.; Zhang, M. Building Change Detection for VHR Remote Sensing Images via Local–Global Pyramid Network and Cross-Task Transfer Learning Strategy. IEEE Trans. Geosci. Remote Sens. 2022, 60, 1–17. [Google Scholar] [CrossRef]
  50. Zhan, Y.; Fu, K.; Yan, M.; Sun, X.; Wang, H.; Qiu, X. Change detection based on deep siamese convolutional network for optical aerial images. IEEE Geosci. Remote Sens. Lett. 2017, 14, 1845–1849. [Google Scholar] [CrossRef]
  51. Yang, L.; Chen, Y.; Song, S.; Li, F.; Huang, G. Deep Siamese networks based change detection with remote sensing images. Remote Sens. 2021, 13, 3394. [Google Scholar] [CrossRef]
  52. Zhang, C.; Yue, P.; Tapete, D.; Jiang, L.; Shangguan, B.; Huang, L.; Liu, G. A deeply supervised image fusion network for change detection in high resolution bi-temporal remote sensing images. ISPRS J. Photogramm. Remote Sens. 2020, 166, 183–200. [Google Scholar] [CrossRef]
  53. Peng, D.; Bruzzone, L.; Zhang, Y.; Guan, H.; Ding, H.; Huang, X. SemiCDNet: A semisupervised convolutional neural network for change detection in high resolution remote-sensing images. IEEE Trans. Geosci. Remote Sens. 2020, 59, 5891–5906. [Google Scholar] [CrossRef]
  54. Zheng, H.; Gong, M.; Liu, T.; Jiang, F.; Zhan, T.; Lu, D.; Zhang, M. HFA-Net: High frequency attention siamese network for building change detection in VHR remote sensing images. Pattern Recognit. 2022, 129, 108717. [Google Scholar] [CrossRef]
  55. Fang, S.; Li, K.; Shao, J.; Li, Z. SNUNet-CD: A Densely Connected Siamese Network for Change Detection of VHR Images. IEEE Geosci. Remote Sens. Lett. 2022, 19, 1–5. [Google Scholar] [CrossRef]
  56. Chen, H.; Qi, Z.; Shi, Z. Remote sensing image change detection with transformers. IEEE Trans. Geosci. Remote Sens. 2021, 60, 1–14. [Google Scholar] [CrossRef]
  57. Zheng, Z.; Zhong, Y.; Tian, S.; Ma, A.; Zhang, L. ChangeMask: Deep multi-task encoder-transformer-decoder architecture for semantic change detection. ISPRS J. Photogramm. Remote Sens. 2022, 183, 228–239. [Google Scholar] [CrossRef]
  58. Zhang, C.; Wang, L.; Cheng, S.; Li, Y. SwinSUNet: Pure Transformer Network for Remote Sensing Image Change Detection. IEEE Trans. Geosci. Remote Sens. 2022, 60, 1–13. [Google Scholar] [CrossRef]
  59. Zhou, S.; Dong, Z.; Wang, G. Machine-Learning-Based Change Detection of Newly Constructed Areas from GF-2 Imagery in Nanjing, China. Remote Sens. 2022, 14, 2874. [Google Scholar] [CrossRef]
  60. Pan, X.; Ge, C.; Lu, R.; Song, S.; Chen, G.; Huang, Z.; Huang, G. On the integration of self-attention and convolution. In Proceedings of the IEEE/CVF Conference on Computer Vision and Pattern Recognition, Vancouver, BC, Canada, 19–22 June 2022; pp. 815–825. [Google Scholar]
  61. Shao, Z.; Tang, P.; Wang, Z.; Saleem, N.; Yam, S.; Sommai, C. BRRNet: A fully convolutional neural network for automatic building extraction from high-resolution remote sensing images. Remote Sens. 2020, 12, 1050. [Google Scholar] [CrossRef]
  62. Lebedev, M.; Vizilter, Y.V.; Vygolov, O.; Knyaz, V.; Rubis, A.Y. Change detection in remote sensing images using conditional adversarial networks. In Proceedings of the ISPRS TC II Mid-Term Symposium “Towards Photogrammetry 2020”, Riva del Garda, Italy, 4–7 June 2018; Volume 2. [Google Scholar]
Figure 1. The spatial location of the study area of Wenzhou City, China.
Remotesensing 14 05969 g001
Figure 2. Some representative examples of the Wenzhou data set. (a1,a2) T1-time image, (b1,b2) T2-time image, and (c1,c2) ground truth image. White: changed pixels; Black: unchanged pixels.
Remotesensing 14 05969 g002
Figure 3. A brief illustration for proposed SCFNet. The SCFM and RRM indicate the self-attention convolution fusion module (SCFM) and residual refinement module (RRM), respectively.
Remotesensing 14 05969 g003
Figure 4. A brief illustration of the employed SCFM.
Remotesensing 14 05969 g004
Figure 5. The structure of the RRM.
Remotesensing 14 05969 g005
Figure 6. The confusion matrices of the results of the proposed SCFNet on two data sets. (a) Wenzhou data set; and (b) Guangzhou data set.
Remotesensing 14 05969 g006
Figure 7. The results of the different methods on the Wenzhou data set: (a) T1-time image; (b) T2-time image; (c) ground truth image; (d) FC-EF [44]; (e) FC-Siam-Conc [44]; (f) SiUnet [45]; (g) SNUNet [55]; (h) SLGPNet [49]; (i) BIT [56]; and (j) proposed SCFNet.
Remotesensing 14 05969 g007
Figure 8. The results of different methods on Guangzhou data set: (a) T1-time image; (b) T2-time image; (c) ground truth image; (d) FC-EF [44]; (e) FC-Siam-Conc [44]; (f) SiUnet [45]; (g) SNUNet [55]; (h) SLGPNet [49]; (i) BIT [56]; and (j) proposed SCFNet.
Remotesensing 14 05969 g008
Figure 9. The performance comparison of the combination of different modules on different evaluation indicators for two data sets. (a) Wenzhou data set and (b) Guangzhou data set.
Remotesensing 14 05969 g009
Table 1. Quantitative comparison of different methods on the Wenzhou data set.
MethodsPrecision (%)Recall (%)F1-Score (%)IoU (%)
FC-EF [44]67.1456.2461.2144.10
FC-Siam-Conc [44]52.3953.1852.7935.85
SiUnet [45]84.4973.5878.6664.83
SNUNet [55]73.8361.3367.0050.38
SLGPNet [49]78.3975.8477.0962.72
BIT [56]80.8375.2777.9563.87
Proposed SCFNet86.6085.3185.9575.36
Table 2. Quantitative comparison of different methods on the Guangzhou data set.
MethodsPrecision (%)Recall (%)F1-Score (%)IoU (%)
FC-EF [44]77.6256.9765.7148.94
FC-Siam-Conc [44]83.0255.4266.4749.78
SiUnet [45]85.5473.4879.0565.36
SNUNet [55]49.1750.0049.5832.96
SLGPNet [49]85.2580.8883.0070.95
BIT [56]87.8671.8479.0565.36
Proposed SCFNet87.3580.9684.0372.46
Table 3. Quantitative evaluation of the combination of different modules on the Wenzhou data set.
BackboneSCFMRRMPrecision (%)Recall (%)F1-Score (%)IoU (%)
85.7976.8081.0468.13
86.2977.3381.5768.87
85.0481.3983.1771.20
86.6085.3185.9575.36
Table 4. Quantitative evaluation of the combination of different modules on the Guangzhou data set.
BackboneSCFMRRMPrecision (%)Recall (%)F1-Score (%)IoU (%)
85.2779.4082.2369.82
84.3582.0283.1771.19
83.5483.9183.7272.01
87.3580.9684.0372.46
Table 5. Quantitative comparison of the performance (in F1-Score) and computational costs of different models.
ModelsFLOPs (G)Params (M)Wenzhou (%)Guangzhou (%)
FC-EF [44]76.6821.5561.2165.71
FC-Siam-Conc [44]73.2324.6852.7966.47
SiUnet [45]185.0831.0578.6679.05
SNUNet [55]162.6012.0367.0049.58
SLGPNet [49]226.4970.9977.0983.00
BIT [56]17.543.5077.9579.05
Proposed SCFNet212.2372.8585.9584.03
Publisher’s Note: MDPI stays neutral with regard to jurisdictional claims in published maps and institutional affiliations.

