1. Introduction
Global snow cover is of great importance in the Earth’s energy balance, and is a critical source of fresh water for billions of people worldwide. With a longer than two-decade record of global snow cover extent (SCE) at 500 m and ~5 km resolution from the Moderate-resolution Imaging Spectroradiometer (MODIS), the dynamics of snow cover can be mapped at local to global scales. Spring snow cover is melting earlier in the Northern Hemisphere in general [
1], but the rate and intensity vary across the continent.
A great deal of global snow cover research has used the 190 km resolution 52-year SCE climate-data record (CDR) (SCE CDR) developed at the Rutgers University Global Snow Lab [
2,
3] using NOAA snow cover maps that began to be produced in 1966 [
4,
5]. However, the finer resolution snow maps developed from MODIS data provide detail that is not possible using the SCE CDR. Using the MODIS SCE records, regional differences and trends in changing SCE can be discerned.
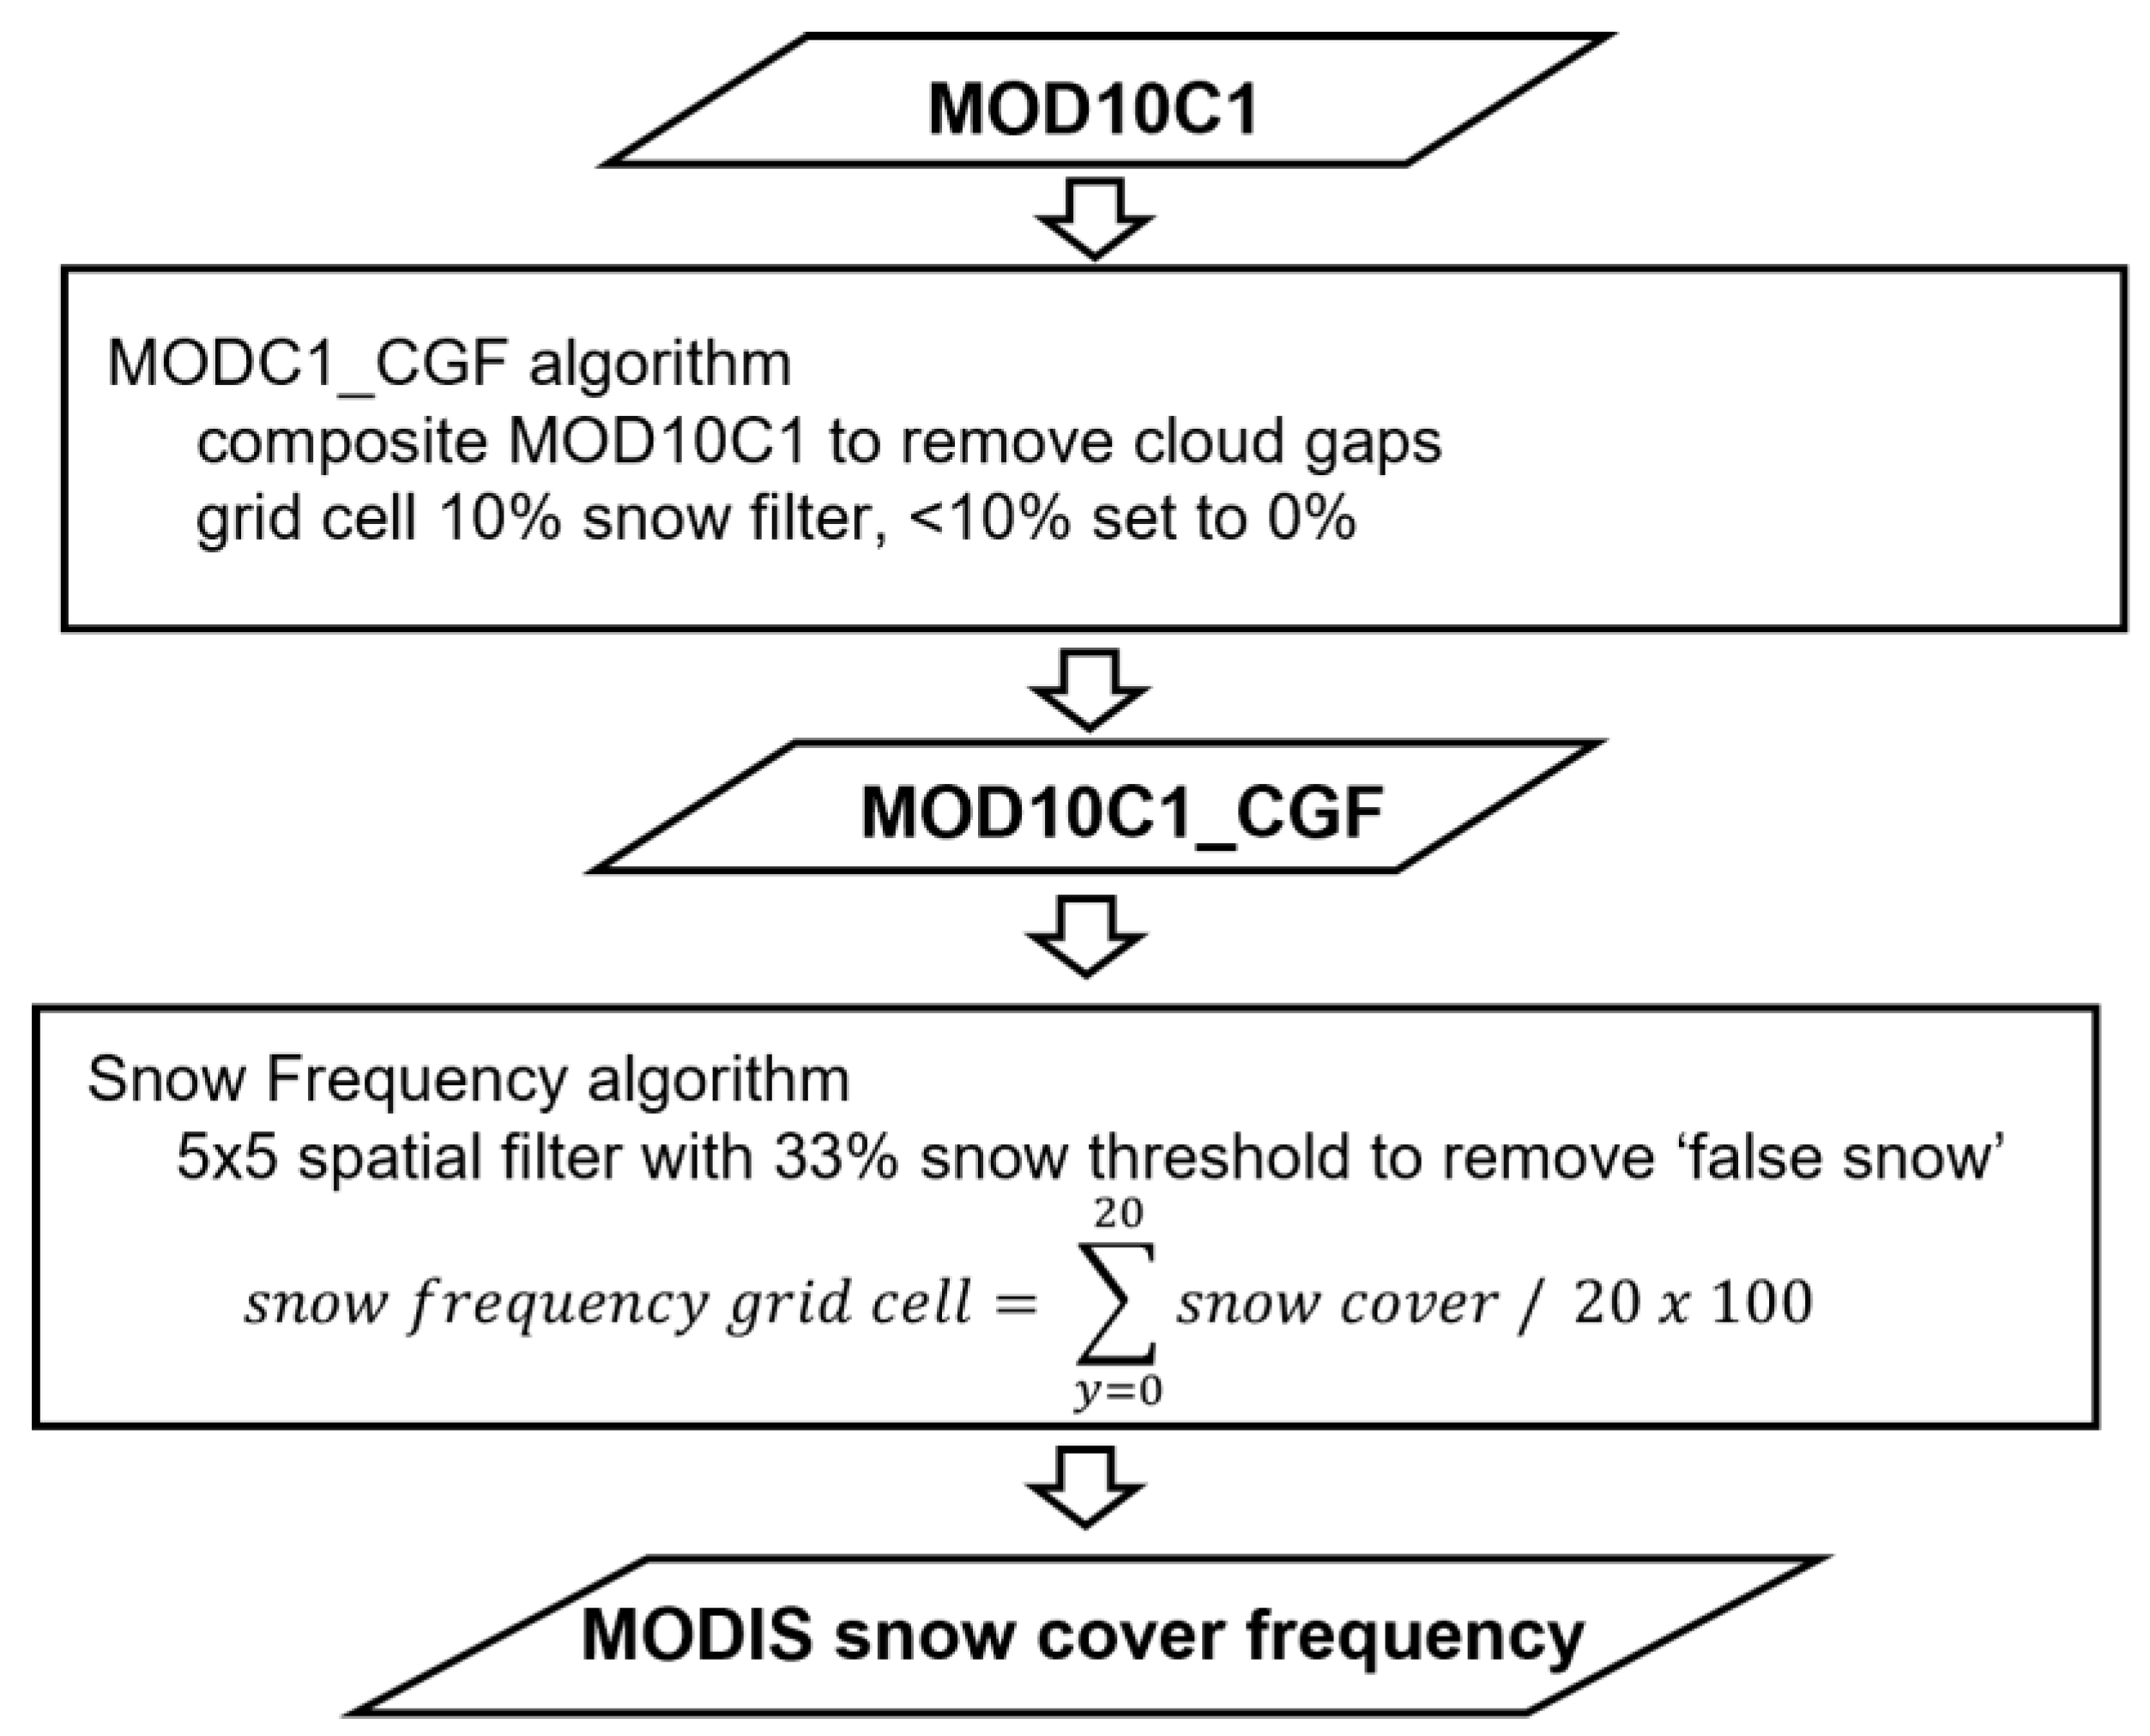
The purpose of this work is to describe the development of a snow frequency dataset using the ~5 km resolution MODIS product, MOD10C1, and to provide the product to the community for discussion, evaluation and/or possible future use. We describe one method for developing snow cover frequency maps and to provide examples of its use. The maps provide information on how frequently snow cover has been observed for every day of a year over the study period from 2001 to 2020 in the Northern Hemisphere.
Background
The start, duration, and end of the snow season are key metrics of importance for snow cover climatology studies, e.g., [
6,
7,
8,
9,
10,
11]. Those metrics provide information on seasonal snow cover where there is a continuous period of snow cover from the start to the end of a snow season. However, many regions of the world have a snow season defined by multiple episodes of snow cover and snowmelt, producing ephemeral snow cover, which is of particular importance in many mid-latitude areas. Ephemeral snow cover is of critical importance economically for recreation and as a nuisance and hazard (e.g., lake effect snow events).
Snow cover frequency can be described as the number of days of snow cover in a location over some time period, for example a month, season(s) or year(s). Snow cover frequency may be computed as the number of days that snow is observed divided by the number of valid observations over a time period of interest e.g., [
7,
8,
12,
13,
14,
15,
16]. Snow cover frequency is reported as the percentage of days in a time period, ranging from 0% no snow cover days to 100% all days of snow cover in the period of interest. Snow cover frequency provides information regarding the spatiotemporal variation of snow cover for different periods of interest, e.g., seasons or years [
7,
12,
16].
3. Results
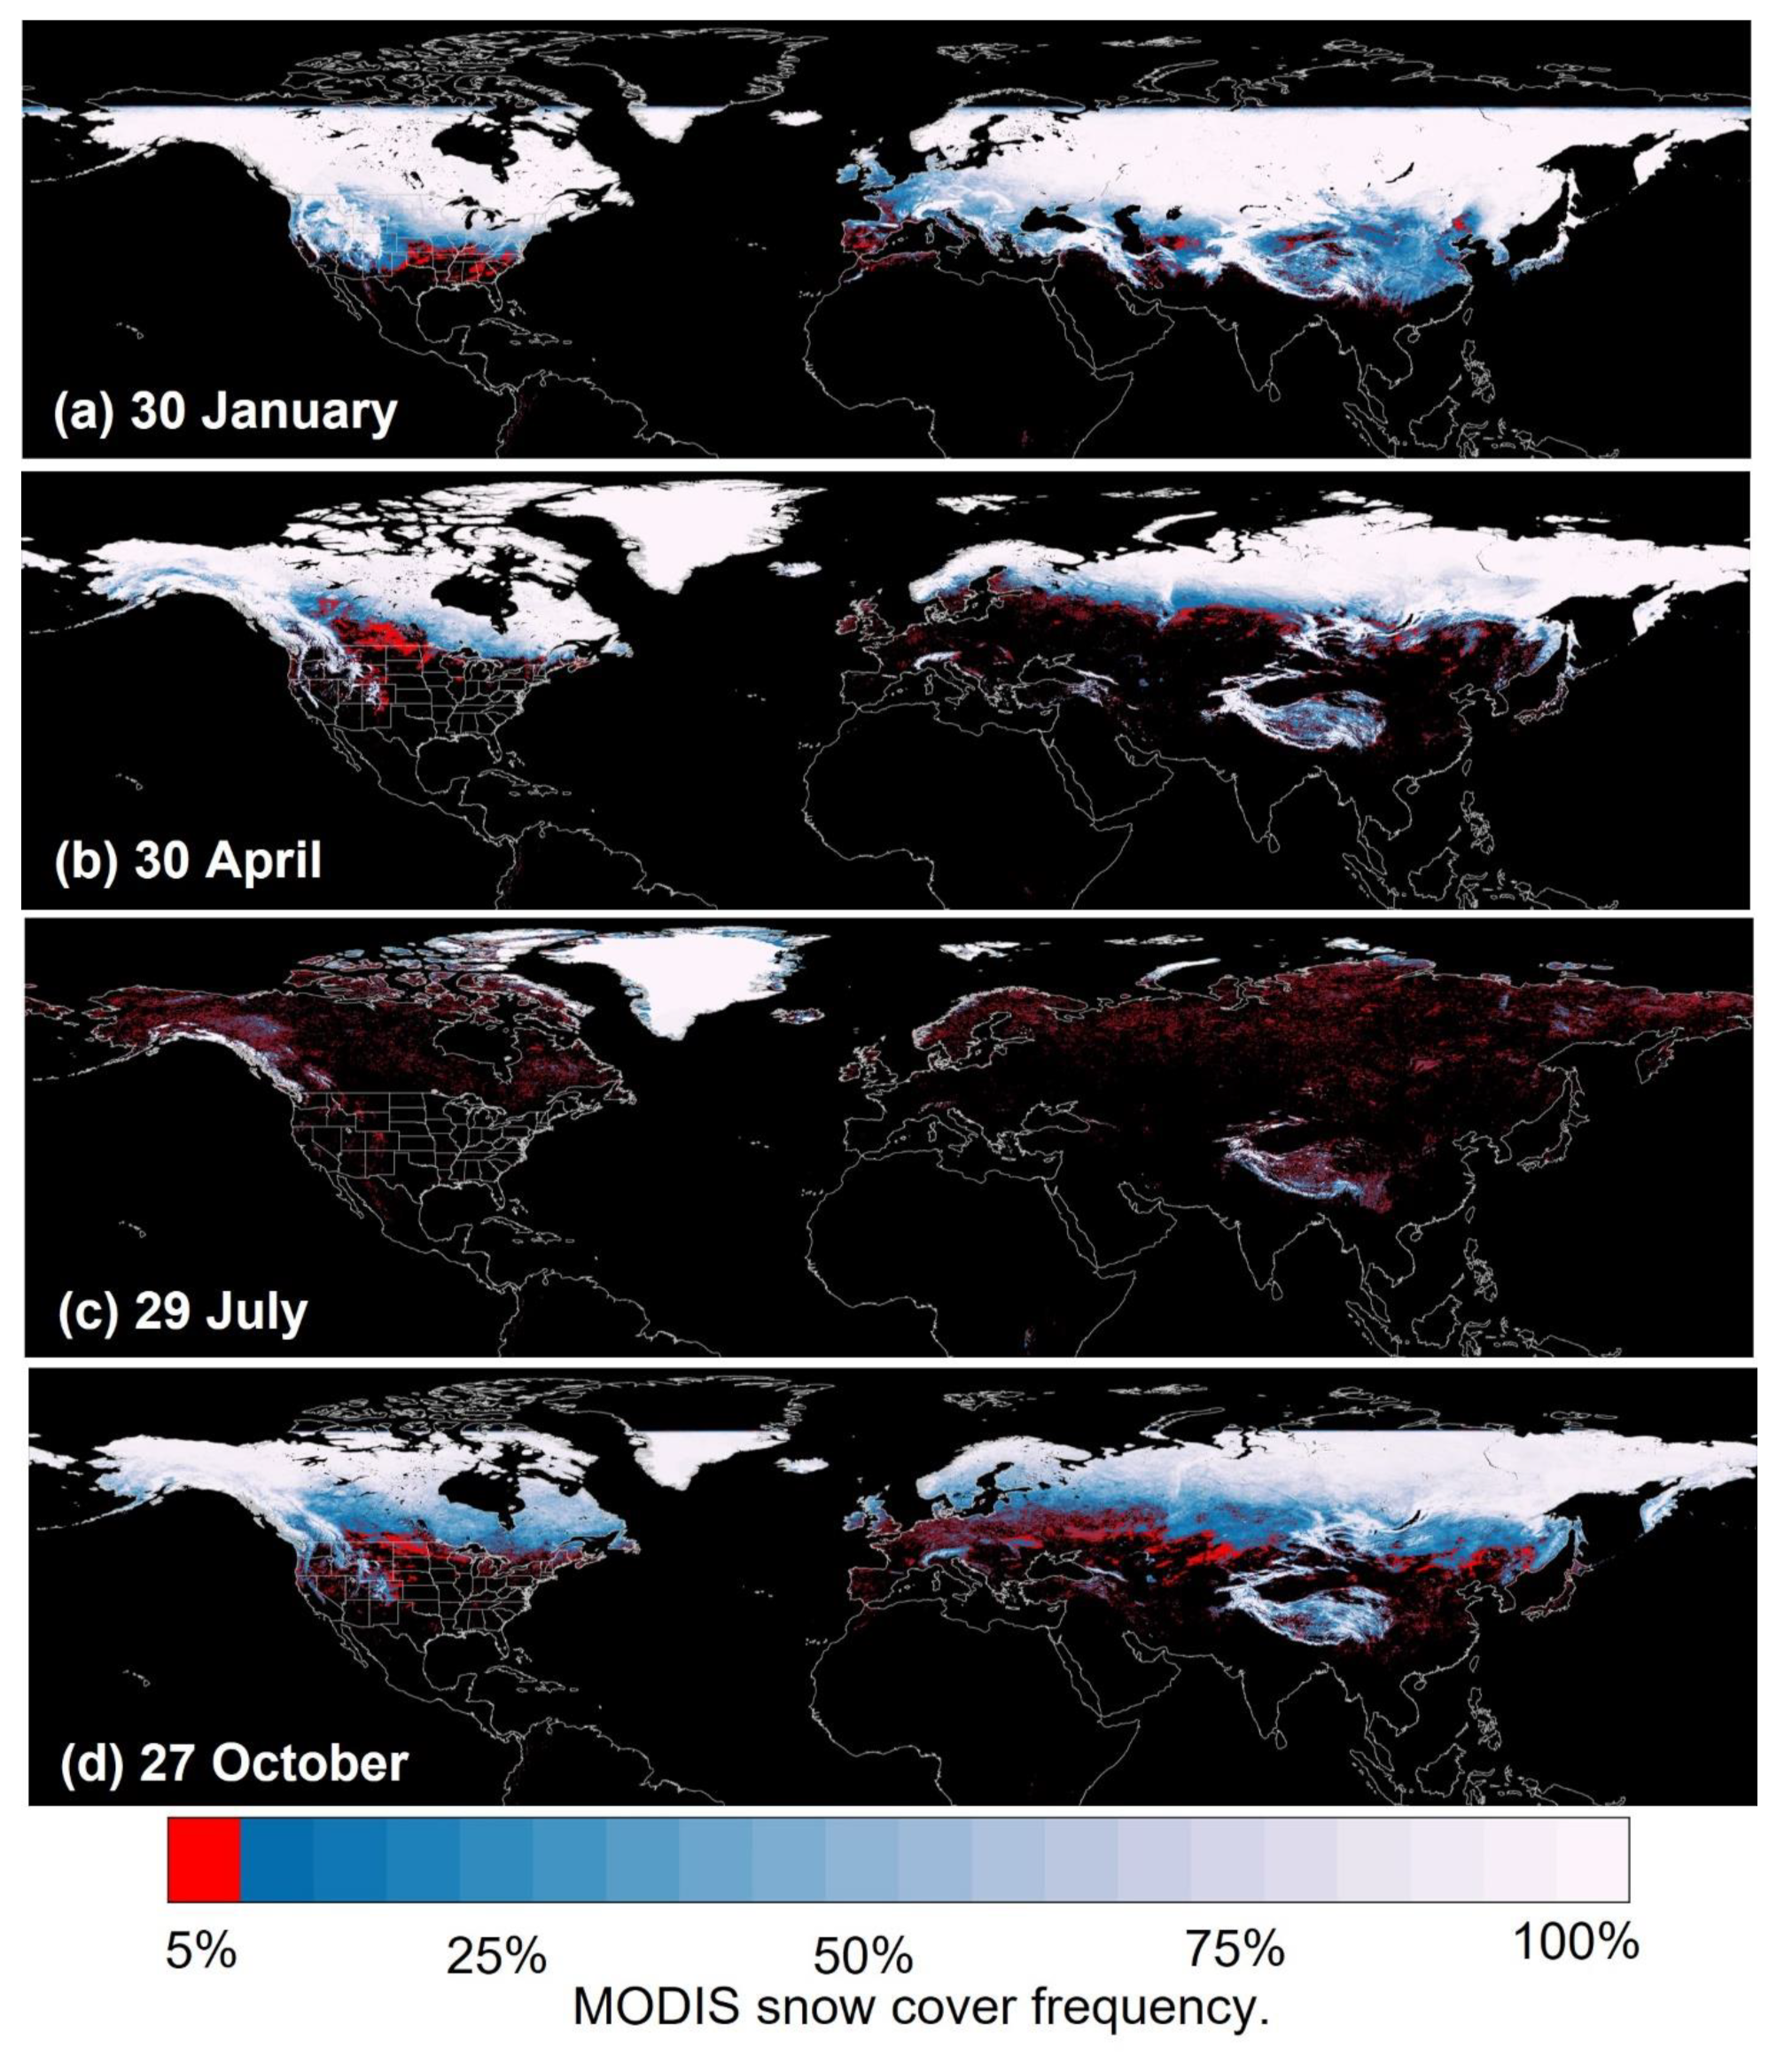
There are 365 snow cover frequency maps. As examples, snow frequency maps for one day from each season, 30 January, 30 April, 29 July, and 27 October are shown in
Figure 2a–d. Our interpretation is that, when snow is mapped in a cell in only one year over the 20-year study period, it is ephemeral snow from a rare snow event or possibly ‘false snow’ that passed through the filters. Such instances are seen in the snow cover frequency maps in locations at times of the year when snow is highly unlikely, for example in the southeastern United States on 30 January. The snow cover frequency maps in
Figure 2 clearly show where snow was observed in only one year out of the 20-year study period (see red pixels in
Figure 2a–d).
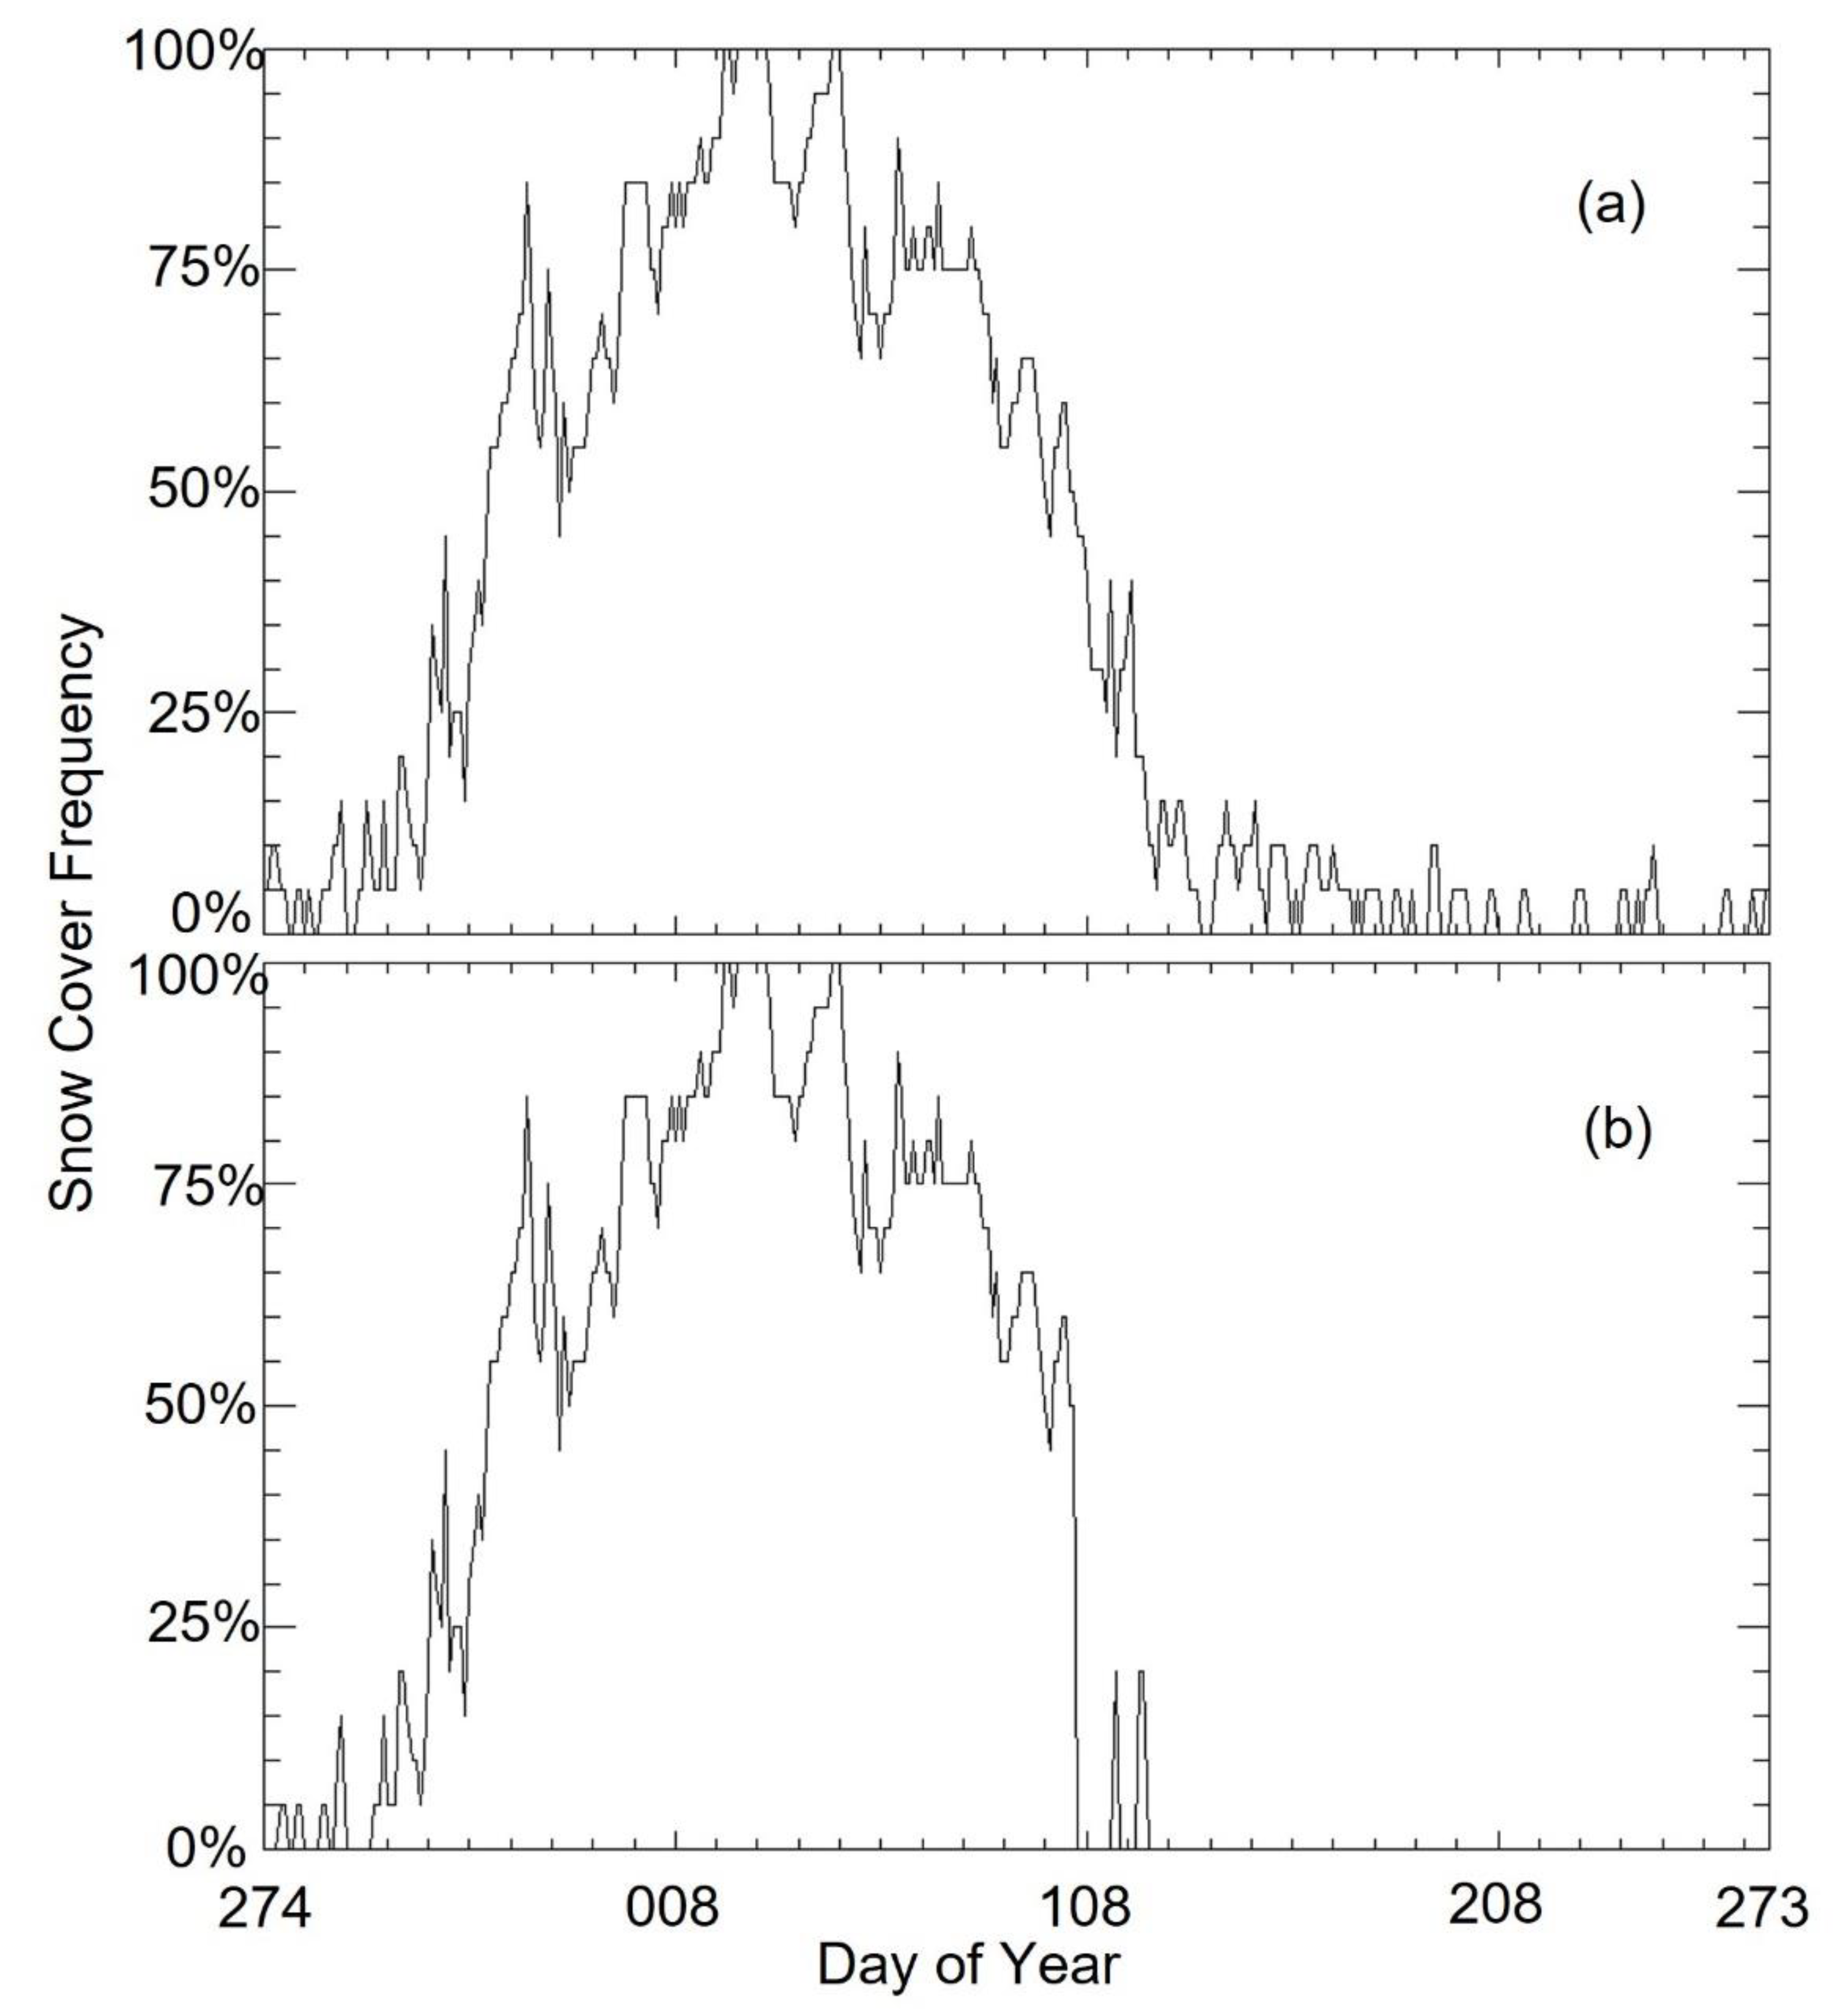
To make a preliminary evaluation of the effect of the spatial box filter to remove ‘false snow’ from the MOD10C1_CGF snow maps, we made plots of the snow cover frequency of the original MOD10C1_CGF and the box filtered snow cover frequency for Buffalo, New York (
Figure 3).
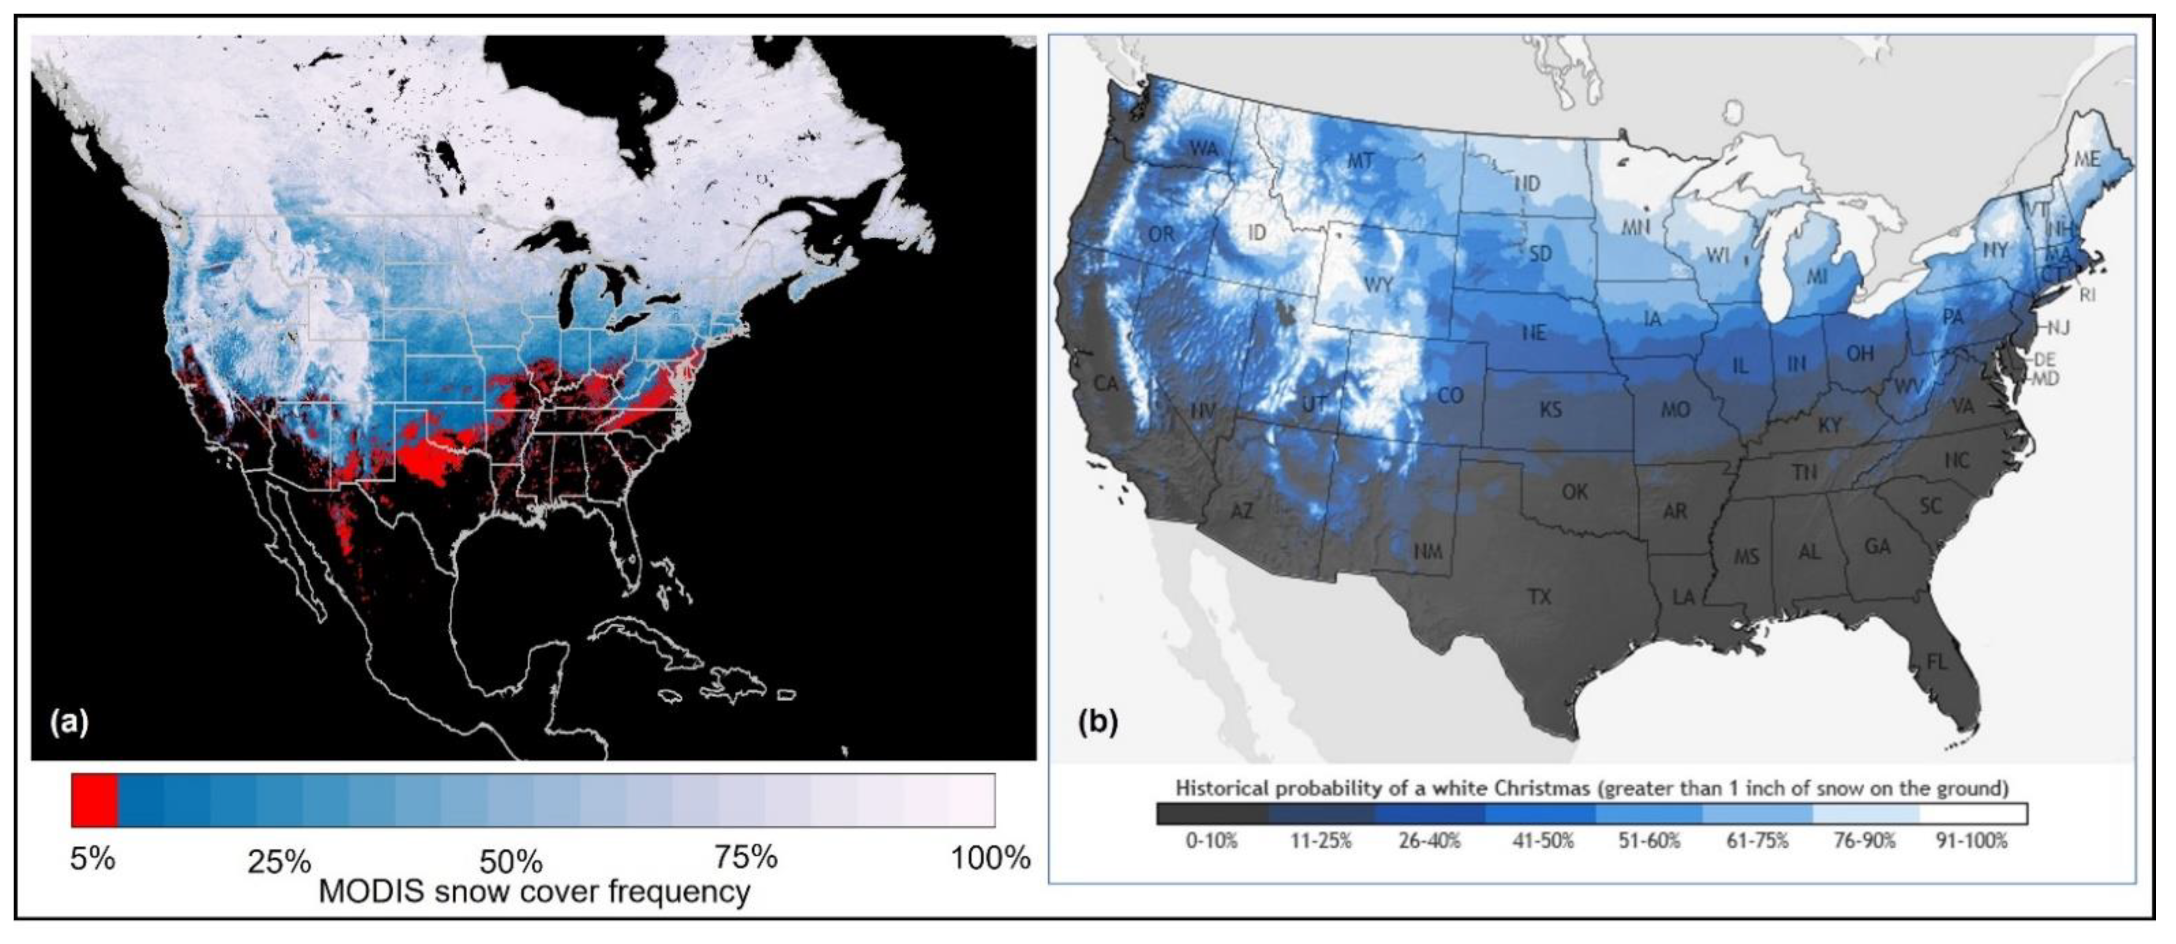
We compared the MODIS snow cover frequency for 25 December to the NOAA historical probability of a white Christmas in the continental United States (CONUS) [
20]. The MODIS frequency of snow cover compares well with the historical probability of a white Christmas (
Figure 4).
Uncertainties
In the MODIS snow cover products, cloud-snow confusion originates at the pixel level in the MOD10_L2 swath-based snow cover detection algorithm, and is propagated through the higher-level products, MOD10A1, MOD10A1F, and MOD10C1. Cloud-snow confusion can result in snow being detected as cloud, or cloud being detected as snow; the latter result can appear as pixels of snow in places or seasons where snow is normally not expected. In the MOD10_L2 snow cover detection algorithm, clouds that are not flagged as ‘certain cloud’ in the input cloud mask product (MOD35_L2) may have normalized difference snow index (NDSI) values similar to snow. Cloud-snow confusion can occur at the periphery of clouds where pixels are mixed (clouds and non-snow-covered land in the same pixel) and have an NDSI value in the range of snow and are furthermore not blocked by a data screen(s) in the algorithm [
21]. In some types of ice cloud formations where clouds shadow other parts of the clouds, the cloud mask does not flag all of the cloud formation as certain cloud, it flags parts of the cloud formation as ‘clear’ view. In this situation the cloud pixels that were flagged as ‘clear’ are processed as clear view pixels. Those ‘clear’ view pixels may have an NDSI similar to snow and may not be blocked by a data screen(s) [
20], which results in a ‘false snow’ detection on the ‘clear’ but actually cloud pixels.
Snow cover detection errors may also occur along shores or banks of water bodies where there are mixed pixels of water and non-snow-covered land. In these situations, a mixed pixel may have an NDSI value similar to snow but is not blocked by any of the data screens in the MOD10_L2 snow cover detection algorithm, thus resulting in a snow cover detection [
19,
21].
The above snow detection errors are propagated from the MOD10_L2 swath product to the MOD10C1 snow cover map. Thus, these snow detection errors pose a problem for the developing of snow cover frequency maps from the MOD10C1 snow cover maps. We refer to these snow cover detection errors as ‘false snow’. The occurrence of ‘false snow’ is highly variable spatially and temporally. These types of ‘false snow’ typically are not observed in the same location from day to day because cloud movement and viewing geometry of MODIS varies from day-to-day. Seasonal weather patterns are also a factor to consider in interpreting the occurrence of ‘false snow’. These types of ‘false snow’ detections are typically observed as scattered pixels, or small clusters of pixels, or a narrow one to three pixel wide strip along cloud formations or water bodies.
Any ’false snow’ in a MOD10_L2, MOD10A1 (MOD10A1 is input to MOD10C1), or MOD10C1 snow cover product may be seen as a significant negative qualitative impact which is out of proportion with the quantitative proportion of ‘false snow’ to real snow cover, or to snow free land. The large spatial and temporal variability of ‘false snow’ is a challenge to making a quantitative estimate. We have estimated the percentage of ‘false snow’ to be typically in the range of 0–3% of all land cover in a MOD10_L2 scene. That estimate is based on the count of what are interpreted as ‘false snow’ pixels compared to the count of all land pixels in a scene. That estimated range is based on the evaluation of scores of scenes in different regions and different seasons. The range of 0–3% is assumed to carry through to the MOD10C1 snow cover product. Though the estimated percentage of ‘false snow’ is small in any scene, it is highly variable spatially and temporally, and thus is a factor to consider in deriving snow cover climatology from the products.
We developed a method of creating snow cover frequency maps that minimize the effect of ‘false snow’ on the accuracy of the maps but likely does not completely eliminate the inclusion of some ‘false snow’. A concern with using filters is that the interpretation of ‘false snow’ is correct, in most situations, but there is a probability that some real snow cover may be removed by these filters. Our evaluation of the MODIS snow cover frequency maps found that there were no regions or time periods with a noticeable absence of snow that may have been caused by the methodology used.
At the boreal day/night terminator in
Figure 2a (30 January) and 2d (27 October), the snow cover frequency is affected by geolocation uncertainty that causes the snow cover frequency count to decrease northward across a small region in the maps near the terminator. Geolocation uncertainty in mapping observations to projections through product levels results in the terminator not being mapped at the same location on the same day in every year. That year-to-year uncertainty results in a narrow band along the terminator where snow frequency year counts are unexpectedly low.
4. Discussion
The MODIS snow cover frequency maps at ~5 km spatial resolution for the 20-year period 2001–2020 provide a unique source of information on snow climatology. This research is an extension of previous work using the daily global MOD10C1 snow cover product at 5 km resolution that investigated the development of a CGF product [
17]. In the current work, we added filtering methods to the MOD10C1_CGF maps to alleviate ‘false snow’ to enable the study of snow climatology. The methods used have similarities with other snow cover frequency research, e.g., [
7,
8,
12,
13,
14,
15,
16].
Alleviating possible ‘false snow’ observations to improve the accuracy of the final snow cover frequency maps was achieved by applying a box spatial filter to the MOD10C1_CGF maps. The filtering method is based on understanding the origins of ‘false snow’ observations in the MOD10_L2 product. The presence of scattered ‘false snow’ is not considered a serious problem in the swath level product, MOD10_L2 or in the daily MOD10A1 and MOD10C1 snow cover maps because pixels containing ‘false snow’ are scattered or in small clusters and may be filtered, however, when snow frequency is computed for a time series such as a month or a year, or for the 20-year study period, and at a synoptic scale the ‘false snow’ errors accumulate and become problematic. We were able to filter our interpretation of ‘false snow’ in the MOD10C1_CGF by applying a spatial box consisting of a 5 × 5 box of grid cells. If fewer than 33% of cells in the box were snow, the snow mapped in the center cell of the 5 × 5 box was likely ‘false snow’. We applied this filter to mitigate the problem of ‘false snow’ being included in the snow frequency maps.
In our preliminary evaluation of the MODIS snow cover frequency maps, we find them to represent a reasonable snow climatology in regions with continuous snow cover and regions with discontinuous snow cover. There are no regions or time periods with a noticeable absence of snow where snow is expected. An evaluation of these MODIS snow cover frequency maps as compared to other sources of snow cover frequency is needed. These MODIS snow cover frequency maps will be compared to snow cover metrics created by other researchers using MODIS data (for example, [
6,
8,
12,
13,
14] and NOAA IMS data [
3,
22]. Making comparisons is challenging, however, because of differences in time periods of interest and differences in spatial resolutions among the various snow frequency maps.
The MODIS snow cover frequency maps developed herein represent an atlas of snow cover frequency providing information on snow climatology during the MODIS era. When combined with daily operational snow cover maps, they can assist with interpretation of operational maps. The frequency of snow cover in mid-season for summer (day 210), autumn (day 300), winter (day 30) and spring (day 120), seasons defined by meteorological dates, are shown in
Figure 2. These mid-season snow cover frequency maps show where snow cover is very likely or not likely in different seasons.
The MODIS cloud-gap-filled product (MOD10C1_CGF) we developed in [
17] had ‘false snow’ originating from the MOD10_L2 swath product as discussed above that appear as low snow frequencies in the unfiltered snow cover frequency maps in seasons and locations where snow is not expected. The purpose of applying the spatial box filter is to remove those ‘false snow’ occurrences from the snow frequency maps to improve the quality of the maps. A plot of snow cover frequency for unfiltered (
Figure 3a) and for filtered snow (
Figure 3b) for each day of the year for Buffalo, New York is evaluated to assess the efficacy of the spatial box filter. In the unfiltered data,
Figure 3a, low snow cover frequencies, <15%, occur throughout the spring and summer seasons, around days 138 (18 May) to 273 (30 September), which we interpret as ‘false snow’. Those ‘false snow’ observations were removed by the box filter; the snow frequency is 0% over days 138 to 273 (
Figure 3b). The box filter had minimal effect on changing snow frequencies in the autumn and winter, days 274 to about mid-April (day 106) as indicated by very similar unfiltered (
Figure 3a) and filtered (
Figure 3b) snow frequencies. However, the box filter caused an abrupt decline in snow frequencies from high frequency to 0% in the mid-spring, about day 108 at this location. That abrupt end to snow frequency is surprising but is not unreasonable for the region where snow cover typically ends in March according to the NOAA National Weather Service climate narrative for Buffalo, New York (
https://www.weather.gov/buf/BUFclifo (accessed on 29 August 2022)). However, snowfalls have historically occurred in April (
https://www.weather.gov/buf/BuffaloSnow (accessed on 29 August 2022)). The spatial filter removes some but not all possible ephemeral snow events in the region in April as indicated by the 0% and spikes to about 25% frequency in April, days 184–213 in the filtered frequency (
Figure 3b) compared to unfiltered
Figure 3a, which probably includes ephemeral snow events and ‘false snow’ days.
The 25 December comparison of the MODIS snow cover frequency map with the NOAA probability of a white Christmas map (
Figure 4) was done to evaluate the MODIS snow frequency of observed snow to the historical probability of snow cover. NOAA defines snow cover as ≥1 inch of snow on the ground, and the normal probability is based on the latest 1981–2010 U.S. climate normals. Though the MODIS snow frequency and NOAA probabilities are computed from very different data sources, they compare very well. The general patterns of high probability and high frequency occur in the same regions, e.g., the Rocky Mountains, northern Minnesota and Maine (
Figure 4). There is also good agreement in regions, such as the Plains and Midwest, where there is a moderate probability of a white Christmas (
Figure 4).
Regions that have infrequent snow events, for example, the southern Plains, southern Midwest and southeastern states, are more challenging to compare. In those regions, MODIS snow frequency of 5% (a 1 year occurrence, shown in red in
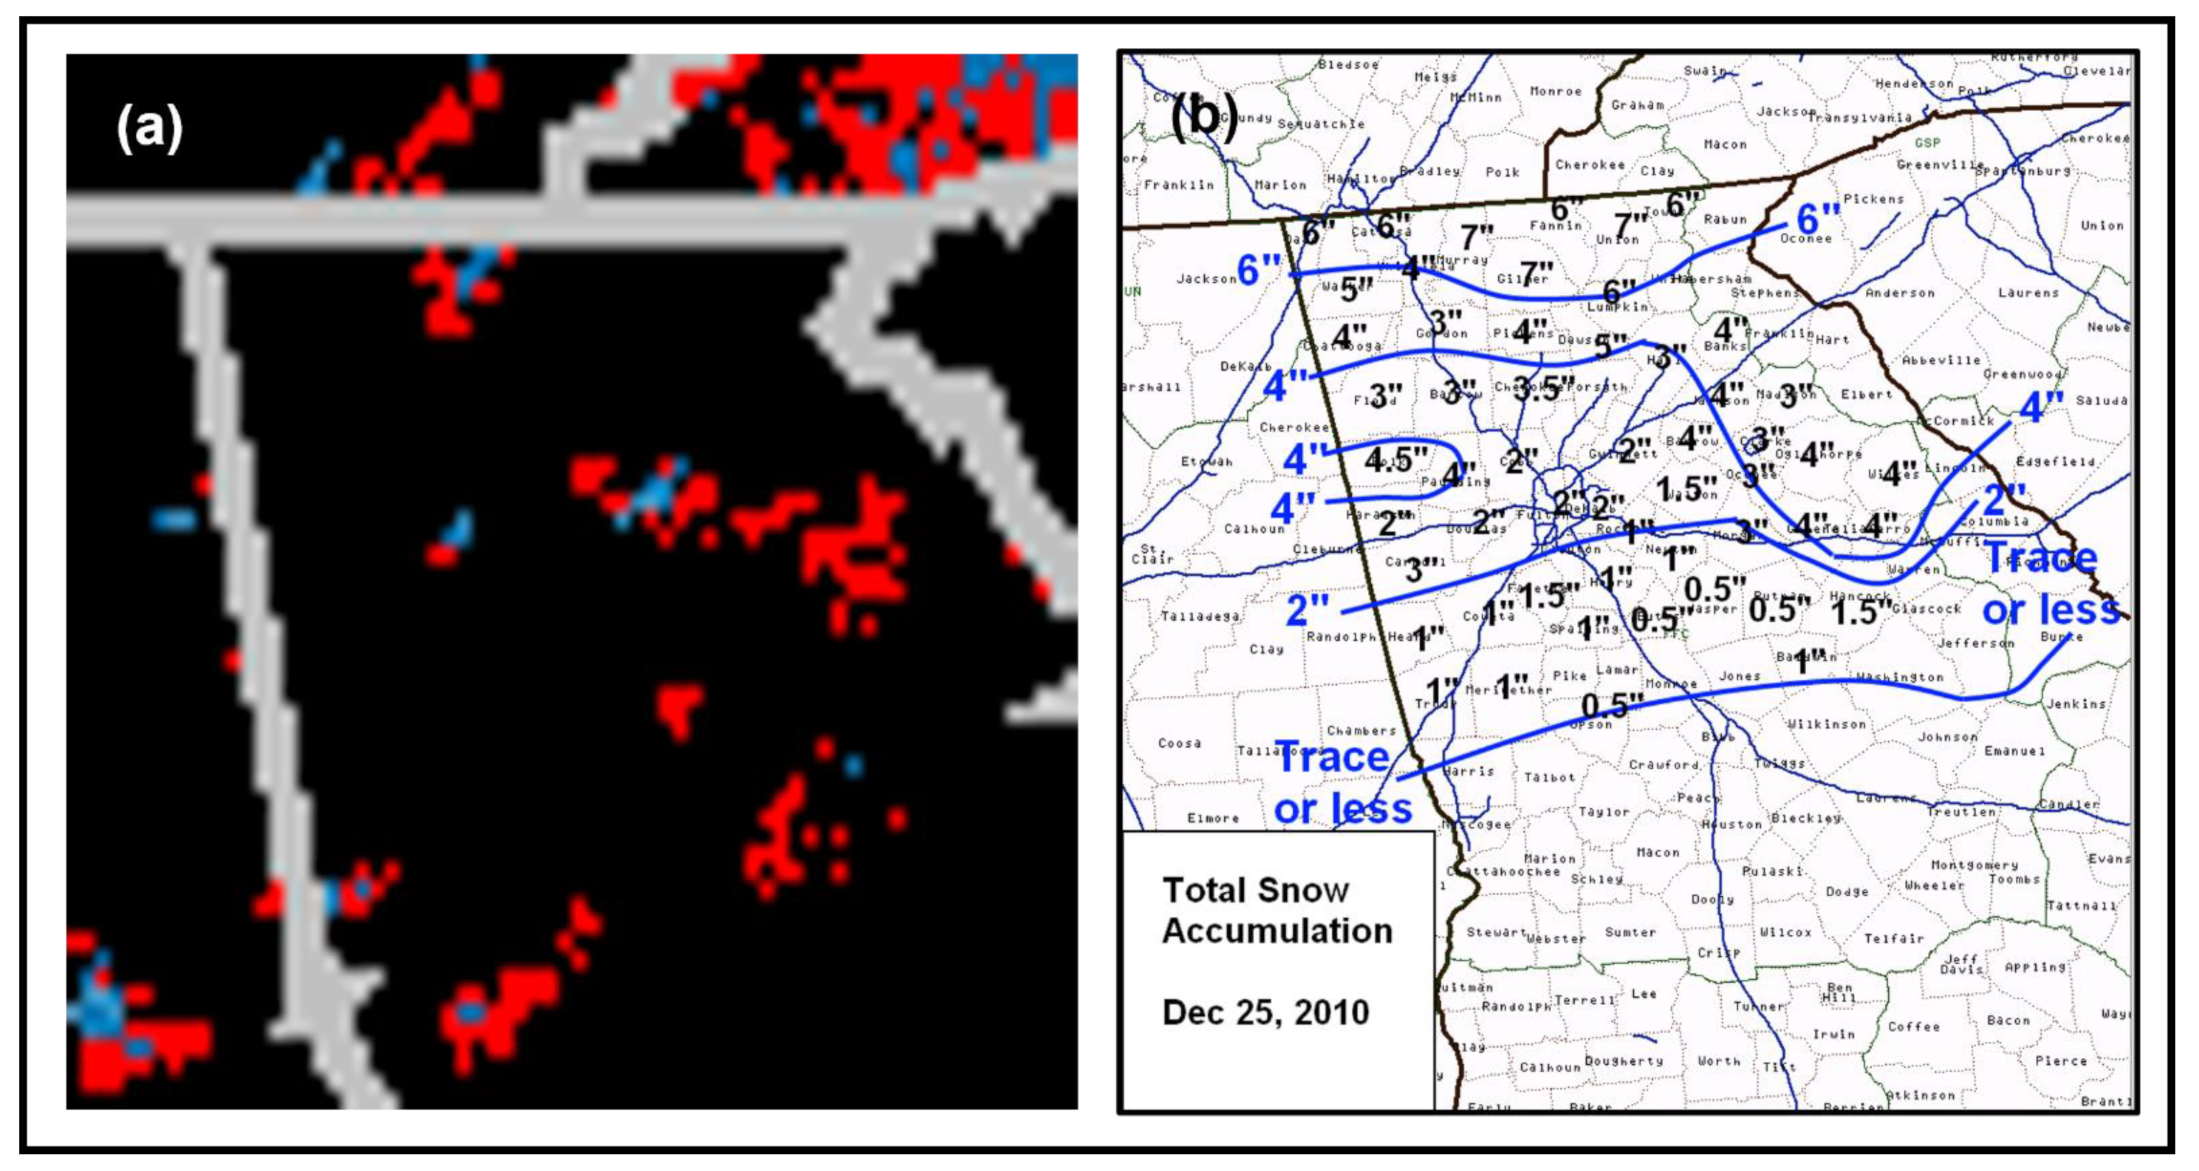
Figure 4) are in the 0–25% NOAA probability range. Snow events are rare in those regions. Infrequent and rare snow events may or may not be observed by MODIS. The last white Christmas in Atlanta, Georgia, USA was in 2010 (
https://www.daculaweather.com/4_georgia_christmas_climo.php (accessed on 24 August 2022)). There were snow accumulations of 1–3” in the Atlanta metro region and 3–7” across northern Georgia on 25 December 2010 shown on the NOAA snow accumulation map (
Figure 5b) (
https://www.weather.gov/ffc/snow20101225 (accessed on 24 August 2022)). The northern Georgia region is mapped as a mix of 0% snow frequency or 5% snow frequency (one year of snow cover) in the MODIS snow frequency map shown in
Figure 4. For the purpose of this discussion, we assume that any snow in that region was from this storm. The MODIS snow cover frequency map (
Figure 5a) shows that this snow event was only observed for a few locations in the region (see red in
Figure 5a) or was mostly missed (see black in
Figure 5a). Possible reasons for missing this snow event are; cloud obscured views, the spatial filtering of possible ‘false snow’ in the MOD10C1_CGF maps removed actual snow observations, or the spatial filtering of ‘false snow’ in step two of the algorithm (
Figure 1) the snow frequency maps removed actual snow observations. Perusal of Terra MODIS imagery and MODIS snow cover in EOSDIS Worldview (
https://worldview.earthdata.nasa.gov/ (accessed on 24 August 2022)) reveals that northern Georgia was cloud free and snow free on 24 December 2010. The region was cloud obscured on 25–26 December. On 27 December the region was mostly clear to partly cloudy, and there was a mix of cloud and clear sky over areas of snow cover and the viewable SCE was less than when compared to the NOAA snow accumulation map (
Figure 5b). MODIS did detect some areas of snow cover. On 28 December the region was mostly clear; areas of fading snow cover were seen, and MODIS detected only a few scattered pixels of snow. It is possible that the fading snow was flagged as ‘certain cloud’ by the cloud mask in the swath product MOD10_L2 or that the snow algorithm failed to detect the fading snow cover. The region was then cloud obscured until 2 January 2011, when it was mostly clear and snow free.
Evaluation of the above rare snow event highlights many factors to be considered in assessing the quality and accuracy of the MODIS snow cover products at each product level and through the product levels from L2 to L3 to derived datasets or maps such as the MOD10C1_CGF and MODIS snow cover frequency map. Only one unusual snow event was selected to provide an example of factors that should be considered in evaluating the quality and accuracy of the MODIS snow cover products and derived products.
5. Conclusions
This work provides insights for the use of MODIS snow cover data products to study snow cover frequency over a 20-year study period from 2001 to 2020. The derived snow cover frequency maps, one for each day of the year, appear to be reasonable after our preliminary analysis. The four seasonal MODIS snow cover frequency maps shown in
Figure 2 are consistent with expected snow climatology across the Northern Hemisphere. We compared and evaluated the 25 December MODIS snow cover frequency map to the NOAA historical probability of a white Christmas for the CONUS and found good agreement, with similar SCE frequencies and probabilities between them. That evaluation confirmed our previous research showing that rare or infrequent snow events may be missed in the MODIS_L2 snow cover product due to clouds obscuring snow cover from a storm or by our interpretation and filtering of possible ‘false snow’ in the MODIS snow cover products.
Our method of filtering ‘false snow’ to make the MOD10C1_CGF map and subsequently filtering that map to make MODIS snow cover frequency map removed ‘false snow’ in all seasons, but in winter the method probably prevented the inclusion of some rare or infrequent snow events in the snow cover frequency calculation.
We derived MODIS snow cover frequency from the coarse resolution ~5 km daily CMG cloud-gap-filled and ‘false snow’ filtered product from previous work [
17], then applied another spatial filter to develop the final snow cover frequency maps that are presented herein. Though these snow cover frequency maps appear to be reasonable, we think that improved snow cover frequency maps can be made from the higher resolution 500 m cloud-gap-filled MODIS snow product, MOD10A1F, and from the Visible Infrared Imaging Radiometer Suite (VIIRS) 375 m cloud-gap-filled snow product VNP10A1F. Those products are produced by using current day clear view observations for a pixel, or if a pixel is cloudy, the most recent clear view observation is retained. The most recent clear view may be from the preceding day or from two or more preceding days. Those products use pixel observations directly, not pixel observations binned to a CMG grid cell as done here to create a MOD10C1_CGF map, and subsequent filtering to make the snow frequency maps. The accuracy of the MOD10A1F and VNP10A1F products is discussed in [
23], with results indicating that an Earth Science Data Record (ESDR) could be developed from that product. Because there is no binning of observations in the MOD10A1F or VNP10A1F, spatial and temporal filter methods could be more effective at alleviating ‘false snow’ effects in derived snow cover frequency maps as compared to maps derived from the derived MOD10C1_CGF.
The orbit of the Terra satellite has begun to drift (orbital drift), and Terra will be lowered 6 km from its current orbit in October 2022 but will continue to collect data for another 2 to 3 years until passivation takes place [
24]. We are moving forward with research investigating the continuity between the MODIS and VIIRS snow cover products to understand how VIIRS can extend the MODIS snow cover data record [
25].


