
Open-Source Data Alternatives and Models for Flood Risk Management in Nepal

 ,
,
Abstract
:1. Introduction
2. Materials and Methods
2.1. Data Collection
2.2. Data Analysis and Validation
3. Results and Discussion
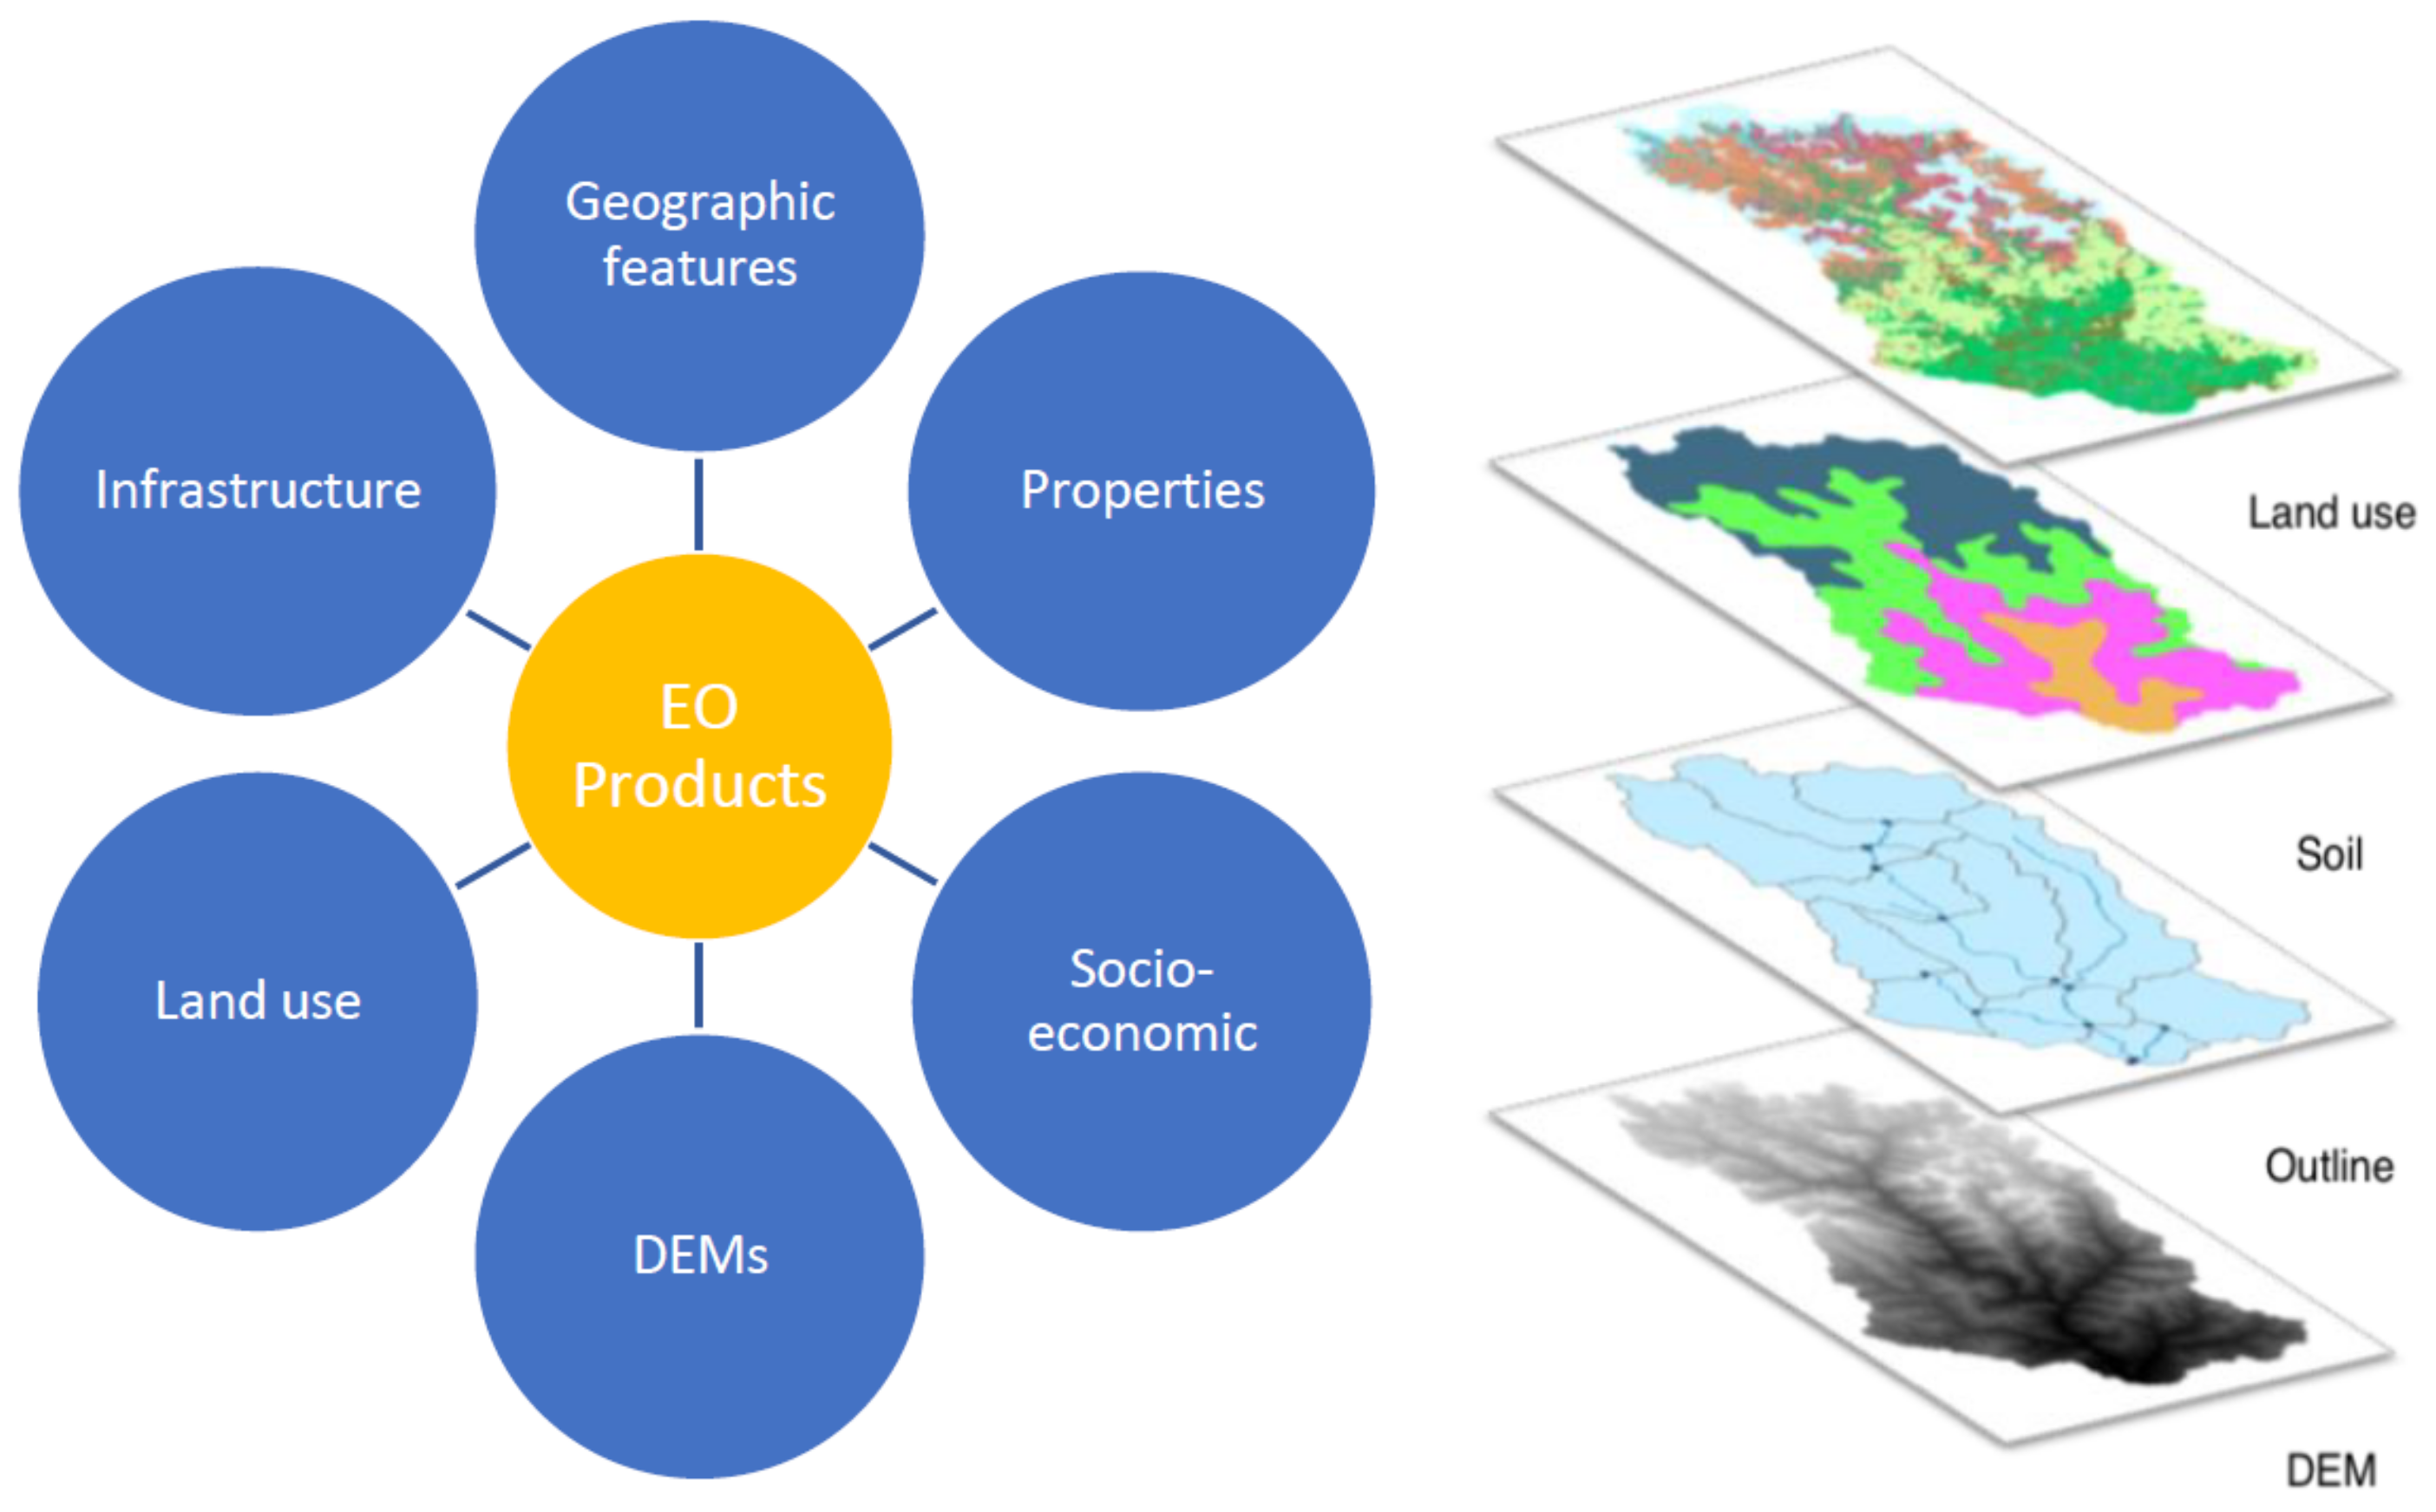
3.1. Earth Observation Data
3.2. Geospatial Data
3.3. Analytical Models for Flood Hazard and Risk Assessment
3.3.1. Hydrodynamic Model
3.3.2. Hydraulic Models
3.3.3. Hydrological Models

| Model | Description | Reference | Types | Temporal and Spatial Scale | Main Outputs |
|---|---|---|---|---|---|
| HecRAS https://www.hec.usace.army.mil/software/hec-ras/ (accessed on 18 October 2021) | Hydrologic Engineering Center’s River Analysis System | [116,117] | Engineering, physically based | Minute to year; Individual to network of reaches | 1D and 2D steady and unsteady analysis, sediment transport, water quality simulation, inundation areas, flood, and CC analysis |
| BEACH | Bridge Event and Continuous Hydrological Model | [118] | Physically based, distributed | Daily; Hillslope, small watershed | Soil moisture, ET, runoff |
| SWAT | Soil water assessment tool | [111,112,113] | Physically based, semi-distributed | Hourly, daily annual, multiyear; Large or small basins | Runoff, sediment yield, ET, percolation, transmission loss |
| KINEROS2 (KINEmatic Runoff and erosion model) | Hydrologic Engineering Center, US Army Corps of Engineers | [119] | Physically based, semi distributed | Event-based (a minute); Small to medium watersheds | Runoff, sediment yield, infiltration, sediment discharge |
| IFAS (Integrated Flood Analysis System) http://www.icharm.pwri.go.jp/research/ifas/ (accessed on 18 October 2021) | International Center for Water Hazard (ICHARM), Public Works Research Institute (PWRI), Japan | [120] | Provides interfaces to input satellite-based and ground-based rainfall data; distributed hydrological model | Operational flood forecasting; Capable of 1D/2D simulations; Successfully used in Indonesia, The Philippines, Indus Basin Pakistan, and Malaysia | River channel network, estimate parameters of runoff analysis |
| Delft-FEWS (Delft Flood Early Warning System) | Deltares, The Netherlands | [121] | XML based data exchange open-source platform | Successfully applied to basins in Europe, Mozambique, Gulf of Thailand, and other parts of the world | |
| Anuga Hydro Model | Australian National University (ANU) and Geoscience Australia (GA), Australia | [122] | Developed in Python; Computationally intensive components are written in C routines compatible with Numpy | Capable of 2D simulation; Continuously being updated with the help of user’s community; Capable of modeling highly dynamic flows | Mostly in Western Australia, UK, and Indian Ocean |
| SPHY (Spatial Processes in Hydrology) | FutureWater and Utrecht University, The Netherlands | [123,124] | Spatially distributed bucket-type model | Programmed in Python; GUI available for QGIS | Applied in many parts of the world, especially European region and in Nepal |
| HBV (Hydrologi ske Byrån avdeling för Vattenbala ns) | Swedish Meteorological and Hydrological Institute | [125,126,127] | Lumped conceptual model | Does not have the capability of a distributed model in terms of its calculations | Applied in catchments of Brazil, China, Iran, Mozambique, Nepal, Norway, Sweden, Zimbabwe, and Nordic countries |
| TOPMODEL (TOPography based hydrological MODEL | TOPMODEL: Lancaster University, UK BTOPMC: University of Yamanashi, Japan | [128,129,130] | Written in FORTRAN77; Spatially distributed | Applicable to small to large scale catchments; Uses some distributed and some lumped parameters | River basins of Japan, China, Nepal, Sri Lanka, Indonesia, Thailand, and USA |
| VIC (Variable Infiltration Capacity) | University of Washington | [110,131] | Semi distributed; Surface water energy balance model for large scale application | Mostly used for long term simulations; Capability of incorporation to GCMs; Capability of integration with other models | Applied in USA and many other parts of the world |
3.4. Analytical Platforms, GIS Software and Programming Languages
| Name | Brief Description | Capability in Data Processing and Modelling | References |
|---|---|---|---|
| Python | Python has many modules in scientific computing and machine learning, including NumPy, scikit-learn, and matplotlib. Python’s extensive set of scientific libraries that make it an attractive environment for interactive development. | Python language is used in the development of models such as Anuga Hydrological Model, LISFLOOD-FP models, THRESH Landslide models. As a general-purpose language, Python can be used to build any kind of models from scratch and run on local desktop or cloud servers. | [190,191] |
| R | R is a free software environment for statistical computing and data analysis. It has many powerful packages that aid in processing, analyzing, and modelling data. | R has an increasing number of packages that support hydrological modelling and facilitate hydrological analyses from start to finish. R can also easily integrate GIS analyses in hazard modelling. | [190,192] |
| Notebook environment | Jupyter notebook is an open-source web-based computational environment that supports the creation of programming documents that combine code, text, and execution results with visualizations and all sorts of rich media [190]. | Notebooks like Jupyter and Google Colab are well suited to be a platform for participatory modeling in disaster use [191]. | [193,194,195] |
| Google Colab: Google Colaboratory [196] provides a free Jupyter notebook environment that requires no setup, and runs entirely (writing, running, and sharing code) on the Cloud |
3.5. Machine Learning Models
4. Conclusions
Author Contributions
Funding
Data Availability Statement
Conflicts of Interest
References
- Aryal, D.; Wang, L.; Adhikari, T.R.; Zhou, J.; Li, X.; Shrestha, M.; Wang, L.; Chen, D. A Model-Based Flood Hazard Mapping on the Southern Slope of Himalaya. Water 2020, 12, 540. [Google Scholar] [CrossRef] [Green Version]
- Cabrera, J.S.; Lee, H.S. Flood risk assessment for Davao Oriental in the Philippines using geographic information system-based multi-criteria analysis and the maximum entropy model. J. Flood Risk Manag. 2020, 13, e12607. [Google Scholar] [CrossRef] [Green Version]
- Borah, S.B.; Sivasankar, T.; Ramya, M.N.S.; Raju, P.L.N. Flood inundation mapping and monitoring in Kaziranga National Park, Assam using Sentinel-1 SAR data. Environ. Monit. Assess. 2018, 190, 520. [Google Scholar] [CrossRef] [PubMed]
- Aksha, S.K.; Resler, L.M.; Juran, L.; Carstensen, L.W., Jr. A geospatial analysis of multi-hazard risk in Dharan, Nepal. Geomat. Nat. Hazards Risk 2020, 11, 88–111. [Google Scholar] [CrossRef] [Green Version]
- Aggarwal, A. Exposure, hazard and risk mapping during a flood event using open source geospatial technology. Geomat. Nat. Hazards Risk 2016, 7, 1426–1441. [Google Scholar] [CrossRef] [Green Version]
- Du, X.; Lin, X. Conceptual model on regional natural disaster risk assessment. Procedia Eng. 2012, 45, 96–100. [Google Scholar] [CrossRef] [Green Version]
- Kappes, M.S.; Keiler, M.; von Elverfeldt, K.; Glade, T. Challenges of analyzing multi-hazard risk: A review. Nat. Hazards 2012, 64, 1925–1958. [Google Scholar] [CrossRef] [Green Version]
- Sekhri, S.; Kumar, P.; Fürst, C.; Pandey, R. Mountain specific multi-hazard risk management framework (MSMRMF): Assessment and mitigation of multi-hazard and climate change risk in the Indian Himalayan Region. Ecol. Indic. 2020, 118, 106700. [Google Scholar] [CrossRef]
- Ahamed, A.; Bolten, J.; Doyle, C.; Fayne, J. Near real-time flood monitoring and impact assessment systems. In Remote Sensing of Hydrological Extremes; Springer: Cham, Switzerland, 2017; pp. 105–118. [Google Scholar]
- Mishra, K.; Sinha, R. Flood risk assessment in the Kosi megafan using multi-criteria decision analysis: A hydro-geomorphic approach. Geomorphology 2020, 350, 106861. [Google Scholar] [CrossRef]
- Towe, R.; Dean, G.; Edwards, L.; Nundloll, V.; Blair, G.; Lamb, R.; Hankin, B.; Manson, S. Rethinking data-driven decision support in flood risk management for a big data age. J. Flood Risk Manag. 2019, 13, e12652. [Google Scholar] [CrossRef]
- GFDRR (Global Facility for Disaster Reduction and Recovery). Understanding Risk: Review of Open Source and Open Access Software Packages Available to Quantify Risk from Natural Hazards; International Bank for Reconstruction and Development/International Development Association or The World Bank: Washington, DC, USA, 2014. [Google Scholar]
- Sudmeier, K.I.; Jaboyedoff, M.; Jaquet, S. Operationalizing “resilience” for disaster risk reduction in mountainous Nepal. Disaster Prev. Manag. 2013, 22, 366–377. [Google Scholar] [CrossRef]
- Sudmeier-Rieux, K.; Gaillard, J.C.; Sharma, S.; Dubois, J.; Jaboyedoff, M. Floods, landslides, and adapting to climate change in Nepal: What role for climate change models? In Climate Change Modeling for Local Adaptation in the Hindu Kush-Himalayan Region; Emerald Group Publishing Limited: Bingley, UK, 2012. [Google Scholar]
- MoHA. National Disaster Report; Disaster Preparedness Network Nepal (DPNet-Nepal); Ministry of Home Affairs (MoHA), Government of Nepal: Kathmandu, Nepal, 2013. [Google Scholar]
- NPC. Nepal Flood 2017: Post Flood Recovery Needs Assessment; Government of Nepal, National Planning Commission: Kathmandu, Nepal, 2017. [Google Scholar]
- Pinos, J.; Orellana, D.; Timbe, L. Assessment of microscale economic flood losses in urban and agricultural areas: Case study of the Santa Bárbara River, Ecuador. Nat. Hazards 2020, 103, 2323–2337. [Google Scholar] [CrossRef]
- Di, L.; Eugene, G.Y.; Kang, L.; Shrestha, R.; Bai, Y.Q. RF-CLASS: A remote-sensing-based flood crop loss assessment cyber-service system for supporting crop statistics and insurance decision-making. J. Integr. Agric. 2017, 16, 408–423. [Google Scholar] [CrossRef]
- Eugene, G.Y.; Di, L.; Rahman, M.S.; Lin, L.; Zhang, C.; Hu, L.; Shrestha, R.; Kang, L.; Tang, J.; Yang, G. Performance improvement on a Web Geospatial service for the remote sensing flood-induced crop loss assessment web application using vector tiling. In Proceedings of the 2017 6th International Conference on Agro-Geoinformatics, Fairfax, VA, USA, 7–10 August 2017; pp. 1–6. [Google Scholar]
- Delalay, M.; Ziegler, A.D.; Shrestha, M.S.; Wasson, R.J.; Sudmeier-Rieux, K.; McAdoo, B.G.; Kochhar, I. Towards improved flood disaster governance in Nepal: A case study in Sindhupalchok District. Int. J. Disaster Risk Reduct. 2018, 31, 354–366. [Google Scholar] [CrossRef]
- Gaire, S.; Delgado, R.C.; González, P.A. Disaster risk profile and existing legal framework of Nepal: Floods and landslides. Risk Manag. Healthc. Policy 2015, 8, 139. [Google Scholar] [CrossRef] [Green Version]
- Sharma, T.P.P.; Zhang, J.; Koju, U.A.; Zhang, S.; Bai, Y.; Suwal, M.K. Review of flood disaster studies in Nepal: A remote sensing perspective. Int. J. Disaster Risk Reduct. 2019, 34, 18–27. [Google Scholar] [CrossRef]
- Charalabidis, Y.; Zuiderwijk, A.; Alexopoulos, C.; Janssen, M.; Lampoltshammer, T.; Ferro, E. The World of Open Data. In Public Administration and Information Technology; Springer International Publishing: Cham, Switzerland, 2018; Volume 10, pp. 978–983. [Google Scholar]
- Great Britain Cabinet Office. Open Data White Paper: Unleashing the Potential; The Stationery Office: London, UK, 2012; Volume 8353. [Google Scholar]
- Ospina, A.V. Big Data for Resilience Storybook: Experiences Integrating Big Data into Resilience Programming; Canada International Institute for Sustainable Development: Winnipeg, MB, Canada, 2018. [Google Scholar]
- Nicoson, C.; Uexkull, N.V. Overlapping Vulnerabilities: The Impacts of Climate Change on Humanitarian Needs; Norwegian Red Cross: Oslo, Norway, 2019. [Google Scholar]
- Kankanamge, N.; Yigitcanlar, T.; Goonetilleke, A.; Kamruzzaman, M. Can volunteer crowdsourcing reduce disaster risk? A systematic review of the literature. Int. J. Disaster Risk Reduct. 2019, 35, 101097. [Google Scholar] [CrossRef]
- Dewey, A.; Drahota, A. Introduction to Systematic Reviews: Online Learning Module Cochrane Training. 2016. Available online: https://training.cochrane.org/interactivelearning/module-1-introduction-conducting-systematic-reviews (accessed on 16 September 2020).
- Gough, D.A.; Gough, D.; Oliver, S.; Thomas, J. An Introduction to Systematic Reviews; SAGE: London, UK, 2012. [Google Scholar]
- Page, M.J.; McKenzie, J.E.; Bossuyt, P.M.; Boutron, I.; Hoffmann, T.C.; Mulrow, C.D.; Shamseer, L.; Tetzlaff, J.M.; Akl, E.A.; Brennan, S.E.; et al. The PRISMA 2020 statement: An updated guideline for reporting systematic reviews. Syst. Rev. 2021, 10, 89. [Google Scholar] [CrossRef]
- Skakun, S.; Kussul, N.; Shelestov, A.; Kussul, O. Flood Hazard and Flood Risk Assessment Using a Time Series of Satellite Images: A Case Study in Namibia. Risk Anal. Off. Publ. Soc. Risk Anal. 2014, 34, 1521–1537. [Google Scholar] [CrossRef]
- Jiang, Y.; Sun, M.; Yang, C. A generic framework for using multi-dimensional earth observation data in GIS. Remote Sens. 2016, 8, 382. [Google Scholar] [CrossRef]
- Rapinel, S.; Hubert-Moy, L.; Clement, B.; Maltby, E. Mapping wetland functions using Earth observation data and multi-criteria analysis. Environ. Monit. Assess. 2016, 188, 641. [Google Scholar] [CrossRef] [PubMed]
- Casana, J. Global-Scale Archaeological Prospection using CORONA Satellite Imagery: Automated, Crowd-Sourced, and Expert-led Approaches. J. Field Archaeol. 2020, 45 (Suppl. 1), S89–S100. [Google Scholar] [CrossRef] [Green Version]
- Galiatsatos, N. Assessment of the CORONA Series of Satellite Imagery for Landscape Archaeology: A Case Study from the Orontes Valley, Syria. Ph.D. Thesis, Durham University, Durham, UK, 2004. [Google Scholar]
- Ye, W.; Qiao, G.; Kong, F.; Ma, X.; Tong, X.; Li, R. Improved Geometric Modeling of 1960s KH-5 ARGON Satellite Images for Regional Antarctica Applications. Photogramm. Eng. Remote Sens. 2017, 83, 477–491. [Google Scholar] [CrossRef]
- Mi, H.; Qiao, G.; Li, T.; Qiao, S. Declassified Historical Satellite Imagery from 1960s and Geometric Positioning Evaluation in Shanghai, China. In International Conference on Geo-Informatics in Resource Management and Sustainable Ecosystem; Springer: Berlin/Heidelberg, Germany, 2014; pp. 283–292. [Google Scholar]
- Fowler, M.J. The application of declassified KH-7 GAMBIT satellite photographs to studies of Cold War material culture: A case study from the former Soviet Union. Antiquity 2008, 82, 714–731. [Google Scholar] [CrossRef]
- Fowler, M.J. The archaeological potential of declassified HEXAGON KH-9 panoramic camera satellite photographs. AARG News 2016, 53, 30–36. [Google Scholar]
- Thapa, S.; Shrestha, A.; Lamichhane, S.; Adhikari, R.; Gautam, D. Catchment-scale flood hazard mapping and flood vulnerability analysis of residential buildings: The case of Khando River in eastern Nepal. J. Hydrol. Reg. Stud. 2020, 30, 100704. [Google Scholar] [CrossRef]
- Tavus, B.; Kocaman, S.; Nefeslioglu, H.A.; Gokceoglu, C. A fusion approach for flood mapping using Sentinel-1 and Sentinel-2 datasets. Int. Arch. Photogramm. Remote Sens. Spat. Inf. Sci. 2020, 43, 641–648. [Google Scholar] [CrossRef]
- Tripathi, G.; Pandey, A.C.; Parida, B.R.; Shakya, A. Comparative Flood Inundation Mapping Utilizing Multi-Temporal Optical and SAR Satellite Data over North Bihar Region: A Case Study of 2019 Flooding Event over North Bihar. In Spatial Information Science for Natural Resource Management; IGI Global: Hershey, PA, USA, 2020; pp. 149–168. [Google Scholar]
- Bhatta, B.; Shrestha, S.; Shrestha, P.K.; Talchabhadel, R. Modelling the impact of past and future climate scenarios on streamflow in a highly mountainous watershed: A case study in the West Seti River Basin, Nepal. Sci. Total Environ. 2020, 740, 140156. [Google Scholar] [CrossRef]
- Ur, J. Spying on the past: Declassified intelligence satellite photographs and near eastern landscapes. Near East. Archaeol. 2013, 76, 28–36. [Google Scholar] [CrossRef] [Green Version]
- Woodcock, C.E.; Allen, R.; Anderson, M.; Belward, A.; Bindschadler, R.; Cohen, W.; Gao, F.; Goward, S.N.; Helder, D.; Helmer, E.; et al. Free access to Landsat imagery. Science 2008, 320, 1011. [Google Scholar] [CrossRef]
- Goward, S.; Arvidson, T.; Williams, D.; Faundeen, J.; Irons, J.; Franks, S. Historical record of Landsat global coverage. Photogramm. Eng. Remote Sens. 2006, 72, 1155–1169. [Google Scholar] [CrossRef]
- Aschbacher, J. ESA’s earth observation strategy and Copernicus. In Satellite Earth Observations and Their Impact on Society and Policy; Springer: Singapore, 2017; pp. 81–86. [Google Scholar]
- Abrams, M.; Tsu, H.; Hulley, G.; Iwao, K.; Pieri, D.; Cudahy, T.; Kargel, J. The advanced spaceborne thermal emission and reflection radiometer (ASTER) after fifteen years: Review of global products. Int. J. Appl. Earth Obs. Geoinf. 2015, 38, 292–301. [Google Scholar] [CrossRef]
- Hu, Z.; Peng, J.; Hou, Y.; Shan, J. Evaluation of recently released open global digital elevation models of Hubei, China. Remote Sens. 2017, 9, 262. [Google Scholar] [CrossRef] [Green Version]
- Toutin, T. ASTER DEMs for geomatic and geoscientific applications: A review. Int. J. Remote Sens. 2008, 29, 1855–1875. [Google Scholar] [CrossRef] [Green Version]
- Akbari, A.; Ramli, N.I.B.; Kong, N.S. Application of public domain satellite-based DEMs in natural hazard modeling. Int. J. Environ. Sci. Dev. 2016, 7, 140. [Google Scholar] [CrossRef] [Green Version]
- NASA. NASA Shuttle Radar Topography Mission Global 1 Arc Second. 2020. Available online: http://cgiarcsi.community/data/srtm-90m-digital-elevation-database-v4-1/ (accessed on 20 July 2020).
- Sampson, C.C.; Smith, A.M.; Bates, P.D.; Neal, J.C.; Trigg, M.A. Perspectives on open access high resolution digital elevation models to produce global flood hazard layers. Front. Earth Sci. 2016, 3, 85. [Google Scholar] [CrossRef] [Green Version]
- Sampson, C.C.; Smith, A.M.; Bates, P.D.; Neal, J.C.; Alfieri, L.; Freer, J.E. A high-resolution global flood hazard model. Water Resour. Res. 2015, 51, 7358–7381. [Google Scholar] [CrossRef] [Green Version]
- Rignot, E. Changes in West Antarctic ice stream dynamics observed with ALOS PALSAR data. Geophys. Res. Lett. 2008, 35, L12505. [Google Scholar] [CrossRef] [Green Version]
- Watson, C.S.; Kargel, J.S.; Tiruwa, B. UAV-derived Himalayan topography: Hazard assessments and comparison with global dem products. Drones 2019, 3, 18. [Google Scholar] [CrossRef] [Green Version]
- Chen, H.; Liang, Q.; Zhao, J.; Xia, X. High-resolution glacial lake outburst flood impact evaluation using high-performance hydrodynamic modelling and open-source data. In EGU General Assembly Conference Abstracts; EGU: Vienna, Austria, 2020; p. 3714. [Google Scholar]
- Rai, R.K.; van den Homberg, M.J.; Ghimire, G.P.; McQuistan, C. Cost-benefit analysis of flood early warning system in the Karnali River Basin of Nepal. Int. J. Disaster Risk Reduct. 2020, 47, 101534. [Google Scholar] [CrossRef]
- Uddin, K.; Matin, M.A.; Meyer, F.J. Operational flood mapping using multi-temporal sentinel-1 SAR images: A case study from Bangladesh. Remote Sens. 2019, 11, 1581. [Google Scholar] [CrossRef]
- Li, Y.; Martinis, S.; Plank, S.; Ludwig, R. An automatic change detection approach for rapid flood mapping in Sentinel-1 SAR data. Int. J. Appl. Earth Obs. Geoinf. 2018, 73, 123–135. [Google Scholar] [CrossRef]
- Shen, X.; Anagnostou, E.N.; Allen, G.H.; Brakenridge, G.R.; Kettner, A.J. Near-real-time non-obstructed flood inundation mapping using synthetic aperture radar. Remote Sens. Environ. 2019, 221, 302–315. [Google Scholar] [CrossRef]
- Sun, Q.; Miao, C.; Duan, Q.; Ashouri, H.; Sorooshian, S.; Hsu, K.L. A review of global precipitation data sets: Data sources, estimation, and intercomparisons. Rev. Geophys. 2018, 56, 79–107. [Google Scholar] [CrossRef] [Green Version]
- Harris, A.; Rahman, S.; Hossain, F.; Yarborough, L.; Bagtzoglou, A.C.; Easson, G. Satellite-based flood modeling using TRMM-based rainfall products. Sensors 2007, 7, 3416–3427. [Google Scholar] [CrossRef] [Green Version]
- Ashouri, H.; Hsu, K.L.; Sorooshian, S.; Braithwaite, D.K.; Knapp, K.R.; Cecil, L.D.; Nelson, B.R.; Prat, O.P. PERSIANN-CDR: Daily precipitation climate data record from multisatellite observations for hydrological and climate studies. Bull. Am. Meteorol. Soc. 2015, 96, 69–83. [Google Scholar] [CrossRef] [Green Version]
- Joyce, R.J.; Janowiak, J.E.; Arkin, P.A.; Xie, P. CMORPH: A method that produces global precipitation estimates from passive microwave and infrared data at high spatial and temporal resolution. J. Hydromet. 2004, 5, 487–503. [Google Scholar] [CrossRef]
- Dennison, L.; Rana, P. Nepal’s Emerging Data Revolution; Background Paper; Development Initiatives: Kathmandu, Nepal, 2017; p. 26. [Google Scholar]
- Basnyat, D.B.; Shrestha, D.; Thapa, S.; Bajimaya, S.; Maharjan, M.; Shrestha, S.; Dhungana, S. Post-Flood Assessment of the 2019 Flooding in the Bagmati River Basin, Nepal. J. Dev. Innov. 2020, 4, 20–47. [Google Scholar]
- MoHA/GoN 2020 Nepal Disaster Risk Reduction Portal. Ministry of Home Affairs, Government of Nepal. Available online: http://www.drrportal.gov.np/ (accessed on 20 October 2021).
- Rimal, B.; Baral, H.; Stork, N.E.; Paudyal, K.; Rijal, S. Growing city and rapid land use transition: Assessing multiple hazards and risks in the Pokhara Valley, Nepal. Land 2015, 4, 957–978. [Google Scholar] [CrossRef] [Green Version]
- Bajracharya, S.R.; Shrestha, M.S.; Shrestha, A.B. Assessment of high-resolution satellite rainfall estimation products in a streamflow model for flood prediction in the Bagmati basin, Nepal. J. Flood Risk Manag. 2017, 10, 5–16. [Google Scholar] [CrossRef]
- Rijal, S.; Rimal, B.; Sloan, S. Flood hazard mapping of a rapidly urbanizing city in the foothills (Birendranagar, Surkhet) of Nepal. Land 2018, 7, 60. [Google Scholar] [CrossRef] [Green Version]
- Currion, P.; Silva, C.D.; Van de Walle, B. Open source software for disaster management. Commun. ACM 2007, 50, 61–65. [Google Scholar] [CrossRef]
- Careem, M.; Bitner, D.; Silva, R. GIS integration in the Sahana disaster management system. In Proceedings of the International Conference on Information Systems for Crisis Response and Management, Delft, The Netherlands, 13–16 May 2007; p. 14. [Google Scholar]
- MoALD. Nepal Agriculture Management Information System. 2020. Available online: www.namis.gov.np (accessed on 26 September 2020).
- Regmi, S.; Shrestha, G.; Baral, B.R.; Rajbhandari, B.P. Adoption of climate smart agricultural technologies: Impact of agriculture management information system on rice production in Banke District, Nepal. J. Nep. Agric. Res. 2018, 17, 141. [Google Scholar]
- Shrestha, R.K.; Shrestha, R. Group segmentation and heterogeneity in the choice of cooking fuels in post-earthquake Nepal. arXiv 2020, arXiv:2005.09616. [Google Scholar]
- Olaniyan, F.A.; Adelekan, I.O.N.; Okocha, E.E. The Role of Local Governments in Reducing Disaster Losses and Vulnerabilities in Ibadan City, Nigeria; Working Paper; Urban Africa Risk Knowledge, UK Department for International Development and the Economic and Social Research Council: London, UK, 2020. [Google Scholar]
- Haklay, M.; Weber, P. Open Street map: User-generated Street maps. IEEE Pervasive Comput. 2008, 7, 12–18. [Google Scholar] [CrossRef] [Green Version]
- Chereni, S.; Sliuzas, R.V.; Flacke, J.; Maarseveen, M.V. The influence of governance rearrangements on flood risk management in Kampala, Uganda. Environ. Policy Gov. 2020, 30, 151–163. [Google Scholar] [CrossRef] [Green Version]
- Tiwari, K.R.; Awasthi, K.D.; Balla, M.K.; Sitaula, B.K. Local People’s Perception on Climate Change, Its Impact and Adaptation Practices in Himalaya to Terai Regions of Nepal; Nepal Study Center, University of New Mexico: Albuquerque, NM, USA, 2010. [Google Scholar]
- Trabucco, A.; Zomer, R.J. Global aridity index and potential evapotranspiration (ET0) climate database v2. CGIAR Consort Spat Inf. 2018, 10, m9. [Google Scholar]
- Kaushik, P.; Ghosh, P. 3D DEM delineation of Chambal River basin from SRTM data using remote sensing and GIS technology. Int. J. Remote Sens. Geosci. 2015, 4, 1–6. [Google Scholar]
- Gorokhovich, Y.; Voustianiouk, A. Accuracy assessment of the processed SRTM-based elevation data by CGIAR using field data from USA and Thailand and its relation to the terrain characteristics. Remote Sens. Environ. 2006, 104, 409–415. [Google Scholar] [CrossRef]
- Peduzzi, P.; Herold, C.; Mouton, F.; Dao, H.; Gregory, G.; Chatenoux, B. Global Human Exposure to Flood Hazard, Preview Global Risk Data Platform; UNEP/GRID-Geneva: Geneva, Switzerland, 2011. [Google Scholar]
- McGlade, J.; Bankoff, G.; Abrahams, J.; Cooper-Knock, S.J.; Cotecchia, F.; Desanker, P.; Erian, W.; Gencer, E.; Gibson, L.; Girgin, S.; et al. Global Assessment Report on Disaster Risk Reduction 2019; UN Office for Disaster Risk Reduction (UNDRR): Geneva, Switzerland, 2019. [Google Scholar]
- Tatem, A.J. WorldPop, open data for spatial demography. Sci. Data 2017, 4, 170004. [Google Scholar] [CrossRef]
- Roser, M.; Ortiz-Ospina, E. Our World in Data: Global Extreme Poverty; University of Oxford Martin School: Oxford, UK, 2013. [Google Scholar]
- Rashid, K. Flood Hazard Mapping for the Humanitarian Sector: An Opinion Piece on Needs and Views. In Global Flood Hazard: Applications in Modeling, Mapping, and Forecasting; Wiley: New York, NY, USA, 2018; pp. 115–130. [Google Scholar]
- Ahmed, B.; Rahman, M.S.; Sammonds, P.; Islam, R.; Uddin, K. Application of geospatial technologies in developing a dynamic landslide early warning system in a humanitarian context: The Rohingya refugee crisis in Cox’s Bazar, Bangladesh. Geomat. Nat. Hazards Risk 2020, 11, 446–468. [Google Scholar] [CrossRef]
- Bajracharya, R.; Khatiwada, A. Standardization of Risk Information Components on BIPAD; Youth Innovation Lab: Kathmandu, Nepal, 2020. [Google Scholar]
- Klaver, J.M.; Fosnight, E.A.; Singh, A. Global Forest Fire Watch: Wildfire Potential, Detection Monitoring and Assessment. In Proceedings of the First International Conference on Geospatial Information in Agriculture and Forestry, Lake Buena Vista, FL, USA, 1–3 June 1997. [Google Scholar]
- Stanojevic, Z.; Lee, P.G.; Gysbers, J.D. Recent Anthropogenic Changes within the Northern Boreal, Southern Taiga, and Hudson Plains Ecozones of Québec: A Global Forest Watch Canada Report; Global Forest Watch Canada: Edmonton, AB, Canada, 2006. [Google Scholar]
- Gaume, E.; Borga, M.; Llassat, M.C.; Maouche, S.; Lang, M.; Diakakis, M. Mediterranean Extreme Floods and Flash Floods. In The Mediterranean Region under Climate Change. A Sciencific Update; IRD Editions: Marseille, France, 2016; pp. 133–144. [Google Scholar]
- Michael, A.W.; Nicholas, C.C.; David, P.R.; Joanne, C.W.; Hermosilla, T. Land cover 2.0. Int. J. Remote Sens. 2018, 39, 4254–4284. [Google Scholar] [CrossRef] [Green Version]
- Brown, J.; Loveland, T.; Ohlen, D. The global land-cover characteristics database: The users’ perspective. Photogramm. Eng. Remote Sens. 1999, 65, 1069–1074. [Google Scholar]
- Nguyen, P.; Shearer, E.J.; Tran, H.; Ombadi, M.; Hayatbini, N.; Palacios, T.; Huynh, P.; Updegraff, G.; Hsu, K.; Kuligowski, B.; et al. The CHRS Data Portal, an easily accessible public repository for PERSIANN global satellite precipitation data. Sci. Data 2019, 6, 180296. [Google Scholar] [CrossRef] [Green Version]
- Kleist, D.; Parrish, D.; Derber, J.; Treadon, R.; Wu, W.; Lord, S. Introduction of the GSI into the NCEP Global Data Assimilation system. Weather Forecast. 2009, 24, 1691–1705. [Google Scholar] [CrossRef] [Green Version]
- Wei, Q.; Chi, Z.; Guangtao, F.; Huicheng, Z. Global Land Data Assimilation System data assessment using a distributed biosphere hydrological model. J. Hydrol. 2015, 528, 652–667. [Google Scholar] [CrossRef]
- Anees, M.T.; Abdullah, K.; Nordin, M.N.M.; Ab Rahman, N.N.N.; Syakir, M.I.; Kadir, M.O.A. One-and Two-Dimensional Hydrological Modelling and Their Uncertainties. Flood Risk Manag. 2017, 11, 221–244. [Google Scholar]
- Costabile, P.; Macchione, F.; Natale, L.; Petaccia, G. Flood mapping using LIDAR DEM. Limitations of the 1-D modeling highlighted by the 2-D approach. Nat. Hazards 2015, 77, 181–204. [Google Scholar] [CrossRef]
- Di Baldassarre, G.; Schumann, G.; Bates, P.D.; Freer, J.E.; Beven, K.J. Flood-Plain Mapping: A Critical Discussion of Deterministic and Probabilistic Approaches. Hydrol. Sci. J. 2010, 55, 364–376. [Google Scholar] [CrossRef]
- Apel, H.; Thieken, A.H.; Merz, B.; Blöschl, G. A Probabilistic Modelling System for Assessing Flood Risks. Nat. Hazards 2006, 38, 79–100. [Google Scholar] [CrossRef]
- Apel, H.; Aronica, G.T.; Kreibich, H.; Thieken, A.H. Flood Risk Analyses—How Detailed Do We Need to Be? Nat. Hazards 2009, 49, 79–98. [Google Scholar] [CrossRef]
- El-Naqa, A.; Jaber, M. Floodplain Analysis using ArcGIS, HEC-GeoRAS and HEC-RAS in Attarat Um Al-Ghudran Oil Shale Concession Area, Jordan. Int. J. Civ. Environ. Eng. 2018, 8, 1–11. [Google Scholar] [CrossRef]
- Pandey, P.; Dugar, S. Flood Hazard mapping in an urban context: A case study of Hanumante stream, Bhaktapur (Nepal). In Proceedings of the IOE Graduate Conference, Kathmandu, Nepal, 24–25 May 2019; Volume 6, pp. 435–444. [Google Scholar]
- Koneti, S.; Sunkara, S.L.; Roy, P.S. Hydrological modeling with respect to impact of land-use and land-cover change on the runoff dynamics in Godavari River Basin using the HEC-HMS model. ISPRS Int. J. Geo-Inform. 2018, 7, 206. [Google Scholar] [CrossRef] [Green Version]
- Younis, S.M.Z.; Ammar, A. Quantification of impact of changes in land use-land cover on hydrology in the upper Indus Basin, Pakistan. Egypt. J. Remote Sens. Space Sci. 2018, 21, 255–263. [Google Scholar] [CrossRef]
- Geng, X.; Wang, X.; Yan, H.; Zhang, Q.; Jin, G. Land Use/Land cover change induced impacts on water supply service in the Upper Reach of Heihe River Basin. Sustainability 2014, 7, 336–383. [Google Scholar] [CrossRef] [Green Version]
- Li, S.; Yang, H.; Lacayo, M.; Liu, J.; Lei, G. Impacts of land-use and land-cover changes on water yield: A case study in Jing-Jin-Ji China. Sustainability 2018, 10, 960. [Google Scholar] [CrossRef] [Green Version]
- Garg, V.; Prasun, S.P.A.; Bhaskar, K.G. Assessment of land use land cover change impact on hydrological regime of a basin. Environ. Earth Sci. 2017, 76, 2233–2240. [Google Scholar] [CrossRef]
- Kumar, L.; Mutanga, O. Google Earth Engine applications since inception: Usage, trends, and potential. Remote Sens. 2018, 10, 1509. [Google Scholar] [CrossRef]
- Li, F.; Zhang, G.; Li, H.; Lu, W. Land use change impacts on hydrology in the Nenjiang River Basin Northeast China. Forest 2019, 10, 476. [Google Scholar] [CrossRef] [Green Version]
- Munoth, P.; Goyal, R. Impacts of land use land cover change on runoff and sediment yield of Upper Tapi River Sub-Basin India. Int. J. River Basin Manag. 2020, 18, 177–189. [Google Scholar] [CrossRef]
- Stehr, A.; Debels, P.; Romero, F.; Stehr, A.; Debels, P.; Romero, F. Hydrological modelling with SWAT under conditions of limited data availability: Evaluation of results from a Chilean case study Hydrological modelling with SWAT under conditions of limited data availability: Evaluation of results from a Chilean case study. Hydrol. Sci. J. 2008, 53, 3588–3601. [Google Scholar] [CrossRef]
- Gassman, P.W.; Reyes, M.R.; Green, C.H.; Arnold, J.G. The soil and water assessment tool: Historical development. Appl. Future Res. Dir. 2007, 50, 1211–1250. [Google Scholar]
- Brunner, G.W. HEC-RAS River Analysis System User’s Manual Version 4.1; USACE Hydrologic Engineering Center: Washington DC, USA, 2010. [Google Scholar]
- Devkota, R.; Bhattarai, U.; Devkota, L.; Maraseni, T.N. Assessing the past and adapting to future floods: A hydro-social analysis. Clim. Chang. 2020, 163, 1065–1082. [Google Scholar] [CrossRef]
- Sheikh, V.; Visser, S.; Stroosnijder, L. A simple model to predict soil moisture: Bridging Event and Continuous Hydrological (BEACH) modelling. Environ. Model. Softw. 2009, 24, 542–556. [Google Scholar] [CrossRef]
- Smith, R.E.; Goodrich, D.C.; Quinton, J.N. Dynamic, distributed simulation of watershed erosion: The KINEROS2 and EUROSEM models. J. Soil Water Conserv. 1995, 50, 517–520. [Google Scholar]
- Aziz, A.; Tanaka, S. Regional parameterization and applicability of Integrated Flood Analysis System (IFAS) for flood forecasting of upper-middle Indus River. Pak. J. Meteorol. 2011, 8, 21–38. [Google Scholar]
- Werner, M.; van Dijk, M.; Schellekens, J. DELFT-FEWS: An open shell flood forecasting system. Hydroinformatics, 2 (with CD-ROM); World Scientific Publishing: Hackensack, NJ, USA, 2004; pp. 1205–1212. [Google Scholar]
- VanDrie, R.; Milevski, P. ANUGA–Free & Open Source 2-D Hydrodynamic Model, with Hydrologic Capability. In H2009: 32nd Hydrology and Water Resources Symposium, Newcastle: Adapting to Change: Adapting to Change; Engineers Australia: Barton, ACT, Australia, 2009; pp. 1138–1149. [Google Scholar]
- Terink, W.; Lutz, A.F.; Simons, G.W.H.; Immerzeel, W.W.; Droogers, P. SPHY v2. 0: Spatial processes in hydrology. Geosci. Model Dev. 2015, 8, 2009–2034. [Google Scholar] [CrossRef] [Green Version]
- Khanal, S.; Lutz, A.F.; Kraaijenbrink, P.D.; van den Hurk, B.; Yao, T.; Immerzeel, W.W. Variable 21st century climate change response for rivers in High Mountain Asia at seasonal to decadal time scales. Water Resour. Res. 2021, 57, e2020WR029266. [Google Scholar] [CrossRef]
- Bhattarai, S.; Zhou, Y.; Shakya, N.M.; Zhao, C. Hydrological modelling and climate change impact assessment using HBV light model: A case study of Narayani River Basin, Nepal. Nat. Environ. Pollut. Technol. 2018, 17, 691–702. [Google Scholar]
- Shiwakoti, S. Hydrological modeling and climate change impact assessment using HBV light model: A case study of Karnali River basin. Iran. J. Energy Environ. 2017, 8, 296–304. [Google Scholar]
- Thapa, B.R.; Ishidaira, H.; Pandey, V.P.; Shakya, N.M. A multi-model approach for analyzing water balance dynamics in Kathmandu Valley, Nepal. J. Hydrol. Reg. Stud. 2017, 9, 149–162. [Google Scholar] [CrossRef]
- Beven, K.; Freer, J. A dynamic topmodel. Hydrol. Process. 2001, 15, 1993–2011. [Google Scholar] [CrossRef]
- Niu, G.Y.; Yang, Z.L.; Dickinson, R.E.; Gulden, L.E. A simple TOPMODEL-based runoff parameterization (SIMTOP) for use in global climate models. J. Geophys. Res. Atmos. 2005, 110. [Google Scholar] [CrossRef]
- Shrestha, S.; Bastola, S.; Babel, M.S.; Dulal, K.N.; Magome, J.; Hapuarachchi, H.A.P.; Takeuchi, K. The assessment of spatial and temporal transferability of a physically based distributed hydrological model parameters in different physiographic regions of Nepal. J. Hydrol. 2007, 347, 153–172. [Google Scholar] [CrossRef]
- Park, D.; Markus, M. Analysis of a changing hydrologic flood regime using the Variable Infiltration Capacity model. J. Hydrol. 2014, 515, 267–280. [Google Scholar] [CrossRef]
- Giuliani, G.; Peduzzi, P. The Preview Global Risk Data Platform: A geoportal to serve and share global data on risk to natural hazards. Nat. Hazards Earth Syst. Sci. 2011, 11, 53–66. [Google Scholar] [CrossRef] [Green Version]
- Carreño, M.L.; Cardona, O.D.; Barbat, A.H. A disaster risk management performance index. Nat. Hazards 2015, 41, 1–20. [Google Scholar] [CrossRef]
- DeGroeve, T.; Poljansek, K.; Vernaccini, L. Index for risk management-INFORM. JRC Sci. Policy Rep.—Eur. Commun. 2007, 96, 636388. [Google Scholar]
- Koudogbo, F.N.; Duro, J.; Rossi, L.; Rudari, R.; Eddy, A. Multi-hazard risk analysis using the FP7 RASOR Platform. In Remote Sensing for Agriculture, Ecosystems, and Hydrology XVI; International Society for Optics and Photonics: Bellingham, WA, USA, 2014; Volume 9239, p. 92390J. [Google Scholar]
- Huber, M.; Wessel, B.; Wendleder, A.; Hoffmann, J.; Roth, A. A framework for an automatical editing of TanDEM-X digital elevation models. In Proceedings of the 2015 IEEE International Geoscience and Remote Sensing Symposium (IGARSS), Milano, Italy, 26–31 July 2015; pp. 3826–3829. [Google Scholar]
- Rudari, R. 2015 RASOR Project: Rapid Analysis and Spatialisation of Risk, from Hazard to Risk Using EO Data; EGUGA: Vienna, Austria, 2015; p. 2538. [Google Scholar]
- Beckers, J.; Buckman, L.; Bachmann, D.; Visser, M.; Tollenaar, D.; Vatvani, D.; Goorden, N. RASOR Flood Modelling; EGUGA: Vienna, Austria, 2015; p. 10082. [Google Scholar]
- Pagani, M.; Monelli, D.; Weatherill, G.; Danciu, L.; Crowley, H.; Silva, V.; Simionato, M. OpenQuake engine: An open hazard (and risk) software for the global earthquake model. Seismol. Res. Lett. 2014, 85, 692–702. [Google Scholar] [CrossRef] [Green Version]
- Silva, V.; Crowley, H.; Pagani, M.; Monelli, D.; Pinho, R. Development of the OpenQuake engine, the Global Earthquake Model’s open-source software for seismic risk assessment. Nat. Hazards 2014, 72, 1409–1427. [Google Scholar] [CrossRef]
- Allen, T.I.; Halchuk, S.; Adams, J.; Weatherill, G.A. Forensic PSHA: Benchmarking Canada’s Fifth Generation seismic hazard model using the OpenQuake-engine. Earthq. Spectra 2020, 36, 91–111. [Google Scholar] [CrossRef]
- Cardona, O.D.; Ordaz Schroder, M.G.; Reinoso, E.; Yamín, L.; Barbat, H.A. Comprehensive approach for probabilistic risk assessment (CAPRA): International initiative for disaster risk management effectiveness. In Proceedings of the 14th European Conference on Earthquake Engineering, Ohrid, Macedonia, 30 August–3 September 2010; pp. 1–10. [Google Scholar]
- Martin, B.; Capra, M.; Van der Heide, G.; Stoneham, M.; Lucas, M. Are disaster management concepts relevant in developing countries? The case of the 1999–2000 Mozambican floods. Aust. J. Emerg. Manag. 2001, 16, 25. [Google Scholar]
- Hossain, M.S.; Gadagamma, C.K.; Bhattacharya, Y.; Numada, M.; Morimura, N.; Meguro, K. Integration of smart watch and Geographic Information System (GIS) to identify post-earthquake critical rescue area part. I. Development of the system. Progress. Disaster Sci. 2020, 7, 100116. [Google Scholar] [CrossRef]
- Wang, J.; Bu, K.; Yang, F.; Yuan, Y.; Wang, Y.; Han, X.; Wei, H. Disaster risk reduction knowledge service: A paradigm shift from disaster data towards knowledge services. Pure Appl. Geophys. 2020, 177, 135–148. [Google Scholar] [CrossRef]
- Karamouz, M.; Fereshtehpour, M.; Ahmadvand, F.; Zahmatkesh, Z. Coastal flood damage estimator: An alternative to FEMA’s HAZUS platform. J. Irrig. Drain. Eng.—ASCE 2016, 142, 04016016. [Google Scholar] [CrossRef]
- Yildirim, E.; Demir, I. An integrated web framework for HAZUS-MH flood loss estimation analysis. Nat. Hazards 2019, 99, 275–286. [Google Scholar] [CrossRef]
- Remo, J.W.; Pinter, N.; Mahgoub, M. Assessing Illinois’s flood vulnerability using Hazus-MH. Nat. Hazards 2016, 81, 265–287. [Google Scholar] [CrossRef]
- Hearn, P.P., Jr.; Longenecker, H.E.; Aguinaldo, J.J.; Rahav, A.N. Delivering integrated HAZUS-MH flood loss analyses and flood inundation maps over the Web. Int. J. Emerg. Manag. 2013, 11, 293–302. [Google Scholar] [CrossRef]
- Carby, B. Integrating disaster risk reduction in national development planning: Experience and challenges of Jamaica. Environ. Hazards 2018, 17, 219–233. [Google Scholar] [CrossRef]
- Faivre, N.; Sgobbi, A.; Happaerts, S.; Raynal, J.; Schmidt, L. Translating the Sendai Framework into action: The EU approach to ecosystem-based disaster risk reduction. Int. J. Disaster Risk Reduct. 2018, 32, 4–10. [Google Scholar] [CrossRef]
- Manley, M.; Hay, J.E.; Lal, P.; Bennett, C.; Chong, J.; Campbell, J.; Thorp, W. Research and Analysis on Climate Change and Disaster Risk Reduction; Working Paper 1: Needs, Priorities and Opportunities Related to Climate Change Adaptation and Disaster Risk Reduction; New Zealand Ministry of Foreign Affairs and Trade: Wellington, New Zealand, 2016. [Google Scholar]
- Bian, J.; Li, A.; Lei, G.; Zhang, Z.; Nan, X. Global high-resolution mountain green cover index mapping based on Landsat images and Google Earth Engine. ISPRS J. Photogramm. Remote Sens. 2020, 162, 63–76. [Google Scholar] [CrossRef]
- DeVries, B.; Huang, C.; Armston, J.; Huang, W.; Jones, J.W.; Lang, M.W. Rapid and robust monitoring of flood events using Sentinel-1 and Landsat data on the Google Earth Engine. Remote Sens. Environ. 2020, 240, 111664. [Google Scholar] [CrossRef]
- Tiwari, V.; Kumar, V.; Matin, M.A.; Thapa, A.; Ellenburg, W.L.; Gupta, N.; Thapa, S. Flood inundation mapping-Kerala 2018; Harnessing the power of SAR, automatic threshold detection method and Google Earth Engine. PLoS ONE 2020, 15, e0237324. [Google Scholar] [CrossRef]
- Gorelick, N.; Hancher, M.; Dixon, M.; Ilyushchenko, S.; Thau, D.; Moore, R. Google Earth Engine: Planetary-scale geospatial analysis for everyone. Remote Sens. Environ. 2017, 202, 18–27. [Google Scholar] [CrossRef]
- Chen, D.; Shams, S.; Carmona-Moreno, C.; Leone, A. Assessment of open source GIS software for water resources management in developing countries. J. Hydro-Environ. Res. 2010, 4, 253–264. [Google Scholar] [CrossRef]
- Cameron, C.; Madumere, C. Assessment of Open-source Software, Qgis, To Estimate Hurricane Matthew Flood Extent in Robeson County, North Carolina, Using Unsupervised Classification. Environ. Eng. Geosci. 2019, 25, 359–367. [Google Scholar] [CrossRef]
- Khatakho, R.; Gautam, D.; Aryal, K.R.; Pandey, V.P.; Rupakhety, R.; Lamichhane, S.; Liu, Y.-C.; Abdouli, K.; Talchabhadel, R.; Thapa, B.R.; et al. Multi-Hazard Risk Assessment of Kathmandu Valley, Nepal. Sustainability 2021, 13, 5369. [Google Scholar] [CrossRef]
- Siam, Z.S.; Hasan, R.T.; Anik, S.S.; Noor, F.; Adnan, M.S.G.; Rahman, R.M.; Dewan, A. National-Scale Flood Risk Assessment Using GIS and Remote Sensing-Based Hybridized Deep Neural Network and Fuzzy Analytic Hierarchy Process Models: A Case of Bangladesh. Geocarto Int. 2022, 1–30. [Google Scholar] [CrossRef]
- Grohmann, C.H. Morphometric analysis in geographic information systems: Applications of free software GRASS and R. Comput. Geosci. 2004, 30, 1055–1067. [Google Scholar] [CrossRef] [Green Version]
- Neteler, M.; Bowman, M.H.; Landa, M.; Metz, M. GRASS GIS: A multi-purpose open source GIS. Environ. Model. Softw. 2012, 31, 124–130. [Google Scholar] [CrossRef] [Green Version]
- Abera, W.; Antonello, A.; Franceschi, S.; Formetta, G.; Rigon, R. The uDig Spatial Toolbox for hydro-geomorphic analysis. In Geomorphological Techniques; British Society for Geomorphology: London, UK, 2014; Chapter 2, Section 4.1. [Google Scholar]
- Xia, D.; Xie, X.; Xu, Y. Web GIS server solutions using open-source software. In Proceedings of the 2009 IEEE International Workshop on Open-Source Software for Scientific Computation (OSSC), Guiyang, China, 18–20 September 2009; pp. 135–138. [Google Scholar]
- Han, P.; Li, Y.; Wang, Y.; Li, L.; Ma, H.; Wang, J. Designing, Analysis and Implementation of Open-source Visualization System for High-Definition Remote Sensing Data Processing. In Proceedings of the 2020 Chinese Control and Decision Conference (CCDC), Hefei, China, 22–24 August 2020; pp. 5011–5015. [Google Scholar]
- Feloni, E.; Mousadis, I.; Baltas, E. Flood vulnerability assessment using a GIS-based multi-criteria approach—The case of Attica region. J. Flood Risk Manag. 2020, 13, e12563. [Google Scholar] [CrossRef] [Green Version]
- Boudani, M.R.; Mazour, M.; Djoukbala, O.; Mazighi, H. Development of a minimalist conceptual numerical model for flood forecasting and management under GIS environment. J. Water Clim. Chang. 2020, 11, 359–386. [Google Scholar] [CrossRef] [Green Version]
- García-Rivero, A.E.; Olivera, J.; Salinas, E.; Yuli, R.A.; Bulege, W. Use of hydrogeomorphic indexes in SAGA-GIS for the characterization of flooded areas in Madre de Dios, Peru. Int. J. Appl. Eng. Res. 2017, 12, 9078–9086. [Google Scholar]
- Konstantinos, P.; Elena, T.; Carmen, M.; Ozgur, K.; Hafzullah, A. Towards Flash Flood Disaster Prevention: The SciNetNat Haz Proposal; EGUGA: Vienna, Austria, 2015; p. 15176. [Google Scholar]
- Ishaya, S.; Ifatimehin, O.O.; Abaje, I.B. Mapping flood vulnerable areas in a developing urban centre of Nigeria. J. Sustain. Dev. Afr. 2009, 11, 180–194. [Google Scholar]
- Khanal, N.R.; Shrestha, M.; Ghimire, M. Preparing for Flood Disaster: Mapping and Assessing Hazard in the Ratu Watershed, Nepal; International Centre for Integrated Mountain Development (ICIMOD): Patan, Nepal, 2007. [Google Scholar]
- Muhammed, I.; Sarkinzango, I.; Aliyu, A. Application of Geographic Information System in Flood Control at Yolde Pate, Yola Adamawa State. ATBU J. Sci. Technol. Educ. 2014, 1, 23–30. [Google Scholar]
- Gautam, D.K.; Kharbuja, R.G. Flood hazard mapping of Bagmati River in Kathmandu valley using geo-informatics tools. J. Hydrol. Meteorol. 2006, 3, 1–9. [Google Scholar]
- Almousawi, D.; Almedeij, J.; Alsumaiei, A.A. Impact of urbanization on desert flash flood generation. Arab. J. Geosci. 2020, 13, 441. [Google Scholar] [CrossRef]
- Chaibandit, K.; Konyai, S. Flood routing in reservoirs using synthetic unit hydrograph: The case of Bung Takreng Reservoir in Yom Basin, Thailand. In Advanced Materials Research; Trans Tech Publications Ltd.: Bäch, Switzerland, 2014; Volume 931, pp. 818–822. [Google Scholar]
- Maathuis, B.H.P.; Van Westen, C.J. Flood hazard analysis using multi-temporal SPOT-XS imagery. In ILWIS Application Guide; International Institute for Aerospace Survey and Earth Sciences (ITC): Enschede, The Netherlands, 2005; pp. 19–28. [Google Scholar]
- Castillo-Rodríguez, J.T.; Escuder Bueno, I.; Perales Momparler, S.; Porta-Sancho, J.R. Enhancing local action planning through quantitative flood risk analysis: A case study in Spain. Nat. Hazards Earth Syst. Sci. 2016, 16, 1699–1718. [Google Scholar] [CrossRef] [Green Version]
- Bhatt, C.M.; Karnatak, H.C. Geoweb Services and Open Online Data Repositories for North West Himalayas Studies Including Disaster Monitoring and Mitigation. In Remote Sensing of Northwest Himalayan Ecosystems; Springer: Singapore, 2019; pp. 501–536. [Google Scholar]
- Rediske, G.; Siluk, J.C.M.; Michels, L.; Rigo, P.D.; Rosa, C.B.; Cugler, G. Multi-criteria decision-making model for assessment of large photovoltaic farms in Brazil. Energy 2020, 197, 117167. [Google Scholar] [CrossRef]
- Zhang, Q.; Wu, Z.; Zhang, H.; Dalla Fontana, G.; Tarolli, P. Identifying dominant factors of waterlogging events in metropolitan coastal cities: The case study of Guangzhou, China. J. Environ. Manag. 2020, 271, 110951. [Google Scholar] [CrossRef]
- Borden, K.A.; Cutter, S.L. Spatial patterns of natural hazards mortality in the United States. Int. J. Health Geogr. 2008, 7, 64. [Google Scholar] [CrossRef] [Green Version]
- Borlongan, N.J.B.; Roel, M.; Olfindo, N.T., Jr.; Perez, A.M.C. Automation of lidar-based hydrologic feature extraction workflows using GIS. In Earth Resources and Environmental Remote Sensing/GIS Applications VII; International Society for Optics and Photonics: Bellingham, WA, USA, 2016; Volume 10005, p. 100050W. [Google Scholar]
- Prizzia, R. The Role of GIS in Emergency Management; University of Hawaii-West Oahu in Pearl City: Kapolei, HI, USA, 2009. [Google Scholar]
- Guo, X.Q.; Hao, W.T.; LI, X. Based on the airborne LIDAR technology research and its prospect. Geomat. Spat. Inf. Technol. 2013, 21. [Google Scholar]
- Guo, J.; Wu, X.; Wei, G. A new economic loss assessment system for urban severe rainfall and flooding disasters based on big data fusion. Environ. Res. 2020, 188, 109822. [Google Scholar] [CrossRef]
- Rutagengwa, J.D.; Nahayo, L.; Philbert, M.; Yambabariye, E.; Nsanzabaganwa, J. Spatial Analysis of Flood Hazard for the Risk Reduction in Rwanda. J. Environ. Prot. Sustain. Dev. 2020, 6, 57–65. [Google Scholar]
- Mohd, A.M.N.; Kamal, R.M.; Abdul, M.M.; Ismail, H. Projected Streamflow in the Kurau River Basin of Western Malaysia under Future Climate Scenarios. Sci. Rep. 2020, 10, 8336. [Google Scholar]
- Perdikaki, M.; Manjarrez, R.C.; Pouliaris, C.; Rossetto, R.; Kallioras, A. Free and open-source GIS-integrated hydrogeological analysis tool: An application for coastal aquifer systems. Environ. Earth Sci. 2020, 79, 348. [Google Scholar] [CrossRef]
- Criollo, R.; Velasco, V.; Nardi, A.; De Vries, L.M.; Riera, C.; Scheiber, L.; Vázquez-Suñé, E. AkvaGIS: An open source tool for water quantity and quality management. Comput. Geosci. 2019, 127, 123–132. [Google Scholar] [CrossRef]
- Slater, L.J.; Thirel, G.; Harrigan, S.; Delaigue, O.; Hurley, A.; Khouakhi, A.; Prosdocimi, I.; Vitolo, C.; Smith, K. Using R in hydrology: A review of recent developments and future directions. Hydrol. Earth Syst. Sci. 2019, 23, 2939–2963. [Google Scholar] [CrossRef] [Green Version]
- Albano, R.; Mancusi, L.; Sole, A.; Adamowski, J. FloodRisk: A collaborative, free and open-source software for flood risk analysis. Geomat. Nat. Hazards Risk 2017, 8, 1812–1832. [Google Scholar] [CrossRef] [Green Version]
- Clewley, D.; Bunting, P.; Shepherd, J.; Gillingham, S.; Flood, N.; Dymond, J.; Lucas, R.; Armston, J.; Moghaddam, M. A python-based open source system for geographic object-based image analysis (GEOBIA) utilizing raster attribute tables. Remote Sens. 2014, 6, 6111–6135. [Google Scholar] [CrossRef] [Green Version]
- Pimentel, J.F.; Murta, L.; Braganholo, V.; Freire, J. A large-scale study about quality and reproducibility of jupyter notebooks. In Proceedings of the 2019 IEEE/ACM 16th International Conference on Mining Software Repositories (MSR), Montreal, QC, Canada, 25–31 May 2019; pp. 507–517. [Google Scholar]
- Miles, S.B. Participatory disaster recovery simulation modeling for community resilience planning. Int. J. Disaster Risk Sci. 2018, 9, 519–529. [Google Scholar] [CrossRef] [Green Version]
- Samela, C.; Persiano, S.; Bagli, S.; Luzzi, V.; Mazzoli, P.; Humer, G.; Reithofer, A.; Essenfelder, A.; Amadio, M.; Mysiak, J.; et al. Safer_RAIN: A DEM-based hierarchical filling-&-Spilling algorithm for pluvial flood hazard assessment and mapping across large urban areas. Water 2020, 12, 1514. [Google Scholar]
- Vitolo, C.; Wells, P.; Dobias, M.; Buytaert, W. Fuse: An R package for ensemble Hydrological Modelling. J. Open Source Softw. 2016, 1, 52. [Google Scholar] [CrossRef]
- Hoch, J.M.; Trigg, M.A. Advancing Global Flood Hazard Simulations by Improving Comparability, Benchmarking, and Integration of Global Flood Models. Environ. Res. Lett. 2019, 14, 034001. [Google Scholar] [CrossRef]
- Chen, J.; Li, Q.; Wang, H.; Deng, M. A Machine Learning Ensemble Approach Based on Random Forest and Radial Basis Function Neural Network for Risk Evaluation of Regional Flood Disaster: A Case Study of the Yangtze River Delta, China. Int. J. Environ. Res. Public Health 2020, 17, 49. [Google Scholar] [CrossRef] [Green Version]
- Li, X.; Yan, D.; Wang, K.; Weng, B.; Qin, T.; Liu, S. Flood Risk Assessment of Global Watersheds Based on Multiple Machine Learning Models. Water 2019, 11, 1654. [Google Scholar] [CrossRef] [Green Version]
- Carozza, D.A.; Boudreault, M. A Global Flood Risk Modeling Framework Built with Climate Models and Machine Learning. J Adv. Model Earth Syst. 2021, 13, e2020MS002221. [Google Scholar] [CrossRef]
- UNSDR. Sendai Framework for Disaster Risk Reduction 2015–2030. UNISDR/GE/2015—ICLUX EN5000 1st Edition. 2015. Available online: https://www.preventionweb.net/files/43291_sendaiframeworkfordrren.pdf (accessed on 30 October 2020).
- Tariq, M.A.U.R.; Farooq, R.; van de Giesen, N. A critical review of flood risk management and the selection of suitable measures. Appl. Sci. 2020, 10, 8752. [Google Scholar] [CrossRef]
- Wang, X.; Xie, H. A review on applications of remote sensing and geographic information systems (GIS) in water resources and flood risk management. Water 2018, 10, 608. [Google Scholar] [CrossRef] [Green Version]
- Zuiderwijk, A.; Janssen, M. Open data policies, their implementation and impact: A framework for comparison. Gov. Inf. Q. 2014, 31, 17–29. [Google Scholar] [CrossRef] [Green Version]
- Notti, D.; Giordan, D.; Caló, F.; Pepe, A.; Zucca, F.; Galve, J.P. Potential and limitations of open satellite data for flood mapping. Remote Sens. 2018, 10, 1673. [Google Scholar] [CrossRef]


| Topic | Keywords/Search Strings Used | Percentage (%) of Articles |
|---|---|---|
| Flood | Flood Nepal, flood hazards, flood risk, flood vulnerability, hazards Nepal | 15 |
| Open data | Earth observation flood, free open data flood, open data flood risks, flood mapping, flood disasters, open GIS data Nepal, flood web-portal, Open data disasters Nepal | 32 |
| Analytical tools used in Nepal | flood analytical tools, open flood risk models, flood risk assessment, flood risk assessment model, flood modelling, flood hazard models, flood data analysis | 25 |
| Open computing resources | Open GIS software, Open computing source disaster, Open computing source flood, online platform, cloud computing, open computing in disaster, open-source software in disasters | 28 |
| Total | 100 |
| Satellite/Mission | Sensor | Sensor Type | Resolution (m) | Description | Reference(s) |
|---|---|---|---|---|---|
| Corona | KH-1, KH-2, KH-3, KH-4A/4B | Optical | High (~2) | Declassified; 1959 to 1972 | [34,35] |
| Argon | KH-5 | Optical | High (~2) | 1962 to 1964 | [36] |
| LANYARD | KH-6 | Optical | High (~2) | 1963 | [37] |
| GAMBIT 1 | KH-7 | Optical | High (~2) | 1963 to 1967 | [38] |
| GAMBIT 2 | KH-8 | Optical | High (~2) | 1966 to 1984 | [39] |
| Hexagon | KH-9 | Optical | High (~2) | 1971 to 1984 | [39] |
| Landsat | MSS, TM, ETM+, OLI | Optical | 15–60 | From 23 July 1972; 16 days | [1,10,40] |
| Sentinel | 2A, 2B | Optical | 10 | 5 days | [41] |
| Sentinel | 1A, 1B | Microwave (Synthetic Aperture Radar-SAR) | 5 × 20 | ESA | [42] |
| Terra | ASTER | Optical | 15 | Launched in 1999; On demand | [4] |
| Terra, Aqua | MODIS | Optical | 250–1000 | 1–2/day | [42,43] |
| DEM Name | Sensor | Resolution (m) | Data Source | Reference |
|---|---|---|---|---|
| SRTM (Shuttle Radar Topography Mission) | Released in 2003 | 30 (1 arc-second); 90 (3 arc-second) | USGS portal (NASA and NGA) www.earthexplorer.usgs.gov (accessed on 16 October 2021) | [22,52,53,54] |
| ASTER GDEM | Released in June 2009 | 30 | A product of NASA and METI (http://gdem.ersdac.jspacesystems.or.jp (accessed on 16 October 2021)) | [43,49] |
| ALOS PALSAR | ASF Data Search Vertex. PALSAR is the L-band SAR | 12.5 | ASF website (as of 18 September 2020) From 2006 to 2011 | [55] |
| The High Mountain Asia (HMA) DEMs (https://nsidc.org/data/highmountainasia (accessed on 16 October 2021) | Derived using stereo imagery from DigitalGlobe’s satellite constellation collected from 28 January 2002 to 24 November 2016 | 8 m (High Mountain Asia) | NSIDC DAAC 28 January 2002 to 24 November 2016 | [56] |
| SN | Data Source | Description | Data Types | Scale | Coverage | References |
|---|---|---|---|---|---|---|
| 1 | Nepal Disaster Risk Reduction Portal (http://drrportal.gov.np/ (accessed on 19 October 2021)) | National disaster management information system managed by Ministry of Home Affairs. Provides spatial data and information on all types of disaster all over Nepal with regular updates. | Disaster incident data from 2011 to present | National | Municipality | [67,68] |
| 2 | Central Bureau of Statistics (https://cbs.gov.np/home/ (accessed on 19 October 2021)) | Established in 1959 under the National Planning Commission Secretariat of Nepal. Generates socio-economic statistics through census and surveys. | Census data on population, social, cultural, economic, environment | National | Municipality | [4,69] |
| 3 | Department of Hydrology and Meteorology (https://www.dhm.gov.np/ (accessed on 19 October 2021)) | Established in 1988. Collects hydrological and meteorological data from all over Nepal. | Hydrological and meteorological data | Local | Station | [1,40,70] |
| 4 | Ministry of Home Affairs Nepal Government GEO-PORTAL (http://drm.moha.gov.no/ (accessed on 19 October 2021)) | Developed by Survey Department, Geographic Information Infrastructure Division (NGIID), GoN. Facilitates finding geospatial data and sharing in the country. | Raster and vector maps on disaster, elevation, administrative boundaries, drought, etc. | Local | Municipality | [21,71] |
| 5 | National Emergency Operation Center–SAHANA Disaster Management System (http://sahana.neoc.gov.np/sahana/default/index (accessed on 19 October 2021)) | Data management system under MoHA. The Emergency Operation Centers at district level and government authorities collect and send them information on disaster incidents, facilities available, and response. | Disaster incident data, facilities, and response data | National | Municipality | [72,73] |
| 6 | Nepal Agriculture Management Information System (NAMIS) (http://www.namis.gov.np/ (accessed on 19 October 2021)) | A project implemented by Ministry of Agriculture and Livestock Development under the component of building resilience to climate-related hazards. Focuses on obtaining agricultural data and timely delivery of agro climatic and weather information under early warning systems to farming communities. | Agricultural statistics on production, area, and yield. Weather and flood forecast data. Livestock population and products data from 2000 to 2014 | National | District | [74,75] |
| 7 | Open Data Nepal (http://opendatanepal.com/ (accessed on 19 October 2021)) | An initiative to make Nepal’s data accessible online and use, reuse, or redistribute as well as publish, explore, download, and utilize data making own visualizations. Consists of 627 datasets from 46 sources under various categories | Administrative boundaries shapefiles, rainfall and temperature data of 2014, agricultural statistics till 2016 and other livestock data, education, finance, geospatial, health, census, energy data, etc. | Local | Municipality | [40,66] |
| 8 | Nepal Map (http://nepalmap.org/ (accessed on 19 October 2021)) | A project of Code for Nepal which works to increase the use of open data in Nepal, providing easy access to data. It uses the National Data Profile, created by CBS and other official sources, to create user-friendly data visualizations on key demographic issues. | Demographics, agriculture, educational and household data | National | District | [66] |
| 9 | Nepal in Data (http://nepalindata.com/data/ (accessed on 25 July 2021)) | An open data portal, aimed to make development data and statistics on Nepal from 1950 to present available and accessible. Provides more than 4000 indicators divided over 12 sections covering various sectors including agriculture and land; energy and environment; economy, market, and finance; infrastructure, communication, and technology; state and politics; the sustainable development goals; etc. | Crop and livestock data, climate, disaster, energy, wildlife data, etc. | National | District | [66] |
| 10 | Open Nepal (http://opennepal.net/ (accessed on 20 October 2020)) | A knowledge hub to produce, share and use data and information for development. Consists of 311 datasets related to 19 sectors including agriculture, climate change, education, energy, geography, finance, etc. | Agriculture data on crops, fertilizers, seeds, etc.; demography data of 2011; rainfall data (2001–2012); disaster and loss data; land use pattern data for 2001; forest area cover percent from 1978 to 2005, etc. | National | District | [66] |
| 11 | Open earthquake data portal (http://eq2015.npc.gov.np/#/ (accessed on 25 July 2021)) | Developed by Kathmandu Living Labs with guidance from CBS and National Planning Commission. Consists of data on household survey between Jan 2016 to May 2016 in the 11 earthquake-affected districts. | CSV datasets on demographics, building structure, etc. | National | District | [76] |
| 12 | DesInventer (https://online.desinventer.org/desinventer/#NPL-DISASTER (accessed on 25 July 2021)) | Disaster Information Management System Project initiated by LA RED and hosted by UNDRR. It is a tool for generation of National Disaster Inventories and construction of databases of the effects of disaster. | Historic disasters data since 1971 | Local | Municipality | [21,77] |
| 13 | Open Street Map (https://www.openstreetmap.org (accessed on 20 October 2021)) | Built by a community of mappers that contribute and maintain data about roads, trails, buildings, etc. emphasizing local knowledge. | Datasets on building footprints and spatial layers of geographical objects, i.e., roads, rivers, health facilities, educational institutions, etc. | Local | Wards | [40,78] |
| 14 | World Bank (http://data.worldbank.org/ (accessed on 20 October 2021)) | Provides free and open access to global development data on 20 different indicators | Agriculture and rural development, climate change, education, health, environment, gender etc. | Regional | Country | [58,79] |
| 15 | UN Digital Repository (https://data.unorg/en/index.html (accessed on 20 October 2020)) | Launched in 2005. Maintained within Statistics Division of the Department of Economic and Social Affairs (UN DESA) of the UN Secretariat. Provides web-based data services to search and download varieties of statistical resources under themes including education, health, finance, agriculture, environment, etc. | Agriculture, education, energy, environment, finance, gender, health, population and migration, etc. | Global | Country | [80] |
| 16 | USGS Earth Explorer (https://earthexplorer.usgs.gov/ (accessed on 19 October 2021)) | USGS Earth Explorer is an online search, discovery, and ordering tool developed by the United States Geological Survey (USGS). The tool provides users the ability to query, search, and order raster images and cartographic products from several sources. | Satellite images aerial photographs, digital elevation model, land cover data, etc. | Global | Country | [4,10,20] |
| 17 | CGIAR-CSIGEOPORTAL (http://srtm.csi.cgiar.org/srtmdata/ (accessed on 19 October 2021)) | CGIAR Consortium for Spatial Information (CGIAR-CSI) is the geospatial science Community of Practice supported by the CGIAR Platform for Big Data in Agriculture that facilitates CGIAR’s use of geospatial data and analysis in research. | Digital Elevation Model | Global | Country | [81,82,83] |
| 18 | Global Risk Data Platform (https://preview.grid.unep.ch/index.php?preview=extract&cat=2&lang=eng (accessed on 20 October 2020)) | Developed as a support to the Global Risk Assessment Report on Disaster Risk Reduction (GAR). It shares spatial data information on global risk from natural hazards, which could include past hazardous events (human and economical hazard exposure, risk). | Data on tropical cyclones and related storm surges, drought, earthquakes, biomass, fires, floods, landslides, tsunamis, and volcanic eruptions. | Global | Country | [84,85] |
| 19 | World Pop (https://www.worldpop.org/geodata/summary?id=6314 (accessed on 20 October 2020)) | Produces different types of gridded population count databases with 100 m resolution from 2000 to 2020 allowing regional and national scales. | Geotiff data for Nepal population 2020. | Global | Country | [86] |
| 20 | Our World in Data (https://ourworldindata.org/country/nepal (accessed on 20 October 2020)) | Provides research and data on the world’s largest problems, such as poverty, disease, hunger, climate change etc. to make the knowledge of big problems accessible and understandable. | Demography, agriculture, natural disasters | Global | Country | [87] |
| 21 | Humanitarian Data Exchange (https://data.humdata.org/dataset/ (accessed on 20 October 2020)) | Repository maintained by UNOCHA, launched in 2014. Provides an open platform for sharing humanitarian data and use it for analysis. | Disasters and other humanitarian crisis data through raster data, shape files, and CSV datasets on earthquake. | Global | Country | [88,89] |
| 22 | BIPAD (https://bipad.gov.np (accessed on 20 October 2020)) | BIPAD is a comprehensive Disaster Information Management System (DIMS) initiative led by the Government of Nepal (GoN), Ministry of Home Affairs (MoHA), National Emergency Operation Centre (NEOC) with the technical support from Youth Innovation Lab. | Disaster incident data, disaster loss and damage data, real time data on rainfall, river water level, air quality, etc. | National | Municipality | [90] |
| 23 | ICIMOD Regional Database System (http://rds.icimod.org/Home/Data?any=nepal&Category=datasets&&page=2&&themekey=Nepal (accessed on 20 October 2020)) | Portal for data curation and dissemination providing easy access and download of curated datasets to the users. Consists various datasets for different thematic areas in the Hindu Kush Himalayan (HKH) region. | Landslides, floods, fire, incidents, glaciers, land cover, hazards, vulnerability, and risk indicator datasets | Local | District | [10,20] |
| 24 | Global Forest Watch Fires (https://fires.globalforestwatch.org/map/#activeLayers=viirsFires%2CactiveBasemap=topo&activeImagery=&planetCategory=PLANET-MONTHLY&planetPeriod=null&x=860154785&y=27.286056&z=7 (accessed on 20 October 2020)) | Online platform for monitoring forest and land fires using near real-time information through high resolution satellite imagery, detailed maps of land cover and other various data to track fire activity and related impacts. | Time series data of fire with forest loss and tree cover loss or gain data from 2001 to present. | Country and regional | Country | [91,92] |
| 25 | EMDAT- The international disaster database (http://www.emdat.be/ (accessed on 20 October 2020)) | Emergency events database maintained by Centre for Research on the Epidemiology of Disasters (CRED). Contains database compiled from various sources including UN agencies, NGOs, research institutes etc. on the occurrence and effects of over 18,000 mass disasters in the world from 1900 to present. | Disaster data with human, economic, sectorial, and infrastructural impact | Global | National and international | [15,61,93] |
| 26 | Global Land Cover Characteristics Database-USGS (http://glcfapp.glcf.umd.edu/data/landcover/ (accessed on 20 October 2020)) | A global land-cover characteristics database developed by the U.S. Geological Survey and available since mid-1997. Generates a 1-km resolution global land cover characteristics data for use in a wide range of environmental research and modeling applications. | Land cover classification datasets | Global | Wards | [70,94,95] |
| 27 | Center for Hydrometeorology and Remote Sensing, University of California (http://chrsdata.eng.uci.edu/ (accessed on 20 October 2020)) | The Center aims to advance the knowledge of the water and energy cycles at scales ranging from local watersheds to continental basins. Contains open-source software, real time monitoring tools, hydrologic models, mesoscale models, and data, etc. | PERSIANN global satellite precipitation data from 2000 to present | Regional, National and Global | District | [4,64,96] |
| 28 | Food and Agriculture Organization–Geonetwork (http://www.fao.org/geonetwork/srv/en/main.home (accessed on 20 October 2020)) | Repository that provides access to interactive maps, satellite imagery, GIS datasets and related applications maintained by FAO and its partners. | Spatial datasets on agriculture, climate, topography, soil etc. | Global | Country | [70] |
| 29 | Global Data Assimilation System (GDAS) (https://www.ncdc.noaa.gov/data-access/model-data/model-datasets/global-data-assimilation-system-gdas (accessed on 20 October 2020)) | The system is used by the National Center for Environmental Prediction (NCEP) Global Forecast System (GFS) model to place observations into a gridded model space for the purpose of starting, or initializing, weather forecasts with observed data. | Global daily assimilation data from 2001 to present, GDAS Snow, Ice, SST, Satellite, Ship, Aircraft (GRIB) data from April 2019 to May 2020. | Global | Country | [70,97,98] |
| 30 | Nepal Climate Change & Development Portal (http://climatenepal.org.np (accessed on 20 October 2020)) | Operated and maintained by NAST (Nepal Academy of Science and Technology). Contains information on six key themes: climate science, impacts, adaptation planning, adaptation policy and actions, international climate change policy, and financing and technology transfer. | Climate change bibliographies | National and local | National and local | [14] |
| 31 | Geofabrik Software Development Company, Germany (download.geofabrik.de/asia/Nepal (accessed on 20 October 2020)) | Portal incorporated by two software engineers in 2007 that provides free geodata created by OpenStreetMap. | Physical infrastructure shapefiles | Local | Municipality | [1] |
| Sn. | Platform | Major Features | References |
|---|---|---|---|
| 1 | Index for risk management (https://drmkc.jrc.ec.europa.eu/inform-index (accessed on 20 October 2020)) | A global platform, open-source risk assessment for humanitarian crises and disasters. | [21,133,134] |
| 2 | Rapid Analysis and Spatialization of Risk (RASOR) (http://www.rasor-project.eu/rasor-platform/ (accessed on 20 October 2020)) | A platform to perform multi-hazard risk analysis for the full cycle of disaster management, including targeted support to critical infrastructure monitoring. | [135,136,137,138] |
| 3 | OPENQUAKE (https://www.global quakemodel.org/op enquake/about/plat form (accessed on 20 October 2020)) | A web-based platform that offers an interactive environment in which users can access, manipulate, share and add data, and explore models and tools for integrated assessment of earthquake risk; Provides tools for DRR and management. | [139,140,141] |
| 4 | eCapra (https://ecapra.org/ (accessed on 20 October 2020)) | Probabilistic risk assessment platform. The platform consists of different modules for probabilistic risk calculations including CAPRA-GIS software module | [142,143,144,145] |
| 5 | FEMA Flood Map Service Center: Hazus (https://msc.fema.g ov/portal/resources/hazus (accessed on 20 October 2020)) | Models for estimating potential losses from earthquakes, floods, hurricanes, and tsunamis. Users can then visualize the spatial relationships between populations and other more permanently fixed geographic assets or resources for the specific hazard being modeled, a crucial function in the predisaster planning process | [146,147,148,149] |
| 6 | SIDS Disaster Risk Reduction Portal (https://smallisland s-riskreduction.net/ (accessed on 20 October 2020)) | Hub for information concerning water disaster risk reduction management, allows searching for relevant resources of Small Islands Developing States. Enhances ‘risk-reduction’ and ‘information and knowledge-sharing’ for Small Island Developing States by providing an access point for a range of available open data, information, tools, and best practices. | [150,151,152,153] |
| 7 | Google Earth Engine (GEE) https://earthengine.google.com/datasets/ (accessed on 20 October 2020) | Established at the end of 2010; GEE provides global time-series satellite imagery and vector data, cloud-based computing, and access to software and algorithms for processing substantial amounts of such data. | [111,154,155,156,157] |
| Program/Software | Description | References |
|---|---|---|
| QGIS | QGIS supports both raster and vector layers. QGIS supports plug-in architecture. For example, InaSAFE is a multi-risk platform, developed as a QGIS plug-in that enables the assessment of several natural hazard scenarios. Similarly, FloodRisk is another QGIS plugin for flood risk analysis. The Analytic Hierarchy Process (AHP) and Weighted Linear Combination (WLC) analysis plugins are commonly used in Nepal for Multi-criteria Decision-Making Analysis using Geo-spatial data [4,159,160]. | [157,158] |
| GRASS | GRASS is a cross platform system (runs in Linux, Mac, Windows). It has numerous add-ons related to landslides, floods, and other hazards. For example, http://www.slopestability.org/ is built on GRASS GIS for landslide modelling. Similarly r.hazard.flood (https://grass.osgeo.org/grass78/manuals/addons/r.hazard.flood.html (accessed on 16 October 2021)) is an implementation of a fast procedure to detect flood prone areas in GRASS GIS. | [161,162] |
| uDig | uDig is used as a framework for building other GIS platforms and applications. It is a full-layered open-source GIS based on Java enabled Eclipse platform | [163,164,165] |
| SAGA GIS | System for Automated Geoscientific Analyses (SAGA) provides an easy and effective implementation of spatial algorithms. Hydrological models TOPMODEL and IHACRES are implemented as module libraries in SAGA. | [166,167,168] |
| ILWIS | Integrated Land and Water Information System (ILWIS) is a geographic information system (GIS) and remote sensing software for both vector and raster processing. | [169,170,171,172] |
| MapWindow | GIS (mapping) application built upon Microsoft NET technology and consists of a set of programmable mapping components. MapWindow GIS can be reprogrammed to perform different or more specialized tasks. | [158,173,174,175] |
| gvSIG | gvSIG is a user-friendly desktop application for capturing, storing, handling, analyzing, and deploying any kind of referenced geographic information to solve complex management and planning problems. | [157,176,177,178] |
| OpenJump | Open Jump is a Java based open-source GIS system with an ability to work with GIS data in GML format. GML or “Geography Markup Language” is an XML (text-based) format for GIS data. | [157] |
| GeoDa | Supports data exploration in statistics | [145,179,180,181] |
| Whitebox GAT | Whitebox GAT (Geospatial Analysis Toolbox) | [177,182] |
| FalconView | Georgia Tech built this open software for displaying various types of maps and geographically referenced overlays | [183] |
| OrbisGIS | OrbisGIS is a cross-platform open-source GIS software designed by and for research | [183] |
| DivaGIS | Mapping and geographic data analysis, in particular point data | [184,185,186] |
| AkvaGIS | Free and open-source GIS-integrated hydrochemical–hydrogeological analysis tool (named AkvaGIS) for the management and interpretation of hydrogeological data | [186,187,188] |
Publisher’s Note: MDPI stays neutral with regard to jurisdictional claims in published maps and institutional affiliations. |
© 2022 by the authors. Licensee MDPI, Basel, Switzerland. This article is an open access article distributed under the terms and conditions of the Creative Commons Attribution (CC BY) license (https://creativecommons.org/licenses/by/4.0/).
Share and Cite
Thakuri, S.; Parajuli, B.P.; Shakya, P.; Baskota, P.; Pradhan, D.; Chauhan, R. Open-Source Data Alternatives and Models for Flood Risk Management in Nepal. Remote Sens. 2022, 14, 5660. https://doi.org/10.3390/rs14225660
Thakuri S, Parajuli BP, Shakya P, Baskota P, Pradhan D, Chauhan R. Open-Source Data Alternatives and Models for Flood Risk Management in Nepal. Remote Sensing. 2022; 14(22):5660. https://doi.org/10.3390/rs14225660
Chicago/Turabian StyleThakuri, Sudeep, Binod Prasad Parajuli, Puja Shakya, Preshika Baskota, Deepa Pradhan, and Raju Chauhan. 2022. "Open-Source Data Alternatives and Models for Flood Risk Management in Nepal" Remote Sensing 14, no. 22: 5660. https://doi.org/10.3390/rs14225660