Article

Neuro-Fuzzy-AHP (NFAHP) Technique for Copper Exploration Using Advanced Spaceborne Thermal Emission and Reflection Radiometer (ASTER) and Geological Datasets in the Sahlabad Mining Area, East Iran

1
Department of Mining Engineering, Amirkabir University of Technology (Tehran Polytechnic), Tehran 1591634311, Iran
2
Institute of Oceanography and Environment (INOS), University Malaysia Terengganu (UMT), Kuala Nerus 21030, Malaysia
3
Geoscience and Digital Earth Centre (INSTeG), Research Institute for Sustainable Environment, Universiti Teknologi Malaysia, Johor Bahru 81310, Malaysia
*
Authors to whom correspondence should be addressed.
Remote Sens. 2022, 14(21), 5562; https://doi.org/10.3390/rs14215562
Submission received: 26 September 2022 / Revised: 20 October 2022 / Accepted: 1 November 2022 / Published: 4 November 2022

Abstract

:
Fusion and analysis of thematic information layers using machine learning algorithms provide an important step toward achieving accurate mineral potential maps in the reconnaissance stage of mineral exploration. This study developed the Neuro-Fuzzy-AHP (NFAHP) technique for fusing remote sensing (i.e., ASTER alteration mineral image-maps) and geological datasets (i.e., lithological map, geochronological map, structural map, and geochemical map) to identify high potential zones of volcanic massive sulfide (VMS) copper mineralization in the Sahlabad mining area, east Iran. Argillic, phyllic, propylitic and gossan alteration zones were identified in the study area using band ratio and Selective Principal Components Analysis (SPCA) methods implemented to ASTER VNIR and SWIR bands. For each of the copper deposits, old mines and mineralization indices in the study area, information related to exploration factors such as ore mineralization, host-rock lithology, alterations, geochronological, geochemistry, and distance from high intensity lineament factor communities were investigated. Subsequently, the predictive power of these factors in identifying copper occurrences was evaluated using Back Propagation Neural Network (BPNN) technique. The BPNN results demonstrated that using the exploration factors, copper mineralizations in Sahlabad mining area could be identified with high accuracy. Lastly, using the Fuzzy-Analytic Hierarchy Process (Fuzzy-AHP) method, information layers were weighted and fused. As a result, a potential map of copper mineralization was generated, which pinpointed several high potential zones in the study area. For verification of the results, the documented copper deposits, old mines, and mineralization indices in the study area were plotted on the potential map, which is particularly appearing in high favorability parts of the potential map. In conclusion, the Neuro-Fuzzy-AHP (NFAHP) technique shows great reliability for copper exploration in the Sahlabad mining area, and it can be extrapolated to other metallogenic provinces in Iran and other regions for the reconnaissance stage of mineral exploration.

Graphical Abstract

1. Introduction

Machine learning approaches are steadfast tools of mineral exploration due to their capability for precise processing of remote sensing data and fusing various and high dimensional data to detect features with problematic attributes [1,2,3,4]. The utilization of machine learning algorithms is an inexpensive and automatic approach for accurate mineral potential mapping, fusing the data derived from remote sensing, geology, geophysics, and geochemistry [1,3,4,5,6]. Machine learning algorithms are typified to (i) dimensionality reduction methods such as Principal Component Analysis, Independent Component Analysis and Minimum Noise Fraction; (ii) classification methods such as Minimum Distance, Support Vector Machine, Artificial Neural Networks and Random Forest; (iii) regression methods such as Multi-Linear Regression, Multivariate Regression, Logistic Regression; and (iv) clustering methods such as K-means and ISODATA [7].
The application of machine learning methods, particularly Artificial Neural Networks (ANN), has great potential in processing of various data for accurate mineral potential mapping [8]. Appropriate training of a Neural Network (NN) is a significant characteristic of producing a consistent model. This training is generally named “Back-propagation”, which is the principle of neural net training. Back-propagation is the exercise of fine-tuning the weights of a neural net built on the error rate acquired in the preceding epoch. Appropriate tuning of the weights guarantees lower error rates, generating the more steadfast model by improving its generalization [9,10,11]. The Back Propagation Neural Network (BPNN) algorithm is a practical approach for improving the accuracy of predictions in data mining [12,13]. For mineral exploration, one of the most significant concerns is the identification of potential zones based on the characteristics of ore deposits, mining area, and mineral occurrences (indices) in a study area [14]. One of the most important benefits of BPNN is the ability to estimate the predictive power and accuracy of factors related to mineralization, which is accomplished through training and testing. In fact, the power of network estimation is evaluated using available data.
In this study, the BPNN was used to evaluate the accuracy of exploration factors related to volcanic massive sulfide (VMS) copper mineralization in the Sahlabad mining area, South Khorasan province, east Iran (Figure 1A,B). Consequently, the predictive power and accuracy of information layers such as host-rock lithology, alteration minerals, geological age of the host-rock, ore mineralization and distance from the community of important fault systems were evaluated to determine the location of copper occurrences in the study area. As a result, the predictive power of the data was accomplished with a lower percentage of error. In fact, implementation of the BPNN algorithm to the exploration factors of copper mineralization has verified the accuracy of inputs layers/information for the next stage [15,16]. Subsequently, the information layers were weighted and fused according to the rules of the Fuzzy Analytic Hierarchy Process (AHP) [17,18,19]. In this study, the combination of BPNN and Fuzzy-AHP methods in the field of mineral exploration is executed and introduced as Neuro-Fuzzy-AHP (NFAHP).
The Advanced Spaceborne Thermal Emission and Reflection Radiometer (ASTER) remote sensing sensor has great capabilities to map hydrothermal alteration zones associated with a variety of ore mineralization particularly massive sulfide copper mineralization [20,21,22]. The hydrothermal alteration zones (e.g., gossan, argillic, phyllic and propylitic) associated with volcanic massive sulfide (VMS) copper mineralization in the Sahlabad mining area have been reported and documented [23]. Consequently, remote sensing and geological information layers, including ASTER alteration maps, host-rock lithology, geochronological, structural data and geochemistry of copper mineralization in the study area were evaluated and verified by the BPNN, then appraised and appropriate layers were subsequently fused by the Fuzzy-AHP method for generating a mineral potential map. In view of that, the main objectives of this study are: (1) to map hydrothermal alteration zones (e.g., gossan, argillic, phyllic and propylitic) associated with copper mineralization using the visible and near infrared (VNIR) and shortwave infrared (SWIR) bands of ASTER data; (2) to estimate the predictive power and accuracy of information layers (remote sensing and geological data) for copper mineralization using the BPNN algorithm; (3) to fuse remote sensing layers (i.e., hydrothermal alteration zones) with geological information layers (i.e., lithology, structural geology, geochemistry and geochronology) using Fuzzy-AHP method; (4) to generate an accurate potential mineral map of VMS copper mineralization for the Sahlabad mining area.

2. Geological Setting

The Sistan Suture Zone (SSZ) is situated in the eastern part of Iran, 800 km in length (N-S) and 200 km in width (E-W) (Figure 1A); it was formed during the Paleogene collision of the Central Iran Block (CIB) with the Afghan Block (AB) [24,25,26]. It splits the continental Lut sub-block of CIB to the west from the AB to the east [27]. This belt consisting of peridotites, serpentinites, gabbros, and leucogabbros, dolerites, basalts, and radiolarites represents remnants of the lithosphere of the Sistan oceanic basin and its pelagic sedimentary cover [28,29,30]. The Sahlabad mining area is situated in the SSZ and is bounded between longitudes 59°30′ to 60° and 32° to 32°30′ (Figure 1A,B). It is located in the flysch and colored mélange belt of the SSZ and consists of igneous, metamorphic and sedimentary lithological units that are shown in Figure 1B, comprehensively. In the Sahlabad mining area, there are three main VMS copper deposits, namely (1) Mesgaran, (2) Chah-Rasteh, and (3) Zahri [23]. Moreover, there are also some copper indices and two abandoned old copper mines in this area. Information about the geographical location, alterations, host lithology and Cu minerals for the deposits, old mines, and indices are represented in Table 1.
Figure 1. (A) Geographical location of Sistan Structural Zone (SSZ) and the study area in Iran. (B) Detailed geology map of the Sahlabad mining Area (modified from [23]).
Remotesensing 14 05562 g001

3. Materials and Methods

3.1. Information Layers

Several information layers were considered and analyzed to map high potential zones of VMS copper mineralization in the Sahlabad mining area. The information layers containing significant information for VMS copper mineralization in the study area were mainly selected from remote sensing and geological datasets. ASTER remote sensing data were processed using band ratio and Selective Principal Components Analysis (SPCA) techniques [20,21,22] to map hydrothermal alteration zones such as the gossan, argillic, phyllic and propylitic associated with massive sulfide copper mineralization in the study area. The geological information is typically derived from lithological, geochronological, geochemical and structural information that is documented (as digital maps) for the study area [32]. Subsequently, information layers were evaluated using the BPNN algorithm and fused using the Fuzzy-AHP method to generate a potential map of VMS copper mineralization for the Sahlabad mining area. Figure 2 shows the methodological flowchart implemented in this study.

3.2. Remote sensing Data Characteristics and Processing

Three ASTER scenes covering the study area acquired on 15 July 2002 were used in this study. They are level 1B product and cloud-free and were obtained from the USGS Earth Explorer (http://earthexplorer.usgs.gov, accessed on 1 June 2021) website. The data were pre-georeferenced to UTM zone 40 North projection using WGS-84 datum. ASTER level 1B data were mosaic and preprocessed using the Cross-Talk correction [33]. Also, atmospheric correction was executed by Fast Line-of-Sight Atmospheric Analysis of Spectral Hypercubes (FLAASH) algorithm to VNIR and SWIR subsystems [34]. Band ratio [35] and Selective Principal Components Analysis (SPCA) [36] were applied to VNIR+SWIR bands (1 to 9) for mapping gossan, argillic, phyllic and propylitic alteration zones. The ENVI (Environment for Visualizing Images, http://www.exelisvis.com, accessed on 1 June 2021) version 5.2 and ArcGIS version 10.3 software (Esri, Redlands, CA, USA) packages were used to process the remote sensing datasets.

3.3. Geological Data

The main host-rocks of copper mineralization are typically andesite, andesite-basalt and basalt rocks [23,32,37]. However, other geological units such as ultrabasic unit, ophiolite mélange and schist could host the copper mineralization in the study area due to structural controls of ore mineralization [23,31]. These lithological units were used as sub-criteria for the geology information layer and decision-making process. Furthermore, the geological ages were considered sub-criteria of the geochronological information layer. The geological ages of the lithological units are shown in Table 2.
The relationship between the fault systems and copper mineralization in the study area is documented [31]. Lithological trends as well as spatial distribution of copper occurrences are related to structural features and the fault systems acted as a controller of the host lithology trend. As a result, the Lineament Factor (LF) map of the study area can be considered as one of the most important keys for identifying the potential zones of copper mineralization. The LF map shows three important factors, including (i) frequency of faults, (ii) frequency of fault intersection and (iii) fault length. The LF map scores the factors related to the faults based on the grade of significance and ultimately shows the areas that are important for fault activity. Initially, the network of the Sahlabad area was divided into 100-square-meter cells to study the faults and generate an LF map using the RockWorks software package (Version 17, RockWare, Golden City, CO, USA). The scores of these factors were considered from top to bottom, 1, 2 and 3, respectively [31]. In this analysis, high intensity areas (LF more than 30) in the LF map were also considered as one of the sub-criteria in identifying copper mineralization. The results of applying factor analysis method on the geochemical data of stream sediments (706 samples) showed that copper is among the first principal factors with 27% variance justification [38]. The elements associated with Cu among the first principal components are Pb, Zn, Sn, Ag and Mo. For this analysis, the geochemical map of the study area is produced based on the scores of Cu, Pb, Zn, Sn, Ag and Mo and the kriging interpolation. These anomalies were also considered as sub-criteria in the geochemical information layer and consequence decision-making process.

3.4. Data Fusion

3.4.1. Back Propagation Neural Network (BPNN)

Back Propagation Neural Network (BPNN) is an algorithm for neural network supervised learning using a reduction gradient. In this method, for an Artificial Neural Network (ANN) and a specific error function, the gradient of the error function relative to the weights of the neural network is calculated [9,10,11,12,13]. The purpose of applying the BPNN algorithm is estimation and validation of the results of the analysis of information layers related to copper mineralization based on copper deposits, old mines, and mineral indices in the Sahlabad mining area. In other words: provide the answer to the question of whether the exploration factors studied so far have sufficient credibility to continue the decision-making process and identify copper mineralization in the area or not. At this stage, if the input factors can be estimated with high accuracy based on each other, the information layers are used as input for AHP-Fuzzy method.
In the BPNN algorithm, parameters such as the type of training, the choice of the number of neurons in different layers and the type of neurons are important [11]. In the obtained results, the type of training is based on binary rules and the network efficiency was estimated using the mean squared error. The type and number of neurons as well as the type of activation functions are shown in Figure 3.
The general structure of the artificial neural network presented in Figure 3 contains two hidden layers, the input layer and the output layer. The first and second hidden layers have two neurons and one neuron, respectively. The activation functions used in the first and second layers are the linear function and the sigmoid logistic function, respectively. This choice was made due to the appropriate results in the mineral exploration data [39,40]. There are 14 copper occurrences in the Sahlabad mining area, including copper deposits, old mines and mineral indices. Therefore, the economic mineralization certainty of the points in the area was defined as the BPNN input algorithm with probability percentages of 100% for the deposits, 70% for the old mines, and 50% for the mineral indices. Then, information about each copper mineralization point in the area was used as a BPNN input. Table 3 lists the inputs for the BPNN algorithm, which are the exploration factors used to generate information layers.

3.4.2. Hybrid Fuzzy-Analytic Hierarchy Process (Fuzzy-AHP) Method

Fuzzy-AHP method was used as a knowledge-based method. In fact, the process used is a decision-making method based on priorities [41,42,43]. Each of the information layers, including maps of geology, geochronology, geochemistry, structural geology, and hydrothermal alterations were weighted. Subsequently, all the fuzzified information layers were fused based on the assigned weights, and the map of the copper mineralization potential was produced. To validate the model obtained from the Fuzzy-AHP method, copper deposits, old mines and indices in the area were positioned on the map. Generally, the processing is comprised of four main steps [44,45]: (i) criteria and sub-criteria determination to use in modeling; (ii) criteria and sub-criteria weight calculation; (iii) information layers fuzzification; and (iv) final integration of information layers based on the calculated weights.
Based on the available data and parameters and the exploration target (identification of copper mineralization), the main criteria and sub-criteria were determined. The hierarchical structure of the criteria and sub-criteria determined based on the exploratory layers is presented in Figure 4. A total of five main criteria and eleven sub-criteria were determined for Fuzzy-AHP modeling in this study. It should be noted that all coding and analysis related to data fusion was done in the MATLAB software (R2020b, Portola Valley, CA, USA) environment.

4. Results

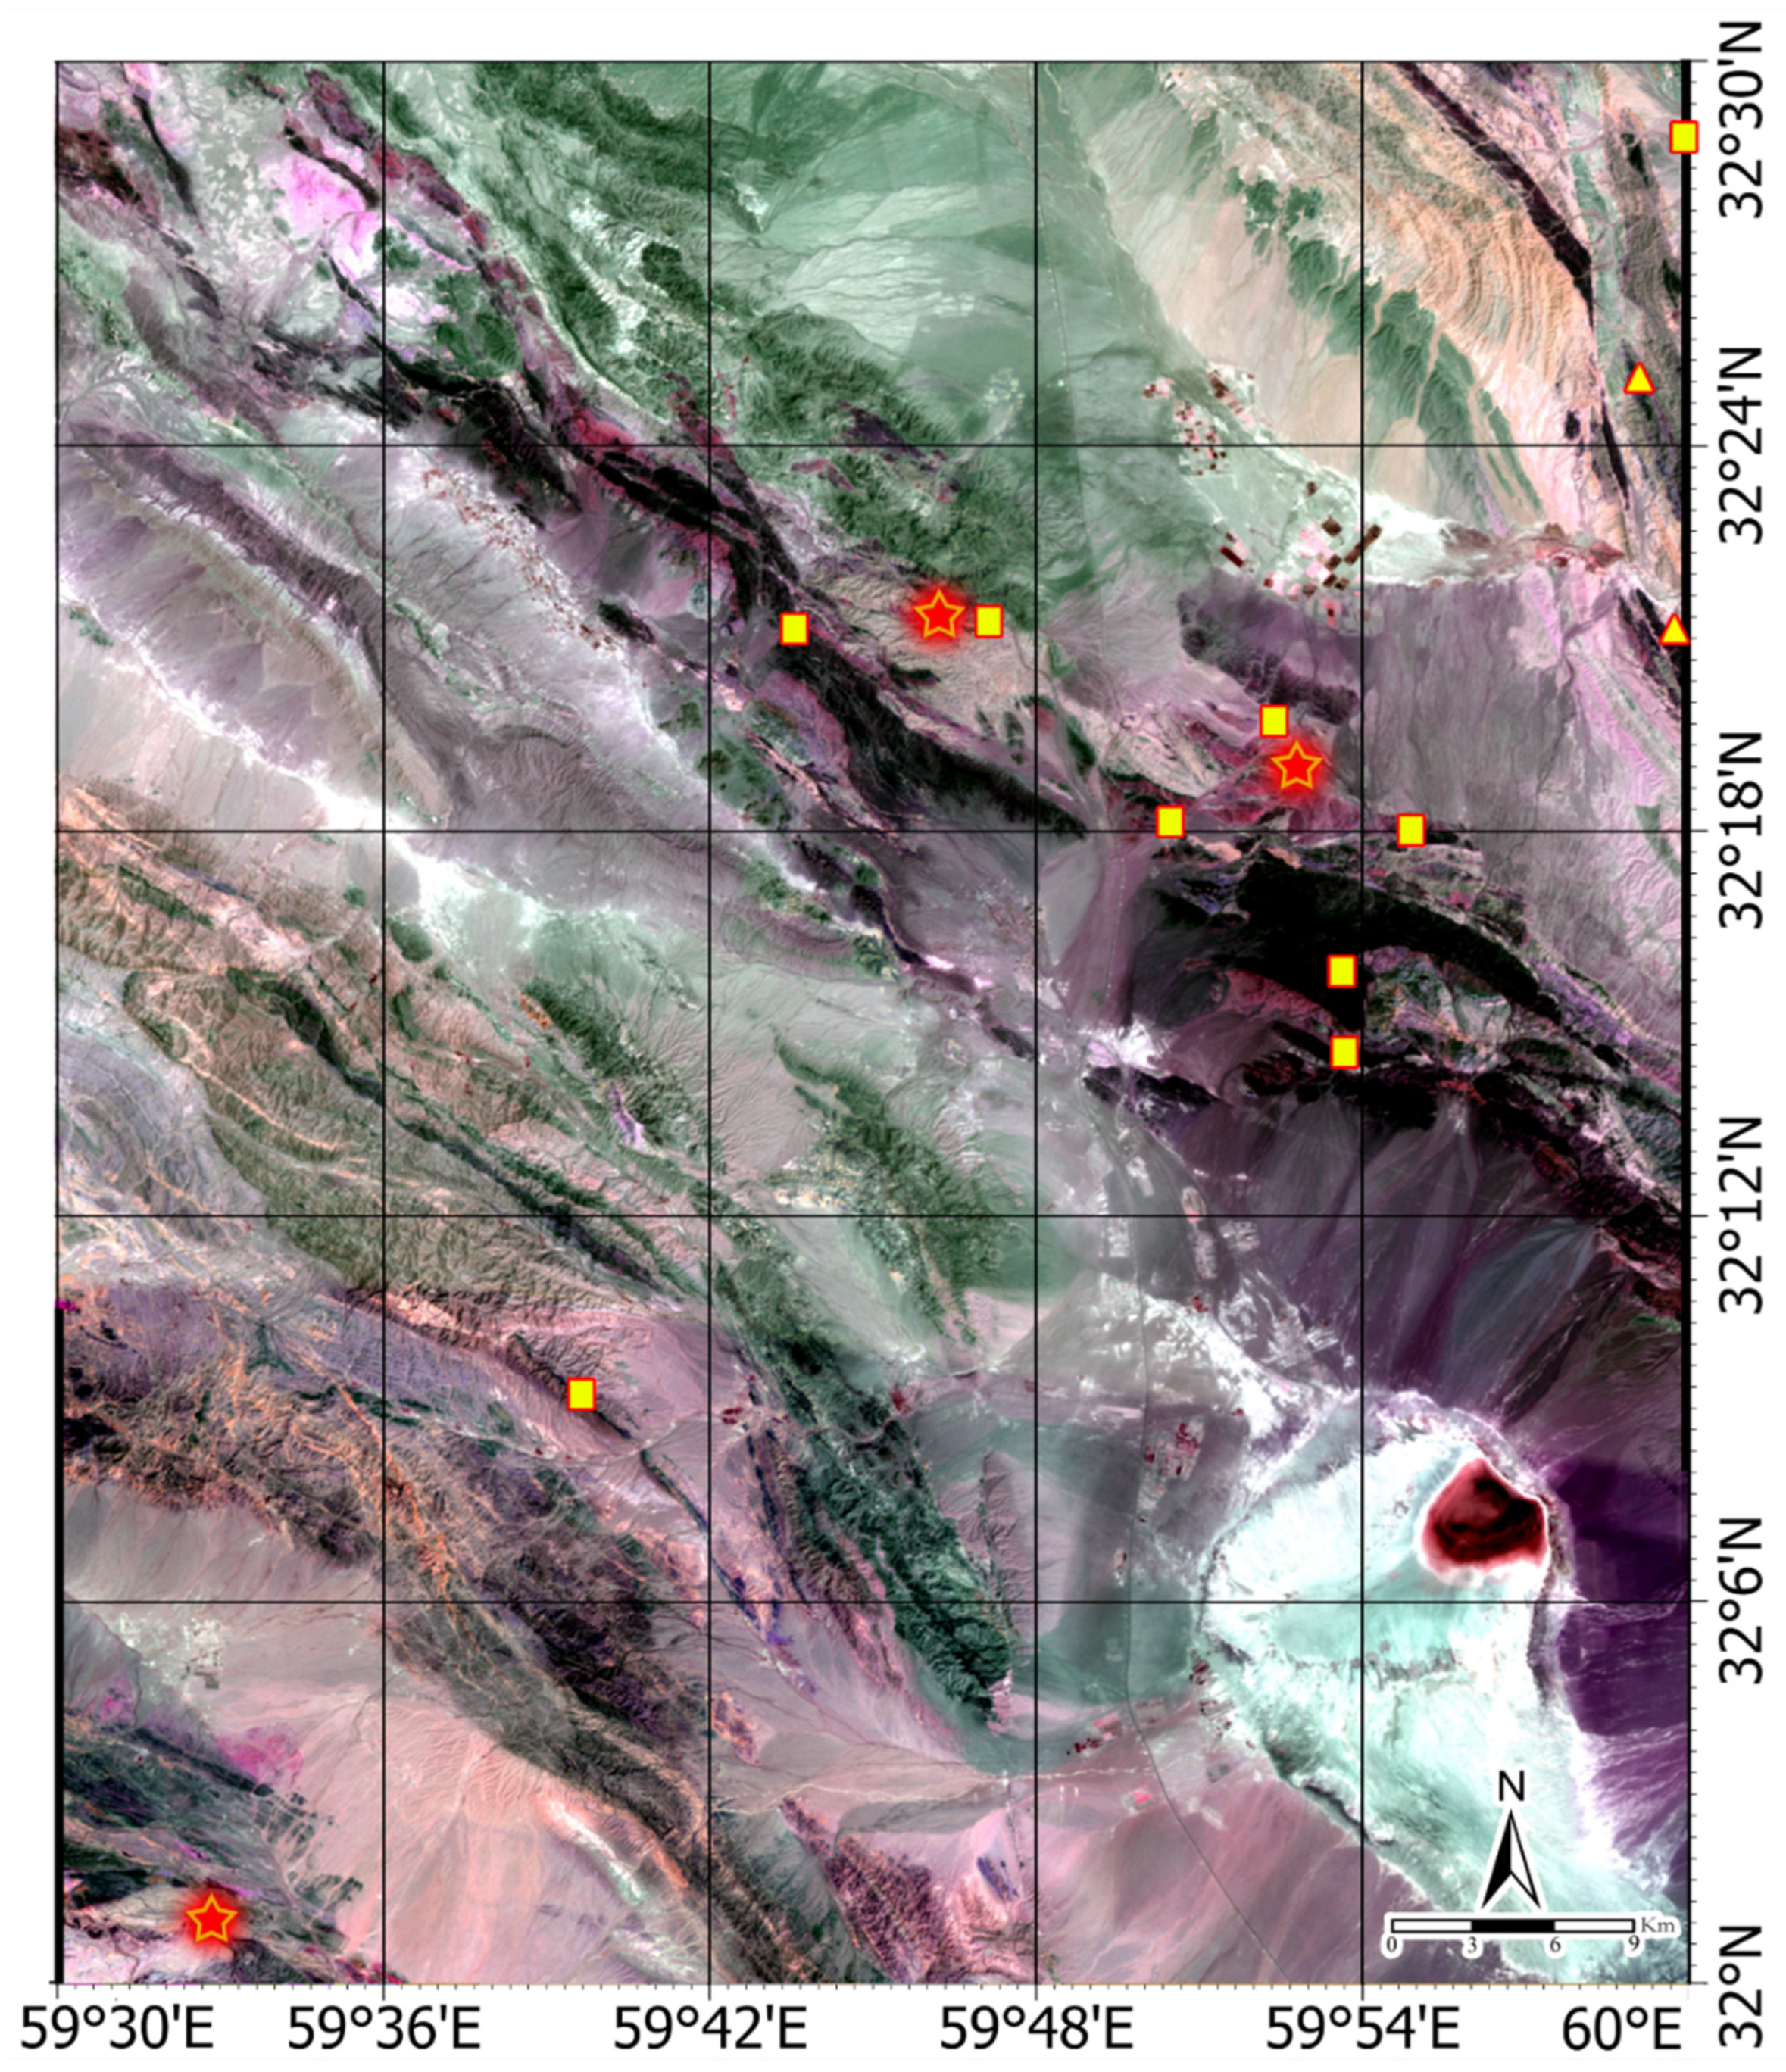
4.1. Alteration Mapping Using ASTER Data

An overview of the lithological units and alteration zones in the Sahlabad mining area was shown using false color composites (FCC) of bands 4 (red), 6 (green), and (blue) 8 of ASTER (Figure 5). The selected bands of ASTER have corresponded to the reflection (1.60–1.70 µm: band 4) and absorption properties (2.185–2.225 µm: band 6 and 2.295–2365 µm: band 8) related to Al-OH and Mg-Fe-OH mineral assemblages [20,46]. The FCC helps to distinguish some of the main lithological units such as ultrabasic rocks and ophiolite mélange (black ton), andesite (grey to brown hue), shale and sandstone (gray to brown shade), tuff (dark grey color) and limestone (whitish pink shade). Moreover, the altered zones might be depicted in pink to magenta color due to high reflectance of OH-bearing minerals in band 4 of ASTER [20,46].
The phyllic and argillic alteration zones have strong Al-OH adsorption properties (illite, montmorillonite, kaolinite, alunite, and muscovite) and can be represented as yellowish-pink shade (Figure 5). The propylitic alteration regions might be mostly manifested in green tone (Figure 5) due to the absorption properties of Fe-Mg-OH (chlorite and epidote) in band 8 [47]. In the southeastern part of the study area, Quaternary alluvium appeared in a red to dark color (Figure 5) attributed to high abundance of clay minerals [47]. Considering the geological map of the study area, the rocks that have been subjected to phyllic and argillic alteration are generally associated with felsic to moderate igneous units (i.e., granodiorite and andesite) and sedimentary rocks such as sandstone and conglomerate. Altered propylitic rocks in the study area are generally associated with mafic igneous units such as basalt, ultrabasic units, andesite-basalt and andesitic lavas.
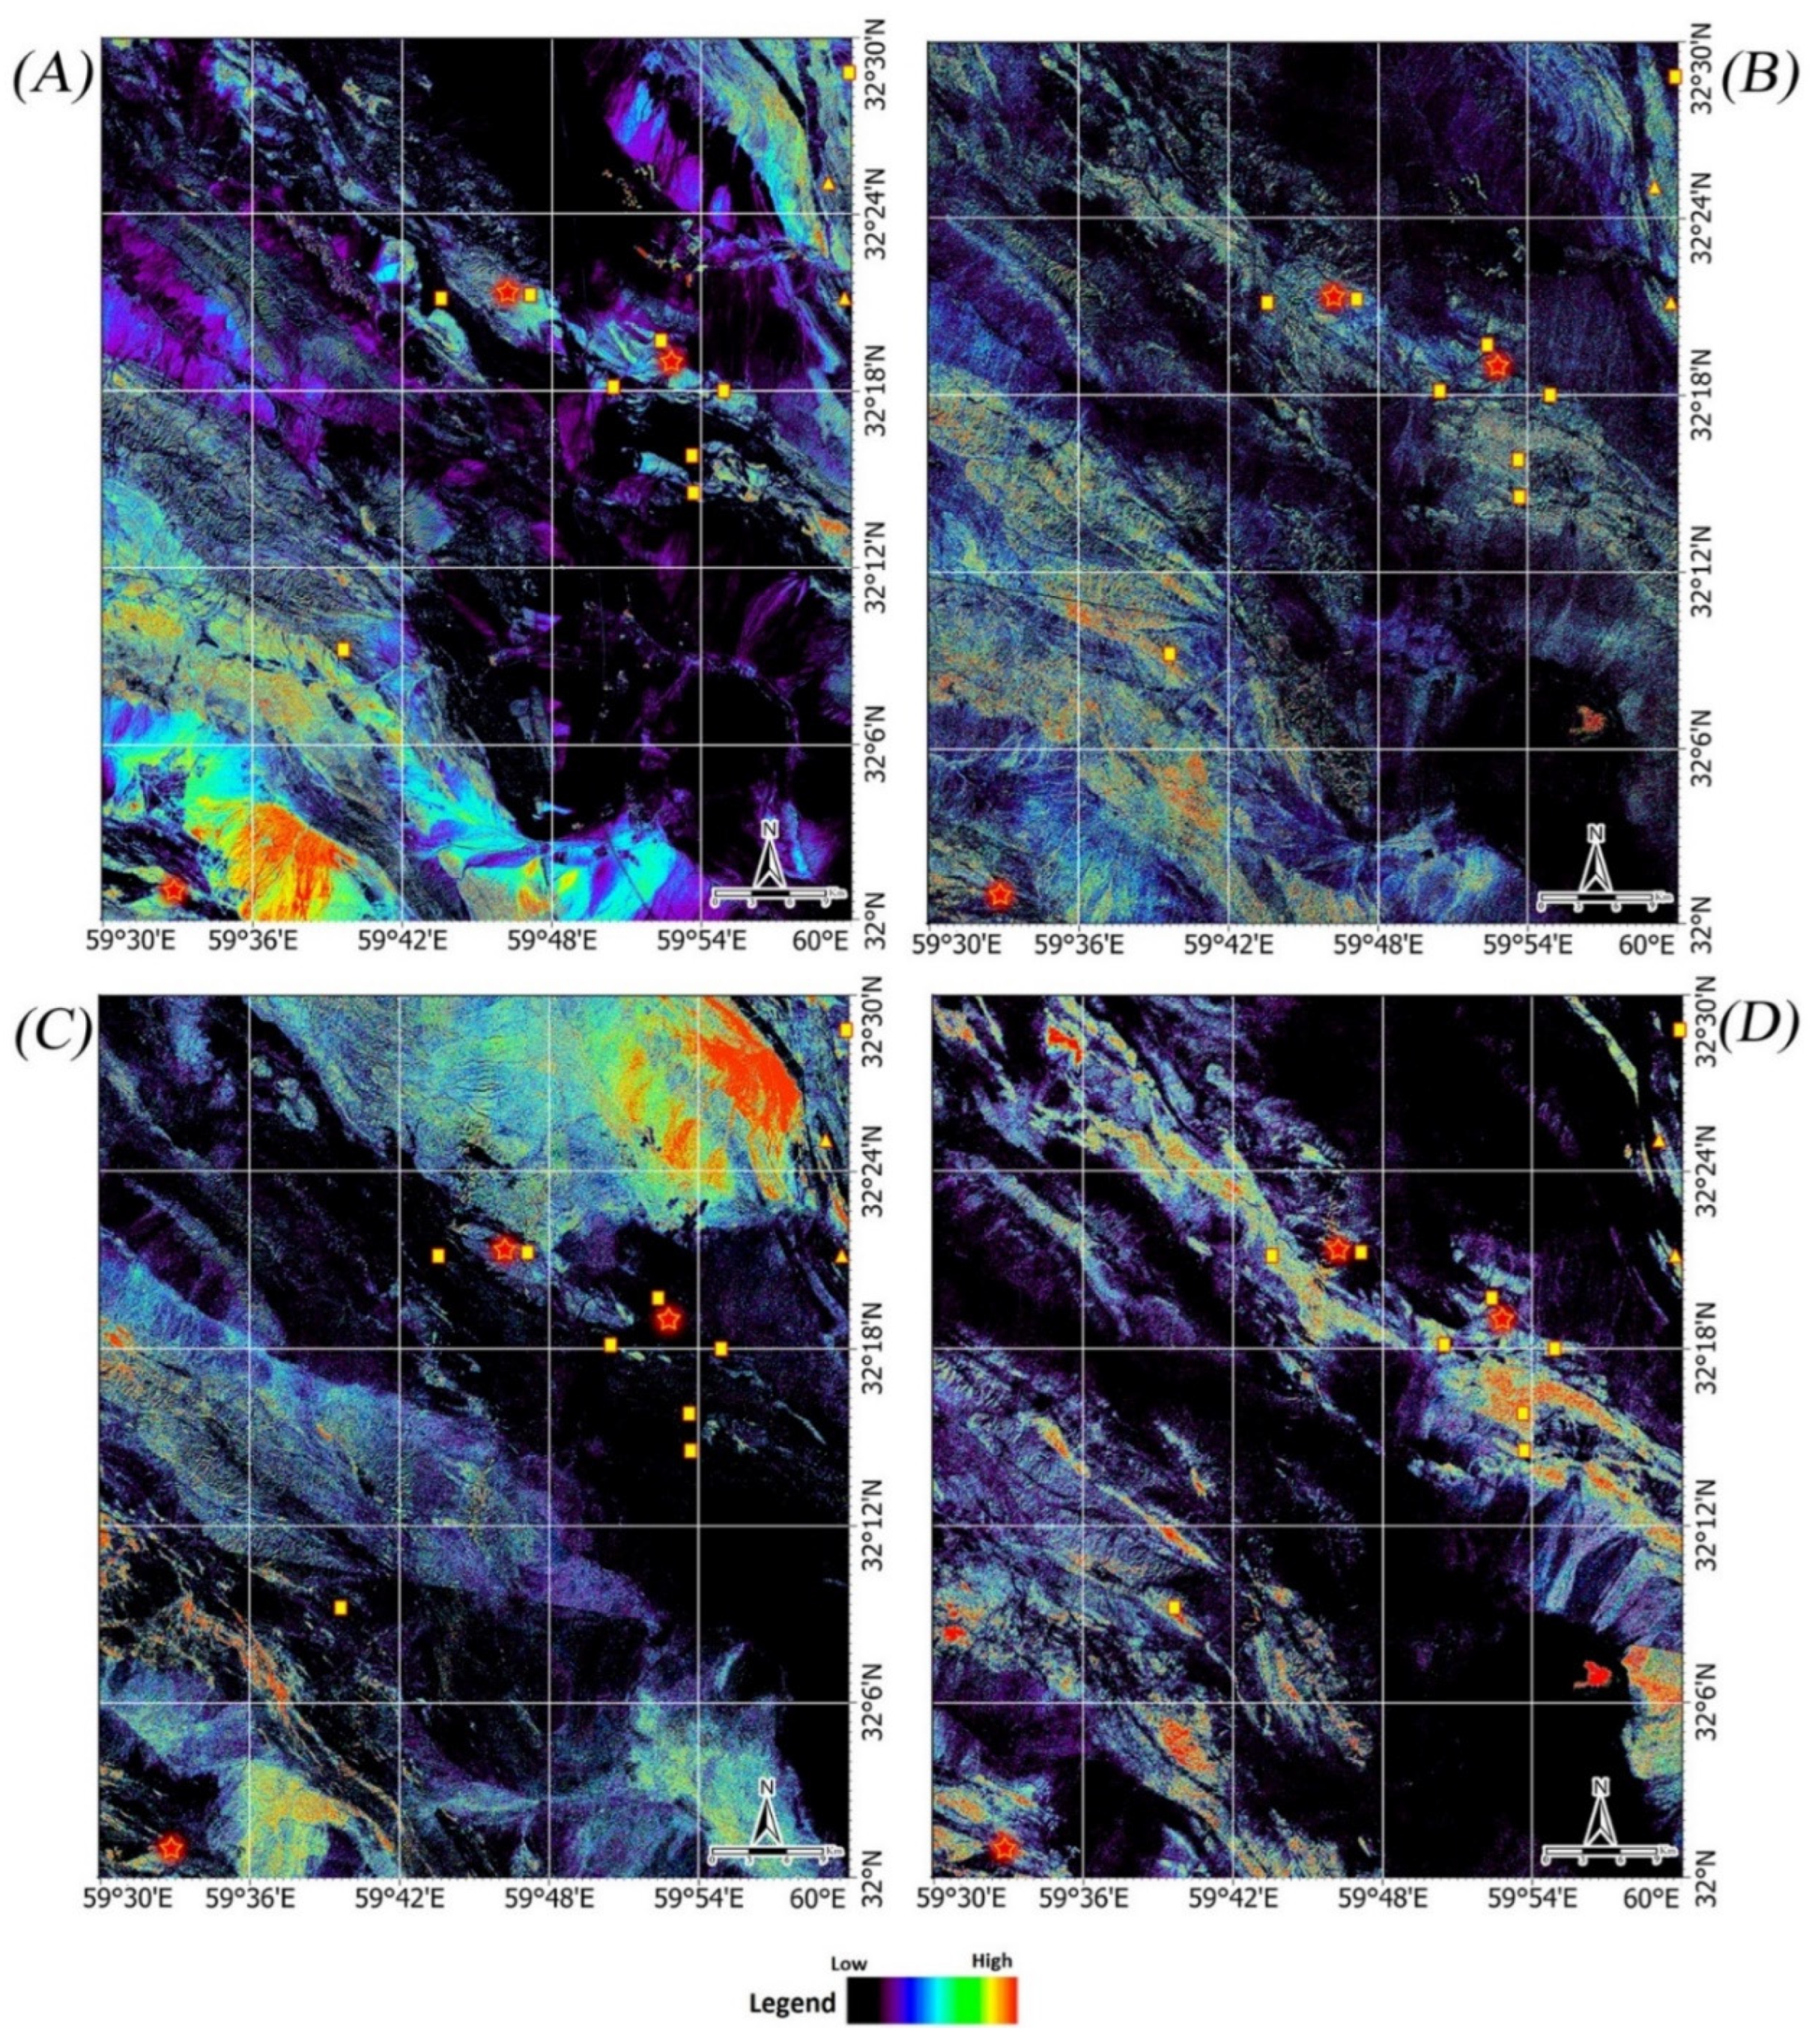
For detailed mapping of hydrothermal alteration minerals, band ratios of 4/2 (to detect iron oxide/hydroxides: gossan), 5/6 (kaolinite and alunite: argillic alteration), 7/6 (muscovite and jarosite: phyllic alteration) and 9/8 (chlorite, epidote and calcite: propylitic alteration) [19,42,43] were assigned and implemented (Figure 6A–D). Subsequently, the alteration zones were mapped in the study area. The results show that moderate to high surface distribution of gossan is typically detected in ophiolite mélange, basalt, shale and sandstone, limestone, schist, and conglomerate (Figure 6A). Argillic alteration is widespread in the study area, which is mainly associated with shale and sandstone, ophiolite mélange, andesitic, ultrabasic rocks and conglomerate (Figure 6B). The phyllic alteration zones show moderate to high surface distribution in many parts of the conglomerate, dacitic dyke, limestone and Quaternary sediments (Figure 6C). Moderate to high surface distribution of propylitic alteration was mapped associated with ultrabasic rocks, basalt, andesite, ophiolite mélange shale and sandstone (Figure 6D). Moderate to high abundance of the alteration zones, especially propylitic, gossan and argillic zones were found with copper deposits, old mines, and indices (Figure 6A–D).
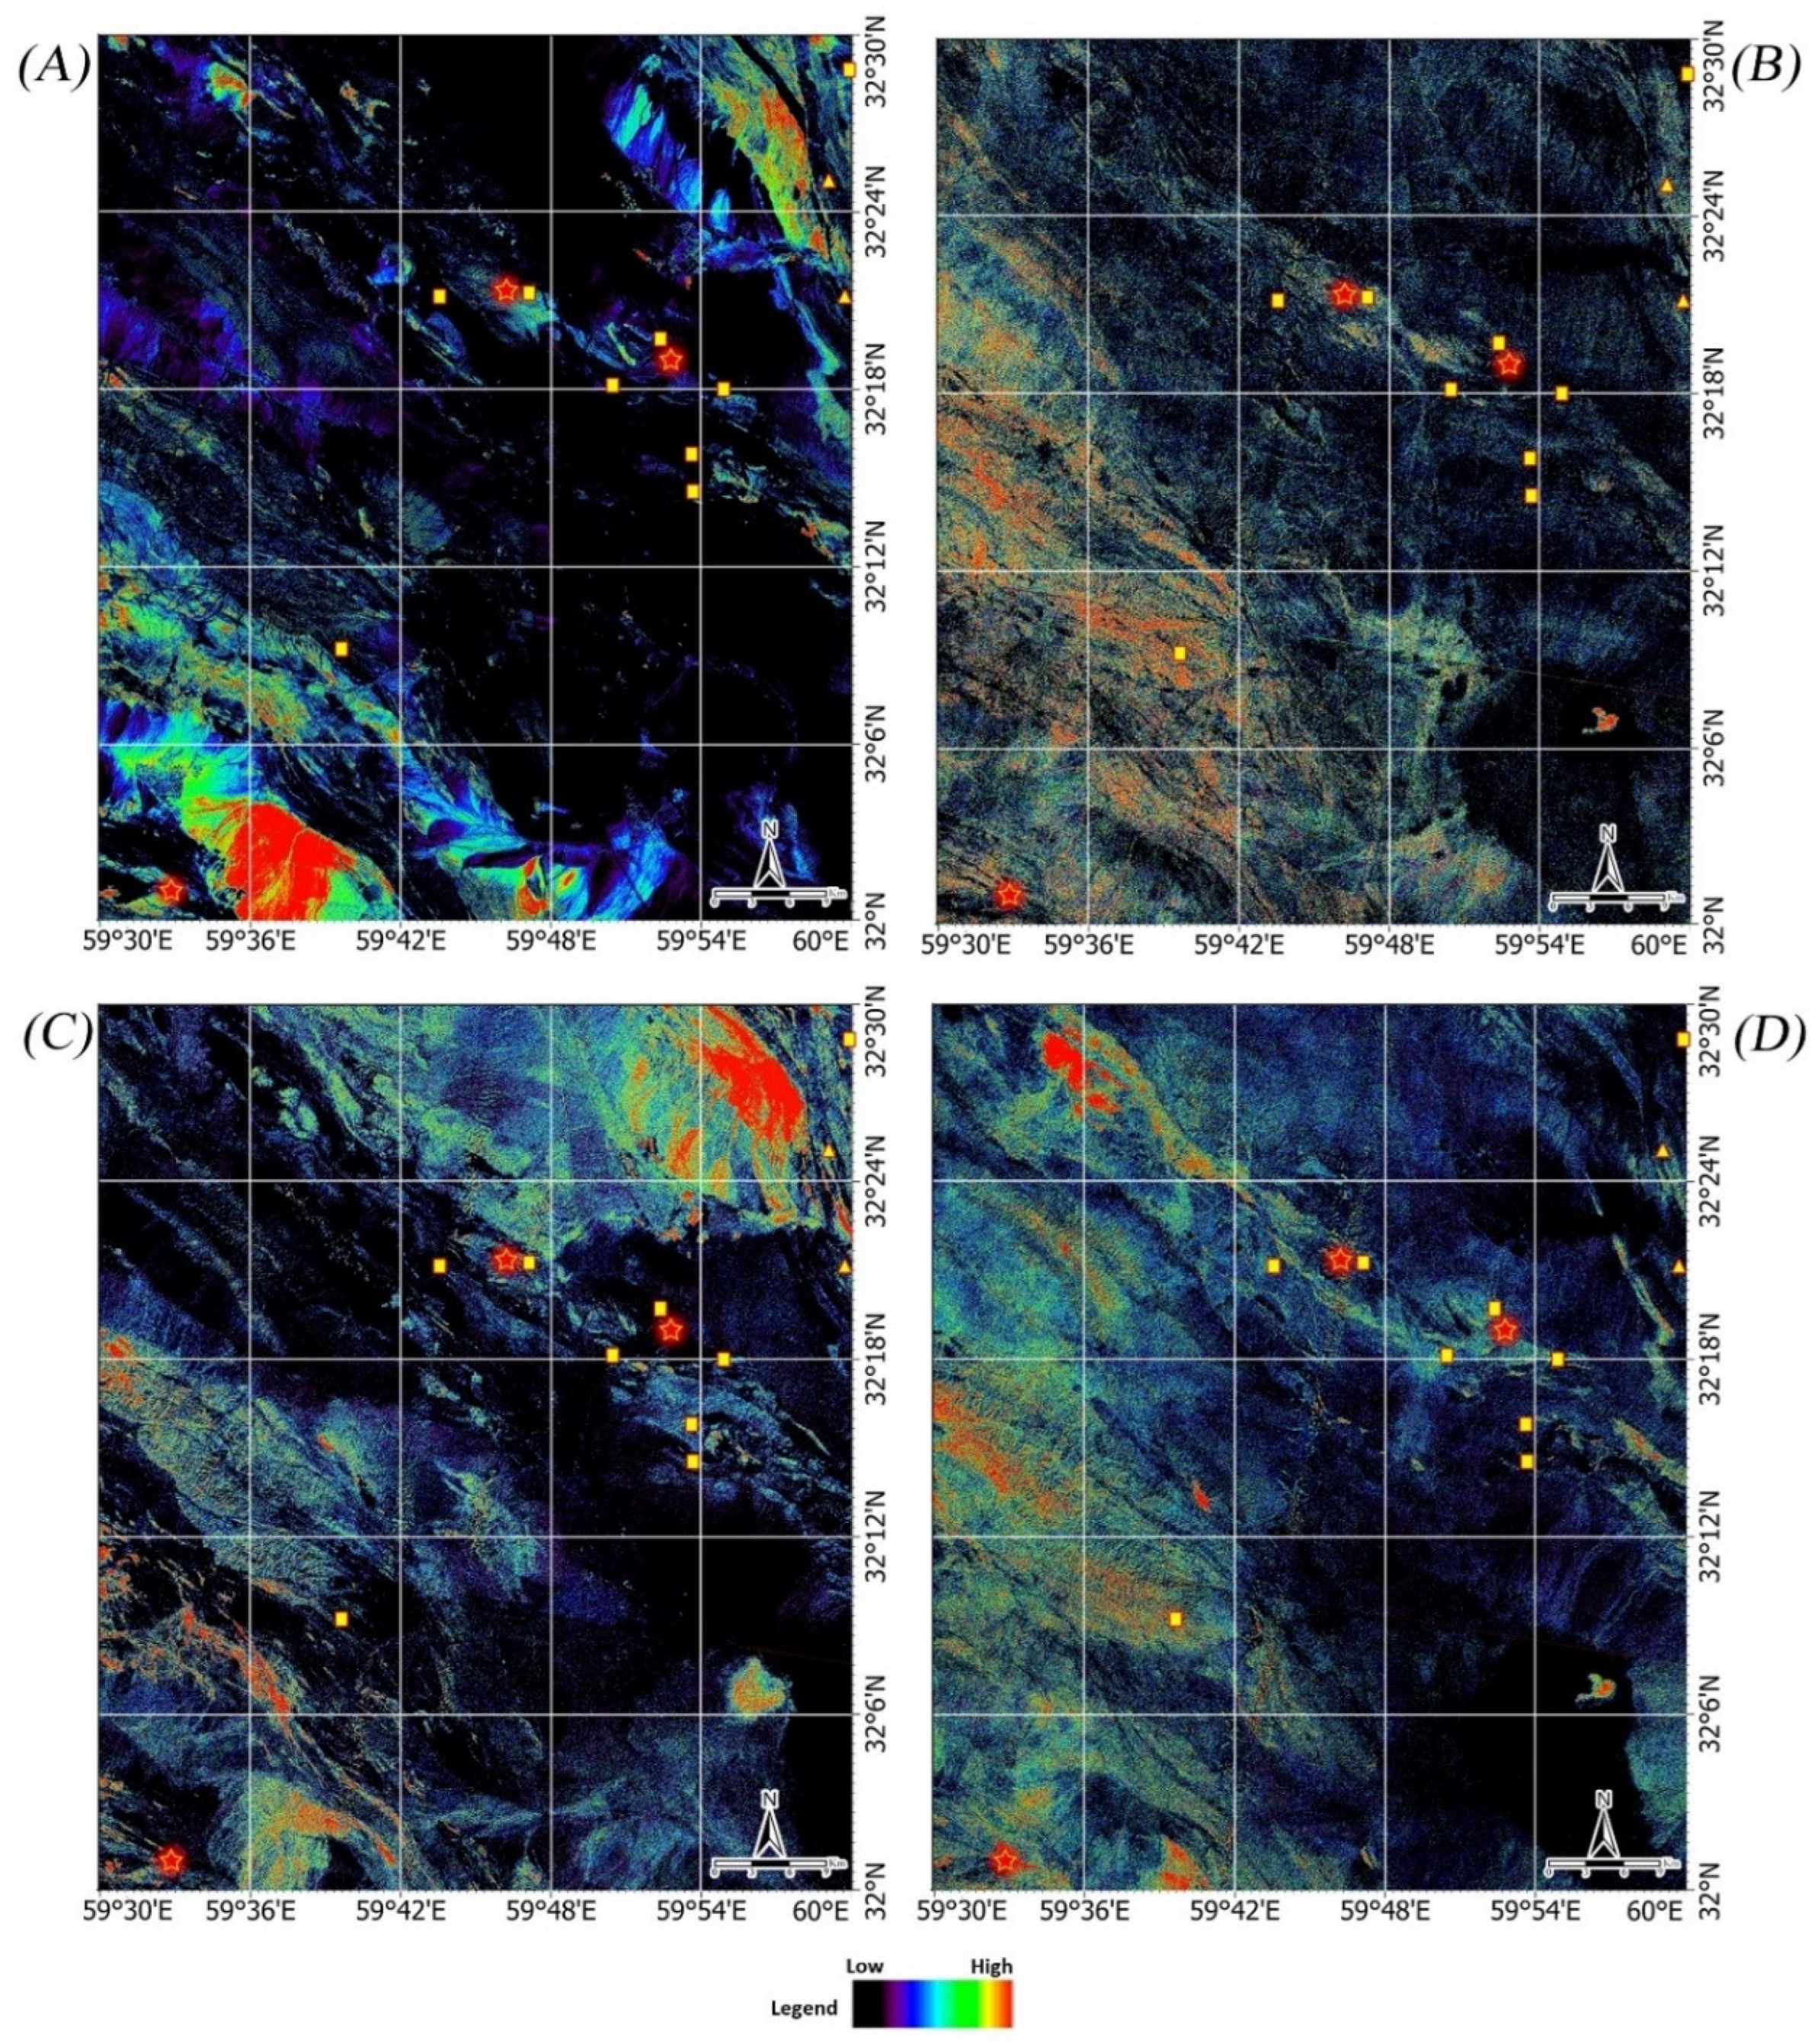
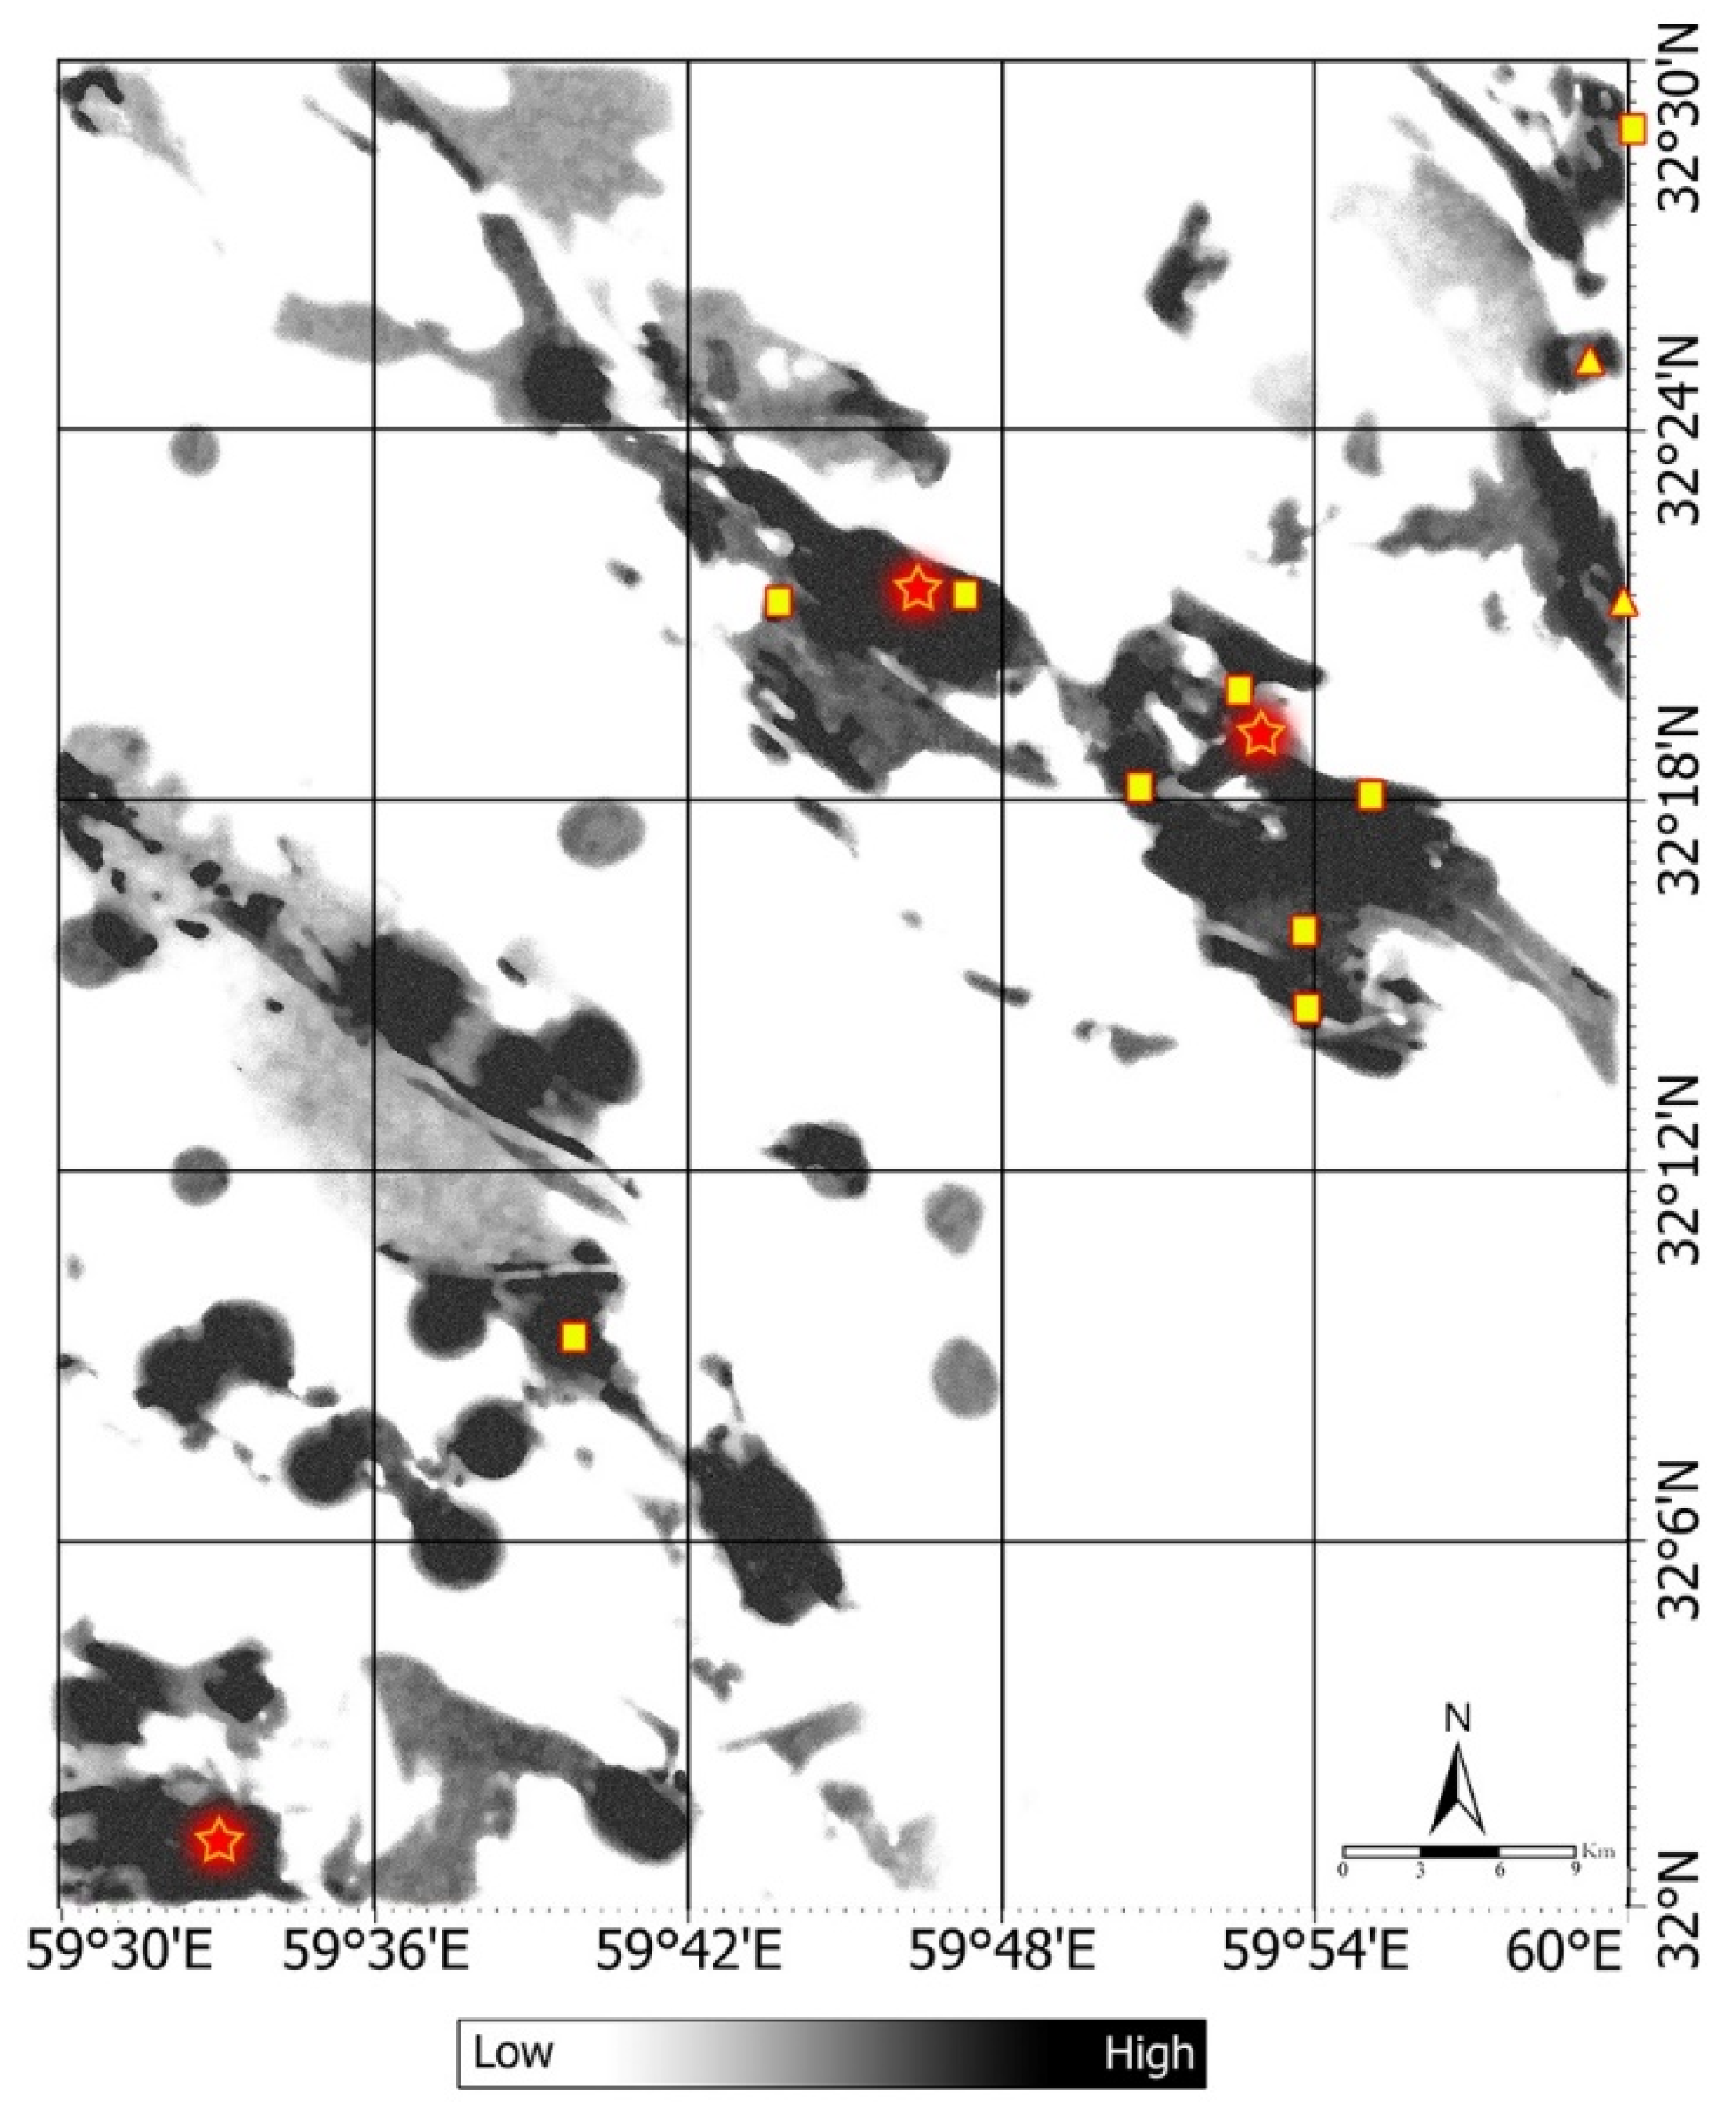
Additionally, the selective principal components analysis (SPCA) method was used to detect the spatial distribution of gossan, argillic, phyllic and propylitic alteration regions in this study. Bands 1, 2, 3 and 4 were selected to map gossan. Analyzing the eigenvector matrix of the selected bands shows the PC2 contains strong loading in band 2 (0.586388) and band 4 (−0.908873) with opposite signs (Table 4). The positive loadings of the eigenvectors in the reflective bands (band 4) show the alterations in the form of bright pixels, while the negative loadings display the alterations in the dark pixels [36]. Therefore, iron oxides (gossan) can be mapped as dark pixels in the PC2 image. This image is negated by multiplication to −1 to show iron oxides (gossan) in bright pixels. Figure 7A shows pseudo-color ramp of PC2 image. Moderate to high spatial distribution of iron oxides (gossan) is mapped in andesite, ophiolite mélange, basalt, shale and sandstone, schist, limestone and conglomerate. Results are almost similar to band ratio of 4/2, although some parts of conglomerate and limestone show high surface distribution of iron oxides in the southwestern and northeastern of the study area (Figure 7A).
Considering the eigenvector matrix of bands 1, 4, 5 and 6 for mapping argillic zone (Table 5), the PC4 has a strong contribution of band 5 (0.777935) and band 6 (−0.595506) with reverse signs. Argillic alteration zone (kaolinite and alunite) displays absorption in band 5 (2.145–2.185 μm) [20,46,47]. Thus, argillic alteration can be mapped as bright pixels in the PC4 image. A pseudo-color ramp of image PC4 is shown in Figure 7B. Argillic alteration (strong to moderate) is mainly mapped in the shale and sandstone, ophiolite mélange, ultrabasic, some part andesitic units and conglomerate and Quaternary deposits. The results are almost identical with the band ratio of 5/6 (see Figure 6B).
Looking at the eigenvector matrix of bands 1, 4, 6 and 7 for identifying the phyllic zone (Table 6), it seems that the PC4 contains information for mapping this alteration zone. Strong loading in band 6 (−0.752127) with a negative sign and strong positive loading in band 6 (0.652273) is presented for the PC4. Phyllic alteration exhibits absorption in band 7 (2.235–2.285 μm) and reflectance in band 6 (2.185–2.225 μm) [19]. Accordingly, the phyllic zone will appear as dark pixels in the PC4 image. This image is negated (by multiplication to −1) for converting the dark to bright pixels. Strong spatial distribution of phyllic zone is associated with dacitic dyke, conglomerate, limestone, basalt, tuff, andesite and quaternary sediments (Figure 7C). The SPCA results for mapping phyllic zone are matched to band ratio of 7/6 (see Figure 6C).
Analyzing the eigenvector matrix of bands 1, 4, 8 and 9 is considered for detecting propylitic zone (Table 7). The PC4 has strong loading in band 8 (−0.705894) with a negative sign and strong loading in band 9 (0.707293) with a positive sign. The propylitic zone is characterized by absorption features of Fe, Mg-OH and CO3 [48]. The absorption features are situated in band 8 (2.295–2.365 μm) [47]. Thus, propylitic zone can be mapped as bright pixels in the PC4 image with considering band 9 as reflectance band. Propylitic alteration is detected in ophiolite mélange, shale and sandstone, ultrabasic rocks, basalt, andesite and some parts of conglomerate, limestone, and Quaternary sediments (Figure 7D). The identified propylitic zone is almost identical with the band ratio (9/8) results, however, SPCA shows strong surface distribution in northwestern and western parts of the study area. Propylitic, gossan and argillic zones are typically mapped in the location of copper deposits, old mines, and indices in the study area (see Figure 6 and Figure 7).

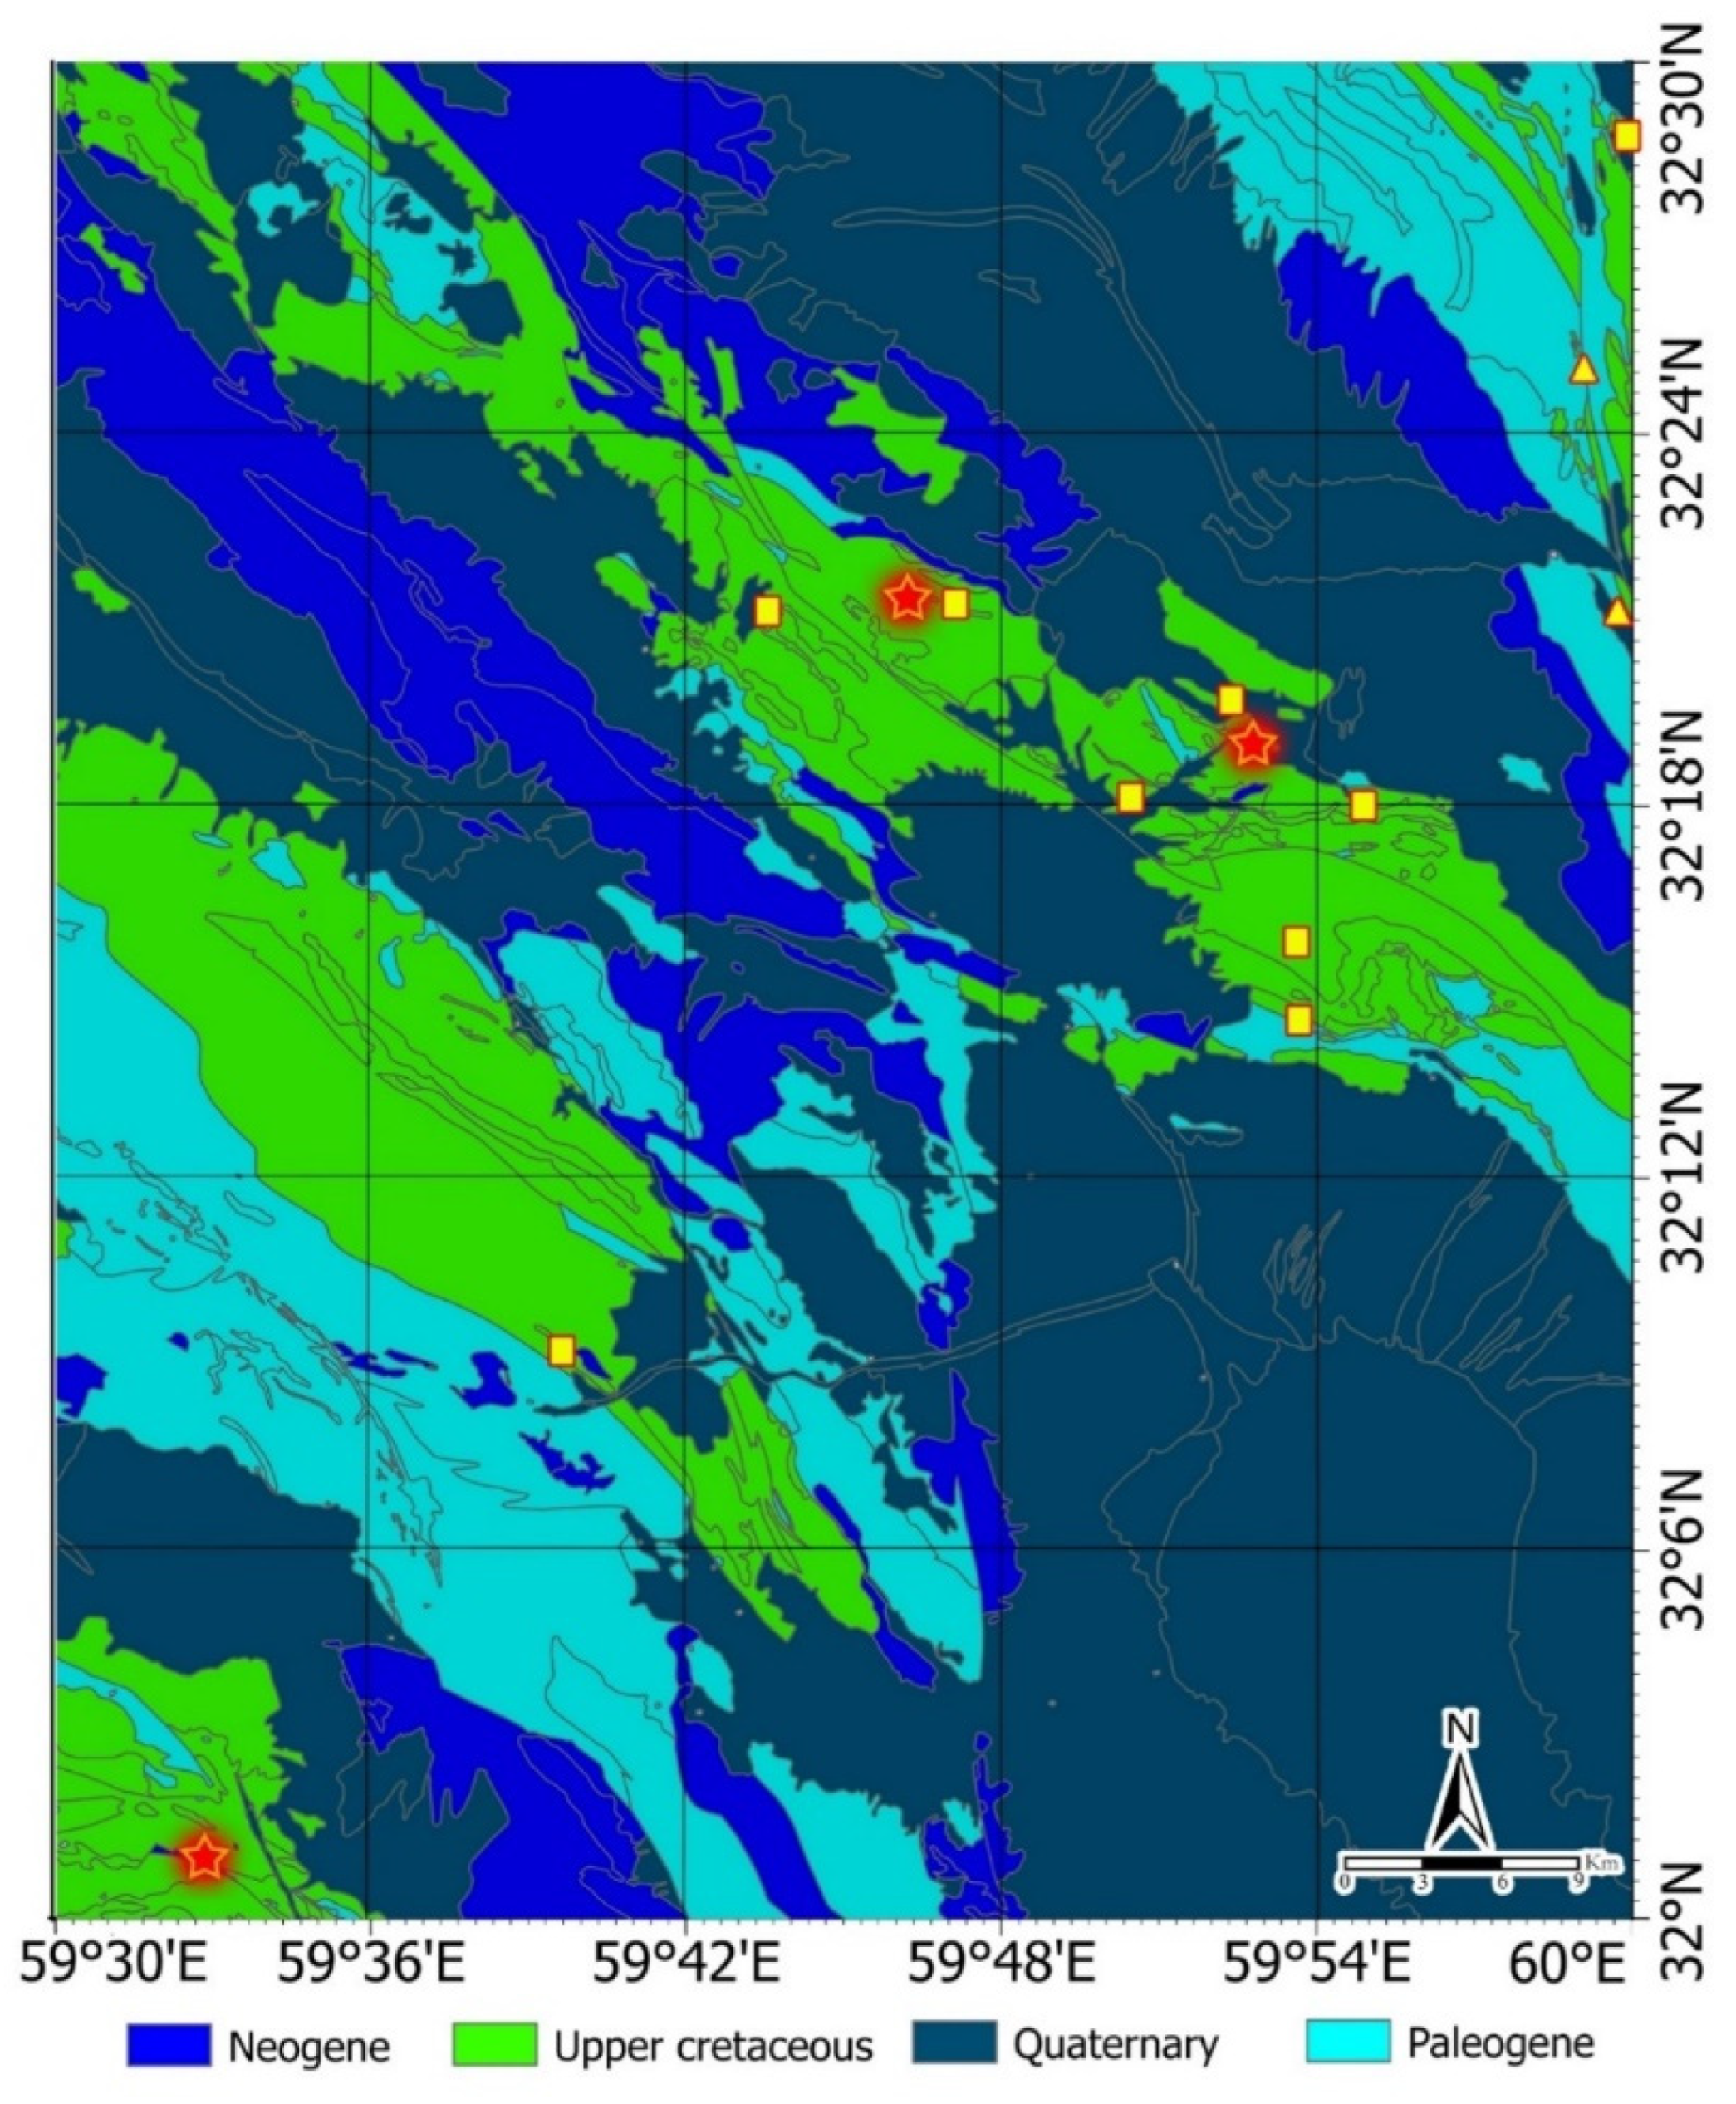
4.2. Geological Maps Derived from the Geochronology, Structures and Geochemistry

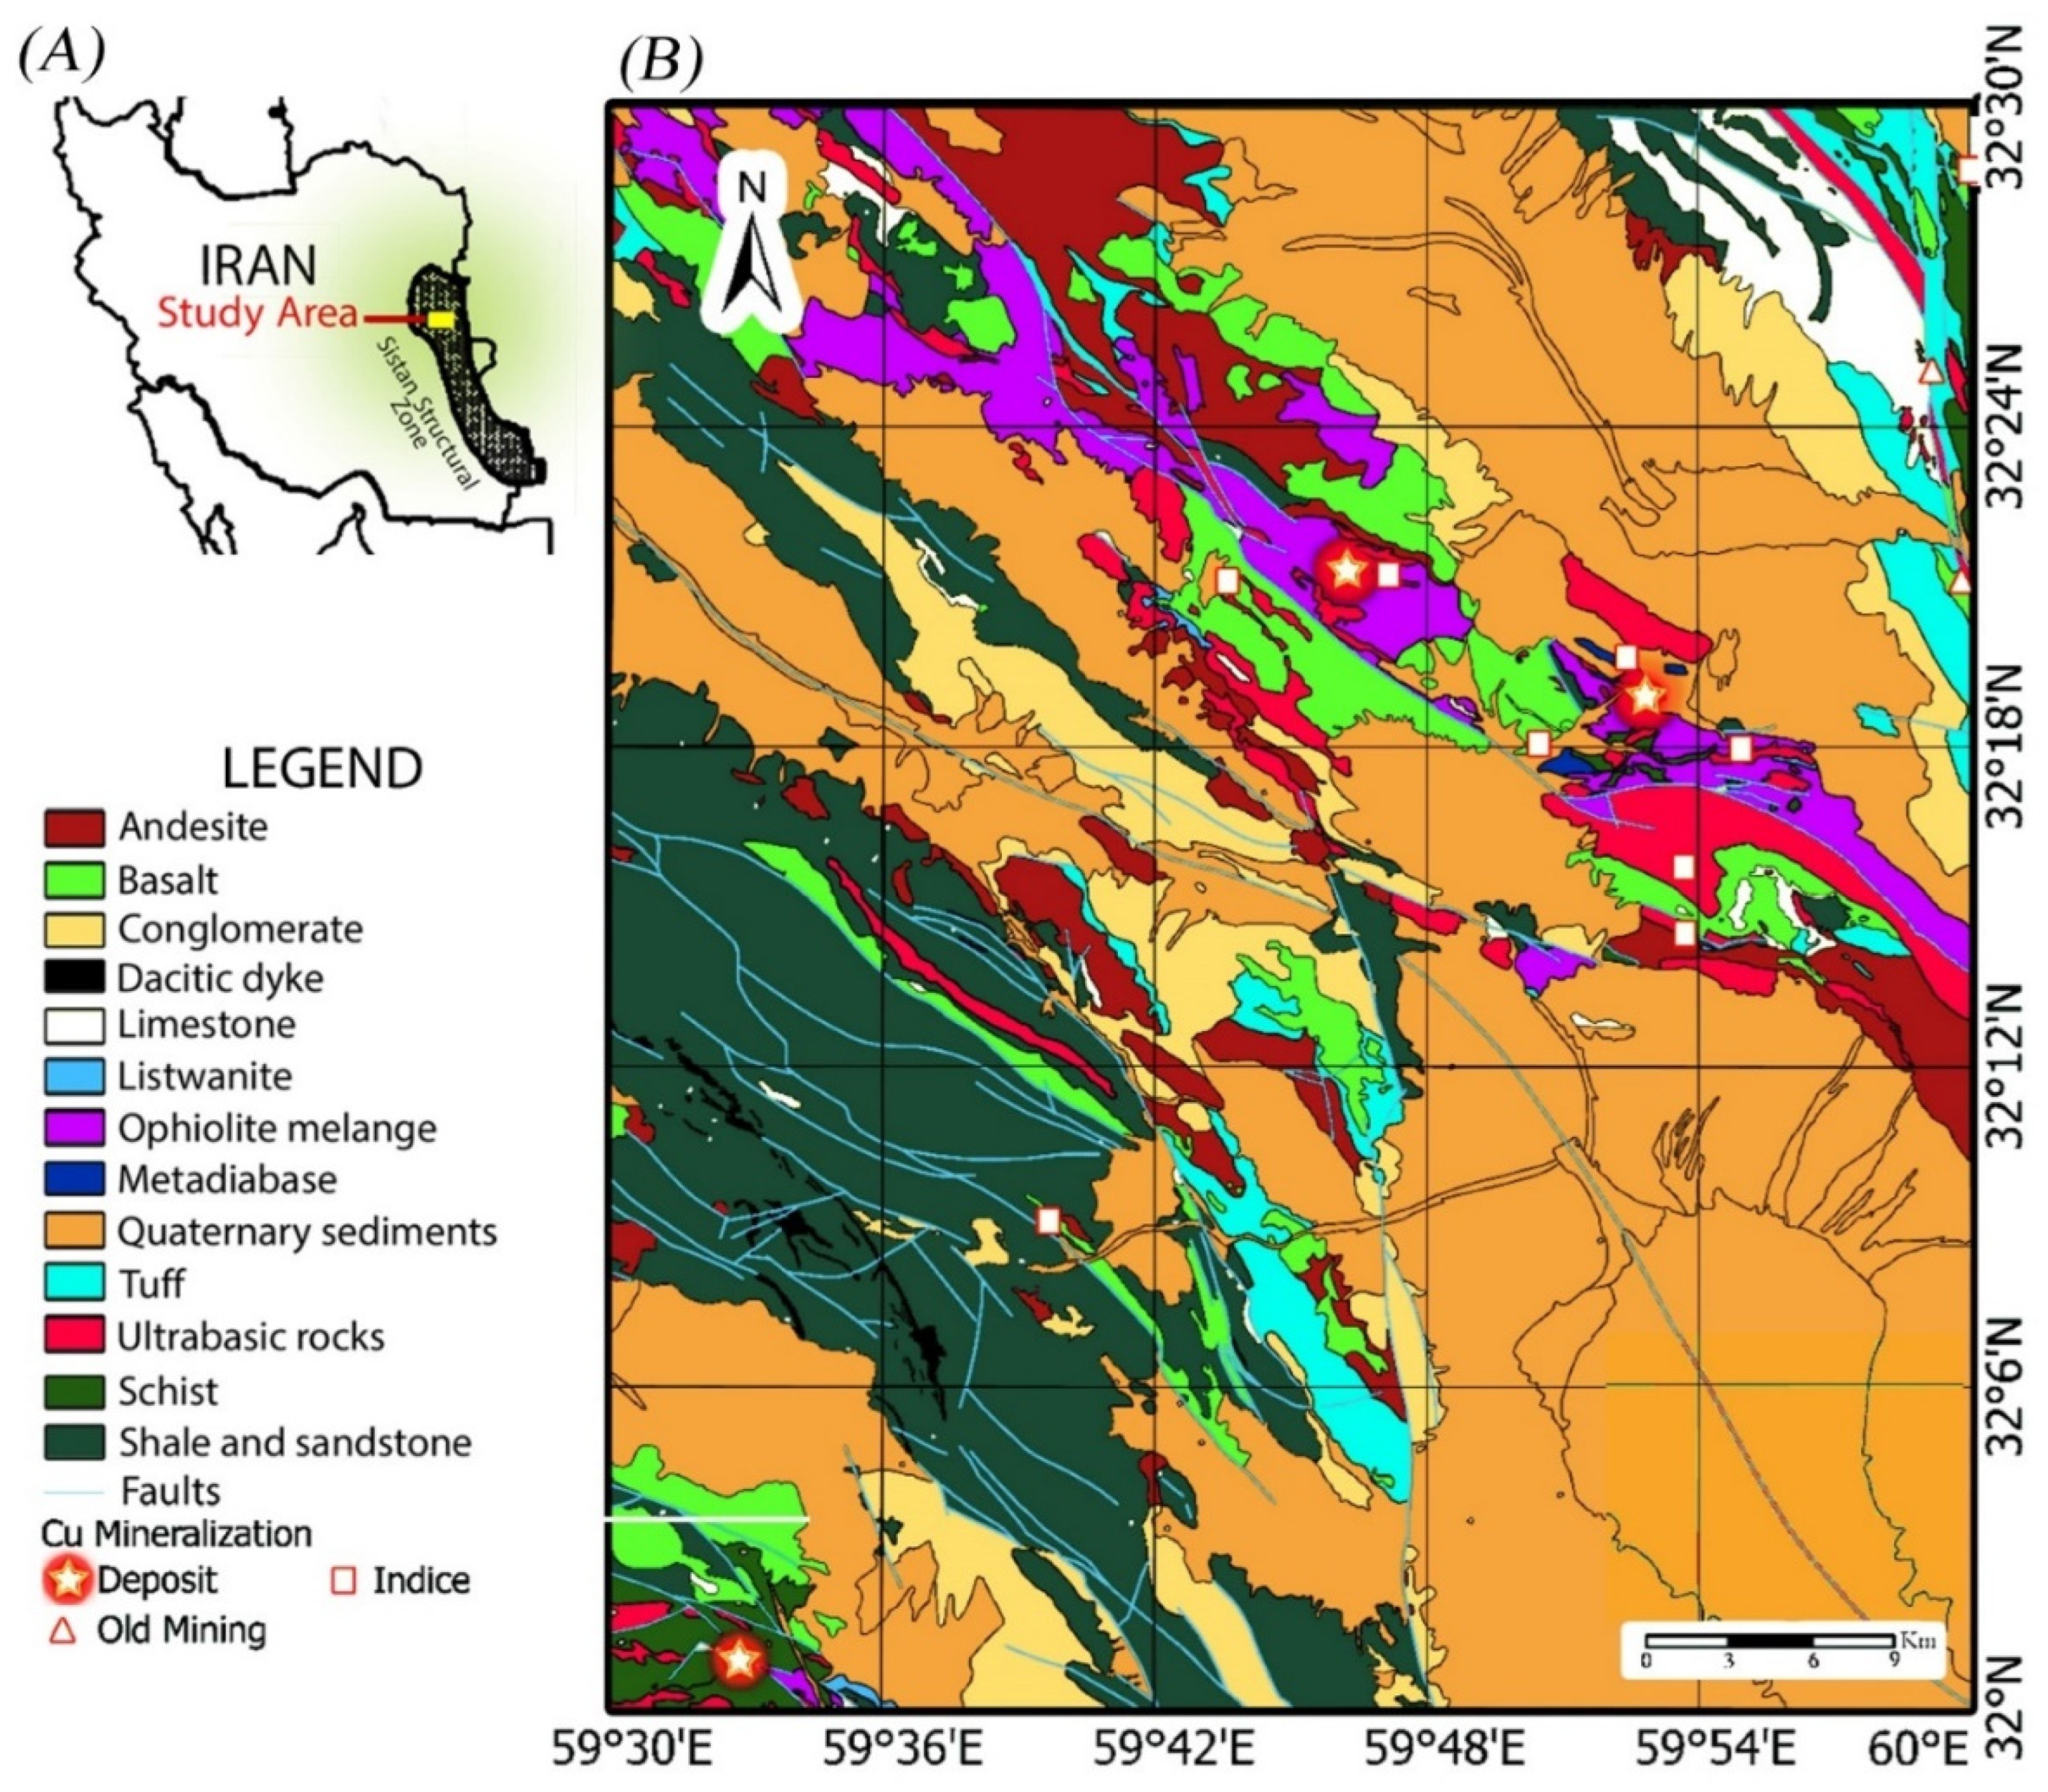
The host-rock of the known VMS copper deposits in the study area, namely Mesgaran, Chah-Raste and Zahri are documented as andesite, andesite-basalt and basalt units. Ultrabasic unit, ophiolite melange and schist are also related to structurally-controlled copper mineralization in the study area [20,31]. The geological ages of the above mentioned lithologies are Upper Cretaceous and Paleogene (see Table 2 and Table 3). A geochronological map of the study area was generated (Figure 8). This map shows the spatial distribution of lithological units for the geological ages of Neogene, Upper Cretaceous, Quaternary and Paleogene. Copper deposits, old mines, and indices in the study area are mostly hosted in Upper Cretaceous and Paleogene units (Figure 8). The three main copper deposits are placed in Upper Cretaceous units. However, old mines and some of the indices are situated in Paleogene units (see Figure 8).
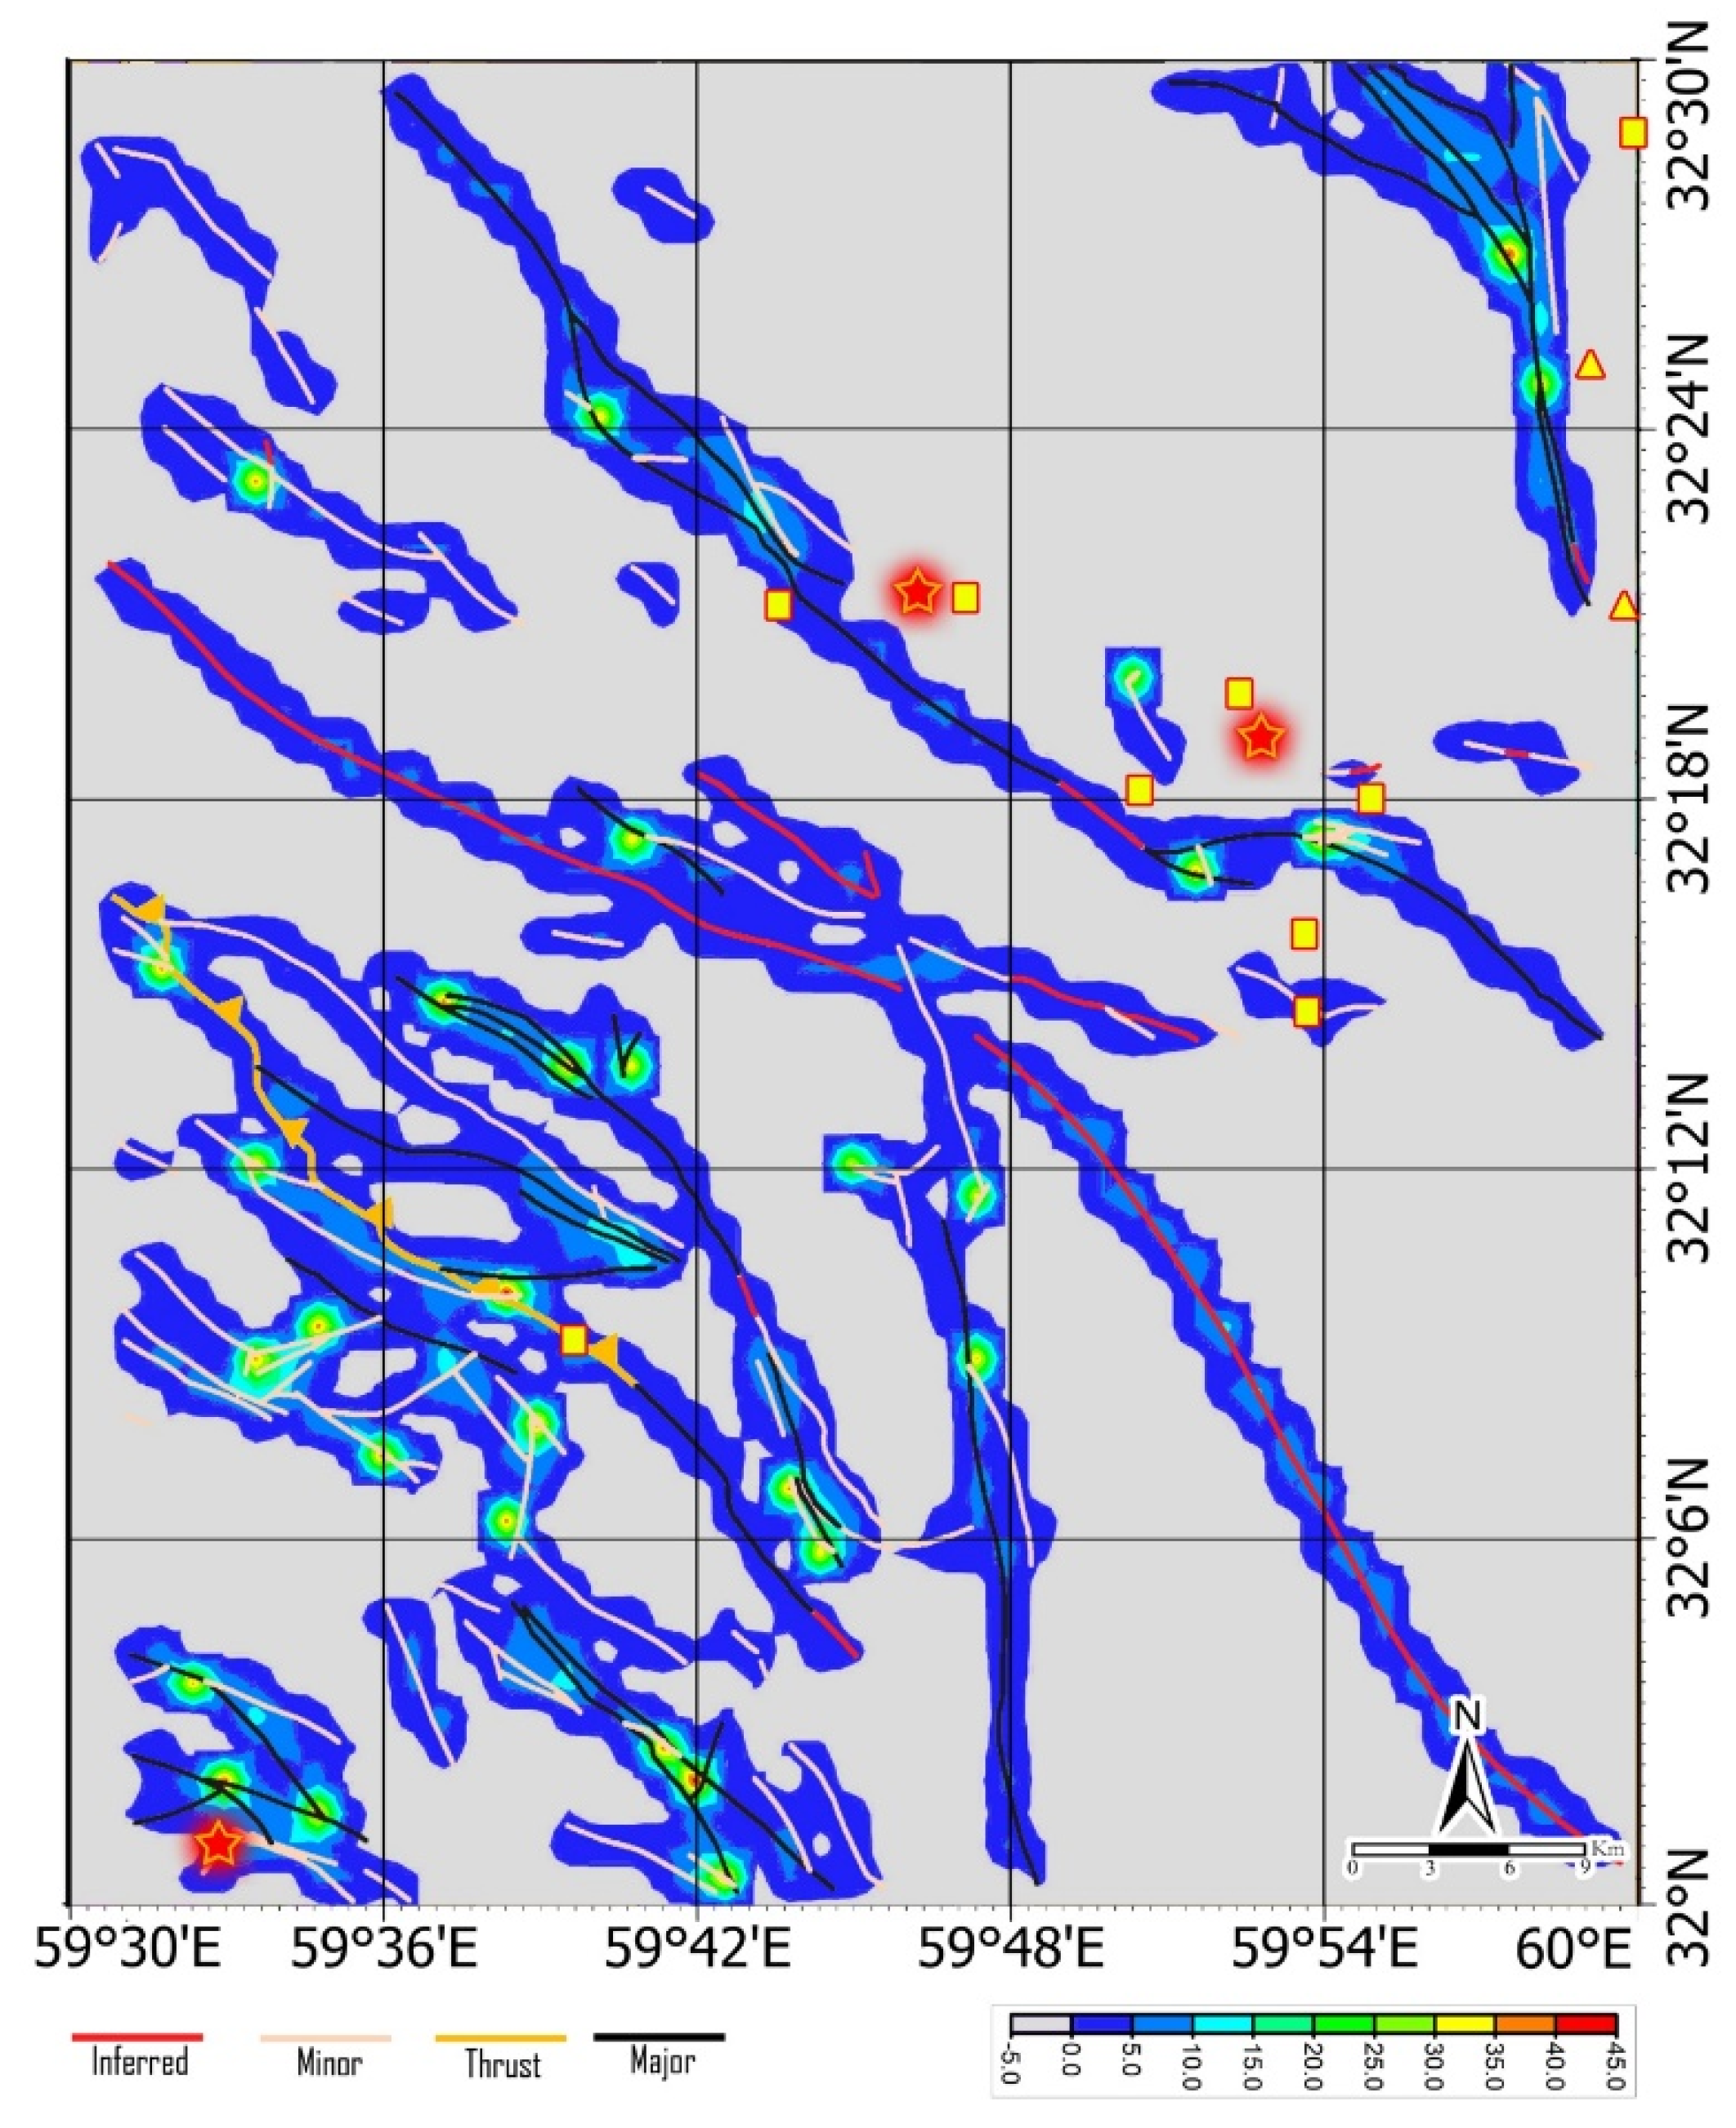
In the study area, fault systems and copper mineralization have a close relationship. The fault system controlled the trend of the host lithology of copper mineralization [31]. Previous research in the study area confirmed that the high intensity areas (LF more than 30) is one of the most important factors in identifying copper mineralization [31]. Accordingly, the Lineament Factor (LF) map of the study area was adopted herein (Figure 9). The NW-SE fault systems are controlling the lithology of the host-rock for copper mineralization. The NW-SE fault systems are consistent with the main trend of lithological units related to copper deposits, old mines, and indices in the area (see Figure 9). 
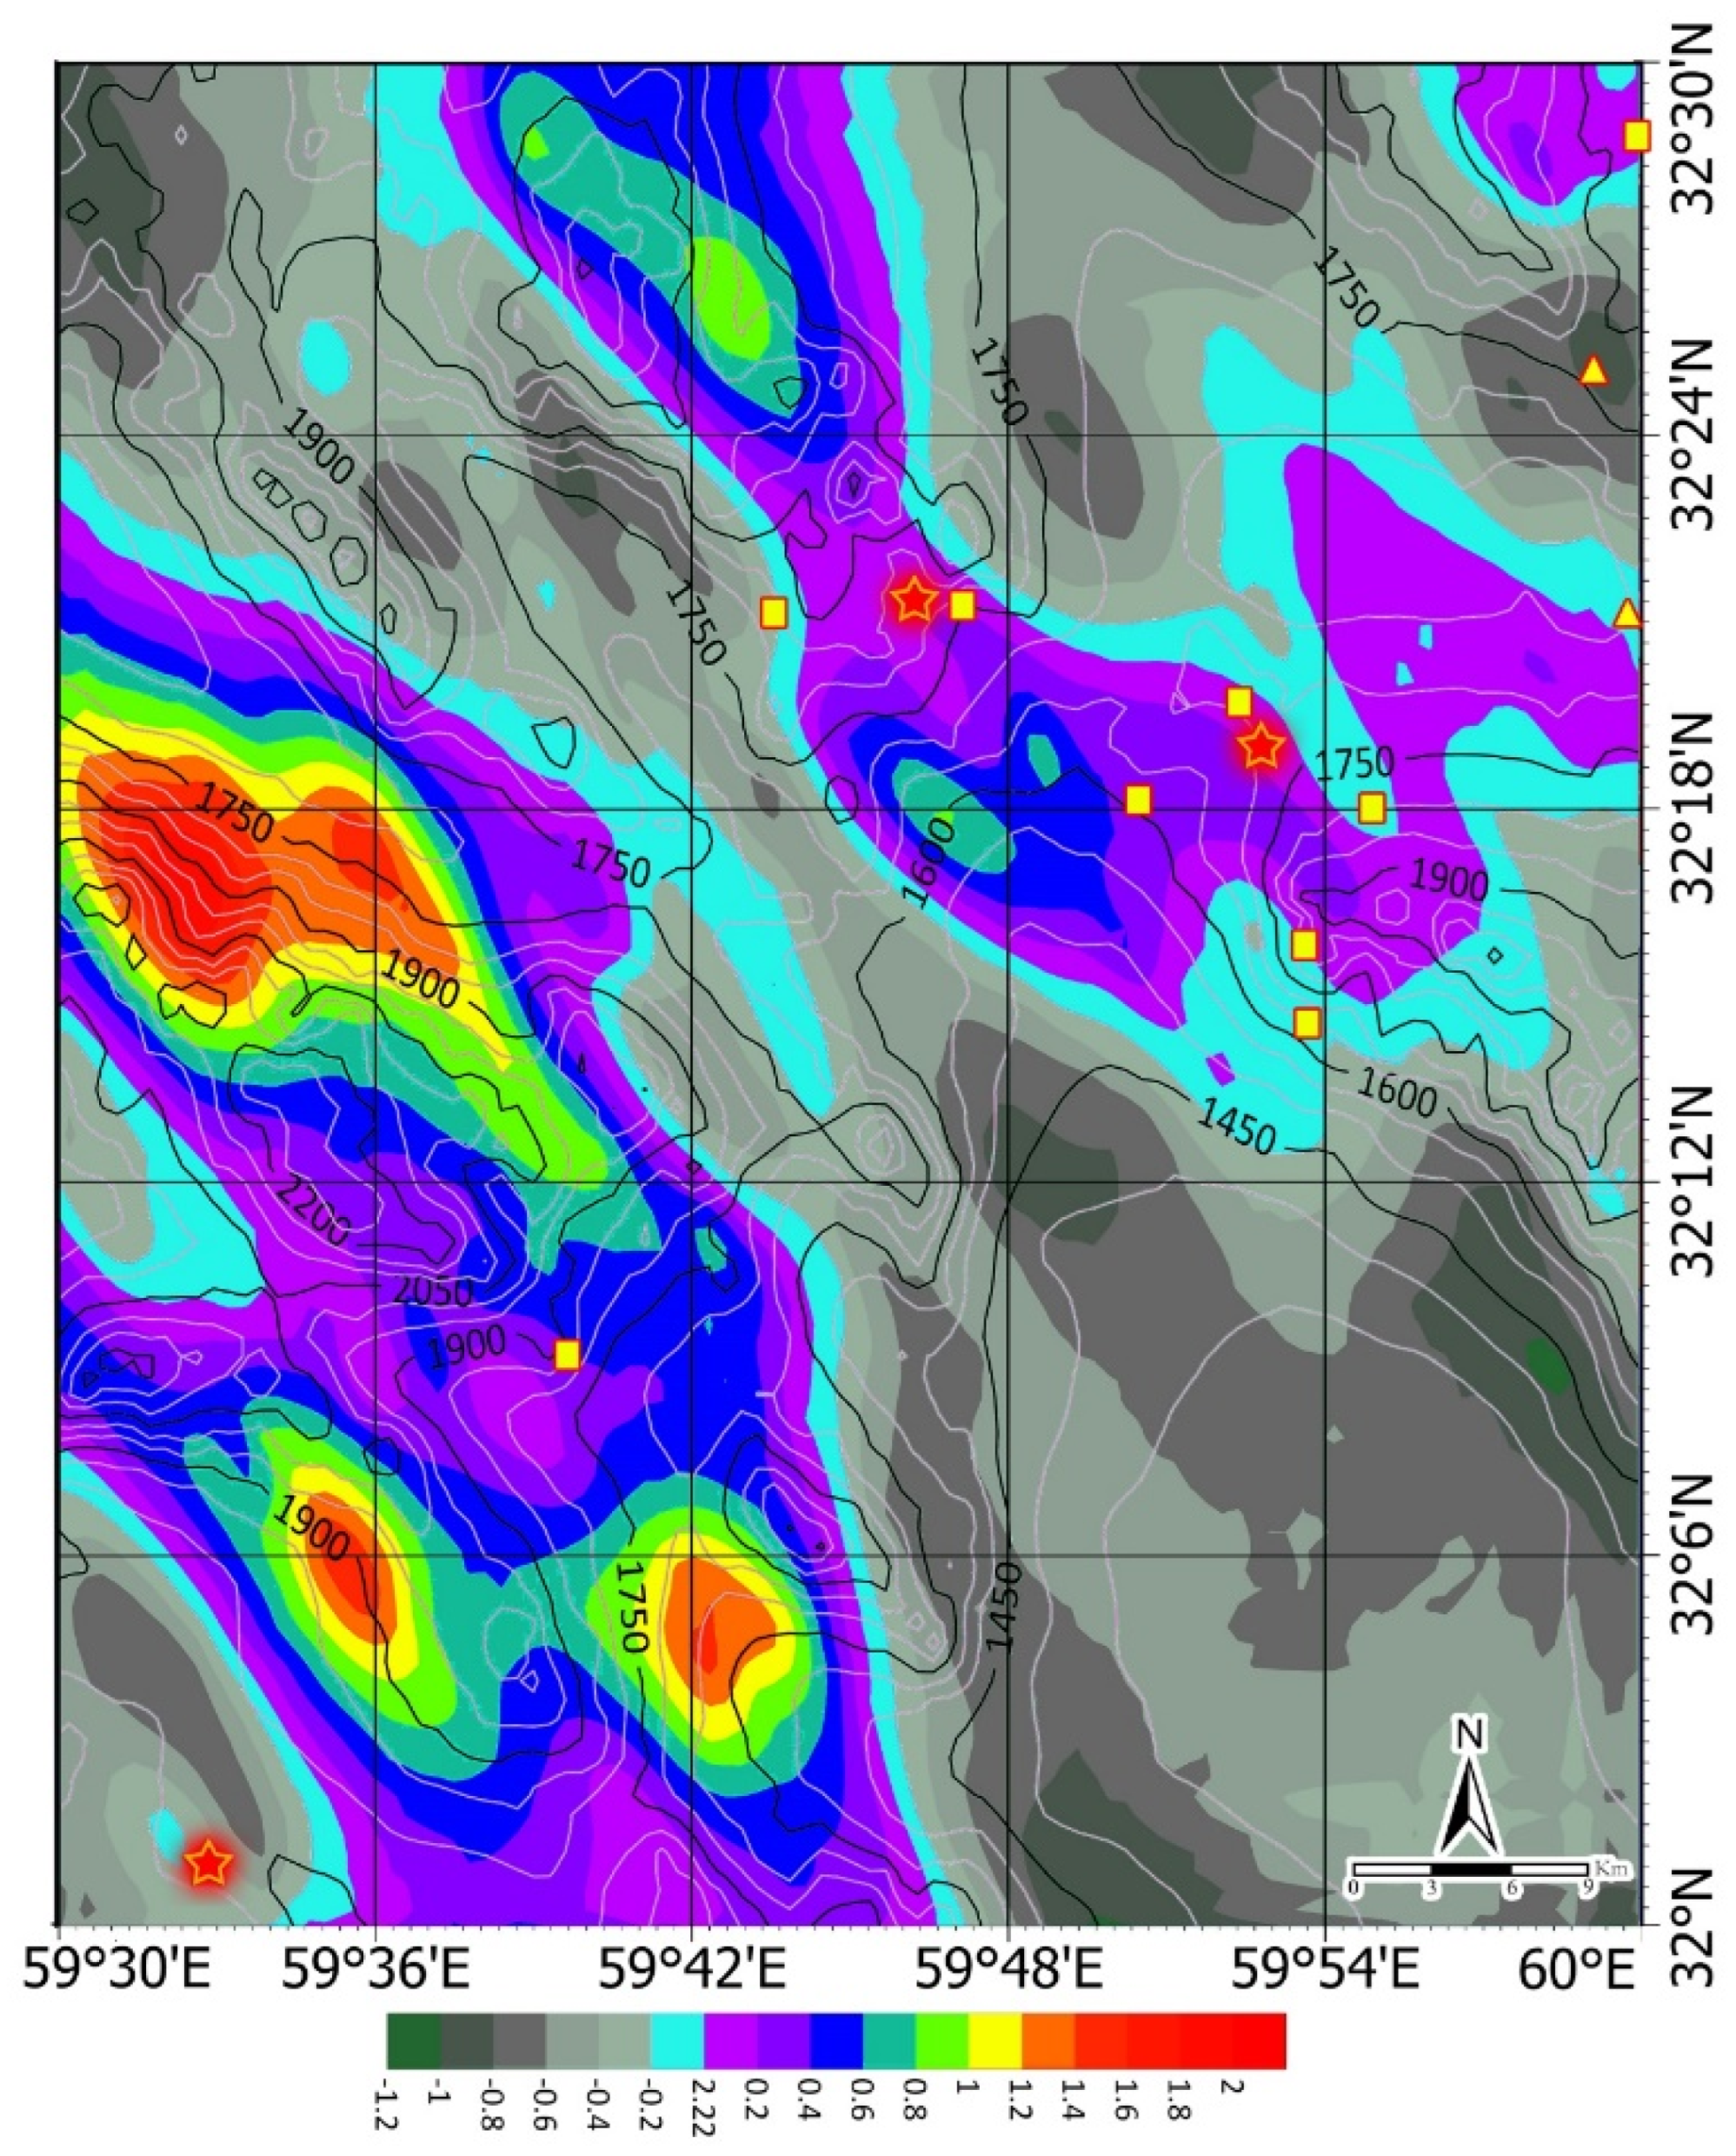
Figure 10 shows the geochemical map for geochemical family of copper (Pb, Zn, Sn, Ag and Mo) in the study area. The elements Pb, Zn, Sn, Ag and Mo were considered as trace elements and predictor composition of copper mineralization in the study area. Hence, the group behavior was investigated to clarify the geochemical relationships of trace elements with the Cu. Copper deposits, old mines, and indices in the study area are mainly associated with moderate to high anomaly zones (Figure 10).

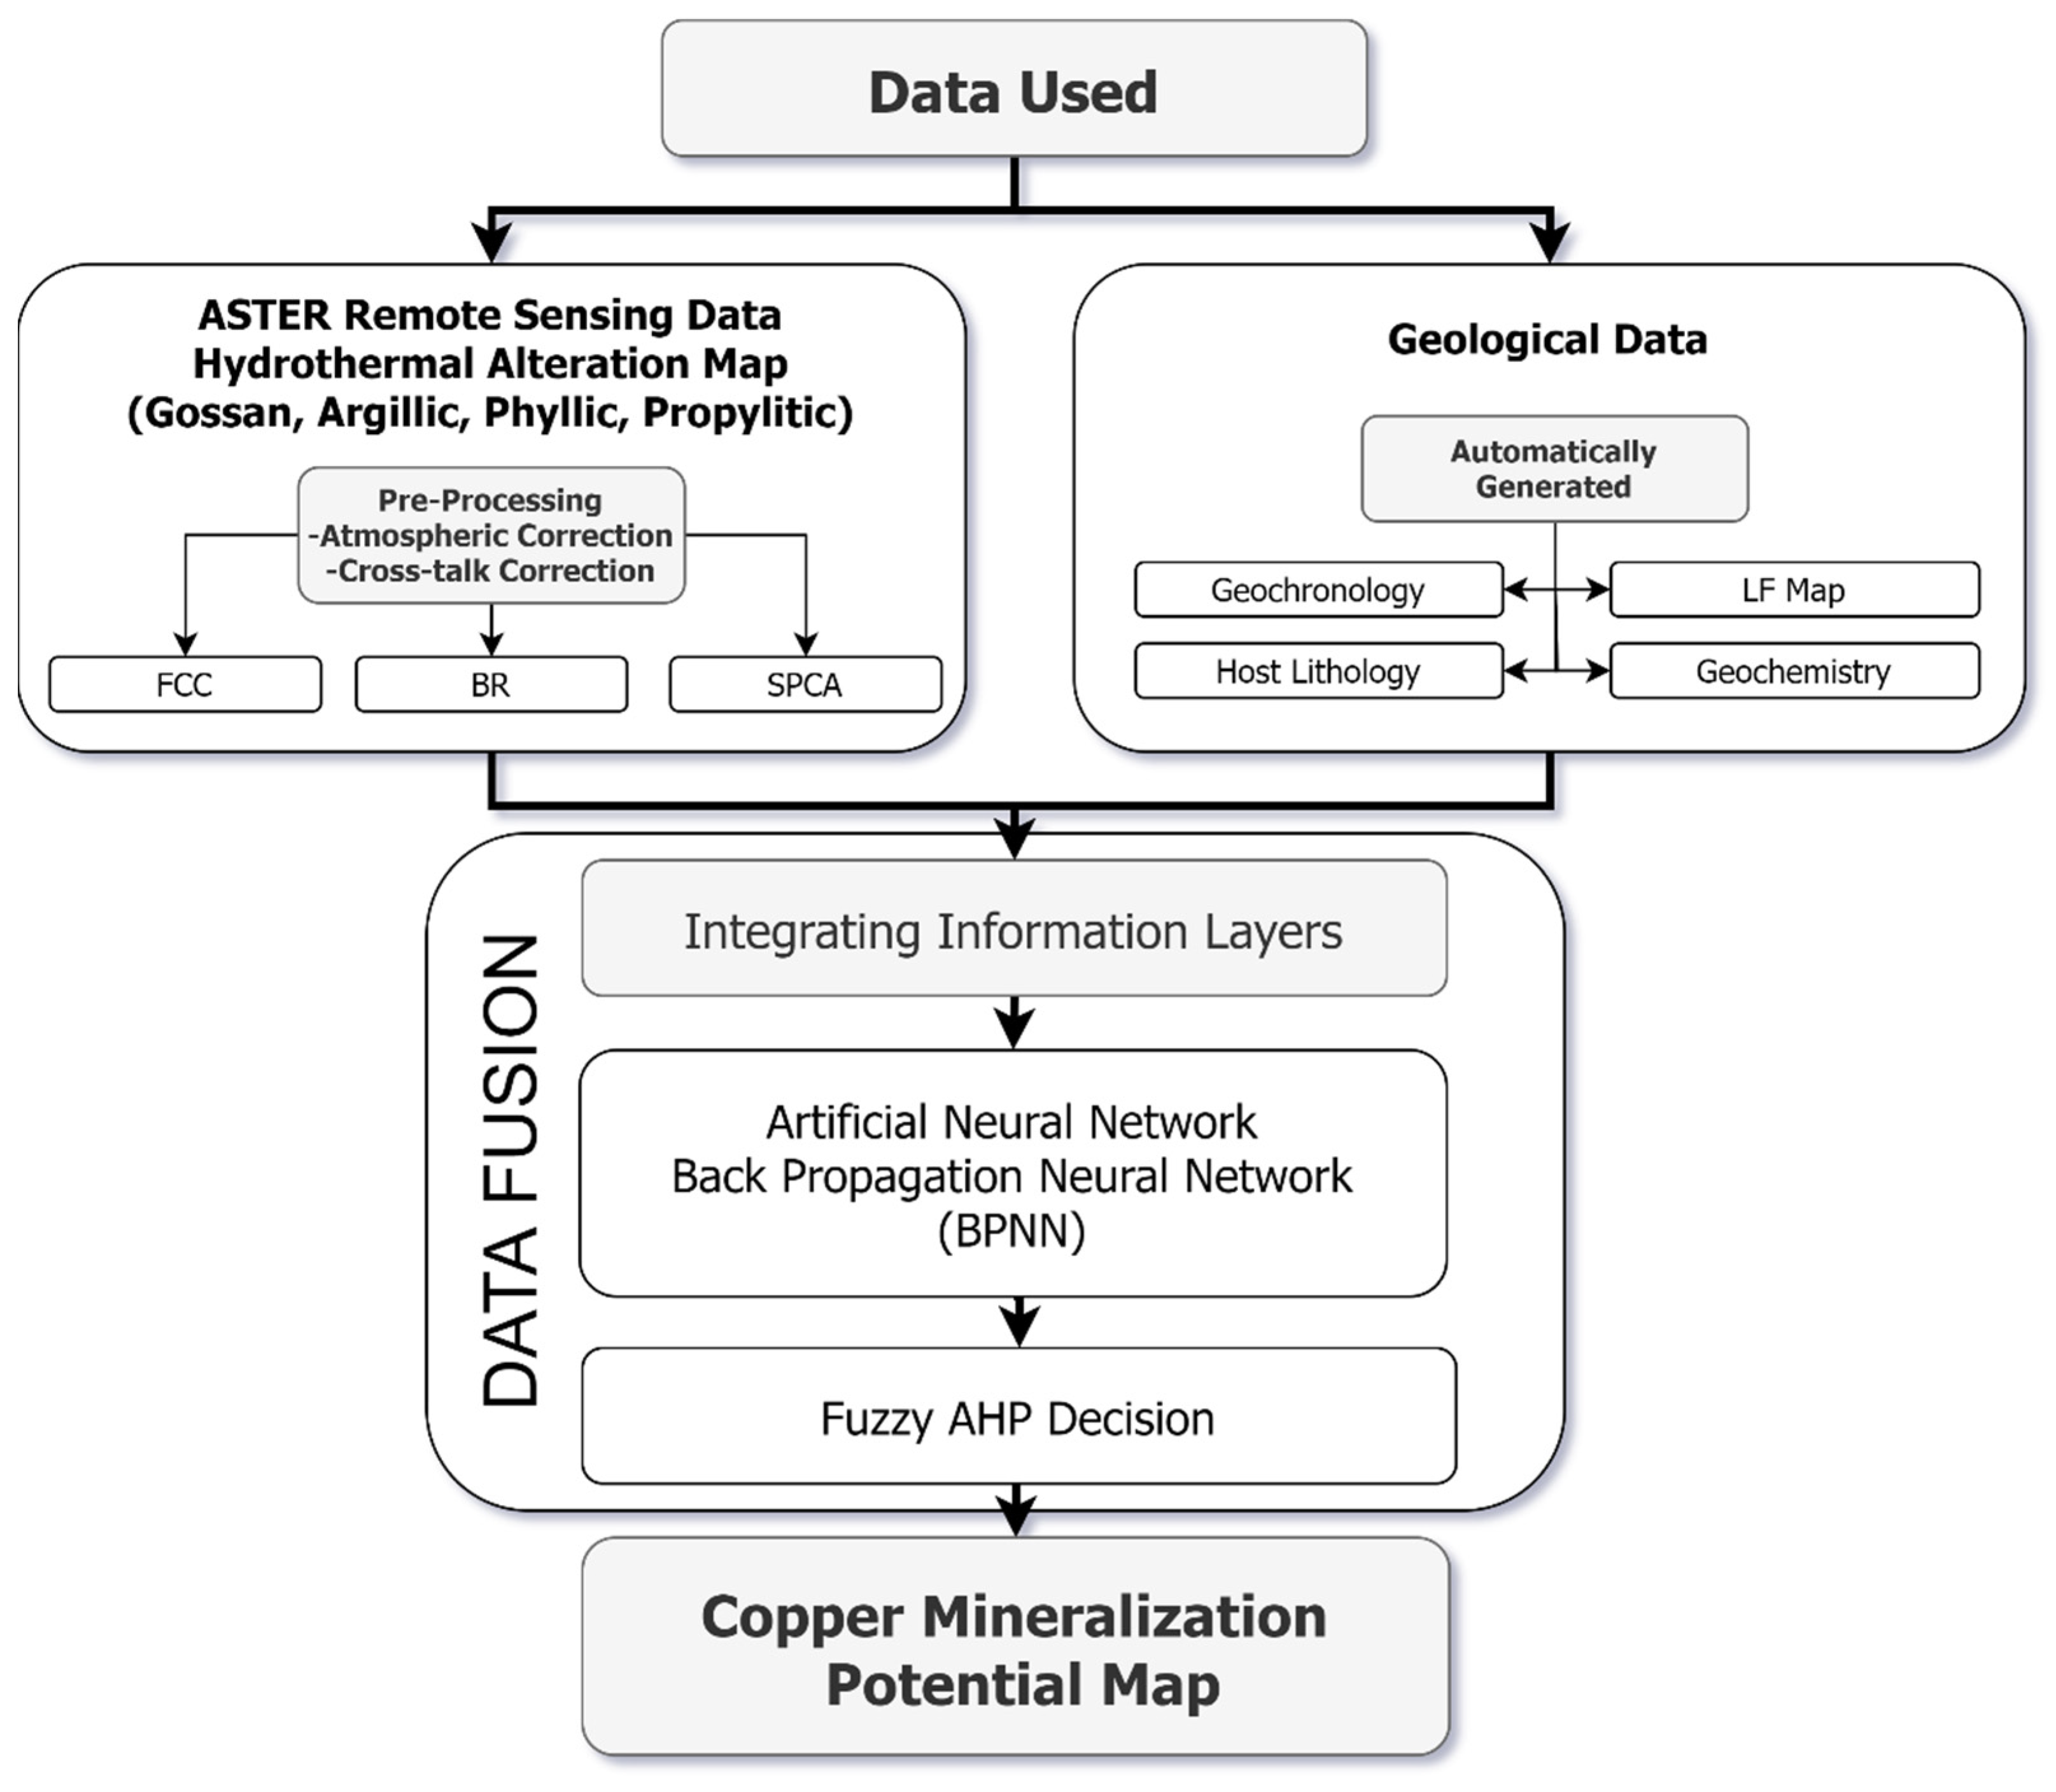
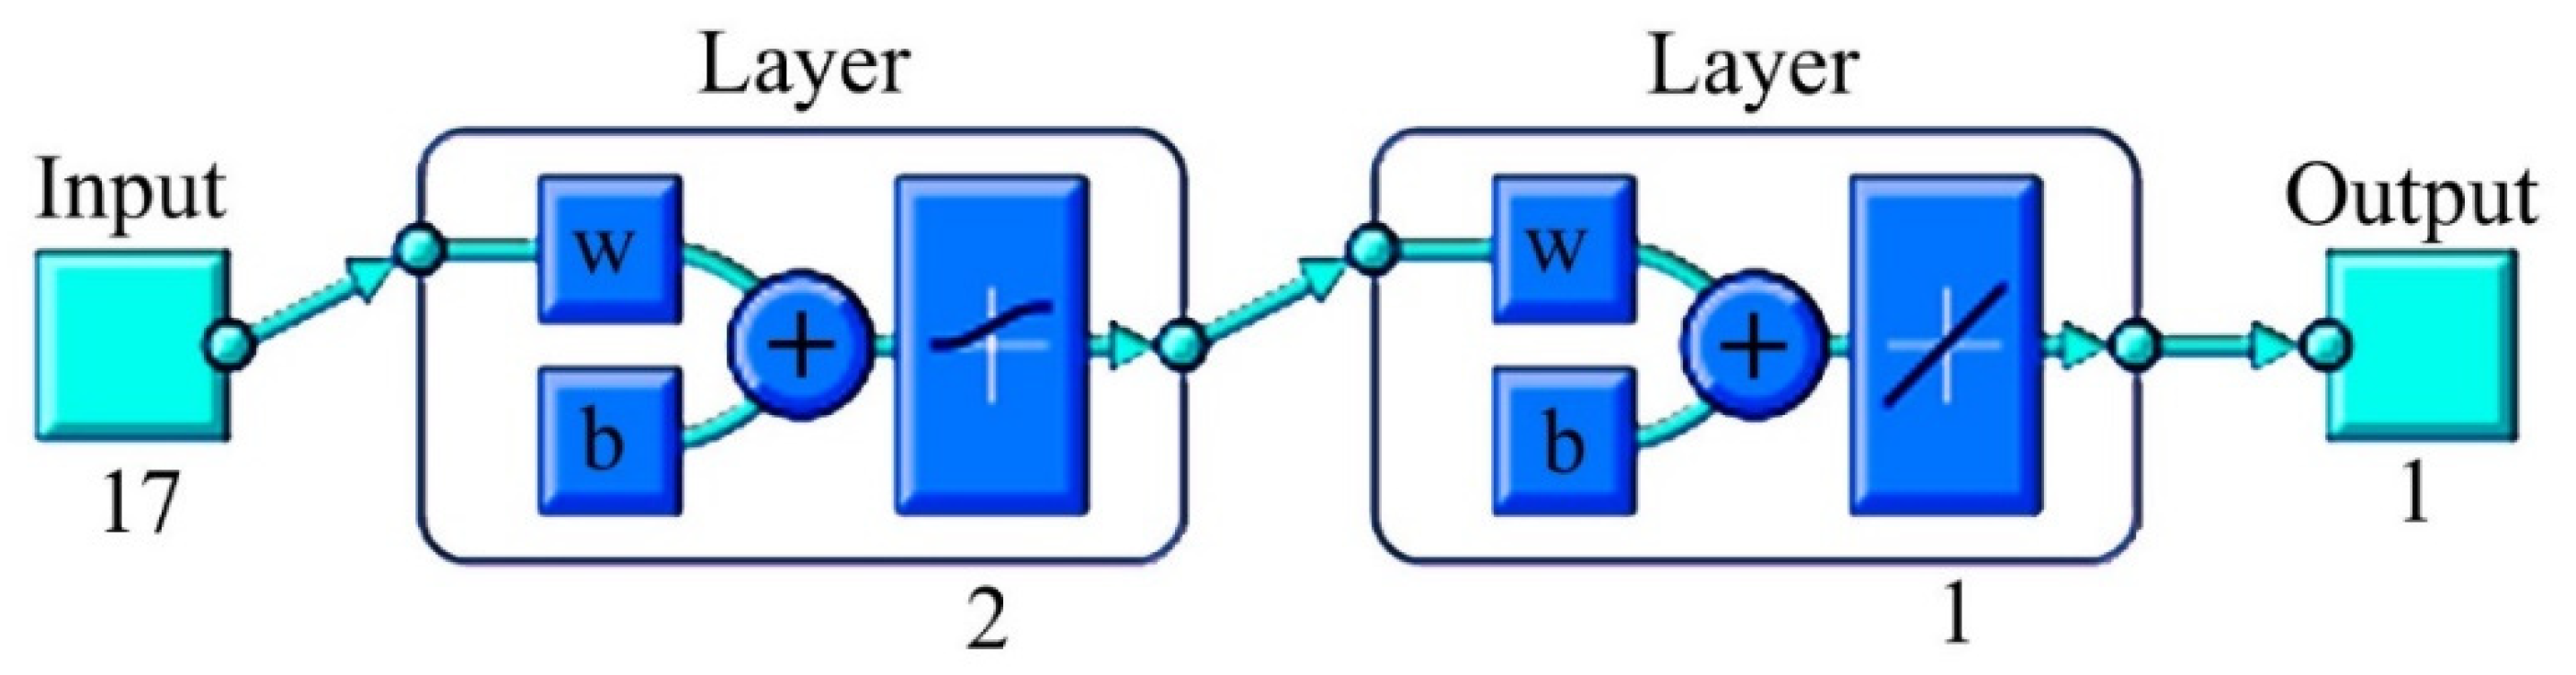
4.3. Fusion of Information Layers

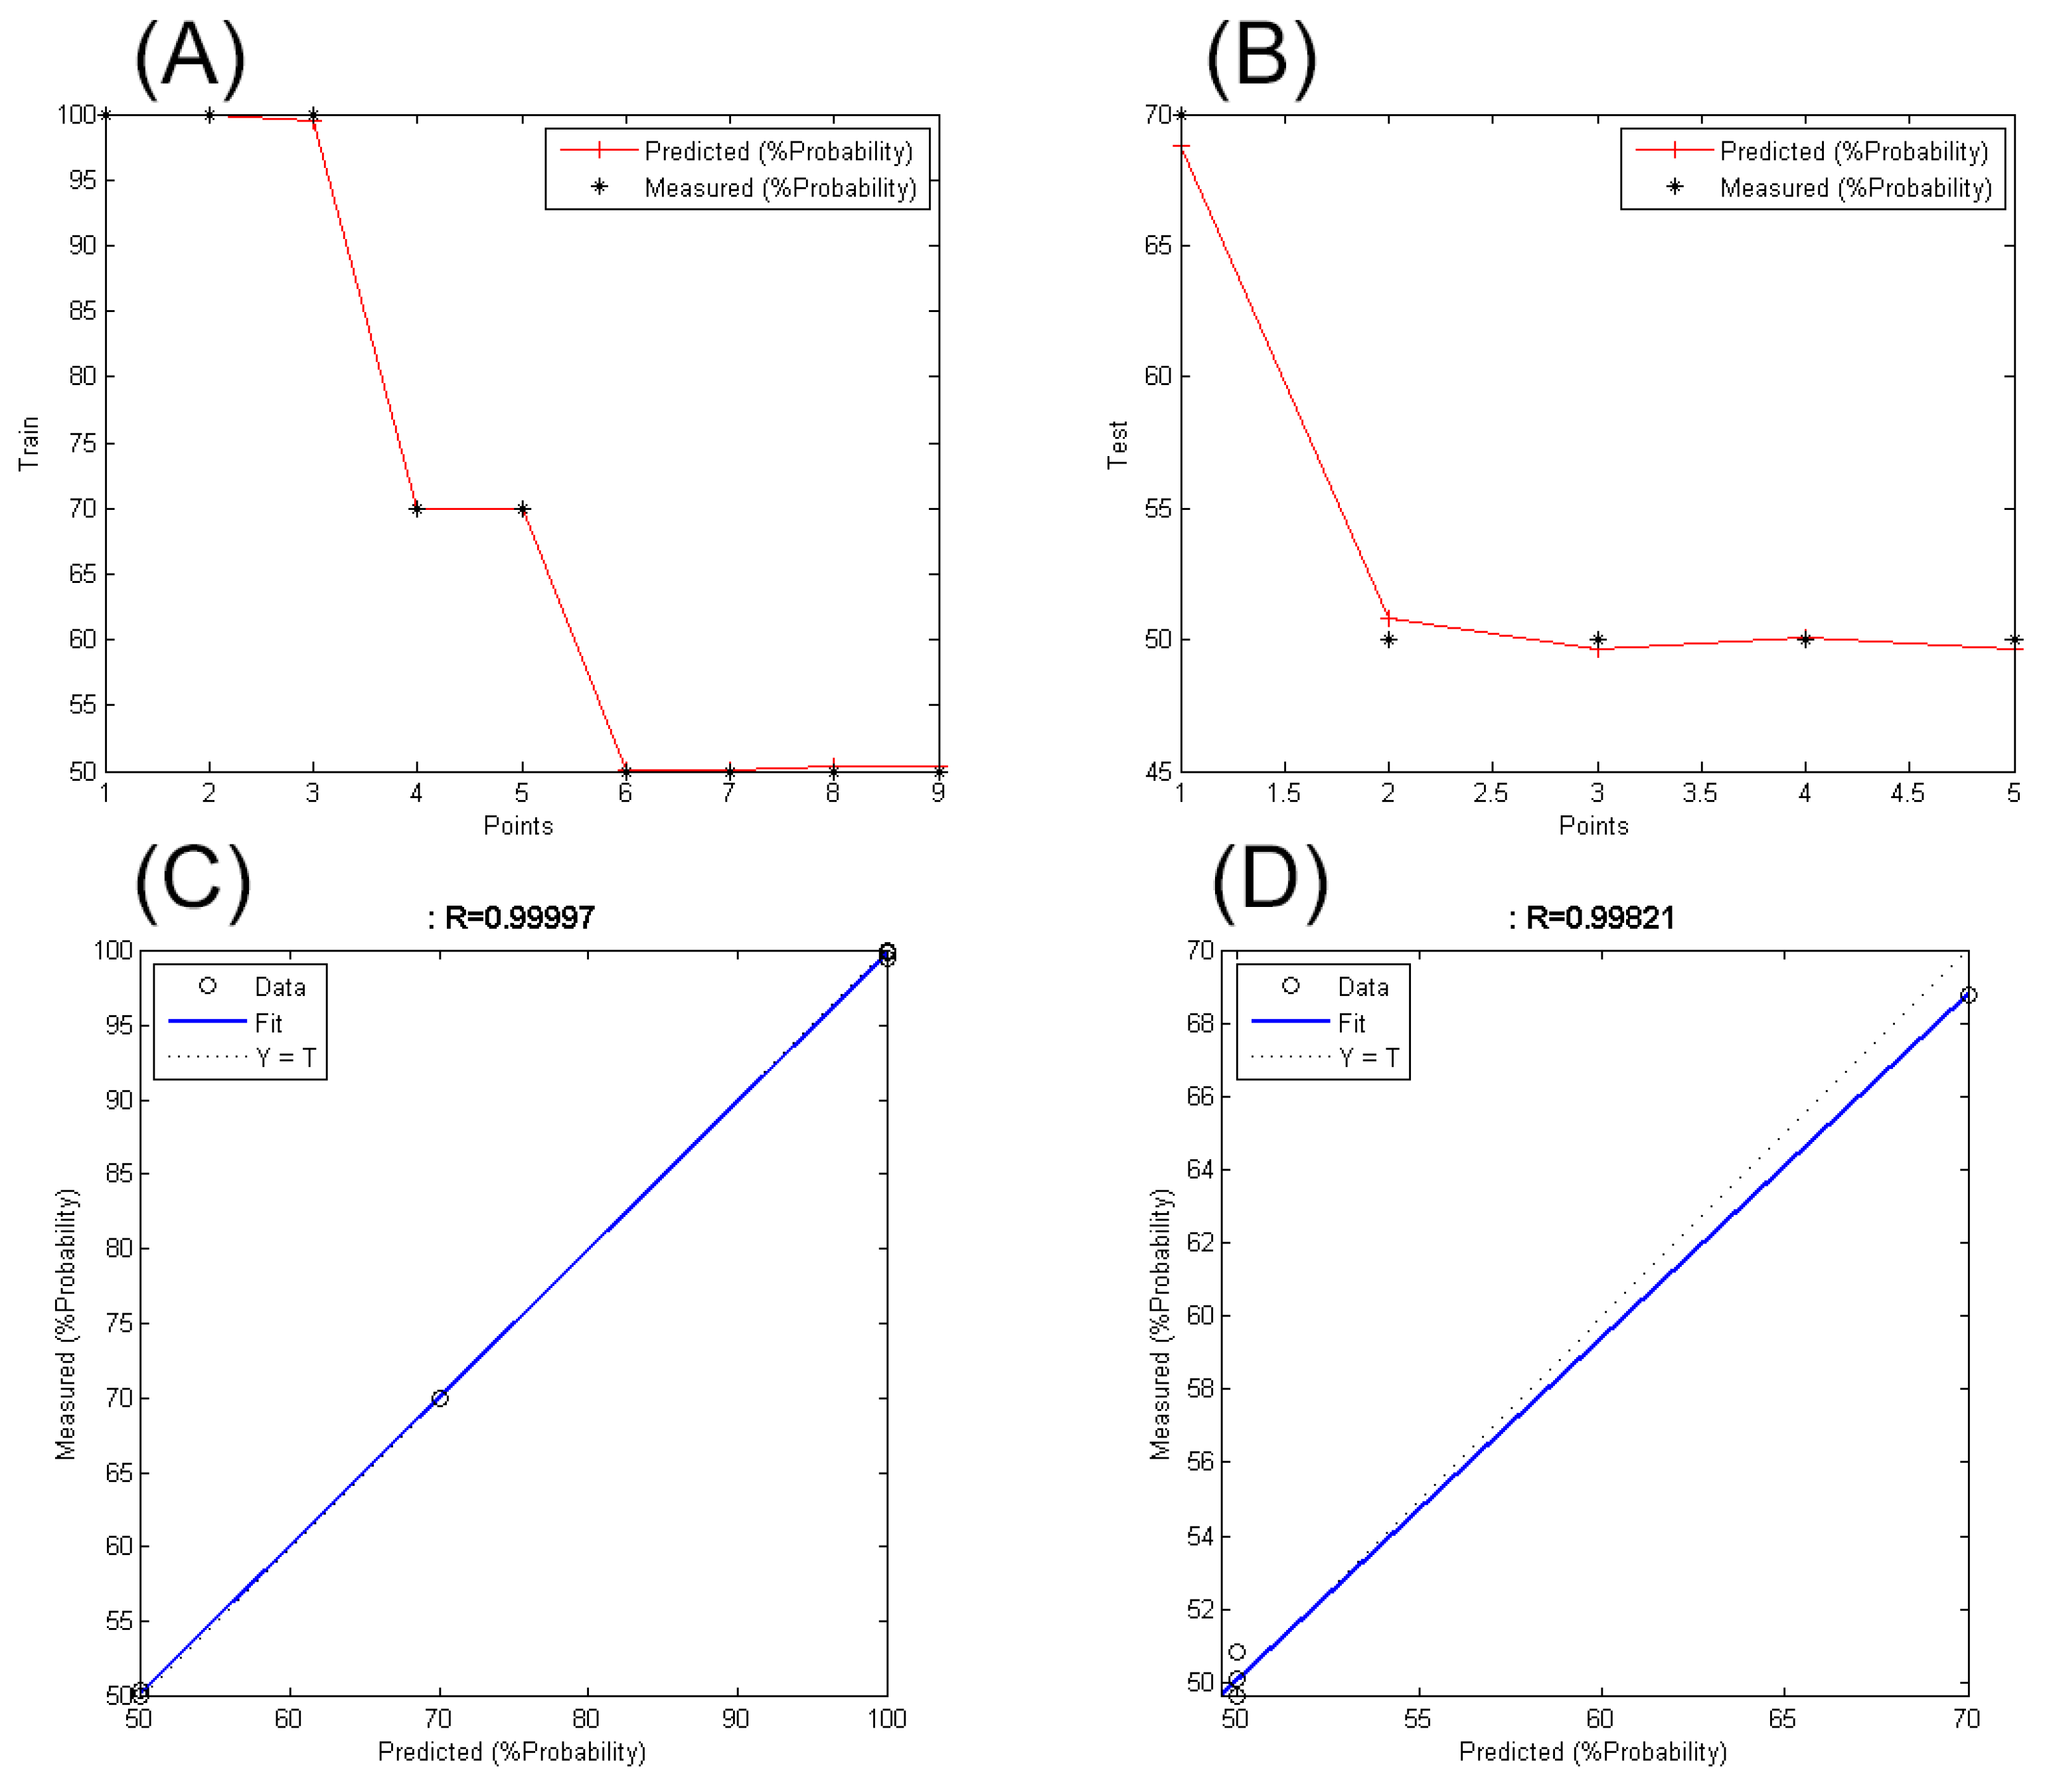
In the BPNN algorithm, the training data (see Table 3) should be divided into two categories (30% to 70%). For this purpose, the training data were randomly divided into two groups and 70% of the group entered the artificial neural network. The result of the estimated line of copper mineralization with real points in the training data and test data is presented in Figure 11A,B and the accuracy of the training data and test data was estimated (Figure 11C,D). According to the results, the accuracy value for training data and test data is over 99%. This result indicates a high performance of the BPNN algorithm in predicting information about copper mineralization in the Sahlabad mining area. In other words, the information obtained from copper exploration studies in the area is practically 99% reliable and is sufficiently fit to be used in the decision-making process and the integration of information layers.
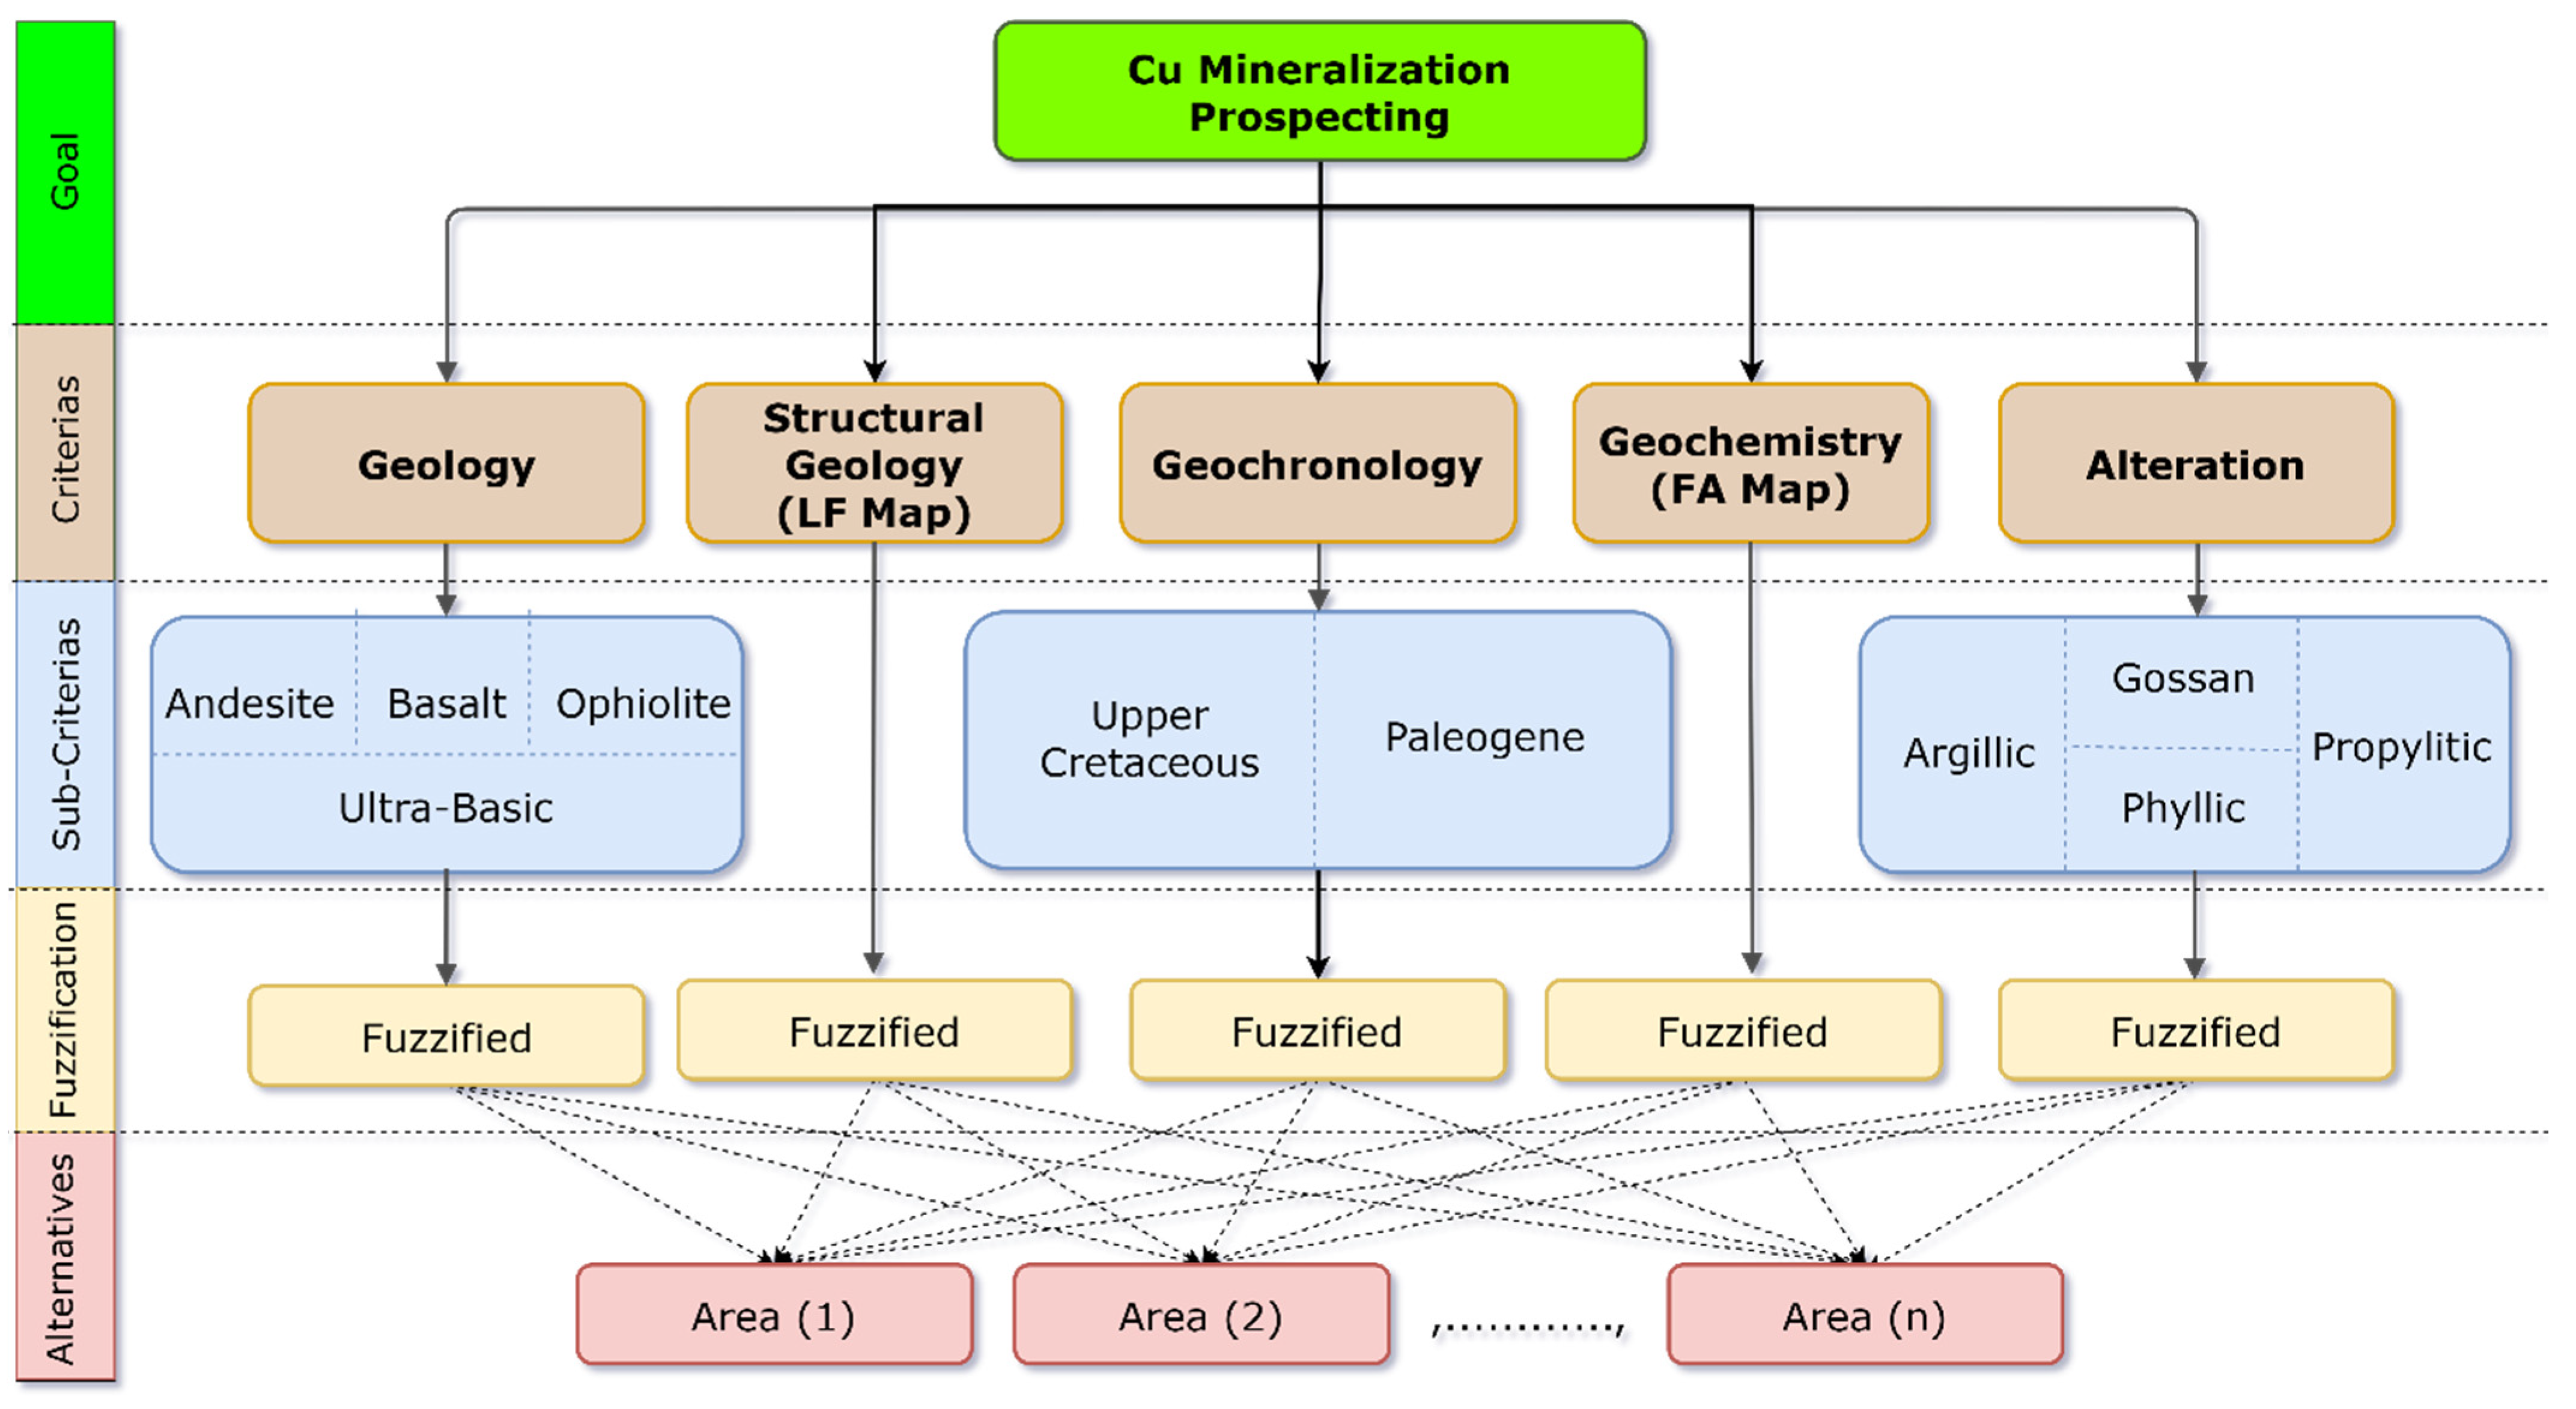
After determining the main criteria and sub-criteria in the Fuzzy-AHP method (see Figure 4), their weights were calculated successively. A paired comparison matrix was formed for the main criteria and sub-criteria and based on expert opinions and prioritization table [45,46]. The main criteria and sub-criteria weights were calculated by paired comparison. Paired comparison matrices for the main criteria and sub-criteria are presented in Table 8, Table 9, Table 10 and Table 11, respectively. According to the calculations performed for each of the above paired comparison matrices, the Inconsistency Rate (IR) (%) was obtained for the main criteria and sub-criteria matrices (Table 12). Given that all Inconsistency Rates (IRs) are less than 10%, it can be said that the consistency of the expert judgment is accepted [
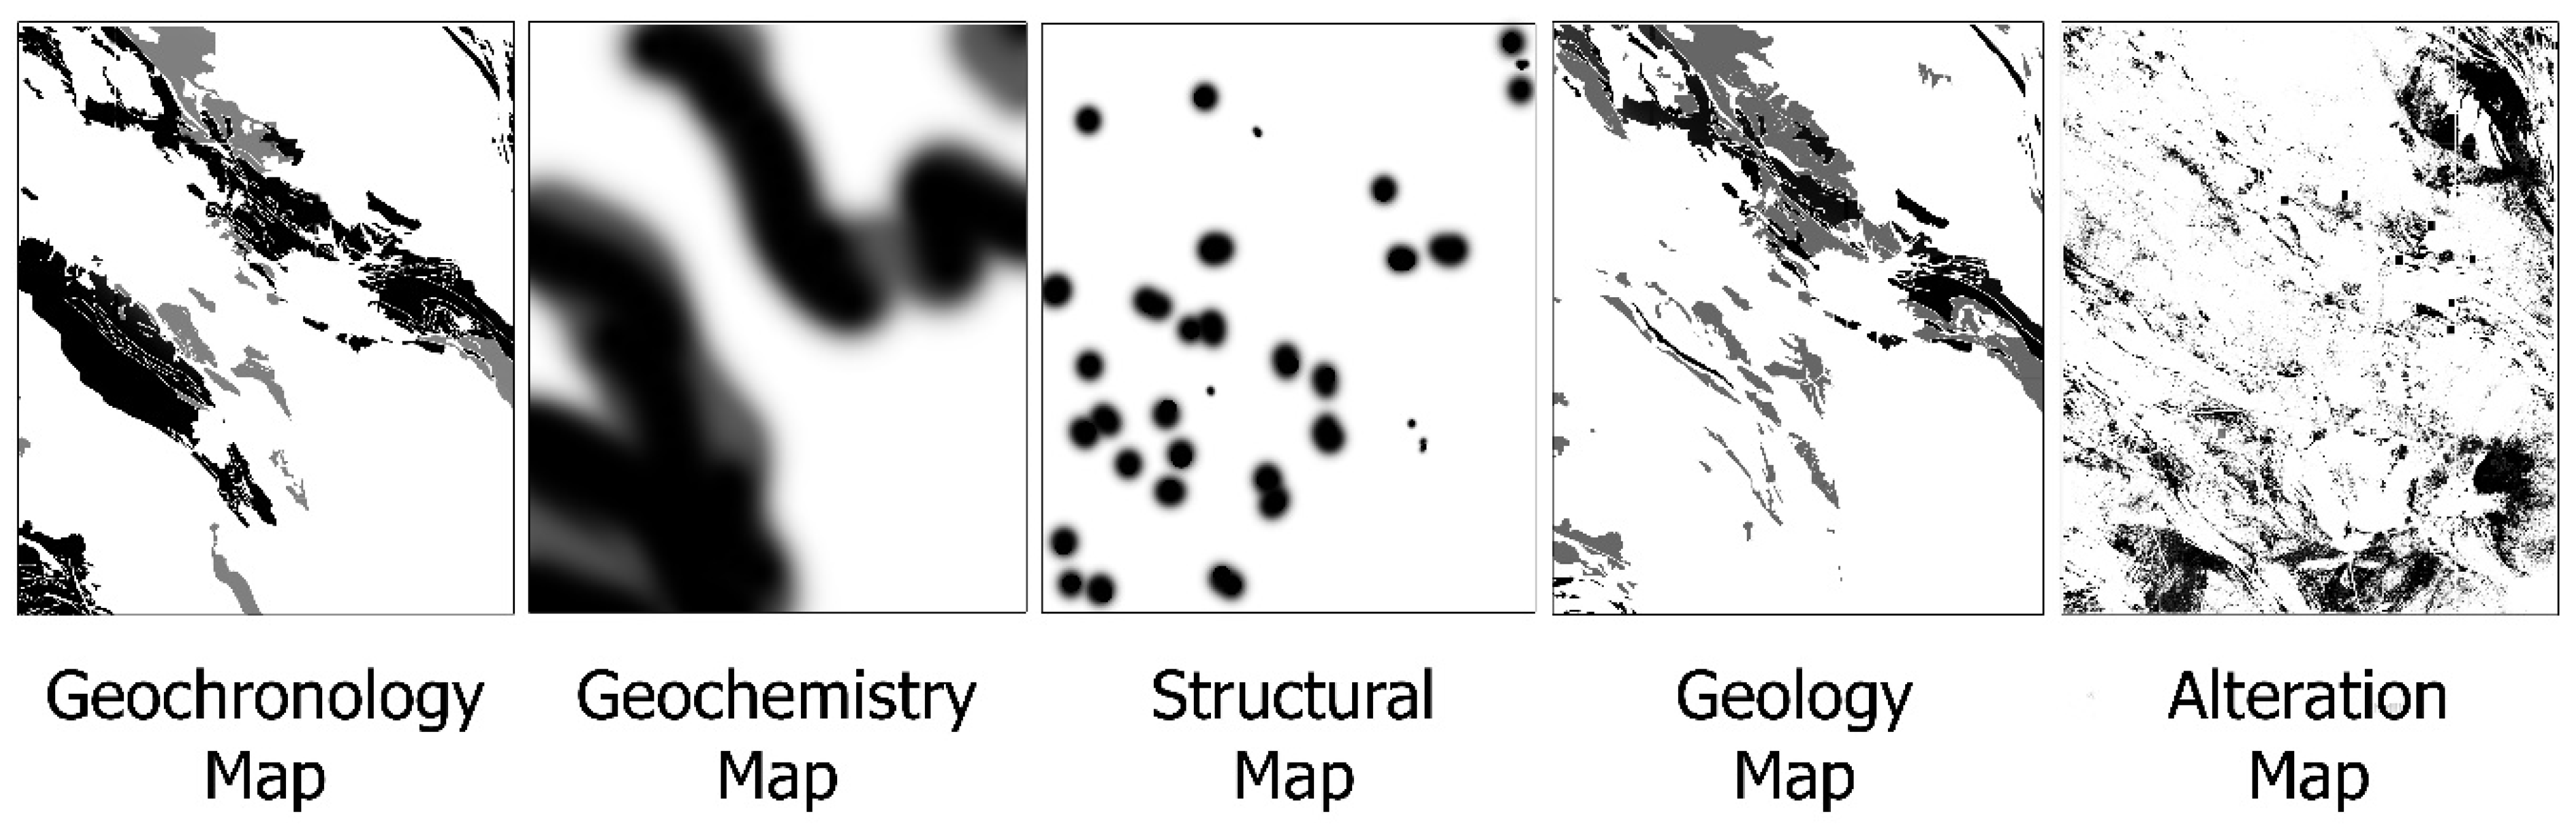
45]. At information layers fuzzification stage, each information layer, which was defined as the main criteria, was fuzzified based on fuzzy logic. Fuzzy maps are shown in Figure 12.
In the fusion of information layers based on the calculated weights step, the fuzzified information layers were integrated using AHP and based on the calculated weights. Consequently, the final fused map/potential map of copper mineralization for the Sahlabad mining area was generated (Figure 13). In the potential map of the study area (Figure 13), copper occurrences in the area, including copper deposits, old mines and mineral indices were plotted to validate the results. The map shows the potential copper mineralization zones (Figure 13). The areas with the highest potential are shown in the black color spectrum and the areas with the lowest potential or barren areas are shown in the white spectrum. As can be seen in Figure 13, all copper occurrences in the Sahlabad mining area are located in areas with high potential copper mineralization. This indicates the high validity of the results. Some new copper potential zones are also identified in northwestern and southeastern parts of the study area (Figure 13). These zones can be considered for subsequent field campaigns and drilling programs in the Sahlabad mining area.

5. Discussion

Identifying potential areas of VMS copper mineralization depends on various parameters such as fault systems, lithological and geochronological units, geochemical anomalies and hydrothermal alteration mineral zones [49,50,51]. Using information layer integration methods has a great potential to increase the accuracy of the identification of high potential areas. Recently, Artificial Intelligence (AI)-based techniques such as Machine Learning (ML) and Artificial Neural Network (ANN) have been successfully used for mineral exploration [52,53,54,55]. In this research, the BPNN method was used before integrating exploratory information layers by Fuzzy-AHP for exploration of massive sulfide copper mineralization in the Sahlabad mining area, east Iran. In fact, the BPNN evaluates the ability to predict copper occurrences by prospecting parameters that exploratory information layers provided based on them. This integrated technique is called Neuro-Fuzzy-AHP (NFAHP), which is developed in the present study.
To use the proposed BPNN network, exploratory features of each copper occurrence such as host lithology, geochemical anomalies, fault system, ore mineralization, alterations and geochronological units of each copper occurrence should be investigated. The BPNN technique ensures the prediction ability of the information layers before combining them. If the exploratory features cannot predict copper occurrences, they should be removed in the final decision making (Fuzzy-AHP). Another advantage of the combined use of BPNN with Fuzzy-AHP is to help prioritize information layers relative to each other.
In this research, by using the exploratory parameters related to 14 occurrences of massive sulfide copper in the Sahlabad mining area, the prediction of copper mineralization was established with 99% accuracy. Then, by combining exploration layers, the map of copper mineralization potential in the area was prepared using fuzzy-AHP method. After plotting the copper occurrences, as can be seen in the map in Figure 13, all the documented points are located in areas with high potential for massive sulfide copper mineralization. The NFAHP approach presented in this study first evaluates the input data by means of the BPNN algorithm to determine whether the mineralizations in question can be estimated based on the factors or not. Then, if the accuracy of the factors is confirmed, it combines the information layers with each other (by Fuzzy-AHP). Therefore, using the NFAHP, any type of mineralization can be prospected, provided that the exploration factors related to target mineralization type, are taken precisely. In fact, using a greater number of information layers and exploration factors, more accurate results will be obtained.

6. Conclusions

To identify the potential areas of VMS copper mineralization in Sahlabad mining area, east of Iran, hydrothermal alterations including argillic, phyllic and propylitic, were identified using band ratios and SPCA that were implemented to ASTER remote sensing data. The integration of faults and the alteration map showed that the faults are one of the controlling factors of the alterations and ore mineralization trend in the study area. Information layers, including alterations, geochemistry, host lithology, LF map and geochronology have been prepared based on exploration factors related to copper occurrences in the study area. Subsequently, using the BPNN, the predictive power of copper occurrences estimation was evaluated based on exploration factors. According to the results, the available exploration factors with an accuracy of 99% were able to estimate copper mineralizations in the Sahlabad mining area. After the validity of the available information had been confirmed by BPNN, the information layers were fused using the Fuzzy-AHP decision method and a copper mineralization potential map was produced. Copper occurrences points were plotted on the final map. In this way, the validation of the final map was examined. As a result, all points were located in high potential areas, which shows the high reliability of this map. It is recommended that the Neuro-Fuzzy-AHP (NFAHP) technique can be considered for mineral exploration in other metallogenic provinces in Iran and other regions around the world.

Author Contributions

Writing original draft preparation, A.S. (Aref Shirazi), A.S. (Adel Shirazy), A.H. and A.B.P.; supervision, A.H. and A.B.P.; writing—review and editing, A.S. (Adel Shirazy), M.H. and A.B.P. All authors have read and agreed to the published version of the manuscript.

Funding

This research received no external funding.

Data Availability Statement

Not applicable.

Acknowledgments

We appreciate the assistance of the Department of Mining Engineering at Amirkabir University of Technology (Tehran Polytechnic). This study is part of the research activity carried out during the first author’s Ph.D. research at the Department of Mining Engineering at Amirkabir University of Technology (Tehran Polytechnic). The Institute of Oceanography and Environment (INOS), Universiti Malaysia Terengganu (UMT) and Universiti Teknologi Malaysia are also acknowledged for providing facilities for editing, rewriting, and re-organizing the manuscript.

Conflicts of Interest

The authors declare no conflict of interest.

References

  1. Bachri, I.; Hakdaoui, M.; Raji, M.; Teodoro, A.C.; Benbouziane, A. Machine Learning Algorithms for Automatic Lithological Mapping Using Remote Sensing Data: A Case Study from Souk Arbaa Sahel, Sidi Ifni Inlier, Western Anti-Atlas, Morocco. ISPRS Int. J. Geo-Inf. 2019, 8, 248. [Google Scholar] [CrossRef] [Green Version]
  2. Maxwell, A.E.; Warner, T.A.; Fang, F. Implementation of Machine-Learning Classification in Remote Sensing: An Applied Review. Int. J. Remote Sens. 2018, 39, 2784–2817. [Google Scholar] [CrossRef] [Green Version]
  3. Shirmard, H.; Farahbakhsh, E.; Heidari, E.; Pour, A.B.; Pradhan, B.; Müller, D.; Chandra, R. A Comparative Study of Convolutional Neural Networks and Conventional Machine Learning Models for Lithological Mapping Using Remote Sensing Data. Remote Sens. 2022, 14, 819. [Google Scholar] [CrossRef]
  4. Shirmard, H.; Farahbakhsh, E.; Müller, R.D.; Chandra, R. A Review of Machine Learning in Processing Remote Sensing Data for Mineral Exploration. Remote Sens. Environ. 2022, 268, 112750. [Google Scholar] [CrossRef]
  5. Sagi, O.; Rokach, L. Ensemble Learning: A Survey. Wiley Interdiscip. Rev. Data Min. Knowl. Discov. 2018, 8, e1249. [Google Scholar] [CrossRef]
  6. Tahmasebi, P.; Kamrava, S.; Bai, T.; Sahimi, M. Machine Learning in Geo-and Environmental Sciences: From Small to Large Scale. Adv. Water Resour. 2020, 142, 103619. [Google Scholar] [CrossRef]
  7. Holloway, J.; Mengersen, K. Statistical Machine Learning Methods and Remote Sensing for Sustainable Development Goals: A Review. Remote Sens. 2018, 10, 1365. [Google Scholar] [CrossRef] [Green Version]
  8. Brown, W.M.; Gedeon, T.D.; Groves, D.I.; Barnes, R.G. Artificial Neural Networks: A New Method for Mineral Prospectivity Mapping. Aust. J. Earth Sci. 2000, 47, 757–770. [Google Scholar] [CrossRef]
  9. Sun, T.; Li, H.; Wu, K.; Chen, F.; Zhu, Z.; Hu, Z. Data-Driven Predictive Modelling of Mineral Prospectivity Using Machine Learning and Deep Learning Methods: A Case Study from Southern Jiangxi Province, China. Minerals 2020, 10, 102. [Google Scholar] [CrossRef] [Green Version]
  10. Shirazy, A.; Hezarkhani, A.; Timkin, T.; Shirazi, A. Investigation of Magneto-/Radio-Metric Behavior in Order to Identify an Estimator Model Using K-Means Clustering and Artificial Neural Network (Ann)(Iron Ore Deposit, Yazd, Iran). Minerals 2021, 11, 1304. [Google Scholar] [CrossRef]
  11. Zhang, N.; Zhou, K.; Li, D. Back-Propagation Neural Network and Support Vector Machines for Gold Mineral Prospectivity Mapping in the Hatu Region, Xinjiang, China. Earth Sci. Inform. 2018, 11, 553–566. [Google Scholar] [CrossRef]
  12. Kakar, S.A.; Sheikh, N.; Naseem, A.; Iqbal, S.; Rehman, A.; Ullah, A.; Ahmad, B.; Ali, H.; Khan, B. Artificial Neural Network Based Weather Prediction Using Back Propagation Technique. Int. J. Adv. Comput. Sci. Appl. 2018, 9, 462–470. [Google Scholar] [CrossRef] [Green Version]
  13. Shahabi, H.; Shirzadi, A.; Ronoud, S.; Asadi, S.; Pham, B.T.; Mansouripour, F.; Geertsema, M.; Clague, J.J.; Bui, D.T. Flash Flood Susceptibility Mapping Using a Novel Deep Learning Model Based on Deep Belief Network, Back Propagation and Genetic Algorithm. Geosci. Front. 2021, 12, 101100. [Google Scholar] [CrossRef]
  14. Wan, Y.-Q.; Fan, Y.-H.; Jin, M.-S. Application of Hyperspectral Remote Sensing for Supplementary Investigation of Polymetallic Deposits in Huaniushan Ore Region, Northwestern China. Sci. Rep. 2021, 11, 440. [Google Scholar] [CrossRef] [PubMed]
  15. Nazerian, H.; Shirazy, A.; Shirazi, A.; Hezarkhani, A. Design of an Artificial Neural Network (Bpnn) to Predict the Content of Silicon Oxide (Sio2) Based on the Values of the Rock Main Oxides: Glass Factory Feed Case Study. Int. J. Sci. Eng. Appl. 2022, 2, 41–44. [Google Scholar] [CrossRef]
  16. Shirazy, A.; Ziaii, M.; Hezarkhani, A. Geochemical Behavior Investigation Based on K-Means and Artificial Neural Network Prediction for Titanium and Zinc, Kivi Region, Iran. Bull. Tomsk Polytech. Univ. 2021, 332, 113–125. [Google Scholar]
  17. Zadeh, L.A. Fuzzy Sets. In Fuzzy Sets, Fuzzy Logic, and Fuzzy Systems: Selected Papers by Lotfi a Zadeh; World Scientific: Singapore, 1996; pp. 394–432. [Google Scholar]
  18. Saaty, T.L. How to Make a Decision: The Analytic Hierarchy Process. Eur. J. Oper. Res. 1990, 48, 9–26. [Google Scholar] [CrossRef]
  19. Liu, Y.; Eckert, C.M.; Earl, C. A Review of Fuzzy Ahp Methods for Decision-Making with Subjective Judgements. Expert Syst. Appl. 2020, 161, 113738. [Google Scholar] [CrossRef]
  20. Pour, A.B.; Hashim, M. The Application of Aster Remote Sensing Data to Porphyry Copper and Epithermal Gold Deposits. Ore Geol. Rev. 2012, 44, 1–9. [Google Scholar] [CrossRef] [Green Version]
  21. Pour, A.B.; Sekandari, M.; Rahmani, O.; Crispini, L.; Läufer, A.; Park, Y.; Hong, J.K.; Pradhan, B.; Hashim, M.; Hossain, M.S.; et al. Identification of Phyllosilicates in the Antarctic Environment Using Aster Satellite Data: Case Study from the Mesa Range, Campbell and Priestley Glaciers, Northern Victoria Land. Remote Sens. 2020, 13, 38. [Google Scholar] [CrossRef]
  22. Wambo, J.D.T.; Pour, A.B.; Ganno, S.; Asimow, P.D.; Zoheir, B.; Salles, R.D.R.; Nzenti, J.P.; Pradhan, B.; Muslim, A.M. Identifying High Potential Zones of Gold Mineralization in a Sub-Tropical Region Using Landsat-8 and Aster Remote Sensing Data: A Case Study of the Ngoura-Colomines Goldfield, Eastern Cameroon. Ore Geol. Rev. 2020, 122, 103530. [Google Scholar] [CrossRef]
  23. Monazami Bagherzade, R. Economic Geology Report (Hammer Exploration) Sahlabad Sheet (Scale 1:100,000); Geological Survey and Mineral Exploration of Northeast Iran: Tehran, Iran, 2001; p. 20. [Google Scholar]
  24. Stoecklin, J. Structural History and Tectonics of Iran: A Review. AAPG Bull. 1968, 52, 1229–1258. [Google Scholar]
  25. Berberian, M.; King, G.C.P. Towards a Paleogeography and Tectonic Evolution of Iran. Can. J. Earth Sci. 1981, 18, 210–265. [Google Scholar] [CrossRef]
  26. Tirrul, R.; Bell, I.R.; Griffis, R.J.; Camp, V.E. The Sistan Suture Zone of Eastern Iran. Geol. Soc. Am. Bull. 1983, 94, 134–150. [Google Scholar] [CrossRef]
  27. Şengör, A.M.C. A New Model for the Late Palaeozoic—Mesozoic Tectonic Evolution of Iran and Implications for Oman. Geol. Soc. Lond. Spec. Publ. 1990, 49, 797–831. [Google Scholar] [CrossRef]
  28. Stampfli, G.; Borel, G. A Plate Tectonic Model for the Paleozoic and Mesozoic Constrained by Dynamic Plate Boundaries and Restored Synthetic Oceanic Isochrons. Earth Planet. Sci. Lett. 2002, 196, 17–33. [Google Scholar] [CrossRef]
  29. Camp, V.; Griffis, R. Character, Genesis and Tectonic Setting of Igneous Rocks in the Sistan Suture Zone, Eastern Iran. Lithos 1982, 15, 221–239. [Google Scholar] [CrossRef]
  30. Moazzen, M.; Modjarrad, M.; Zarrinkoub, M. Mineral Chemistry, Petrogenesis and P–T Conditions of Formation of Harzburgitic Peridotites from South of Birjand, Eastern Iran. J. Asian Earth Sci. 2006, 4, 56–75. [Google Scholar] [CrossRef]
  31. Shirazi, A.; Hezarkhani, A.; Pour, A.B. Fusion of Lineament Factor (Lf) Map Analysis and Multifractal Technique for Massive Sulfide Copper Exploration: The Sahlabad Area, East Iran. Minerals 2022, 12, 549. [Google Scholar] [CrossRef]
  32. Shirazi, A. Integration of Intelligent Analytical Methods for Geochemical Modeling and Identification of Exploration Keys for the Sahlabad Applied Research. Ph.D. Thesis, Amirkabir University of Technology (Tehran Polytechnic), Tehran, Iran, 2022. [Google Scholar]
  33. Iwasaki, A.; Tonooka, H. Validation of a Crosstalk Correction Algorithm for Aster/Swir. IEEE Trans. Geosci. Remote Sens. 2005, 43, 2747–2751. [Google Scholar] [CrossRef]
  34. Thome, K.; Palluconi, F.; Takashima, T.; Masuda, K. Atmospheric Correction of Aster. IEEE Trans. Geosci. Remote Sens. 1998, 36, 1119–1211. [Google Scholar] [CrossRef]
  35. Inzana, J.; Kusky, T.; Higgs, G.; Tucker, R. Supervised Classifications of Landsat Tm Band Ratio Images and Landsat Tm Band Ratio Image with Radar for Geological Interpretations of Central Madagascar. J. Afr. Earth Sci. 2003, 37, 59–72. [Google Scholar] [CrossRef]
  36. Noori, L.; Pour, A.B.; Askari, G.; Taghipour, N.; Pradhan, B.; Lee, C.-W.; Honarmand, M. Comparison of Different Algorithms to Map Hydrothermal Alteration Zones Using Aster Remote Sensing Data for Polymetallic Vein-Type Ore Exploration: Toroud–Chahshirin Magmatic Belt (Tcmb), North Iran. Remote Sens. 2019, 11, 495. [Google Scholar] [CrossRef] [Green Version]
  37. Agharezaei, M.; Hezarkhani, A. Delineation of Geochemical Anomalies Based on Cu by the Boxplot as an Exploratory Data Analysis (Eda) Method and Concentration-Volume (Cv) Fractal Modeling in Mesgaran Mining Area, Eastern Iran. Open J. Geol. 2016, 6, 1269–1278. [Google Scholar] [CrossRef] [Green Version]
  38. GSI. Report of Systematic Geochemical Explorations in the Sahlabad Area (Sheet on Scale 1:100,000—Geochemistry of Stream Sediments); Geological Survey of IRAN (GSI): Tehran, Iran, 2001; p. 644. [Google Scholar]
  39. Abdelouhed, F.; Algouti, A.; Algouti, A.; Mohammed, I.; Mourabit, Z. Contribution of Gis and Remote Sensing in Geological Mapping, Lineament Extractions and Hydrothermal Alteration Minerals Mapping Using Aster Satellite Images: Case Study of Central Jebilets-Morocco. Disaster Adv. 2021, 14, 15–25. [Google Scholar]
  40. Yousefi, M.; Tabatabaei, S.H.; Rikhtehgaran, R.; Pour, A.B.; Pradhan, B. Application of Dirichlet Process and Support Vector Machine Techniques for Mapping Alteration Zones Associated with Porphyry Copper Deposit Using Aster Remote Sensing Imagery. Minerals 2021, 11, 1235. [Google Scholar] [CrossRef]
  41. Khan, S.A.; Naim, I.; Kusi-Sarpong, S.; Gupta, H.; Idrisi, A.R. A Knowledge-Based Experts’ System for Evaluation of Digital Supply Chain Readiness. Knowl.-Based Syst. 2021, 228, 107262. [Google Scholar] [CrossRef]
  42. Wang, C.-N.; Nguyen, N.-A.; Dang, T.-T.; Lu, C.-M. A Compromised Decision-Making Approach to Third-Party Logistics Selection in Sustainable Supply Chain Using Fuzzy Ahp and Fuzzy Vikor Methods. Mathematics 2021, 9, 886. [Google Scholar] [CrossRef]
  43. Padma, T.; Shantharajah, S.P.; Ramadoss, P. Hybrid Fuzzy Ahp and Fuzzy Topsis Decision Model for Aquaculture Species Selection. Int. J. Inf. Technol. Decis. Mak. 2022, 21, 999–1030. [Google Scholar] [CrossRef]
  44. Khosravi, V.; Shirazi, A.; Shirazy, A.; Hezarkhani, A.; Pour, A.B. Hybrid Fuzzy-Analytic Hierarchy Process (Ahp) Model for Porphyry Copper Prospecting in Simorgh Area, Eastern Lut Block of Iran. Mining 2022, 2, 1–12. [Google Scholar] [CrossRef]
  45. Bai, H.; Cao, Y.; Zhang, H.; Zhang, C.; Hou, S.; Wang, W. Combining Fuzzy Analytic Hierarchy Process with Concentration–Area Fractal for Mineral Prospectivity Mapping: A Case Study Involving Qinling Orogenic Belt in Central China. Appl. Geochem. 2021, 126, 104894. [Google Scholar] [CrossRef]
  46. Mars, J.C.; Rowan, L.C. Spectral Assessment of New Aster Swir Surface Reflectance Data Products for Spectroscopic Mapping of Rocks and Minerals. Remote Sens. Environ. 2010, 114, 2011–2025. [Google Scholar] [CrossRef]
  47. Mars, J.C.; Rowan, L.C. Regional Mapping of Phyllic-and Argillic-Altered Rocks in the Zagros Magmatic Arc, Iran, Using Advanced Spaceborne Thermal Emission and Reflection Radiometer (Aster) Data and Logical Operator Algorithms. Geosphere 2006, 2, 161–186. [Google Scholar] [CrossRef]
  48. Spatz, D.M.; Wilson, R.T.; Pierce, F.W.; Bolm, J.G. Remote Sensing Characteristics of Porphyry Copper Systems, Western America Cordillera. Ariz. Geol. Soc. Dig. 1995, 20, 94–108. [Google Scholar]
  49. Moradpouri, F. A Copper Porphyry Promising Zones Mapping Based on the Exploratory Data, Multivariate Geochemical Analysis and Gis Integration. Appl. Geochem. 2021, 132, 105051. [Google Scholar] [CrossRef]
  50. Heidari, S.M.; Afzal, P.; Ghaderi, M.; Sadeghi, B. Detection of Mineralization Stages Using Zonality and Multifractal Modeling Based on Geological and Geochemical Data in the Au-(Cu) Intrusion-Related Gouzal-Bolagh Deposit, Nw Iran. Ore Geol. Rev. 2021, 139, 104561. [Google Scholar] [CrossRef]
  51. Mirsepahvand, F.; Jafari, M.R.; Afzal, P.; Arian, M.A. Identification of Alteration Zones Using Aster Data for Metallic Mineralization in Ahar Region, Nw Iran. J. Min. Environ. 2022, 13, 309–324. [Google Scholar]
  52. Chen, G.; Huang, N.; Wu, G.; Luo, L.; Wang, D.; Cheng, Q. Mineral Prospectivity Mapping Based on Wavelet Neural Network and Monte Carlo Simulations in the Nanling W-Sn Metallogenic Province. Ore Geol. Rev. 2022, 143, 104765. [Google Scholar] [CrossRef]
  53. Dumakor-Dupey, N.; Arya, S. Machine Learning—A Review of Applications in Mineral Resource Estimation. Energies 2021, 14, 4079. [Google Scholar] [CrossRef]
  54. Liu, L.; Cao, W.; Liu, H.; Ord, A.; Qin, Y.; Zhou, F.; Bi, C. Applying Benefits and Avoiding Pitfalls of 3d Computational Modeling-Based Machine Learning Prediction for Exploration Targeting: Lessons from Two Mines in the Tongling-Anqing District, Eastern China. Ore Geol. Rev. 2022, 142, 104712. [Google Scholar] [CrossRef]
  55. Agrawal, N.; Govil, H.; Chatterjee, S.; Mishra, G.; Mukherjee, S. Evaluation of Machine Learning Techniques with Aviris-Ng Dataset in the Identification and Mapping of Minerals. Adv. Space Res. 2022; in press. [Google Scholar]
Figure 2. The methodological flowchart implemented in this study.
Remotesensing 14 05562 g002
Figure 3. Schematic view of the BPNN structure used in this analysis. (Numbers are neurons in the layers, W: Weight, b: bias value, +: combination).
Remotesensing 14 05562 g003
Figure 4. Hierarchical structure for integrated modeling of copper mineralization in the Sahlabad mining area based on the Fuzzy-AHP method.
Remotesensing 14 05562 g004
Figure 5. False Color Combination (FCC) of bands 4, 8 and 6 as RGB color composite for Sahlabad mining area. The location of copper deposits, old mines and indices are shown with red stars and yellow triangles and cubes, respectively.
Remotesensing 14 05562 g005
Figure 6. Pseudo-color ramp of band ratio results. (A) Band ratio of 4/2 shows the surface distribution of iron oxide/hydroxides; (B) band ratio of 5/6 shows the surface distribution of argillic alteration; (C) band ratio of 7/6 shows the surface distribution of phyllic alteration; (D) band ratio of 9/8 shows the surface distribution of propylitic alteration.
Remotesensing 14 05562 g006
Figure 7. Pseudo-color ramp of SPCA results. (A) PC2 shows the surface distribution of iron oxide/hydroxides; (B) PC4 shows the surface distribution of argillic alteration; (C) PC4 shows the surface distribution of phyllic alteration; (D) PC4 shows the surface distribution of propylitic alteration.
Remotesensing 14 05562 g007
Figure 8. Geochronological map of the study area.
Remotesensing 14 05562 g008
Figure 9. Lineament Factor (LF) map of the study area.
Remotesensing 14 05562 g009
Figure 10. Geochemical map of high potential areas based on geochemical family of copper (Pb, Zn, Sn, Ag and Mo).
Remotesensing 14 05562 g010
Figure 11. (A) Copper occurrences estimation line based on copper occurrences in training data; (B) copper occurrences estimation line based on copper occurrences in test data; (C) regression of estimated data versus training data; (D) regression of estimated data versus test data.
Remotesensing 14 05562 g011
Figure 12. The fuzzified exploratory maps for the Sahlabad mining area.
Remotesensing 14 05562 g012
Figure 13. The potential map of copper mineralization for the Sahlabad mining area.
Remotesensing 14 05562 g013
Table 1. Copper mineralization, host-rock lithologies and alteration zones in Sahlabad mining area [31]. Abbreviations: Cpy = Chalcopyrite, Py = Pyrite, Mch = Malachite, Ch = Chalcocite, Az = Azorite, Ba = Basalt, Phy = Phyllic, An = Andesite, Sch = Schist, Mtd = Metadiabase, Chl = Chlorite Alteration, Db = Diabase, Anb = Andesite-Basalt, Qtz = Quartz Alteration, Cab = Carbonate Alteration, Pp = Propylitic Alteration, Arg = Argillic Alteration, Ub = Ultrabasic, Alteration, Sep = Serpentine Alteration, Hem = Hematite Alteration, Lm = Limonite Alteration, Goe = Goethite Alteration.
Copper OccurrencesCenter CoordinatesAnomaly Area
(Km2)
MineralizationAlterationsHost-Rock Lithologies
Longitude (E)Latitude (N)
Mesgaran Deposit59°52′49″32°18′58″8Cpy + MchPhy + Arg + Pp + Chl + QtzBa + Anb
Chah-Rasteh Deposit59°46′15″32°21′19″4Ch + MchPhy + Arg + Pp + Chl + CabAn + Anb
Zahri Deposit59°32′52″32°00′50″2Cpy + Ch + MchPhy + Arg + Pp + HemUb + Sch
Kasrab Abandoned Mine59°59′45″32°21′05″3.8MchPhy + Arg + Pp + SepUb
Cheshme-Zangi Abandoned Mine59°59′08″32°25′02″2.5Cpy + MchPhy + Arg + Pp + SilicificationLimestone shale + Listwanite
Shir-Shotor Indice59°53′50″32°14′28″1Mch + AzArg + Pp + SepAn + Serpentinite (Ub)
Dastgerd Indice59°43′39″32°21′03″2MchArg + Pp + Sep + HemHarzburgite
Torshaab Indice59°59′56″32°28′48″5Mch + AzPhy + Arg + Pp + Hem + LmSch
Chah-Anjir Indice59°53′37″32°15′44″2Mch + AzPp + SepSerpentinite (Ub)
Zargaran Indice59°47′09″32°21′14″1Mch + AzPhy + Arg + Pp + Lm + Goe + HemAn + Db
West Mesgaran Indice59°52′26″32°19′36″1.5Cpy + Mch + AzArg + Pp + Hem + LmMtd
Mirsimin Indice59°54′58″32°17′53″9Cpy + Mch + AzArg + Pp + HemDb
Kuharod Indice59°50′31″32°18′01″1MchPhy + Arg + Pp + HemDb
Barghan Indice59°39′38″32°09′05″2MchArg + Pp + Lm + Geo + HemDb + Limestone
Table 2. Geological ages of host lithological units related to copper occurrences in the study area.
Lithological UnitGeological Age
Andesite (An)Paleogene
Schist (Sch)
Basalt (Ba)Upper Cretaceous
Ophiolite Mélange (Ml)
Ultrabasic (Ub)
Table 3. Factors of the copper occurrences in the Sahlabad mining area used as the input for the BPNN algorithm.
LithologyGeochronologyAlterationsDominant MineralizationStructural Geology
AnUpper CretaceousArgillicMalachiteDistance from high intensity LF community
BaPhyllicAzurite
UbPaleogenePropyliticChalcopyrite
MlIron OxidesChalcocite
Sch
Table 4. Eigenvector matrix of selected bands for detecting iron oxides (gossan) derived from SPCA.
EigenvectorBand 1Band 2Band 3Band 4
PC 10.5461950.6448880.4069940.346621
PC 20.3725060.586388−0.021196−0.908873
PC 30.642726−0.232160−0.6922430.231958
PC 4−0.3870560.703904−0.595573−0.000394
Table 5. Eigenvector matrix of selected bands for mapping argillic zone derived from SPCA.
EigenvectorBand 1Band 4Band 5Band 6
PC 10.5904620.4655580.4522650.479653
PC 20.805201−0.296067−0.381717−0.343930
PC 30.034781−0.8106830.2111060.544994
PC 40.042383−0.1959410.777935−0.595506
Table 6. Eigenvector matrix of selected bands for mapping phyllic zone derived from SPCA.
EigenvectorBand 1Band 4Band 6Band 7
PC 1−0.583430−0.457601−0.472606−0.476292
PC 2−0.8114640.2948870.3493110.364074
PC 3−0.0335600.833551−0.298210−0.463828
PC 40.0030410.093998−0.7521270.652273
Table 7. Eigenvector matrix of selected bands for mapping propylitic zone derived from SPCA.
EigenvectorBand 1Band 4Band 8Band 9
PC 1−0.545145−0.432945−0.525490−0.489117
PC 2−0.8304440.1685160.3556650.394294
PC 3−0.1090090.885442−0.314765−0.324087
PC 40.0360120.012378−0.7058940.707293
Table 8. Paired comparison matrix and calculated weights for each of the main criteria by AHP method.
CriteriaGeologyGeochronologyStructural GeologyGeochemistryAlterationsImportance RankWeight (%)
Geology140.230.25313.3
Geochronology0.2510.140.20.1453.6
Structural Geology57152144.6
Geochemistry0.3350.210.3349.3
Alterations470.531229.2
Table 9. Paired comparison matrix and calculated weights for sub-criteria of geology criteria by AHP method.
Sub-Criteria of GeologyAnBaMlUbImportance RankWeight (%)
An110.330.239.9
Ba110.330.239.9
Ml3310.5228.4
Ub5521151.8
Table 10. Paired comparison matrix and calculated weights for sub-criteria of geochronology criteria by AHP method.
Sub-Criteria of GeochronologyUpper CretaceousPaleogeneImportance RankWeight (%)
Upper Cretaceous12166.7
Paleogene0.51233.3
Table 11. Paired comparison matrix and calculated weights for sub-criteria of alterations criteria by AHP method.
Sub-Criteria of AlterationsArgillicPhyllicPropyliticImportance RankWeight (%)
Argillic111133.3
Phyllic111133.3
Propylitic111133.3
Table 12. The inconsistency rate (%) of criteria and sub-criteria paired comparison matrices.
Inconsistency Rate (%)
Main Criteria8.9
Sub-criteria of Geology0.2
Sub-criteria of Geochronology0
Sub-criteria of Alterations0
Publisher’s Note: MDPI stays neutral with regard to jurisdictional claims in published maps and institutional affiliations.

