
Upper Ocean Responses to the Tropical Cyclones Ida and Felicia (2021) in the Gulf of Mexico and the Eastern North Pacific

Abstract
:1. Introduction
2. Materials and Methods
2.1. Study Area
2.2. Sea-Surface Temperature
2.3. Surface Chlorophyll-a
2.4. Argo
3. Results
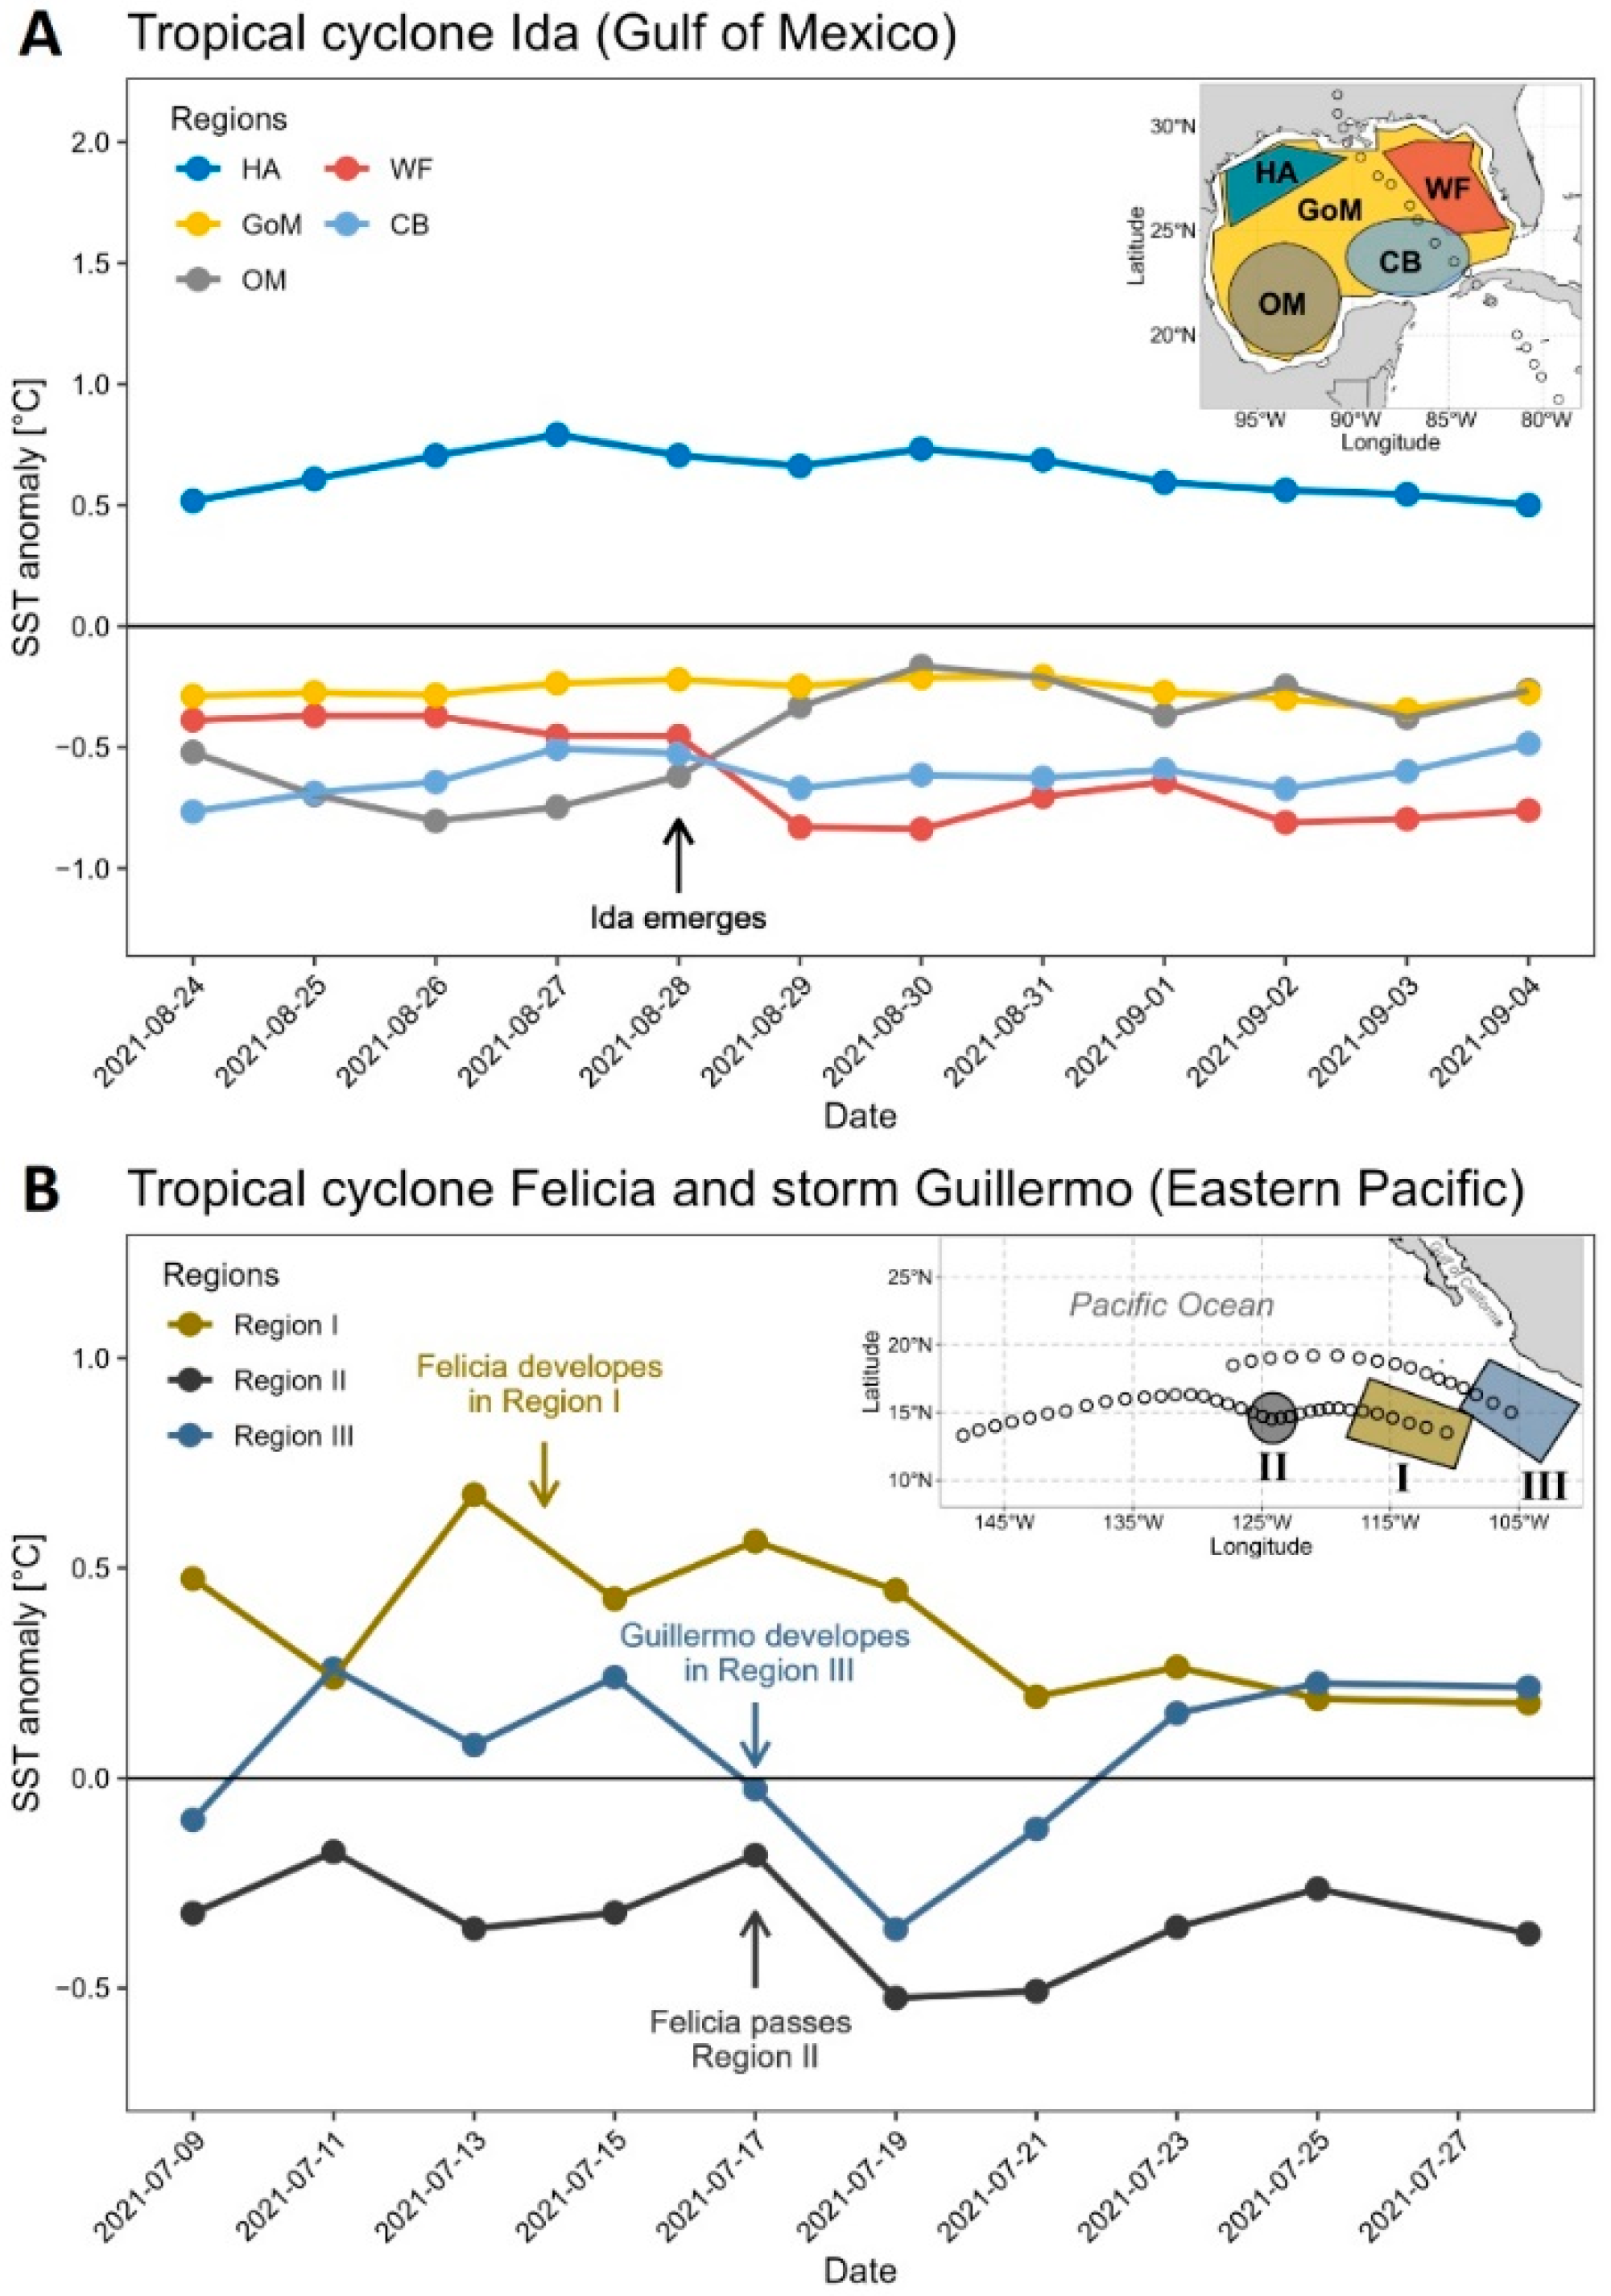
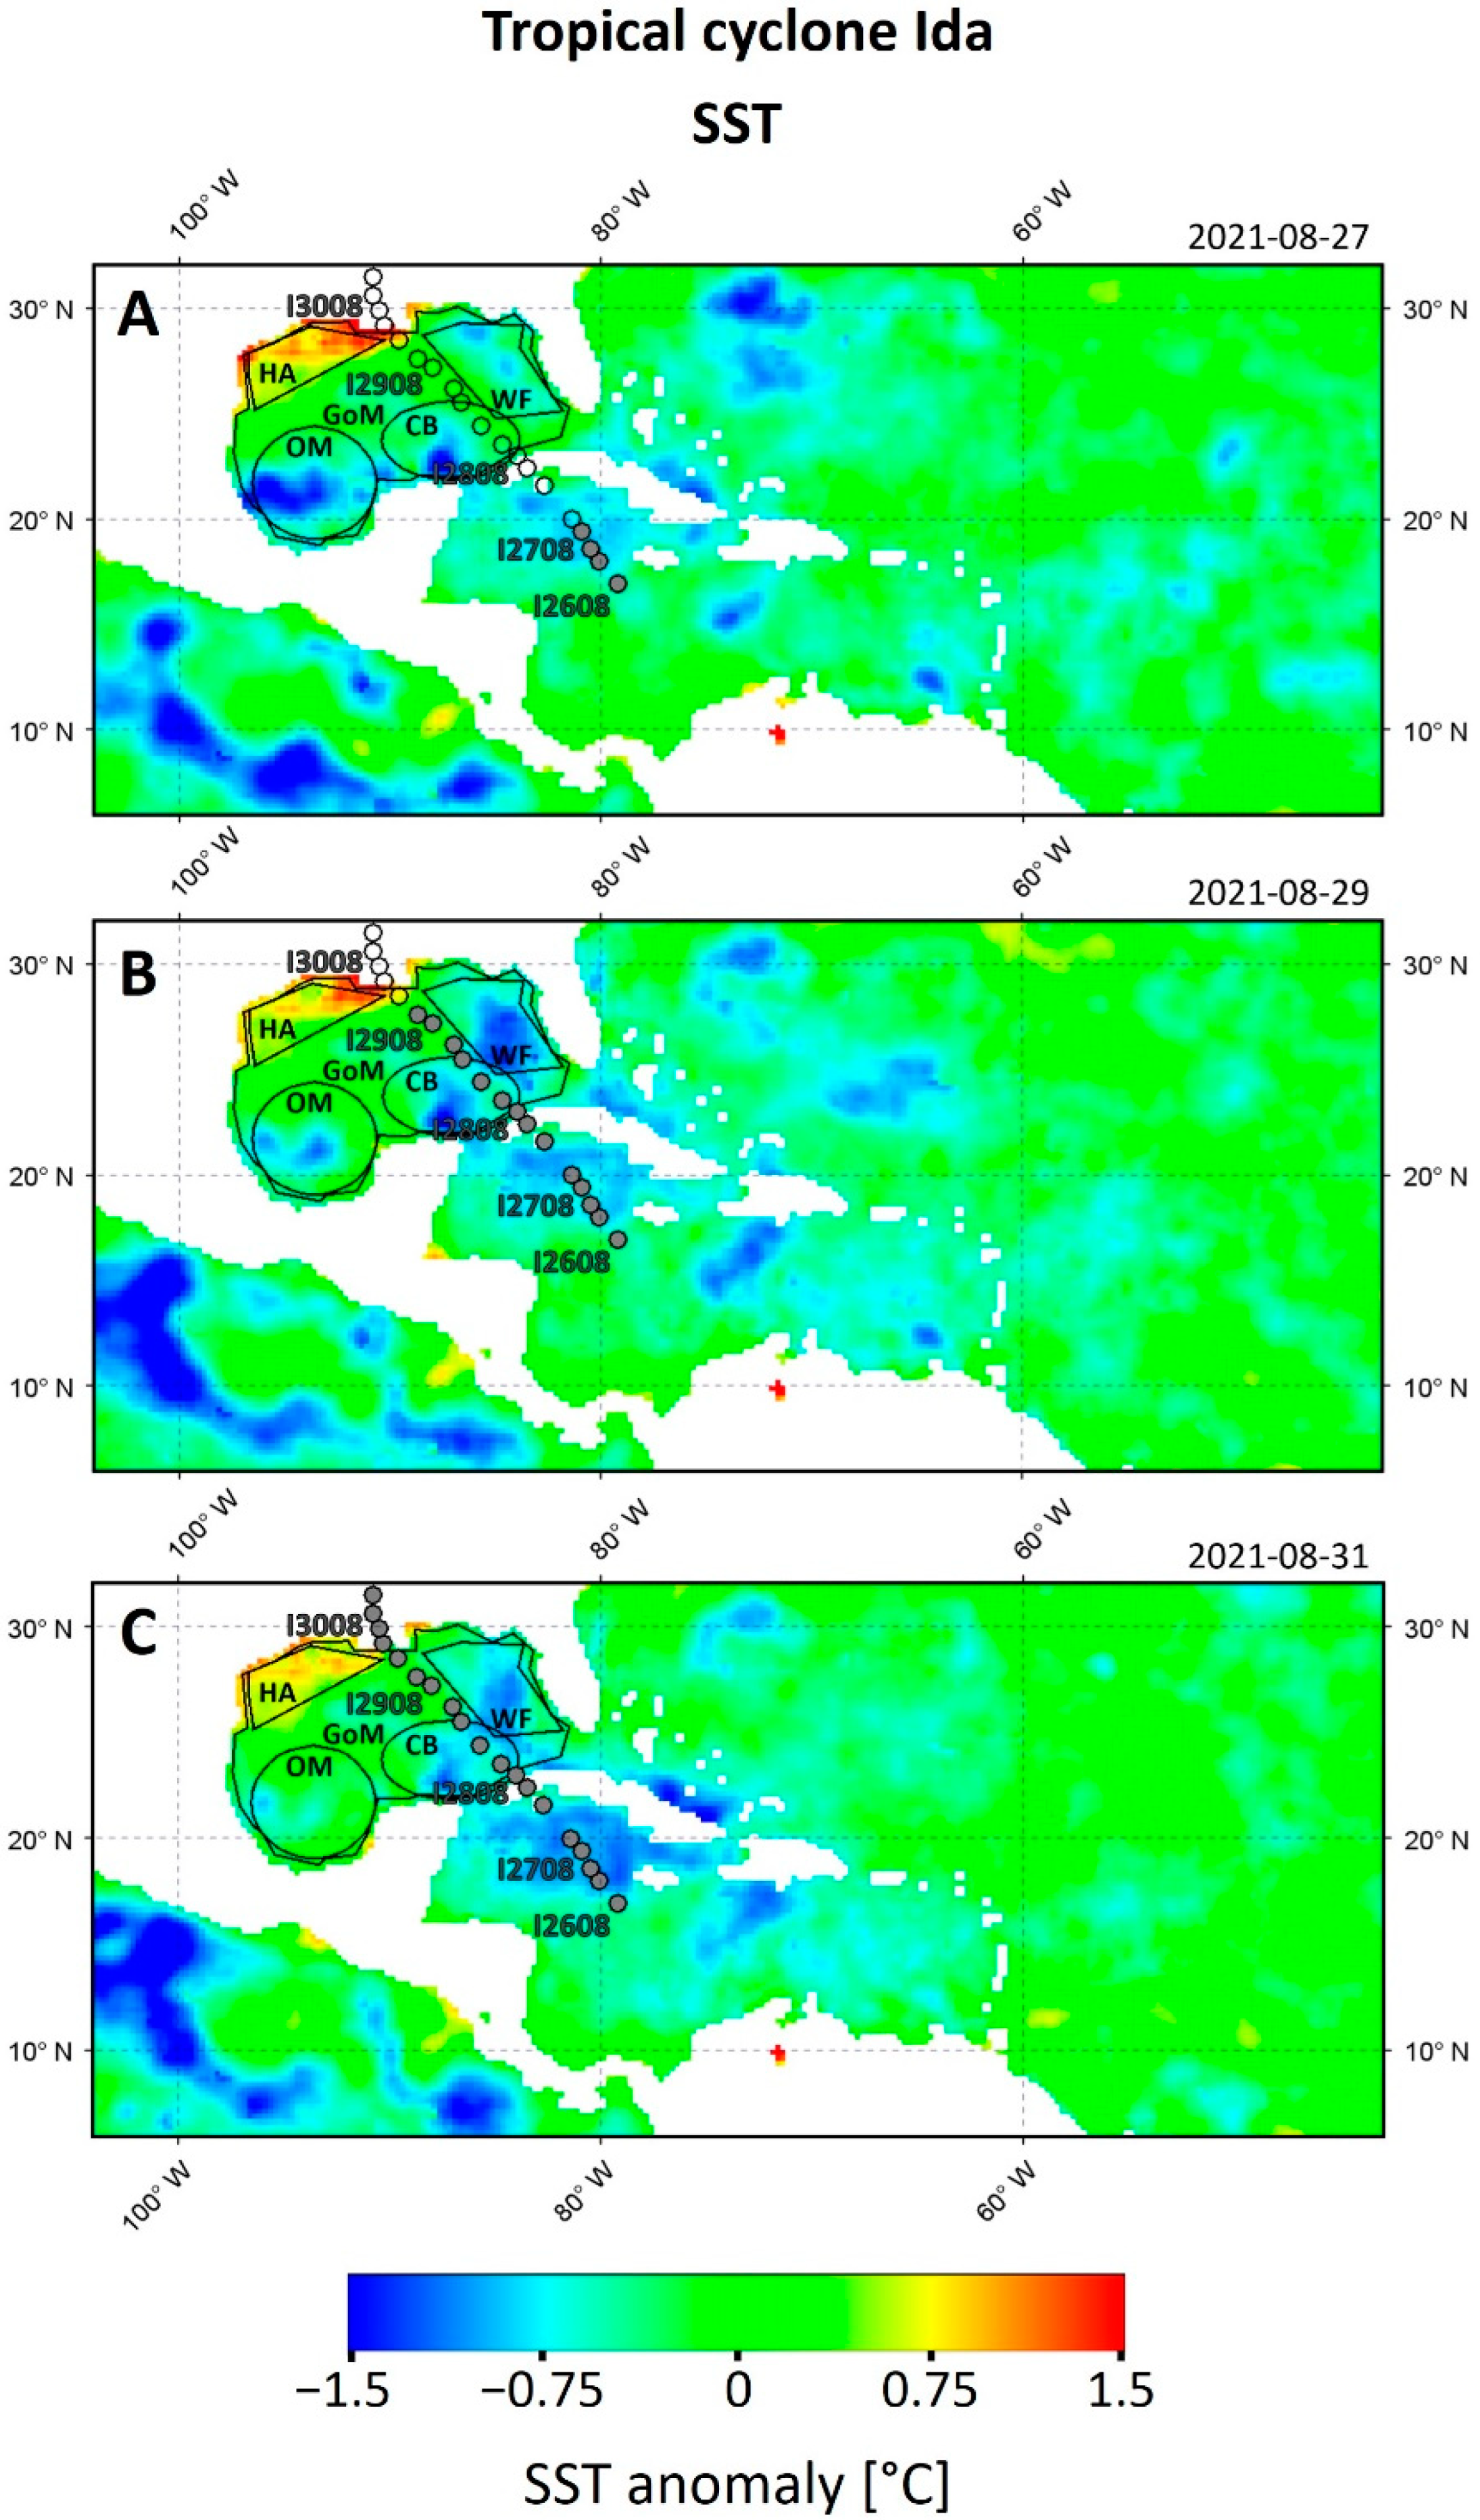
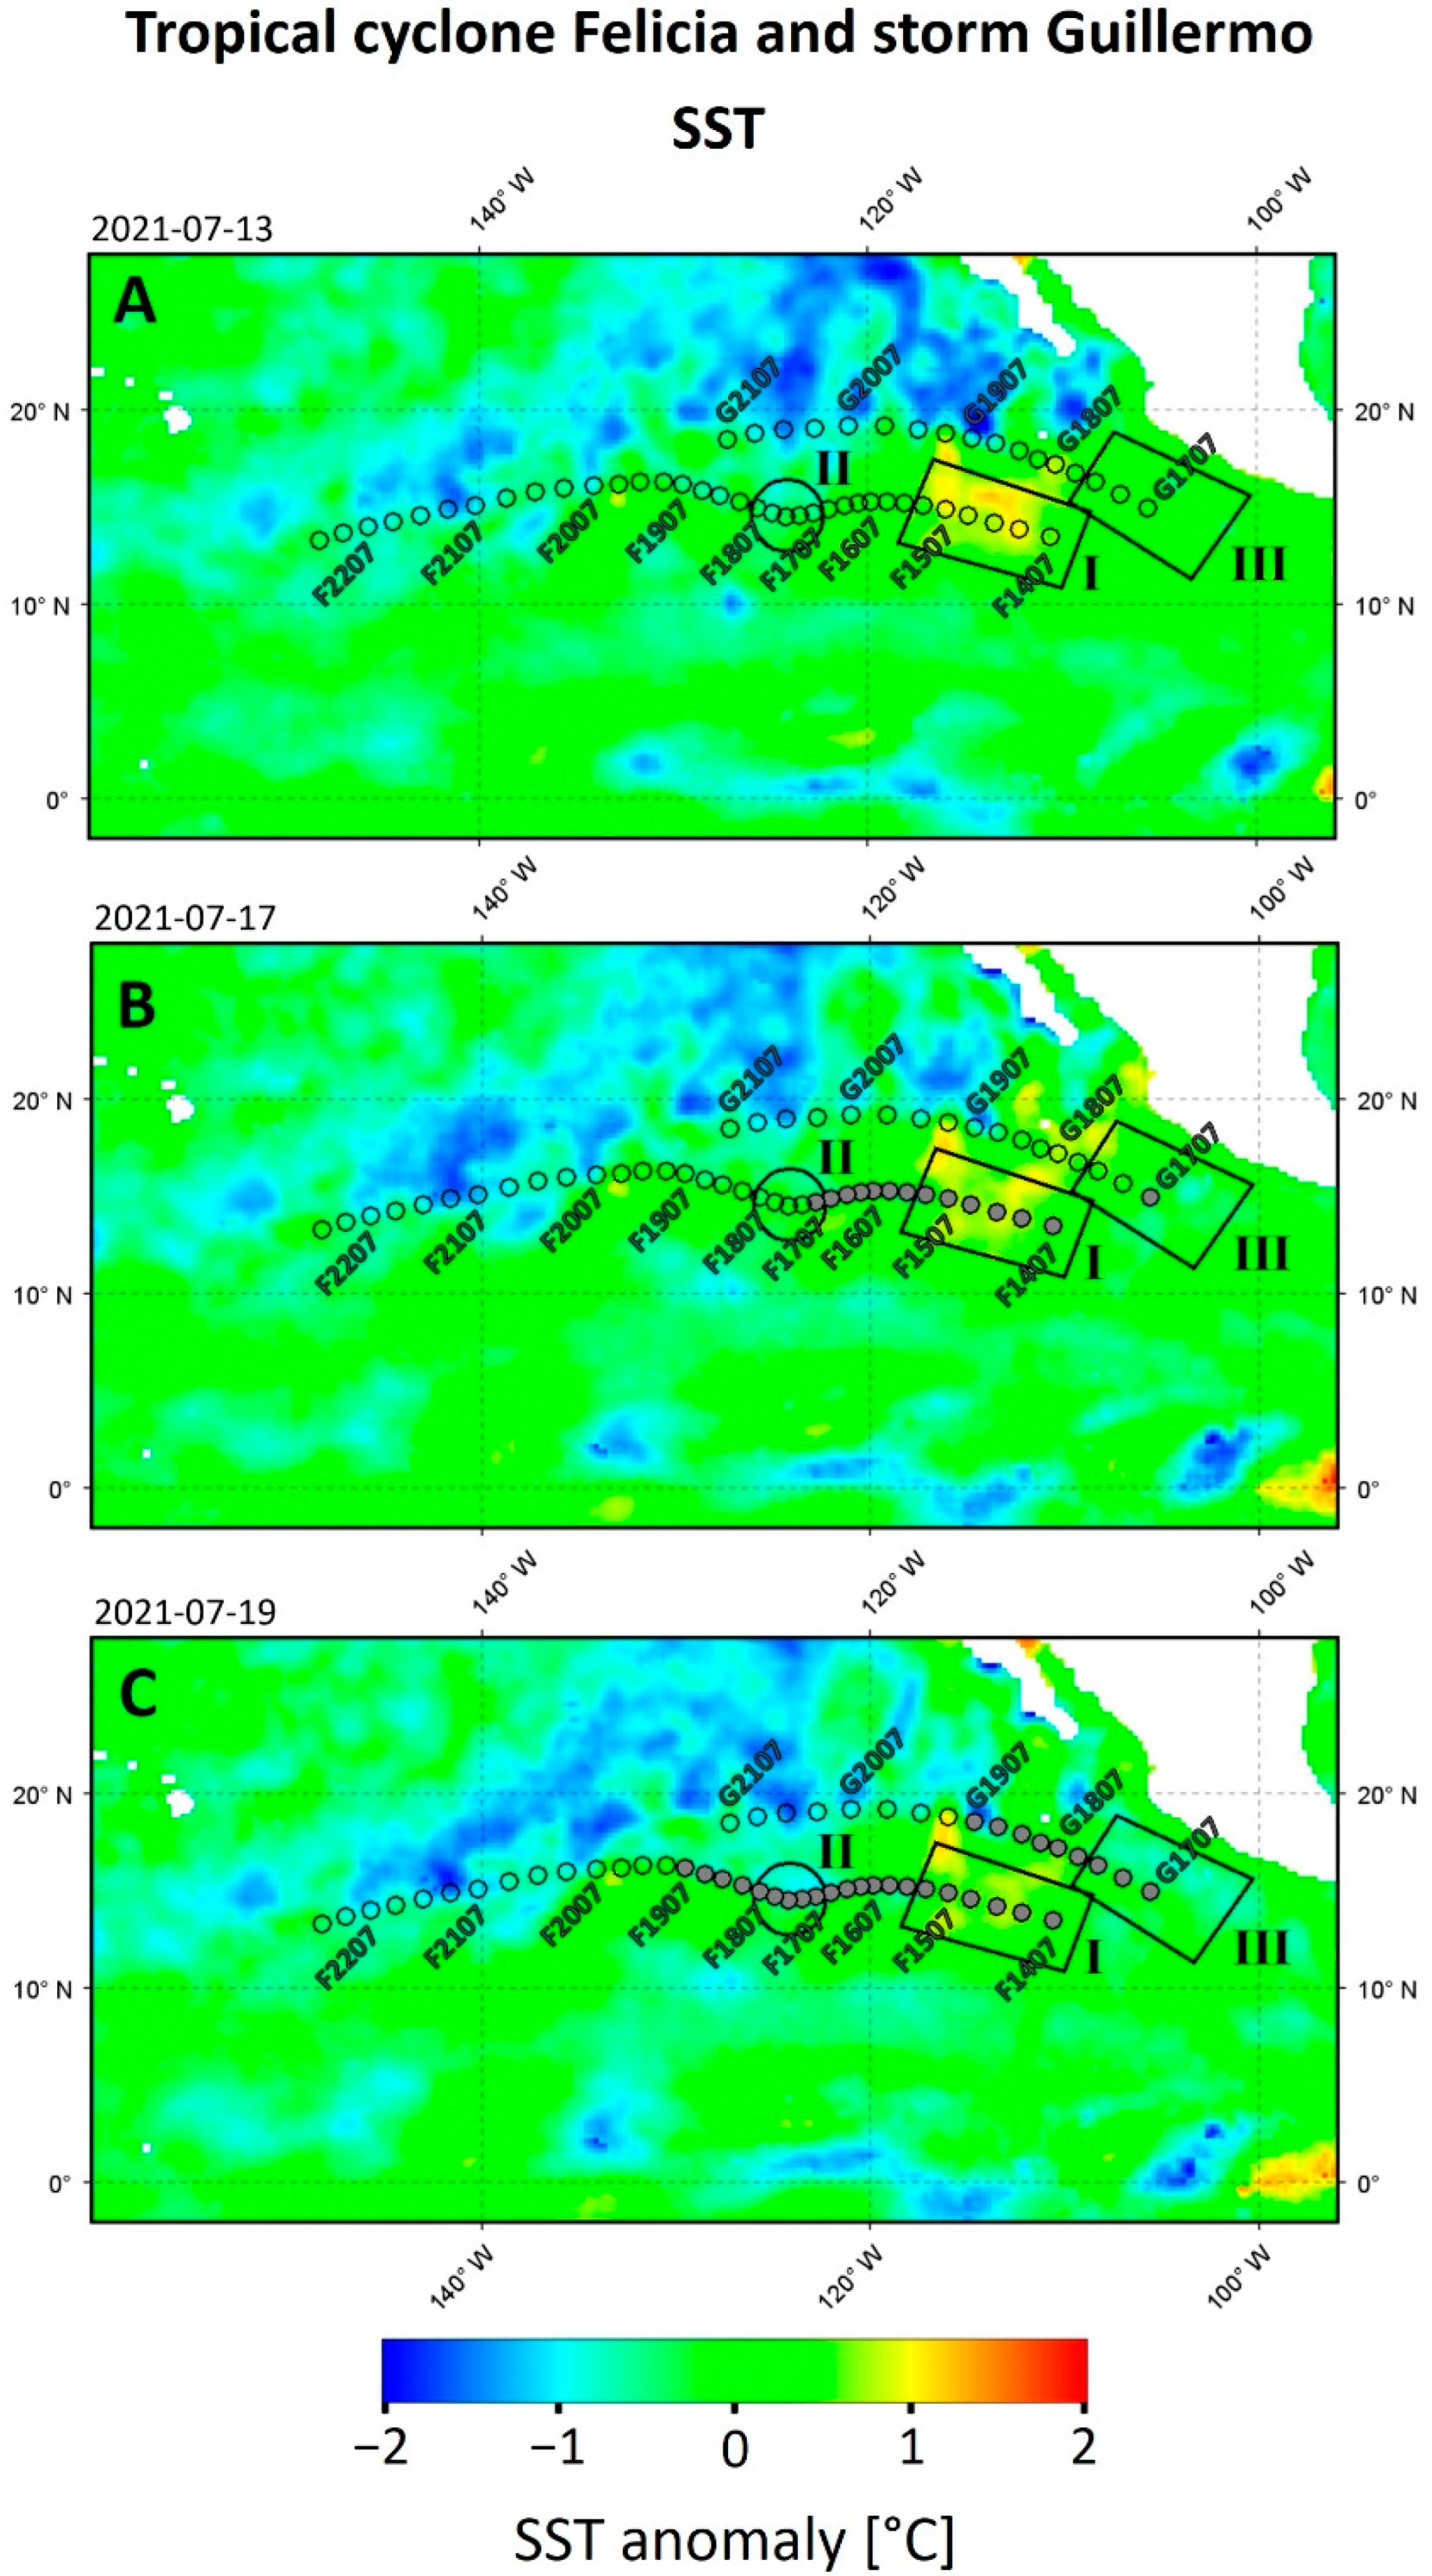
3.1. SST
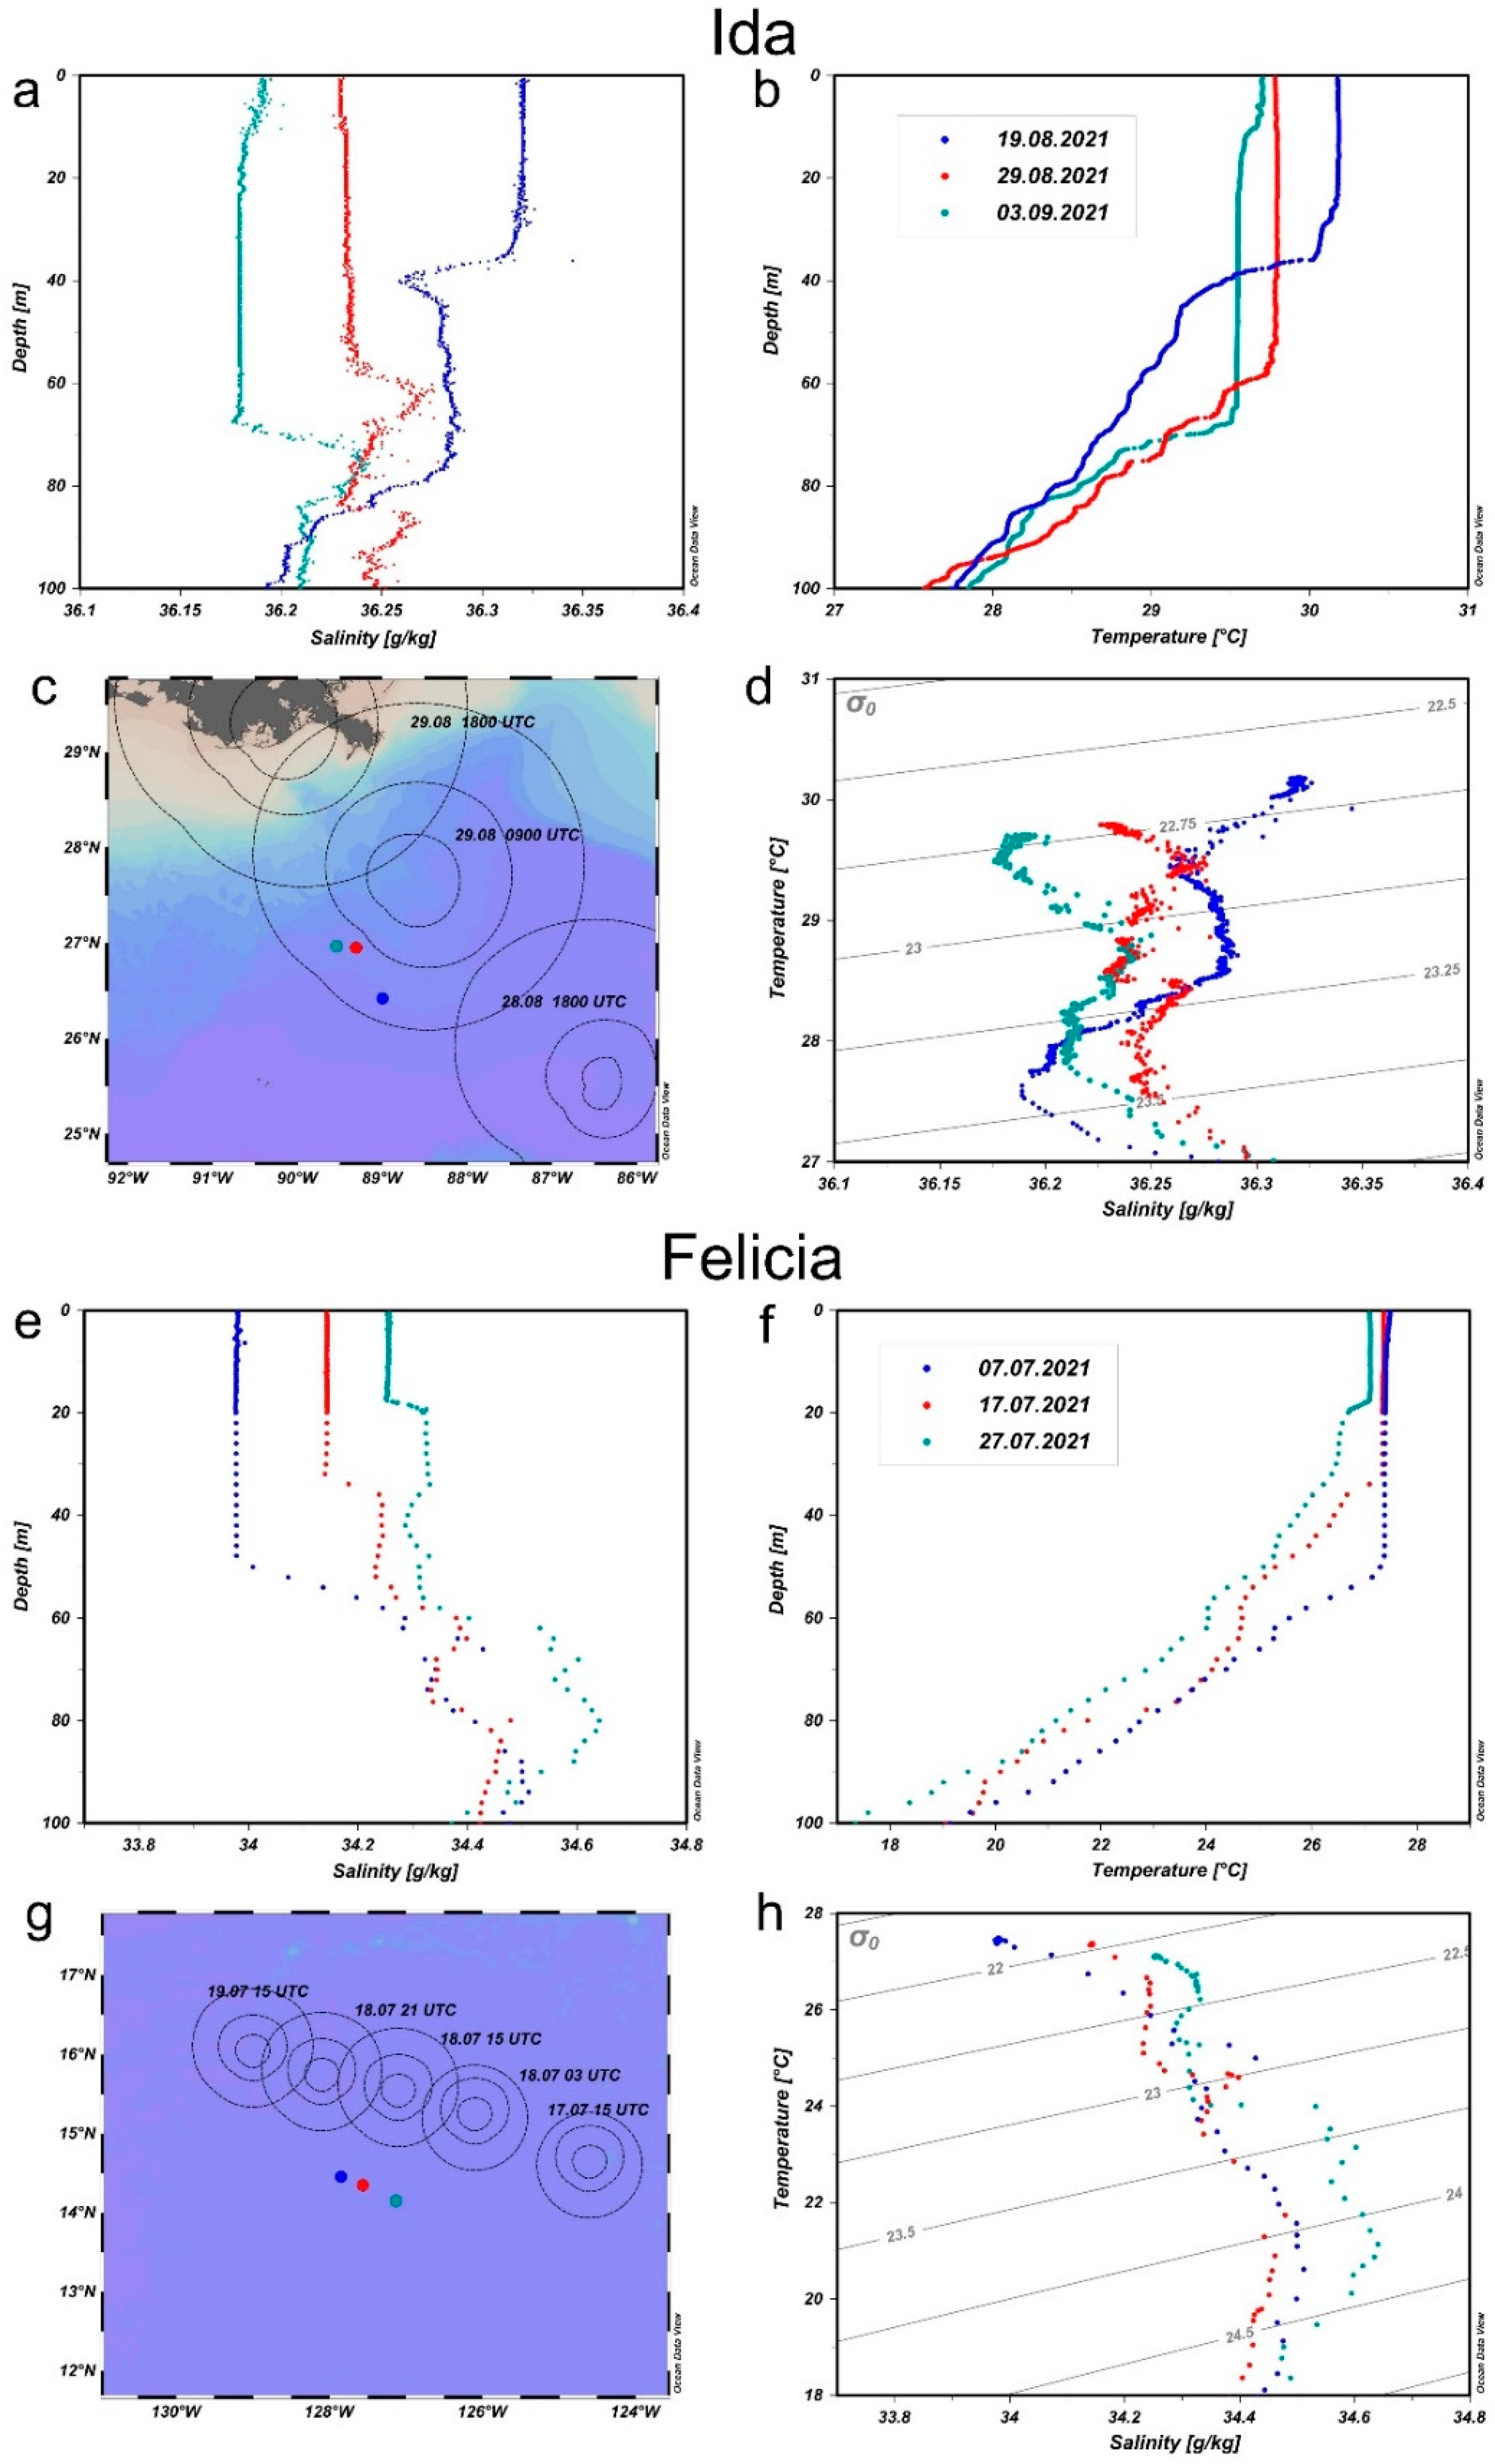
3.2. Temperature and Salinity Profiles
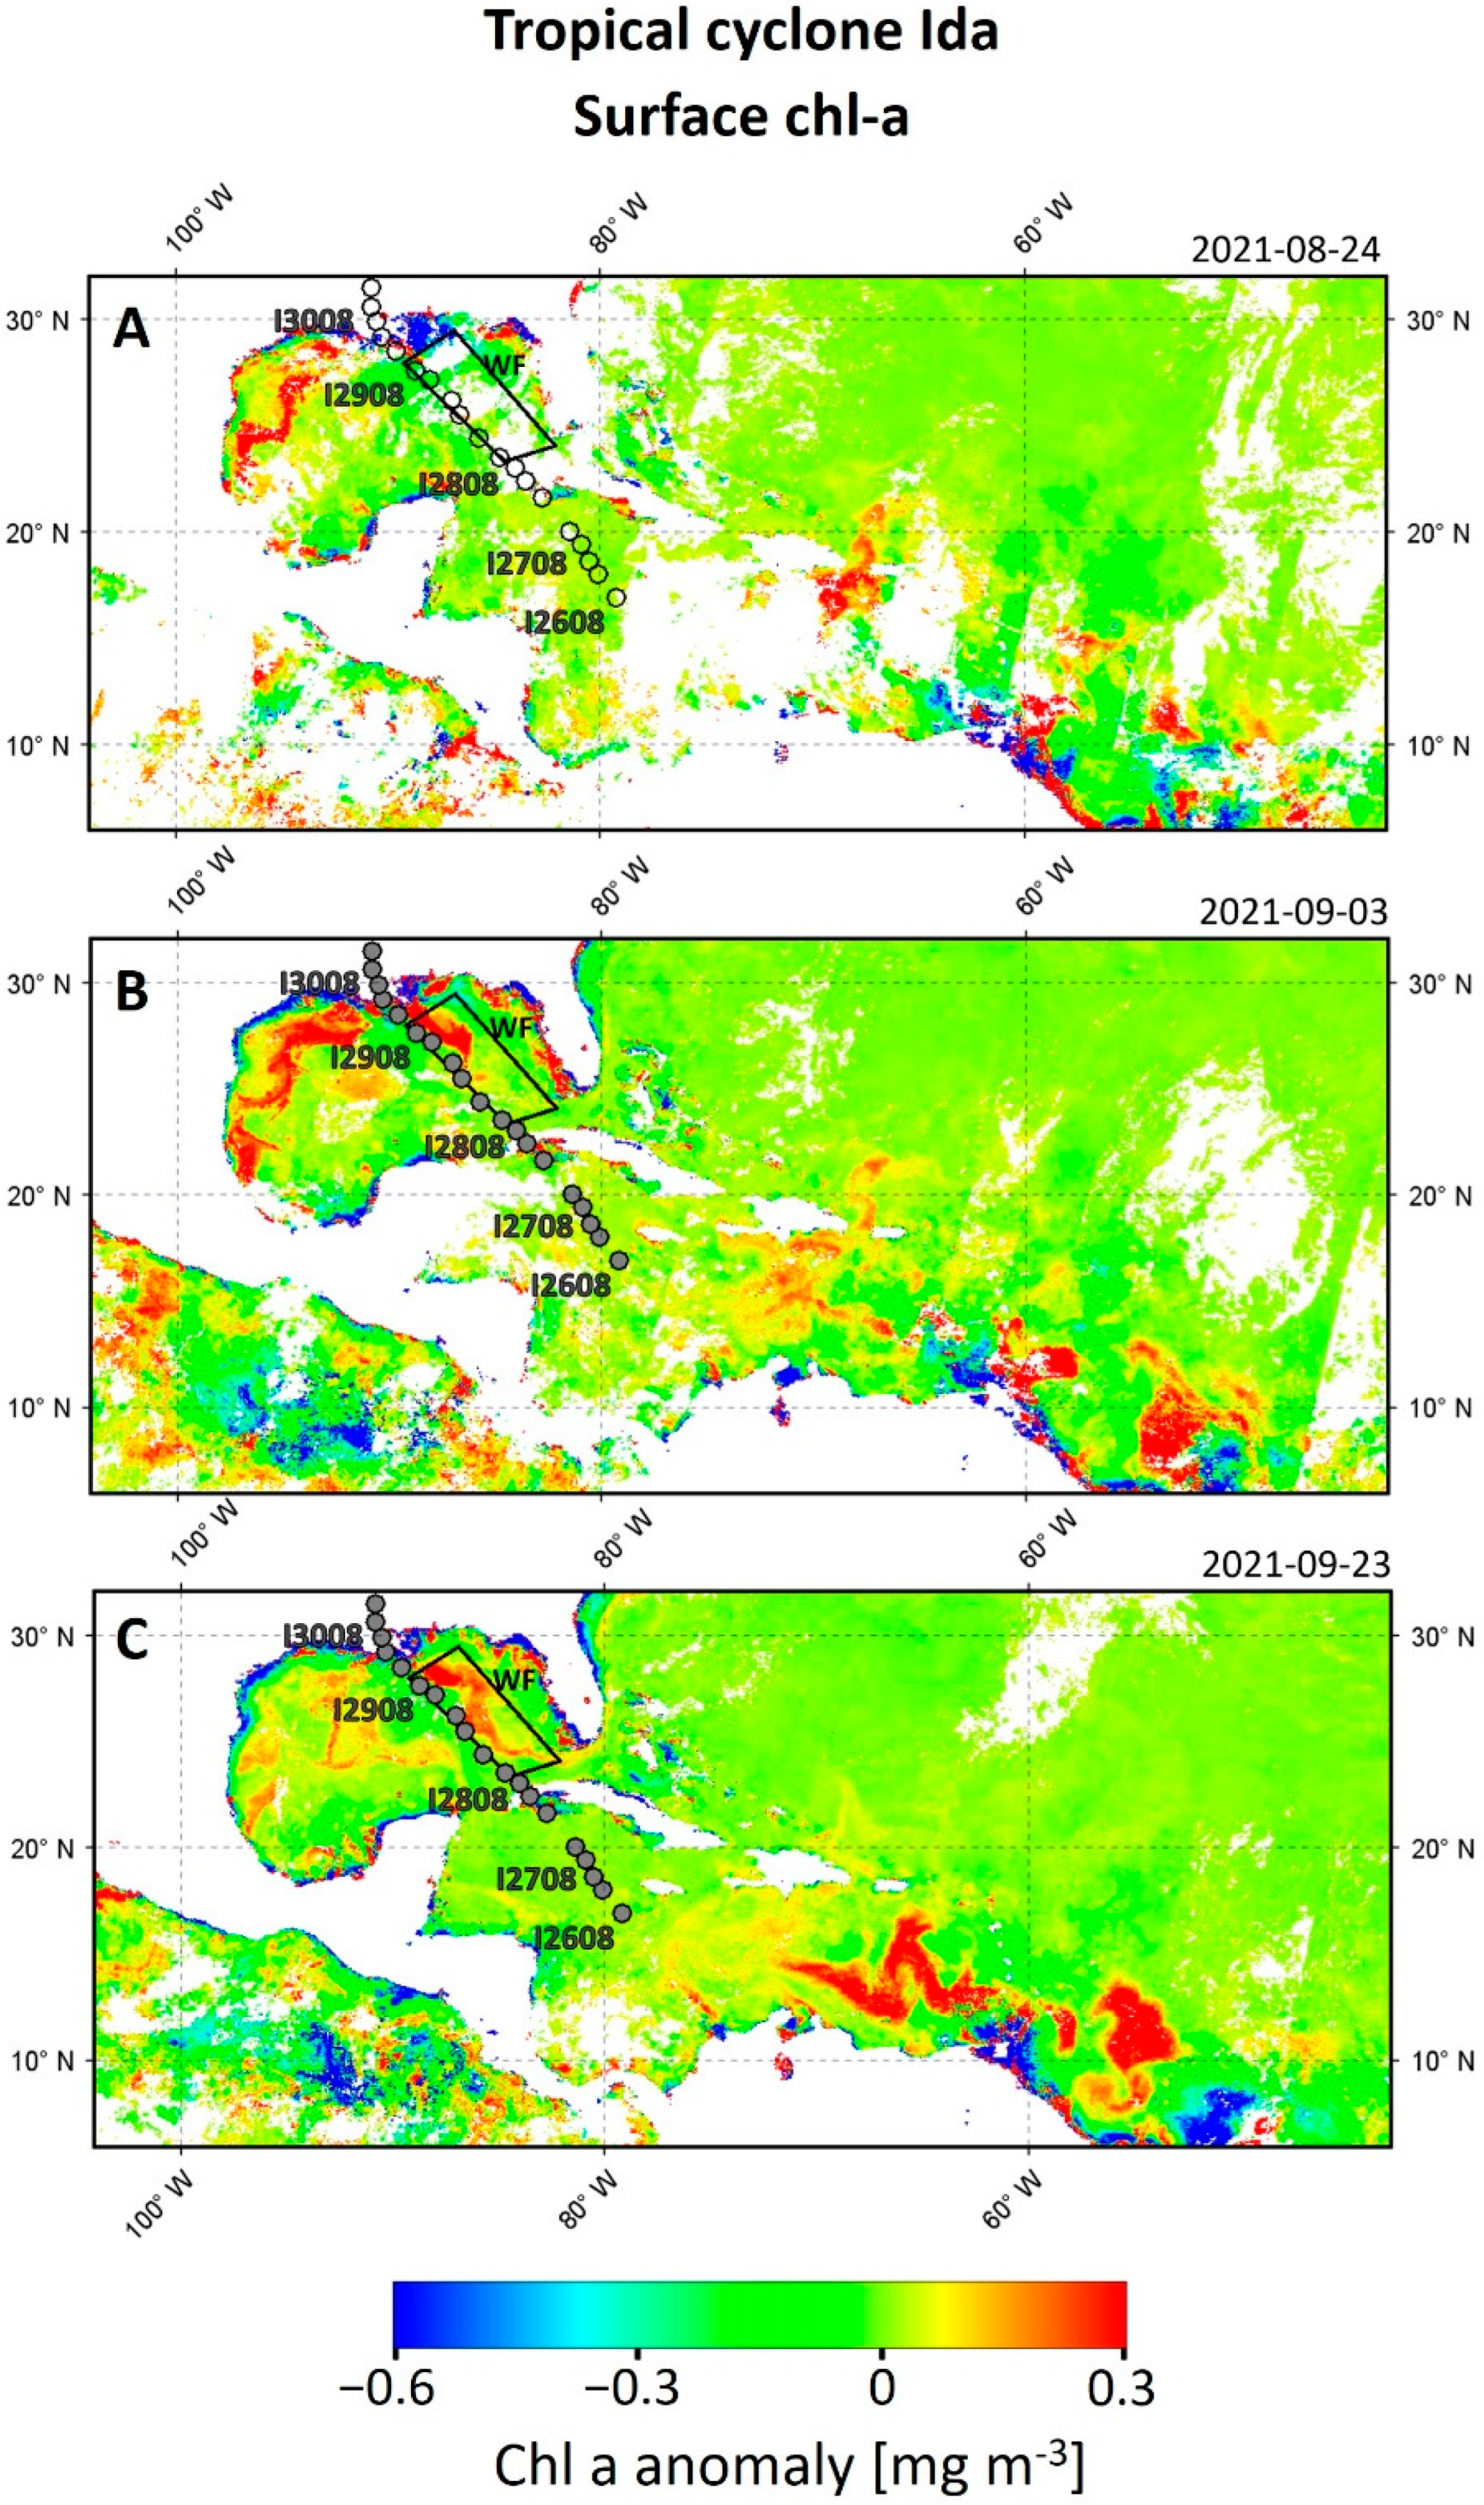
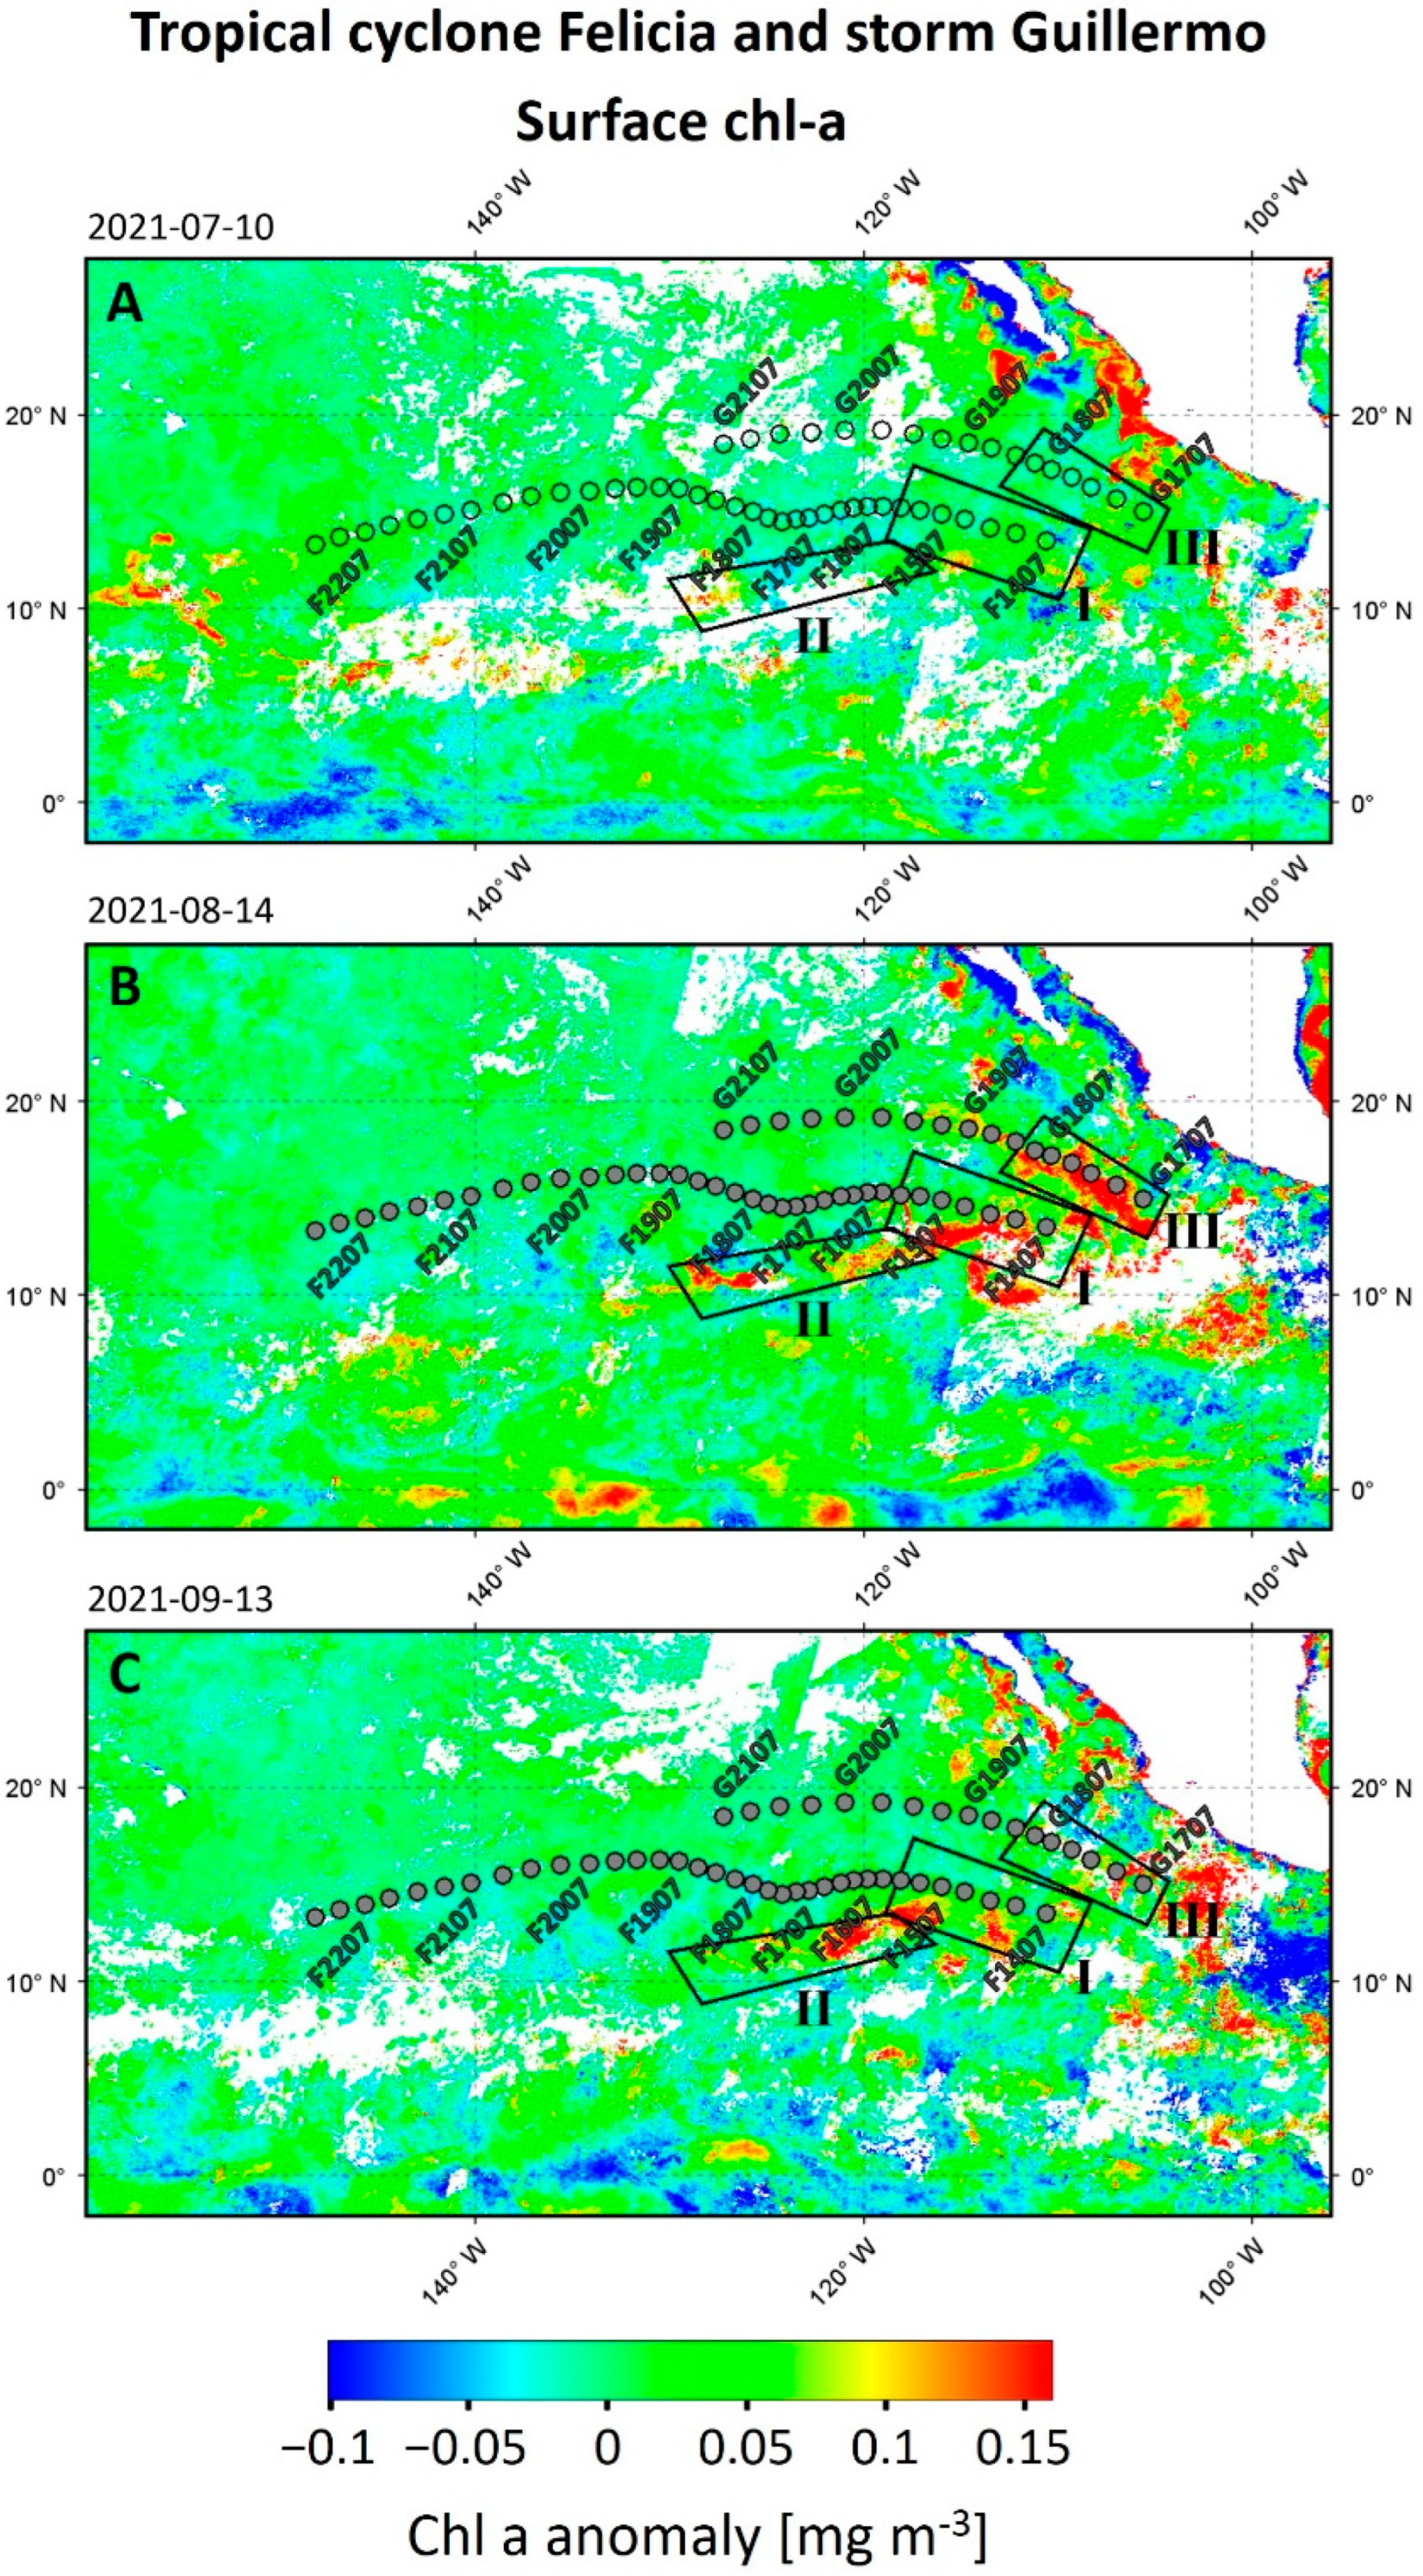
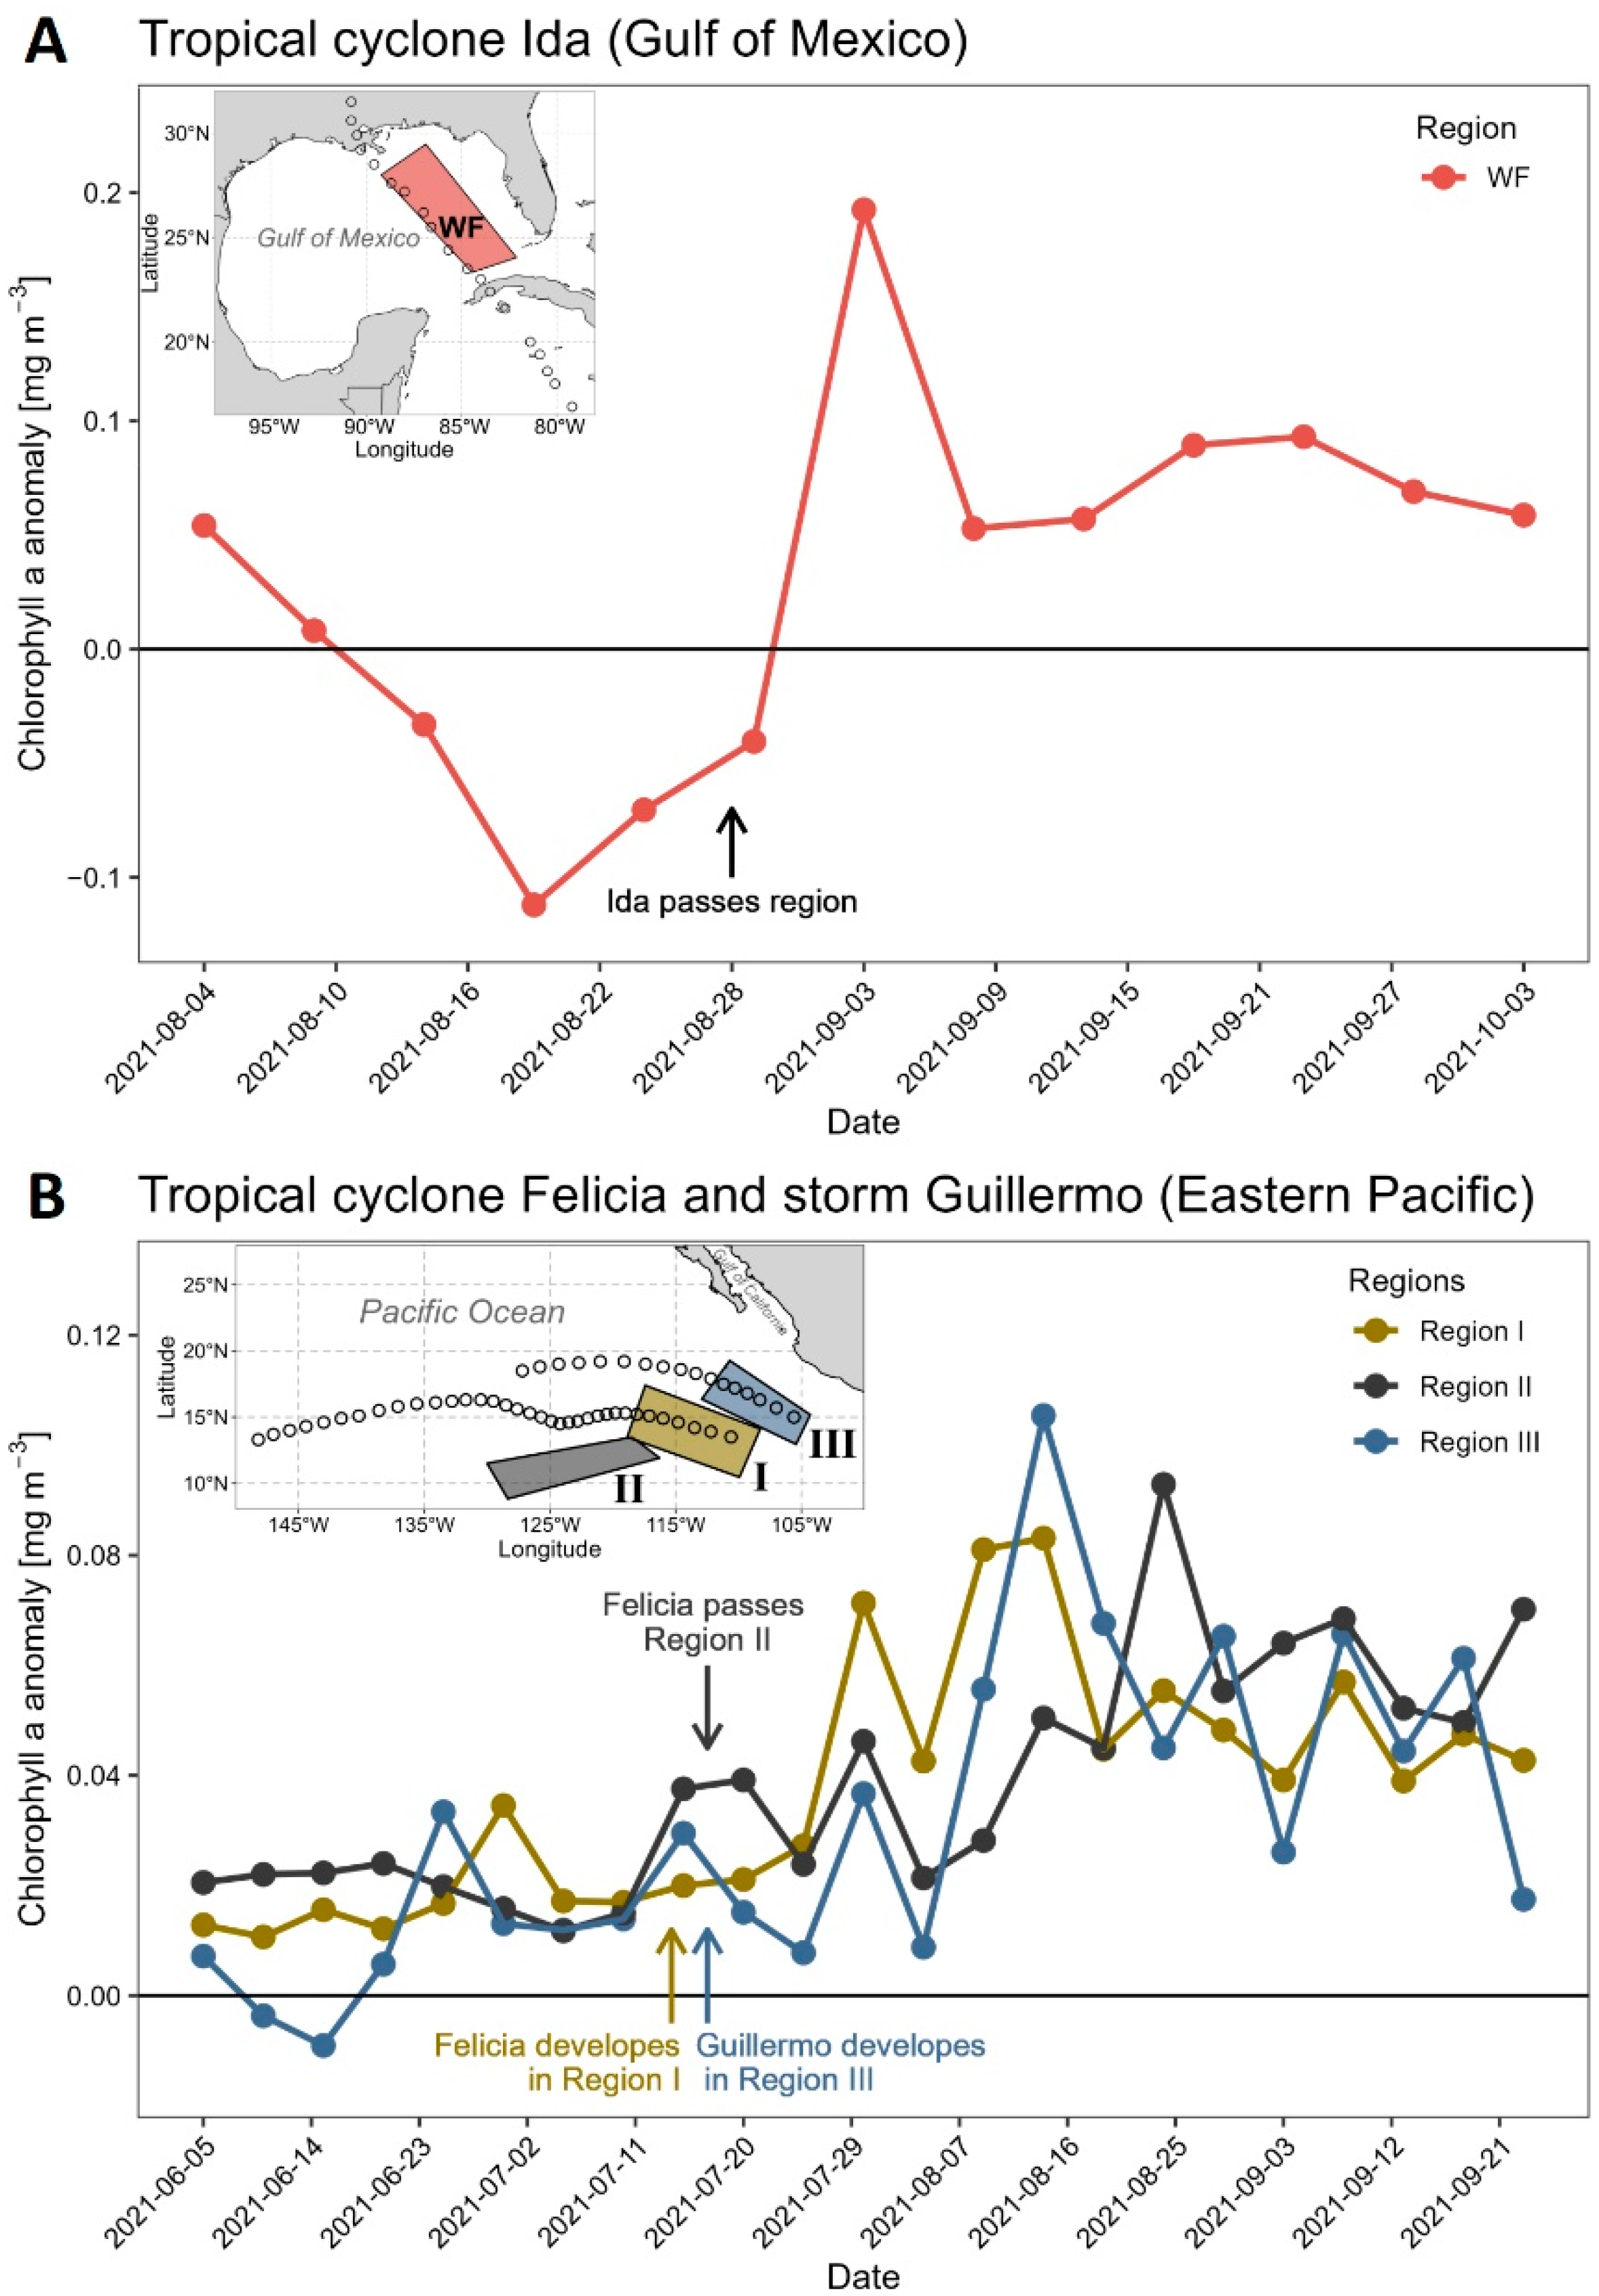
3.3. Surface Chlorophyll-a
4. Discussion
4.1. SST
4.2. Temperature and Salinity Profiles
4.3. Surface Chlorophyll-a
5. Conclusions
Supplementary Materials
Author Contributions
Funding
Institutional Review Board Statement
Informed Consent Statement
Data Availability Statement
Acknowledgments
Conflicts of Interest
References
- Seneviratne, S.I.; Nicholls, N.; Easterling, D.; Goodess, C.M.; Kanae, S.; Kossin, J.; Luo, Y.; Marengo, J.; McInnes, K.; Rahimi, M.; et al. Changes in Climate Extremes and Their Impacts on the Natural Physical Environment. In Managing the Risks of Extreme Events and Disasters to Advance Climate Change Adaptation. A Special Report of Working Groups I and II of the Intergovernmental Panel on Climate Change; Field, C.B., Barros, V., Stocker, T.F., Qin, D., Dokken, D.J., Ebi, K.L., Mastrandrea, M.D., Mach, K.J., Plattner, G.-K., Allen, S.K., et al., Eds.; Cambridge University Press: Cambridge, UK; New York, NY, USA, 2012; pp. 109–123. [Google Scholar]
- Gray, W.M. Global view of the origin of tropical disturbances and storms. Mon. Weather Rev. 1968, 96, 669–700. [Google Scholar] [CrossRef]
- Price, J.F. Upper Ocean Response to a Hurricane. J. Phys. Oceanogr. 1981, 11, 153–175. [Google Scholar] [CrossRef]
- Emanuel, K.A.; DesAutels, C.; Holloway, C.; Korty, R. Environmental Control of Tropical Cyclone Intensity. J. Atmos. Sci. 2004, 61, 843–858. [Google Scholar] [CrossRef]
- Emanuel, K.A. Thermodynamic control of hurricane intensity. Nature 1999, 401, 665–669. [Google Scholar] [CrossRef]
- Emanuel, K.A. Tropical Cyclones. Annu. Rev. Earth Planet. Sci. 2003, 31, 75–104. [Google Scholar] [CrossRef]
- Zhang, H.; He, H.; Zhang, W.-Z.; Tian, D. Upper ocean response to tropical cyclones: A review. Geosci. Lett. 2021, 8, 1. [Google Scholar] [CrossRef]
- Jacob, S.D.; Shay, L.K.; Mariano, A.J.; Black, P.G. The 3D Oceanic Mixed Layer Response to Hurricane Gilbert. J. Phys. Oceanogr. 2000, 30, 1407–1429. [Google Scholar] [CrossRef]
- D’Asaro, E.A. The Ocean Boundary Layer below Hurricane Dennis. J. Phys. Oceanogr. 2003, 33, 561–579. [Google Scholar] [CrossRef]
- Dare, R.A.; McBride, J.L. Sea Surface Temperature Response to Tropical Cyclones. Mon. Weather Rev. 2011, 139, 3798–3808. [Google Scholar] [CrossRef]
- Shay, L.K.; Goni, G.J.; Black, P.G. Effects of a Warm Oceanic Feature on Hurricane Opal. Mon. Weather Rev. 2000, 128, 1366–1383. [Google Scholar] [CrossRef]
- Lloyd, I.D.; Vecchi, G.A. Observational Evidence for Oceanic Controls on Hurricane Intensity. J. Clim. 2011, 24, 1138–1153. [Google Scholar] [CrossRef]
- Balaguru, K.; Chang, P.; Saravanan, R.; Leung, L.R.; Xu, Z.; Li, M.; Hsieh, J.-S. Ocean barrier layers’ effect on tropical cyclone intensification. Proc. Natl. Acad. Sci. USA 2012, 109, 14343–14347. [Google Scholar] [CrossRef] [PubMed] [Green Version]
- Lin, I.-I.; Wu, C.-C.; Pun, I.-F.; Ko, D.-S. Upper-Ocean Thermal Structure and the Western North Pacific Category 5 Typhoons. Part I: Ocean Features and the Category 5 Typhoons’ Intensification. Mon. Weather Rev. 2008, 136, 3288–3306. [Google Scholar] [CrossRef] [Green Version]
- Babin, S.M.; Carton, J.A.; Dickey, T.D.; Wiggert, J.D. Satellite evidence of hurricane-induced phytoplankton blooms in an oceanic desert. J. Geophys. Res. Ocean. 2004, 109, C03043. [Google Scholar] [CrossRef] [Green Version]
- Davis, A.; Yan, X.-H. Hurricane forcing on chlorophyll-a concentration off the northeast coast of the U.S. Geophys. Res. Lett. 2004, 31, L17304. [Google Scholar] [CrossRef]
- Walker, N.D.; Leben, R.R.; Balasubramanian, S. Hurricane-forced upwelling and chlorophyll a enhancement within cold-core cyclones in the Gulf of Mexico. Geophys. Res. Lett. 2005, 32, L18610. [Google Scholar] [CrossRef]
- Lin, I.; Liu, W.T.; Wu, C.-C.; Wong, G.T.F.; Hu, C.; Chen, Z.; Liang, W.-D.; Yang, Y.; Liu, K.-K. New evidence for enhanced ocean primary production triggered by tropical cyclone. Geophys. Res. Lett. 2003, 30, 1718. [Google Scholar] [CrossRef] [Green Version]
- Chen, C.-T.A.; Liu, C.-T.; Chuang, W.S.; Yang, Y.J.; Shiah, F.-K.; Tang, T.Y.; Chung, S.W. Enhanced buoyancy and hence upwelling of subsurface Kuroshio waters after a typhoon in the southern East China Sea. J. Mar. Syst. 2003, 42, 65–79. [Google Scholar] [CrossRef]
- Zheng, G.M.; Tang, D. Offshore and nearshore chlorophyll increases induced by typhoon winds and subsequent terrestrial rainwater runoff. Mar. Ecol. Prog. Ser. 2007, 333, 61–74. [Google Scholar] [CrossRef] [Green Version]
- Tsuchiya, K.; Kuwahara, V.S.; Hamasaki, K.; Tada, Y.; Ichikawa, T.; Yoshiki, T.; Nakajima, R.; Imai, A.; Shimode, S.; Toda, T. Typhoon-induced response of phytoplankton and bacteria in temperate coastal waters. Estuar. Coast. Shelf Sci. 2015, 167, 458–465. [Google Scholar] [CrossRef]
- Menkes, C.E.; Lengaigne, M.; Lévy, M.; Ethé, C.; Bopp, L.; Aumont, O.; Vincent, E.; Vialard, J.; Jullien, S. Global impact of tropical cyclones on primary production. Glob. Biogeochem. Cycles 2016, 30, 767–786. [Google Scholar] [CrossRef] [Green Version]
- Foltz, G.R.; Balaguru, K.; Leung, L.R. A reassessment of the integrated impact of tropical cyclones on surface chlorophyll in the western subtropical North Atlantic. Geophys. Res. Lett. 2015, 42, 1158–1164. [Google Scholar] [CrossRef]
- Weng, J.; Wang, L.; Luo, J.; Chen, B.; Peng, X.; Gan, Q. A Contrast of the Monsoon-Tropical Cyclone Relationship between the Western and Eastern North Pacific. Atmosphere 2022, 13, 1465. [Google Scholar] [CrossRef]
- Jin, F.F.; Boucharel, J.; Lin, I.I. Eastern Pacific tropical cyclones intensified by El Niño delivery of subsurface ocean heat. Nature 2014, 516, 82–85. [Google Scholar] [CrossRef]
- Fu, D.; Chang, P.; Patricola, C.M.; Saravanan, R.; Liu, X.; Beck, H.E. Central American mountains inhibit eastern North Pacific seasonal tropical cyclone activity. Nat. Commun. 2021, 12, 4422. [Google Scholar] [CrossRef] [PubMed]
- Holbach, H.M.; Bourassa, M.A. The Effects of Gap-Wind-Induced Vorticity, the Monsoon Trough, and the ITCZ on East Pacific Tropical Cyclogenesis. Mon. Weather Rev. 2014, 142, 1312–1325. [Google Scholar] [CrossRef]
- Beven, J.L.; Hagen, A.; Berg, R. Tropical Cyclone Report (AL092021): Hurricane IDA; National Hurricane Center. 4 April 2022. Available online: https://www.nhc.noaa.gov/data/tcr/AL092021_Ida.pdf (accessed on 21 June 2022).
- Cangialosi, J.P. Tropical Cyclone Report (EP062021): Hurricane FELICIA; National Hurricane Center. 9 September 2021. Available online: https://www.nhc.noaa.gov/data/tcr/EP062021_Felicia.pdf (accessed on 15 February 2022).
- Berg, R. Tropical Cyclone Report (EP072021): Tropical Storm GUILLERMO; National Hurricane Center. 15 August 2021. Available online: https://www.nhc.noaa.gov/data/tcr/EP072021_Guillermo.pdf (accessed on 15 February 2022).
- Zhao, H.; Shao, J.; Han, G.; Yang, D.; Lv, J. Influence of Typhoon Matsa on Phytoplankton Chlorophyll-a off East China. PLoS ONE 2015, 10, e0137863. [Google Scholar] [CrossRef]
- Sathyendranath, S.; Brewin, R.J.W.; Brockmann, C.; Brotas, V.; Calton, B.; Chuprin, A.; Cipollini, P.; Couto, A.B.; Dingle, J.; Doerffer, R.; et al. An Ocean-Colour Time Series for Use in Climate Studies: The Experience of the Ocean-Colour Climate Change Initiative (OC-CCI). Sensors 2019, 19, 4285. [Google Scholar] [CrossRef] [Green Version]
- Roemmich, D.; Johnson, G.C.; Riser, S.; Davis, R.; Gilson, J.; Owens, W.B.; Garzoli, S.L.; Schmid, C.; Ignaszewski, M. The Argo Program. Observing the Global Ocean with Profiling Floats. Oceanography 2009, 22, 34–43. [Google Scholar] [CrossRef] [Green Version]
- Schlitzer, R. Ocean Data View. 2018. Available online: https://odv.awi.de (accessed on 22 February 2022).
- R Core Team. R: A Language and Environment for Statistical Computing. R Found. Stat. Comput. Vienna Austria 2021. [Google Scholar]
- Wickham, H. Ggplot2: Elegant Graphics for Data Analysis; Springer: New York, NY, USA, 2016. [Google Scholar]
- Yuan, J.; Miller, R.L.; Powell, R.T.; Dagg, M.J. Storm-induced injection of the Mississippi River plume into the open Gulf of Mexico. Geophys. Res. Lett. 2004, 31, L09312. [Google Scholar] [CrossRef]
- Kimball, S.K. Structure and Evolution of Rainfall in Numerically Simulated Landfalling Hurricanes. Mon. Weather Rev. 2008, 136, 3822–3847. [Google Scholar] [CrossRef]
- Sun, J.; Vecchi, G.; Soden, B. Sea Surface Salinity Response to Tropical Cyclones Based on Satellite Observations. Remote Sens. 2021, 13, 420. [Google Scholar] [CrossRef]
- Reinhart, B.J.; Reinhart, A.; Berg, R. Tropical Cyclone Report (AL072021): Hurricane GRACE; National Hurricane Center. 18 February 2022. Available online: https://www.nhc.noaa.gov/data/tcr/AL072021_Grace.pdf (accessed on 18 September 2022).
- Zavala-Hidalgo, J.; Gallegos-García, A.; Martínez-López, B.; Morey, S.L.; O’Brien, J.J. Seasonal upwelling on the Western and Southern Shelves of the Gulf of Mexico. Ocean Dyn. 2006, 56, 333–338. [Google Scholar] [CrossRef]
- Lin, I.-I. Typhoon-induced phytoplankton blooms and primary productivity increase in the western North Pacific subtropical ocean. J. Geophys. Res. Ocean. 2012, 117, C03039. [Google Scholar] [CrossRef]
- Knapp, K.R.; Diamond, H.J.; Kossin, J.P.; Kruk, M.C.; Schreck, C.J. International Best Track Archive for Climate Stewardship (IBTrACS) Project, Version 4. NOAA National Centers for Environmental Information. Available online: https://doi.org/10.25921/82ty-9e16 (accessed on 29 August 2022).
- Knapp, K.R.; Kruk, M.C.; Levinson, D.H.; Diamond, H.J.; Neumann, C.J. The International Best Track Archive for Climate Stewardship (IBTrACS): Unifying Tropical Cyclone Data. Bull. Am. Meteorol. Soc. 2010, 91, 363–376. [Google Scholar] [CrossRef] [Green Version]
- Jaimes, B.; Shay, L.K. Mixed Layer Cooling in Mesoscale Oceanic Eddies during Hurricanes Katrina and Rita. Mon. Weather Rev. 2009, 137, 4188–4207. [Google Scholar] [CrossRef] [Green Version]
- Liu, S.-S.; Sun, L.; Wu, Q.; Yang, Y.-J. The responses of cyclonic and anticyclonic eddies to typhoon forcing: The vertical temperature-salinity structure changes associated with the horizontal convergence/divergence. J. Geophys. Res. Ocean. 2017, 122, 4974–4989. [Google Scholar] [CrossRef]
- Byju, P.; Prasanna Kumar, S. Physical and biological response of the Arabian Sea to tropical cyclone Phyan and its implications. Mar. Environ. Res. 2011, 71, 325–330. [Google Scholar] [CrossRef] [Green Version]
- Pennington, J.T.; Mahoney, K.L.; Kuwahara, V.S.; Kolber, D.D.; Calienes, R.; Chavez, F.P. Primary production in the eastern tropical Pacific: A review. Prog. Oceanogr. 2006, 69, 285–317. [Google Scholar] [CrossRef]
- Hanshaw, M.N.; Lozier, M.S.; Palter, J.B. Integrated impact of tropical cyclones on sea surface chlorophyll in the North Atlantic. Geophys. Res. Lett. 2008, 35, L01601. [Google Scholar] [CrossRef]
- Cochrane, J.D.; Kelly, F.J. Low-frequency circulation on the Texas-Louisiana continental shelf. J. Geophys. Res. Ocean. 1986, 91, 10645–10659. [Google Scholar] [CrossRef]
- Walker, N.D. Satellite assessment of Mississippi River plume variability: Causes and predictability. Remote Sens. Environ. 1996, 58, 21–35. [Google Scholar] [CrossRef]


Publisher’s Note: MDPI stays neutral with regard to jurisdictional claims in published maps and institutional affiliations. |
© 2022 by the authors. Licensee MDPI, Basel, Switzerland. This article is an open access article distributed under the terms and conditions of the Creative Commons Attribution (CC BY) license (https://creativecommons.org/licenses/by/4.0/).
Share and Cite
Neun, S.; Jacob, J.; Wurl, O. Upper Ocean Responses to the Tropical Cyclones Ida and Felicia (2021) in the Gulf of Mexico and the Eastern North Pacific. Remote Sens. 2022, 14, 5520. https://doi.org/10.3390/rs14215520
Neun S, Jacob J, Wurl O. Upper Ocean Responses to the Tropical Cyclones Ida and Felicia (2021) in the Gulf of Mexico and the Eastern North Pacific. Remote Sensing. 2022; 14(21):5520. https://doi.org/10.3390/rs14215520
Chicago/Turabian StyleNeun, Sebastian, Jan Jacob, and Oliver Wurl. 2022. "Upper Ocean Responses to the Tropical Cyclones Ida and Felicia (2021) in the Gulf of Mexico and the Eastern North Pacific" Remote Sensing 14, no. 21: 5520. https://doi.org/10.3390/rs14215520