Article

Evaluation of the Landsat-8 Albedo Product across the Circumpolar Domain

1
School for the Environment, University of Massachusetts Boston, Boston, MA 02125, USA
2
Helmholtz Center for Environmental Research, 04318 Leipzig, Germany
3
BASF Digital Farming GmbH, Im Zollhafen 24, 50678 Köln, Germany
4
Terrestrial Information Systems Laboratory, NASA Goddard Space Flight Center, Greenbelt, MD 20771, USA
5
Earth System Science Interdisciplinary Center, University of Maryland, College Park, MD 20742, USA
*
Author to whom correspondence should be addressed.
Remote Sens. 2022, 14(21), 5320; https://doi.org/10.3390/rs14215320
Submission received: 2 September 2022 / Revised: 10 October 2022 / Accepted: 19 October 2022 / Published: 24 October 2022

Abstract

:
Land surface albedo plays an extremely important role in the surface energy budget, by determining the proportion of incoming solar radiation, which is available to drive photosynthesis and surface heating, and that which is reflected directly back to space. In northern high latitude regions, the albedo of snow-covered vegetation and open, leafless forest canopies in winter, is quite high, while the albedo of boreal evergreen conifers can either be quite low (even with extensive snow lying under the canopy) or rather bright depending on the structure and density of the canopy. Here, we present the further development and evaluation of a 30 m Landsat albedo product, including an operational blue-sky albedo product, for application in the circumpolar domain. The surface reflectances from the Landsat satellite constellation are coupled with surface anisotropy information (Bidirectional Reflectance Distribution Function, BRDF) from the MODerate-resolution Imaging Spectroradiometer (MODIS). The product is extensively validated across diverse land cover and conditions and performs well with root mean squared error of 0.0395 and negligible bias when compared to coincident tower-based albedo measurements. The development of this Landsat albedo products allows for better capture of ephemeral, heterogeneous and dynamic surface conditions at the landscape scale across the circumpolar domain.

1. Introduction

Land surface albedo, defined as the ratio of upwelling to downwelling radiative flux, is an essential climate variable (ECV) required to accurately model the global surface energy budget [1]. Albedo describes how incoming solar energy interacts with the Earth’s surface, which is key to monitoring and modeling the surface energy and the hydrologic and biogeochemical functioning of land and coastal ecosystems over the globe. Albedo is a particularly critical factor in surface radiative warming and cooling in the northern latitudes, in large part to the presence or absence of seasonal snow cover [2,3].
Albedo is influenced by both biotic and abiotic factors including land cover, vegetation structure and distribution, and landscape topography. As such, it is locally, regionally, and temporally variable. Higher spatial resolution albedo products allow for both the discrimination of the drivers of albedo change within a landscape and the impact of these changes on the overall energy balance of a system. Climate warming is occurring more strongly in the northern latitudes, with some regions of the Arctic experiencing rates two to three times the global average, leading to widespread and measurable shifts in vegetation and snow cover [4]. Correspondingly, satellite albedo measures from sensors such as AVHRR and MODIS have shown decreasing spring and summer albedo across the northern hemisphere since the 1980s [5]. This decrease in albedo has been linked to changes in snow extent and duration [5,6] as well as decreasing Arctic sea ice extent [7,8]. Surface water has also been shown to be a contributor to decreasing albedo across the Arctic-boreal domain, accounting for up to a quarter of the spatial variation in monthly albedo from 2000 to 2019 [9]. Local changes in growing season length, soil hydrology, soil nutrition, and disturbance regimes alter vegetation productivity, composition, and structure [10] and in turn affect the landscape albedo signatures. The importance of albedo in the surface energy budget is also highly dependent on the seasonality of solar insolation which can compound the impact of changes in landcover at the landscape scale. The complexity of the drivers of change coupled with the small-scale heterogeneity in vegetation, topography and seasonal snow patterns of high latitude systems highlight the need for a higher resolution satellite albedo product.
Variations in small scale patterns are also associated with snow accumulation and retention across the northern hemisphere. Changes in seasonal snow and ice coverage in the biomes have particularly important implications as the high albedo of snow and ice increases the proportion of solar radiation reflected from the Earth’s surface and can produce a measurable cooling effect. The Snow Albedo Feedback (SAF) is a leading cause of shifts in atmospheric circulation and climate in the Northern Hemisphere and is especially influential in the spring when higher incoming solar radiation and thinning snow cover correlate to earlier snowmelt [11] and enhanced soil thawing [12], resulting in variable growing seasons. The magnitude of cooling provided by higher snow albedo is related to several factors including snow depth, cloud cover, solar zenith angle, day length, solar insolation and vegetation type and structure, and as such, is highly variable over heterogeneous land surfaces. The largest variations in surface shortwave forcing are seen over shrublands, grasslands, and sparsely vegetated terrain. In addition to changes in water, snow and ice regimes, the pan-arctic region is also seeing changes in vegetation structure and distribution with shrubs and trees expanding in both range and stature [13,14,15,16,17]. These shifts in vegetation structure and extent have measurable effects on the surface energy balance and have been observed through greening and browning trends identified with satellite-based vegetation indices [10,18,19,20,21].
In tall forests, the presence of snow beneath an evergreen canopy can have a varying and complex influence on surface albedo. A study in northeastern U.S. forests, found that snow under the canopy only increased albedo by +0.08 at most, indicating the strong masking effect of standing biomass [22] and resulting in positive climate forcing (i.e., warming). However, forests at higher latitudes tend to have less dense canopies with lower values of total leaf area per unit ground surface area (Leaf Area Index—LAI), but more pronounced surface anisotropy. In these systems, the masking effect of standing biomass on snow is lower and the SAF effects expected to be higher. In one study in southern Finland, snow cover in a boreal Scots pine (Pinus sylvestris) was shown to increase albedo by 0.2, but the results varied greatly between and within canopy highlighting the need for higher resolution snow cover and stand information on larger scales [23].
Additionally, both surface albedo and large-scale vegetation dynamics are affected by wetland area and water budgets. Changes in wetland areas and lakes in the Arctic have been shown to be quite variable. In Siberia, lake area is increasing in northern continuous permafrost regions and decreasing further south [24]. In North America, the opposite trend has been observed with small gains in the south offset by larger losses further north [25]. These observed changes in surface water cover will have a strong impact on the energy budget both locally and regionally. A radiative transfer modeling study found the fraction of standing water is a critical driver of landscape albedo [26]. Using MODIS imagery, a study found changes in surface water extent were a key driver in the spatial variation of albedo change between 2000 and 2019, especially in the summer months [9]. These changes are often driven by permafrost degradation where localized thawing of ground ice can cause subsidence and the accumulation of surface water. This surface water lowers albedo, increases surface temperatures, and can perpetuate further permafrost degradation. Again, higher resolution albedo products will be key in understanding these relationships as many of the waterbodies in the northern latitudes are not effectively captured at the MODIS scale. Monitoring these systems using higher resolution albedo products such as the Landsat albedo products evaluated here, allows for a more nuanced understanding of how the spatial patterns of inland water, as well as vegetation dynamics, contribute to large variability at the local scale and aid in resolving unexplained drivers in identified trends.
In this paper, a pan-arctic 30 m albedo algorithm for snow and snow-free periods from Landsat-8 Operational Land Imager is presented and evaluated. The development and availability of an operational white-sky, black-sky and blue-sky albedo product suite will help facilitate analysis of albedo dynamics across the tundra and boreal biomes. The target area for this production and validation is between 40°–84°N, as 84°N represents the upper range of the Landsat acquisition paths [27] and the extent to 40°N at the southern edge allows the capture of much of the boreal and temperate forest biomes across northern North America and Eurasia, all of which are heavily impacted by changing climate and disturbance patterns. The Landsat albedo product is evaluated both with internal quality metrics and against ground tower measurements across a diversity of biomes and solar geometries. Previous preliminary iterations of the Landsat albedo product have been validated, including the initial snow-free product [28], and the North American Albedo Product which included snow retrievals [29]. Further development of Sentinel-2 albedo products [30] and implementation of the algorithm on the Harmonized Landsat Sentinel-2 (HLS) surface reflectance data is ongoing. Here, we present the further development of these efforts, which include processing chain enhancements, development of an operational blue-sky or actual albedo, and further emphasis on the impact of retrieval conditions on the accuracy of the operational product.

2. Materials and Methods

The Landsat albedo algorithms couple finer resolution surface reflectance Landsat products with coincident same-day coarser resolution MODerate Resolution Imaging Spectroradiometer (MODIS) derived Bidirectional Reflectance Distribution Function (BRDF) characteristics using a method developed by Shuai et al. [28], Wang et al. [31] and Li et al. [30] as described below. Landsat-8 surface reflectance is generated from the Landsat Surface Reflectance Code (LaSRC), which makes use of the unique coastal aerosol band to perform aerosol inversion tests as well as using auxiliary climate data from MODIS in a unique radiative transfer model [32]. The MODIS BRDF parameters are derived from the Moderate Resolution Imaging Spectroradiometer (MODIS) MCD43A1 Version 6 Bidirectional Reflectance Distribution Function and Albedo (BRDF/Albedo) Model Parameters dataset, produced daily using both Terra and Aqua MODIS data at 500-meter (m) resolution [33,34]. The generation of a hemispherical albedo requires a BRDF model of each land surface field of view to capture surface anisotropy. The BRDF describes the behavior of a scattering surface and is defined as the ratio of the reflected radiance in a particular direction to the incident irradiance from a specified direction in a solid angle [35]. To accurately describe the BRDF of a surface, the anisotropic character of the surface must be observed through sufficient and well distributed angular reflectance measurements. The near nadir acquisition geometry of the Landsat sensors is not capable of generating such a BRDF and therefore the BRDF models from the coarser resolution MODIS are utilized. To generate finer resolution albedo products, Landsat surface reflectance measures are then adjusted by MODIS- BRDF parameters using an Albedo-to-Nadir Reflectance (AN) ratio for each spectral band. To generate this ratio, an automatic classification algorithm is first run on the six Landsat bands coincident with MODIS (bands 2–7 for Landsat-8). The classification map and MODIS derived BRDF parameters are stacked to identify suitable “pure patches” within the classification layer. A pure patch is considered as such when it spatially matches more than 85% of its coincident MODIS pixel. For the identified pure patches, the AN ratio is generated using MCD43 BRDF-based estimates of reflectances and albedos at the at the illumination and near-nadir view geometry of the Landsat and MODIS albedo at two extreme illumination conditions—wholly direct radiation (black-sky or directional hemispherical) and wholly diffuse radiation (white-sky or bi-hemispherical reflectance). The average MODIS AN ratio for each class within the classification layer is derived and the ratio is applied to the Landsat surface reflectance within each class to generate the Landsat albedo. In homogenous, pure pixels at MODIS resolution, the AN ratio of albedo and reflectance is assumed to be similar at Landsat and MODIS spatial resolutions at Landsat viewing geometries. The black-sky and white-sky albedo can then be calculated for each pixel in the Landsat scene as:
R ¯ λ , l   ( θ s ) = a ¯ λ ,   l ( Ω l ) * R λ ,   l   ( Ω l ) = a ¯ λ ,   m ( Ω l ) *   R λ ,   l   ( Ω l ) R = λ , l   = a = λ ,   l ( Ω l ) * R λ ,   l   ( Ω l ) = a = λ ,   m ( Ω l ) *   R λ ,   l   ( Ω l )
where R ¯ λ   is the directional hemispherical reflectance or black-sky albedo and R = λ is the bi-hemispherical reflectance under isotropic illumination conditions or white-sky albedo for spectral band λ , θ s is the solar-angle at Landsat overpass, m denotes MODIS resolution parameters, l denotes the Landsat resolution parameters, Ω l is the Landsat sun-view geometry and a ¯ and a = are the AN ratio for black-sky and white-sky albedo, respectively.
To increase the opportunity for pure pixel identification and reduce the influence of arbitrary scene edges resulting from the Landsat tiling scheme, the classification algorithm is run on the mosaic of consecutive same-day Landsat scenes (and area of ~510 km north–south by 185 km east–west) with the central scene serving as the scene of interest for albedo derivation. The white-sky and black-sky albedo products are produced with per band quality metrics to indicate the quality of both the BRDF input data per pixel and the quality of the correlation between the MODIS and Landsat classification maps and the QA layers are included in the resultant product metadata. The six spectral bands are then used to calculate three broadbands (visible (0.35–0.7 μm), near infrared (0.7–5.0 μm) and shortwave (0.35–5.0 μm)) consistent with the MCD43 albedo product suite. The narrow-to-broadband conversion coefficients used were derived from MODTRAN modelling as presented in Wang et al., 2016 [29]. The internal Landsat snow flag was used to detmination if the snow or snow free coefficients should be applied and the pure pixel snow flags are delivered with the product in an separate image file.

2.1. Operational Blue-Sky Albedo

Bi-hemispherical reflectance (white-sky albedo) and directional hemispherical reflectance (black-sky albedo) represent opposite extremes in illumination conditions and thus are not the best indicator of albedo under ambient illumination conditions at a specific date and time. For forcing calculations and other modeling applications, instantaneous blue-sky albedo under specific illumination conditions is needed. There are several mechanisms for deriving blue-sky albedo. The isotropic blue-sky albedo is calculated as a weighted sum using the fractions of direct and diffuse illumination calculated for the observed optical depth. These measurements of direct and diffuse illumination can be measured directly by radiometers at validation towers and field sites such that:
BLUE iso = R =   p + R ¯   ( 1 p )
where BLUEiso is the isotropic blue-sky albedo, R ¯   is the directional hemispherical reflectance or black-sky albedo and R = is the bi-hemispherical reflectance under isotropic illumination conditions or white-sky albedo and p is the ratio of the surface downward diffuse shortwave radiation to the surface downward total shortwave radiation [36].
The isotropic blue-sky albedo calculation assumes the distribution of sky radiance is of minor importance as the generation of albedo quantities involves the integration over the full hemisphere. Additionally, it assumes that interaction between the incoming radiances and the ground (scattering and absorption) can be approximated within the definition of the diffuse proportion of the atmospheric conditions. However, under bright and complex surface conditions where multiple scattering events are more common (such as snow), these assumptions can lead to larger discrepancies between the actual albedo observed on the ground and modelled albedo measured by satellites [37]. Additional compounding factors that can lead to large errors in the calculation of blue-sky albedo are high solar zenith angles (which affect the quality of MODIS BRDFs) and atmospheric conditions with high concentrations of aerosols [36,37,38,39]. In the development of an operational circumpolar albedo algorithm, the impact of solar zenith angles and multiple scattering characteristics of snow and ice are particularly important components in the calculation of blue-sky albedo at high latitudes and in the transition period between the snow and snow free season.
To address the impact of multiple scattering on the blue-sky albedo calculation, Román et al. [37] developed a model to calculate a full expression blue-sky albedo from MODIS based upon extensive modeling of atmospheric and illumination conditions within the MODTRAN radiative transfer model. The model considers multiple scattering events and has been particularly valuable at capturing blue-sky albedo under snow covered conditions improving MODIS albedo validation biases by 0.004–0.013 absolute units (root mean-squared error) or 0.1–2.0% relative error [37].
For the implementation of a blue-sky albedo algorithm, atmospheric aerosol optical depth (AOD), a quantitative assessment of the amount of aerosol present in the atmosphere (measured by the extinction of a ray of light as it passes through the atmosphere), is required at the global scale. AOD for the operational blue-sky Landsat albedo derivation is iteratively retrieved from Terra and Aqua Aerosol Cloud Water Vapor Products (MOD08v06 and MYD08v06) at daily, eight-day and monthly time steps [40]. The mean AOD over land and ocean is reported for 1 × 1 degree cells globally. AOD values and the target location are extracted first for MODIS Terra (morning overpass to pair with the Landsat acquisition time), then Aqua (afternoon overpass) on the day of interest. If no valid measurements were recorded on a daily timestep, the eight-day interval product and monthly products are queried. In cases where no valid AOD information could be retrieved, a universal climatology value of 0.2 is used.
To further investigate the uncertainties resulting from the low resolution and possibly non-coincident AOD data, the full expression blue-sky albedo data is evaluated further using in situ AOD values at 550 nm from available Aerosol Robotic NETwork (AERONET) tower sites [41,42,43]. AERONET is a project established by NASA and PHOTONS (PHOtométrie pour le Traitement Opérationnel de Normalisation Satellitaire; Univ. of Lille 1, CNES, and CNRS-INSU) in collaboration with other national agencies and consists of a network of ground-based remote sensing aerosol towers to provide a continuous and accessible database for aerosol optical, microphysical and radiative properties for aerosol research and characterization, validation of satellite retrievals, and synergism with other databases. Its towers report measurements of atmospheric optical parameters with the CIMEL sun photometers every 15 minutes in the spectral range from 340 to 1020 nm. The Aerosol Optical Depth is calculated based on the spectral attenuation of a ray at each wavelength with the Beer-Lambert-Bouguer Law, which is based on the measurement of direct solar radiation with the aim of subsequent determination of atmospheric AOD and total content of certain gases [43]. This study used cloud-screened and quality-assured level 2.0 version 3.0 AOD product [44] at 500 nm.
To compare blue-sky albedo calculated using the ground measured AOD to the MODIS derived AOD product at 550 nm, the AERONET AOD must be interpolated to 550 nm using the following:
τ 550 = τ 500 550 500 α
where τ 550 is the target AOD at 550 nm, τ 500 is the measured AOD at 500 nm and α is the ngstrom exponent calculated from the measured wavelengths between 440–675 nm and supplied in the AERONET level 2.0 dataset [45,46,47]. The ngstrom exponent is calculated as:
α = ln ( τ 1 τ 2 ) ln ( λ 1 λ 2 )
where τ 1 and τ 2 are the aerosol optical depths at the wavelengths of λ1 and λ2, respectively. For the validation efforts presented here, the average of all quality screened AOD values within one hour of the Landsat overpass were used for the calculation of the full expression blue-sky albedo.
Lastly, to examine the limits of an operational blue-sky product, a full-expression blue-sky albedo product with a constant AOD, that is, a climatology value of 0.2 is produced for comparison. The full expression blue-sky albedo derived from the three sources of AOD (BLUE_full(MODIS_AOD), BLUE_full(AERONET_AOD), and BLUE_full(Constant_AOD)) were then validated against the in situ tower measurements to determine the best practices and scalability of full expression blue-sky retrievals.

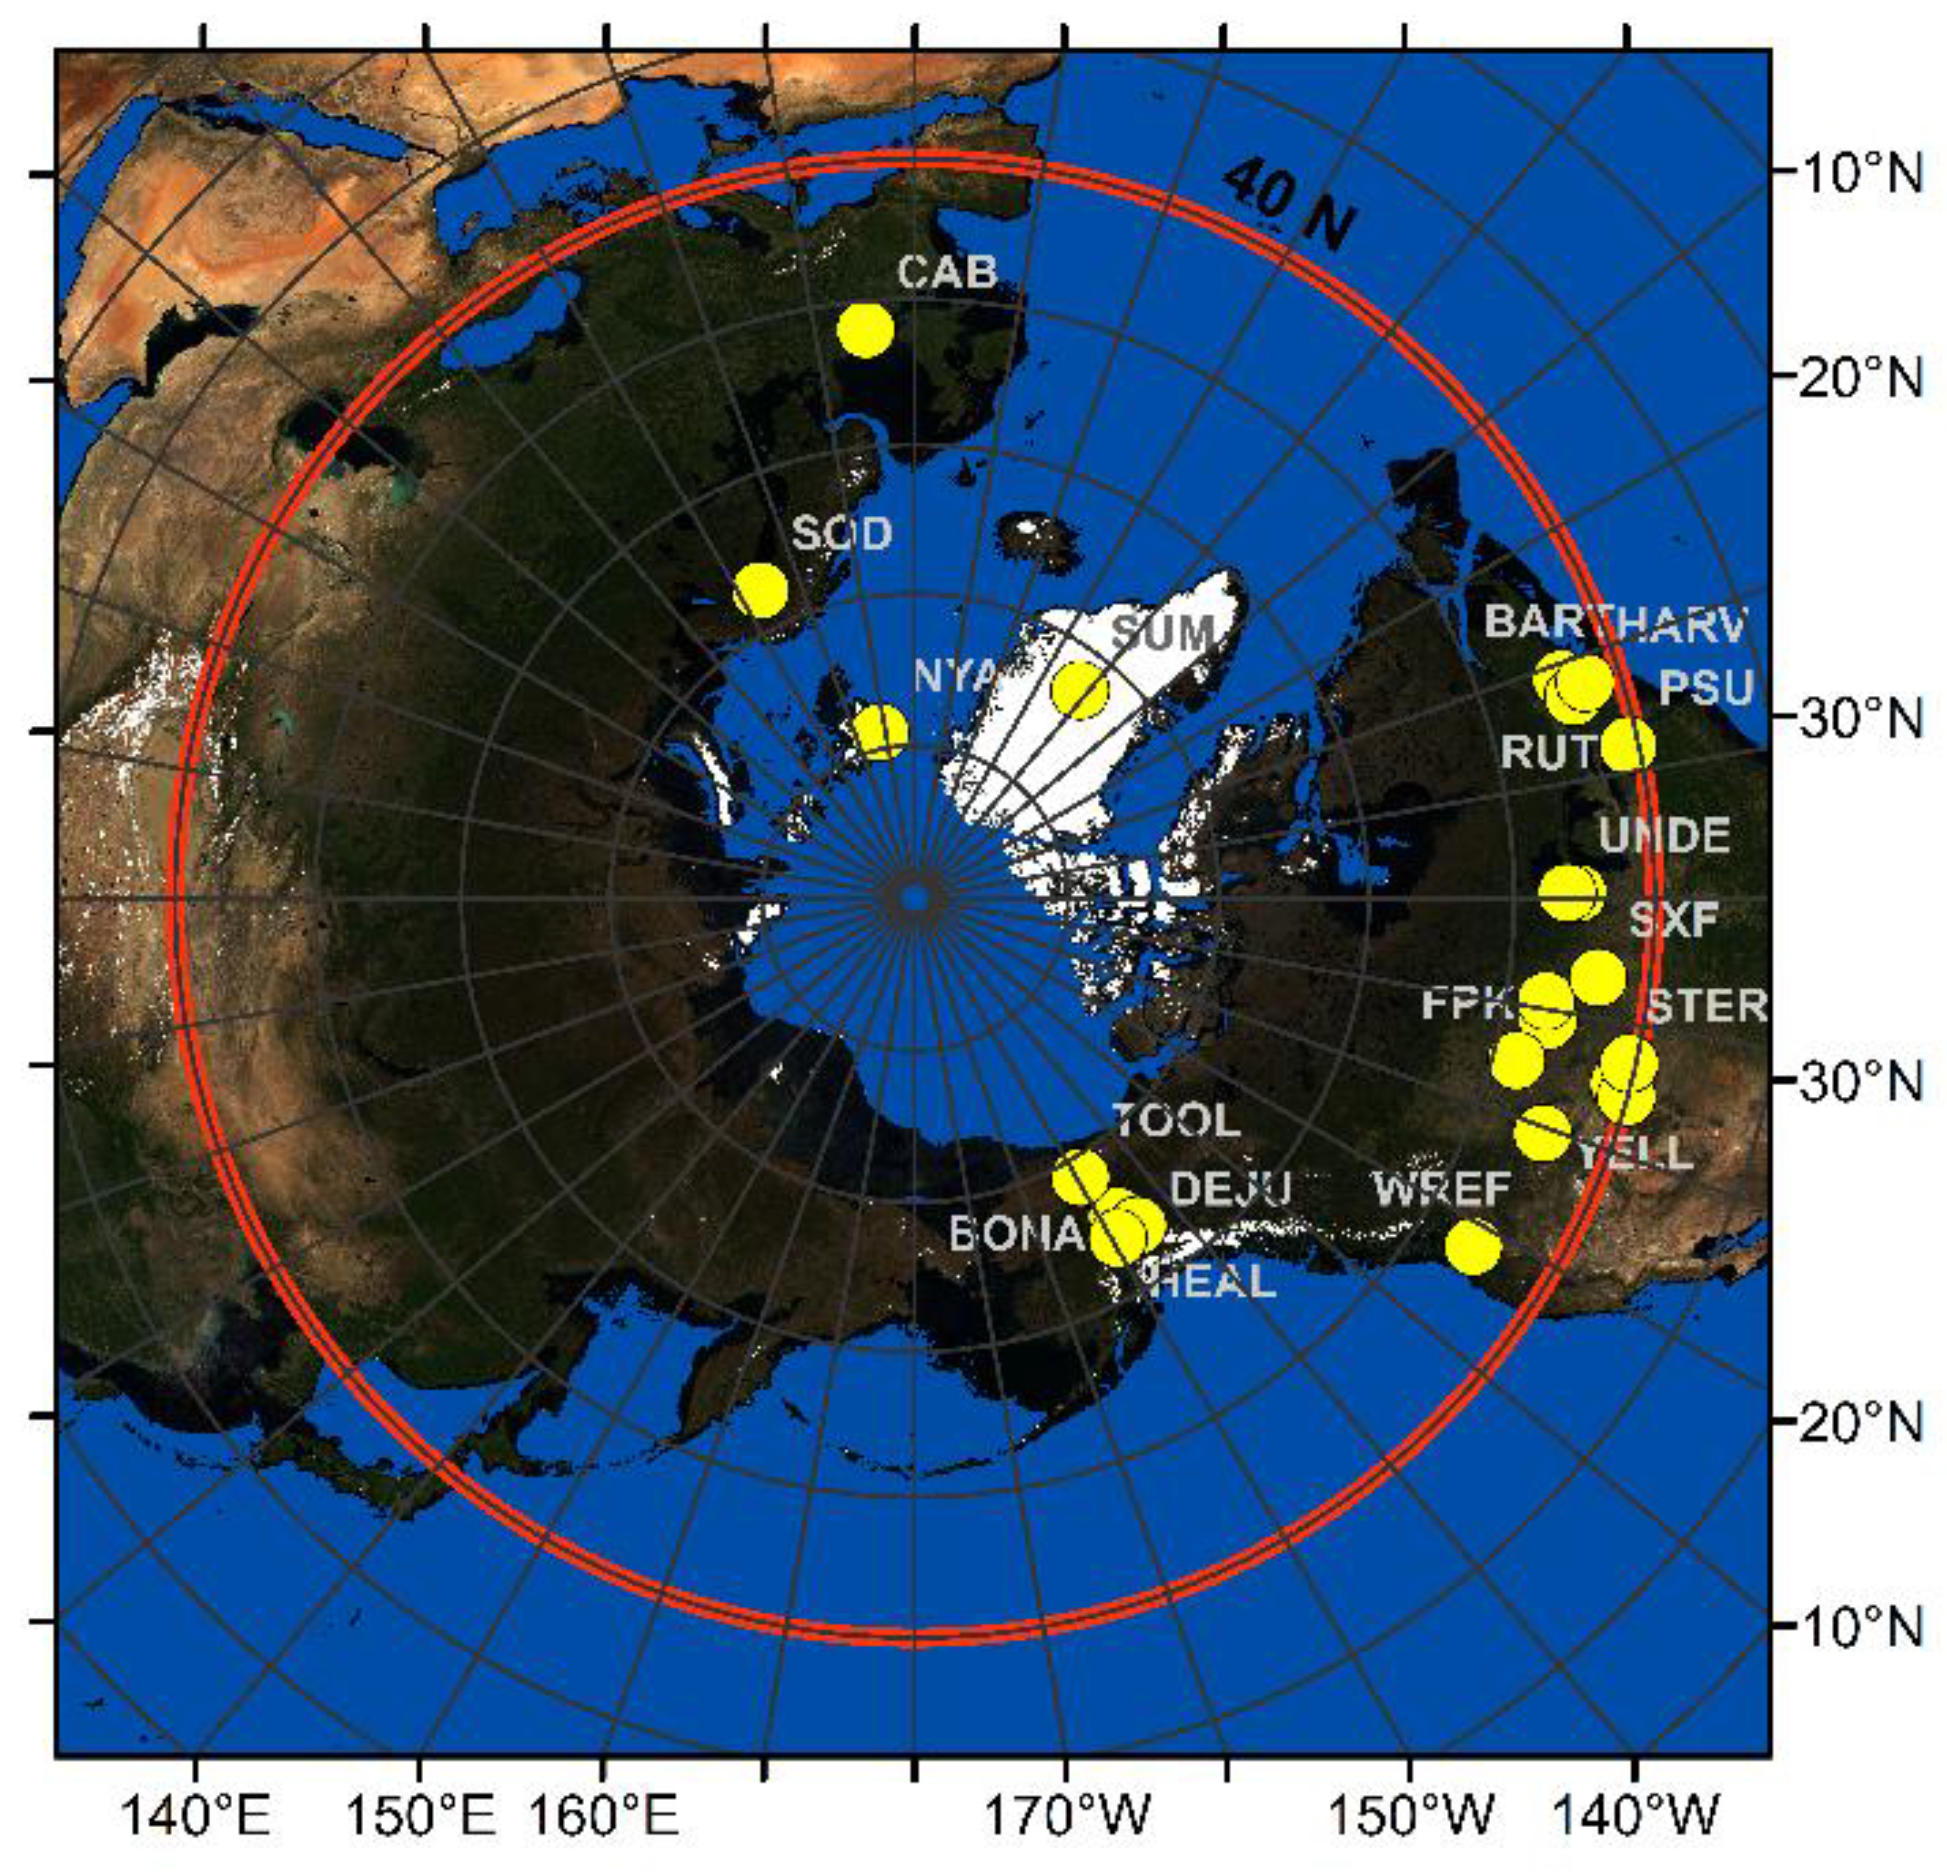
2.2. Ground-Based Tower Albedo

Validation of the circumpolar Landsat albedo product across the study domain was undertaken through the acquisition of ground tower data from various networks and collaborators as shown in Figure 1. A comprehensive list of the tower sites used in this validation effort can be found in Table 1. These sites cover a broad latitudinal range and a diversity of terrestrial biomes to serve as a proxy of the circumpolar region.
In the United States, a great number of the validation sites are part of the National Ecological Observation Network (NEON) operated by Batelle and funded through the National Science Foundation [48,49,50]. For this work terrestrial NEON sites located north of 40 degrees in latitude were selected and all available data from 2015 to 2018 were considered. The NEON towers record incoming shortwave, outgoing shortwave, incoming longwave, and outgoing longwave radiation by a 4-component sensor located at the top of the tower infrastructure using a Hukseflux NR01 Net Radiometer. The data are published as one- and thirty-minute averages of 1 Hz observations. Shortwave tower albedo values were calculated as the average of the ratio of outgoing shortwave to incoming shortwave radiation in a one-hour window around the Landsat acquisition time (typically between 10:00 AM and 11:00 AM local time). The data were screened for quality assurance according to the NEON parameters and only high-quality retrievals were considered [51].
In addition to the NEON tower locations, data from the BSRN and SURFRAD networks were also used in this validation effort. The Baseline Surface Radiation Network (BSRN) is an international effort coordinated by the Data and Assessments Panel from the Global Energy and Water Cycle Experiment (GEWEX) under the World Climate Research Programme (WCRP) [52]. The United States supports the BSRN initiative through the maintenance and publication of the NOAA’s Surface Radiation Budget Network (SURFRAD). As in the NEON data, the ratio of outgoing shortwave to incoming shortwave radiation during a one-hour window around the Landsat acquisition time is used to represent albedo at the time of Landsat acquisition. To expand the biomes covered in this validation effort, tower data from the Greenland Summit Research Station 2015 and 2017 was used. This tower has been established and maintained by the Earth System Research Laboratories (ESRL), a research branch of the National Oceanic and Atmospheric Administration (NOAA). The ESRL tower measured shortwave upwelling and downwelling radiation and is reported at hourly time steps. Lastly, data from the Sodankylä boreal forest site operated by the Finish Meteorological Institute from 2015–2019 were QA screened and used for valuation efforts [53].
When comparing satellite products with single tower measurements it is crucial to consider the spatial representativeness of the tower measurement. Tower measurements depend on the height of the tower and a spatial representativeness analysis is required to determine just how much of the surrounding landscape conforms to the area in the tower albedo footprint. The albedometers in this validation effort were assumed to have nominal directional errors of 10% and a half field of view (FOV) ~81°. As such, the instrument footprints (g) were calculated with the mounted height (h) of the downwelling radiometer such that:
g   = 2 h   tan ( FOV ° )
The representativeness at each tower site was assessed at 500 m, 1 km and 2 km and representativeness was ranked by season and conditions [47] Site representativeness was assessed using geostatistical attributes which describe the landscape variability. Specifically, the sill values presented in Table 1, are measured as the value where the variogram function flattens at increasing distance. The sill represents the maximum spatial variation in the subset surrounding the tower and is used as an indicator of heterogeneity, spatial extent, and strength of the spatial correlation within the satellite subsets. This assessment is often used for identification of suitable MODIS and VIIRS validations sites [54]. Evaluation of Landsat albedo products generally do not have to conform to this representativeness requirement, as in most cases, several Landsat pixels lie within the tower footprint. However, we note that the MODIS derived BRDFs are not specifically spatially linked to the tower pixels as they are paired with Landsat surface reflectances based on the classification algorithm. However, the assessment can be used as a metric for the homogeneity of the surrounding landscape and has served as a benchmark for suitable MODIS and VIIRS validation efforts in the past. As such the assessment can provide additional information on the added capabilities of higher resolution albedo products to capture heterogeneous landscapes.

3. Results

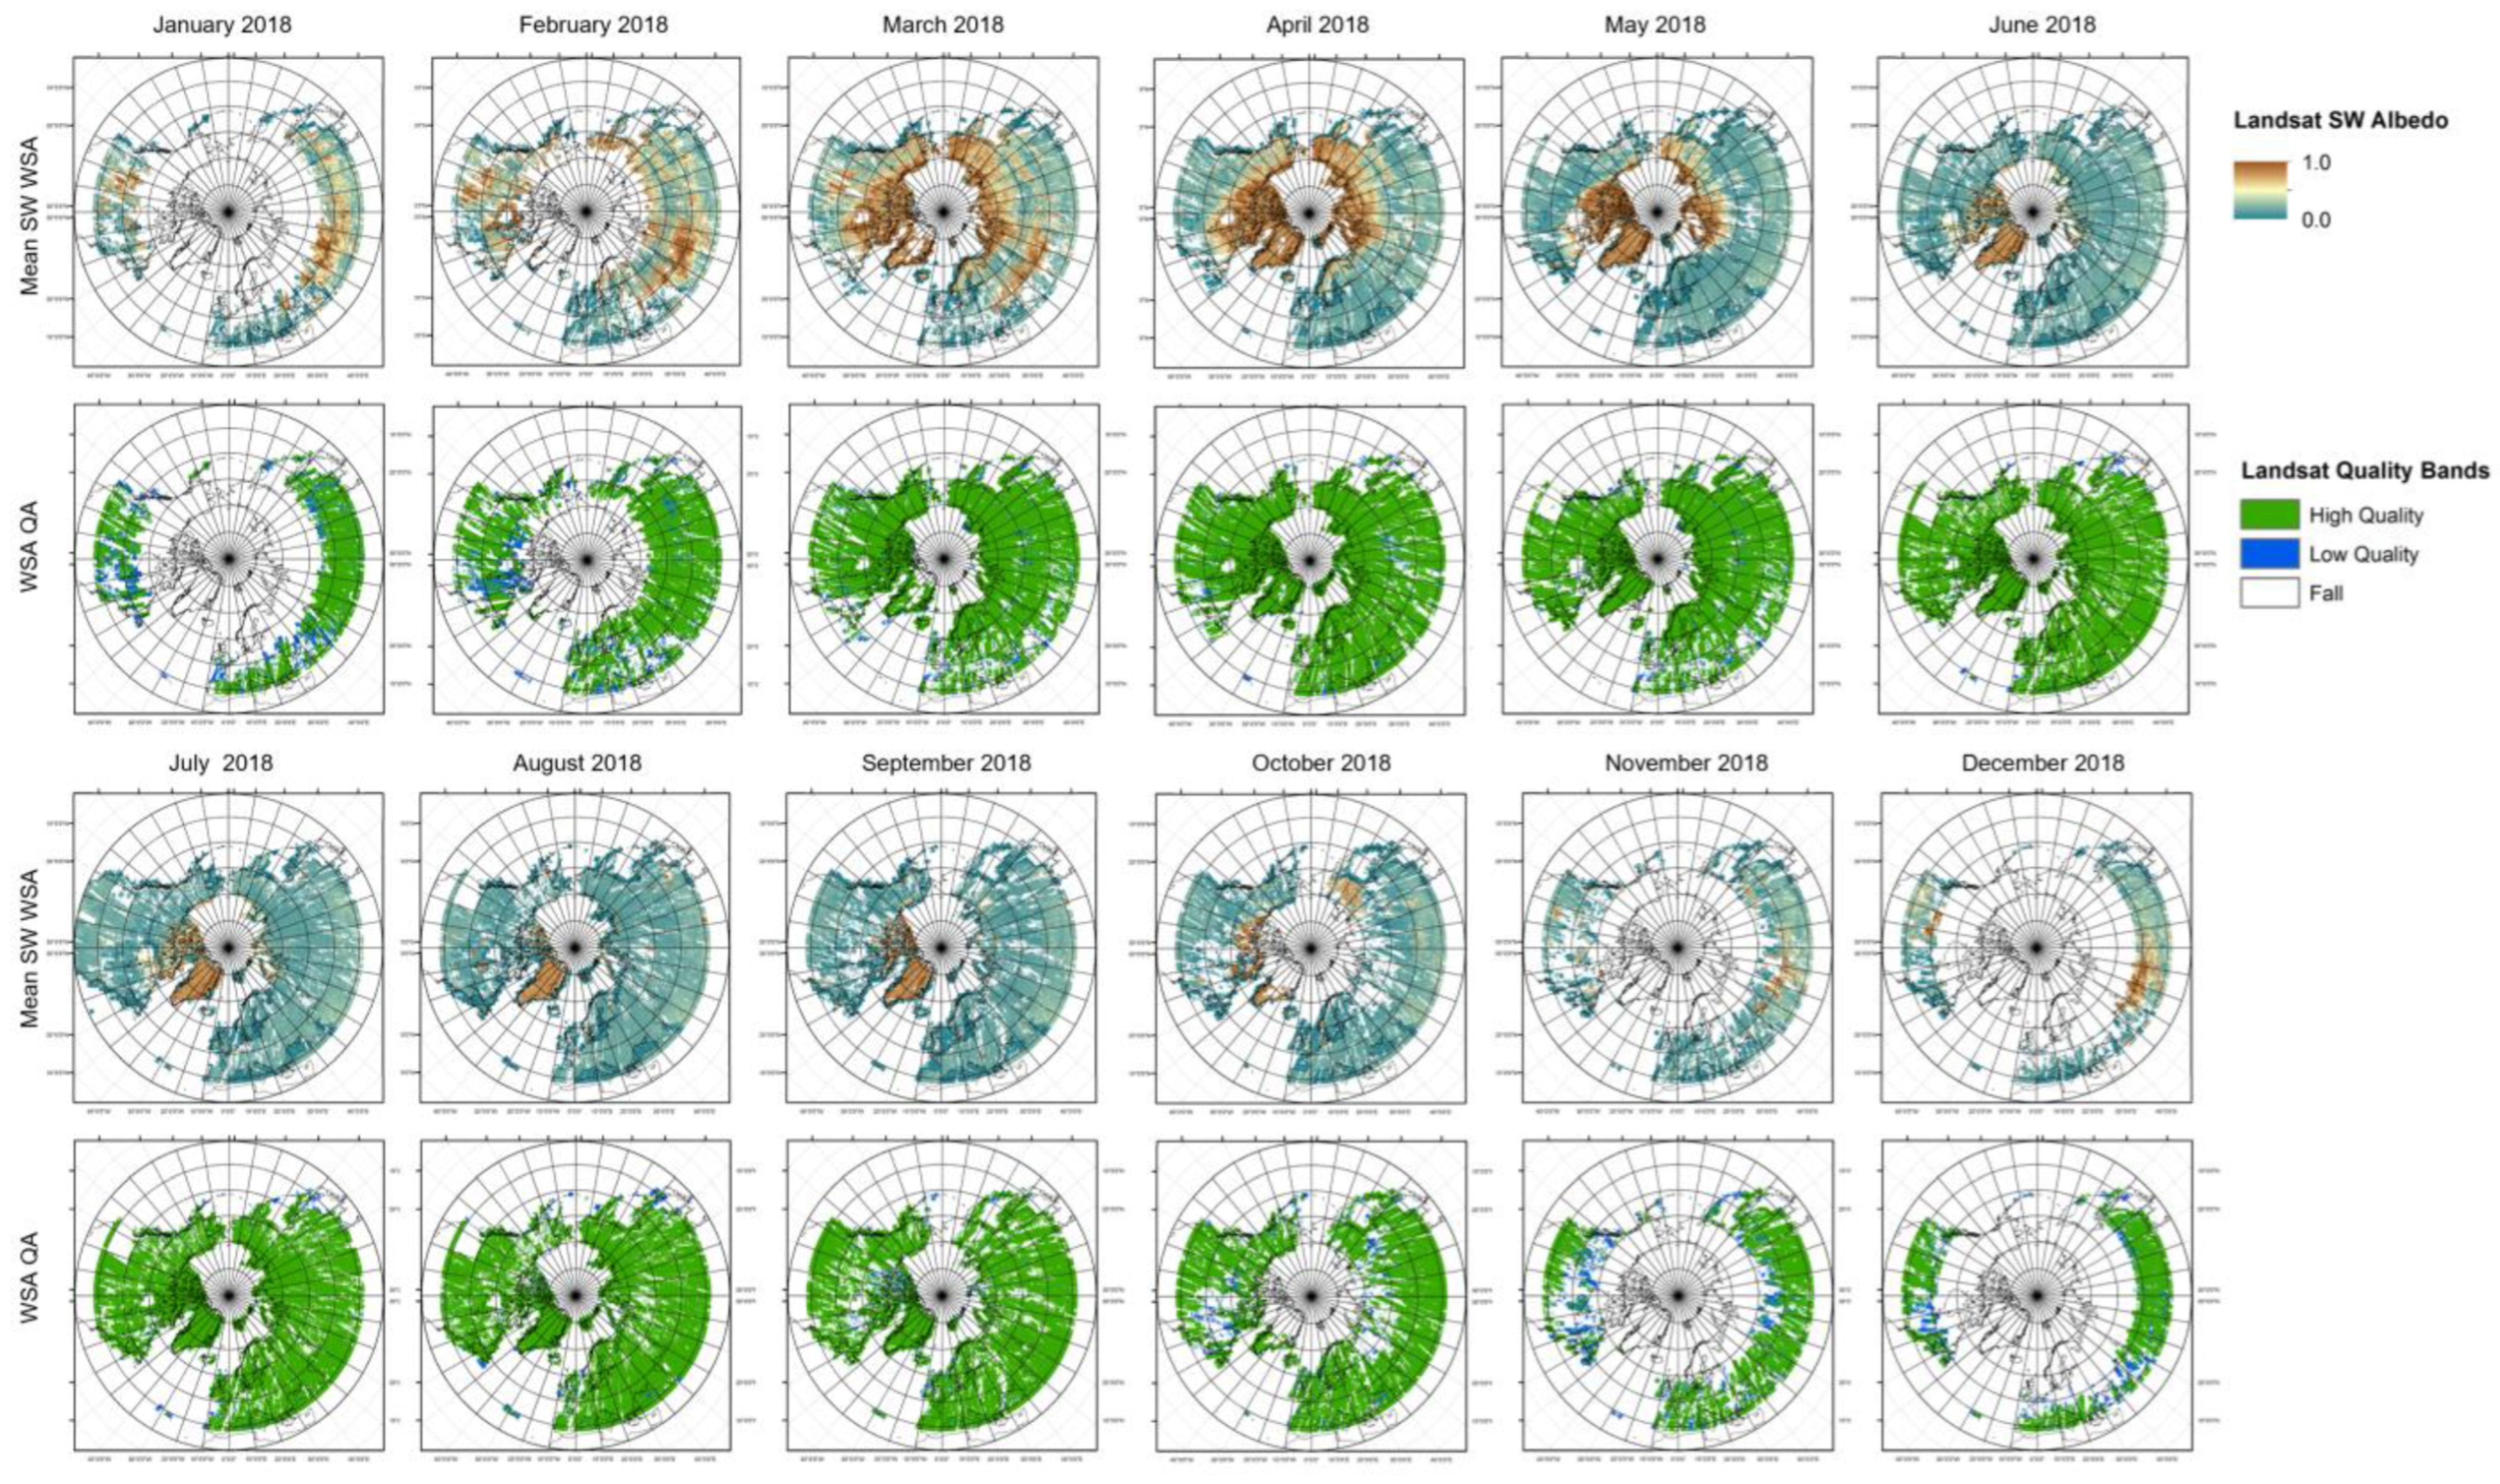
3.1. Overview of Landsat Circumpolar Albedo

The Landsat circumpolar albedo for 2018 is presented in Figure 2. The product provides comprehensive coverage across much of the domain with some data gaps resulting from solar angle limitations and the presence of clouds across the landscape. The albedo results are generally high-quality returns with the greatest data loss occurring in November through February due to polar night and insufficient illumination conditions. The data loss during this period is not typically critical for forcing applications, as solar insolation is low and the impact of albedo on the energy balance is minimal.

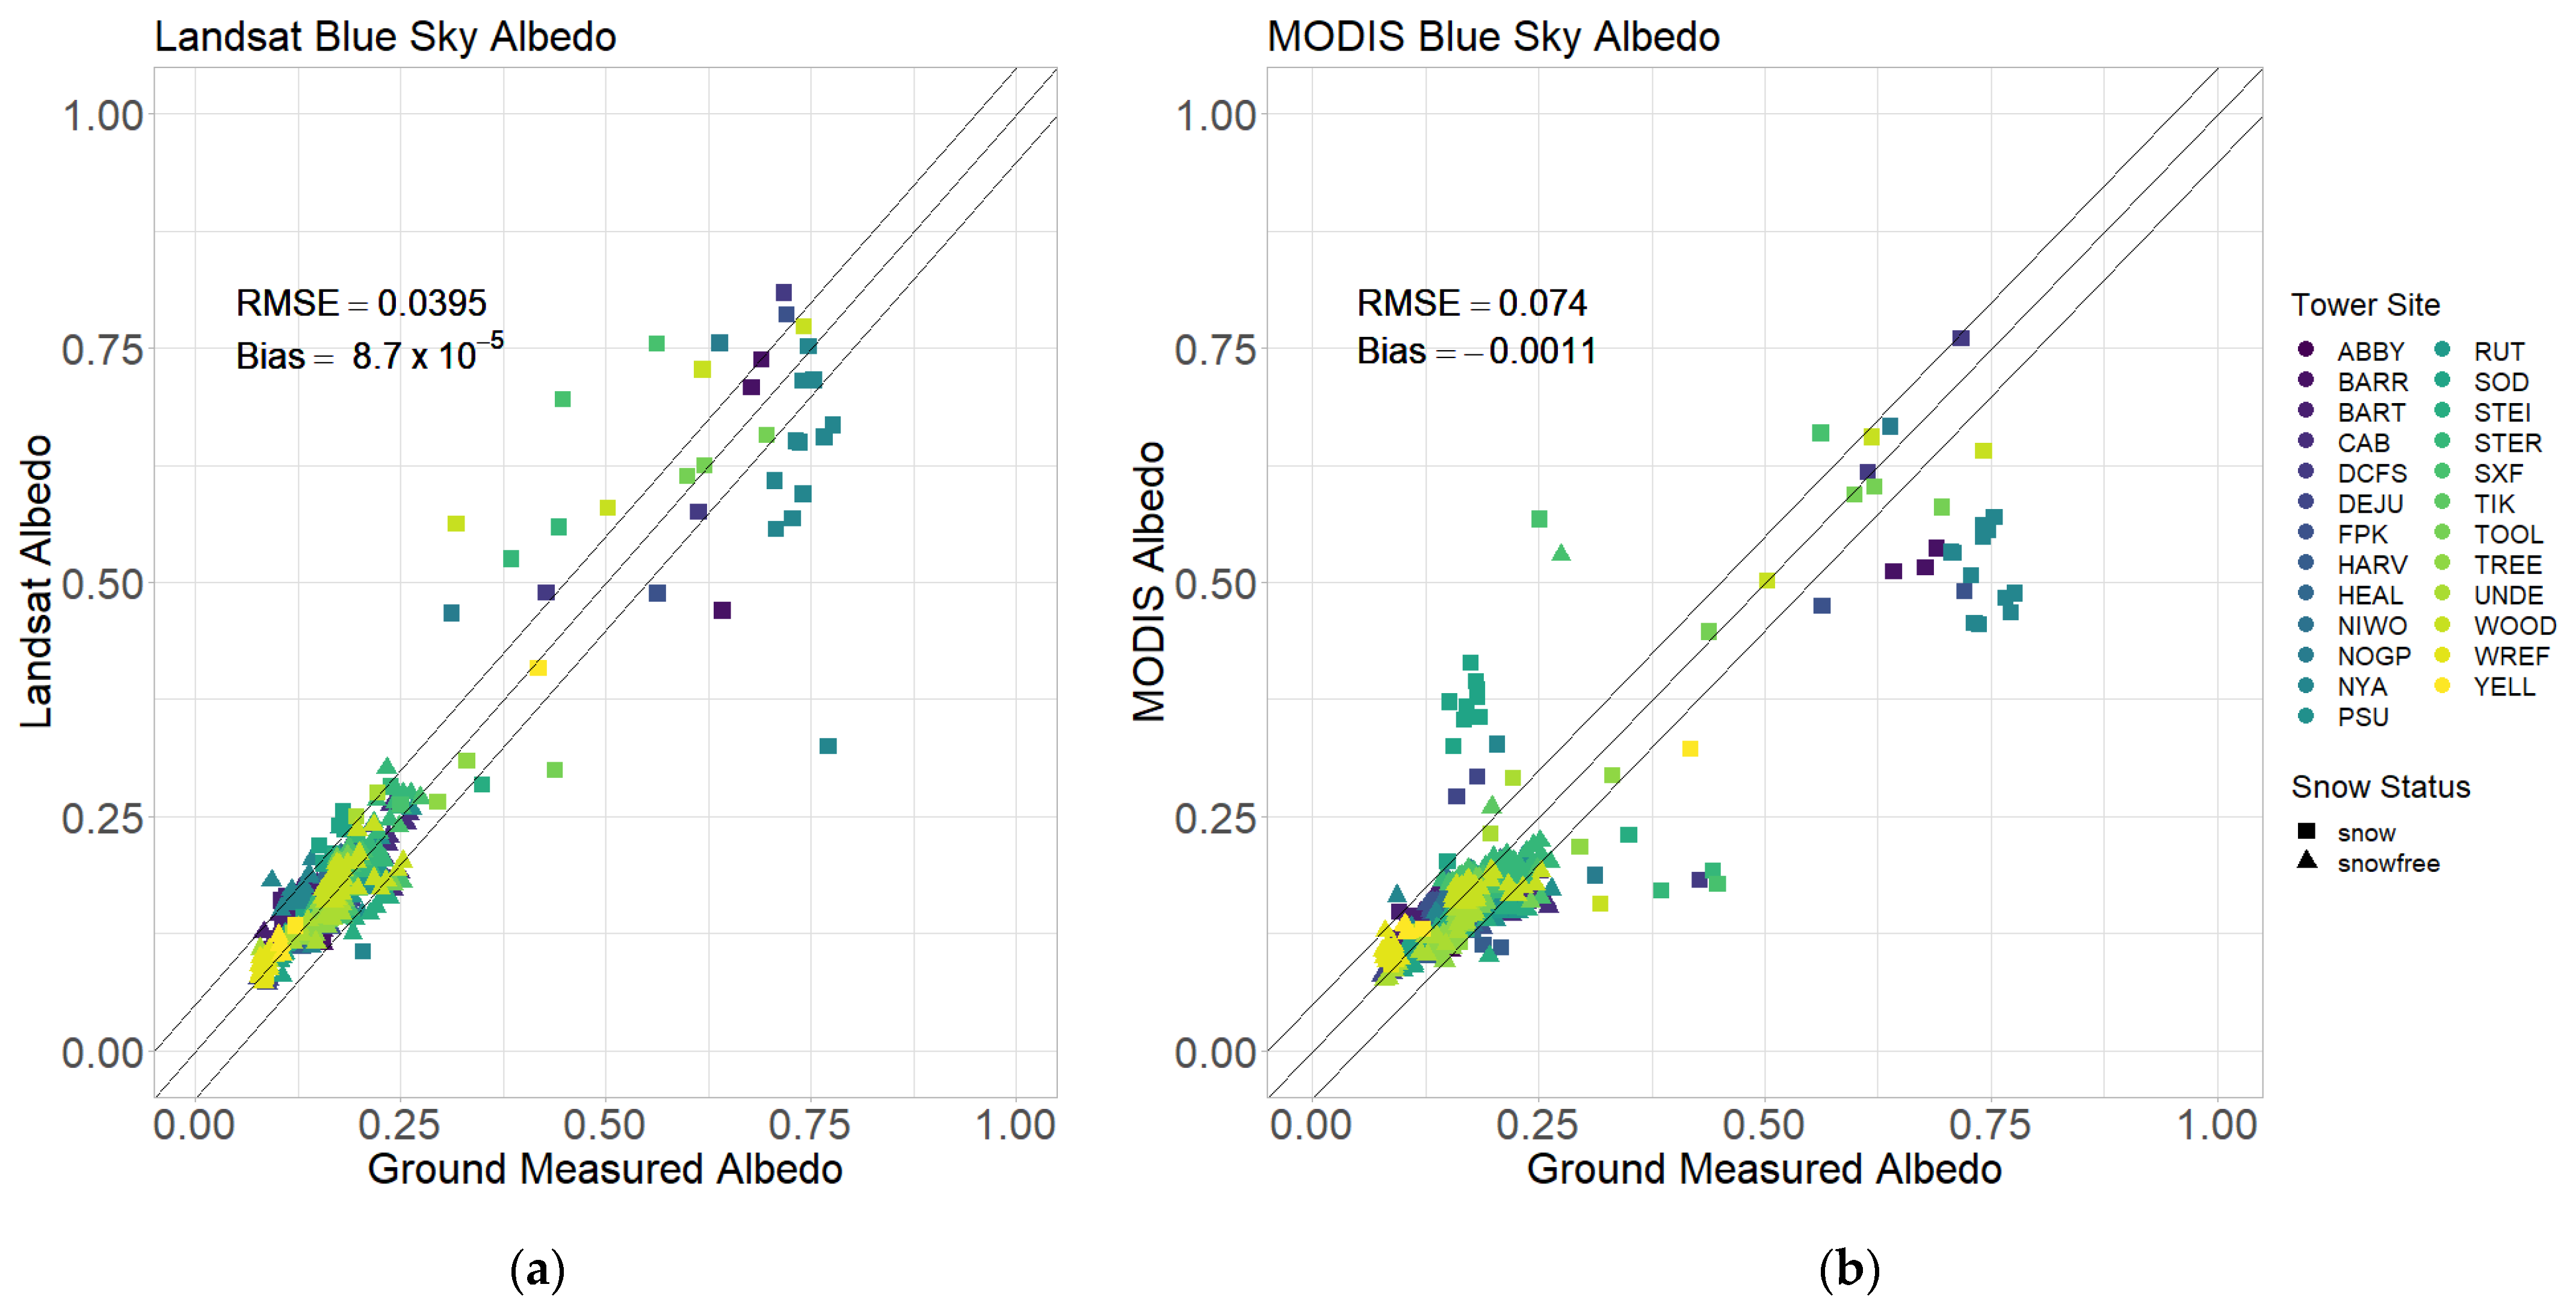
3.2. Accuracy of Circumpolar Full-Expression Blue-Sky Albedo

The full expression blue-sky albedo (BLUE_full(MODIS_AOD)) was compared to tower measurements at 26 sites as shown in Figure 3. All sites were north of 40° in latitude and represented a diversity of land cover and conditions as specified in Table 1. The suitability of the validation data was refined to include only tower footprints in which greater than 70% of the Landsat pixels were valid, high-quality returns. The validation data were initially cloud screened using the Fmask algorithm and then visually inspected for misidentified clouds and cloud shadow. For the operational blue-sky albedo algorithm, the RMSE and bias to 0.0475 and −0.00026, respectively, within 0.05 required by climate modelers [55] with a sample size of 661. The results are shown in Figure 3b with the scatter shown along the 1:1 and +/−0.05 validation threshold indicated by the black lines. The dependence of solar zenith angle of the blue-sky albedo results was also investigated, as Wang et al. [56] have shown that MODIS albedo values are most accurate with solar zenith angles (SZA) less than 70°. As such, for the purpose of this comparison, SZA was restricted to less than 70°, in doing so the Landsat RMSE and bias improved slightly to 0.0395 and 8.67 × 10⁻⁵, respectively. The Landsat albedo product was also well able to capture ephemeral events when they occurred at the time of instrument overpass. Temporal plots for the tower data, MCD43A3 MODIS albedo, and blue-sky albedo derived from MODIS and AERONET AOD sources are shown at three tower sites are shown in Figure 4.
The tower sites were also analyzed for their representativeness at 2 km subsets surrounding the tower with the assessment results per site listed in indicated in Table 1. In the growing/snow-free season, 12 of the 22 sites with available snow-free imagery were classified as representative suggesting the landscape can be accurately captured by lower spatial resolution satellites such as MODIS and VIIRS. However, on the dates when snow was present, only 2 of 21 sites with available imagery were classified as representative, highlighting the importance of higher spatial resolution when attempting to capture and quantify changes in dynamic and complex systems. The same 661 site-dates for assessing Landsat albedo were compared with high quality MCD43A3v06 shortwave albedo. At these sites that are both spatially representative and non-representative for the spatial resolution of the MODIS sensors, the comparison reported an RMSE of 0.074 and bias of 0.011 of all sites (0.043/0.012 at spatially representative sites only). The smaller RMSE and biases of 30 m Landsat albedo at the sites including those spatially non-representatives for the MODIS sensors, support Landsat’s ability to accurately measure albedo values within heterogeneous landscapes.

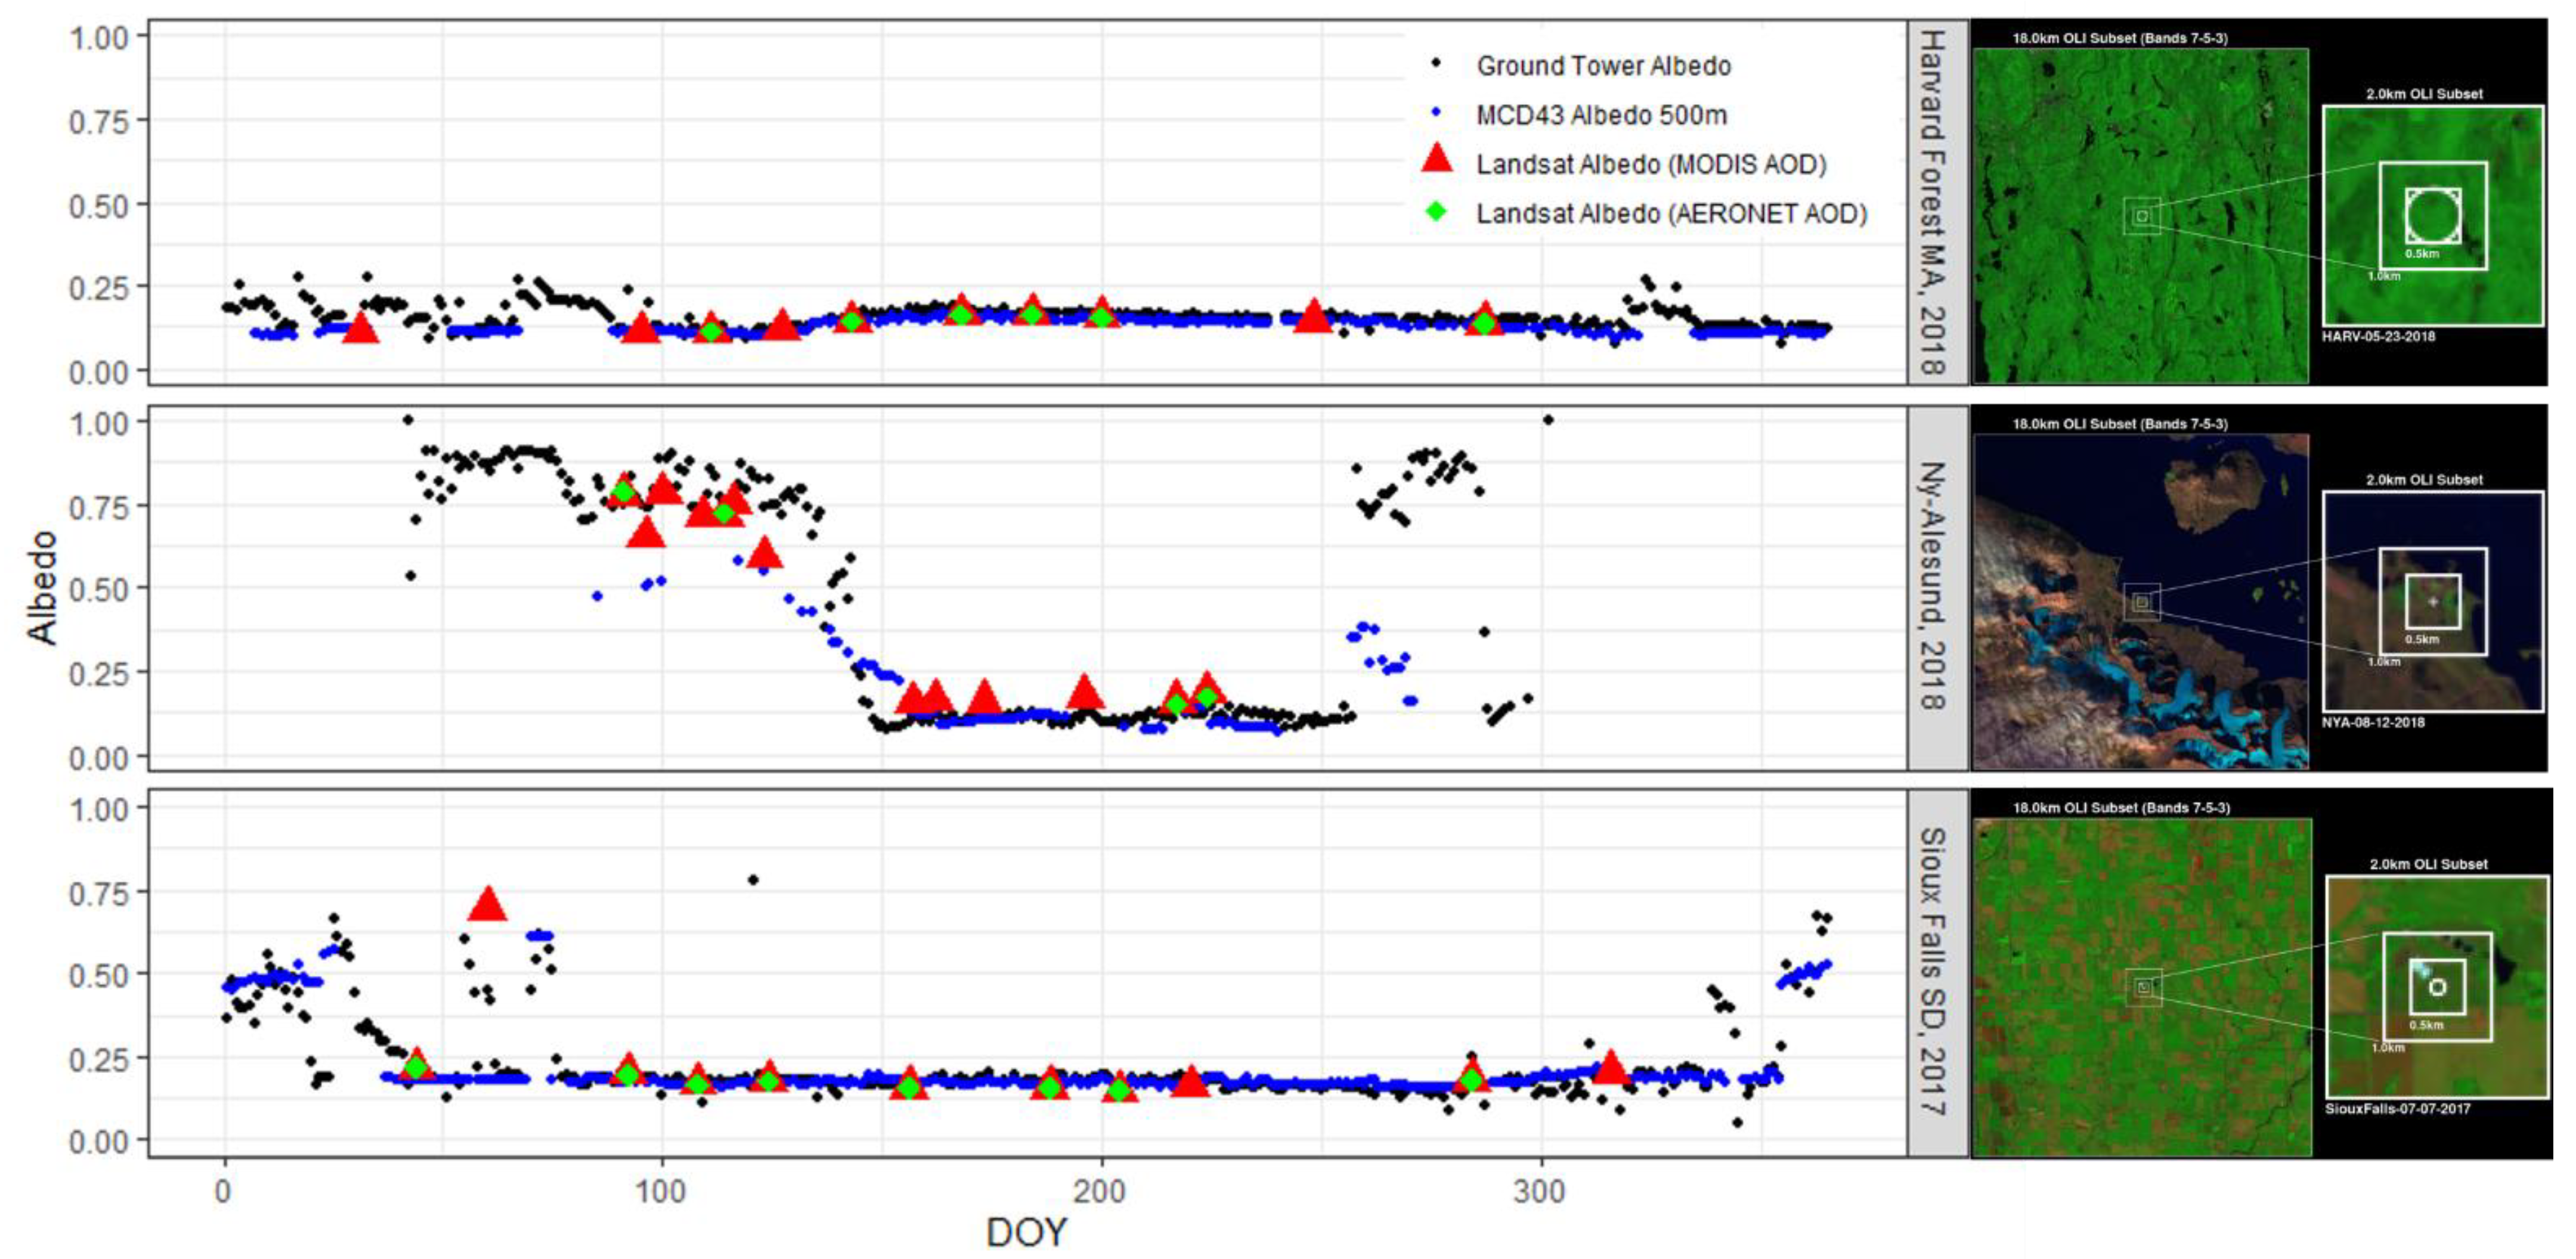
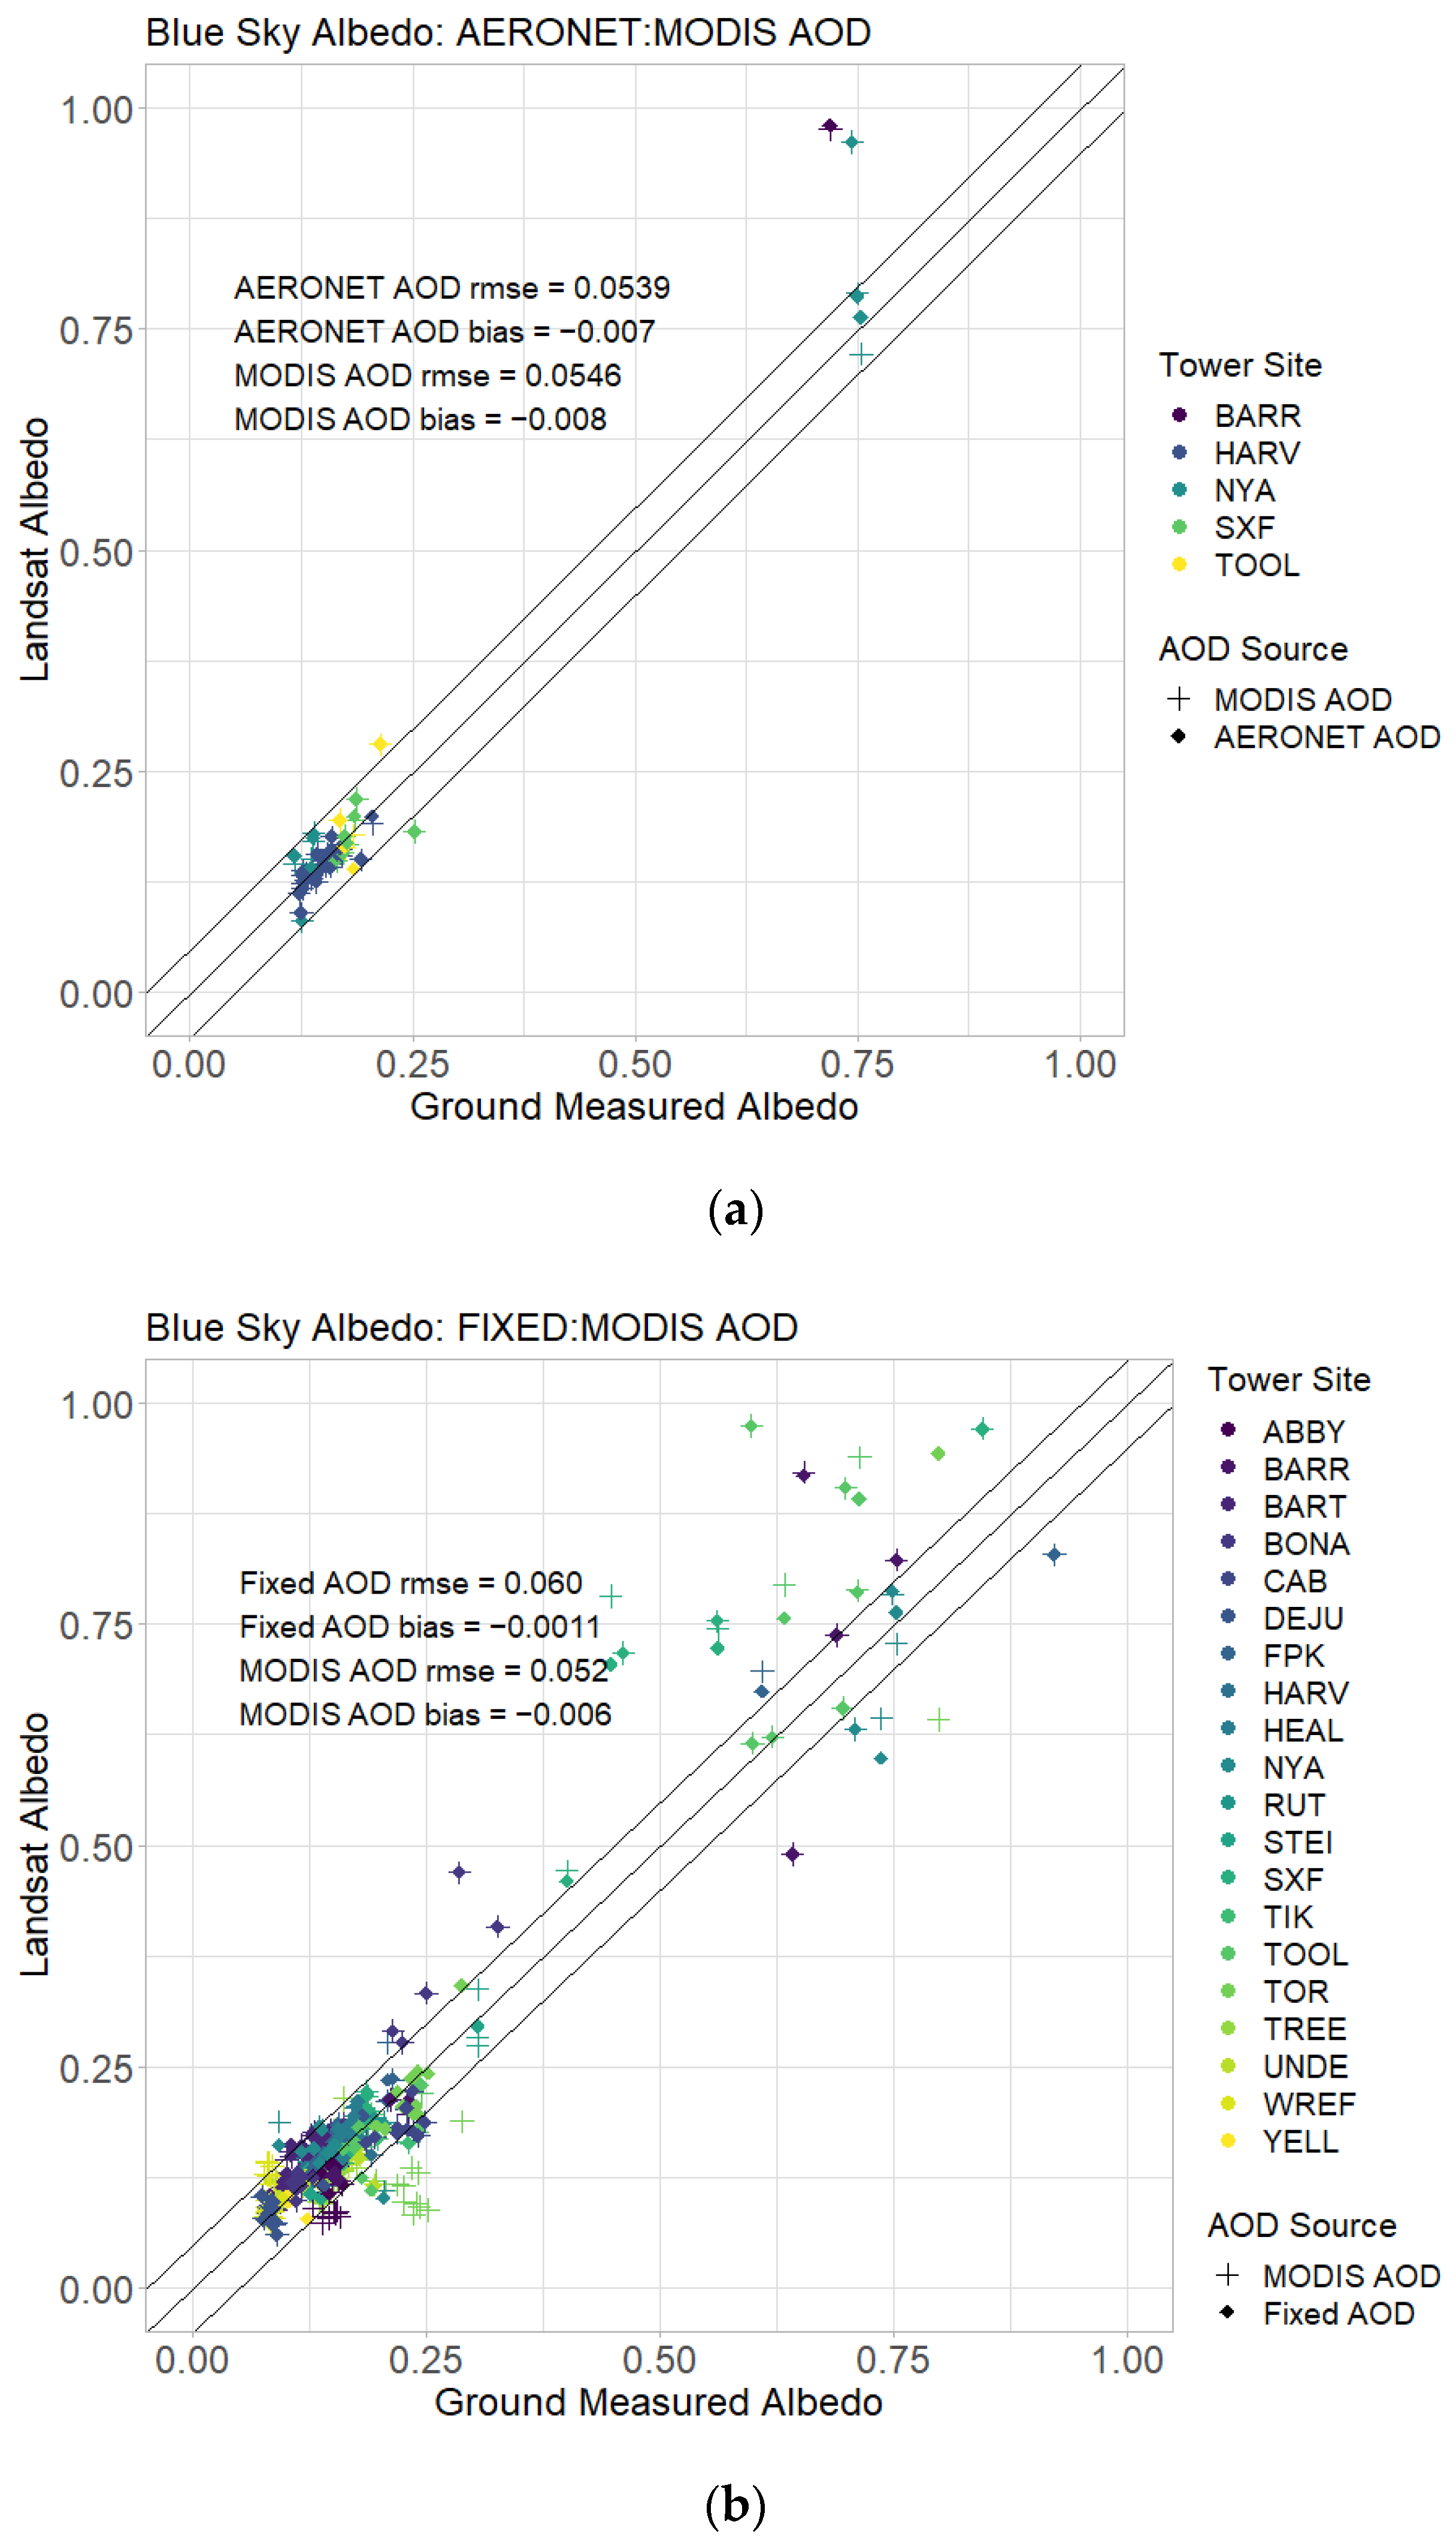
3.3. Effects of AOD Data Sources on Full-Expression Blue-Sky Albedo

Blue-sky albedo generated for comparison using three sources of Aerosol Opitcal Depth (AOD) information representing different levels of data precision and availability. AERONET aerosol optical depth is a coincident, real-time measure of atmospheric properties and provides the best indication of local aerosol conditions at the time of satellite overpass. Level-2 aerosol optical depth AERONET data coincident to Landsat overpass date and time were limited to 5 sites (BARR, HARV, NYA, SXF, and TOOL) in the study domain. The coarser resolution MODIS AOD from the Terra and Aqua Aerosol Cloud Water Vapor Products (MOD08v06 and MYD08v06) at daily, eight-day and monthly time steps served as a less precise, but more widely available and operational AOD source. Lastly, the fixed value was used as an estimate when no other AOD source was available.
The AERONET and MODIS AOD derived blue-sky albedos are compared in Figure 5a. A total of 32 valid data points were available for the analysis. The difference in blue-sky albedo derived from the in situ atmospheric datasets and MODIS AOD was minimal with RMSE and bias of 0.0539 and −0.007 from the AERONET derived AOD and 0.0546 and −0.008 from the MODIS derived AOD. This congruency in results between these methods suggests that the use of the coarser MODIS AOD dataset can serve as relevant and valuable proxy for AOD at a global and operational scale. A comparison with a fixed value AOD of 0.20 was also performed at 20 sites totaling 295 validation datapoints (Figure 5b). The use of a fixed AOD value indicated a slightly weaker fit with tower data with an RMSE of 0.060 and bias of −0.003 as compared to the MODIS AOD values which returned a RMSE of 0.052 and −0.006 bias (Figure 5b).

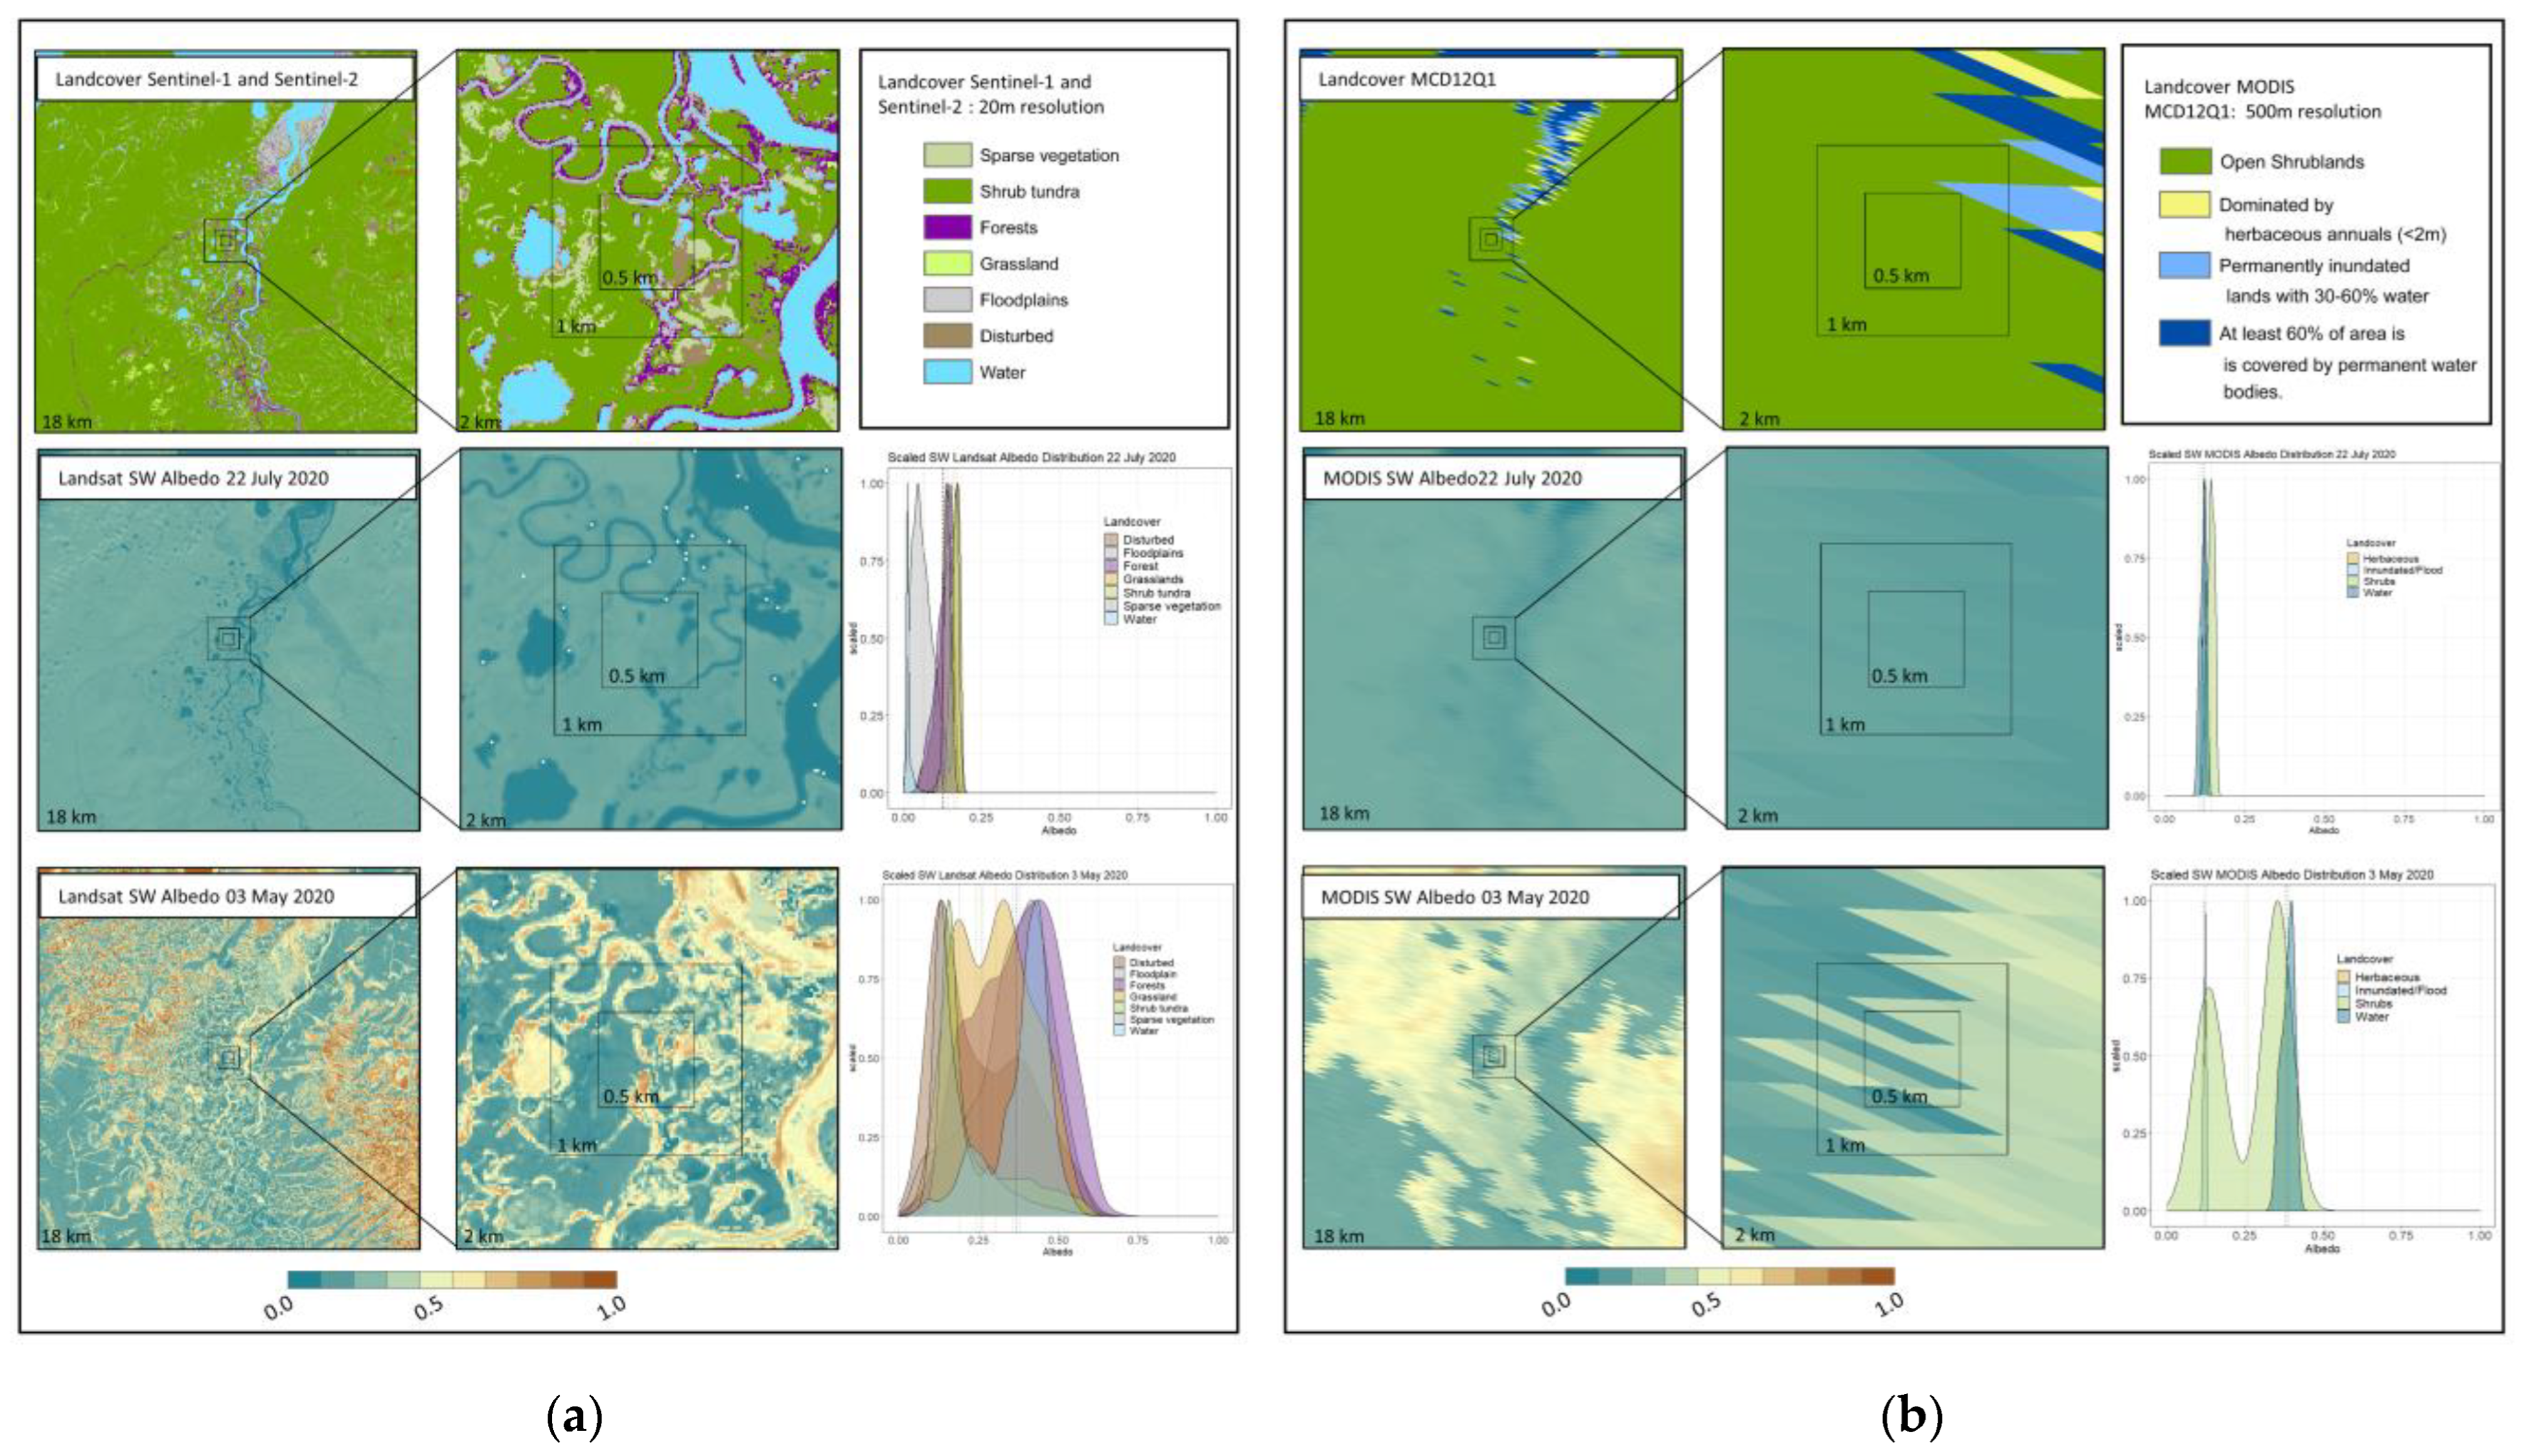
3.4. Spatial Details in Landsat Circumpolar Albedo

The ability to characterize local changes and determine their influence on the landscape scale has important implications for understanding the role of finer scale changes in the arctic and boreal domains. In Figure 6, for example we highlight a coastal section of the Seward Peninsula in western Alaska in mid-summer and early spring. The MODIS landcovers are pulled from the MCD12Q1 data product [57], and 30 m landcovers are resampled from Sentinel-1 and Sentinel-2 derived landcover maps over selected areas of Alaska, Canada, and Siberia [58]. However, detail captured in the Landsat imagery allows for the differentiation in the albedo values of both small-scale water bodies and vegetation classes not possible at the MODIS scale. As both shrubification and changing surface water are considered major drivers of albedo change across the tundra biomes [9,17,59,60] the better characterization of these albedo signature can help better understand and model the impact of shrub expansion and surface water change in the northern latitudes.

4. Discussion

The production of high-quality surface albedo products at higher spatial resolution allows for more nuanced understanding of broad landscape changes. The use of concurrent MODIS data for the BRDF attribution enables the capture of rapid and ephemeral changes in the landscape which can have large impacts on the overall albedo of a system. As surface albedo plays a critical role in the climatic, hydrological, biophysical, and biogeochemical processes through its regulation of surface energy budgets, the improved spatial and temporal resolution and quality of albedo products serves broad interests in advancing the understanding, monitoring, and modeling of these interrelated processes under fragmented land cover and land use changes in the circumpolar domain. The ability of this Landsat derived albedo product to capture land surface albedo more accurately in highly heterogeneous landscapes enables further investigation into the land-atmosphere interactions that drive surface warming in high latitude systems. The improved accuracy and specificity, especially in the presence of snow is especially applicable in the higher latitudes where changing land cover and land use have a significant impact on the accumulation and melt patterns of snow in vegetated areas. The expansion and increased stature of shrubs in the northern latitudes, for example, changes the energy partitioning as darker biomass protrudes above the snow lowering the overall albedo and helps snow accumulation as a shrub canopy can trap and shade snow under its canopy insulating the ground [59,61]. The unique characteristics of these landscapes, the rapidity at which they are changing and their role in global forcing dynamics means the effects of changes in snow cover and extent on albedo, surface energy budget and surface shortwave radiative forcing will likely become more pronounced. This Landsat albedo products and like products from Sentinel-2 [30] and Landsat-9 will be important in capturing and quantifying these changes.
One of the greatest advantages of this higher resolution albedo product is the ability to capture ephemeral (e.g., snow, fire, flooding) events at the landscape scale. The results presented here show that this albedo product performs well under a wide range of conditions and landscapes, however, most of the scatter on the validation data plots occurred when snow was present. Heterogeneously snowy conditions are difficult to capture due to the difference in the bright snow signal as compared to the darker vegetation signals. A good deal of data from the tower-sites presented here was not used as the surface reflectance values fell outside of the acceptable/valid range of 0 to 1. There is a continuing effort to optimize snow surface reflectance values and both data accuracy and data availability are likely to improve. The recent launch of Landsat-9, its improved radiometric resolution to 14-bit quantization [62], and the increase in imaging frequency, the high-quality data available in these regions will continue to enable a more comprehensive understanding of these systems [9,24,25,26]. The validation of an operational 30 m blue-sky albedo product allows accurate characterization of smaller-scale landscape drivers and potentially the earlier identification of landscape changes. The full expression blue-sky albedo product enables the quantification of landscape change on radiative forcing and the global energy balance as it represents the actual albedo given atmospheric conditions. The use of MODIS AOD, while reporting a slightly weaker correlation with tower data, than the AERONET AOD, was relatively stable in the blue-sky albedo production and provided reliable, global, daily, and coincident AOD information. The balance between spatial and temporal scale and geographic coverage was well achieved and the fixed value provided a reasonable estimation when no other data source was available. The availability of further development of higher resolution albedo products will be a valuable tool in the further examination of landscape trends in the higher latitudes.

5. Conclusions

The performance of the blue-sky albedo algorithm over heterogeneous landscapes and with coarser aerosol products shows that landscape changes can be well quantified by these efforts. We evaluated impact of three AOD sources on blue-sky albedo calculation using the full-expression approach that is necessitated by the vast snow cover in the circumpolar region. The operational blue-sky Landsat-8 albedo product produced using MODIS AOD data performed well with a RMSE of 0.0475 and a bias of −0.00026. The accuracy improved (RMSE of 0.0395 and mean bias of 8.67 × 10⁻⁵) when solar zenith angle was restricted to under 70°. The evaluation supports the feasibility of using MODIS AOD to produce operational full-expression blue-sky albedo products that will meet the increasing interests in studies of a snow-dominated but fast-changing Arctic-Boreal zone. While using local AOD information from AERONET produces slightly better accuracy in blue-sky albedo than using MODIS AOD, the much lower geographic coverage by the AERONET measurements than the MODIS AOD data warrants the use of MODIS AOD data rather than AERONET for the operational production of blue-sky albedo. Additionally, the results support the further expansion and development of these products to Sentinel-2 and other similar spatial-resolution sensors which would result in a suite of surface albedo products at further improved spatial and temporal resolutions.

Author Contributions

Conceptualization, A.M.E., Z.L., Z.W., Q.S., I.P. and C.S.; methodology, A.M.E., Z.L. and Q.S.; validation, A.M.E. and Z.L.; formal analysis, A.M.E.; investigation, A.M.E. and Z.L.; resources, C.S.; data curation, A.M.E.; writing—original draft preparation, A.M.E.; writing—review and editing, A.M.E., Z.L., Z.W., Q.S., I.P. and C.S.; visualization, A.M.E.; supervision, C.S.; project administration, C.S.; funding acquisition, C.S. All authors have read and agreed to the published version of the manuscript.

Funding

This research was funded by the following grants: USGS grant number 140G0118C0010 and 140G0118C005 for Landsat Science Team Support; NASA grant 80NSSC18K0642 for MODIS Science Team support; and NASA grant 80NCSSC18K0479 for Land Cover and Land Use Change Circumpolar Albedo support.

Data Availability Statement

The data will be archived and available in accordance with MDPI policies upon publication.

Acknowledgments

The authors would like to thank Terhikki Manninen and Aku Riihelä, Finnish Meteorological Institute, Helsinki, P.O. Box 503, 00101, Finland, for their support on providing in situ albedo data from the Sodankylä tower site. Additionally, we would like to thank the NOAA/ESRL/GML/GRAD, the GML-Radiation group for the radiation data from the Summit tower site.

Conflicts of Interest

The authors declare no conflict of interest.

References

  1. Dickinson, R.E. Land Surface Processes and Climate-Surface Albedos and Energy Balance. In Advances in Geophysics; Saltzman, B., Ed.; Elsevier: New York, NY, USA, 1983; Volume 25, pp. 305–353. ISBN 0065–2687. [Google Scholar]
  2. Betts, A.K.; Ball, J.H. Albedo over the Boreal Forest. J. Geophys. Res. Atmos. 1997, 102, 28901–28909. [Google Scholar] [CrossRef] [Green Version]
  3. Stephens, G.L.; O’Brien, D.; Webster, P.J.; Pilewski, P.; Kato, S.; Li, J.L. The Albedo of Earth. Rev. Geophys. 2015, 53, 141–163. [Google Scholar] [CrossRef] [Green Version]
  4. Post, E.; Alley, R.B.; Christensen, T.R.; Macias-Fauria, M.; Forbes, B.C.; Gooseff, M.N.; Iler, A.; Kerby, J.T.; Laidre, K.L.; Mann, M.E.; et al. The Polar Regions in a 2 °C Warmer World. Sci. Adv. 2019, 5, eaaw9883. [Google Scholar] [CrossRef] [PubMed] [Green Version]
  5. Zhang, R.; Wang, H.; Fu, Q.; Rasch, P.J.; Wang, X. Unraveling Driving Forces Explaining Significant Reduction in Satellite-Inferred Arctic Surface Albedo since the 1980s. Proc. Natl. Acad. Sci. USA 2019, 116, 23947–23953. [Google Scholar] [CrossRef] [PubMed] [Green Version]
  6. Mudryk, L.E.; Chereque, A.; Brown, R.; Derksen, C.; Luojus, K.; Decharme, B. Arctic Report Card 2020: Terrestrial Snow Cover; Thoman, R.L., Richter-Menge, J., Druckenmiller, M.L., Eds.; 2020; pp. 28–34. Available online: https://repository.library.noaa.gov/view/noaa/27902 (accessed on 1 September 2022).
  7. Stroeve, J.C.; Serreze, M.C.; Holland, M.M.; Kay, J.E.; Malanik, J.; Barrett, A.P. The Arctic’s Rapidly Shrinking Sea Ice Cover: A Research Synthesis. Clim. Change 2012, 110, 1005–1027. [Google Scholar] [CrossRef] [Green Version]
  8. Perovich, D.; Meier, W.; Tschudi, M.; Hendricks, S.; Petty, A.A.; Divine, D.; Farrell, S.; Gerland, S.; Haas, C.; Kaleschke, L.; et al. Arctic Report Card 2020: Sea Ice; Thoman, R.L., Richter-Menge, J., Druckenmiller, M.L., Eds.; 2020; pp. 44–53. Available online: https://repository.library.noaa.gov/view/noaa/27904 (accessed on 1 September 2022).
  9. Webb, E.E.; Loranty, M.M.; Lichstein, J.W. Surface Water, Vegetation, and Fire as Drivers of the Terrestrial Arctic-Boreal Albedo Feedback. Environ. Res. Lett. 2021, 16, 084046. [Google Scholar] [CrossRef]
  10. Stow, D.A.; Hope, A.; McGuire, D.; Verbyla, D.; Gamon, J.; Huemmrich, F.; Houston, S.; Racine, C.; Sturm, M.; Tape, K.; et al. Remote Sensing of Vegetation and Land-Cover Change in Arctic Tundra Ecosystems. Remote Sens. Environ. 2004, 89, 281–308. [Google Scholar] [CrossRef] [Green Version]
  11. Peng, S.; Piao, S.; Ciais, P.; Friedlingstein, P.; Zhou, L.; Wang, T. Change in Snow Phenology and Its Potential Feedback to Temperature in the Northern Hemisphere over the Last Three Decades. Environ. Res. Lett. 2013, 8, 014008. [Google Scholar] [CrossRef] [Green Version]
  12. Park, H.; Yabuki, H.; Ohata, T. Analysis of Satellite and Model Datasets for Variability and Trends in Arctic Snow Extent and Depth, 1948–2006. Polar. Sci. 2012, 6, 23–37. [Google Scholar] [CrossRef] [Green Version]
  13. Beringer, J.; Chapin III, F.S.; Thompson, C.C.; McGuire, A.D. Surface Energy Exchanges along a Tundra-Forest Transition and Feedbacks to Climate. Agric. For. Meteorol. 2005, 131, 143–161. [Google Scholar] [CrossRef]
  14. Pearson, R.G.; Phillips, S.J.; Loranty, M.M.; Beck, P.S.A.; Damoulas, T.; Knight, S.J.; Goetz, S.J. Shifts in Arctic Vegetation and Associated Feedbacks under Climate Change. Nat. Clim. Chang. 2013, 3, 673–677. [Google Scholar] [CrossRef]
  15. Sturm, M.; Racine, C.; Tape, K. Climate Change: Increasing Shrub Abundance in the Arctic. Nature 2001, 411, 546–547. [Google Scholar] [CrossRef] [PubMed]
  16. Tape, K.; Sturm, M.; Racine, C. The Evidence for Shrub Expansion in Northern Alaska and the Pan-Arctic. Glob. Chang. Biol. 2006, 12, 686–702. [Google Scholar] [CrossRef]
  17. Myers-Smith, I.H.; Forbes, B.C.; Wilmking, M.; Hallinger, M.; Lantz, T.; Blok, D.; Tape, K.D.; Macias-Fauria, M.; Sass-Klaassen, U.; Lévesque, E.; et al. Shrub Expansion in Tundra Ecosystems: Dynamics, Impacts and Research Priorities. Environ. Res. Lett. 2011, 6, 045509. [Google Scholar] [CrossRef] [Green Version]
  18. Ju, J.; Masek, J.G. The Vegetation Greenness Trend in Canada and US Alaska from 1984–2012 Landsat Data. Remote. Sens. Environ. 2016, 176, 1–16. [Google Scholar] [CrossRef]
  19. Bi, J.; Xu, L.; Samanta, A.; Zhu, Z.; Myneni, R. Divergent Arctic-Boreal Vegetation Changes between North America and Eurasia over the Past 30 Years. Remote Sens. 2013, 5, 2093–2112. [Google Scholar] [CrossRef] [Green Version]
  20. Zhu, Z.; Piao, S.; Myneni, R.B.; Huang, M.; Zeng, Z.; Canadell, J.G.; Ciais, P.; Sitch, S.; Friedlingstein, P.; Arneth, A.; et al. Greening of the Earth and Its Drivers. Nat. Clim. Chang. 2016, 6, 791–795. [Google Scholar] [CrossRef]
  21. Berner, L.T.; Massey, R.; Jantz, P.; Forbes, B.C.; Macias-Fauria, M.; Myers-Smith, I.; Kumpula, T.; Gauthier, G.; Andreu-Hayles, L.; Gaglioti, B.v.; et al. Summer Warming Explains Widespread but Not Uniform Greening in the Arctic Tundra Biome. Nat. Commun. 2020, 11, 1–12. [Google Scholar] [CrossRef] [PubMed]
  22. Burakowski, E.A.; Ollinger, S.V.; Lepine, L.; Schaaf, C.B.; Wang, Z.; Dibb, J.E.; Hollinger, D.Y.; Kim, J.H.; Erb, A.; Martin, M. Spatial Scaling of Reflectance and Surface Albedo over a Mixed-Use, Temperate Forest Landscape during Snow-Covered Periods. Remote Sens. Environ. 2015, 158, 465–477. [Google Scholar] [CrossRef]
  23. Kuusinen, N.; Kolari, P.; Levula, J.; Porcar-Castell, A.; Stenberg, P.; Berninger, F. Seasonal Variation in Boreal Pine Forest Albedo and Effects of Canopy Snow on Forest Reflectance. Agric. For. Meteorol. 2012, 164, 53–60. [Google Scholar] [CrossRef]
  24. Smith, L.C.; Sheng, Y.; MacDonald, G.M.; Hinzman, L.D. Atmospheric Science: Disappearing Arctic Lakes. Science 2005, 308, 1429. [Google Scholar] [CrossRef] [Green Version]
  25. Carroll, M.L.; Townshend, J.R.G.; Dimiceli, C.M.; Loboda, T.; Sohlberg, R.A. Shrinking Lakes of the Arctic: Spatial Relationships and Trajectory of Change. Geophys. Res. Lett. 2011, 38, L20406. [Google Scholar] [CrossRef] [Green Version]
  26. Juszak, I.; Iturrate-Garcia, M.; Gastellu-Etchegorry, J.P.; Schaepman, M.E.; Maximov, T.C.; Schaepman-Strub, G. Drivers of Shortwave Radiation Fluxes in Arctic Tundra across Scales. Remote Sens. Environ. 2017, 193, 86–102. [Google Scholar] [CrossRef] [Green Version]
  27. Wulder, M.A.; Loveland, T.R.; Roy, D.P.; Crawford, C.J.; Masek, J.G.; Woodcock, C.E.; Allen, R.G.; Anderson, M.C.; Belward, A.S.; Cohen, W.B.; et al. Current Status of Landsat Program, Science, and Applications. Remote Sens. Environ. 2019, 225, 127–147. [Google Scholar] [CrossRef]
  28. Shuai, Y.; Masek, J.G.; Gao, F.; Schaaf, C.B. An Algorithm for the Retrieval of 30-m Snow-Free Albedo from Landsat Surface Reflectance and MODIS BRDF. Remote Sens. Environ. 2011, 115, 2204–2216. [Google Scholar] [CrossRef]
  29. Wang, Z.; Erb, A.M.; Schaaf, C.B.; Sun, Q.; Liu, Y.; Yang, Y.; Shuai, Y.; Casey, K.A.; Román, M.O. Early Spring Post-Fire Snow Albedo Dynamics in High Latitude Boreal Forests Using Landsat-8 OLI Data. Remote Sens. Environ. 2016, 185, 71–83. [Google Scholar] [CrossRef] [Green Version]
  30. Li, Z.; Erb, A.; Sun, Q.; Liu, Y.; Shuai, Y.; Wang, Z.; Boucher, P.; Schaaf, C. Preliminary Assessment of 20-m Surface Albedo Retrievals from Sentinel-2A Surface Reflectance and MODIS/VIIRS Surface Anisotropy Measures. Remote Sens. Environ. 2018, 217, 352–365. [Google Scholar] [CrossRef]
  31. Wang, Z.; Schaaf, C.B.; Sun, Q.; Kim, J.H.; Erb, A.M.; Gao, F.; Román, M.O.; Yang, Y.; Petroy, S.; Taylor, J.R.; et al. Monitoring Land Surface Albedo and Vegetation Dynamics Using High Spatial and Temporal Resolution Synthetic Time Series from Landsat and the MODIS BRDF/NBAR/Albedo Product. Int. J. Appl. Earth Obs. Geoinf. 2017, 59, 104–117. [Google Scholar] [CrossRef]
  32. Vermote, E.; Justice, C.; Claverie, M.; Franch, B. Preliminary Analysis of the Performance of the Landsat 8/OLI Land Surface Reflectance Product. Remote Sens Environ. 2016, 185, 46–56. [Google Scholar] [CrossRef]
  33. Schaaf, C.B.; Gao, F.; Strahler, A.H.; Lucht, W.; Li, X.; Tsang, T.; Strugnell, N.C.; Zhang, X.; Jin, Y.; Muller, J.; et al. Schaaf et al 2002 First Operational BRDF, Albedo Nadir Reflectance Products from MODIS.Pdf. Remote Sens. Environ. 2002, 83, 135–148. [Google Scholar] [CrossRef]
  34. Wang, Z.; Schaaf, C.B.; Sun, Q.; Shuai, Y.; Román, M.O. Capturing Rapid Land Surface Dynamics with Collection V006 MODIS BRDF/NBAR/Albedo (MCD43) Products. Remote Sens. Environ. 2018, 207, 50–64. [Google Scholar] [CrossRef]
  35. Schaepman-Strub, G.; Schaepman, M.E.; Painter, T.H.; Dangel, S.; Martonchik, J.V. Reflectance Quantities in Optical Remote Sensing-Definitions and Case Studies. Remote Sens. Environ. 2006, 103, 27–42. [Google Scholar] [CrossRef]
  36. Lewis, P.; Barnsley, M. Influence of the Sky Radiance Distribution on Various Formulations of the Earth Surface Albedo. In Proceedings of the Conference on Physical Measurements and Signatures in Remote Sensing, Val d’Isere, France, 17–21 January 1994; pp. 707–715. [Google Scholar]
  37. Román, M.O.; Schaaf, C.B.; Lewis, P.; Gao, F.; Anderson, G.P.; Privette, J.L.; Strahler, A.H.; Woodcock, C.E.; Barnsley, M. Assessing the Coupling between Surface Albedo Derived from MODIS and the Fraction of Diffuse Skylight over Spatially-Characterized Landscapes. Remote Sens. Environ. 2010, 114, 738–760. [Google Scholar] [CrossRef]
  38. Lucht, W.; Schaaf, C.B.; Strahler, A.H. An Algorithm for the Retrieval of Albedo from Space Using Semiempirical BRDF Models. IEEE Trans. Geosci. Remote Sens. 2000, 38, 977–998. [Google Scholar] [CrossRef] [Green Version]
  39. Pinty, B.; Lavergne, T.; Dickinson, R.E.; Widlowski, J.L.; Gobron, N.; Verstraete, M.M. Simplifying the Interaction of Land Surfaces with Radiation for Relating Remote Sensing Products to Climate Models. J. Geophys. Res. Atmos. 2006, 111, 1–20. [Google Scholar] [CrossRef] [Green Version]
  40. Platnick, S.; King, M.D.; Meyer, K.G.; Wind, G.; Amarasinghe, N.; Marchant, B.; Arnold, G.T.; Zhang, Z.; Hubanks, P.A.; Ridgway, B. MODIS Atmosphere L3 Monthly Product; NASA MODIS Adaptive Processing System, Goddard Space Flight Center: Greenbelt, MD, USA, 2017. [Google Scholar] [CrossRef]
  41. Dubovik, O.; King, M.D. A Flexible Inversion Algorithm for Retrieval of Aerosol Optical Properties from Sun and Sky Radiance Measurements. J. Geophys. Res. Atmos. 2000, 105, 20673–20696. [Google Scholar] [CrossRef] [Green Version]
  42. Dubovik, O.; Smirnov, A.; Holben, B.N.; King, M.D.; Kaufman, Y.J.; Eck, T.F.; Slutsker, I. Accuracy Assessments of Aerosol Optical Properties Retrieved from Aerosol Robotic Network (AERONET) Sun and Sky Radiance Measurements. J. Geophys. Res. Atmos. 2000, 105, 9791–9806. [Google Scholar] [CrossRef] [Green Version]
  43. Holben, B.N.; Slutsker, T.I.E.I.; Tar, D.; Buis, J.P.; Setxerj, I.I.A.; Reagan, J.A.; Kaufman, Y.J.; Nakajima, T.; Lavenu, F.; Vemte, E.; et al. AERONET-A Federated Instrument Network and Data Archive for Aerosol Characterization. Remote Sens. Environ. 1998, 66, 1–16. [Google Scholar] [CrossRef]
  44. Smirnov, A.; Holben, B.N.; Eck, T.F.; Dubovik, O.; Slutsker, I. Cloud-Screening and Quality Control Algorithms for the AERONET Database. Remote Sens. Environ. 2000, 73, 337–349. [Google Scholar] [CrossRef]
  45. Kaskaoutis, D.; Kambezidis, H.D.; Hatzianastassiou, N.; Kosmopoulos, P.G.; Badarinath, K. v Aerosol Climatology: Dependence of the Angstrom Exponent on Wavelength over Four AERONET Sites. Atmos. Chem. Phys. Discuss. 2007, 7, 7347–7397. [Google Scholar] [CrossRef]
  46. Alam, K.; Us Sahar, N.; Iqbal, Y. Aerosol Characteristics and Radiative Forcing during Pre-Monsoon and Post-Monsoon Seasons in an Urban Environment. Aerosol. Air. Qual. Res. 2014, 14, 99–107. [Google Scholar] [CrossRef] [Green Version]
  47. Prasad, A.K.; Singh, R.P. Comparison of MISR-MODIS Aerosol Optical Depth over the Indo-Gangetic Basin during the Winter and Summer Seasons (2000–2005). Remote Sens. Environ. 2007, 107, 109–119. [Google Scholar] [CrossRef]
  48. Hamilton, M.P.; Graham, E.A.; Rundel, P.W.; Allen, M.F.; Kaiser, W.; Hansen, M.H.; Estrin, D.L. New Approaches in Embedded Networked Sensing for Terrestrial Ecological Observatories. Environ. Eng. Sci. 2007, 24, 192–204. [Google Scholar] [CrossRef] [Green Version]
  49. Kampe, T.U. NEON: The First Continental-Scale Ecological Observatory with Airborne Remote Sensing of Vegetation Canopy Biochemistry and Structure. J. Appl. Remote Sens. 2010, 4, 043510. [Google Scholar] [CrossRef] [Green Version]
  50. Schimel, D.; Hargrove, W.; Hoffman, F.; MacMahon, J. NEON: A Hierarchically Designed National Ecological Network. Front. Ecol. Environ. 2007, 5, 59. [Google Scholar] [CrossRef]
  51. NEON Provisional Data Downloaded from Ational Ecological Observatory Network. Battelle, Boulder, CO, USA. 2018. Available online: http://Data.Neonscience (accessed on 1 August 2018).
  52. Driemel, A.; Augustine, J.; Behrens, K.; Colle, S.; Cox, C.; Cuevas-Agulló, E.; Denn, F.M.; Duprat, T.; Fukuda, M.; Grobe, H.; et al. Baseline Surface Radiation Network (BSRN): Structure and Data Description (1992–2017). Earth Syst. Sci. Data 2018, 10, 1491–1501. [Google Scholar] [CrossRef] [Green Version]
  53. Manninen, T.; Roujean, J.L.; Hautecoeur, O.; Riihelä, A.; Lahtinen, P.; Jääskeläinen, E.; Siljamo, N.; Anttila, K.; Sukuvaara, T.; Korhonen, L. Airborne Measurements of Surface Albedo and Leaf Area Index of Snow-Covered Boreal Forest. J. Geophys. Res. Atmos. 2022, 127, e2021JD035376. [Google Scholar] [CrossRef]
  54. Román, M.O.; Schaaf, C.B.; Woodcock, C.E.; Strahler, A.H.; Yang, X.; Braswell, R.H.; Curtis, P.S.; Davis, K.J.; Dragoni, D.; Goulden, M.L.; et al. The MODIS (Collection V005) BRDF/Albedo Product: Assessment of Spatial Representativeness over Forested Landscapes. Remote Sens. Environ. 2009, 113, 2476–2498. [Google Scholar] [CrossRef] [Green Version]
  55. Henderson-Sellers, A.; Wilson, M.F. Surface Albedo Data for Climatic Modeling. Rev. Geophys. 1983, 21, 1743–1778. [Google Scholar] [CrossRef]
  56. Wang, Z.; Schaaf, C.B.; Chopping, M.J.; Strahler, A.H.; Wang, J.; Román, M.O.; Rocha, A.V.; Woodcock, C.E.; Shuai, Y. Evaluation of Moderate-Resolution Imaging Spectroradiometer (MODIS) Snow Albedo Product (MCD43A) over Tundra. Remote Sens. Environ. 2012, 117, 264–280. [Google Scholar] [CrossRef]
  57. Friedl, M.A.; Sulla-Menashe, D.; Tan, B.; Schneider, A.; Ramankutty, N.; Sibley, A.; Huang, X. MODIS Collection 5 Global Land Cover: Algorithm Refinements and Characterization of New Datasets. Remote Sens. Environ. 2010, 114, 168–182. [Google Scholar] [CrossRef]
  58. Bartsch, A.; Widhalm, B.; Pointner, G.; Ermokhina, K.; Leibman, M.; Heim, B. Landcover Derived from Sentinel-1 and Sentinel-2 Satellite Data (2015–2018) for Subarctic and Arctic Environments; Zentralanstalt für Meteorologie und Geodynamik: Wien, Austria, 2019. [Google Scholar]
  59. Sturm, M.; Schimel, J.; Michaelson, G.; Welker, J.M.; Oberbauer, S.F.; Liston, G.E.; Fahnestock, J.; Romanovsky, V.E. Winter Biological Processes Could Help Convert Arctic Tundra to Shrubland. Bioscience 2005, 55, 17–26. [Google Scholar] [CrossRef]
  60. Pomeroy, J.W.; Bewley, D.S.; Essery, R.L.H.; Hedstrom, N.R.; Link, T.; Granger, R.J.; Sicart, J.E.; Ellis, C.R.; Janowicz, J.R. Shrub Tundra Snowmelt. Hydrol Process 2006, 20, 923–941. [Google Scholar] [CrossRef]
  61. Bonfils, C.J.W.; Phillips, T.J.; Lawrence, D.M.; Cameron-Smith, P.; Riley, W.J.; Subin, Z.M. On the Influence of Shrub Height and Expansion on Northern High Latitude Climate. Environ. Res. Lett. 2012, 7, 015503. [Google Scholar] [CrossRef] [Green Version]
  62. Masek, J.G.; Wulder, M.A.; Markham, B.; McCorkel, J.; Crawford, C.J.; Storey, J.; Jenstrom, D.T. Landsat 9: Empowering Open Science and Applications through Continuity. Remote Sens. Environ. 2020, 248, 111968. [Google Scholar] [CrossRef]
Figure 1. Validation tower sites used in this assessment with the red line indicating the product extent above 40°N.
Remotesensing 14 05320 g001
Figure 2. Monthly average white-sky albedo across the circumpolar domain for 2018 with associated QA metrics. The albedo and QA values have been aggregated to 500 m for the purpose of static visualization. The missing data, primarily occurring in November-February across the northern-most regions result from insufficient solar illumination due to polar night.
Remotesensing 14 05320 g002
Figure 3. (a) Comparison of the Landsat blue-sky albedo results using MODIS-based AOD values (BLUE_full(MODIS_AOD)) to tower measured albedo values across the circumpolar domain. RMSE and bias to 0.0395 and 8.67 × 10⁻⁵, respectively. Almost all the points outside of the +/−0.05 are scenes where snow is present in the footprint, highlighting the need for further development of high-resolution products to capture these conditions. (b) Comparison of the MODIS blue-sky albedo results to tower measured albedo values at both spatially representative and non-representative sites for the spatial resolution of the MODIS sensors across the circumpolar domain. RMSE and bias to 0.074 and −0.0011, respectively. Again, most points outside the +/−0.05 are scenes in which snow is present, with Ny-Alesund and Sodankylä being especially poorly captured by MODIS albedo.
Remotesensing 14 05320 g003
Figure 4. Temporal comparison of Landsat and MODIS albedo products with Landsat albedo shown in red and green for MODIS and AERONET AODs, respectively, MODIS albedo at 500 m resolution in blue and the tower albedo in black. Insets of the tower footprints and surrounding landscape at each site are shown for summer months. Missing AERONET data points largely result from unavailable Level 2.0 AOD information.
Remotesensing 14 05320 g004
Figure 5. Comparison of blue-sky albedo derivation using Aerosol Optical Depth (AOD) data from different sources: (a) The comparison of blue-sky albedo calculated from MODIS AOD and AERONET tower AOD; (b) The comparison of blue-sky albedo calculated from MODIS AOD and using a fixed climatology value of 0.20.
Remotesensing 14 05320 g005
Figure 6. Comparison of Landsat (a) and MODIS (b) albedo results of varying landcovers on the northern edge of the Seward Peninsula, Alaska USA. Imagery from mid-summer (22 July 2020—middle row) and the early spring (03 May 2020—bottom row) show the landscape in the presence and absence of snow. The 18 km subsets highlight the heterogeneity of the region as a whole as captured by the Landsat-scale albedo and landcover results. The 2 km subsets and coincident density estimations of albedo show the increase in information available using higher resolution imagery. The range in albedo values is greater in both higher resolution plots and clear separation in albedo signature can be seen in the landcovers presented here.
Remotesensing 14 05320 g006
Table 1. The location and specifications of the 26 tower sites used for the comparison of Landsat blue-sky albedo with ground measured tower data. The representative assessment within the 2 km subset for both snow-free and snow-covered imagery is shown in the last six columns with R = Representative, NR = Not Representative, NF = Model was Not Fit indicating the variogram never reached an asymptote on any available imagery for the targeted time period and NI are cases in which No Imagery was available for assessment.
Site IDNetworkCountryLat/
Long
Tower Height (m)Instrument Footprint (m)Landcover/DomainRepresentativeness Assessment
Snow FreeSnow Present
Image DateSill2.0R @ 2 kmImage DateSill2.0R @ 2 km
Abby RoadABBYNEONUSA45.762/
−122.330
18.55235.59Evergreen Forest, Grassland/Herbaceous, Shrub/Shrub05 Aug 20195.93 × 10−4R24 Oct 20195.36 × 10−4R
UtqiaġvikBARRNEONUSA71.282/
−156.619
8.92113.28Emergent Herbaceous Wetlands12 Jul 20177.91 × 10−4R22 Jun 20181.02 × 10−2NR
Bartlett Exp ForestBARTNEONUSA44.064/
−71.287
35.67453.01Deciduous/Evergreen/Mixed Forest19 Jul 20183.33 × 10−4R26 Mar 20174.66 × 10−3NR
Caribou-Poker Creeks BONANEONUSA65.154/
−147.503
19.37246.00Deciduous/Evergreen/Mixed Forest26 Jun 20196.50 × 10−4NR12 Mar 20185.72 × 10−2NR
CabauwCABBSRNNL51.971/
4.927
225.40Grasslands01 May 20161.47 × 10−3NR NI
Dakota Coteau DCFSNEONUSA47.162/
−99.107
8.59109.09Grassland/Herbaceous27 Jul 20191.09 × 10−3NR16 Jan 20191.23 × 10−2NR
Delta JunctionDEJUNEONUSA63.881/
−145.751
22.33283.59Evergreen Forest, Shrub/Shrub, Woody Wetlands09 Aug 20172.34 × 10−4R NF
Fort Peck FPKSURFRADUSA48.308/
−105.102
10127.00Grasslands NF01 Feb 20181.20 × 10−2NR
Harvard ForestHARVNEONUSA42.537/
−72.173
39.1496.57Deciduous/Evergreen, Mixed Forest, Woody Wetlands05 Aug 20163.83 × 10−4R17 Mar 20171.05 × 10−2NR
HealyHEALNEONUSA63.876/
−149.213
8.81111.89Dwarf Scrub, Evergreen Forest, Shrub/Shrub10 Jul 2019Not FitNR NF
Niwot Ridge Mountain NIWONEONUSA40.054/
−105.582
8.41106.81Evergreen Forest, Grassland/Herbaceous17 Aug 20194.94 × 10−4R05 Apr 20172.28 × 10−2NR
Northern Great PlainsNOGPNEONUSA46.77/
−100.915
8.39106.55Grassland/Herbaceous25 Jul 20192.35 × 10−4R14 Jan 20192.36 × 10−2NR
Ny-Alesund SpitsbergenNYABSRNSJ78.925/
11.93
225.40Tundra Vegetation NI01 Apr 20182.09 × 10−1NR
Penn StatePSUSURFRADUSA40.72/
−77.931
10127.00Cultivated/Mixed Forest23 Jul 20156.38 × 10−4NR13 Feb 20152.98 × 10−2NR
Rutland VTRUTSURFRADUSA43.637/
−72.975
10127.00Grasslands06 May 20157.16 × 10−4NR12 Mar 20151.95 × 10−2NR
Sioux Falls SDSXFSURFRADUSA43.734/
−96.623
10127.00Grassland05 Aug 20161.70 × 10−3NR31 Jan 20187.62 × 10−3NR
Steigerwaldt Land ServicesSTEINEONUSA45.509/
−89.586
5.9875.95Woody Wetlands10 Jul 20192.61 × 10−4R17Mar 20181.32 × 10−2NR
North Sterling STERNEONUSA40.462/
−103.029
8.42106.93Cultivated21 Feb 20187.10 × 10−3R04 Jan 20183.68 × 10−4NR
Summit StationSUMESRLGL−38.4596/72.57661.721.93Snow/Ice NI17 Jun 20167.44 × 10−5R
TiksiTIKBSRNRU71.586/
128.919
225.40Tundra Vegetation NI30 Apr 20161.25 × 10−3NR
ToolikTOOLNEONUSA68.661/
−149.37
8.96113.79Dwarf Scrub, Shrub/Shrub08 Jul 20194.51 × 10−5NR NF
ToravereTORBSRNEE58.254/
26.462
225.40Deciduous/Evergreen/Mixed Forest, Woody Wetlands23 Aug 20186.21 × 10−4R NF
TreehavenTREENEONUSA45.494/
−89.586
35.9455.93Deciduous/Mixed Forest, Woody Wetlands30 Jul 20185.30 × 10−4R17 Mar 20181.29 × 10−2NR
Notre Dame ERCUNDENEONUSA46.234/
−89.537
38.74492.00Emergent Herbaceous Wetlands, Grassland/Herbaceous30 Jul 20181.52 × 10−3NR25 Apr 20184.04 × 10−3NR
Wind River Experimental ForestWREFNEONUSA45.82/
−121.952
74.2942.34Evergreen Forest29 Jul 20195.12 × 10−4R30 Mar 20193.23 × 10−3NR
Yellowstone Northern RangeYELLNEONUSA44.953/
−110.539
18.03228.98Evergreen Forest, Grassland/Herbaceous, Shrub/Shrub NF18 Feb 20196.70 × 10−2NR
Publisher’s Note: MDPI stays neutral with regard to jurisdictional claims in published maps and institutional affiliations.

