Article

A Novel Low-Cost GNSS Solution for the Real-Time Deformation Monitoring of Cable Saddle Pushing: A Case Study of Guojiatuo Suspension Bridge

1
School of Smart City, Chongqing Jiaotong University, Chongqing 400074, China
2
China State Construction Engineering Co., Ltd., Beijing 100029, China
3
School of Civil Engineering, Chongqing Jiaotong University, Chongqing 400074, China
4
College of Geological Engineering and Geomatics, Chang’an University, Xi’an 710054, China
5
College of Geomatics, Xi’an University of Science and Technology, Xi’an 710054, China
*
Author to whom correspondence should be addressed.
Remote Sens. 2022, 14(20), 5174; https://doi.org/10.3390/rs14205174
Submission received: 27 September 2022 / Revised: 10 October 2022 / Accepted: 12 October 2022 / Published: 16 October 2022
(This article belongs to the Special Issue Remote Sensing in Space Geodesy and Cartography Methods)

Abstract

:
Extreme loadings, a hostile environment and dangerous operation lead to the unsafe state of bridges under construction, especially large-span bridges. Global Navigation Satellite Systems (GNSS) tend to be the best choice for real-time deformation monitoring due to the significant advantage of automation, continuation, all-weather operation and high precision. Unfortunately, the traditional geodetic GNSS instrument with its high price and large volume is limited in its applications. Hence, we design and develop low-cost GNSS equipment by simplifying the monitoring module. The performance of the proposed solution is evaluated through an experimental dynamic scenario, proving its ability to track abrupt deformation down to 3–5 mm. We take Chongqing Guojiatuo Suspension Bridge in China as a case study. We build a real-time low-cost GNSS monitoring cloud platform. The low-cost bridge GNSS monitoring stations are located at the top of the south and north towers, midspan upstream and downstream respectively and the reference station is located in the stable zone 400 m away from the bridge management buildings. We conducted a detailed experimental assessment of low-cost GNSS on 5 April and a real-time deformation detection experiment of the towers and main cables during the dynamic cable saddle pushing process on 26 February 2022. In the static experiment, the standard deviation of the residual using the multi-GNSS solution is 2 mm in the horizontal direction and 5 mm in the vertical direction. The multi-GNSS solution significantly outperforms the BDS/GPS single system. The dynamic experiment shows that, compared with the movement measured by the robotic total station, the horizontal error of the south tower and north tower measured by low-cost GNSS is below 0.005 m and 0.008 m respectively. This study highlights the potential of low-cost GNSS solutions for Structural Health Monitoring (SHM) applications.

1. Introduction

Bridges are important transport nodes of a country. There are significant losses top life and economy when damage occurs [1,2,3]. Nowadays, bridges, especially large-span bridges, must stand an increasing traffic load. Meanwhile, they have to endure hostile weather conditions because they are usually built in cross-river areas. Real-time deformation of bridges under construction is a vital part of SHM, which intuitively reflects the shape of bridges under loads, retrieves the required mechanical state and detects damage [4,5,6]. Therefore, the real-time deformation monitoring of bridges under construction is crucial and helps bridge owners to make proper and timely decisions. In addition, we can identify the potential hazards by real-time deformation as early as possible. This keeps bridges safe, preventing and reducing loss of life and property.
GNSS can provide a continuous, all-weather, automated positioning solution. Due to its attractive advantages, GNSS is now widely used in displacement measurement in civil engineering, such as bridges, high-rise buildings, towers and dams [7,8,9]. Roberts et al. (1997 and 2012) made detailed tests on the accuracy of GNSS to measure bridge movement [10,11]. Ashkenazi et al. (1997) conducted kinematic GPS monitoring experiments on the Humber Suspension Bridge and confirmed that GPS RTK is suitable for SHM with an accuracy to only a few millimeters [12]. Brown et al. (1999) showed GPS can obtain resonant frequencies at the Severn Suspension Bridge. The GNSS-derived vibration frequencies were consistent in these measured frequencies by conventional methods and the Finite Element Model (FEM), respectively [13]. Meng et al. (2016, 2018, 2019) independently designed a GNSS and Earth Observation SHM system (GeoSHM) and applied the system both to the UK’s Forth Road Bridge and several bridges in China. The long-term monitoring results show that GNSS is capable of capturing deformation and vibration frequencies [14,15,16]. With the full operation of BDS and GLONASS, Msaewe et al. (2021) used multi-GNSS to monitor the response of the Severn Suspension Bridge [17]. Xi et al. (2021) proposed a multi-GNSS integration method and applied it to the Baishazhou Yangtze River Bridge with high cutoff elevations [18]. To enhance the applicability of GNSS in restricted environments, high cutoff elevations can be set in bridge monitoring.
However, for wide applications of GNSS in bridge monitoring many unsolved problems still exist [19,20,21,22]. For example, main cables and towers block GNSS signals, resulting in reducing the number of tracking GNSS satellites and weakening satellite geometry [23]. It is usually admitted that, over such a small area, perturbation due to the atmosphere and ionosphere are negligible with respect to the multipath effect on the phase. It is a challenging task to eliminate these errors. Geodetic-class receivers with choke ring antenna can achieve millimeter accuracy [24]. However, the high precision instruments usually need to consume a high cost. It is a significant limitation for institutions and scholars with a restricted budget [25,26]. Managers also cannot afford to conduct monitoring projects. Fortunately, low-cost GNSS receivers have entered the mass market and attracted the attention of researchers for a variety of applications, such as landslides, disasters and high-rise buildings. In addition, with the establishment and full operation of BDS and GLONASS, the number of visible satellites has increased worldwide. To date, there are more than 100 navigation satellites, all of which broadcast over multiple frequencies, providing more observation information and facilitating error handling. Biagi et al. [27] applied a low-cost U-BLOX GNSS receiver to local monitoring by using BSW5.2 and LGO software. The consumer-grade u-Blox NEO-7P receiver was used to conduct a movement simulation experiment. The movement measured by low-cost GNSS was consistent with that measured by RTS. Notti et al. [28] conducted a continuous low-cost GNSS monitoring experiment of an unstable slope in NW Italy. The results showed that millimeter accuracy and the deformation trend were similar to the INSAR-derived movement. Caldera et al. [29] analyzed the performance of the low-cost u-Blox EVK-6T GPS receiver under open sky conditions and showed that a 2–3 mm movement could be detected when using a short baseline with a daily solution. Hamza et al. [30] showed that the low-cost GNSS could identify displacements at a range of 10 mm in the open sky. Generally, researchers have made detailed studies for displacement monitoring by low-cost GNSS receivers. However, the benefits of low-cost GNSS sensors in bridge health monitoring have not yet been explored. Thus, it makes us wonder whether such low-cost GNSS instruments proposed in this paper could be used for tracking real-time tiny movements of bridges with high precision.
Our study aims to prove that low-cost GNSS receivers with double frequencies can provide reliable results for real-time deformation of large-span bridges. We take the Guojiatuo Yangtze River Suspension Bridge, which is under construction, in Chongqing, China, as the experimental object. The main contributions of this paper are as follows,
(1)
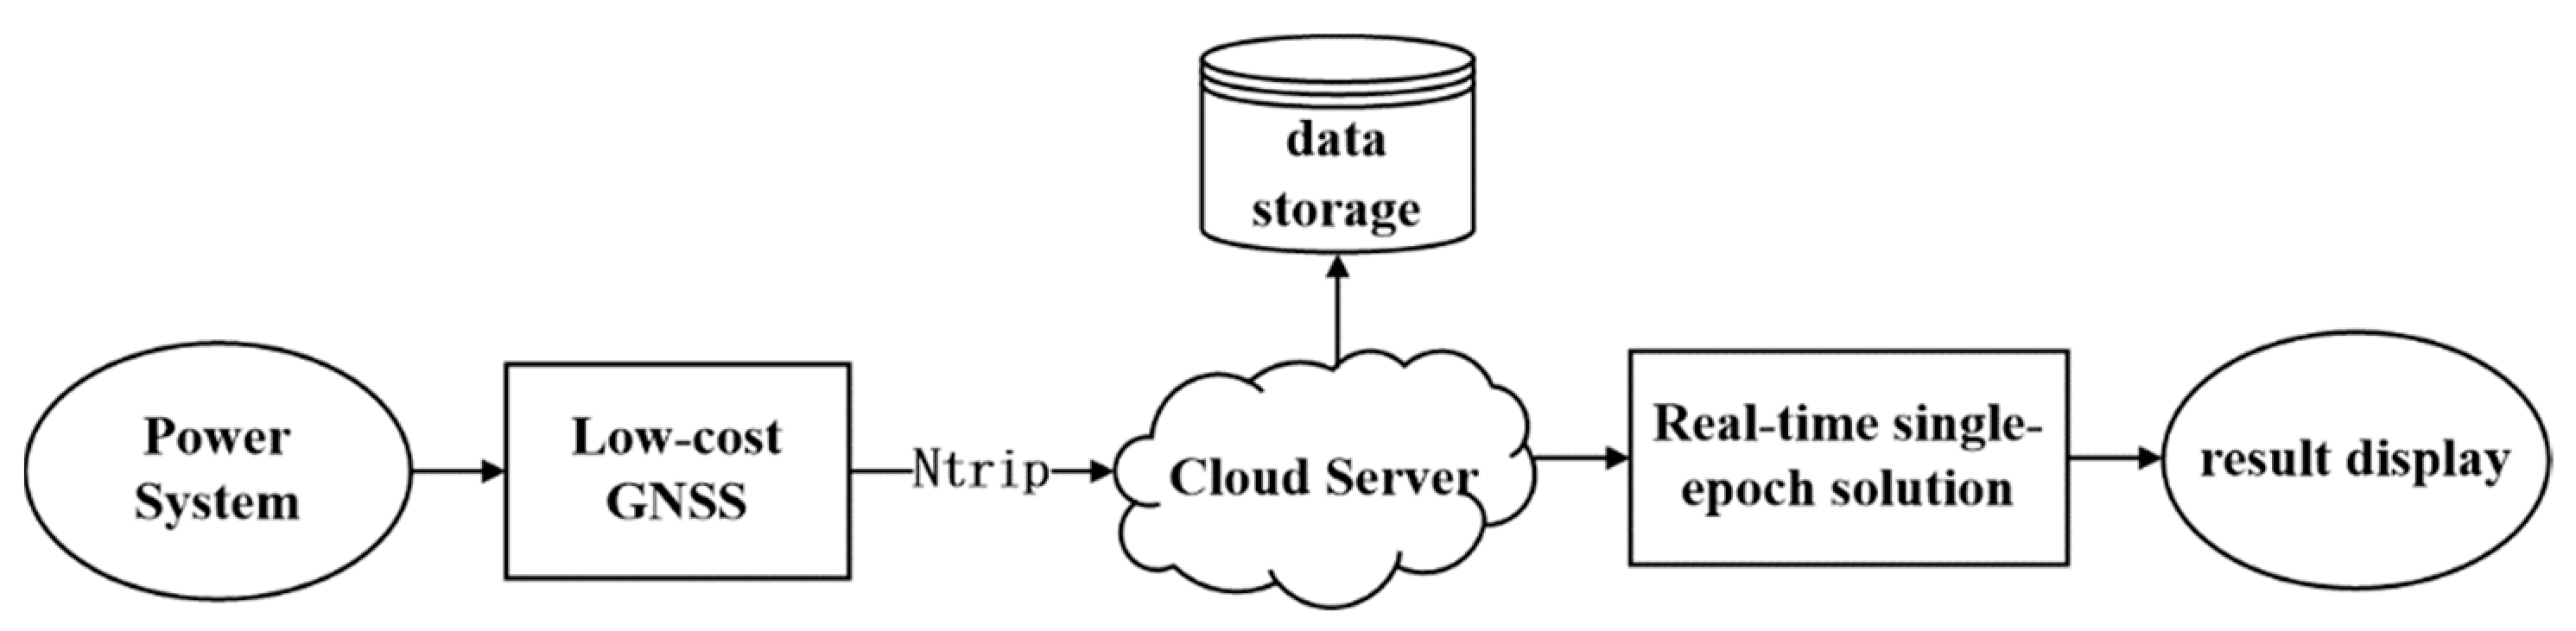
We independently develop a low-cost GNSS sensor. Only data acquisition and data transmission modules are adopted. Then we build a real-time monitoring cloud platform based on our proposed GNSS sensors. The data records can be transmitted and processed in the cloud platform.
(2)
We propose a novel low-cost GNSS solution based on our developed sensors for automatic real-time dynamic monitoring of long-span suspension bridges. As a case study, the tower and cable deformation during the cable saddle pushing process are monitored. Compared with the movement measured by RTS, the accuracy of deformation measured by low-cost GNSS is within an order of one millimeter.
The remainder of this paper is structured as follows. In Section 2 we present a detailed description of the Guojiatuo Suspension Bridge background and the structural characterization of cable saddle pushing. We introduce the hardware and software of our low-cost GNSS sensors and build a real-time low-cost GNSS monitoring cloud system based on the proposed low-cost GNSS sensors in Section 3. Moreover, we present the details of the GNSS dynamic deformation analysis method. Three experiments are conducted in Section 4. We first check the low-cost GNSS sensors’ response to short and quick movement in horizontal and vertical directions. Then we conduct the static positioning test to check the performance of a low-cost GNSS sensor. Finally, in the dynamic cable saddle pushing experiment, the deformation derived from our low-cost GNSS sensors is checked by using RTS. We discuss findings and make conclusions in Section 5.

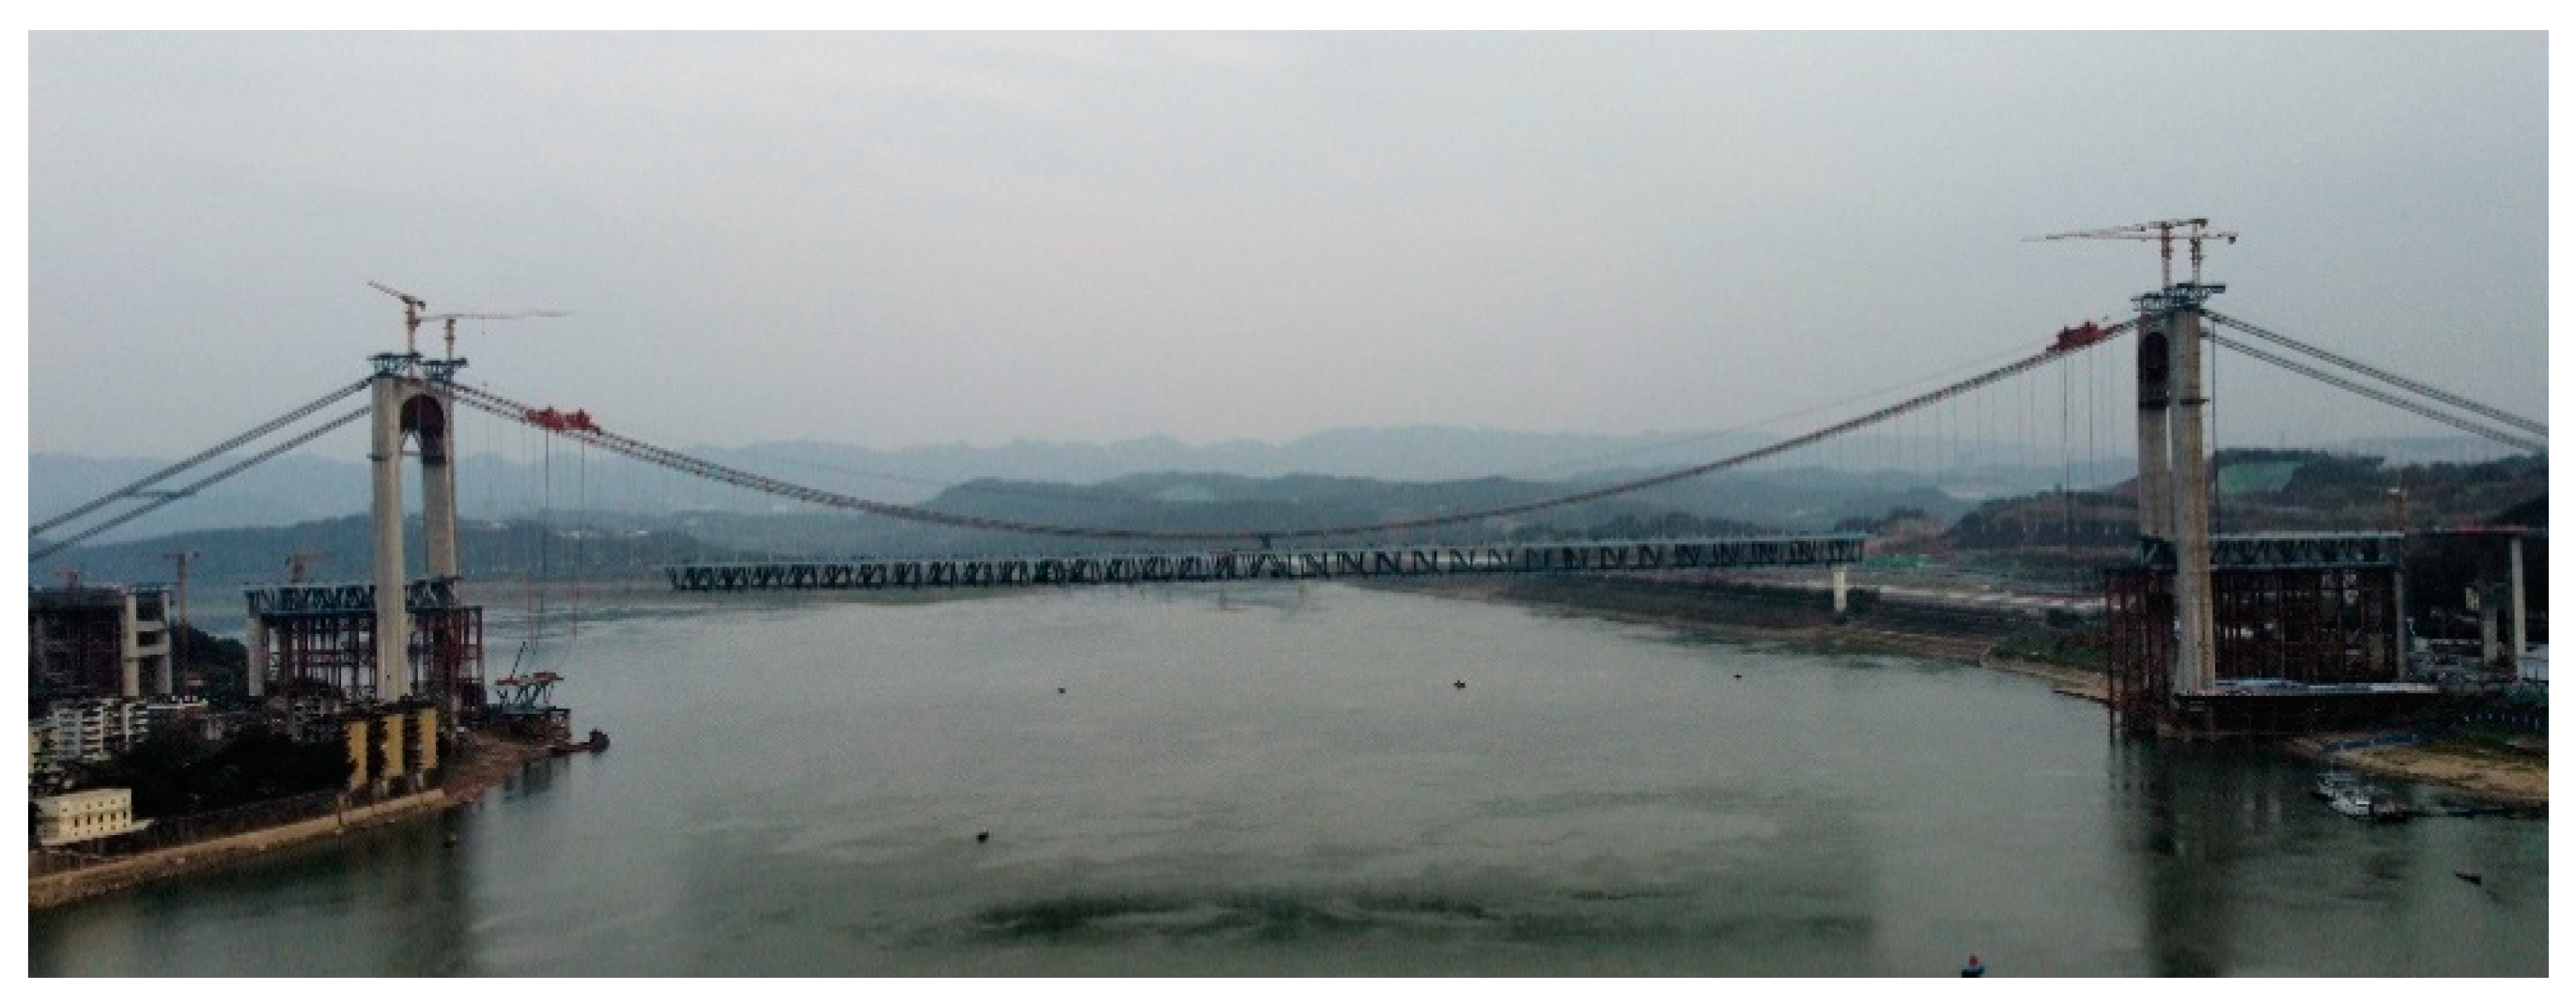
2. The Guojiatuo Suspension Bridge Structural Description

2.1. Research Object Background

The Guojiatuo Suspension Bridge over the Yangtze River is taken as an experiment. The bridge is located between Xiakou town, Nan’an district, and Guojiatuo town, Jiangbei district, Chongqing, China. It is a steel truss suspension bridge with a span of 720 m. The upper deck is for 8-lane car traffic, and the lower deck is for rail traffic. The span arrangement is 75 m + 720 m + 75 m = 870 m. An Unmanned Aerial Vehicle (UAV) photo of Guojiatuo Suspension Bridge which is under construction is shown in Figure 1.
The span of the north approach bridge is 4 × 43 m and the span of the south approach bridge is 3 × 43 m + 4 × 43 m. There are 48 pairs of slings in this bridge and the sling spacing is 15 m. The tower is a concrete portal frame structure. Each bridge tower includes two tower columns, upper and lower beams. The height of the north tower and the south tower are 161.9 m and 172.9 m, respectively. The diameter of the tower pile foundation is 3 m and the number of piles is 34. The bridge is currently the longest-span dual-road-rail purpose suspension bridge in China and will open to traffic by the end of 2022.

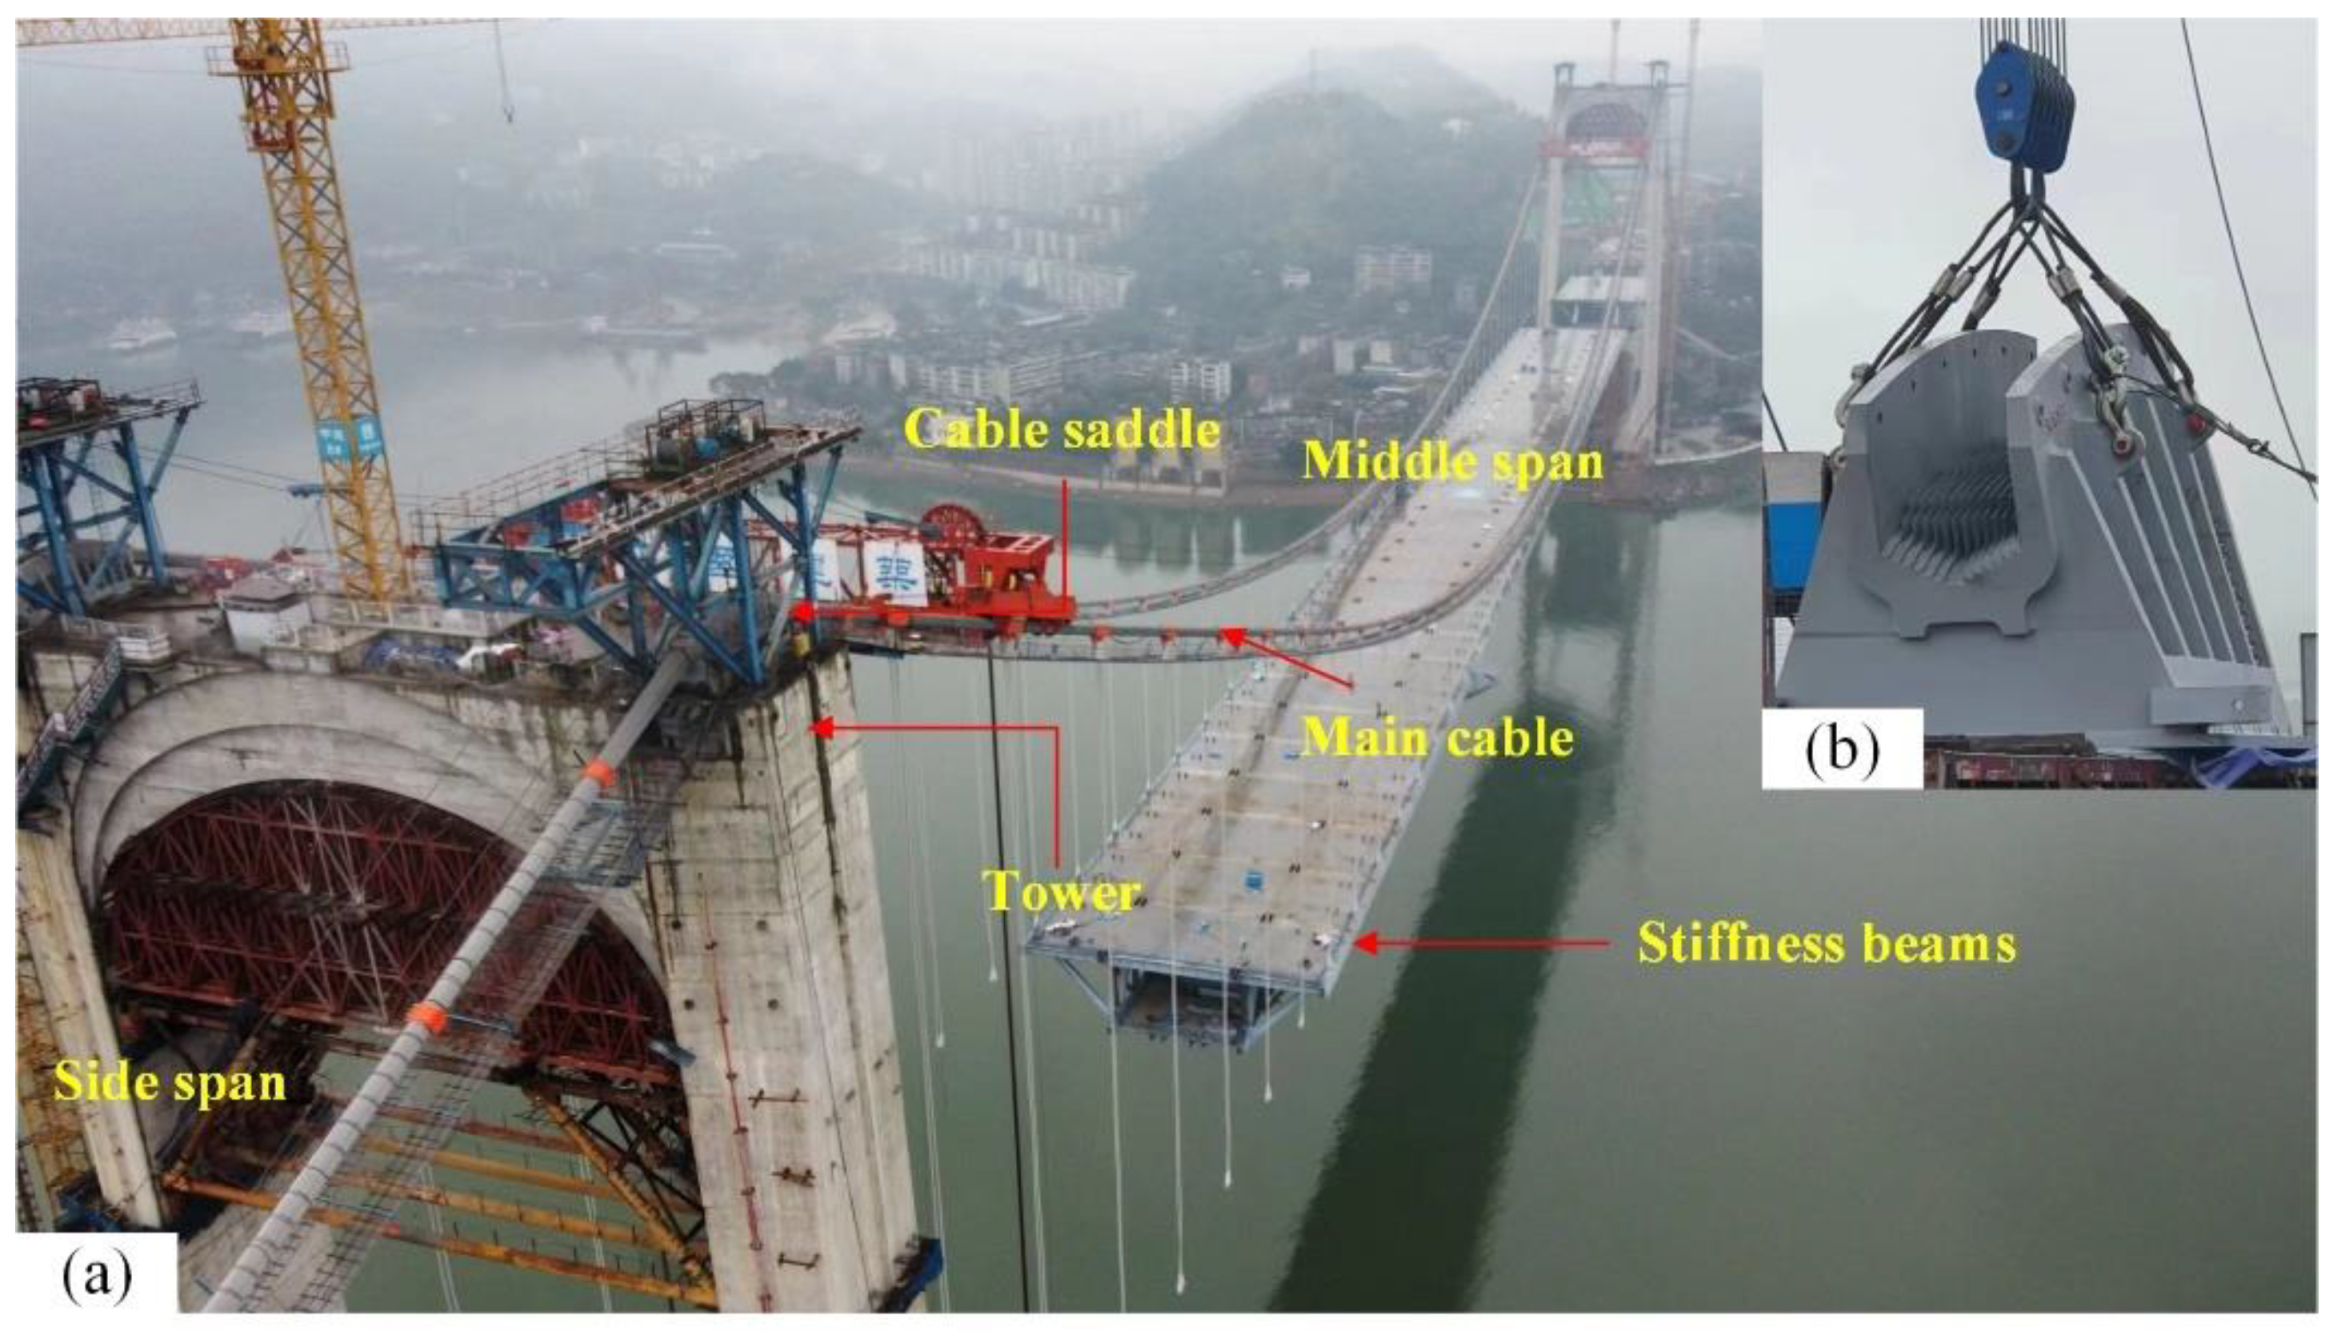
2.2. Structural Characterization of the Cable Saddle Pushing

2.2.1. Cable Saddle Pushing Description

The main components of the Guojiatuo Suspension Bridge upper structure are shown in Figure 2. With lifting of the stiffness beams, the axial force of the main cables in the middle span increases, and the horizontal component force of main cables in the middle span and side span also increases. Under the condition of strong horizontal force, if the cable saddle is not consolidated with the tower, the cable saddle will overcome the friction force and then slip, which may create an unsafe state. The schematic diagram of the connection between the cable saddle and tower is shown in Figure 3. As shown in Figure 3, to ensure a stable safety environment in the construction process, the cable saddle and tower need to use temporary rigid joints. Thus, the tower stands as the horizontal component force. The force diagram of the tower is shown in Figure 4. The unbalanced horizontal force causes tower deflection which is along the traffic and also produces a large bending moment at the bottom of the tower. Therefore, it is necessary to adjust the length of the middle span and side span in a timely fashion to reduce the unbalanced horizontal force, i.e., the cable saddle pushing process.

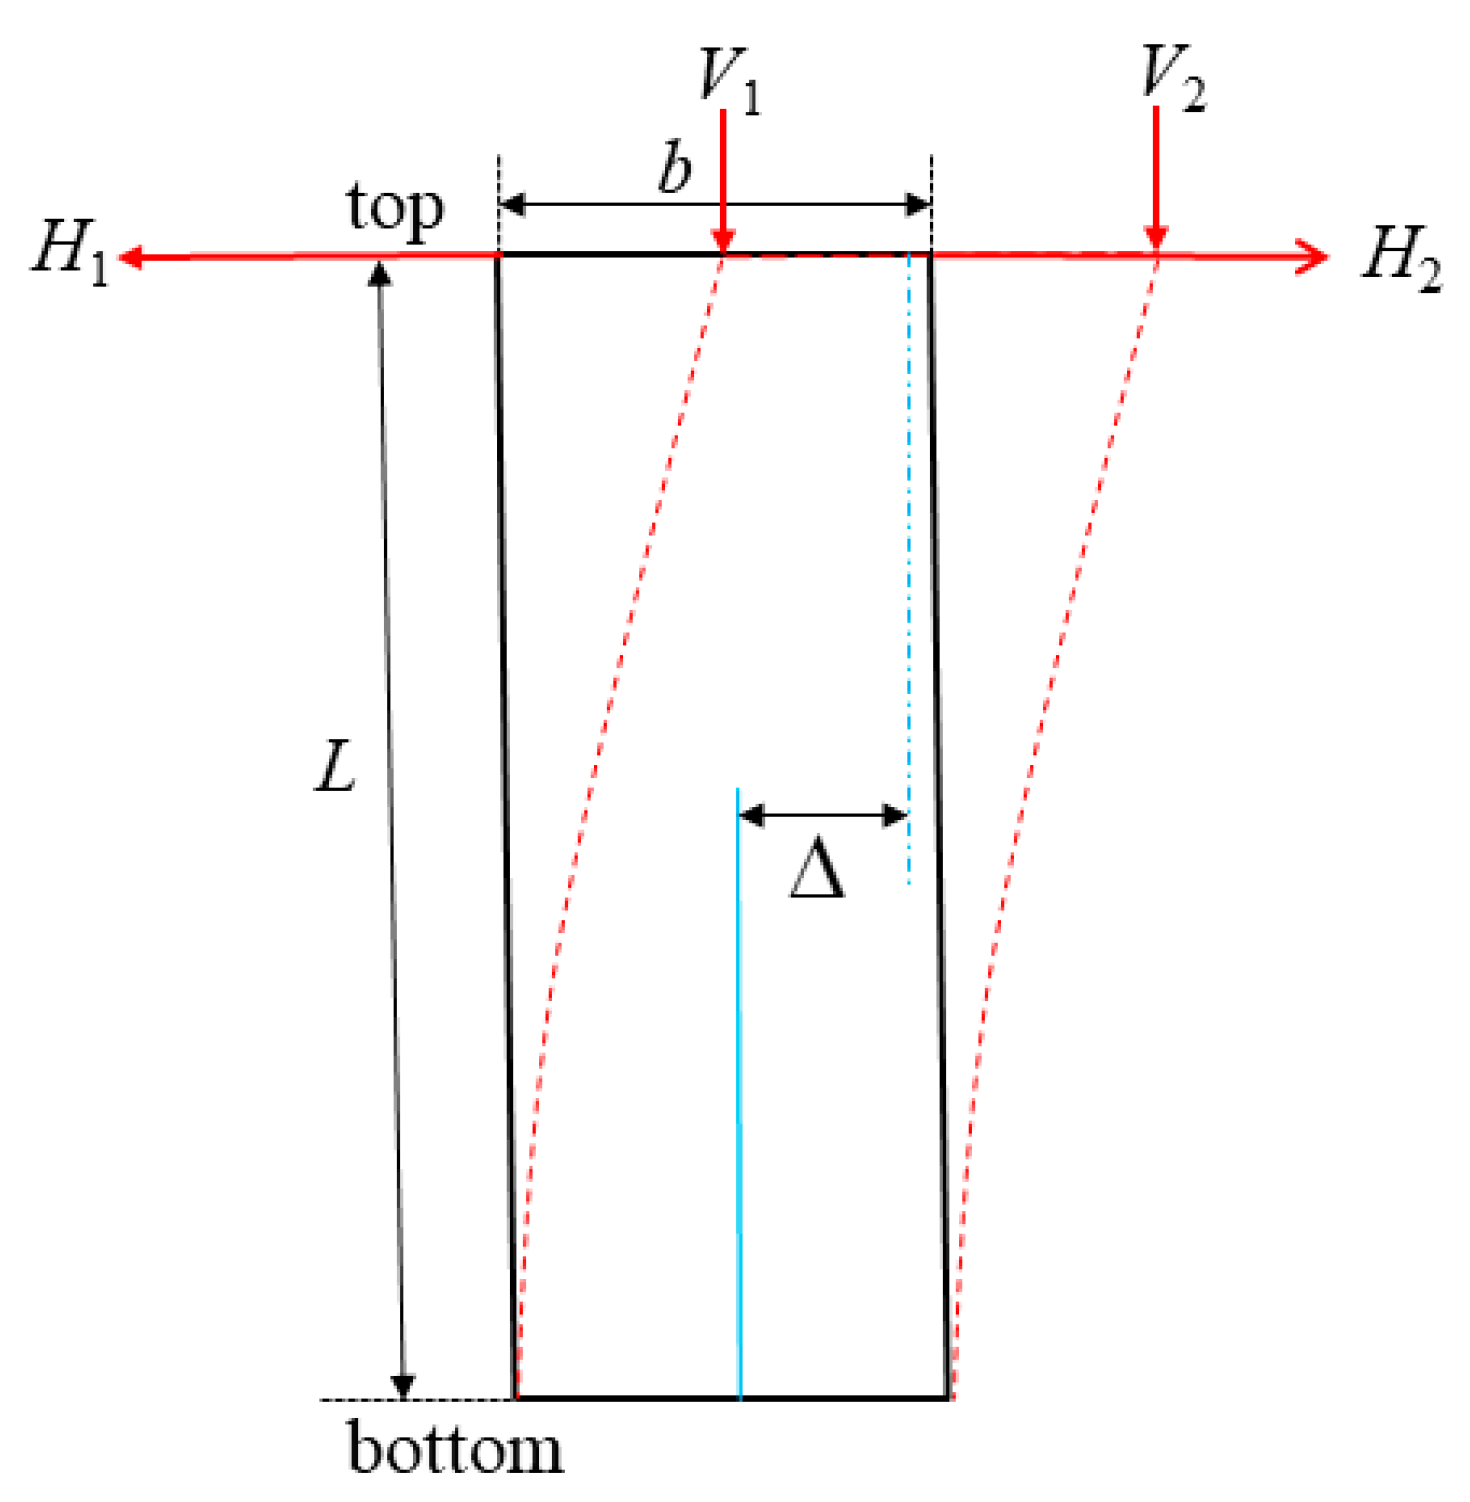
2.2.2. Determination of Unloaded Main Cable Shape and Saddle Reserved Displacement

The calculation of the unloaded main cable shape and cable saddle reserved displacement is vital to ensure the safe construction of the suspension bridge. Due to the irreversibility of concrete shrinkage and creep, we first establish the suspension bridge FEM based on the normal construction sequence, then change the shape of the unloaded main cable considering the displacements of towers and main cables caused by concrete shrinkage and creep. Finally, we determine the shape of the unloaded main cables and the cable saddle reserved displacement considering the influence of the second stage load redistribution along the beam.

2.2.3. Determination of Cable Saddle Pushing Time

To date, the following three principles are generally adopted to determine the cable saddle pushing time: (1) the most unfavorable stress of the control section at the bottom of the bridge tower; (2) horizontal deviation at the top of the bridge tower; (3) push cable saddle at the appropriate time and only once. The advantage of the second principle is that the stress at the bottom of the bridge tower is safe. However, the cable saddle is pushed more frequently. Because of the complicated operation during cable saddle pushing, once a construction error or instrument failure occurs, it will influence the safety of the bridge. If we take the third principle, the deflection of the tower is extremely large and it maybe even damage the tower. Thus, we take the first principle. To ensure that the stress of the control section of the bridge tower which is obtained by bridge FEM meets the requirements that the condition of the bridge is safe.
To ensure the safety of the bridge tower structure and considering the frequency of cable saddle pushing during the construction process, the minimum stress of the control section at the tower bottom of the Guojiatuo Suspension Bridge is 0.2 Mpa. This is set as the standard to determine the pushing time.
When we build the FEM of the Guojiatuo Suspension Bridge, the following aspects should be noted,
(1)
Simulation method of suspension bridge construction stage
For suspension bridges, the conservation of bridge component mass and the invariance of stress-free length are the principles that must be observed in the analysis of the structure in both normal procedures of construction and reverse construction procedures analysis. Meanwhile, for the beams in the cable-free areas, theoretically, the displacement of these beams at the stage of the completed bridge is 0 due to the internal force of the balance element node used in the reverse construction procedures analysis. However, in the real construction processing phase, due to the weight of the beams in the cable-free areas, it is impossible to achieve displacement of beams equal to zero. Usually, a practical solution is to set the pre-arch degree during construction. Unfortunately, it is impossible to set the pre-arch degree of the suspension bridge during the reverse construction analysis. Therefore, it is impossible to observe the principle mentioned above. In this paper, we take the normal construction procedures analysis method. That is, we simulate the state of each construction process according to the actual construction sequence of the suspension bridge.
(2)
Simulation method of beam temporary connection
Three commonly used methods for beam connection are segmental rigid joint, section by-section hinge joint, and rigid and hinged mixed joint. Among them, the second method can effectively reduce the bending moment of the beam in the hoisting process, which is a practical and ideal solution. More specifically, firstly we use the connecting piece with little stiffness hinged on the beam section, then the beam is welded into a whole when all the beam is fully installed. We use this method in the Guojiatuo Suspension Bridge construction. The stiffness beam temporary connection method of the Guojiatuo Suspension Bridge is shown in Figure 5.

3. Materials and Methods

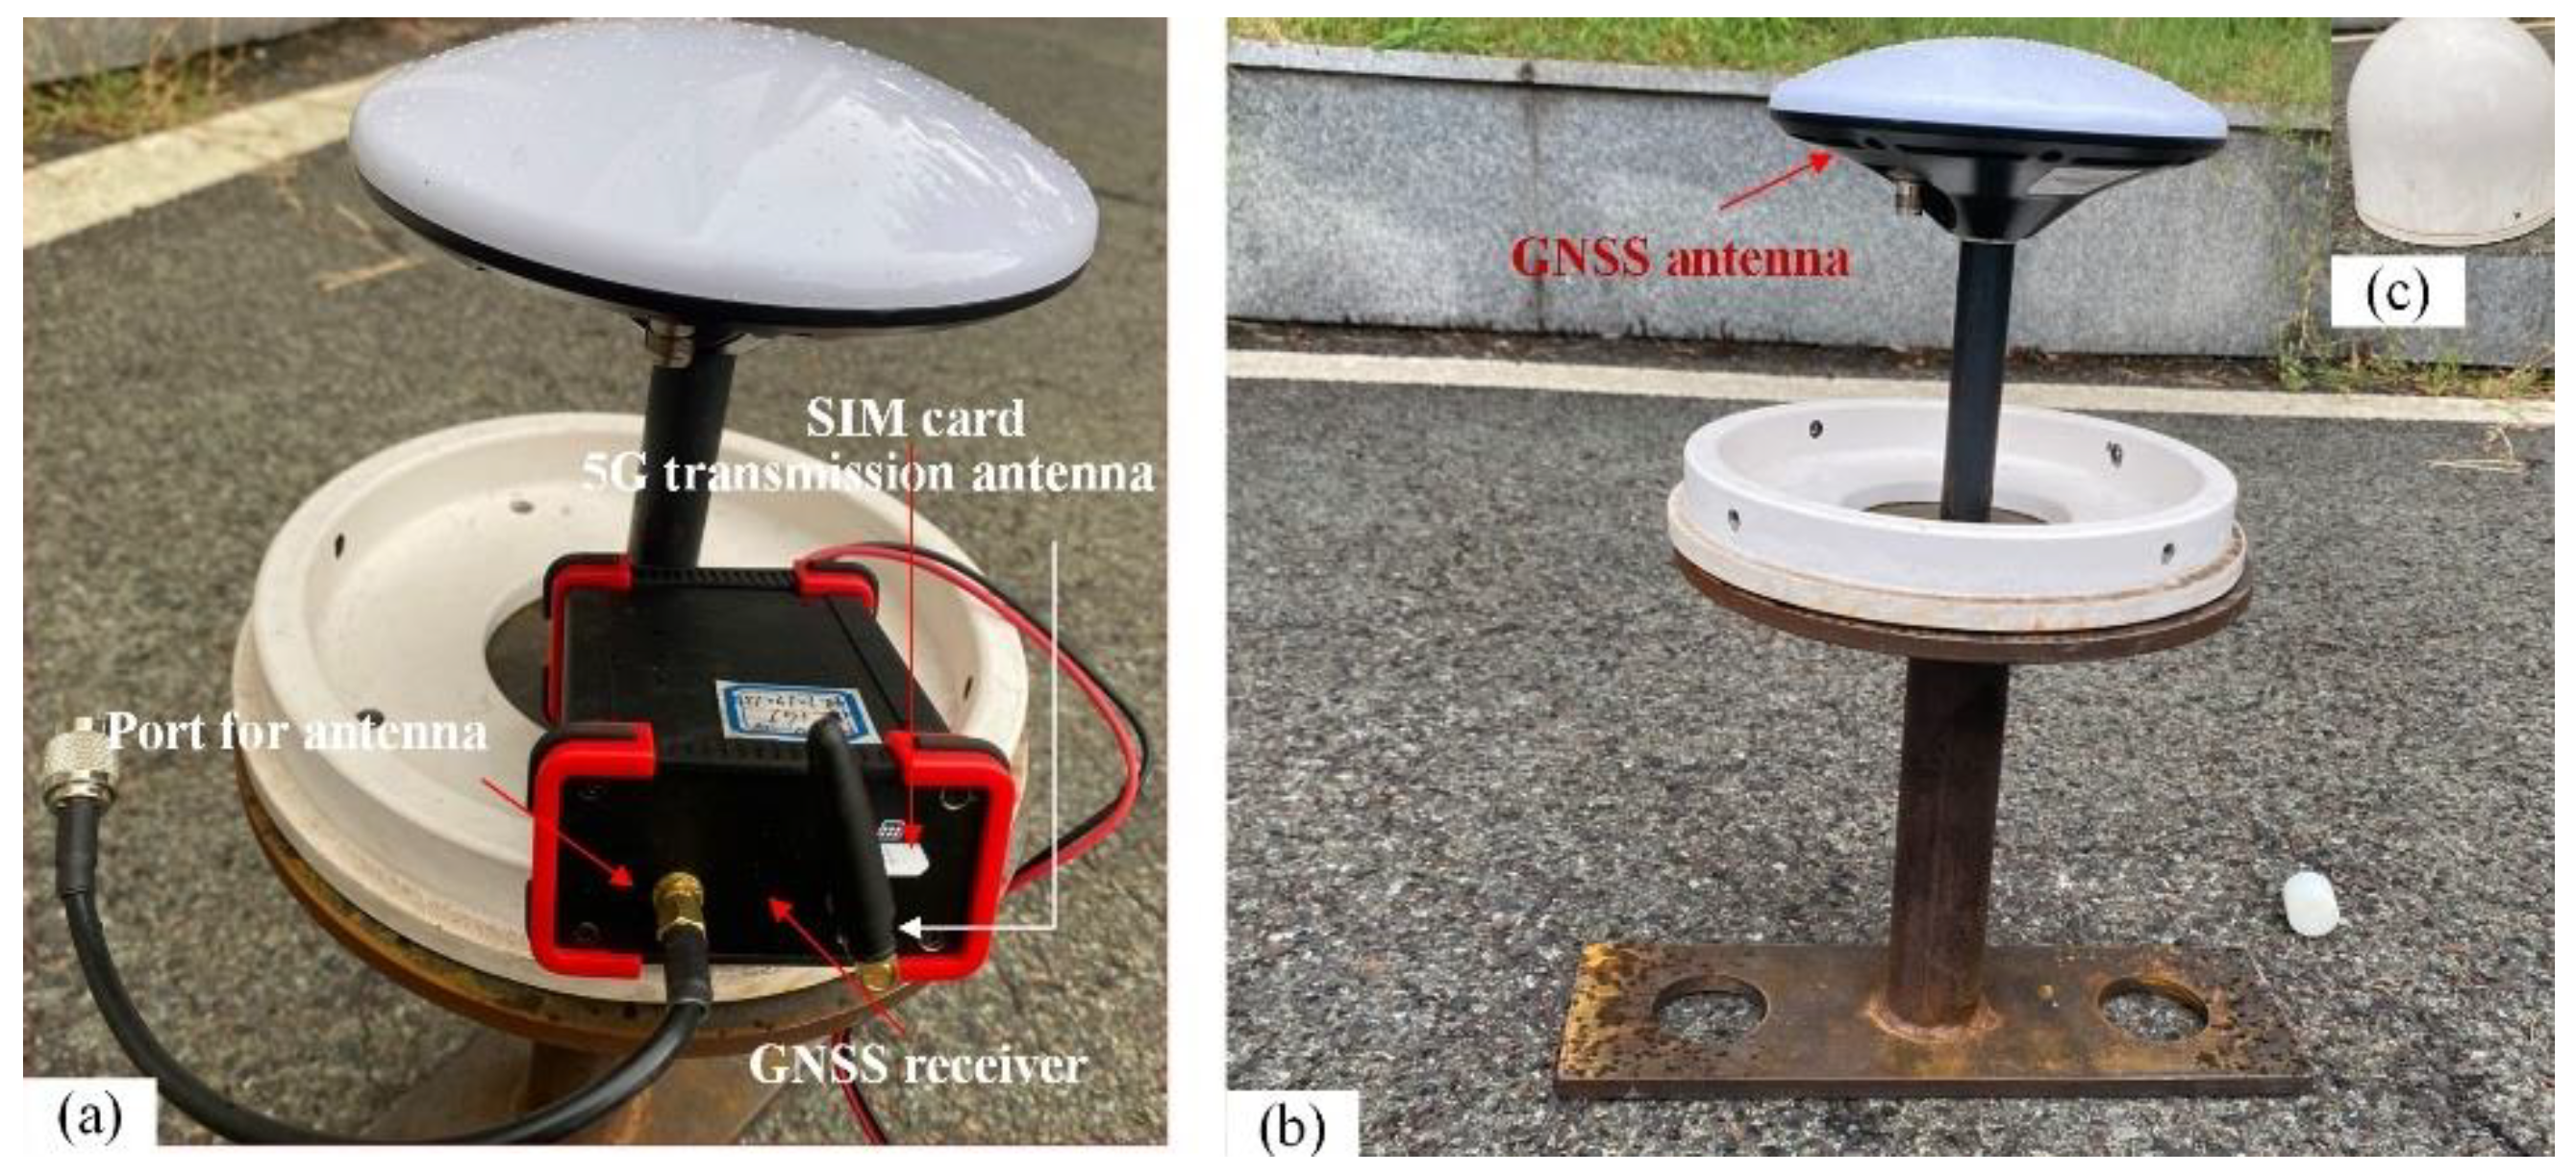
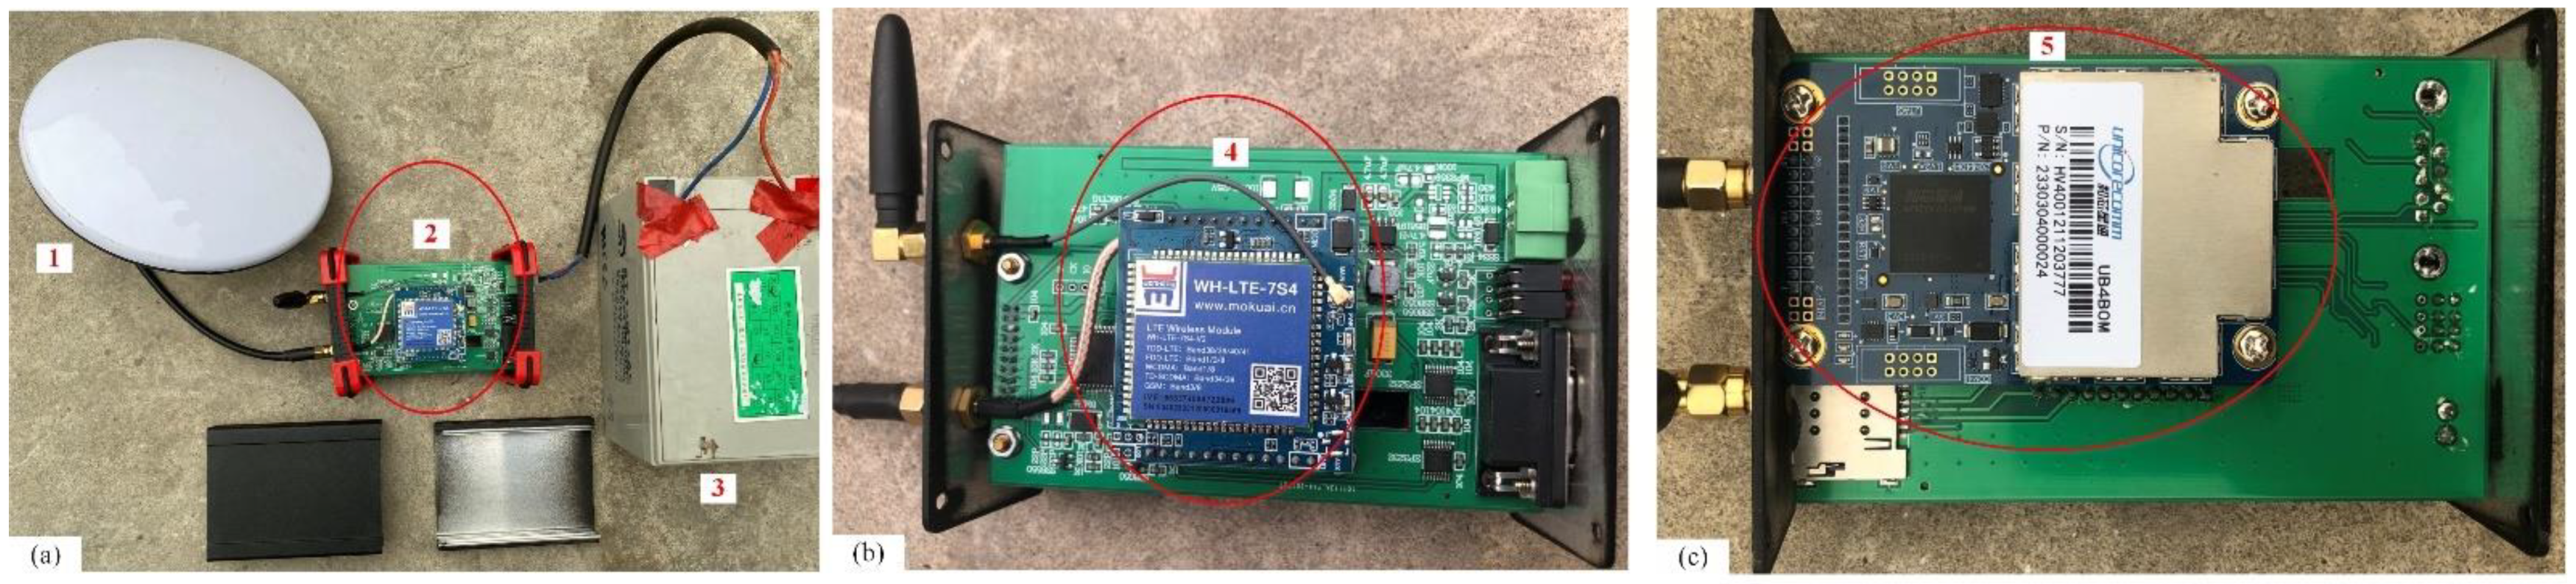
3.1. Low-Cost GNSS Sensor

The low-cost GNSS equipment is shown in Figure 6. As can be seen from Figure 6a, it is divided into GNSS receiver and antenna. The observation data is transmitted by SIM card using a 4G transmission antenna in real time. Three lights are burning if the low-cost equipment is in normal operation, one for transmitting observation records and the other two for positioning and power respectively. The power could be supplied by the alternating current or solar panel. We design connection equipment with an antenna and main cable in Figure 6b and an antenna dome in Figure 6c. Our proposed low-cost GNSS sensor equipment, prototypal box and Micro PC mainboard is shown in Figure 7.
The main components are as follows,
(1) Micro PC mainboard. We can control all the components of low-cost GNSS by the Micro PC mainboard. The mainboard is programmable by remote control (e.g., via 4G in Figure 6) by any computer with Windows operating system. The micro PC also manages the transmission of observation data to the control center in real-time. The observation record is in the Radio Technical Commission for Maritime Services (RTCM) format.
(2) UB4BOM board (5 in Figure 7c). With 432 super channels, it supports BDS, GPS, GLONASS, Galileo and QZSS, including BDS-3 signal. Nebulas-II UC4C0 chipset is a multi-system and multi-core high precision GNSS SoC with 55 nm. It can track 12 navigation signals with 432 channels and with low power. It provides data on the double frequencies of the BDS, GPS, GLONASS, and Galileo constellations in this study. With the full operation of BDS, it has a sufficient number of satellites to strengthen the satellite geometry and improve the robustness of the positioning.
(3) Beitian BT-300 mass-market antenna (1 in Figure 7a). It can track GPS L1/L2, GLONASS L1/L2, BDS B1/B2/B3 and GALILEO E1/E5b signals. The gain is lower than 5.5 dBi and waterproof grade is IP67. The operating temperature ranges from −40 to 70 degree Celsius. The antenna is mounted on a specially constructed iron plate that forms the circular ground plane. Other sensors, such as the accelerometer, could also be mounted on the circular ground plane.
(4) Installation equipment. We design and develop the installation equipment. As shown in Figure 8, it allows the antennas to be mounted on the tower and main cable conveniently.
We do not adopt the non-essential functional modules (such as positioning, data storage, battery and other functional modules). Only data acquisition and communication modules are employed. The real-time observation data of each monitoring station is collected by the data acquisition unit.
The cost of an installed low-cost GNSS instrument is about $350. The detailed cost of our proposed GNSS is listed in Table 1. The installation cost strongly depends on the characteristics of the monitoring station, such as transportation accessibility, electricity grid and data transmission network. Under normal circumstances, the cost is empirically estimated at $800.
The comparison of parameters of self-developed instruments and receivers of different brands is shown in Table 2. Our low-cost GNSS sensors reduce the terminal volume by nearly 75%, and also effectively reduce the equipment cost with small operation power.

3.2. Real-Time Low-Cost GNSS Monitoring Cloud Platform

According to the Ntrip transmission protocol, we transmit real-time data streams with RTCM format to the cloud platform in real-time by using wireless communication methods such as GPRS/4G. The brief technical route of the low-cost GNSS real-time dynamic monitoring system is shown in Figure 9.
The calculation module can realize the functions of GNSS baseline solution, real-time single epoch positioning, deformation result, analysis, etc. The framework of the real-time monitoring system is as follows,
(1) The data stream management module installed on the cloud server can receive the data stream from each monitoring station in real-time, decode and store it at the same time and generate a series of RINEX observation files.
(2) The system can automatically download data such as ultra-fast precise ephemeris, broadcast ephemeris, table files and International GNSS Service (IGS) station observation files.
(3) Real-time short baseline solution. We use DD mode to solve the short baseline and also display and broadcast results via E-mail, message, website, etc.

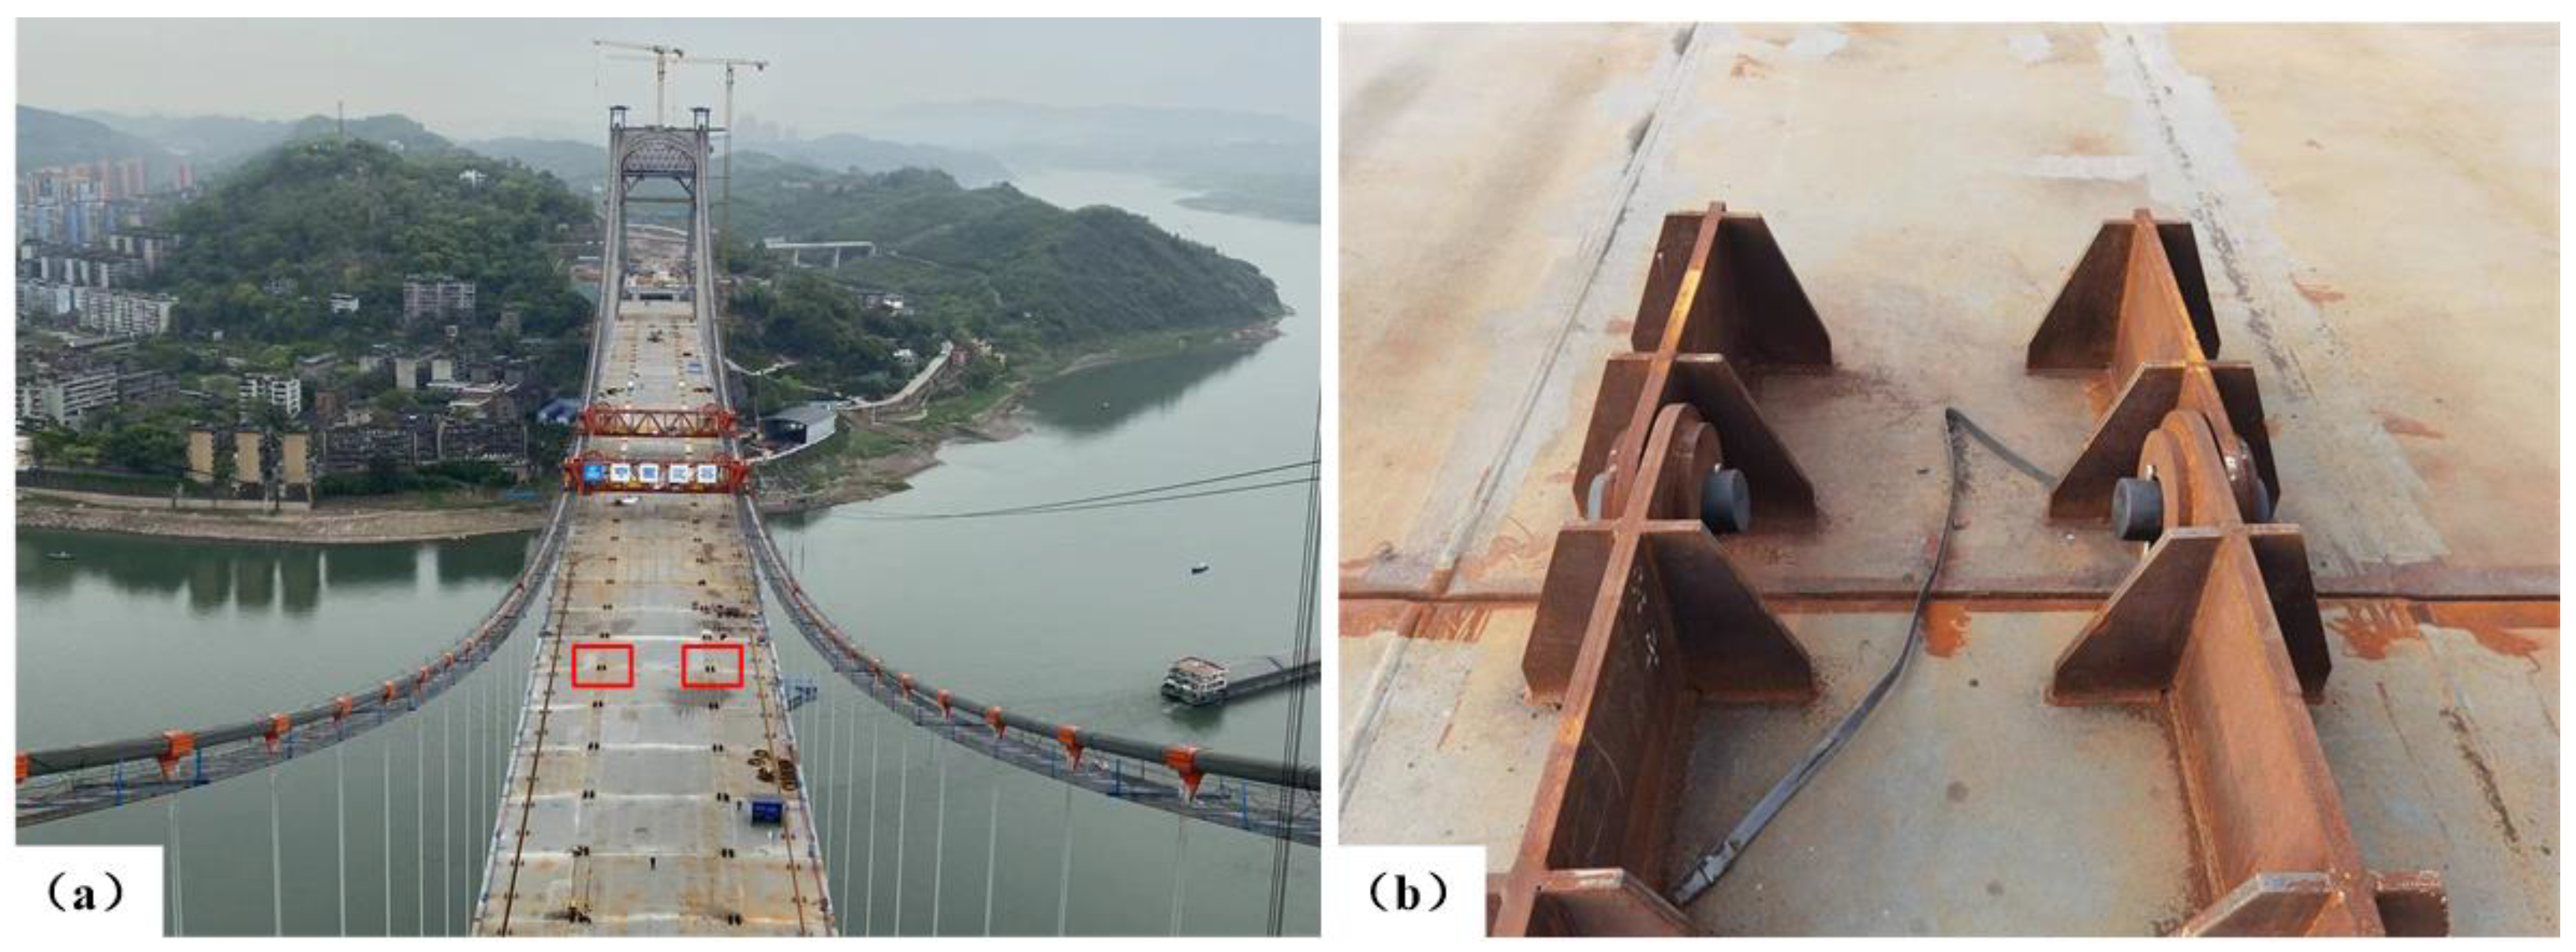
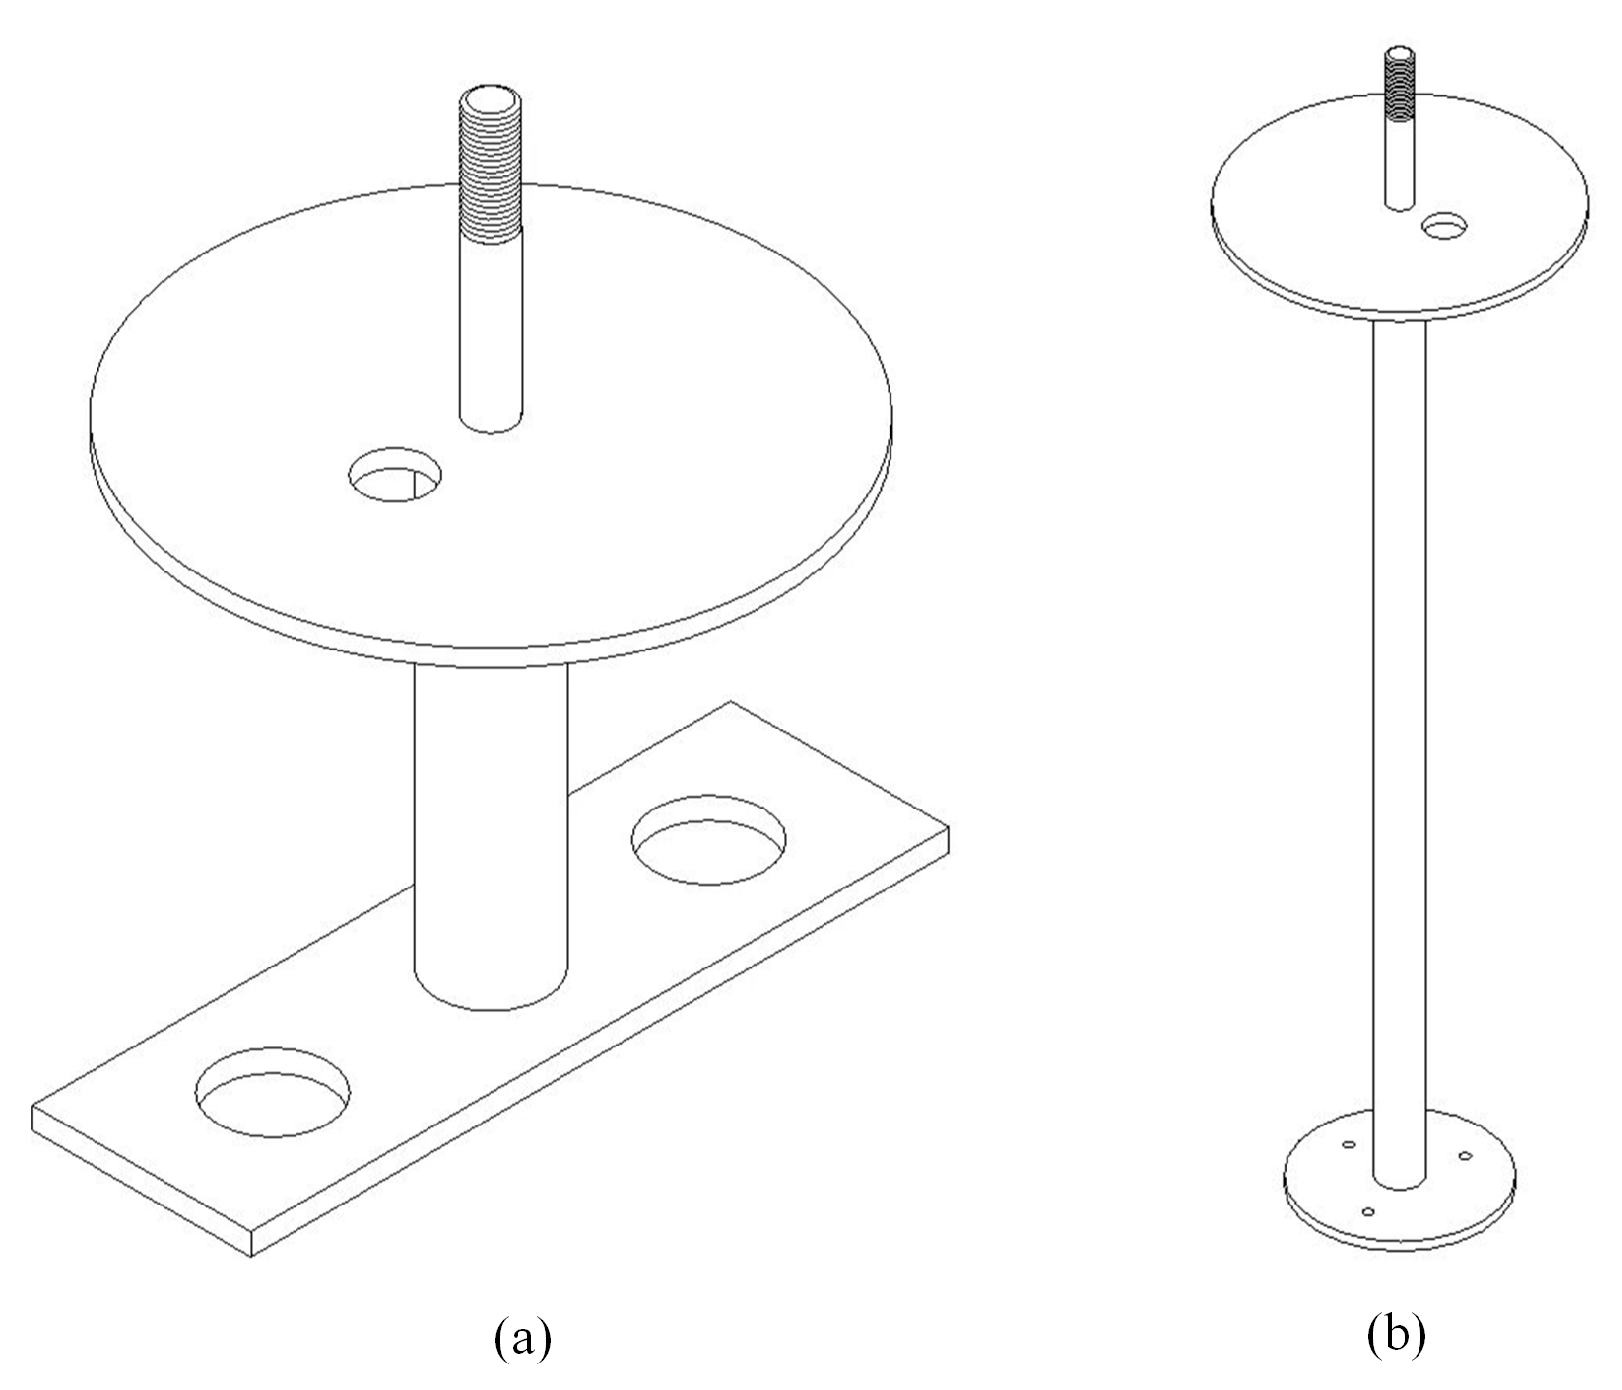
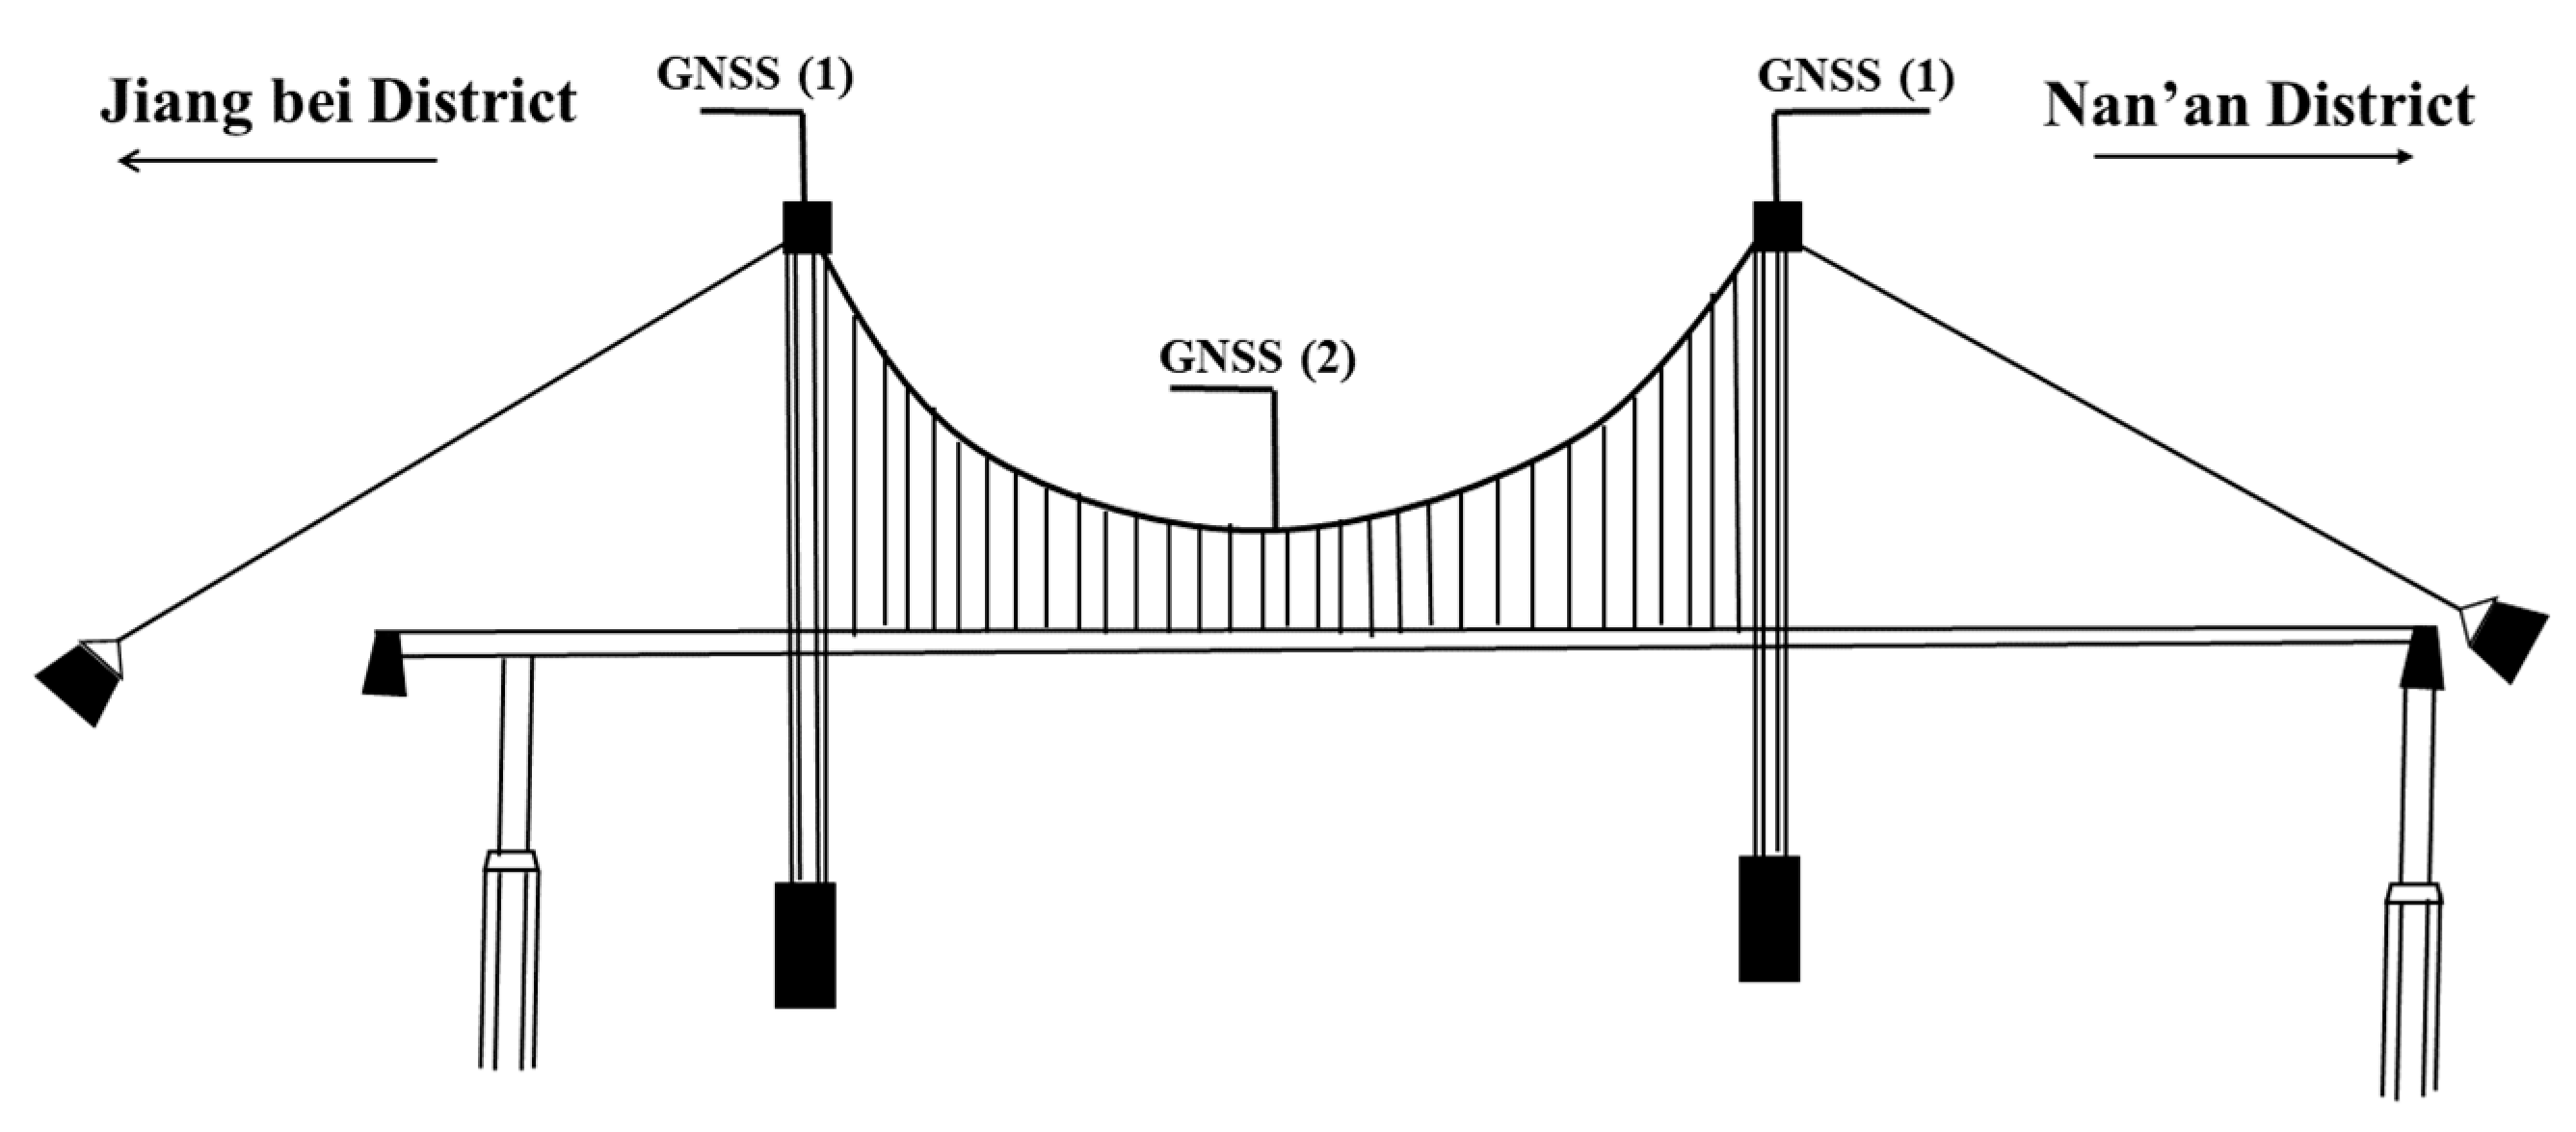
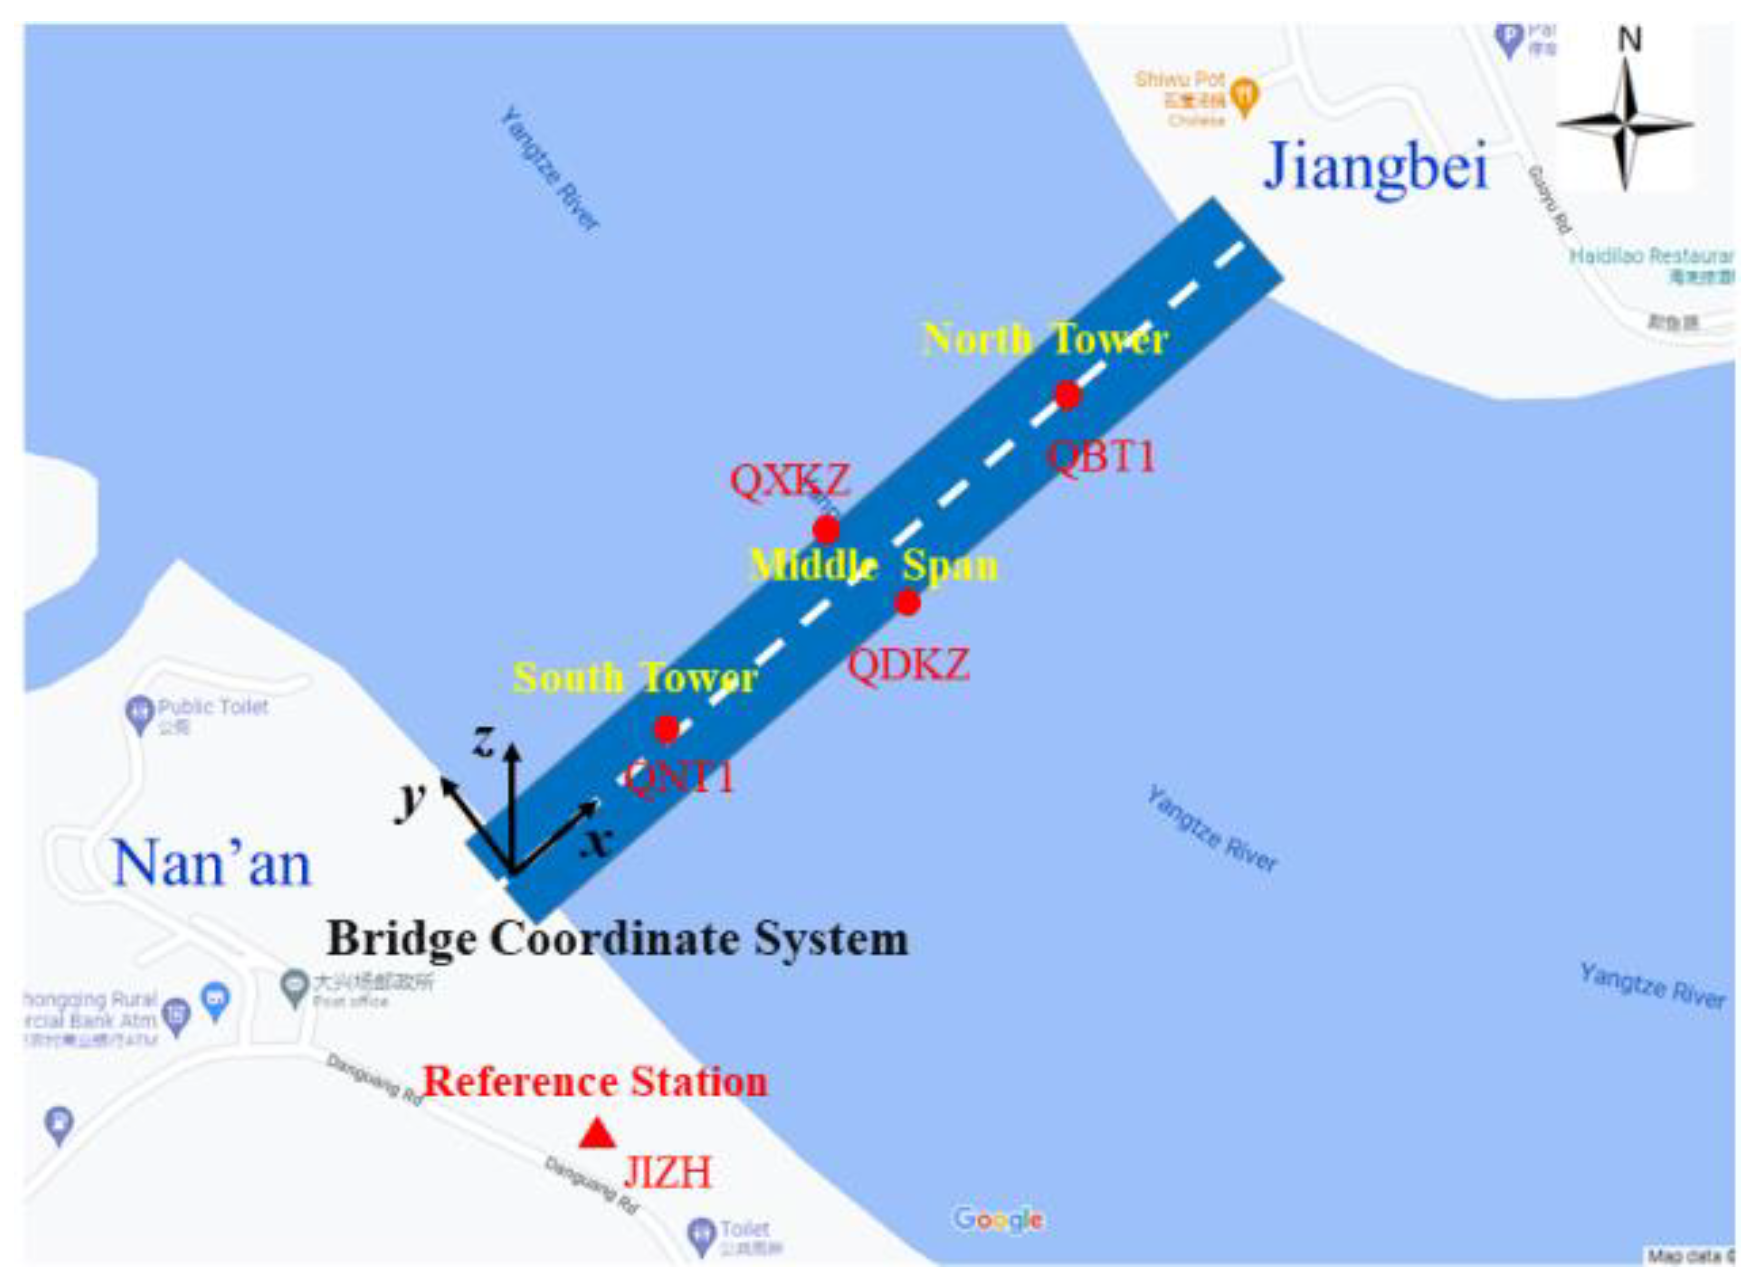
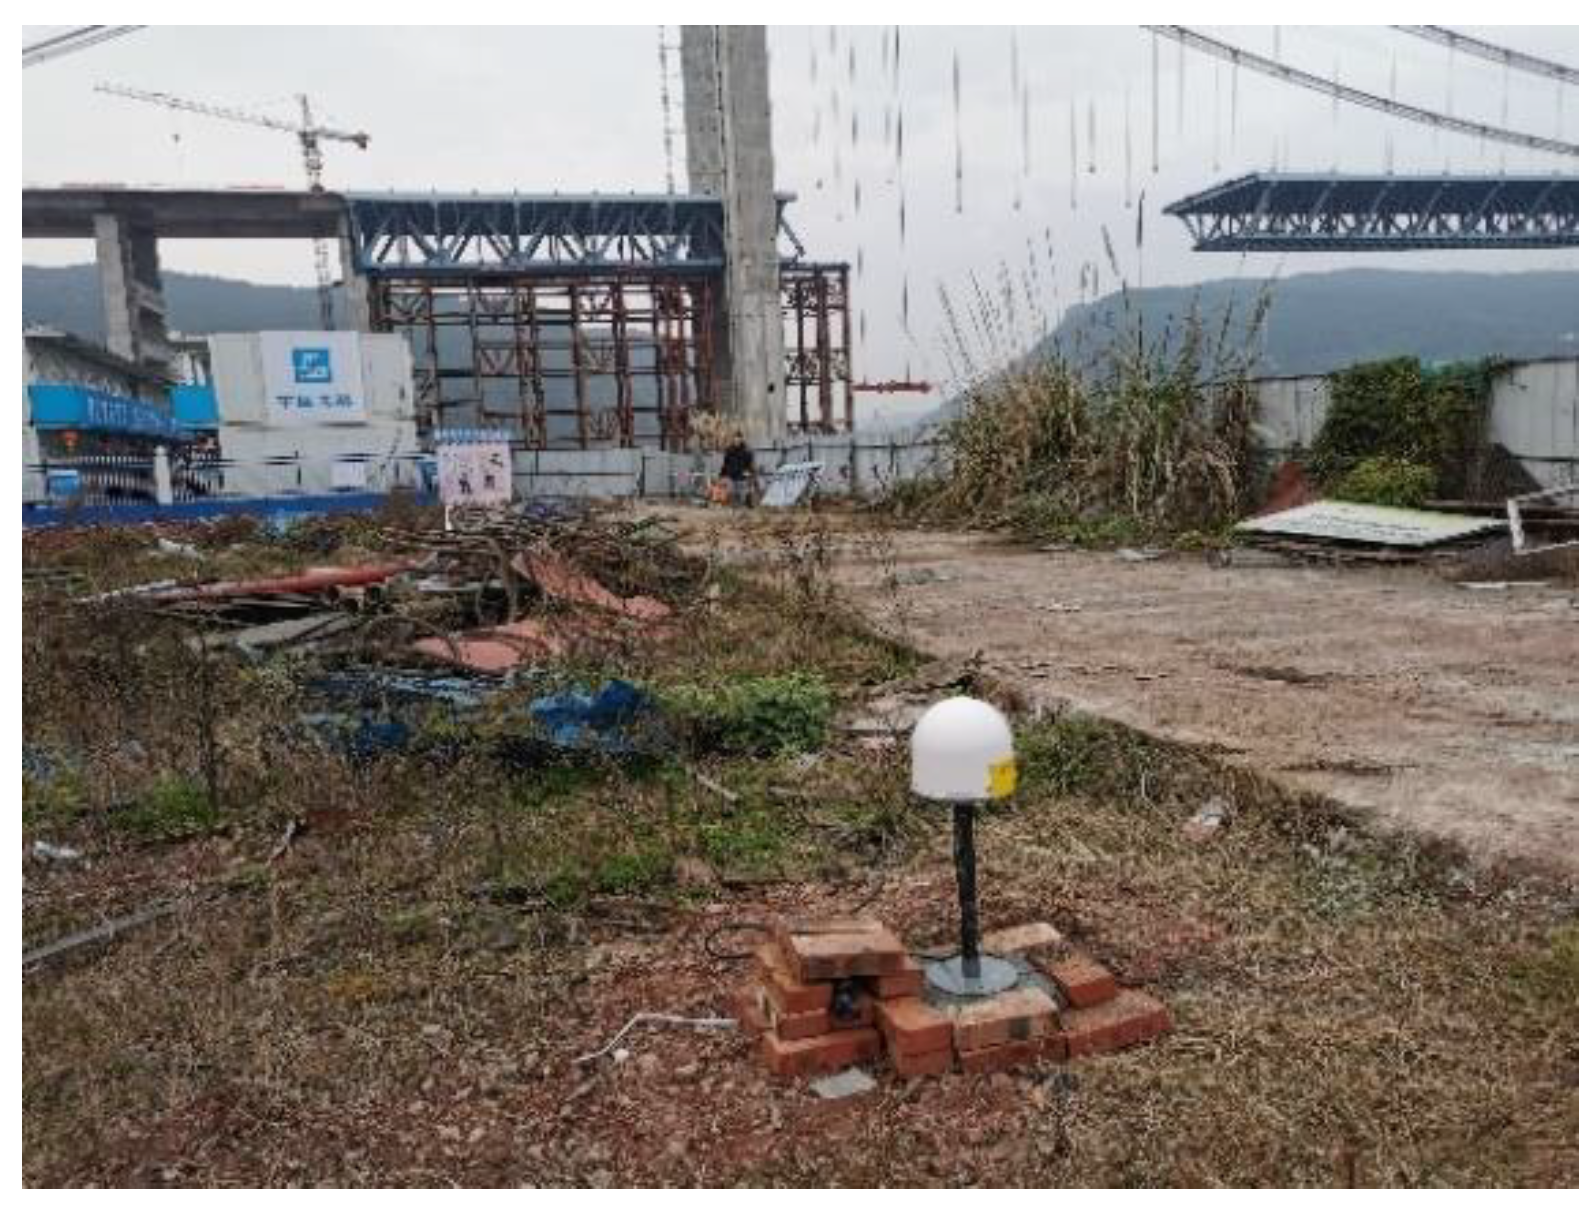
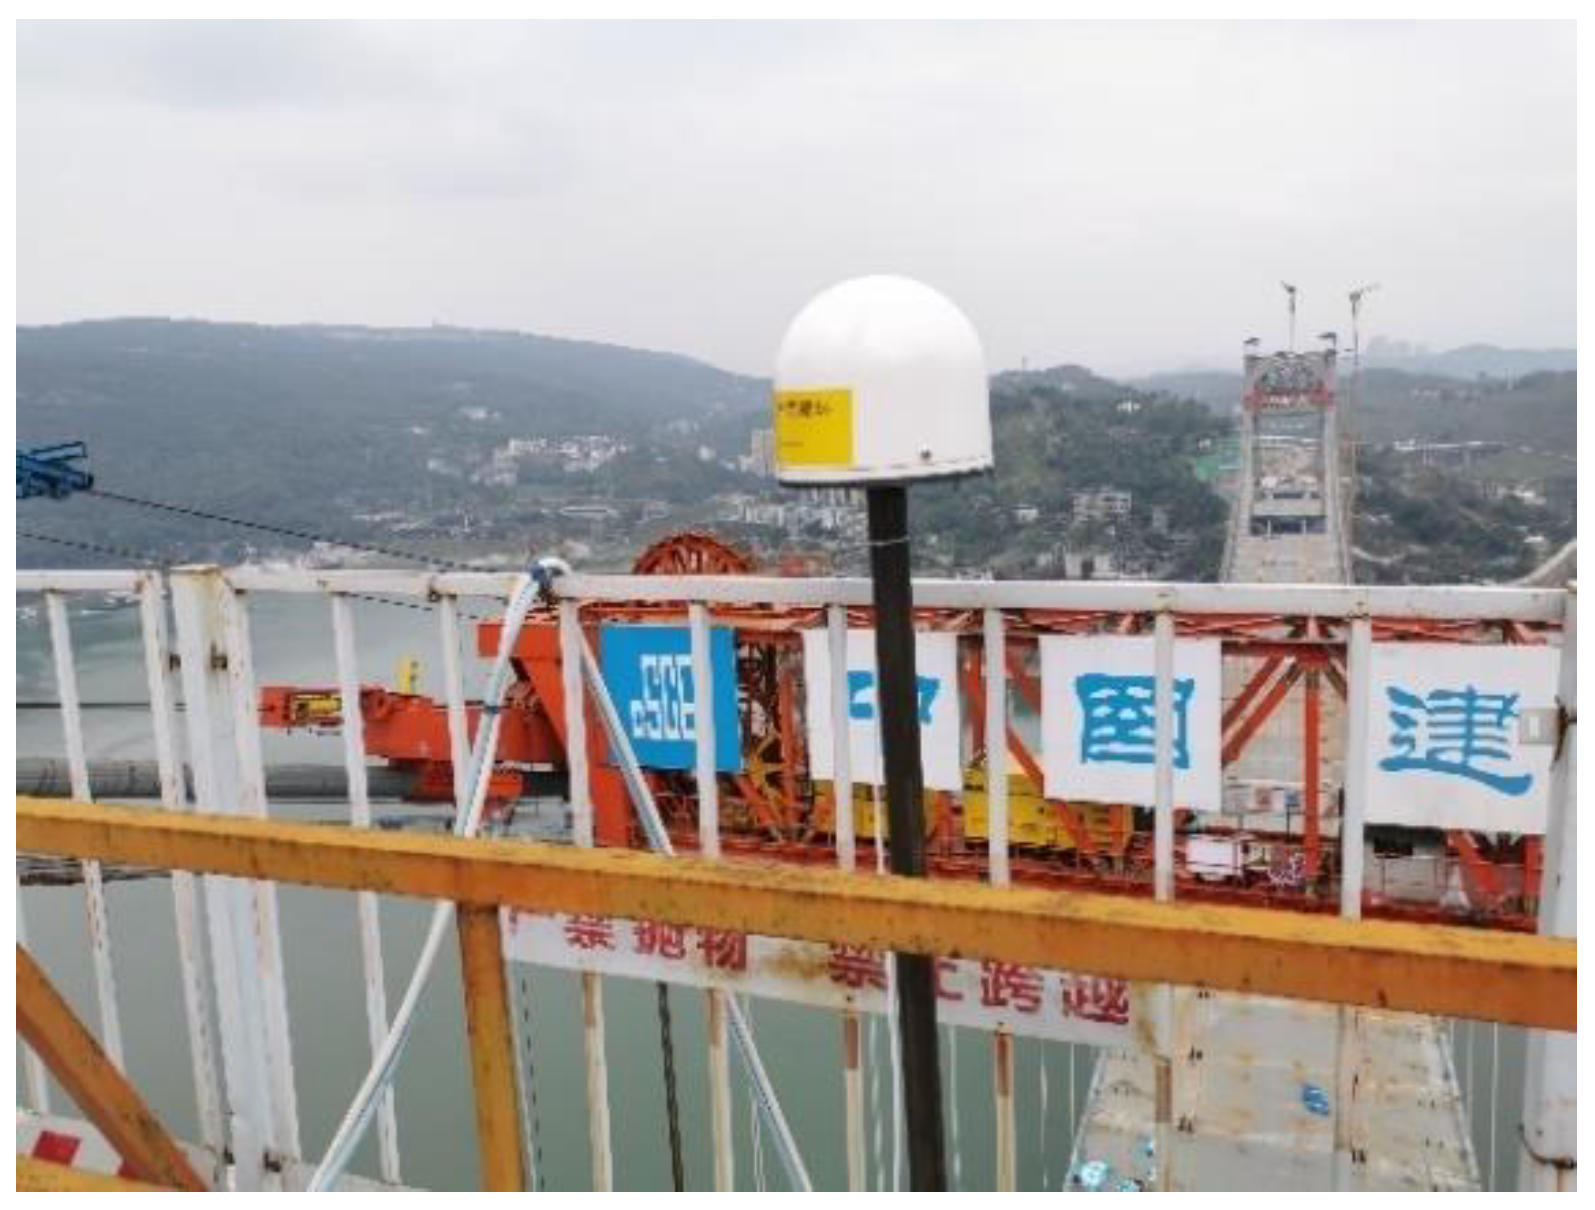
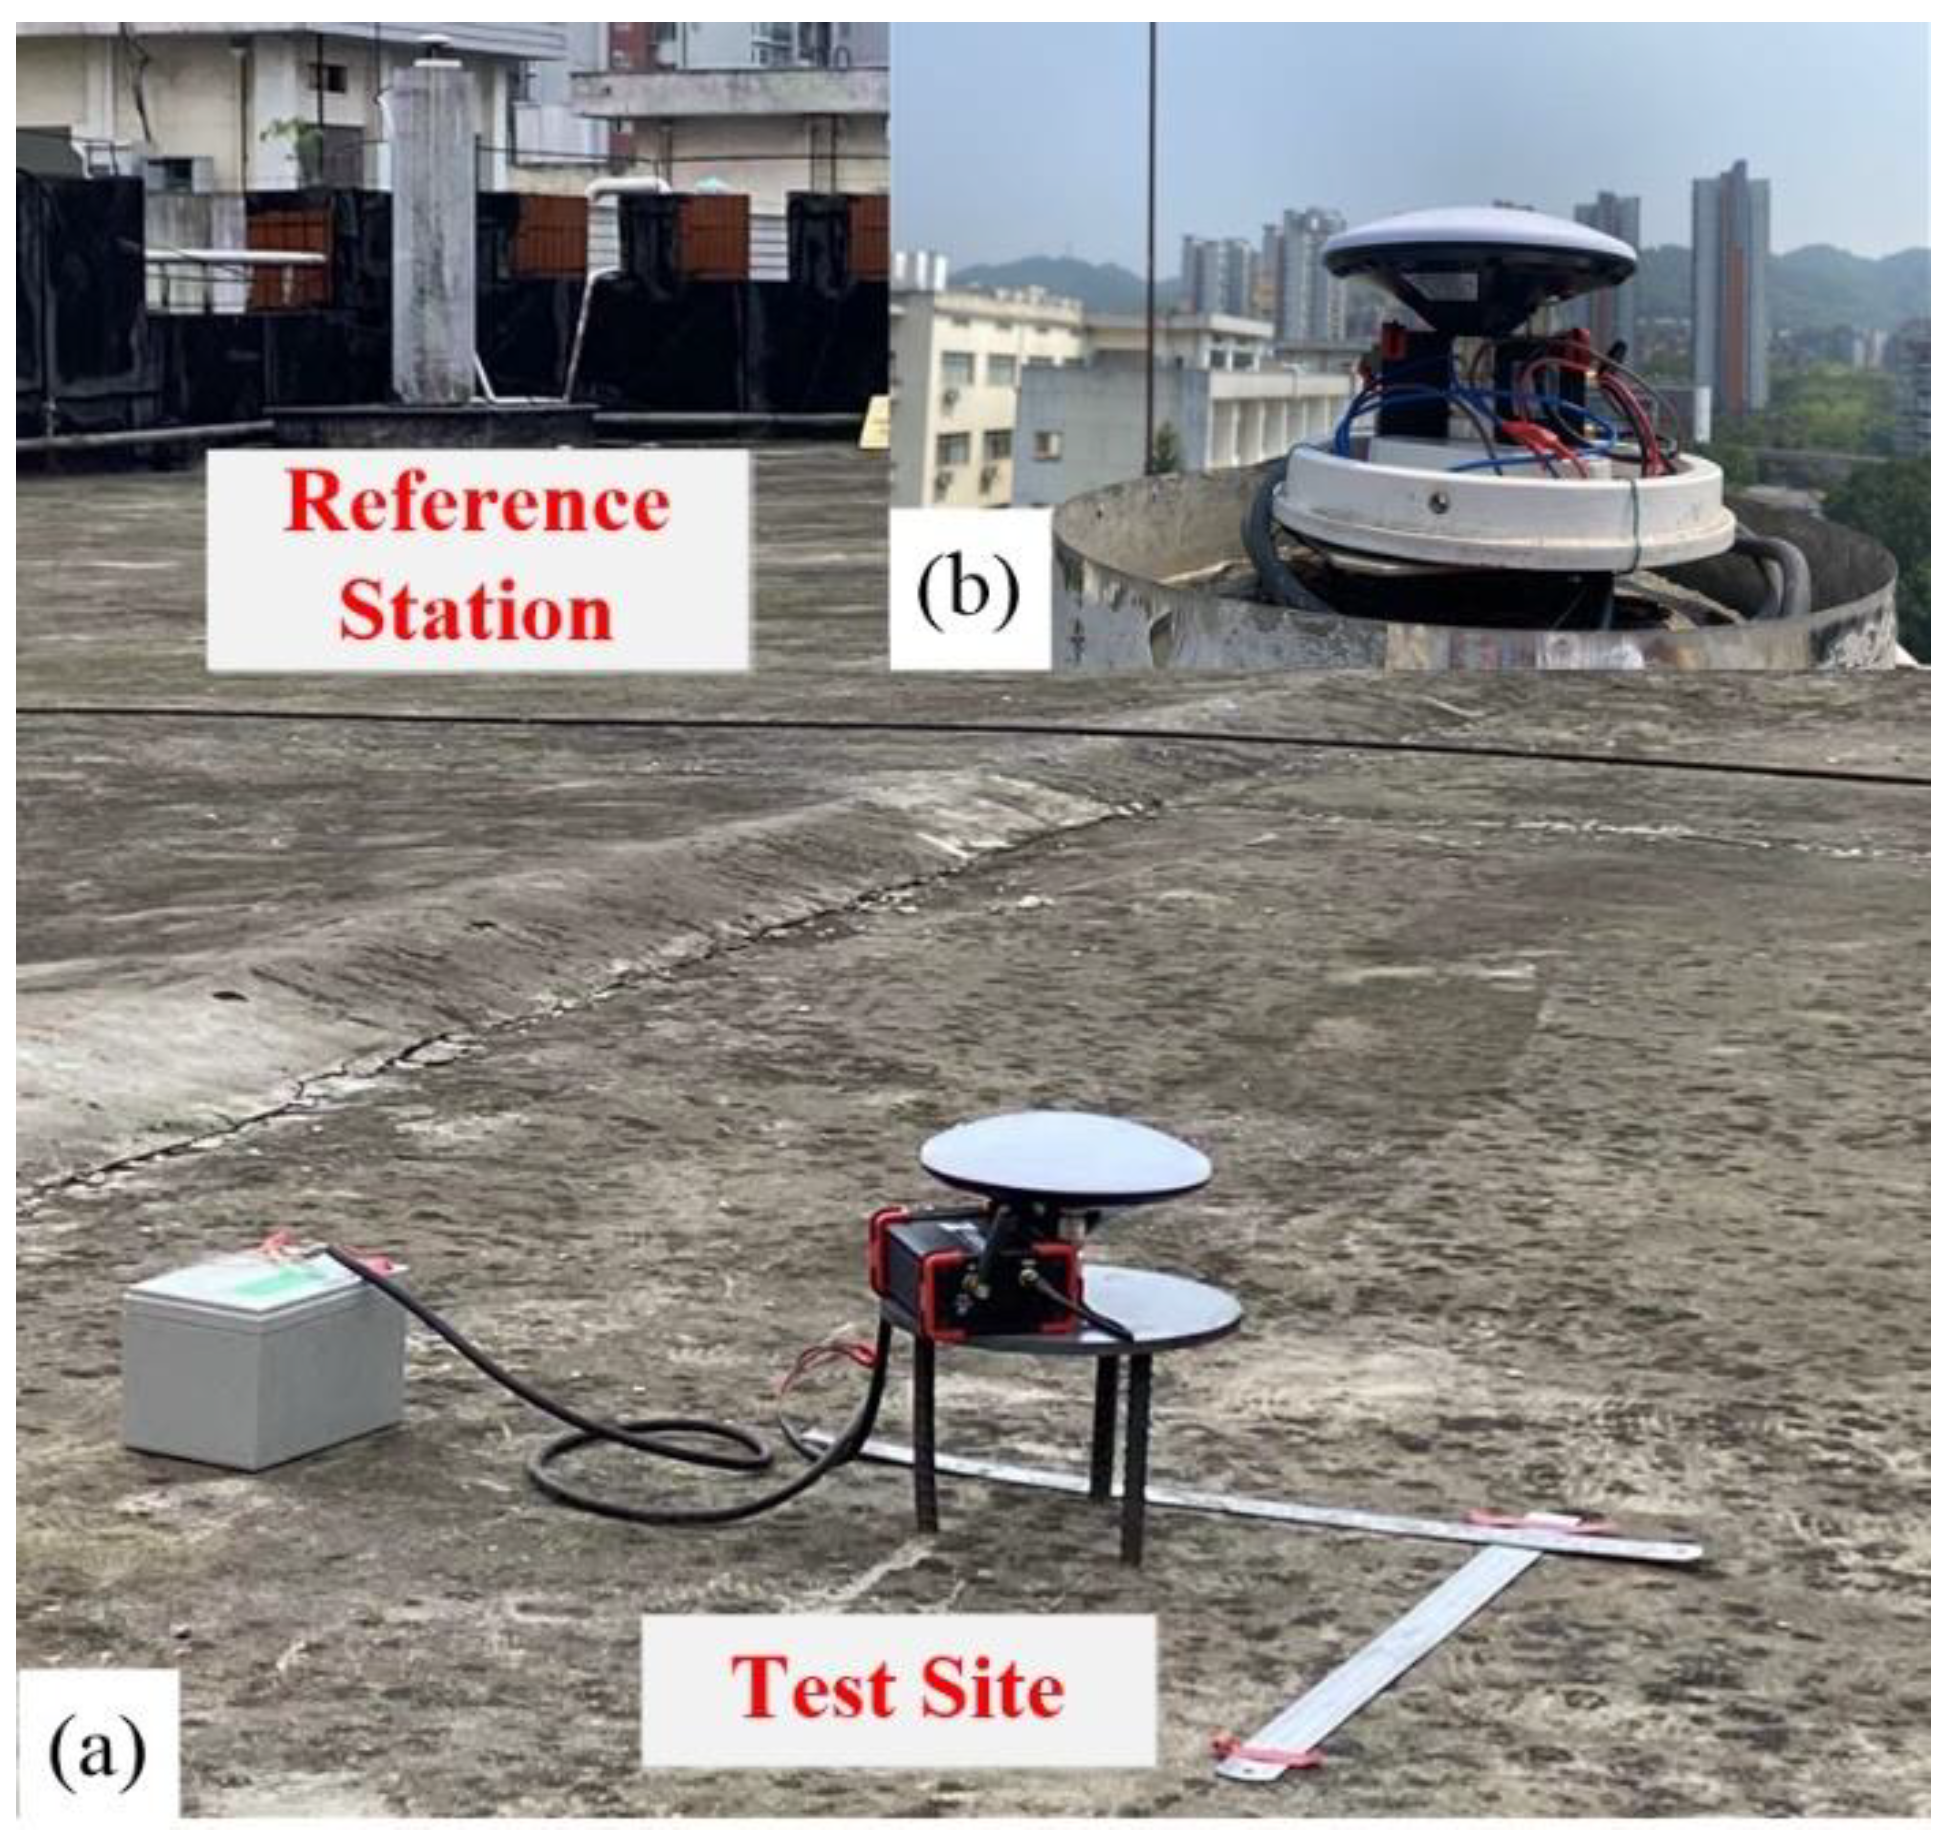
3.2.1. Installation of A Low-Cost GNSS Real-Time Monitoring System for Bridge

We set up four monitoring stations and one reference station. The four monitoring stations are at the top of the south and north tower, the middle span upstream and downstream, respectively. The reference station is located in a stable area about 150 m away from the bridge management buildings. The three-dimensional layout of the low-cost GNSS sensor is shown in Figure 10. The distribution of stations on the bridge is shown in Figure 11. It should be noted that the direction x represents the longitudinal direction, that is the direction of traffic, the direction y represents the lateral direction and z represents the vertical direction in the Bridge Coordinate System (BCS). All the stations are equipped with our low-cost GNSS receivers and antennas, which support tracking BDS, GPS, GLONASS and Galileo satellites. The monitoring stations are set up on the middle span (QXKZ, QDKZ) and on top of the towers (QNT1, QBT1). The photo of base station JIZH is shown in Figure 12, and the photo of the QNT1 station is shown in Figure 13.

3.2.2. Multi-GNSS Integration Positioning Method

In general, the GNSS satellite transfers pseudo-range and carrier phase signals for positioning, navigation and timing (PNT). Due to pseudo-range being easily contaminated by multipath and hardware delays, the bias is significant. As a common practice, only carrier phase observation is used to calculate the displacement. In addition, we use a short baseline solution to achieve high accuracy. The double differenced (DD) technology can eliminate the common delays between a pair of satellites simultaneously tracked by two GNSS receivers [31,32]. In multi-GNSS processing, we have to express the DD observation equation in distance unit and not in phase unit, since the carrier frequencies are not the same. For BDS and GPS systems, which transmit signals in code division multiple access (CDMA) mode, the DD observation can be simply expressed as follows [33],
Δ ϕ m , p q i j = Δ ρ p q i j + λ m Δ N m , p q i j + Δ ε m , p q i j
where i and j represent the common tracking satellites at p and q stations and Δ denotes the DD operator. λ m is the wavelength of frequency m in meters. The phase-range ϕ m is defined as the carrier-phase multiplied by the carrier frequency λ m in meters. ρ represents the geometric distance between the satellite and receiver antenna. N is the ambiguity in the integer cycle. ε is the observation noise of the carrier phase signal in meters. From Equation (1), the common error terms such as the receiver, satellite clock offsets, tropospheric and ionospheric delays are removed by DD solution. Therefore, only position parameters of station and integer ambiguity terms are in the estimation parameter list [34,35].

3.3. Dynamic Deformation Analysis Method

We only consider the time window corresponding to the duration of cable saddle pushing. Thus, the displacement is calculated as in [36],
A = R 1 n s = 1 n R s
where A represents the apparent displacement. R is the raw position in the horizontal or vertical component obtained from the processing of GNSS observations. n is the number of sampling points, and s = 1 , 2 , , n .
To further extract deformation, we apply moving average filter to the time series as in [37,38],
u ( i ) = 1 M j = 0 M 1 z ( i + j )
where z ( ) is the apparent displacement, u ( ) is the output signal and M represents the total number of signal samples.

4. Experiment and Result

4.1. Data Description and Processing Strategy

The dual frequencies (L1 and L2) observations are used with a short baseline (<1 km). To analyze the response of the bridge, we process the data in a kinematic mode using the DD technique. The GNSS data are transmitted and processed by using RTKLIB (version 2.4.3 b34) [39]. RTKLIB software is among the leading software for multi-GNSS processing. To optimize the processing strategies, the users should master good theoretical knowledge and experience in multi-GNSS data processing. Table 3 lists the multi-GNSS data processing strategies. In the RTKLIB software, there are three methods for ambiguity resolution in kinematic mode: (1) fix and hold; (2) continuous; (3) instantaneous [40]. The first two methods use the Kalman filtering method to obtain a continuous solution. Meanwhile, the instantaneous mode uses the integer least squares method to fix the ambiguity epoch by epoch. In this study, we use the instantaneous strategy which is also adopted by the leading GNSS processing software (i.e., Bernese). More importantly, it is more easily applied in real-time GNSS processing applications. In addition, only BDS and GPS are used due to GLONASS and Galileo having a marginal effect on the positioning performance. Hence, the investigation is applied to three GNSS solutions: (1) BDS-only, (2) GPS-only, and (3) Multi-GNSS, combining BDS and GPS. In addition, we also use Leica MS60 to measure the displacement of the tower with prisms installed on the top of the tower.
Real-time and synchronization are both important in the process of bridge structure trial monitoring. According to the document BeiDou navigation satellite system open service performance standard (version 3.0), which is an official document released by the China Satellite Navigation Office [41], BDS is reported to be providing a global PNT service, which supports timing accuracy better than 20 ns. The 5th Edition of the GPS Standard Positioning Service (SPS) Performance Standard, dated April 2020, demonstrates that SPS time accuracy of GPS is lower than 30 ns [42]. This is high precision in terms of timing accuracy. The different measurement points receive the observation data from navigation satellites synchronously, which can guarantee the time synchronization.
In the experiment, the sampling rate of low-cost receivers is set to 1 Hz. The detailed information on stations is listed in Table 4. Additionally, for bridge monitoring stations, the three dimensional GNSS coordinates system (N, E and U) are transformed into the local BCS as shown in Figure 11 (longitudinal-x, transverse-y and longitudinal-z) by using linear transformations.

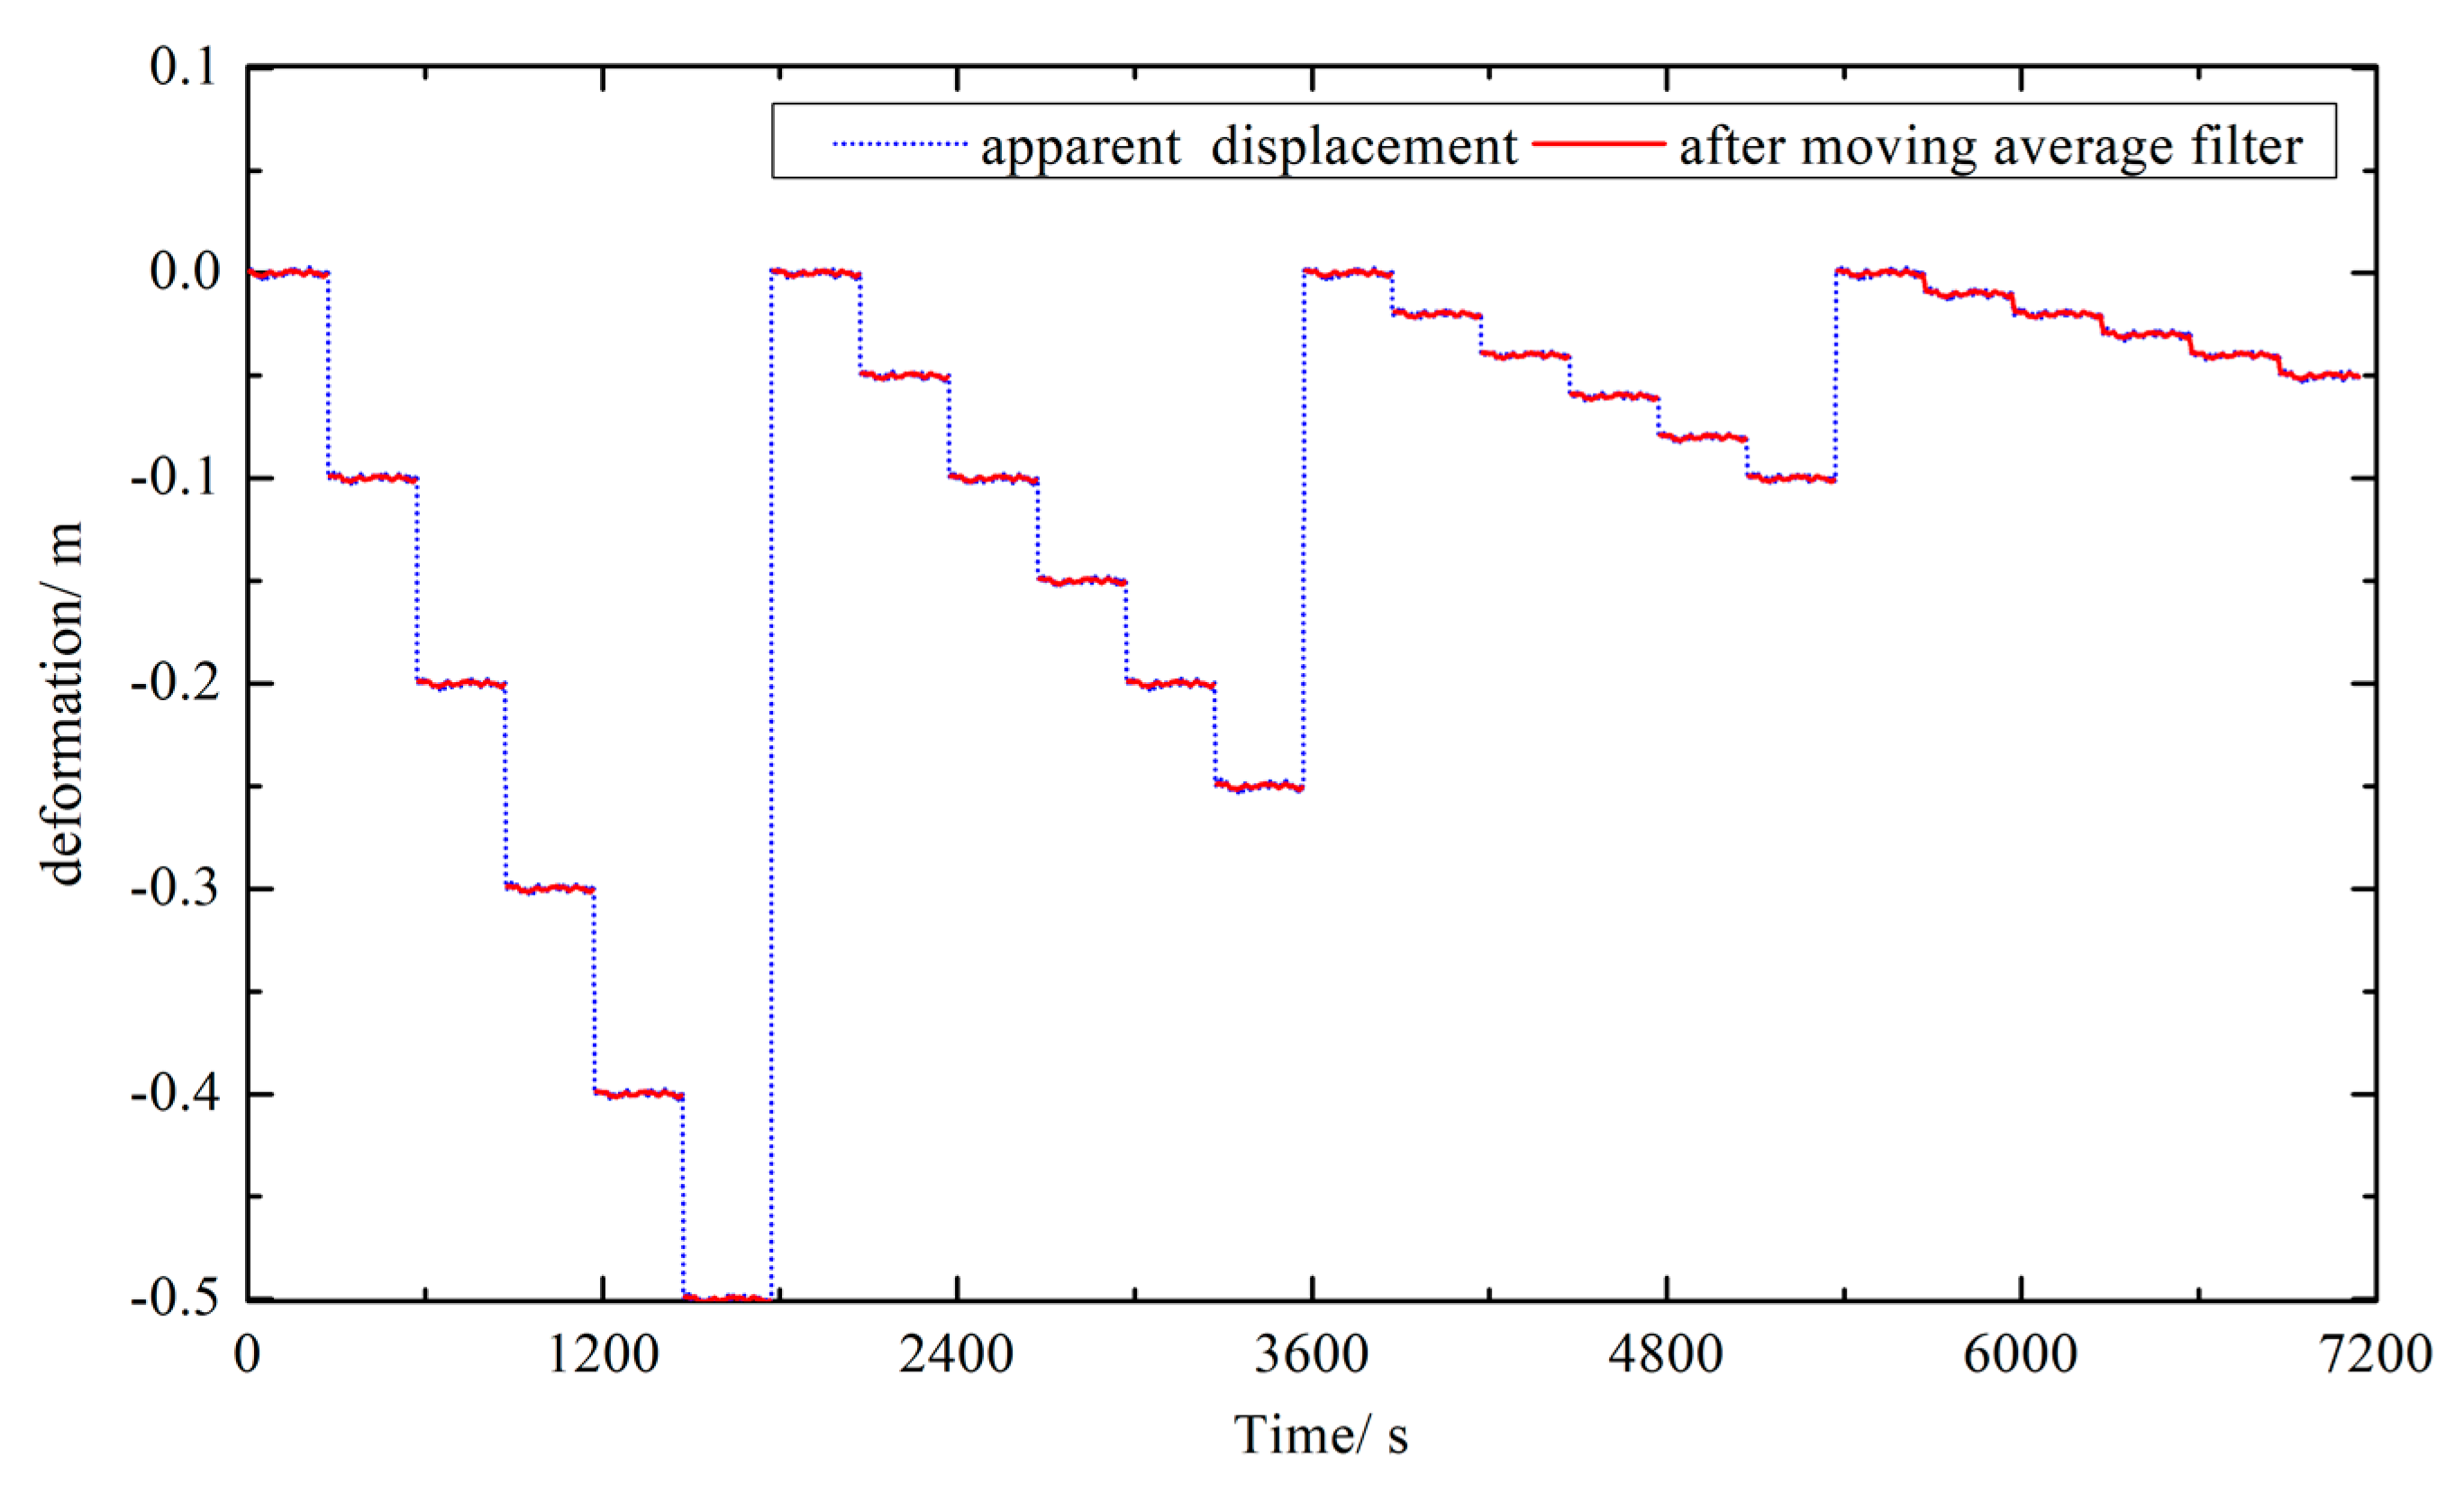
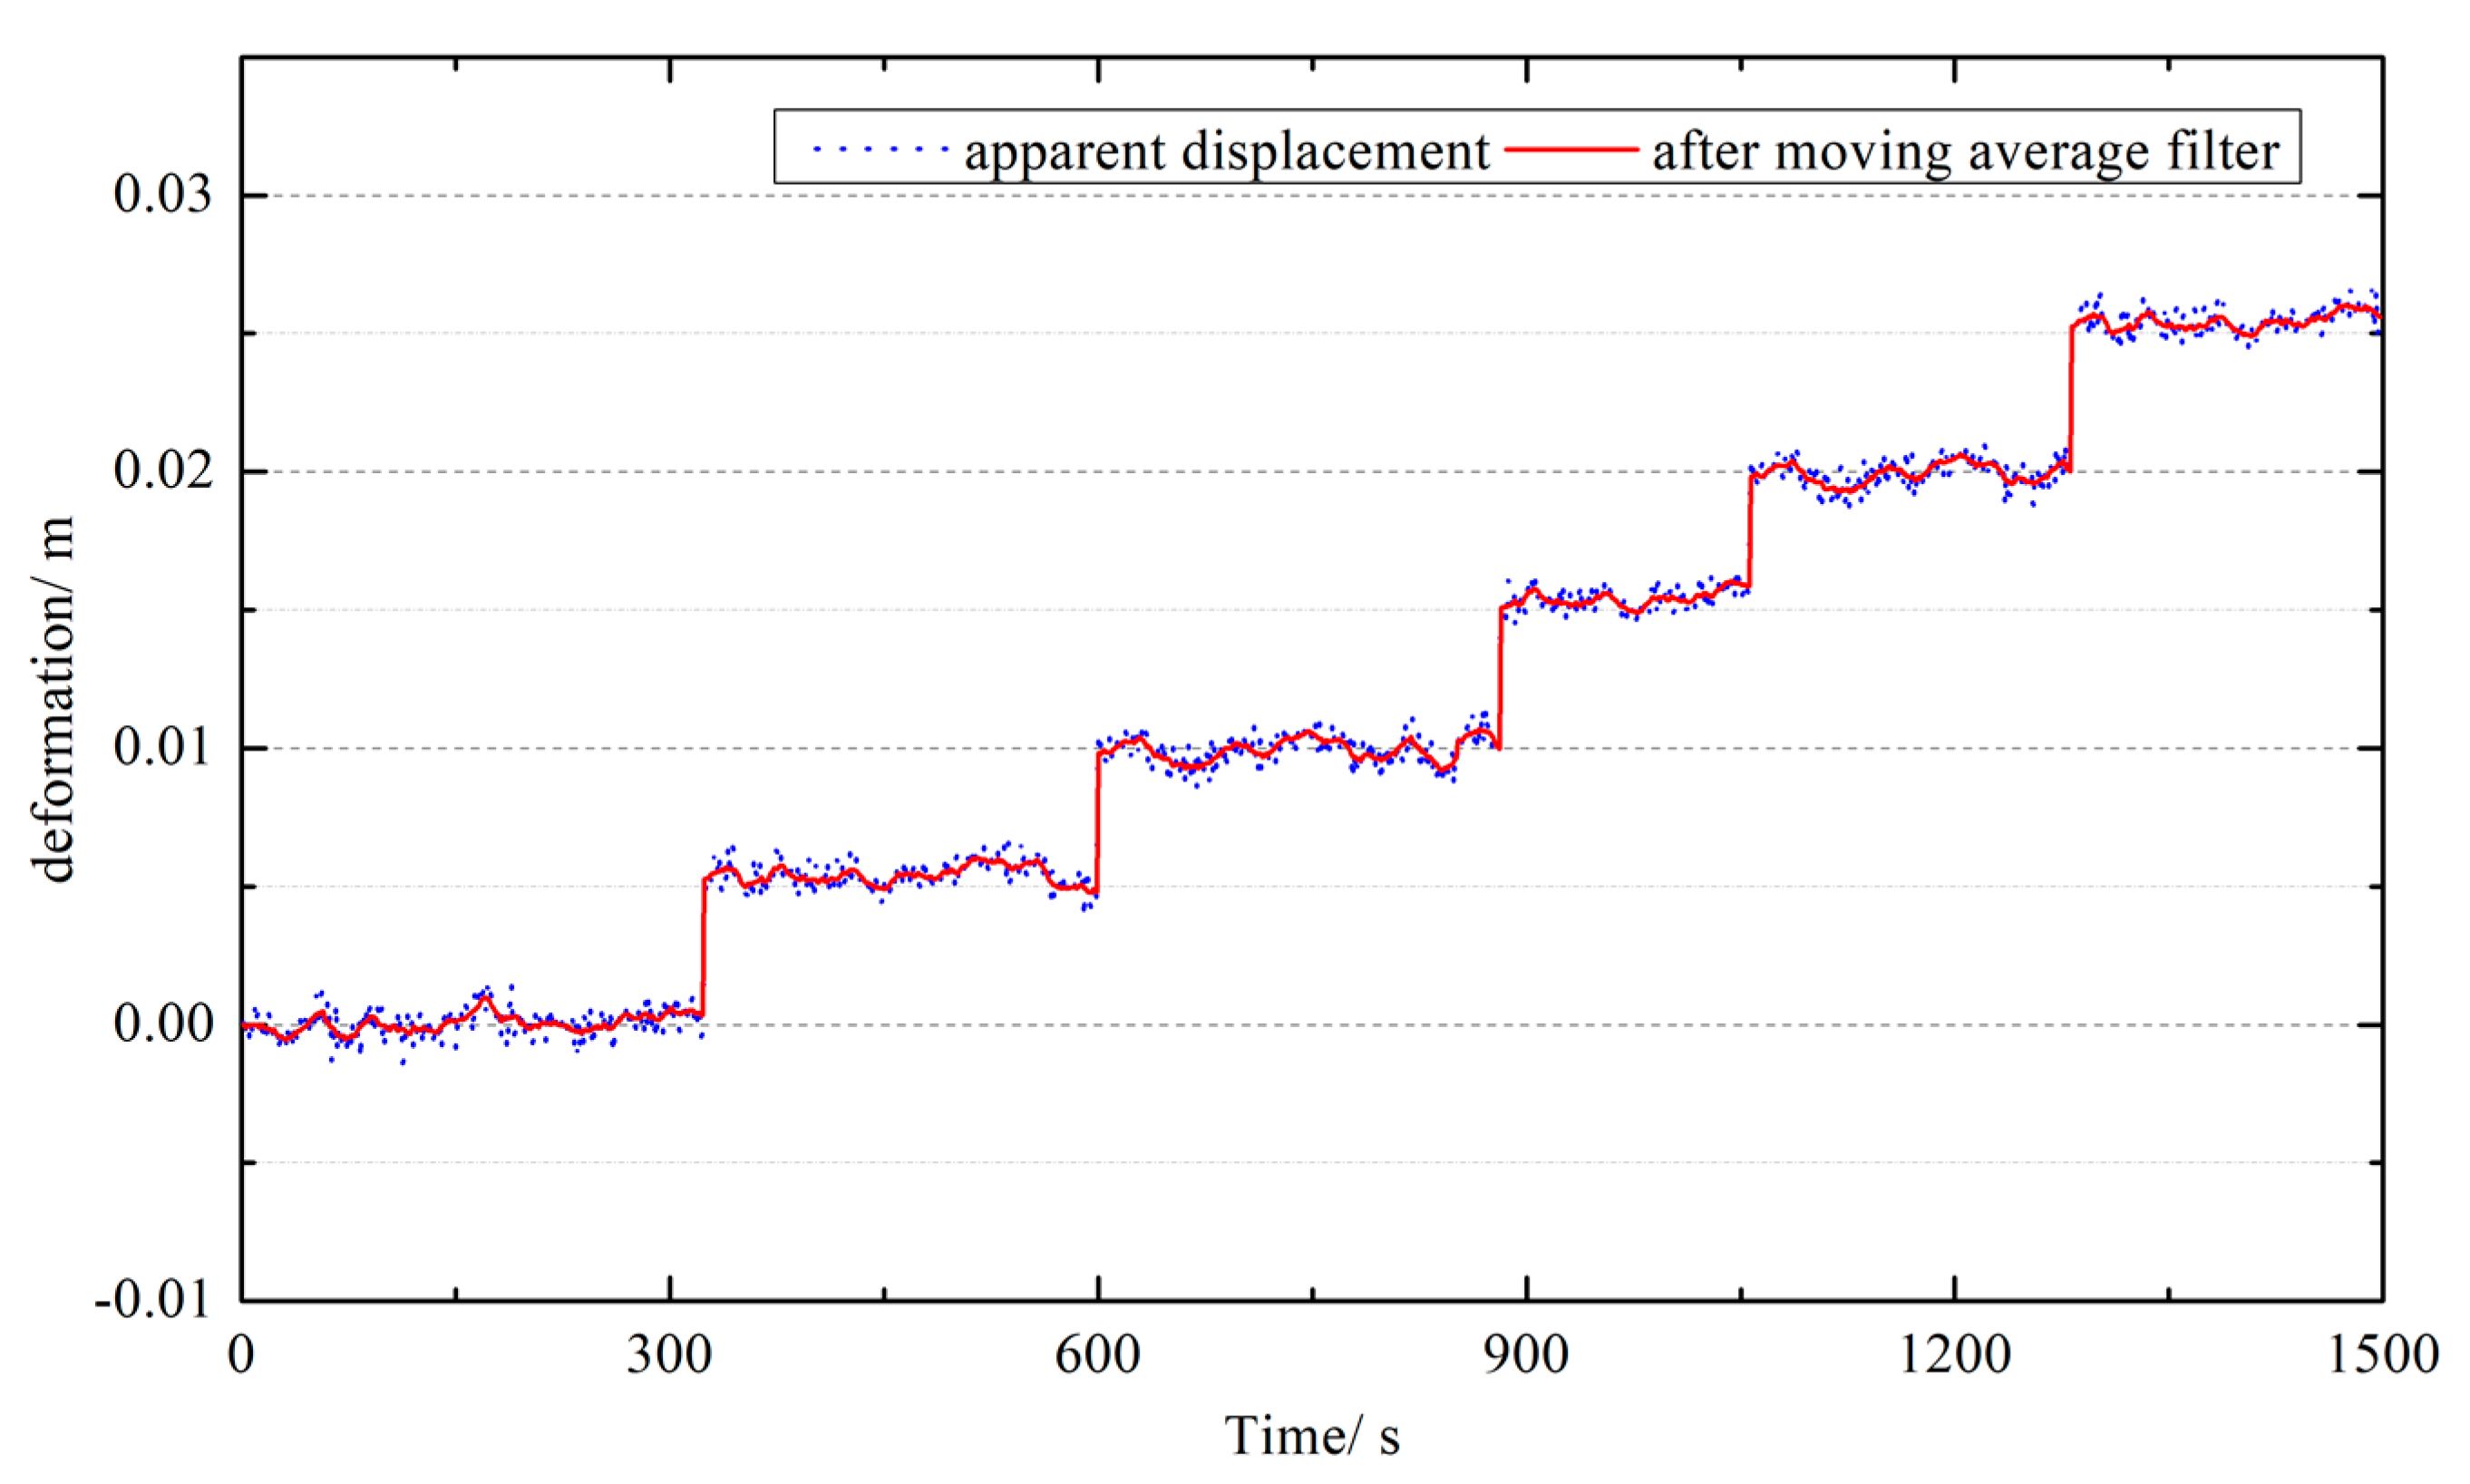
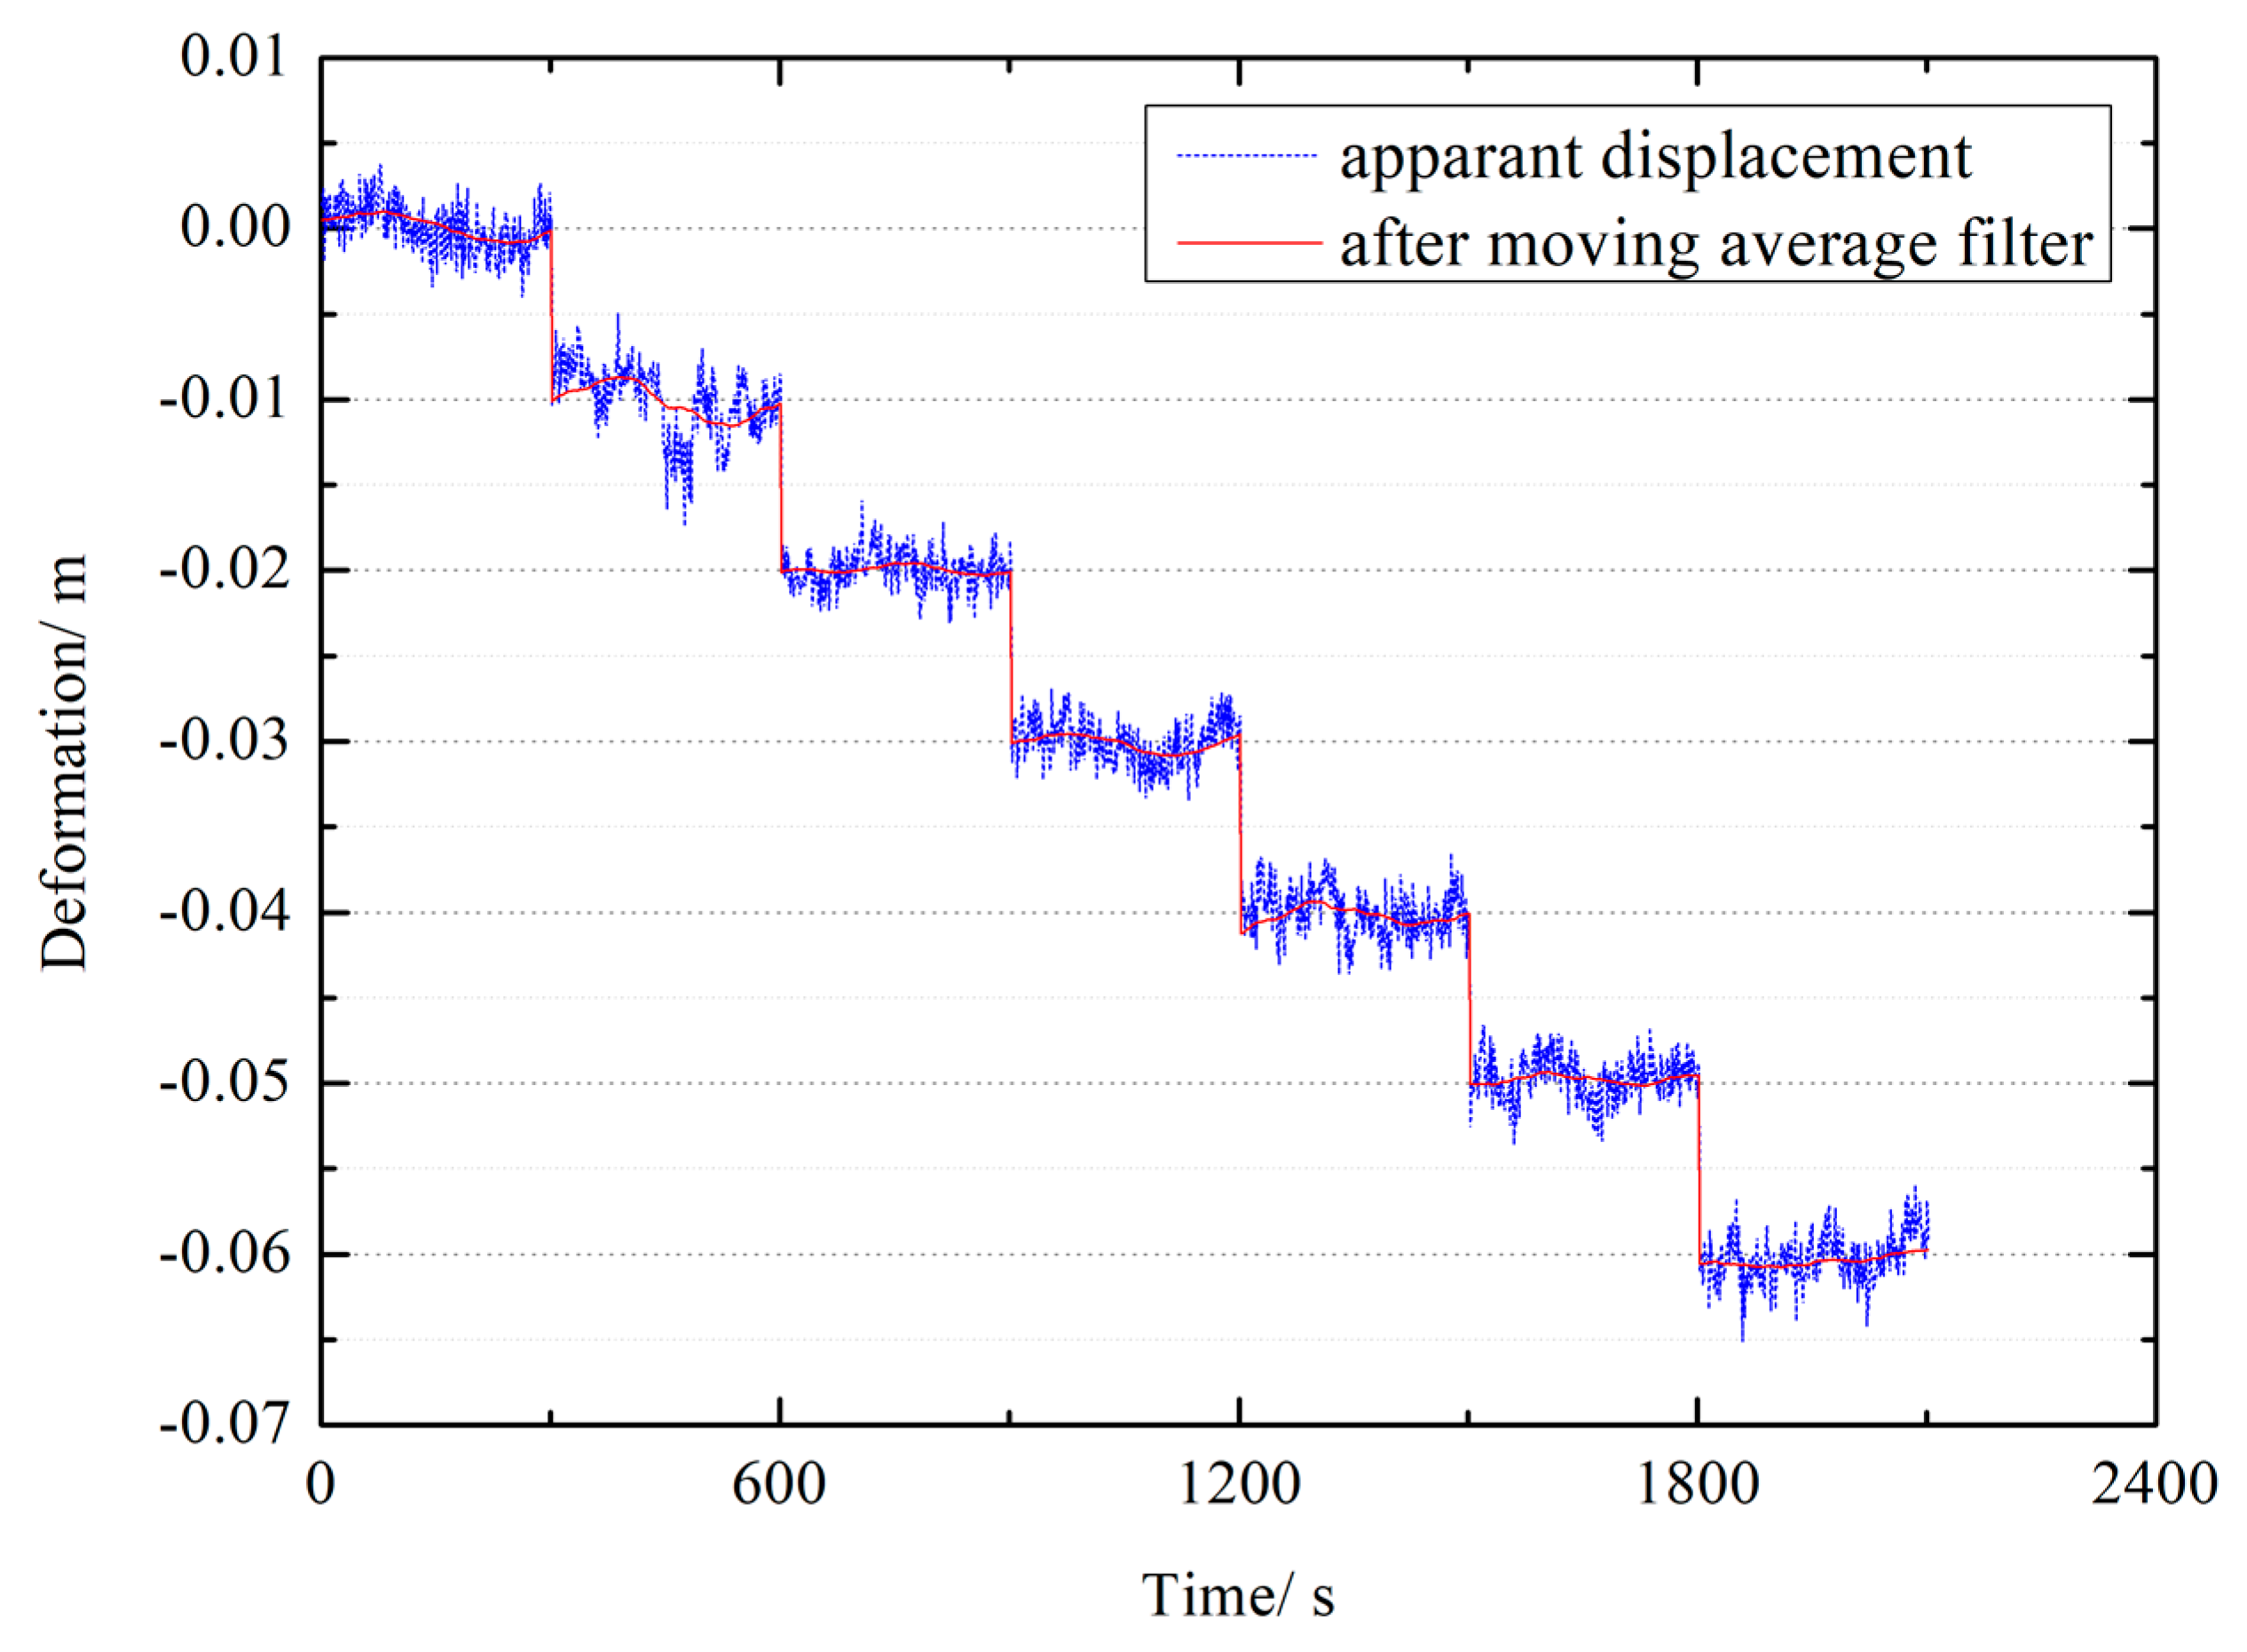
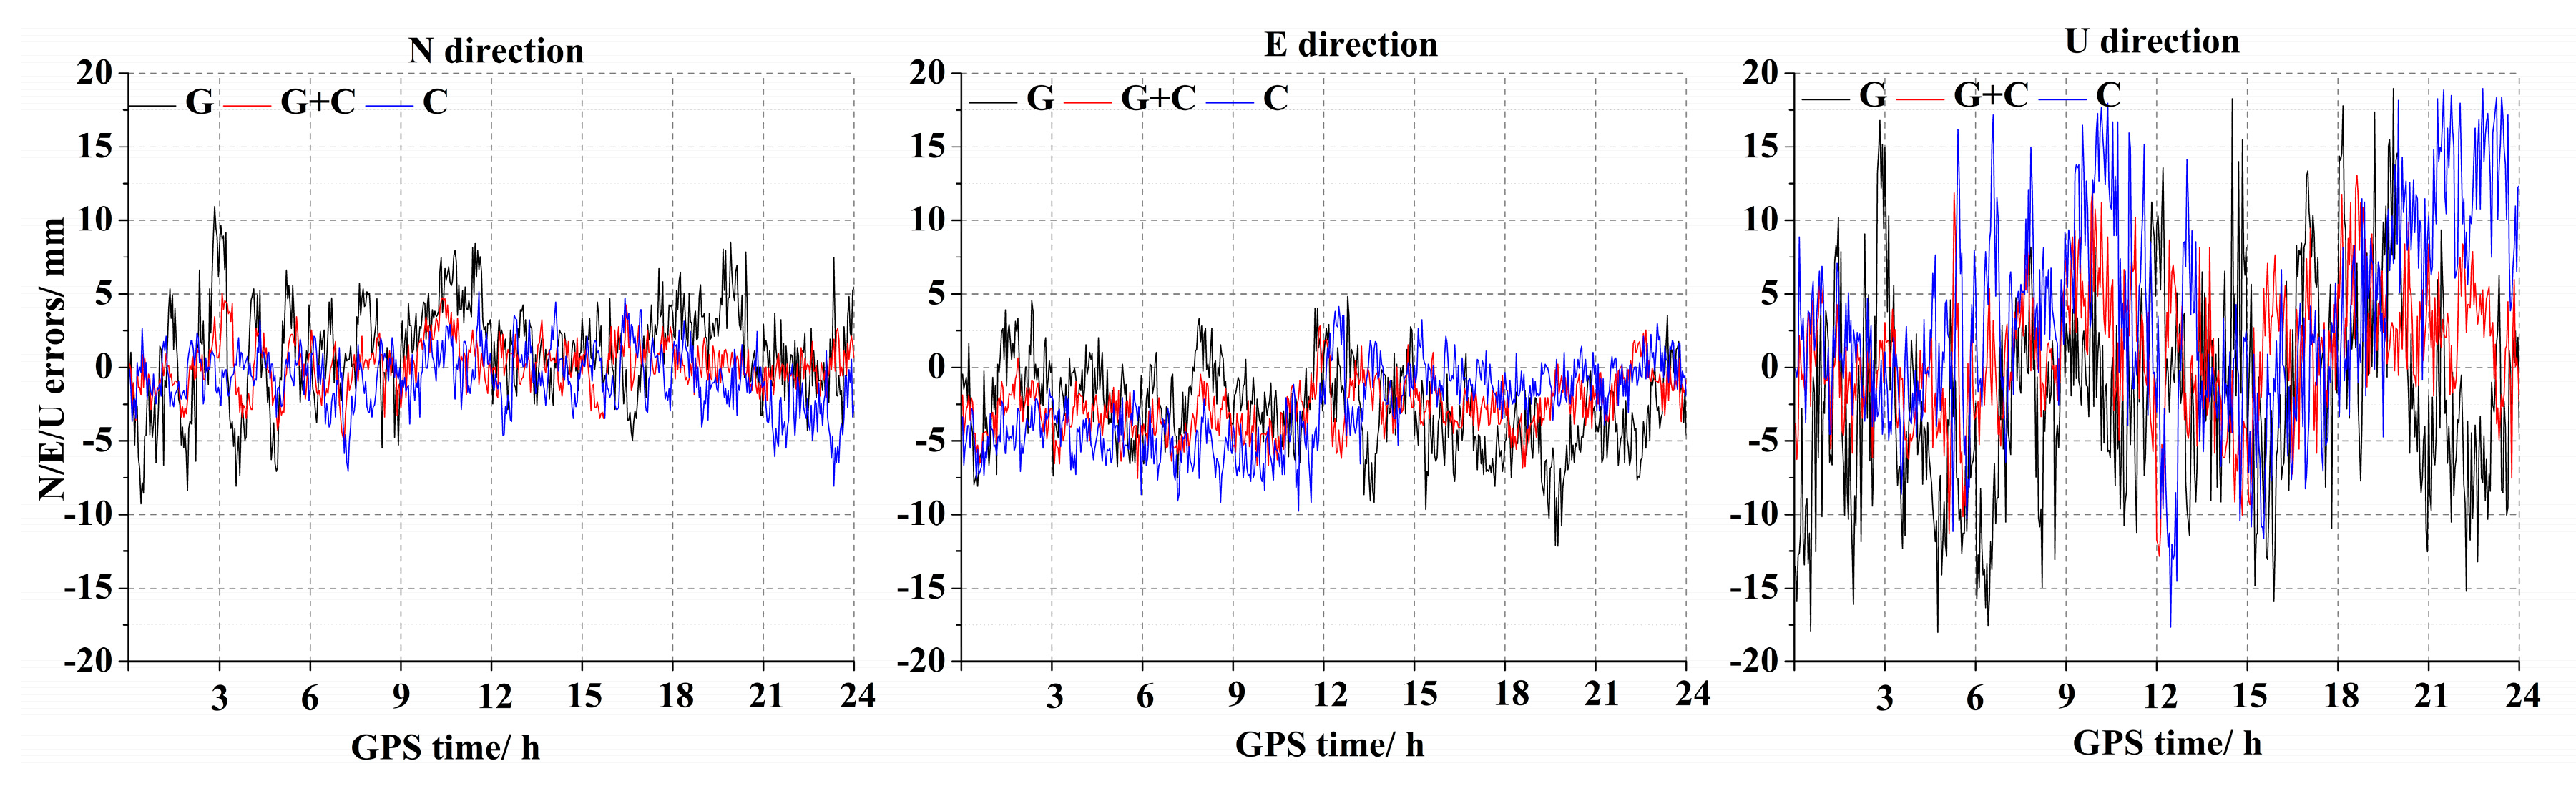
4.2. Real-Time Dynamic Performance of Low-Cost GNSS Sensors

Generally speaking, GNSS are effective at tracking motions with slow speed. However, fast and small movements usually occur in a bridge structure. Consequently, we check their response to quick and short movements.
The test site is located about 50 m away from the reference station (Figure 14). The two sites are deployed with the proposed low-cost GNSS sensors. To investigate horizontal displacements, two metal scales (half-millimeter graduation) are crossed vertically. The antenna for the test site moves in an east-west direction. We fix the antenna for the test site on a metal plate. The antenna of the reference station is fixed on the top of a concrete pillar.
The antenna of the test site is shifted repeatedly over distances ranging from 10 cm to 5 mm, five times per distance. Figure 15 shows the response of the test site to sudden quick and short horizontal movements. The movements of 10 cm, 5 cm, 2 cm and 1 cm are repeated 5 times respectively with a time lap of 5 min. The results are summarized in Table 5. Considering the high success rate of the minimum movement (1 cm), a further test is conducted with the distance ranging from 10 mm to 3 mm to check the smallest deformation size that could be detected. The time laps were also 5 min. Figure 16 shows the response to a sudden tiny moving distance (5 mm). Table 6 summarizes the evaluation of shift from 10 mm to 3 mm. We can detect the smallest shifted horizontal distance of 3 mm with a high success rate (80%). Finally, we check the response of low-cost GNSS sensors to vertical abrupt movement with steps of 10 cm, 5 cm, 2 cm, 1 cm and 7 mm (see Table 7). We shifted repeatedly five times per distance with time laps of 5 min. We show the low-cost GNSS response to a tiny shift (1 cm) in Figure 17. Table 7 summarizes the result of a vertical shift from 10 cm to 7 mm. The minimum vertical shift size of 7 mm could be detected with an encouraging success rate (70%). In conclusion, when we process the low-cost GNSS sensor records in real-time, using ambiguity solution with instantaneous strategy and Kalman filter with forward direction, with a high success rate, 3–5 mm horizontal displacements and 7 mm–1 cm vertical displacements can be detected. We can detect and determine sub-centimeter quick motions by using the proposed low-cost GNSS sensors with a short baseline solution. This demonstrates that the proposed low-cost GNSS sensor can monitor the healthy state of large-span bridges with enough accuracy.

4.3. Real-Time Static Positioning Performance of Low-Cost GNSS Sensors

Based on the RTKLIB software, the results of every system combination are obtained by using the multi-GNSS integration method mentioned above. We can successfully fix the ambiguities within about 10 epochs. This is justified because the baselines are short and the constraint of a priori coordinates of bridge monitoring points is set to 2 m. After moving the baseline average value from the time series, the baseline residual is obtained and then shown in Figure 18. To obtain the precision of low-cost GNSS positioning, we build the N/E/U coordinate system in the station local frame instead of BCS, which is shown in Figure 11.
In Figure 18, the residual time series of multi-GNSS is better than the individual single system. For the result of the BDS/GPS combination, the fluctuation of time series in the horizontal direction is within 5 mm, except for a few outliers. For QNT1, usually the time series of all the system combinations is within 10 mm. The multi-GNSS solution posses a more precise time series than a single BDS/GPS. It is justified because of the increased number of satellites and the significantly improved geometry of the satellite constellation. The few large outliers exist in the time series because the station surroundings, such as the tower crane, block the GNSS satellite signals and thus weaken the geometric strength.
To further analyze the multi-GNSS precision, Table 8 lists the maximum and minimum value and STD of the residual time series. The result of multi-GNSS is shown in bold. From Table 8, the extremely large errors are all shown with large STDs. It is clear that multi-GNSS solutions could have better performance than a single system. Meanwhile, the multi-GNSS achieves the lowest errors and smallest STD. In addition, the main improvement of the multi-GNSS solution is in the north direction. It is justified because GPS-only is weak in the high latitude measurement. Meanwhile, GNSS is most susceptible to the high noise level in altimetry. Table 9 lists the average values of the baseline by applying BDS, GPS and multi-GNSS solutions, respectively. Mostly, the discrepancy between different solutions is within 3 mm.

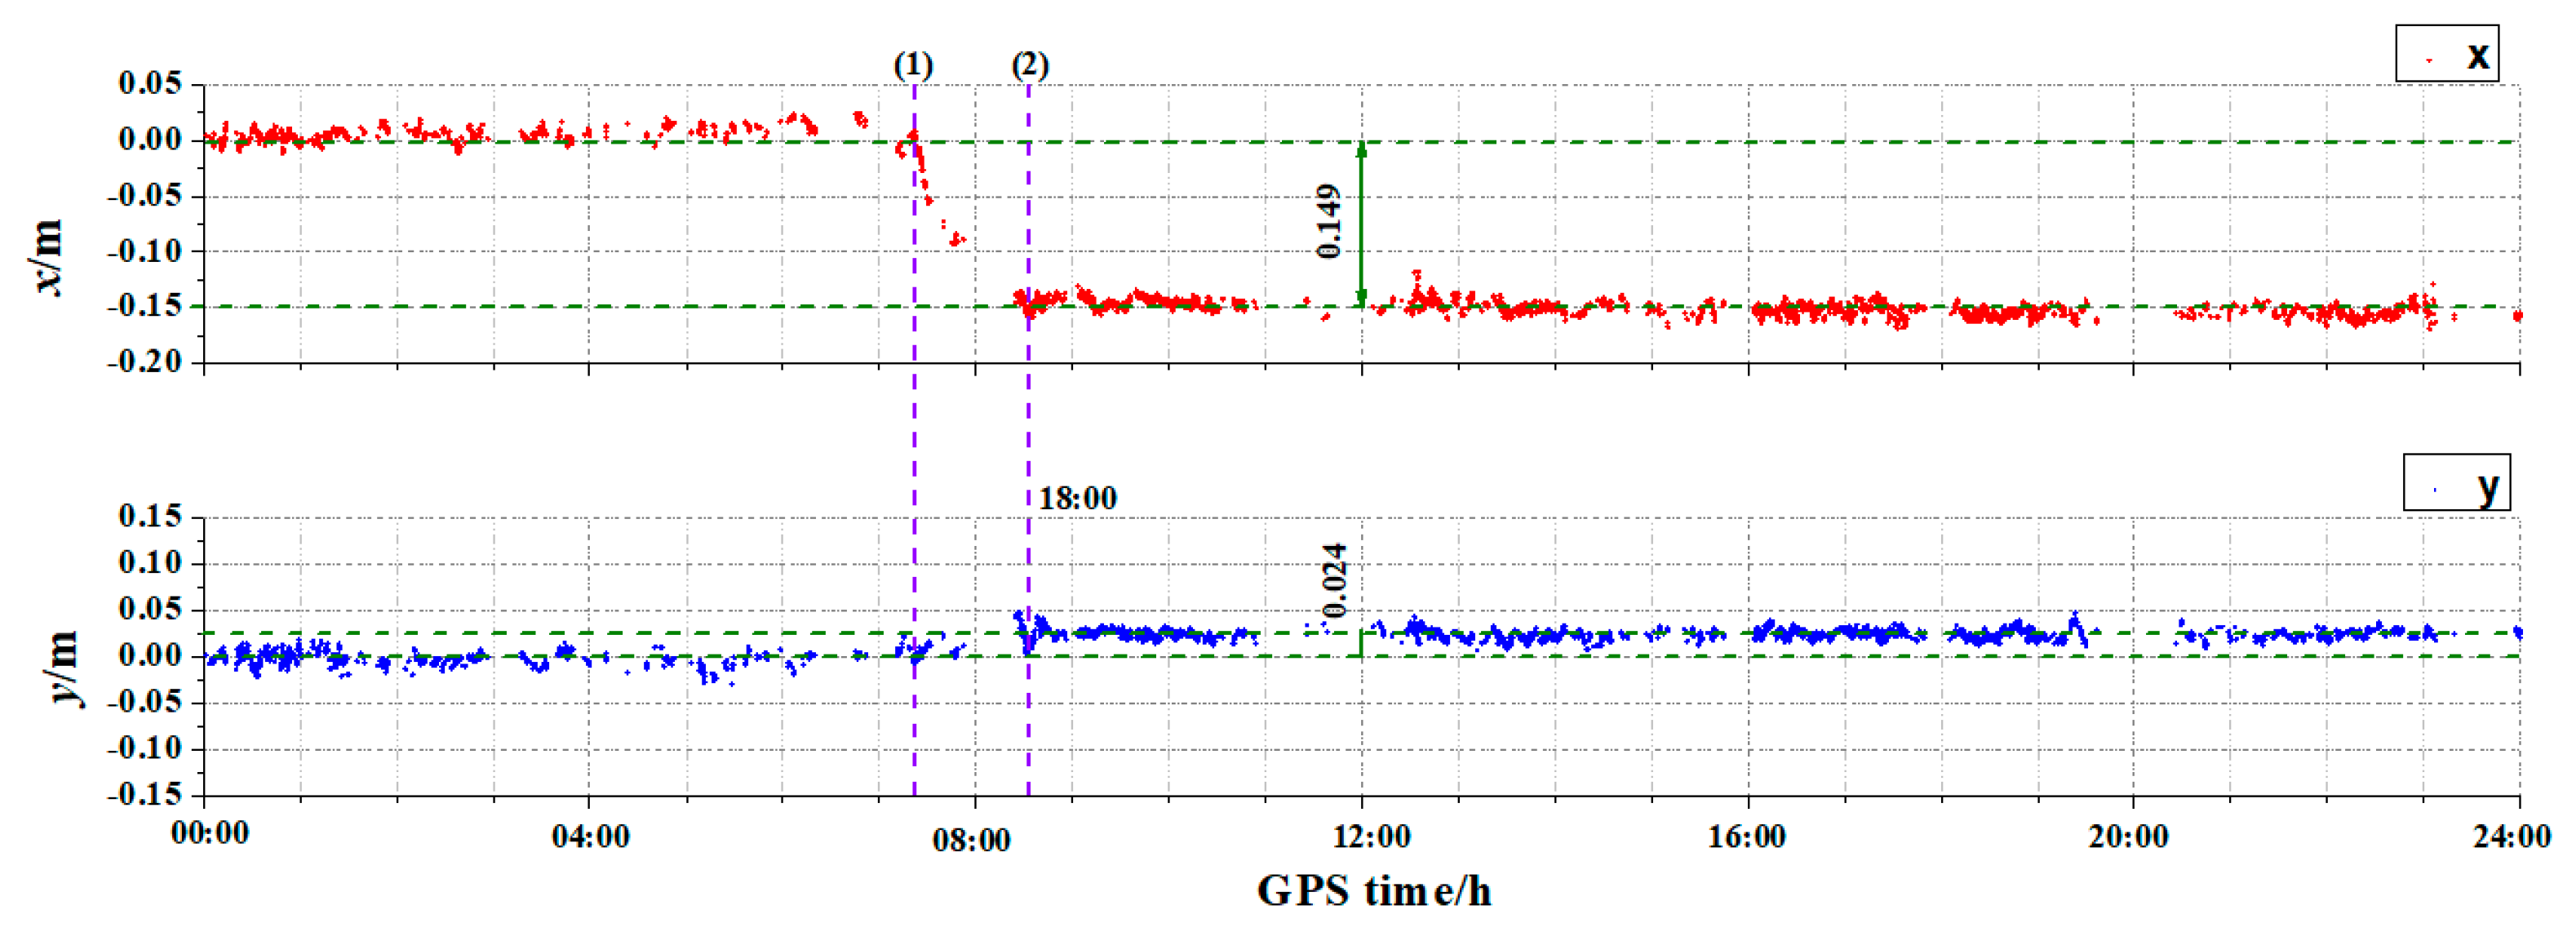
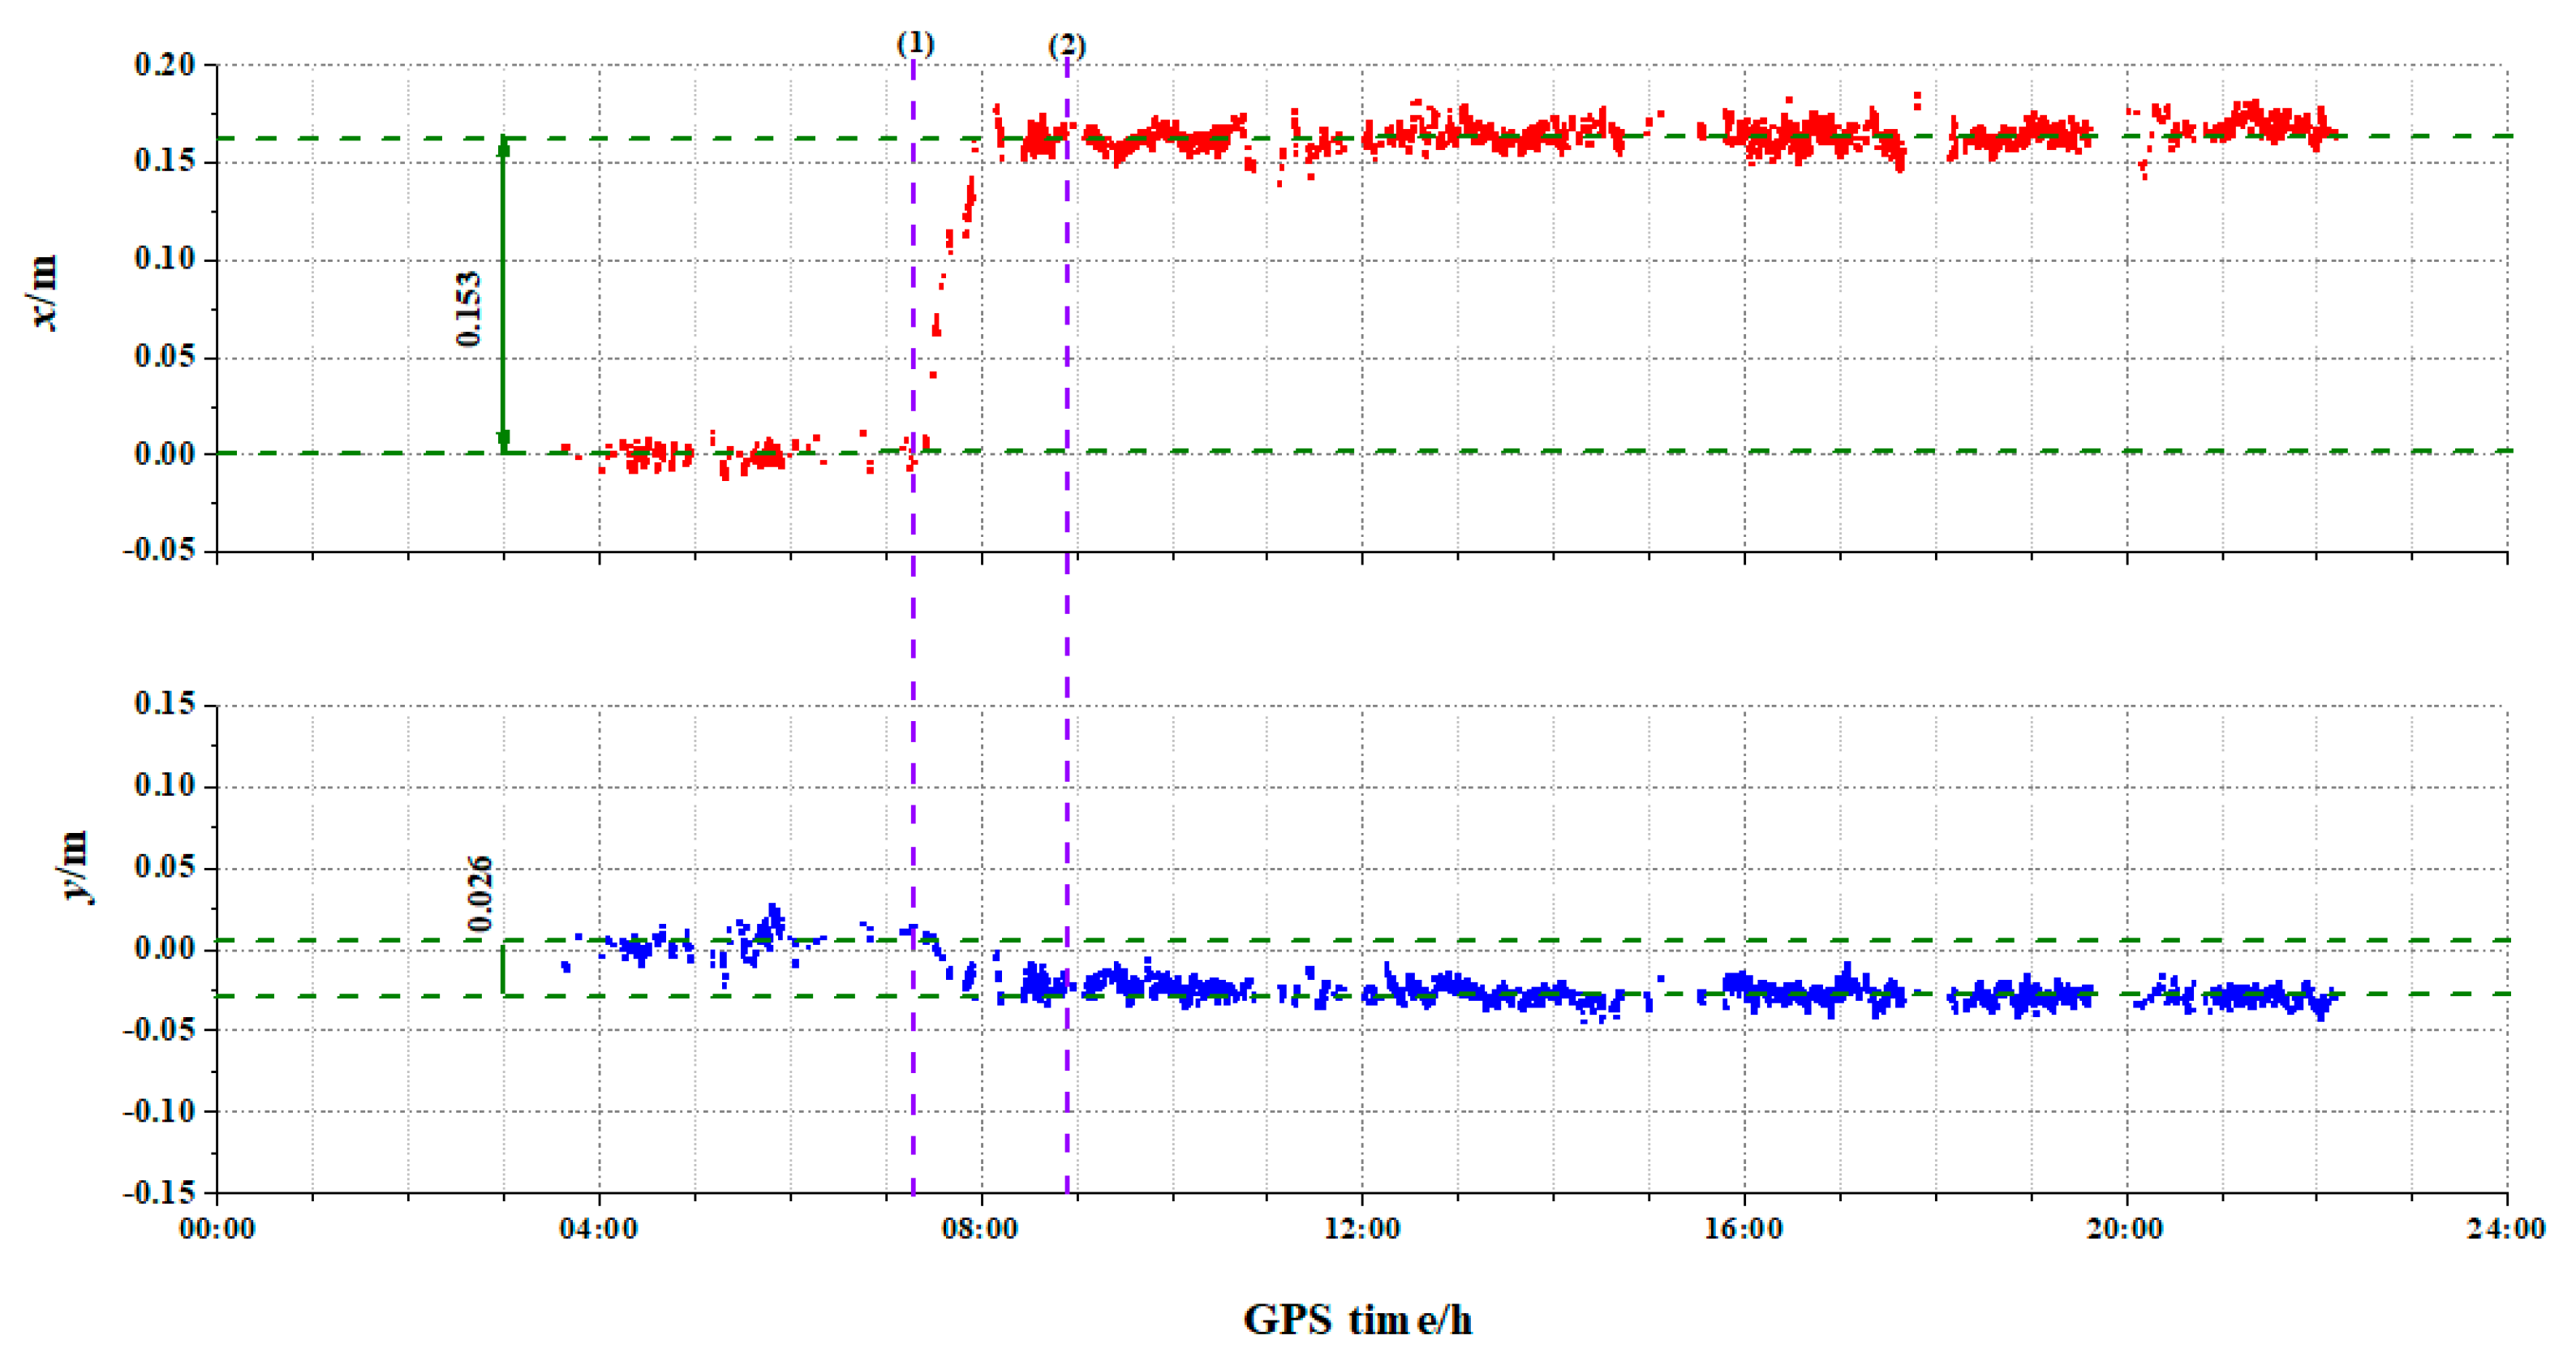
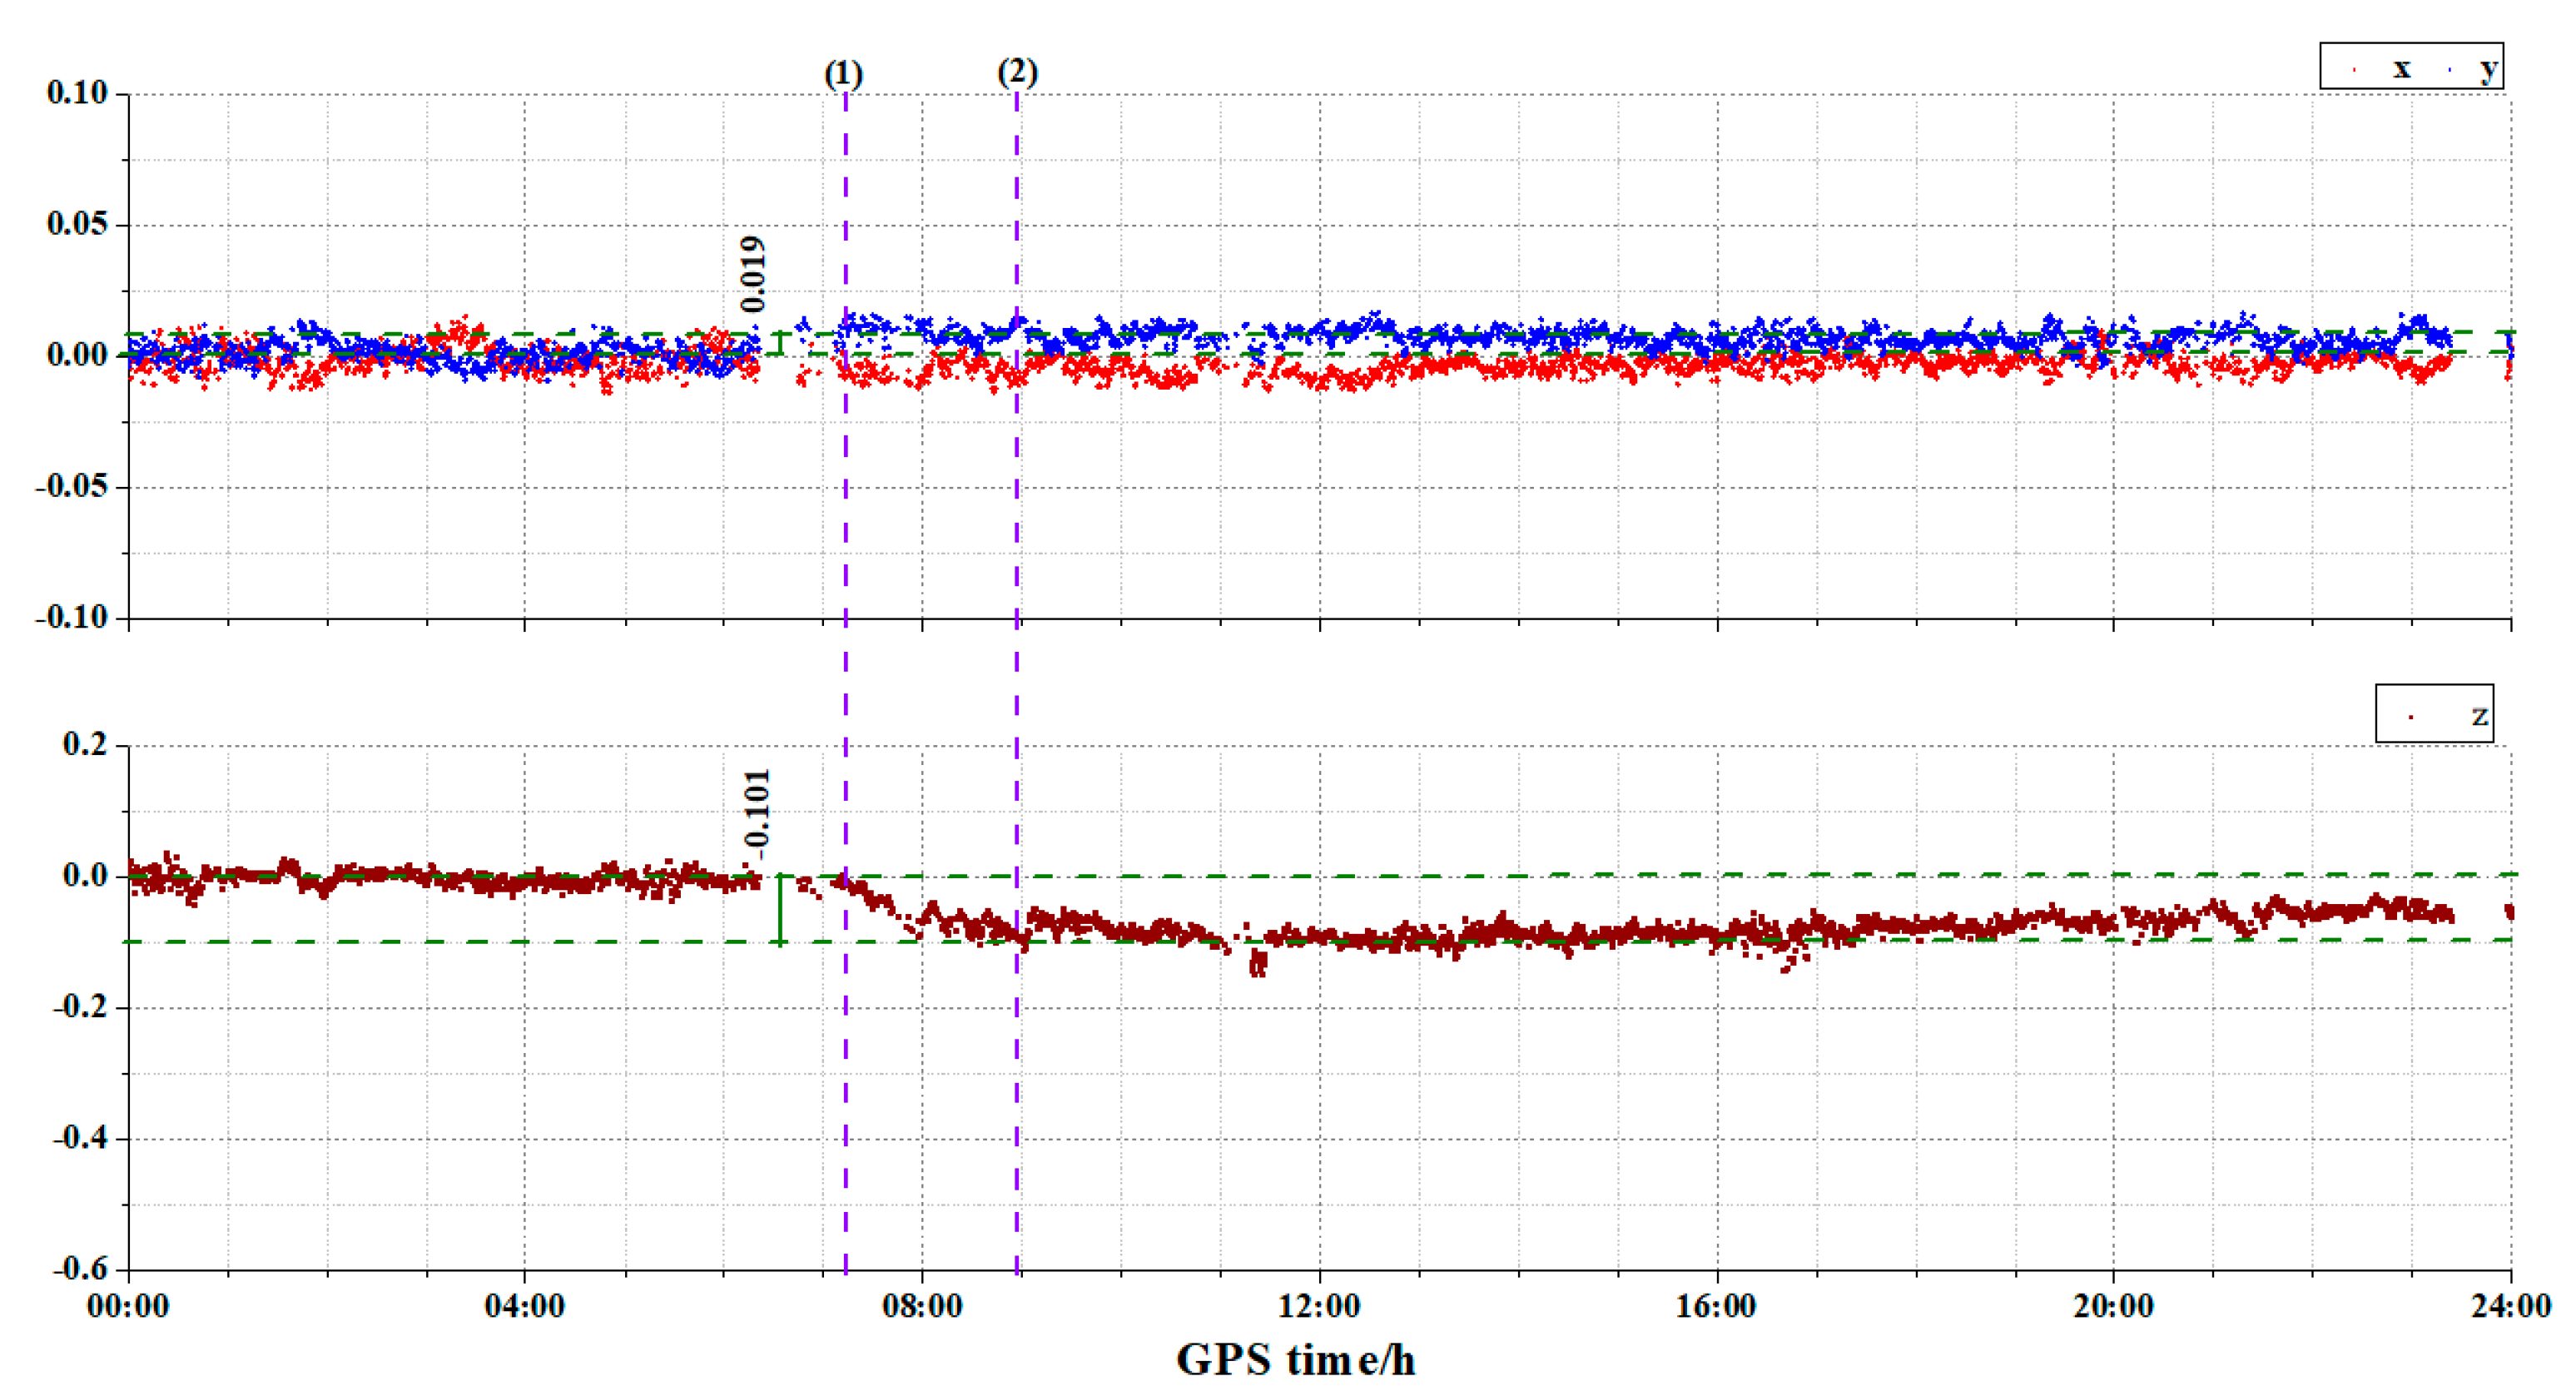
4.4. Dynamic Result of the Cable Saddle Pushing and Validation

In this section, the monitoring station of the main cables, middle spans and towers will be used to validate the performance of multi-GNSS positioning in dynamic mode. In the following figures, the positioning results have been transformed into the local BCS as shown in Figure 11. The real-time displacement series of QNT1 is shown in Figure 19. We detect that the start point of cable saddle pushing is Beijing time at 15:21 (07:21 GPS time) and the end point is 16:59 (08:59 GPS time). This is consistent with the actual operation of cable saddle pushing. Moreover, the deformation of the south tower is 0.149 m in the x direction and 0.024 m in the y direction. The real-time displacement series of QBT1 is shown in Figure 20. The start and end moments of cable saddle pushing are also consistent with the ground truth. The x-direction deformation of the north tower is 0.153 m and the y-direction deformation is 0.026 m. The real-time displacement series of QDKZ is shown in Figure 21. The deformation of the cable is 0.019 m in the y direction and 0.101 m in the vertical z direction.
To validate the precision of our low-cost GNSS solution, the deformation measured by Leica MS60 is taken as the reference. Table 10 lists the deformation error between multi-GNSS and RTS. The horizontal error of QNT1 is below 0.005 m and QBT1 is below 0.008 m. It is because the baseline length of QBT1 is longer than QNT1 that the DD residual tropospheric and ionospheric delays cannot be fully eliminated, which will have a larger influence on the x and y direction.

5. Discussion and Conclusions

We independently develop a low-cost GNSS instrument, build a universal low-cost GNSS bridge real-time monitoring system and successfully apply it to the real-time monitoring of saddle pushing during the construction of the Guojiatuo Yangtze River suspension bridge.
The analysis of the BDS-only, GPS-only and multi-GNSS solutions for the response of the Guojiatuo suspension bridge over Yangtze river shows that their accuracy highly depends on the navigation satellite system used, especially under unfavorable surroundings, such as obstructions and strong multipath. The low-cost GNSS solution applied in the real-time movement detection of the Guojiatuo suspension bridge can be used in any SHM project for a civil engineering structure. Generally, the steps of the proposed solution are as follows (see Figure 22).
Step 1, data collection. The observations of bridge monitoring stations and base stations are collected.
Step 2, real-time quality analysis technology. The observations of the bridge GNSS monitoring stations and base stations are cleaned. According to the information derived from parameters, such as MP, integrity rate and position precision factor, we identify and remove the satellite with a low-quality signal. Additionally, we will remove the epoch under the condition that the signal of several satellites shows low quality.
Step 3, data processing with each possible satellite system combination. We use DD technology to process the observation data. The main requirements of the configuration parameters are (i) 15° cut-off elevation angle, (ii) fixed-ambiguity resolution with integer least squares method [47]. We obtain the N, E, U time series of all the monitoring stations by using each GNSS system combination.
Step 4, Conversion of GNSS N, E, U coordinate system to local BCS x, y, z coordinate system. The N, E, U time series of each monitoring station are converted to the local BCS by using the relative bridge position with respect to the GNSS N, E, U coordinates and the transformation matrix.
Step 5, Determination of the deformation of the bridge.
The limitations of traditional multi-GNSS post-processing solutions are that the bridge may change its state immediately and thus the dangerous situation may not be detected soon enough. On the other hand, due to the affordable price, continuous monitoring systems with geodetic GNSS instrument is not a practical solution. Hence, a novel solution is the use of a real-time low-cost GNSS continuous monitoring system. The cons and pros of the low-cost GNSS solution are discussed as follows.
  • Under the condition that we apply a rigorous processing method and install the instrument properly, the accuracy of low-cost GNSS instruments is 3 mm in the horizontal direction and 5 mm in the vertical direction, which is comparable to traditional GNSS [48,49,50].
  • Real-time, continuous and high-frequency measurements over a long period can better describe the deformation during the bridge construction and explore the inversion of the mechanical state according to the digital twin studies [51,52]. More importantly, the novel solution can detect abnormal deformation which may indicate a potential trend in bridge failure.
  • The procedure is all-weather and fully automated. No human intervention is required. The system automatically sends reasonable processing result reports via E-mail and web platform, which helps the bridge managers make timely and right decisions.
  • The novel low-cost GNSS solution also has some limitations: If the low-cost GNSS monitoring system starts to operate, the continuity of measurement and maintenance of the system is a fundamental task. However, in our experiment, some problems, such as the interruption of power supply, lead to observation data discontinuity, which limits the period of observation. Under this condition, we also have to fix the ambiguity and reposition [47,53,54].
The advantages and disadvantages of the low-cost GNSS solution have been presented and conclusions are drawn as follows,
(1) A low-cost GNSS instrument is developed. The volume only accounts for one quarter of the traditional monitoring equipment with small power.
(2) The results show that the real-time monitoring accuracy of the low-cost GNSS in the horizontal direction and the vertical direction is 2 mm and 5 mm, respectively. The displacement monitoring series also intuitively shows the deformation of the saddle pushing. The low-cost GNSS solution is suitable for real-time monitoring of the Guojiatuo Suspension Bridge.
(3) The low-cost GNSS could be set in bridge monitoring applications, which has a good application prospect and provides a new solution for the real-time deformation monitoring of bridges, especially large-span bridges.
Now the GNSS is limited only to the critical elements of the bridge structure. Considering the relative inexpensiveness and high precision of low-cost GNSS sensors compared with traditional geodetic or high-end commercial solutions, it allows the deployment of more GNSS sensors at a global scale of the bridge structure in the future. This helps understand overall mechanical structural behavior.

Author Contributions

Conceptualization, L.Z., C.H. and S.Z.; methodology, L.Z., X.L., X.W., Y.Z. and S.Z.; software, L.Z., X.L. and X.W.; validation, X.L., S.Z., J.P., M.C. and Z.X.; writing—original draft preparation, L.Z., X.M. and S.Z.; data curation, L.Z. and S.Z.; writing—review and editing, Y.Y. and X.W.; visualization, S.Z., M.C. and C.H.; funding acquisition, S.Z. and Z.X. All authors have read and agreed to the published version of the manuscript.

Funding

This research was supported in part by the National Natural Science Foundation of China (42074041 and 41904171), Chongqing Natural Science Foundation (cstc2020jscx-msxmX0080), Key R&D Program of Ningxia Autonomous Region: Ecological environment monitoring and platform development of ecological barrier protection system for Helan Mountain (2022CMG02014) and Chongqing Joint Training Base for Graduate Students (JDLHPYJD2019004).

Data Availability Statement

The data presented in this study are available upon reasonable request from the corresponding author.

Conflicts of Interest

The authors declare no conflict of interest.

References

  1. Rao, R.; Li, C.; Huang, Y.; Zhen, X.; Wu, L. Method for structural frequency extraction from GNSS displacement monitoring signals. J. Test. Eval. 2018, 47, 2026–2043. [Google Scholar] [CrossRef]
  2. Liu, X.; Wang, J.; Zhen, J.; Han, H.; Hancock, C. GNSS-aided accelerometer frequency domain integration approach to monitor structural dynamic displacements. Int. J. Image Data Fusion 2021, 12, 268–281. [Google Scholar] [CrossRef]
  3. Artese, S.; Achilli, V.; Zinno, R. Monitoring of bridges by a laser pointer: Dynamic measurement of support rotations and elastic line displacements: Methodology and first test. Sensors 2018, 18, 338. [Google Scholar] [CrossRef] [Green Version]
  4. Ntotsios, E.; Papadimitriou, C.; Panetsos, P.; Karaiskos, G.; Perros, K.; Perdikaris, P.C. Bridge health monitoring system based on vibration measurements. Bull. Earthq. Eng. 2009, 7, 469–483. [Google Scholar] [CrossRef] [Green Version]
  5. Inaudi, D. Structural health monitoring of bridges: General issues and applications. Struct. Health Monit. Civ. Infrastruct. Syst. 2009, 339–370. [Google Scholar] [CrossRef]
  6. Zhou, Y.; Xiang, Z.; Zhang, X.; Wang, Y. Mechanical state inversion method for structural performance evaluation of existing suspension bridges using 3D laser scanning. Comput. Aided Civ. Infrastruct. Eng. 2022, 37, 650–665. [Google Scholar] [CrossRef]
  7. Xiong, C.; Niu, Y. Investigation of the dynamic behavior of a super high-rise structure using RTK-GNSS technique. KSCE J. Civ. Eng. 2019, 23, 654–665. [Google Scholar] [CrossRef]
  8. Barzaghi, R.; Cazzaniga, N.E.; De Gaetani, C.I.; Pinto, L.; Tornatore, V. Estimating and comparing dam deformation using classical and GNSS techniques. Sensors 2018, 18, 756. [Google Scholar] [CrossRef] [Green Version]
  9. Yu, J.; Meng, X.; Shao, X.; Yan, B.; Yang, L. Identification of dynamic displacements and model frequencies of a medium-span suspension bridge using multimode GNSS processing. Eng. Struct. 2014, 81, 432–443. [Google Scholar] [CrossRef]
  10. Roberts, G.W. Real Time On-The-Fly Kinematic GPS. Ph.D. Thesis, The University of Nottingham, Nottingham, UK, 1997. [Google Scholar]
  11. Roberts, G.W.; Brown, C.J.; Meng, X.; Ogundipe, O.; Atkins, C.; Colford, B. Deflection and frequency monitoring of the Forth Road Bridge, Scotland, by GPS. ICE Proceedings. Bridge Eng. 2012, 165, 105–123. [Google Scholar]
  12. Ashkenazi, V.; Roberts, G.W. Experimental monitoring of the Humber bridge using GPS. In Proceedings of the Institution of Civil Engineers-Civil Engineering, Thomas Telford-ICE Virtual Library, London, UK, November 1997; Volume 120, pp. 177–182. [Google Scholar]
  13. Brown, C.J.; Karuma, R.; Ashkenazi, V.; Roberts, G.W.; Evans, R.V. Monitoring of structures using the global positioning system. Proc. Inst. Civ. Eng. Struct. Build. 1999, 134, 97–105. [Google Scholar] [CrossRef]
  14. Meng, X.; Xie, Y.; Bhatia, P.; Sowter, A.; Psimoulis, P.; Colford, B.; Ye, J.; Skicko, M.; Dimauro, M.; Ge, M.; et al. Research and Development of a Pilot Project Using GNSS and Earth Observation (GeoSHM) for Structural Health Monitoring of the Forth Road Bridge in Scotland. In Proceedings of the Joint International Symposium on Deformation Monitoring, Vienna, Austria, 30 March–1 April 2016. [Google Scholar]
  15. Meng, X.; Nguyen, D.T.; Xie, Y.; Owen, J.S.; Psimoulis, P.; Ince, S.; Chen, Q.; Ye, J.; Bhatia, P. Design and implementation of a new system for large bridge monitoring—GeoSHM. Sensors 2018, 18, 775. [Google Scholar] [CrossRef] [Green Version]
  16. Meng, X.; Nguyen, D.T.; Owen, J.S.; Xie, Y.; Psimoulis, P.; Ye, G. Application of GeoSHM System in Monitoring Extreme Wind Events at the Forth Road Bridge. Remote Sens. 2019, 11, 2799. [Google Scholar] [CrossRef] [Green Version]
  17. Msaewe, H.A.; Psimoulis, P.A.; Hancock, C.M.; Roberts, G.W.; Bonenberg, L. Monitoring the response of Severn Suspension Bridge in the United Kingdom using multi-GNSS measurements. Struct. Control Health Monit. 2021, 28, e2830. [Google Scholar] [CrossRef]
  18. Xi, R.; He, Q.; Meng, X. Bridge monitoring using multi-GNSS observations with high cutoff elevations: A case study. Measurement 2021, 168, 108303. [Google Scholar] [CrossRef]
  19. Elnabwy, M.T.; Kaloop, M.R.; Elbeltagi, E. Talkha steel highway bridge monitoring and movement identification using RTK-GPS technique. Measurement 2013, 46, 4282–4292. [Google Scholar] [CrossRef]
  20. Psimoulis, P.A.; Stiros, S.C. Experimental assessment of the accuracy of GPS and RTS for the determination of the parameters of oscillation of major structures. Comput. Aided Civ. Infrastruct. Eng. 2008, 23, 389–403. [Google Scholar] [CrossRef]
  21. Vazquez-Ontiveros, J.R.; Vazquez-Becerra, G.E.; Quintana, J.A.; Carrion, F.J.; Guzman-Acevedo, M.; Gaxiola-Camacho, J.R. Implementation of PPP-GNSS measurement technology in the probabilistic SHM of bridge structures. Measurement 2021, 173, 108677. [Google Scholar] [CrossRef]
  22. Meng, X. From structural health monitoring to geo-hazard early warning: An integrated approach using GNSS positioning technology. In Earth Observation of Global Changes (EOGC); Springer: Berlin/Heidelberg, Germany, 2013; pp. 285–293. [Google Scholar]
  23. Moschas, F.; Stiros, S. Dynamic multipath in structural bridge monitoring: An experimental approach. GPS Solut. 2014, 18, 209–218. [Google Scholar] [CrossRef]
  24. Liu, S.; Li, D.; Li, B.; Wang, F. A compact high-precision GNSS antenna with a miniaturized choke ring. IEEE Antennas Wirel. Propag. Lett. 2017, 16, 2465–2468. [Google Scholar] [CrossRef]
  25. Janssen, V.; Rizos, C. A mixed-mode GPS network processing approach for deformation monitoring applications. Surv. Rev. 2003, 37, 2–19. [Google Scholar] [CrossRef]
  26. Xi, R.; Jiang, W.; Meng, X.; Chen, H.; Chen, Q. Bridge monitoring using BDS-RTK and GPS-RTK techniques. Measurement 2018, 120, 128–139. [Google Scholar] [CrossRef]
  27. Notti, D.; Cina, A.; Manzino, A.; Colombo, A.; Bendea, I.H.; Mollo, P.; Giordan, D. Low-cost GNSS solution for continuous monitoring of slope instabilities applied to Madonna Del Sasso Sanctuary (NW Italy). Sensors 2020, 20, 289. [Google Scholar] [CrossRef] [Green Version]
  28. Biagi, L.; Grec, F.; Negretti, M. Low-cost GNSS receivers for local monitoring: Experimental simulation, and analysis of displacements. Sensors 2016, 16, 2140. [Google Scholar] [CrossRef] [Green Version]
  29. Caldera, S.; Realini, E.; Barzaghi, R.; Reguzzoni, M.; Sansò, F. Experimental study on low-cost satellite-based geodetic monitoring over short baselines. J. Surv. Eng. 2016, 142, 04015016. [Google Scholar] [CrossRef]
  30. Hamza, V.; Stopar, B.; Ambrožič, T.; Turk, G.; Sterle, O. Testing Multi-Frequency Low-Cost GNSS Receivers for Geodetic Monitoring Purposes. Sensors 2020, 20, 4375. [Google Scholar] [CrossRef]
  31. Bai, Z.; Zhang, Q.; Huang, G.; Jin, C.; Wang, J. Real-time BeiDou Landslide Monitoring Technology of Light Terminal plus Industry Cloud. Acta Geod. Cartogr. Sin. 2019, 48, 1424–1429. [Google Scholar]
  32. Prochniewicz, D.; Kudrys, J.; Maciuk, K. Noises in Double-Differenced GNSS Observations. Energies 2022, 15, 1668. [Google Scholar] [CrossRef]
  33. Schönemann, E.; Becker, M.; Springer, T. A new approach for GNSS analysis in a multi-GNSS and multi-signal environment. J. Geod. Sci. 2011, 1, 204–214. [Google Scholar] [CrossRef] [Green Version]
  34. Falletti, E.; Falco, G.; Nicola, M. Performance analysis of the dispersion of double differences algorithm to detect single-source GNSS spoofing. IEEE Trans. Aerosp. Electron. Syst. 2021, 57, 2674–2688. [Google Scholar] [CrossRef]
  35. Tu, R.; Liu, J.; Zhang, R.; Fan, L.; Zhang, P. Real-time kinematic positioning algorithm with GNSS and high-frequency accelerometer observations for broadband signals. Meas. Sci. Technol. 2019, 31, 035007. [Google Scholar] [CrossRef]
  36. Manzini, N.; Orcesi, A.; Thom, C.; Brossault, M.A.; Botton, S.; Ortiz, M.; Dumoulin, J. Performance analysis of low-cost GNSS stations for structural health monitoring of civil engineering structures. Struct. Infrastruct. Eng. 2022, 18, 595–611. [Google Scholar] [CrossRef]
  37. Gaxiola-Camacho, J.R.; Bennett, R.; Guzman-Acevedo, G.M.; Gaxiola-Camacho, I.E. Structural evaluation of dynamic and semi-static displacements of the Juarez Bridge using GPS technology. Measurement 2017, 110, 146–153. [Google Scholar]
  38. Xiong, C.; Lu, H.; Zhu, J. Operational modal analysis of bridge structures with data from GNSS/accelerometer measurements. Sensors. 2017, 17, 436. [Google Scholar] [CrossRef] [PubMed] [Green Version]
  39. RTKLIB: An Open Source Program Package for GNSS Positioning. Available online: https://www.rtklib.com/ (accessed on 20 July 2022).
  40. Teunissen, P.J.G.; De Jonge, P.J.; Tiberius, C. The least-squares ambiguity decorrelation adjustment: Its performance on short GPS baselines and short observation spans. J. Geod. 1997, 71, 589–602. [Google Scholar] [CrossRef] [Green Version]
  41. BeiDou Navigation Satellite System Official Document. Available online: http://en.beidou.gov.cn/SYSTEMS/Officialdocument/ (accessed on 9 October 2022).
  42. The 5th Edition of the Global Positioning System Standard Positioning Service Performance Standard. Available online: https://www.gps.gov/technical/ps/2020-SPS-performance-standard.pdf (accessed on 9 October 2022).
  43. Qu, W.; Zhu, W.; Song, S.; Ping, J. The evaluation of precision about Hopfield, Saastamoinen and EGNOS tropospheric delay correction model. Acta Astron. Sin. 2008, 49, 113–122. [Google Scholar]
  44. Böhm, J.; Möller, G.; Schindelegger, M.; Pain, G.; Weber, R. Development of an improved empirical model for slant delays in the troposphere (GPT2w). GPS Solut. 2015, 19, 433–441. [Google Scholar] [CrossRef] [Green Version]
  45. Böhm, J.; Neill, A.; Tregoning, P.; Schuh, H. Global Mapping Function (GMF): A new empirical mapping function based on numerical weather model data. Geophys. Res. Lett. 2006, 33, 7. [Google Scholar] [CrossRef] [Green Version]
  46. Odijk, D. Ionosphere-free phase combinations for modernized GPS. J. Surv. Eng. 2003, 129, 165–173. [Google Scholar]
  47. Teunissen, P.J.G. Integer aperture GNSS ambiguity resolution. Artif. Satell. 2003, 38, 79–88. [Google Scholar]
  48. Xi, R.; Chen, H.; Meng, X.; Jiang, W.; Chen, Q. Reliable dynamic monitoring of bridges with integrated GPS and BeiDou. J. Surv. Eng. 2018, 144, 04018008. [Google Scholar] [CrossRef]
  49. Shen, N.; Chen, L.; Liu, J.; Wang, L.; Tao, T.; Wu, D.; Chen, R. A review of global navigation satellite system (GNSS)-based dynamic monitoring technologies for structural health monitoring. Remote Sens. 2019, 11, 1001. [Google Scholar] [CrossRef] [Green Version]
  50. Stiros, S.C. GNSS (GPS) Monitoring of Dynamic Deflections of Bridges: Structural Constraints and Metrological Limitations. Infrastructures 2021, 6, 23. [Google Scholar] [CrossRef]
  51. Mohammadi, M.; Rashidi, M.; Mousavi, V.; Karami, A.; Yu, Y.; Samali, B. Quality evaluation of digital twins generated based on UAV photogrammetry and TLS: Bridge case study. Remote Sens. 2021, 13, 3499. [Google Scholar] [CrossRef]
  52. Zhao, H.; Tan, C.; Obrien, E.J.; Zhang, B.; Uddin, N.; Guo, H. Developing Digital Twins to Characterize Bridge Behavior Using Measurements Taken under Random Traffic. J. Bridge Eng. 2022, 27, 04021101. [Google Scholar] [CrossRef]
  53. Verhagen, S.; Teunissen, P.J.G. The ratio test for future GNSS ambiguity resolution. GPS Solut. 2013, 17, 535–548. [Google Scholar] [CrossRef]
  54. Li, B. Review of triple-frequency GNSS: Ambiguity resolution, benefits and challenges. J. Glob. Position. Syst. 2018, 16, 1. [Google Scholar] [CrossRef]
Figure 1. A UAV photo of Guojiatuo Suspension Bridge.
Remotesensing 14 05174 g001
Figure 2. Main components of the Guojiatuo Suspension Bridge upper structure. (a) Cable saddle and tower. (b) Enlarged detail of the cable saddle.
Remotesensing 14 05174 g002
Figure 3. Schematic diagram of the connection between cable saddle and tower.
Remotesensing 14 05174 g003
Figure 4. Force diagram of the tower. The parameters L and b are the height and width of the tower respectively. The black vertical solid line and red dot line represent before and after the deformation of the tower. Δ is the horizontal movement value. The parameters V1 and V2 are the vertical force. The parameters H1 and H2 are the horizontal force. Note that the horizontal force is H1H2.
Remotesensing 14 05174 g004
Figure 5. Stiffness beam hinge joint method of the Guojiatuo Suspension Bridge. The red box in (a) shows the connection component; (b) shows the enlarged details of the connection component between two stiffness beam.
Remotesensing 14 05174 g005
Figure 6. Low-cost GNSS receiver equipment. (a) Details of low-cost GNSS. (b) Installation of antenna equipment connects the antenna and main cable. (c) GNSS antenna dome.
Remotesensing 14 05174 g006
Figure 7. The prototypal low-cost GNSS sensor box and Micro PC mainboard. (a) The sensor box and Beitian BT-300 antenna. 1 = antenna, 2 = Micro PC mainboard, 3 = power supply; (b) The front of the Micro PC mainboard. 4 = WH-LTE-7S4 communication module; (c) The reverse side of the Micro PC mainboard. 5 = UB4BOM board with Nebulas-II UC4C0 system on chip (Soc).
Remotesensing 14 05174 g007
Figure 8. Our proposed low-cost GNSS installation equipment. (a) This equipment connects with the main cable. (b) This equipment connects with the towers.
Remotesensing 14 05174 g008
Figure 9. Brief technical route of the low-cost GNSS monitoring system.
Remotesensing 14 05174 g009
Figure 10. The low-cost GNSS sensor layout of Guojiatuo Suspension Bridge.
Remotesensing 14 05174 g010
Figure 11. Low-cost GNSS stations are set up on the bridge. (The background figure is from Google Earth). The BCS is defined in this paper (x and y denote the longitudinal and lateral direction of the bridge and z is orthogonal with the plane of x-o-y and denotes the height direction).
Remotesensing 14 05174 g011
Figure 12. GNSS reference station JIZH.
Remotesensing 14 05174 g012
Figure 13. GNSS monitoring station QNT1.
Remotesensing 14 05174 g013
Figure 14. Experimental apparatus used for dynamic experiment evaluation. (a) Photo of overall dynamic scenario; (b) enlarged details of reference station.
Remotesensing 14 05174 g014
Figure 15. Automated horizontal shift detection based on deformation. The antenna was shifted repeatedly at distances ranging from 10 cm to 1 cm. The blue dot line is the apparent displacement derived from short baseline solution. The red line is the deformation after applying the moving average filter method.
Remotesensing 14 05174 g015
Figure 16. Automated tiny shift detection based on deformation. The antenna was quickly moved repeatedly 5 mm distance per step. The blue dot line is the apparent displacement derived from the short baseline solution. The red line is the deformation after applying the moving average filter method.
Remotesensing 14 05174 g016
Figure 17. Automated vertical shift detection based on deformation. The antenna of the test site is shifted repeatedly by 1 cm distance. The blue dot line is the deformation derived from the short baseline solution. The red line is the deformation after applying the moving average filter method.
Remotesensing 14 05174 g017
Figure 18. Deformation time series of QNT1.
Remotesensing 14 05174 g018
Figure 19. Real-time tower deflection of QNT1. The vertical line (1) represents the start moment of saddle pushing and the vertical line (2) represents the end moment of saddle pushing. The deformation of the x-direction is shown in red and y is shown in blue.
Remotesensing 14 05174 g019
Figure 20. Real-time tower deflection of QBT1. The vertical line (1) represents the start moment of saddle pushing and (2) represents the end moment of saddle pushing. The deformation of the x-direction is shown in red and y is shown in blue.
Remotesensing 14 05174 g020
Figure 21. Real-time tower deflection of QDKZ. The vertical line (1) represents the start point of saddle pushing and (2) represents the end point of saddle pushing. The deformation of the x-direction is shown in red, the y-direction is shown in blue and z is shown in wine.
Remotesensing 14 05174 g021
Figure 22. The method flowchart for Guojiatuo Suspension Bridge using low-cost GNSS sensors.
Remotesensing 14 05174 g022
Table 1. The detailed cost of instrumentations and installation at the bridge monitoring station.
InstrumentUnit Cost
low-cost receiver$100
antenna$50
Micro-pc mainboard$200
Plastic box, SIM card and 4G transmission antenna$100
Installation cost$350
Table 2. Comparison of parameters between self-developed equipment and receivers of different brands.
ParameterReceiver Type
Sino T30Trimble R12CHCNAV T6 ProOur Low-Cost GNSS
Volume/cm3137615111414180
Power/W24.221.8
Table 3. Multi-GNSS data processing strategies in RTKLIB.
Models or ParametersStrategies
Process ModeDD mode with L1+L2 measurement
Cut-off elevation angle (°)15
A priori tropospheric modelSaastamoinen model [43]/GPT2w [44]/GMF [45]
Weighting scheme σ 2 = a 2 + b 2 / sin 2 θ , where θ is an elevation
Ephemerisbroadcast ephemeris
Ambiguity resolutioninstantaneous
Cycle slip detectionIonosphere-free (IF) observations [46]
GNSS SolutionsBDS-only, GPS-only, multi-GNSS
Table 4. Specifications of low-cost GNSS stations for the Guojiatuo Suspension Bridge.
GroupStation NameLocationBaseline Length (m)Receivers &
Antennas
The Period for Collecting Data *
26 February5 April
BaseJIZHStable areaOur Low-cost GNSS0:00–24:000:00–24:00
TowerQNT1South Tower300.05Our Low-cost GNSS0:00–24:000:00–24:00
QBT1North Tower772.21Our Low-cost GNSS04:00–22:030:00–24:00
CablesQXKZMiddle Span469.21Our Low-cost GNSS/0:00–24:00
QDKZMiddle Span490.28Our Low-cost GNSS0:00–23:220:00–24:00
* GNSS UTC, Note Beijing time = UTC + 08:00, ‘/’ means no observation data.
Table 5. Evaluation of horizontal shift from 10 cm to 1 cm.
Processing ParametersRatio of Successfully Detected Steps
baselineambiguity
solution
Kalman filter
direction
10 cm5 cm2 cm1 cm
120 minstantaneousforward100%100%100%100%
Table 6. Evaluation of horizontal shift from 10 mm to 3 mm.
Processing ParametersRatio of Successfully Detected Steps
baselineambiguity
solution
Kalman filter
direction
10 mm7 mm5 mm3 mm
120 minstantaneousforward100%100%100%80%
Table 7. Evaluation of vertical shift from 10 cm to 7 mm.
Processing ParametersRatio of Successfully Detected Steps
baselineambiguity
solution
Kalman filter
direction
10 cm5 cm2 cm1 cm7 mm
120 minstantaneousforward100%100%100%100%70%
Table 8. The maximum, minimum errors and STD for different system combinations/mm.
ResolutionN DirectionE DirectionU Direction
MaxMinSTDMAXMINSTDMAXMINSTD
BDS5.1−8.12.04.1−9.72.718.9−17.66.9
GPS10.9−9.33.34.8−12.12.918.9−18.07.0
Multi-GNSS5.0−4.91.72.8−7.51.813.1−12.04.4
Table 9. Mean values of baseline resolutions (m).
StationQNT1QBT1
NEUNEU
BDS237.572−119.196139.212691.940438.896139.143
GPS237.574−119.193139.215619.942438.893139.140
Multi-GNSS237.573−119.194139.213619.942438.894139.141
Table 10. The deformation error between multi-GNSS and RTS (m).
StationDirectionMulti-GNSSRTSError
QNT1x0.1490.1450.004
y0.0240.021−0.003
QBT1x0.1530.145−0.008
y0.0260.023−0.003
Publisher’s Note: MDPI stays neutral with regard to jurisdictional claims in published maps and institutional affiliations.

