

Road Condition Detection and Emergency Rescue Recognition Using On-Board UAV in the Wildness

Abstract
:
1. Introduction
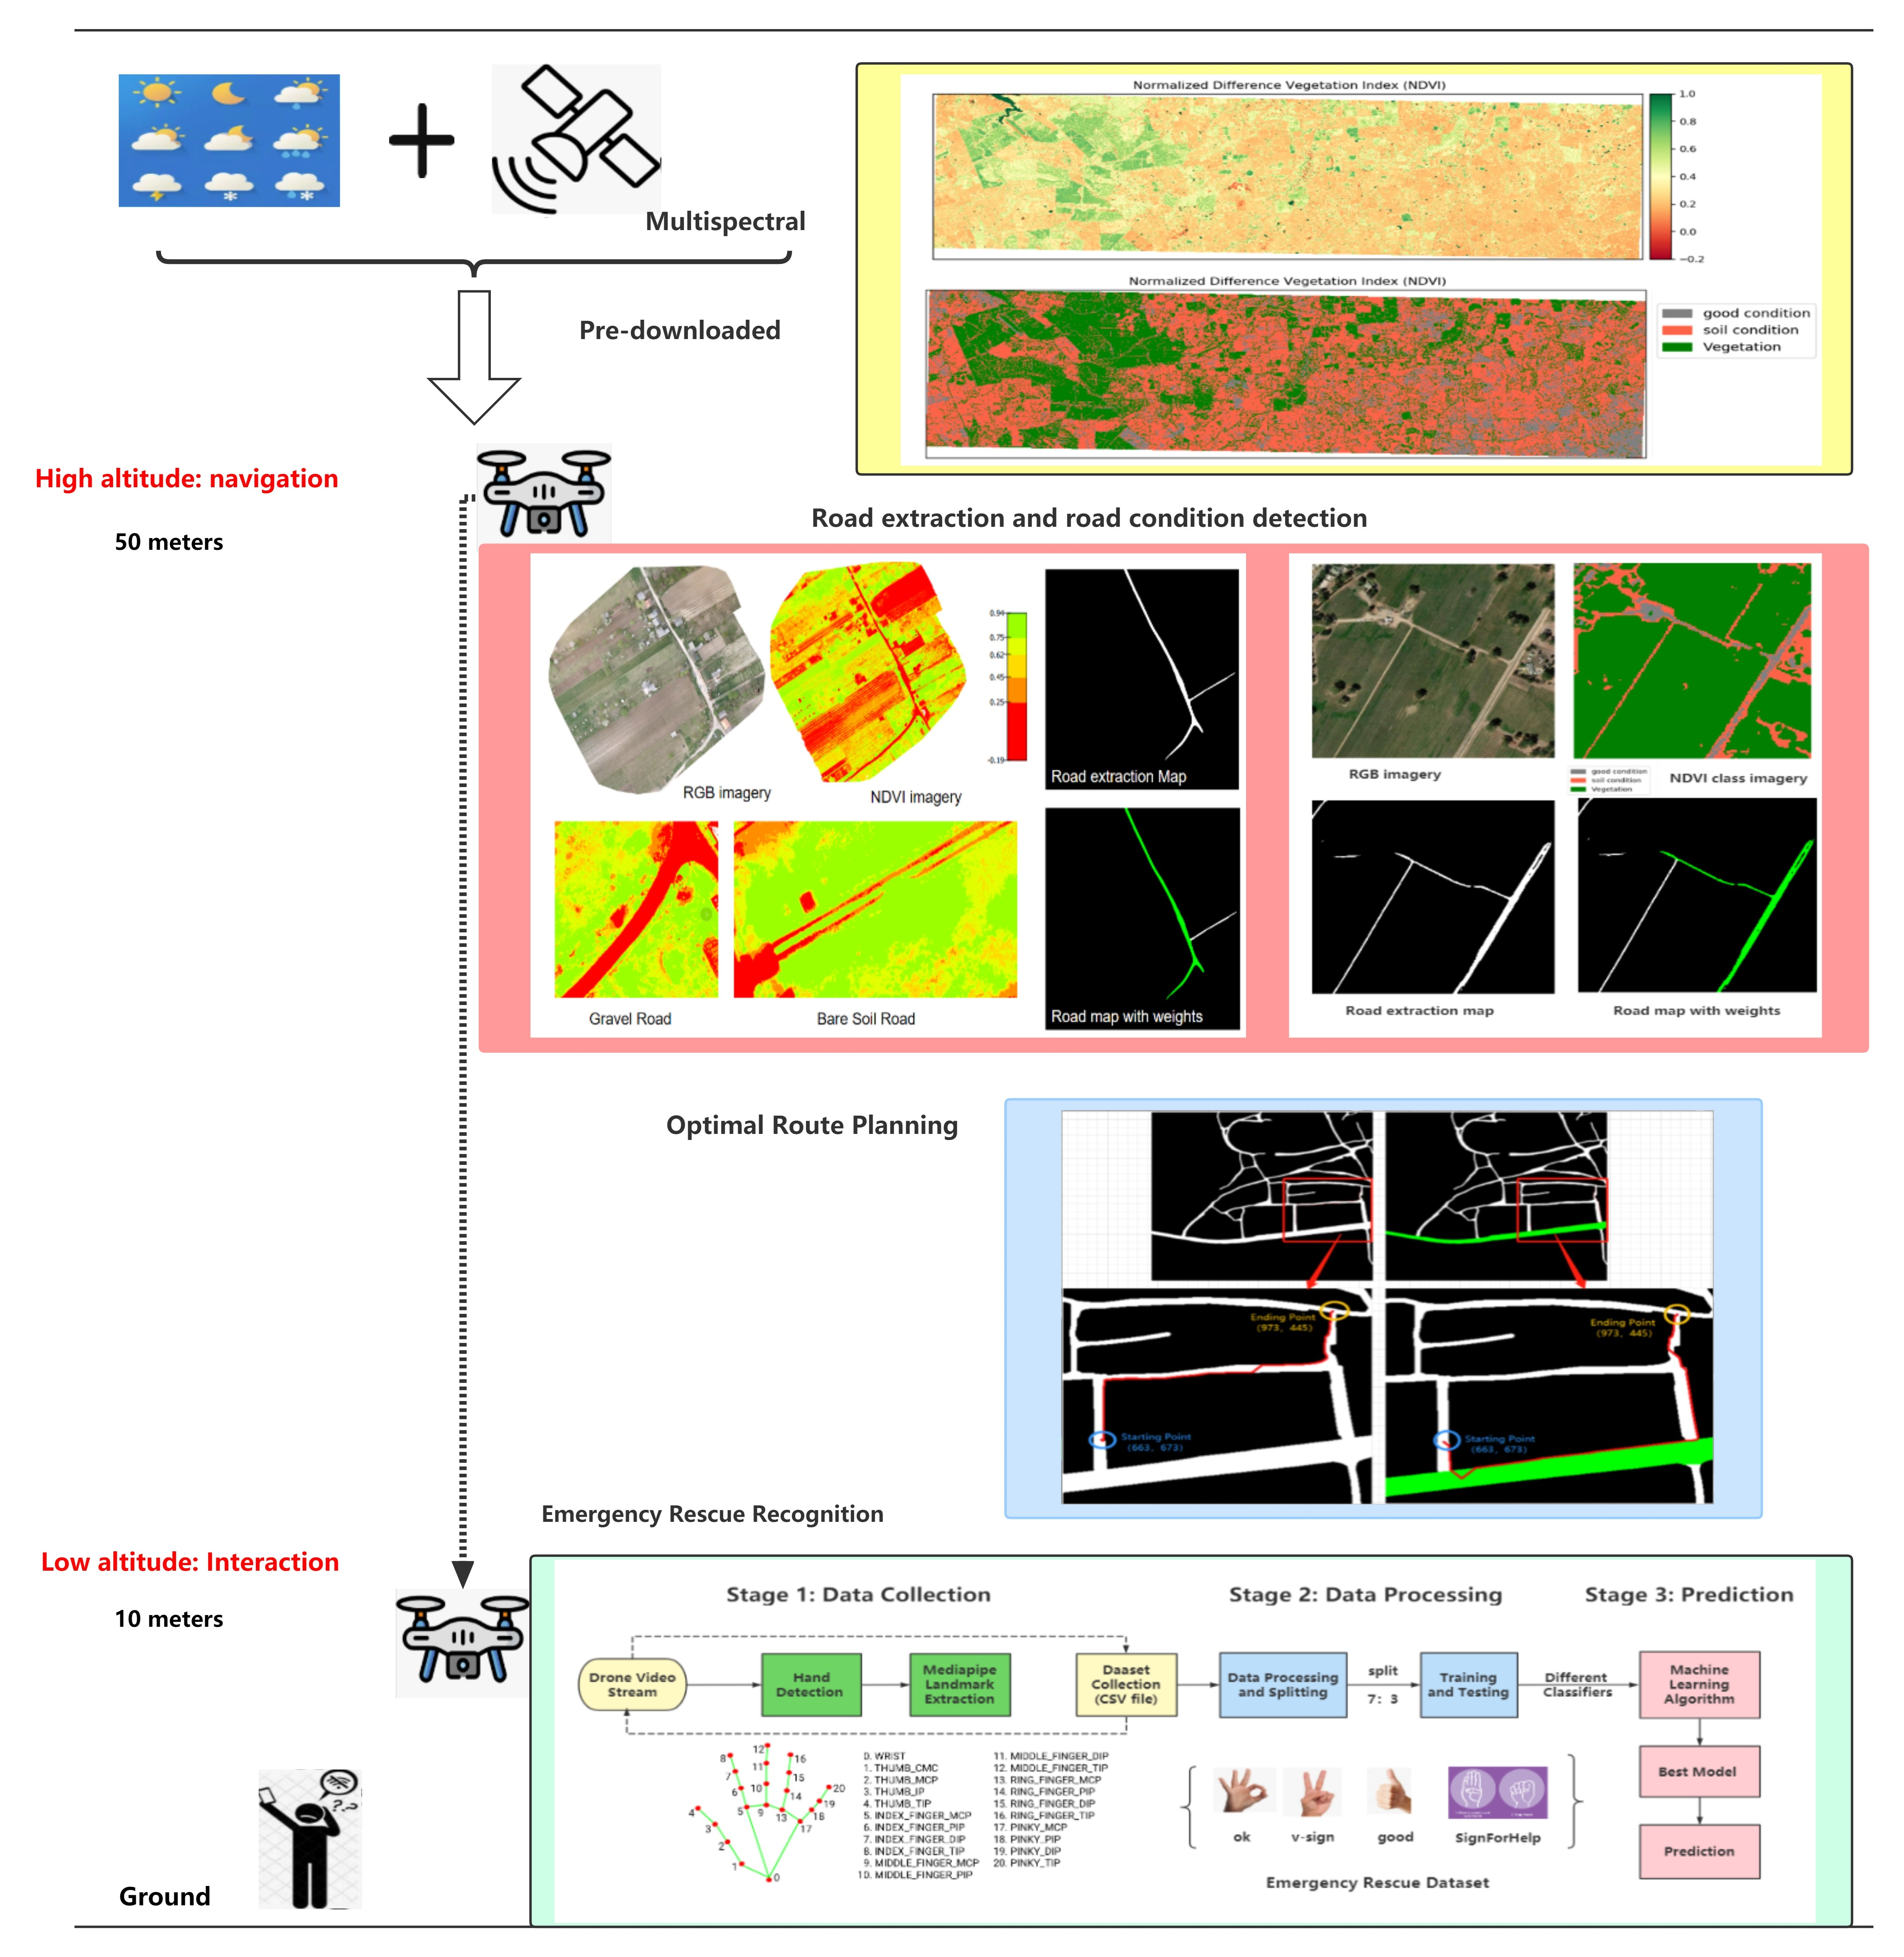
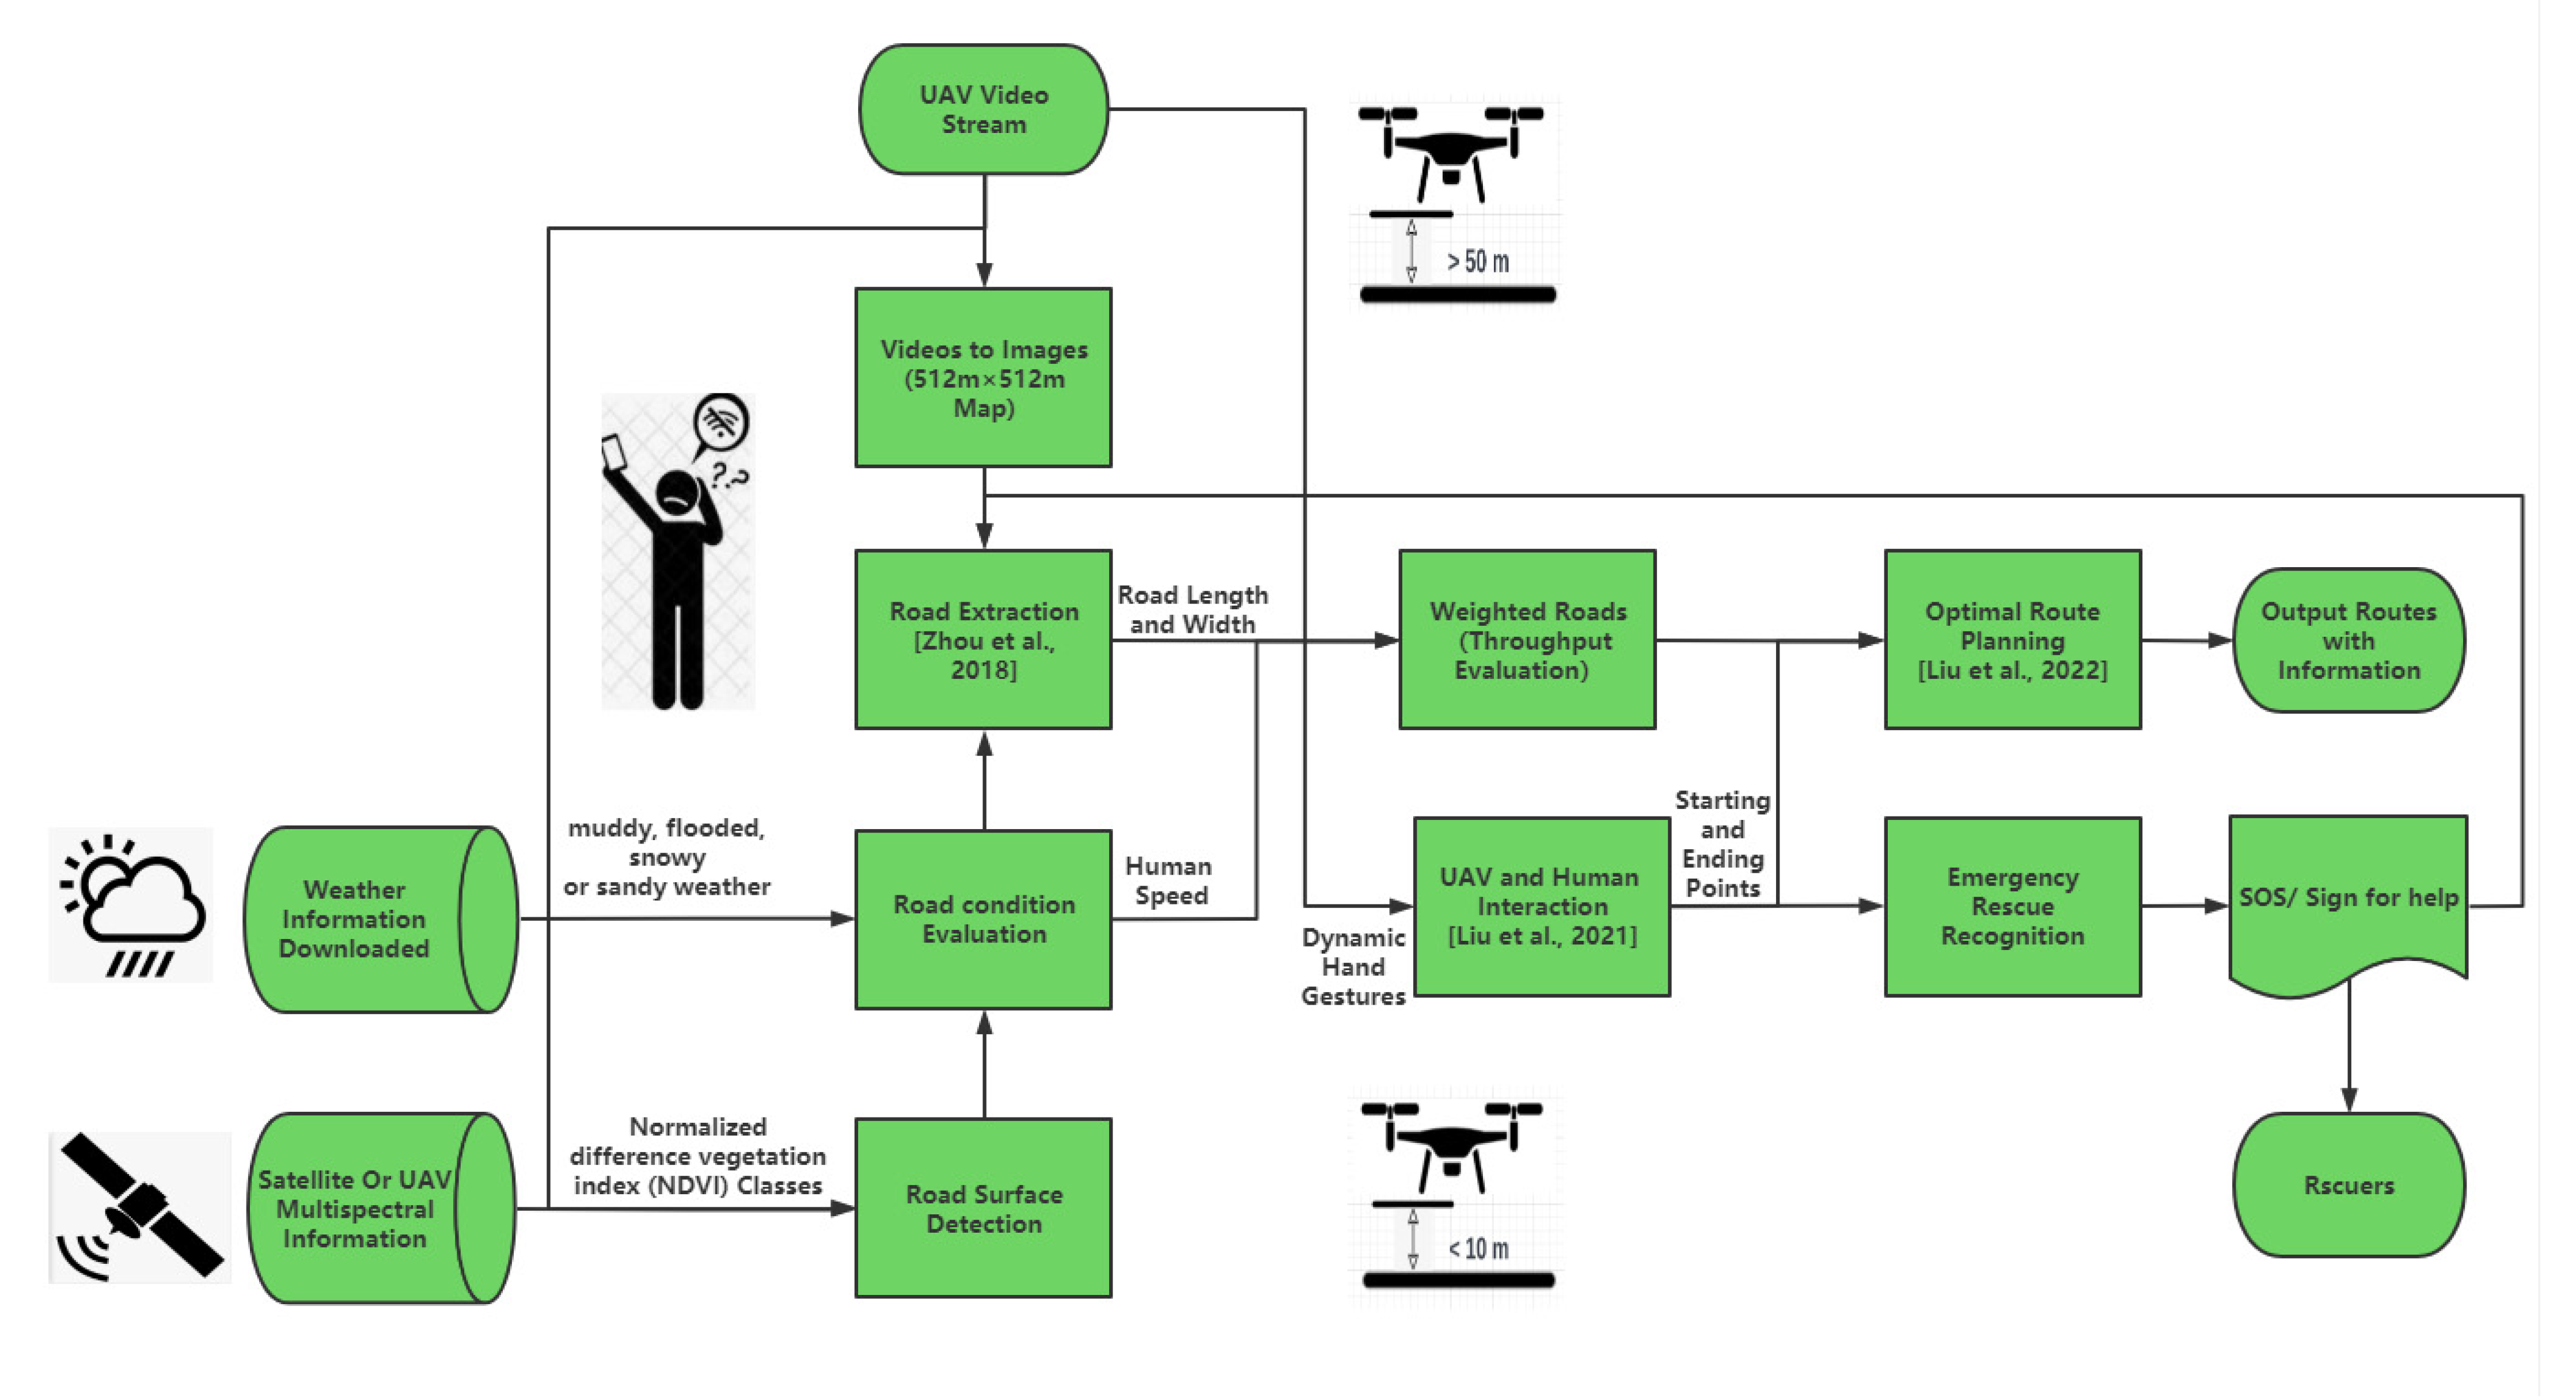
- The UAV plans an optimal route for human navigation in real-time in wildness environments with poor mobile networks and bad weather;
- With the local road quality ensuring the probable walking or driving speed, multispectral images are combined with weather information to estimate the walking speed of pedestrians, and the throughput of the road should also be evaluated;
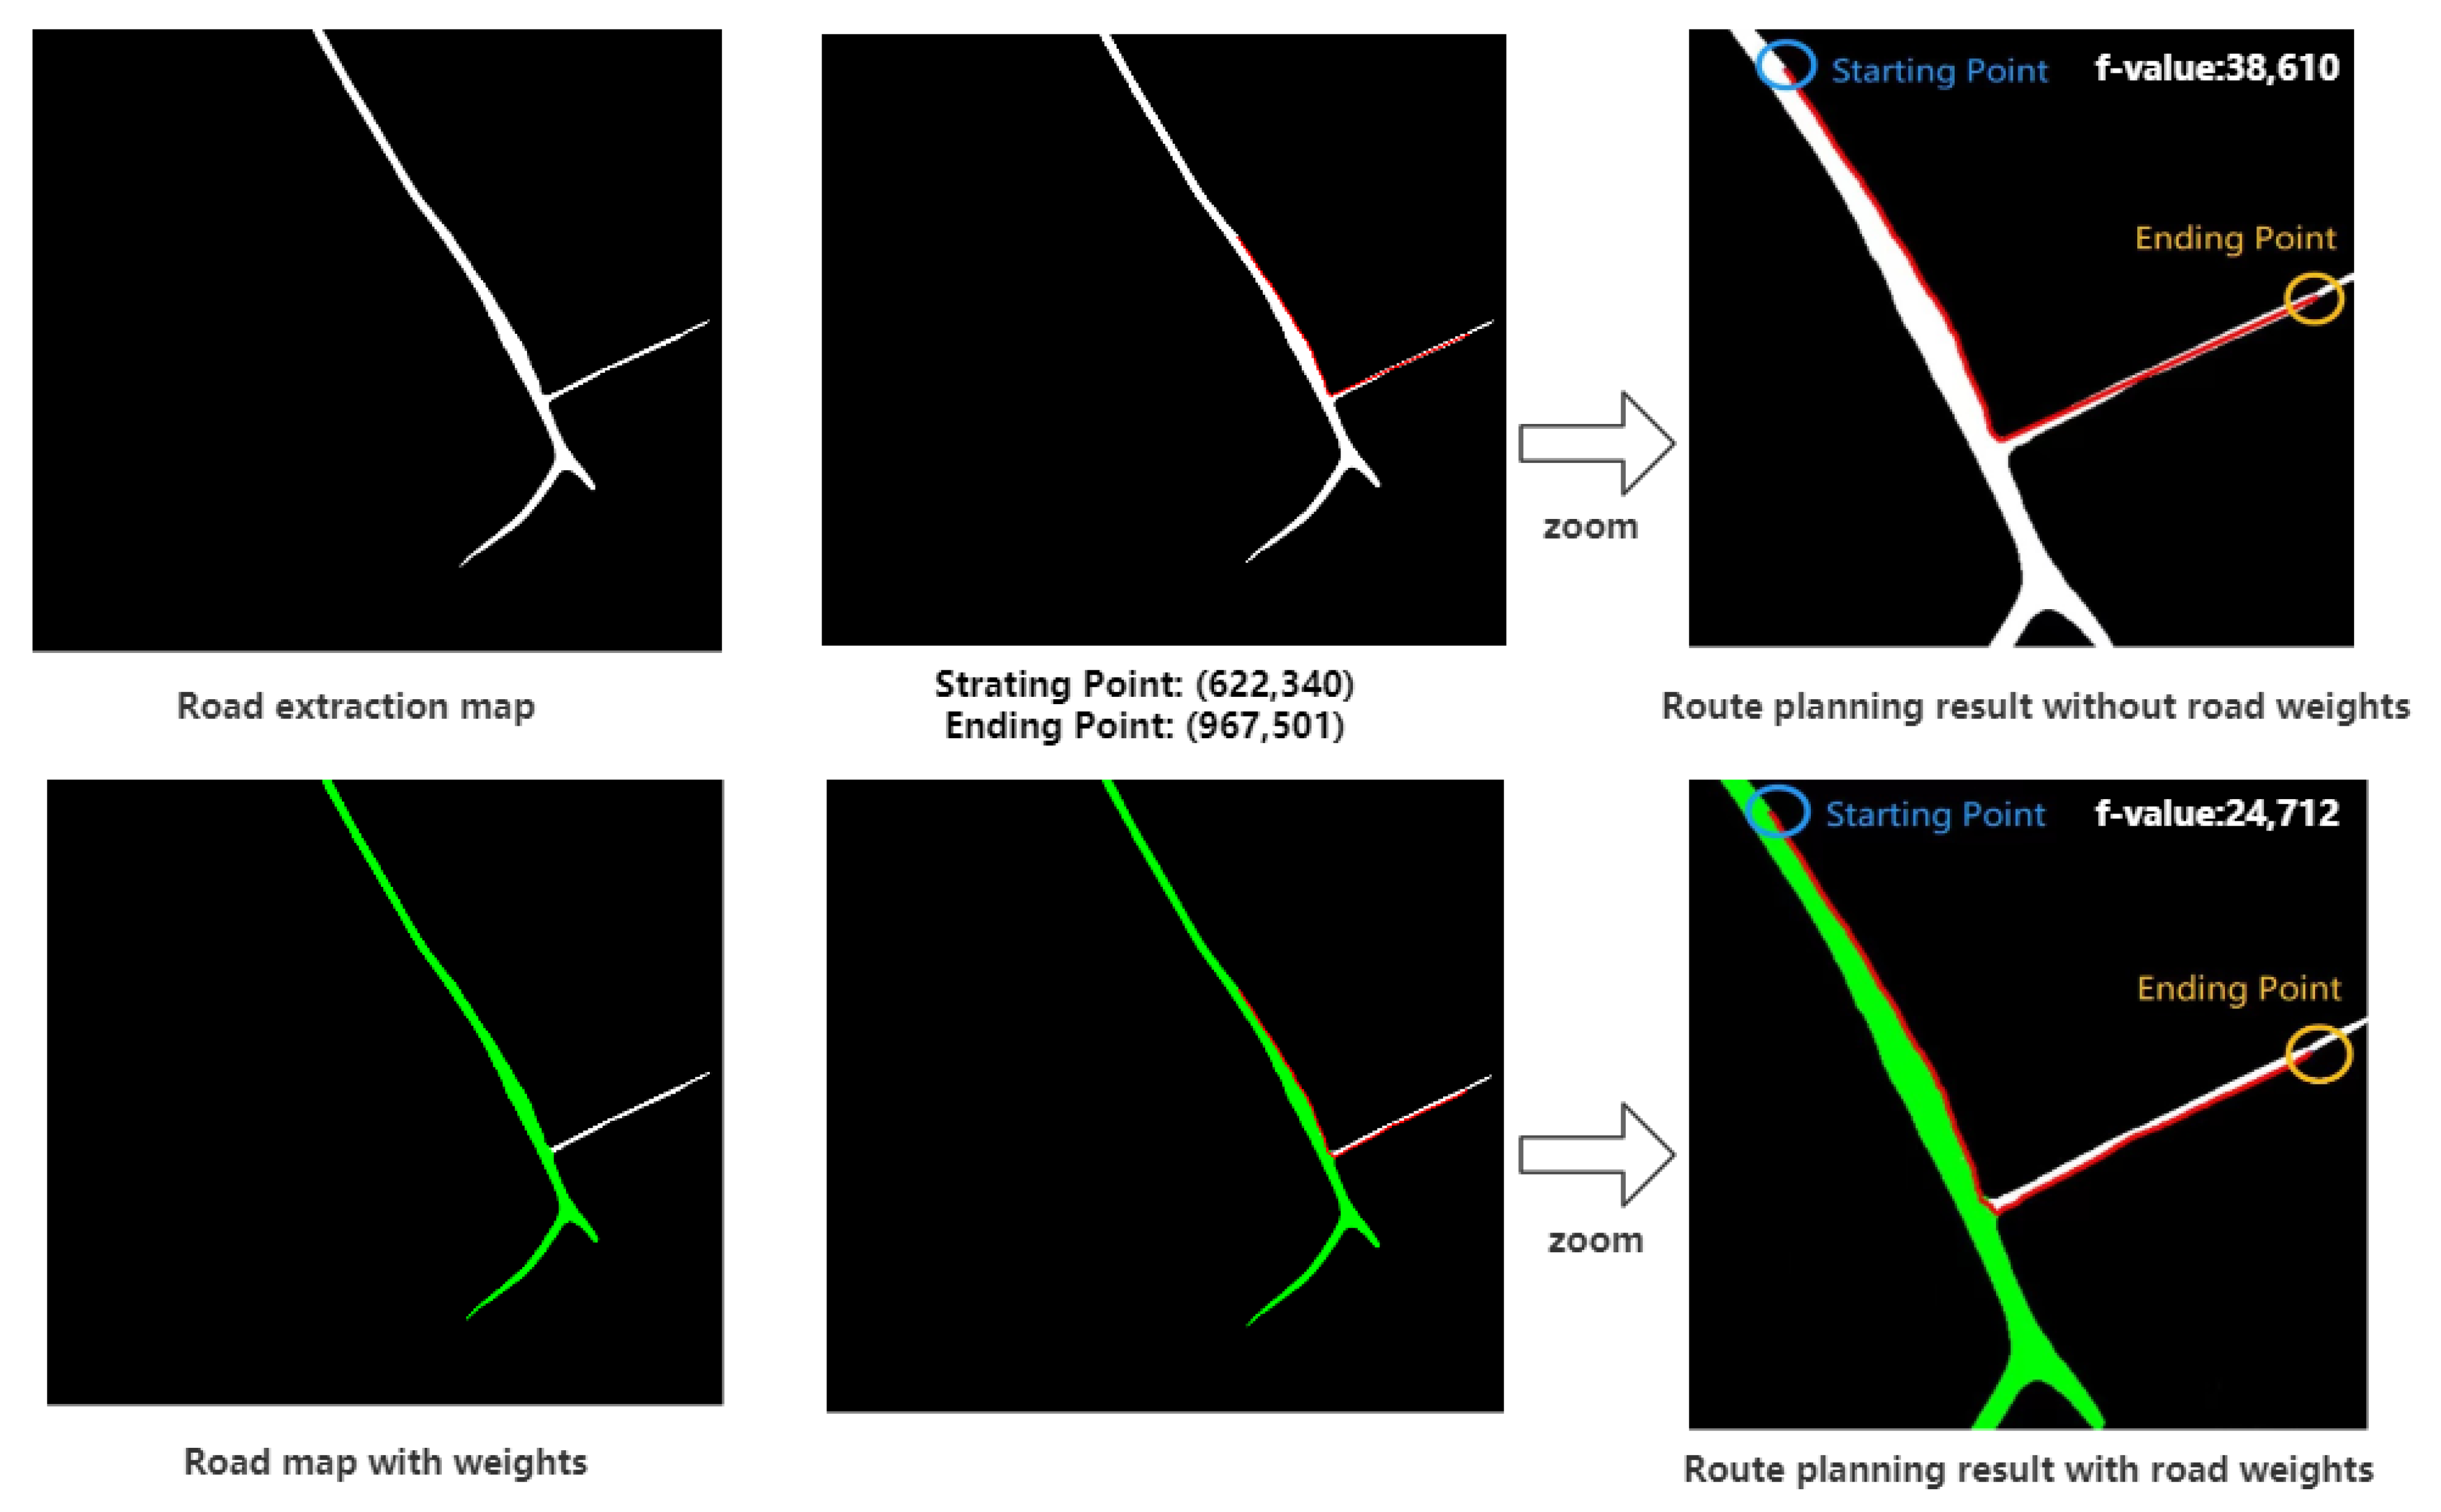
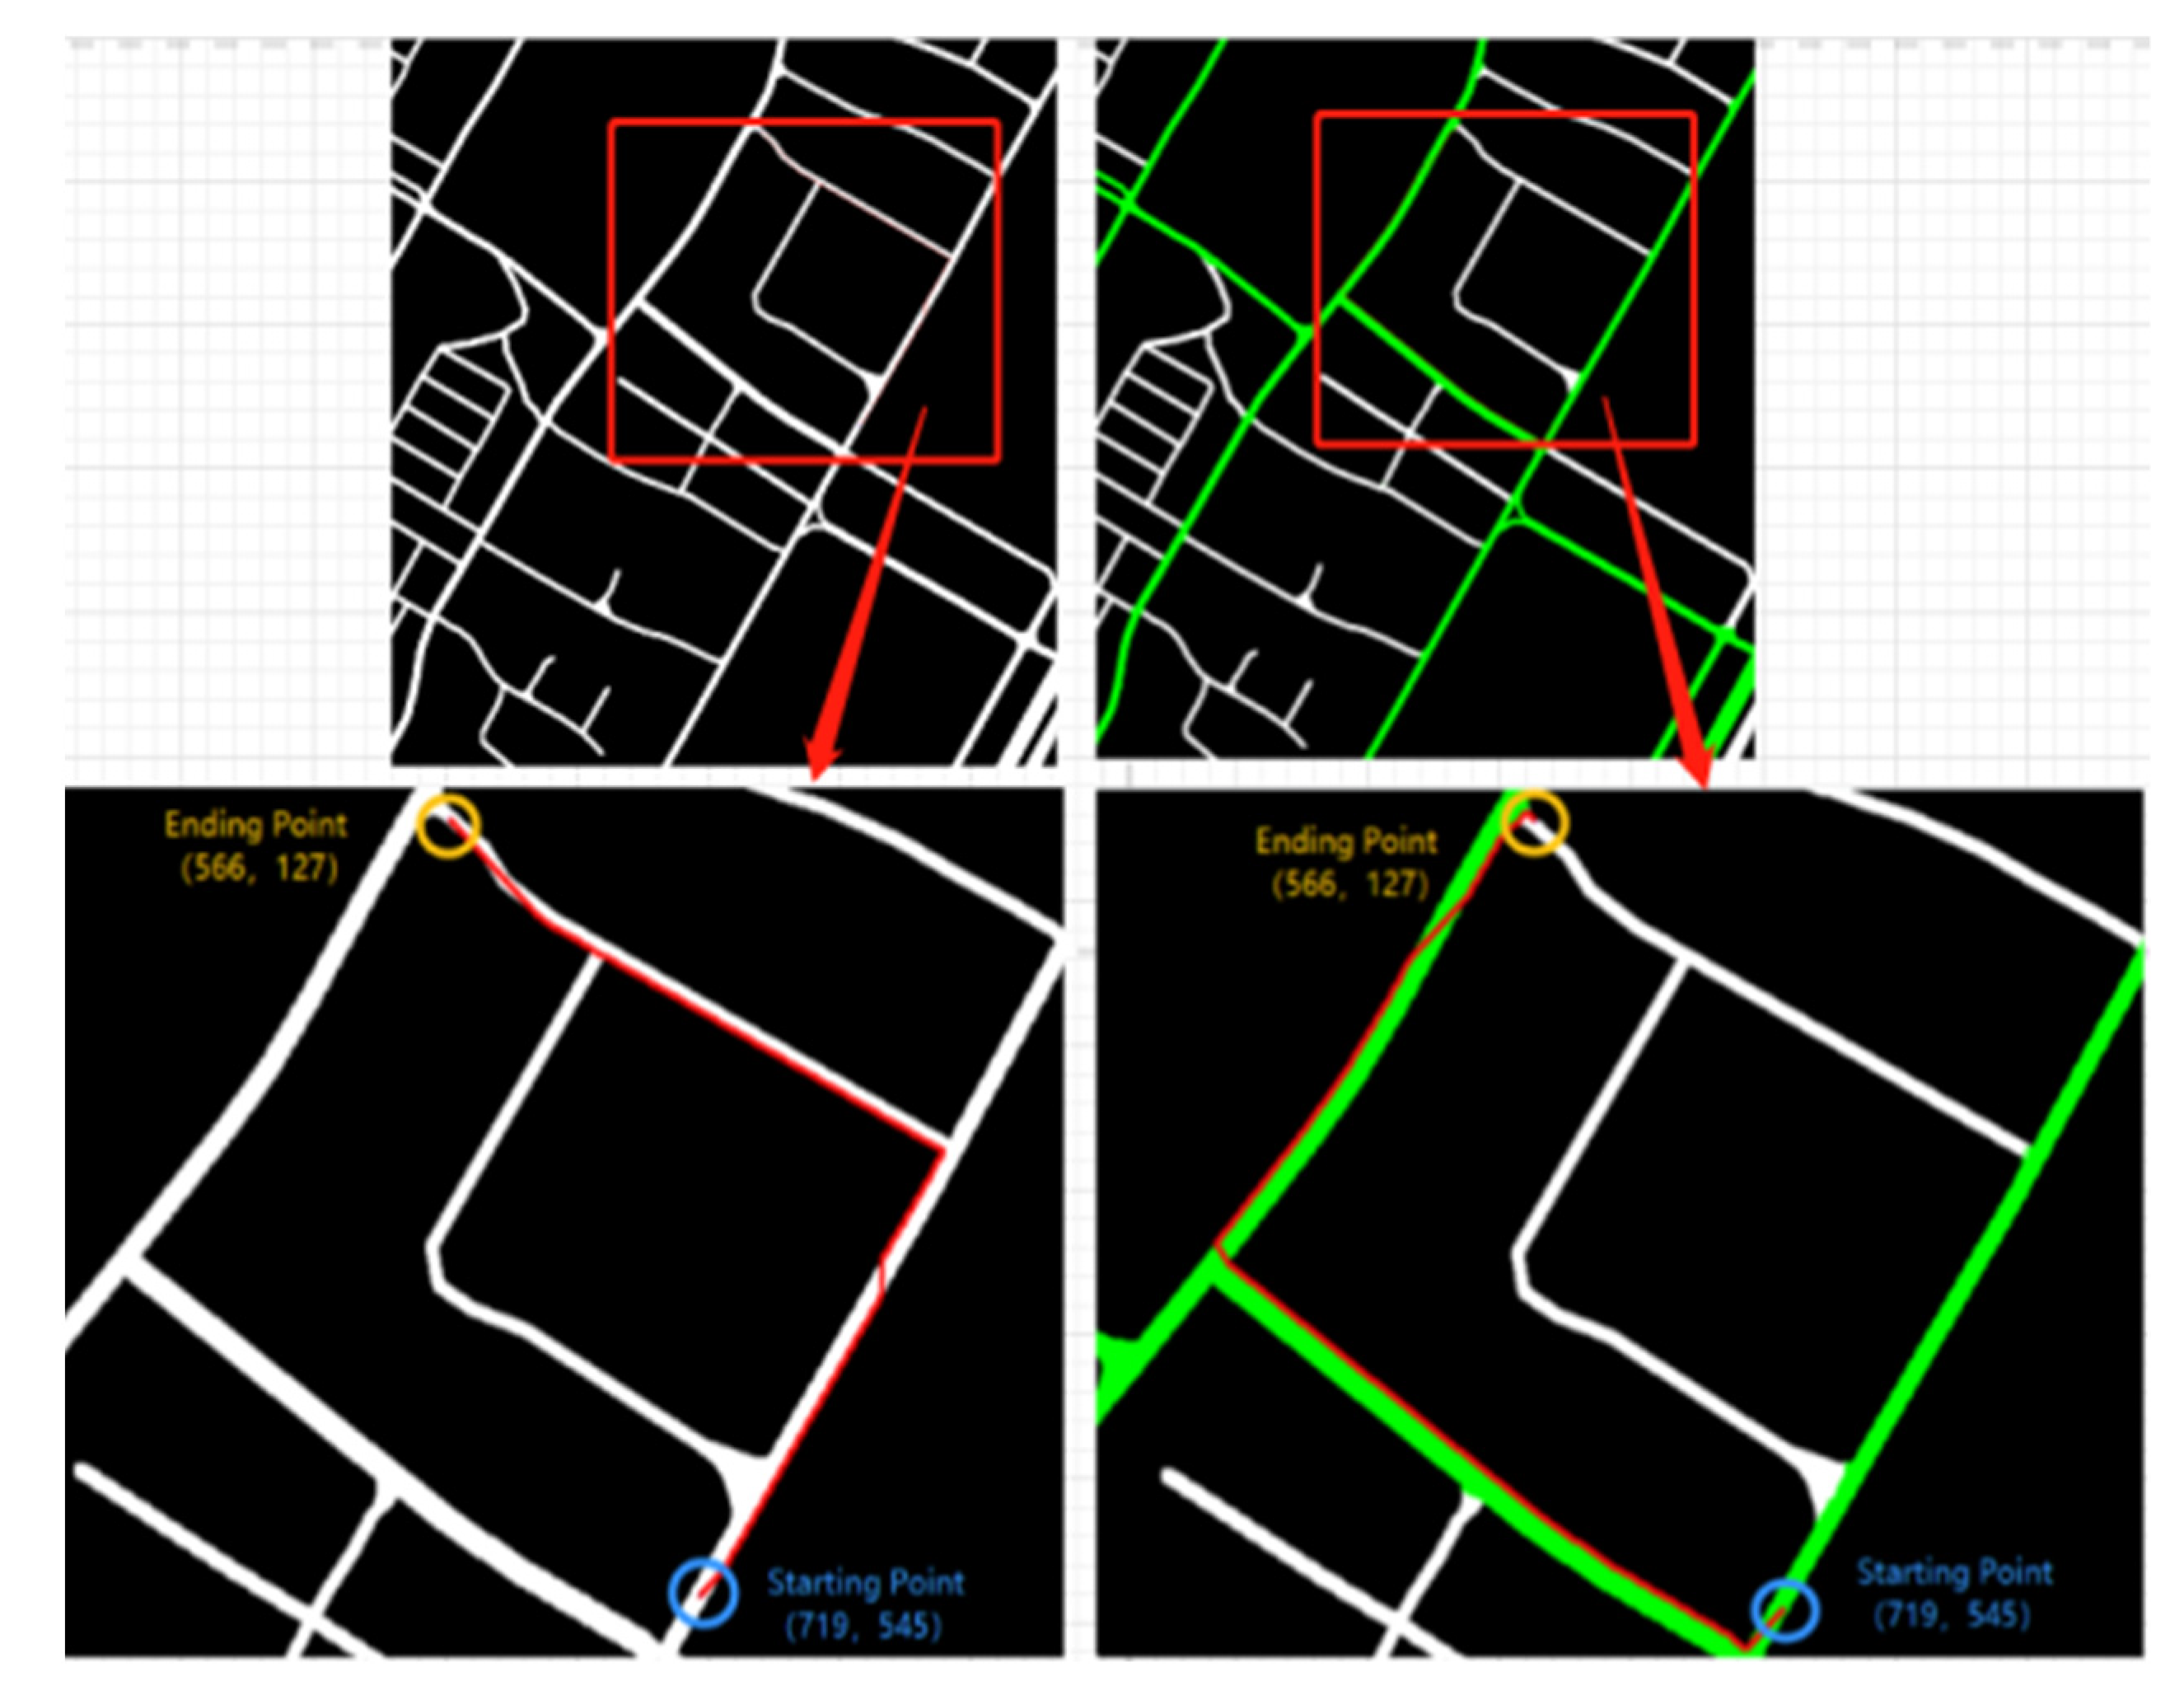
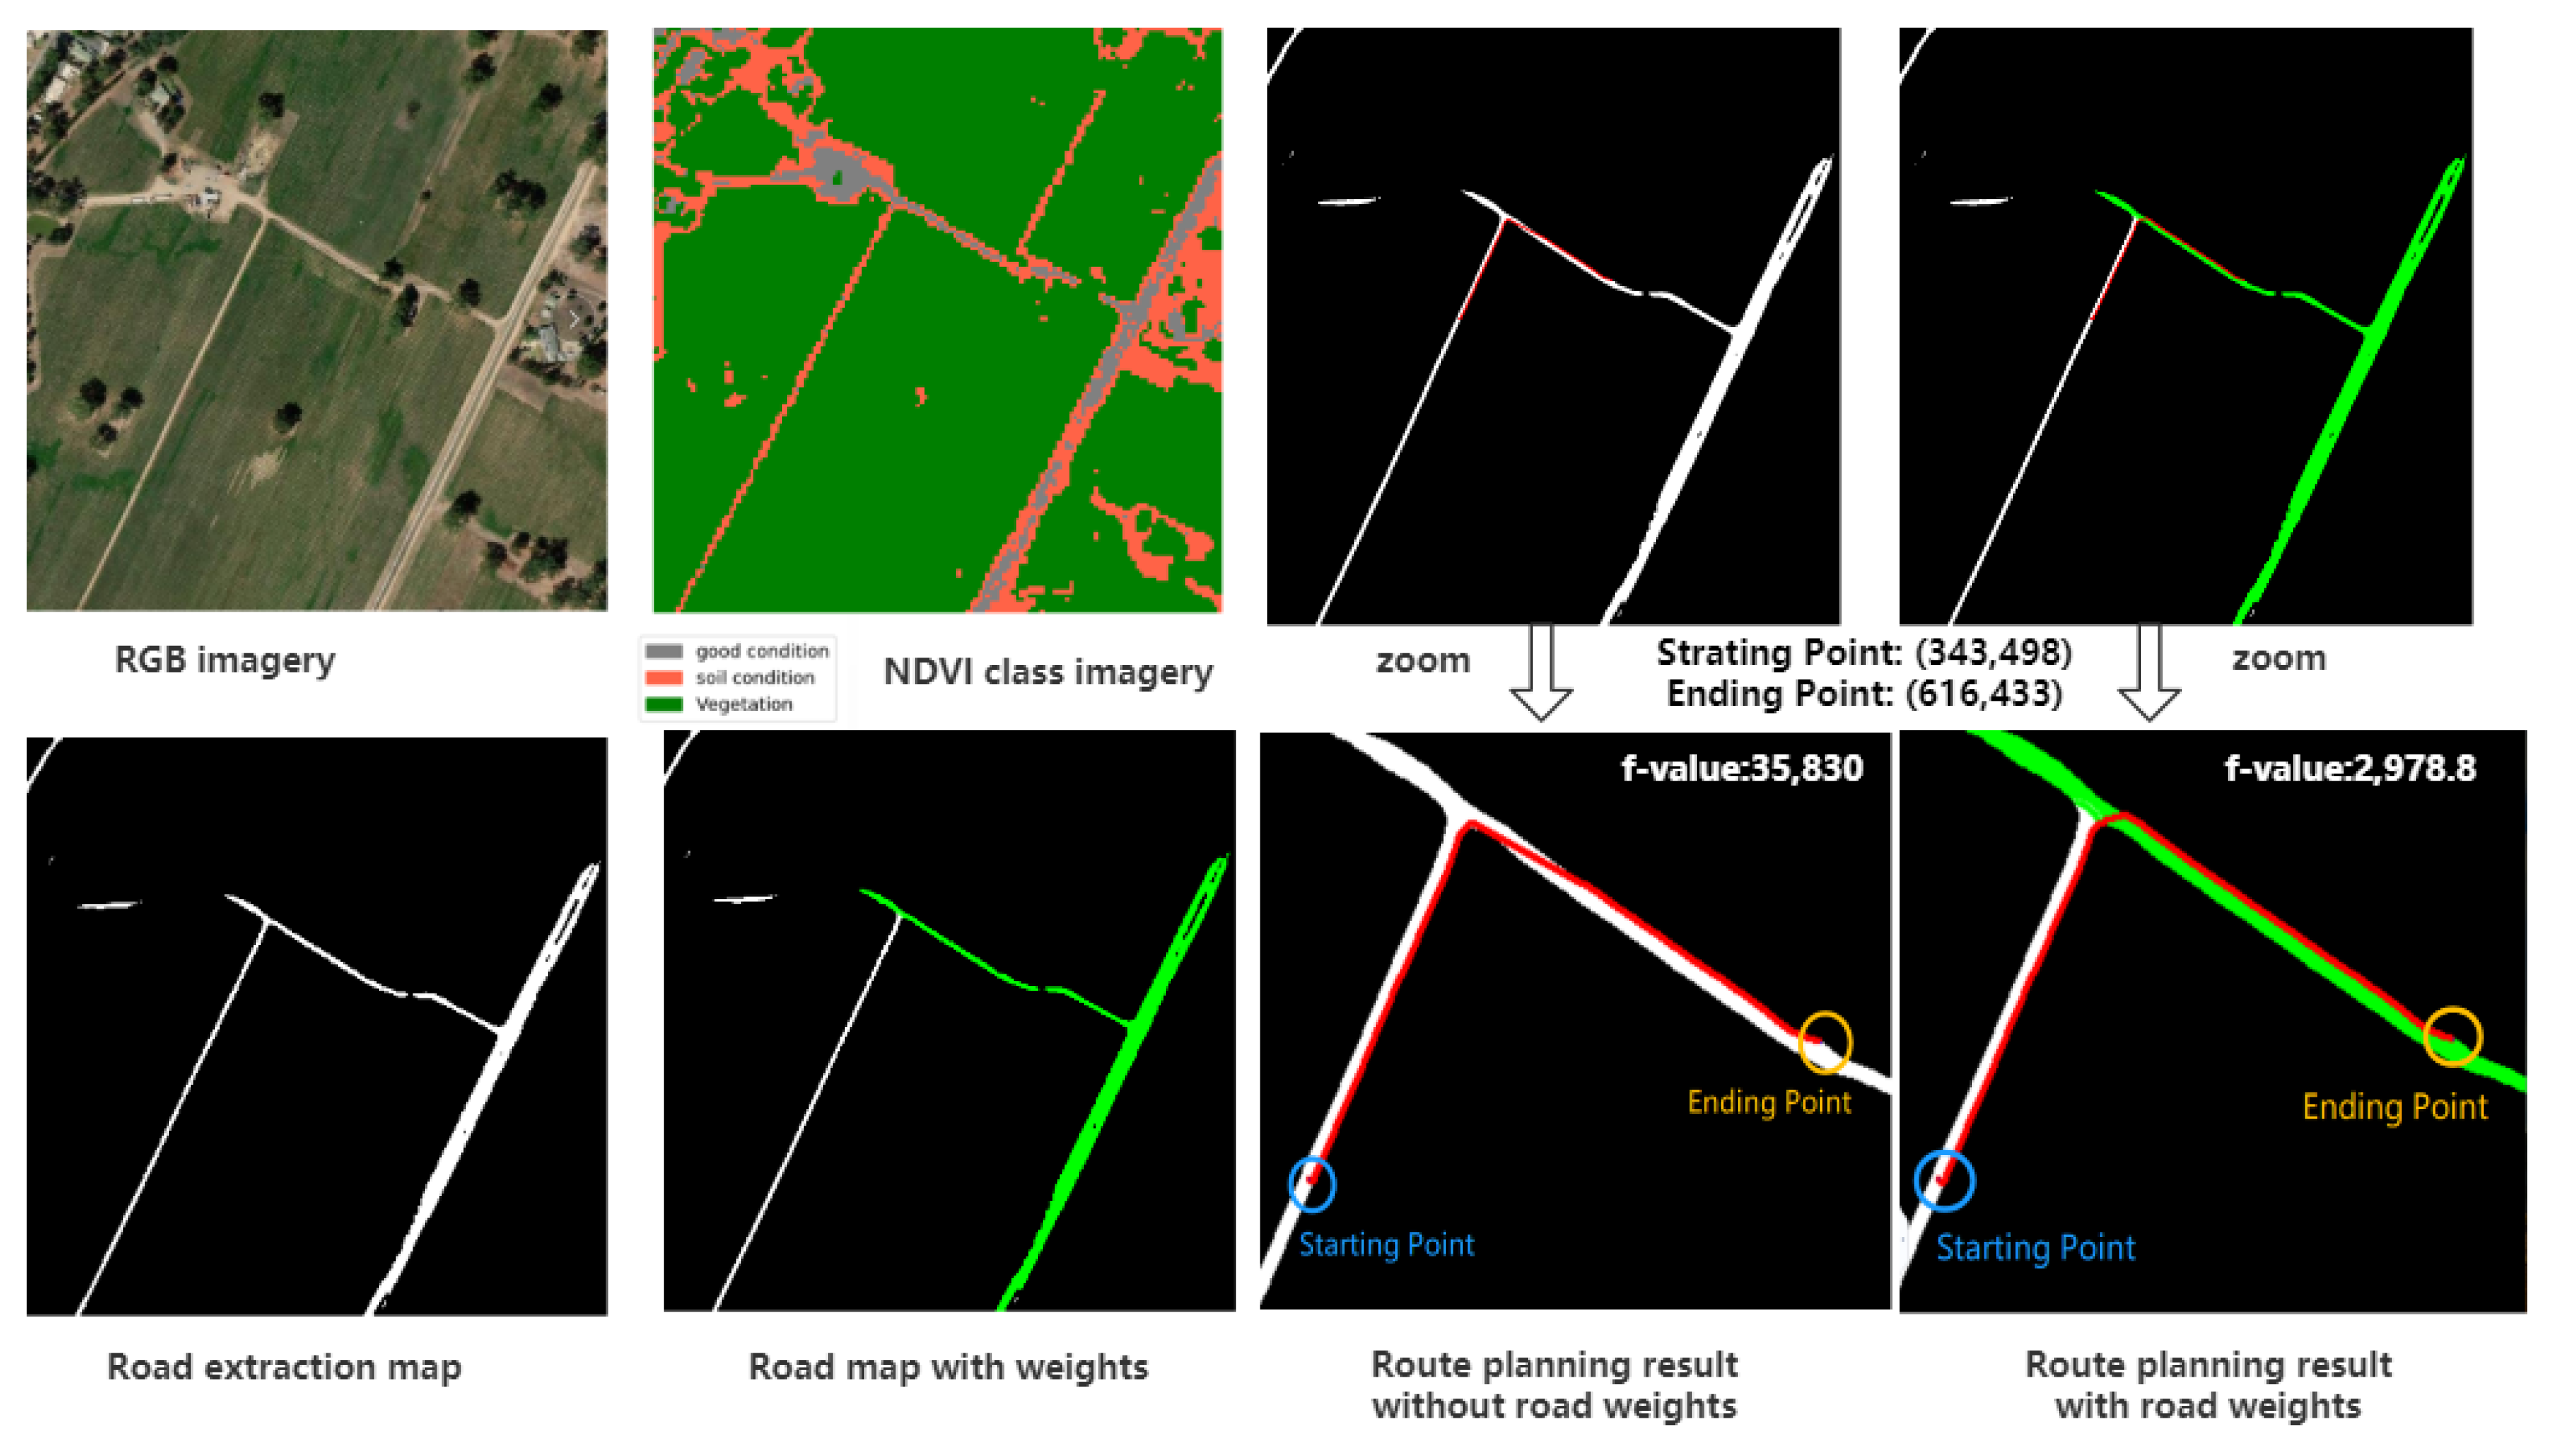
- Different roads are assigned weights by geometric features, such as road length and width on the road extraction map, as well as estimated pedestrian speed and road throughput;
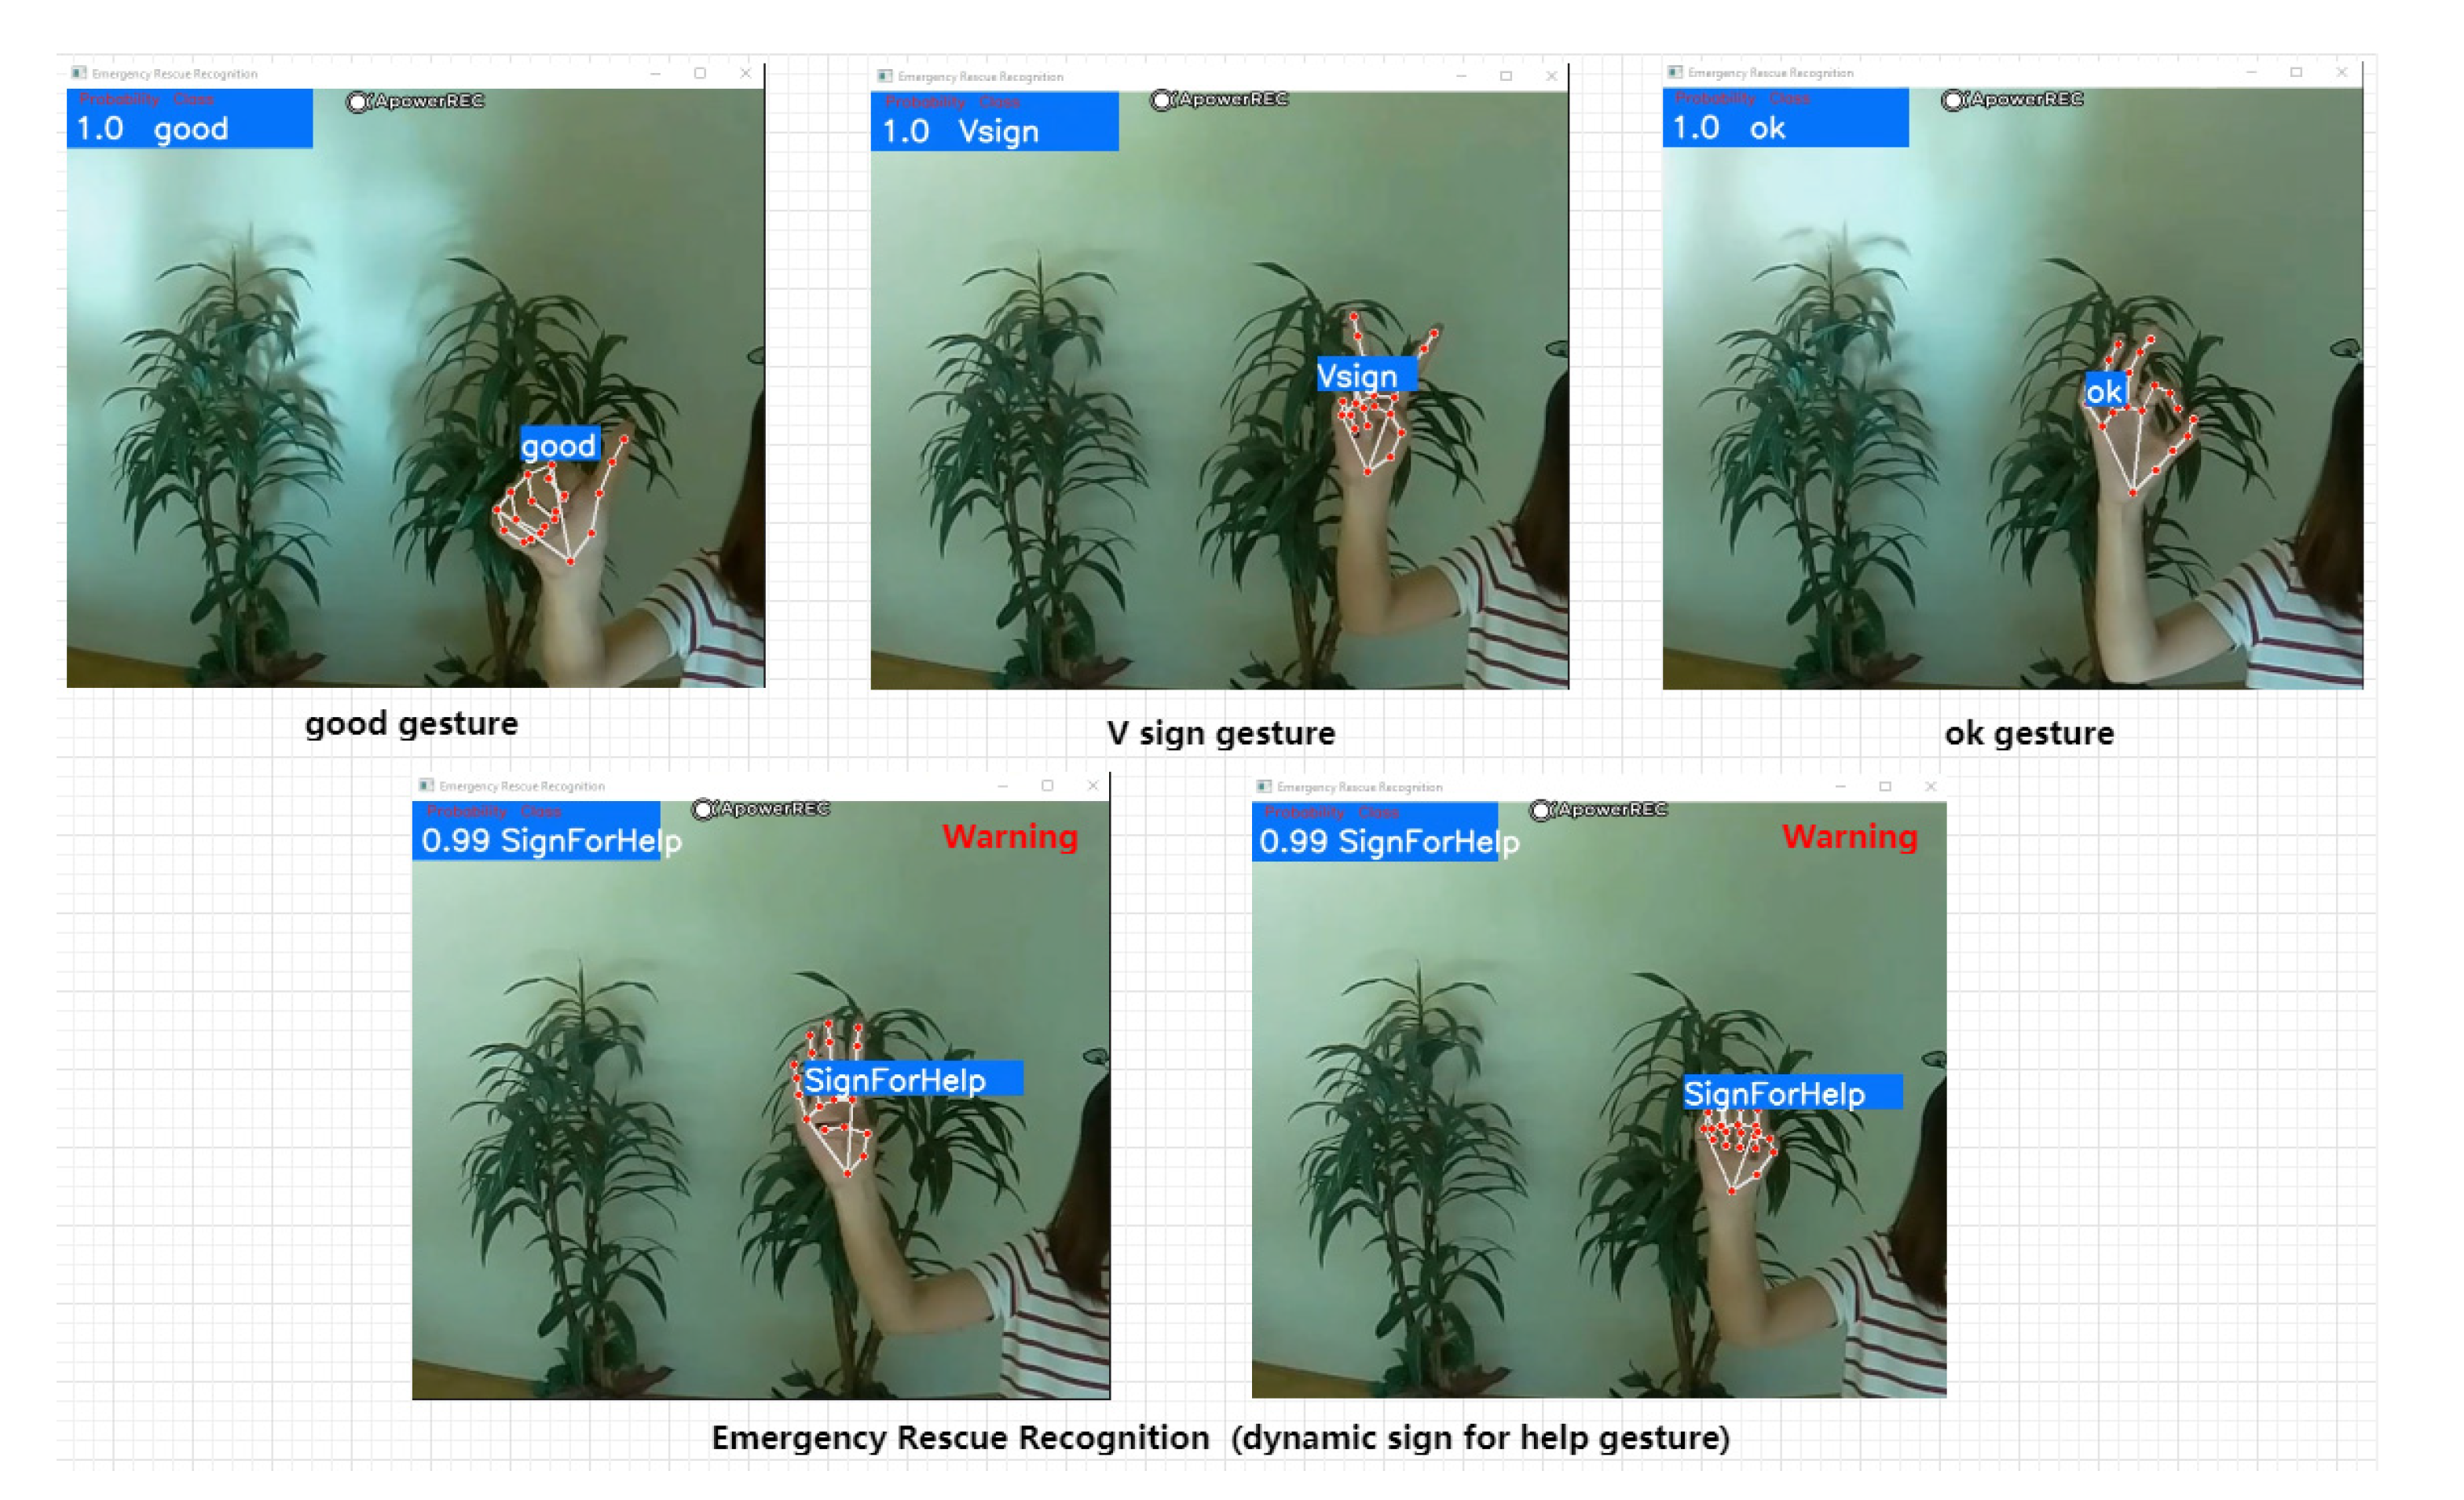
- Human–UAV interaction in low latitudes by adjusting the flight altitude of the UAV to facilitate the recognition of emergency hand gesture signals and potential hazards. e.g., injured or tired persons, or vehicles with technical defects.
- The drones use extracted road network maps with different weights to navigate the user in real-time and plan an optimal route that meets the needs by weighted searching algorithms;
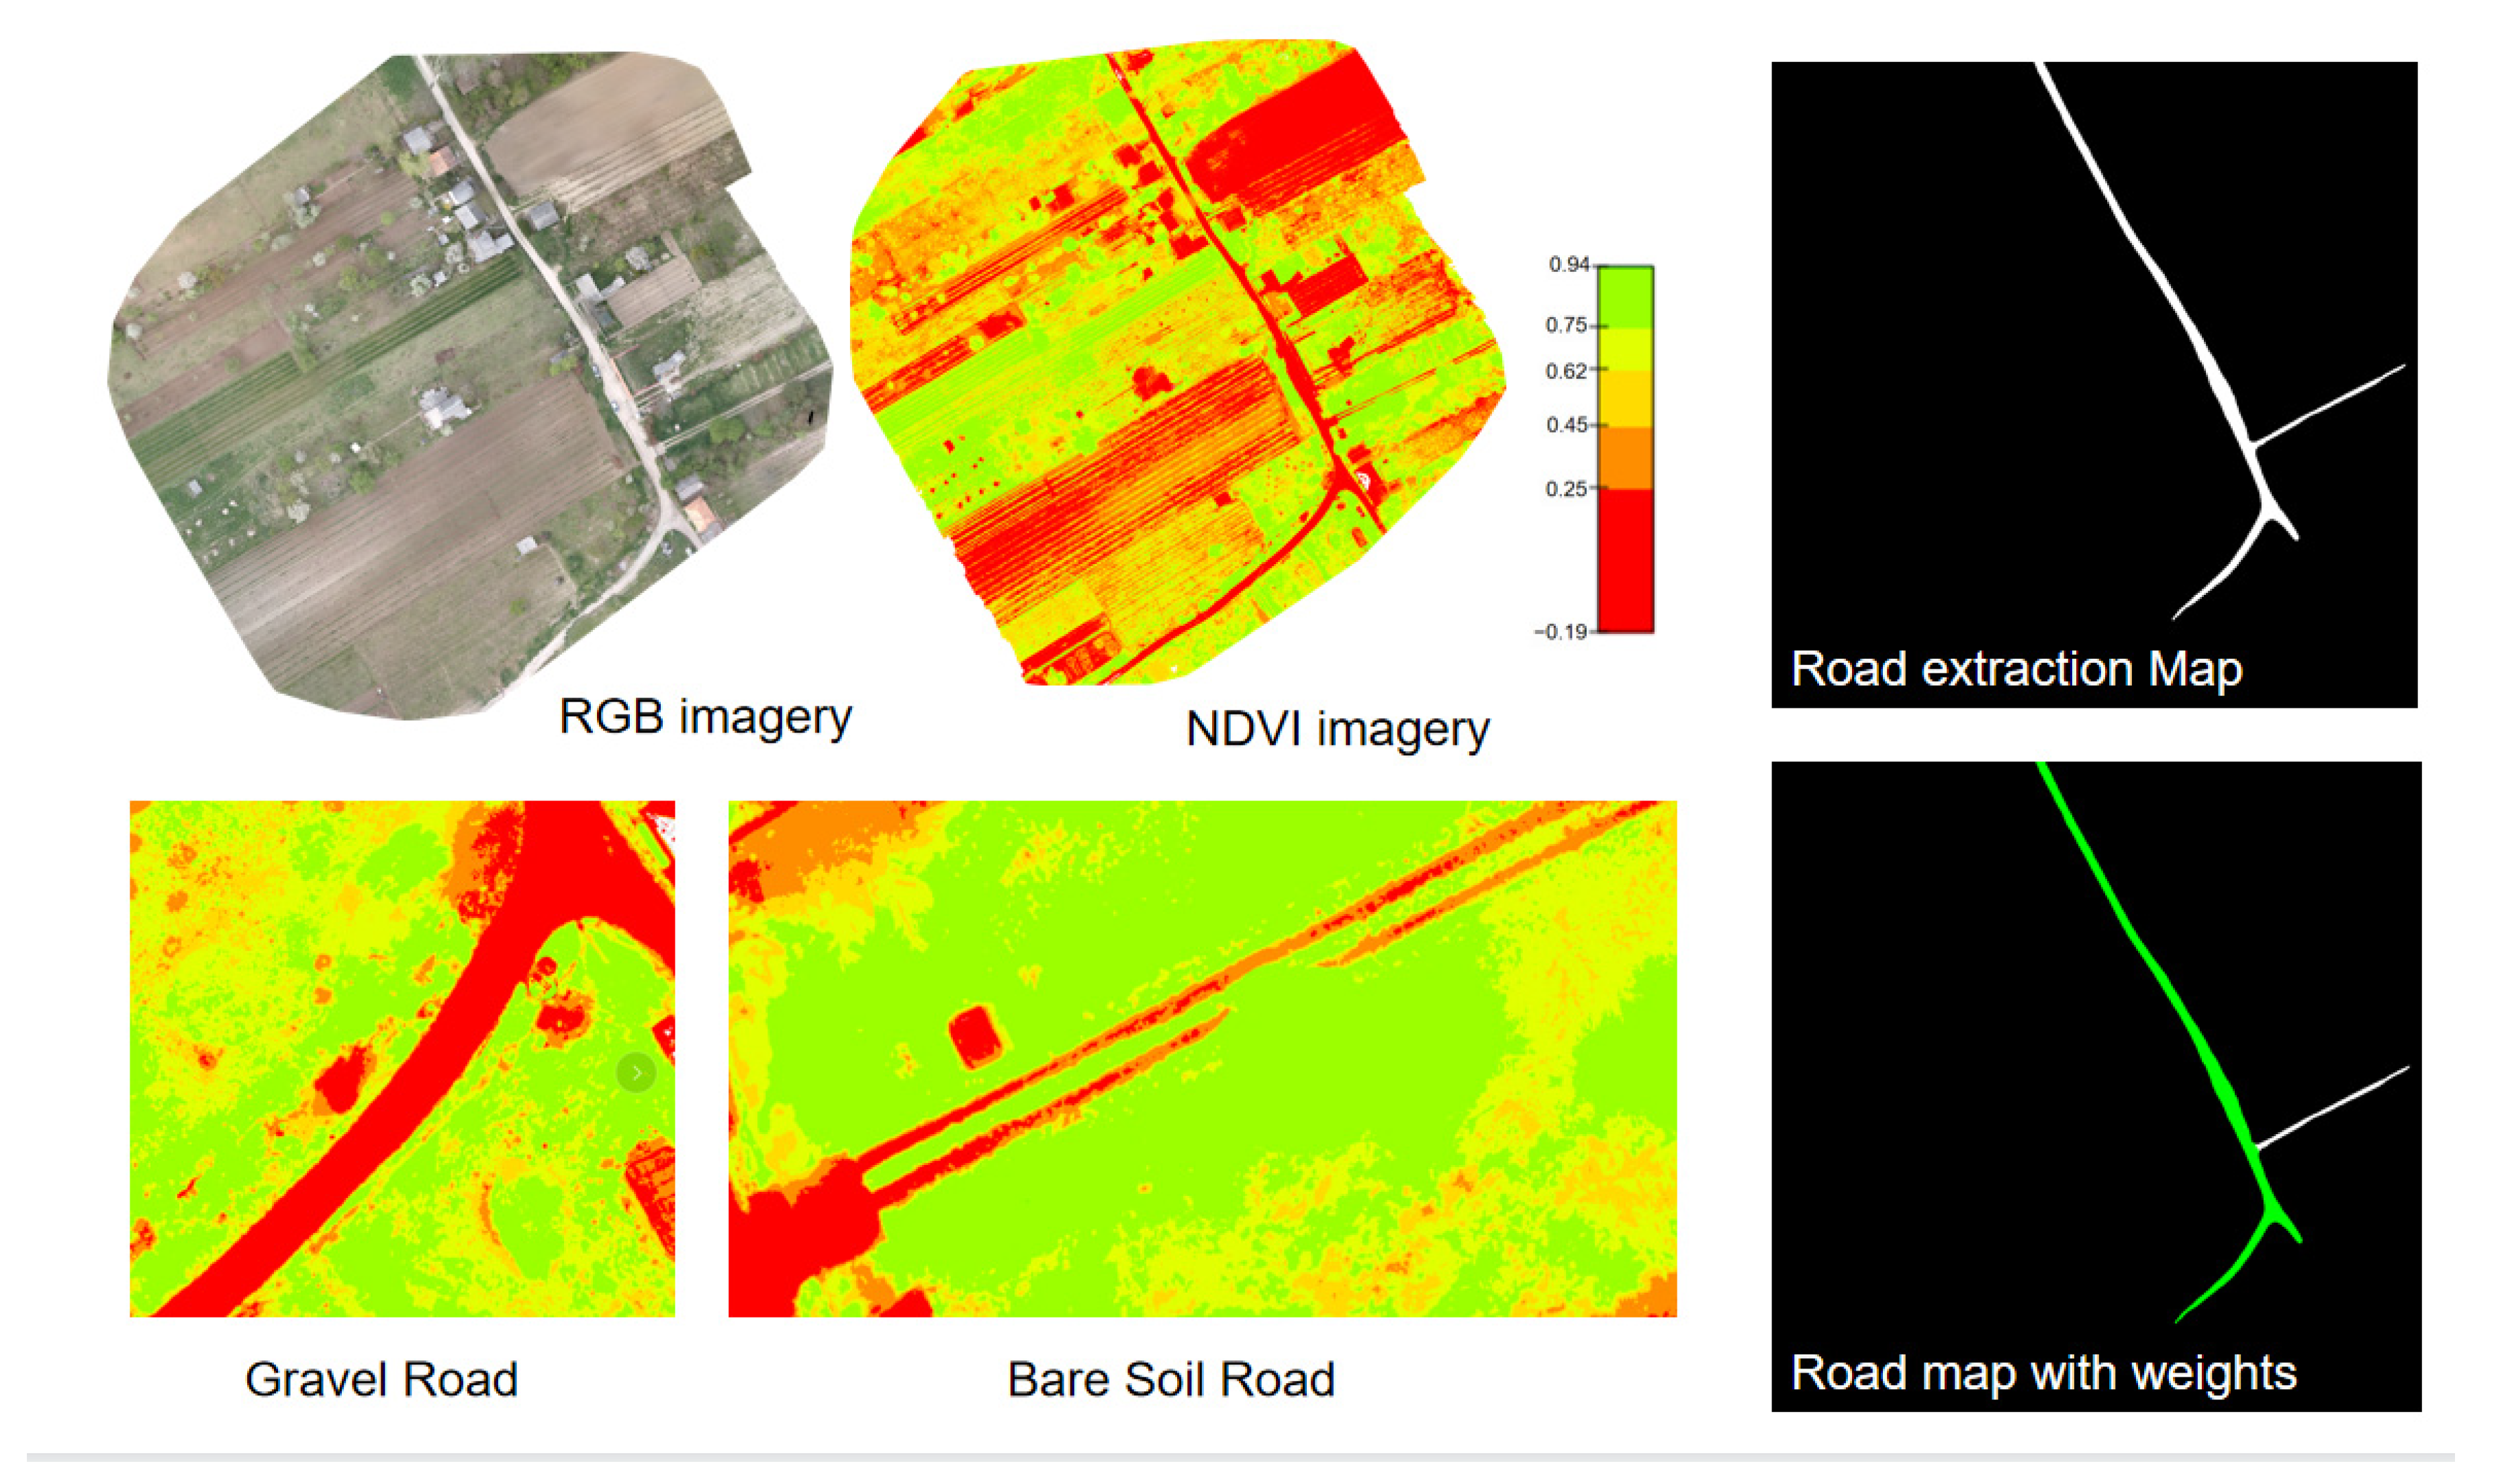
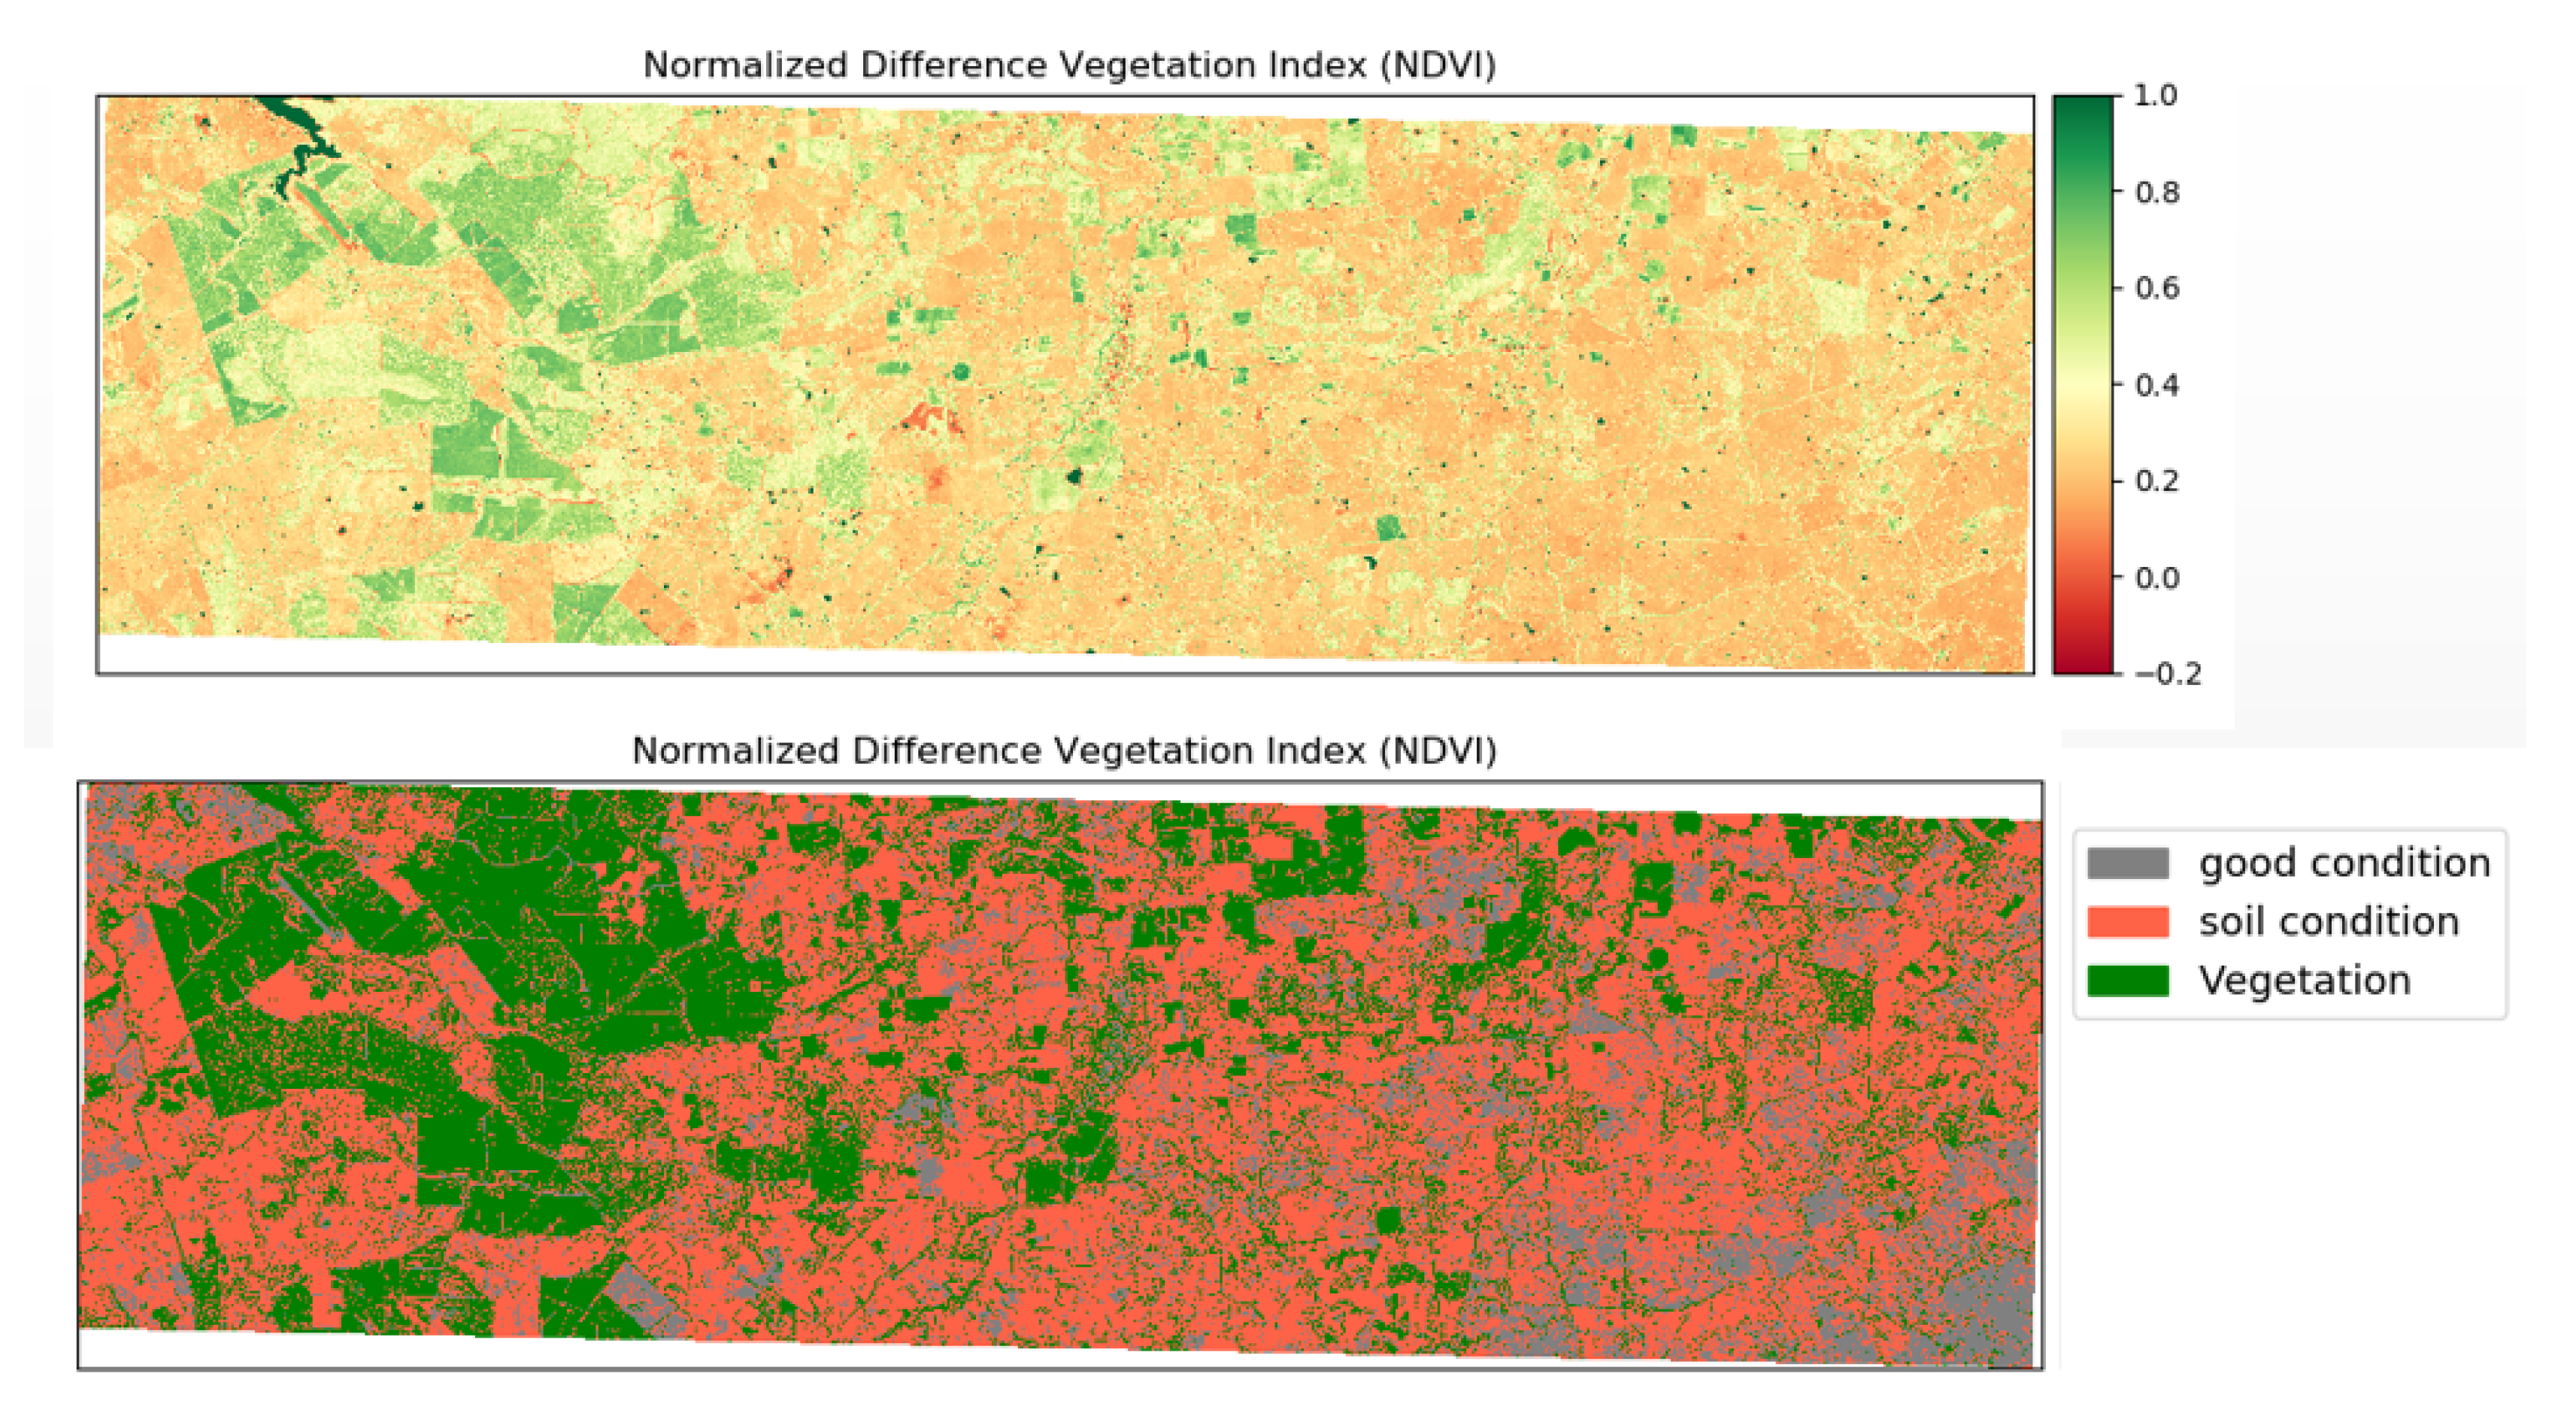
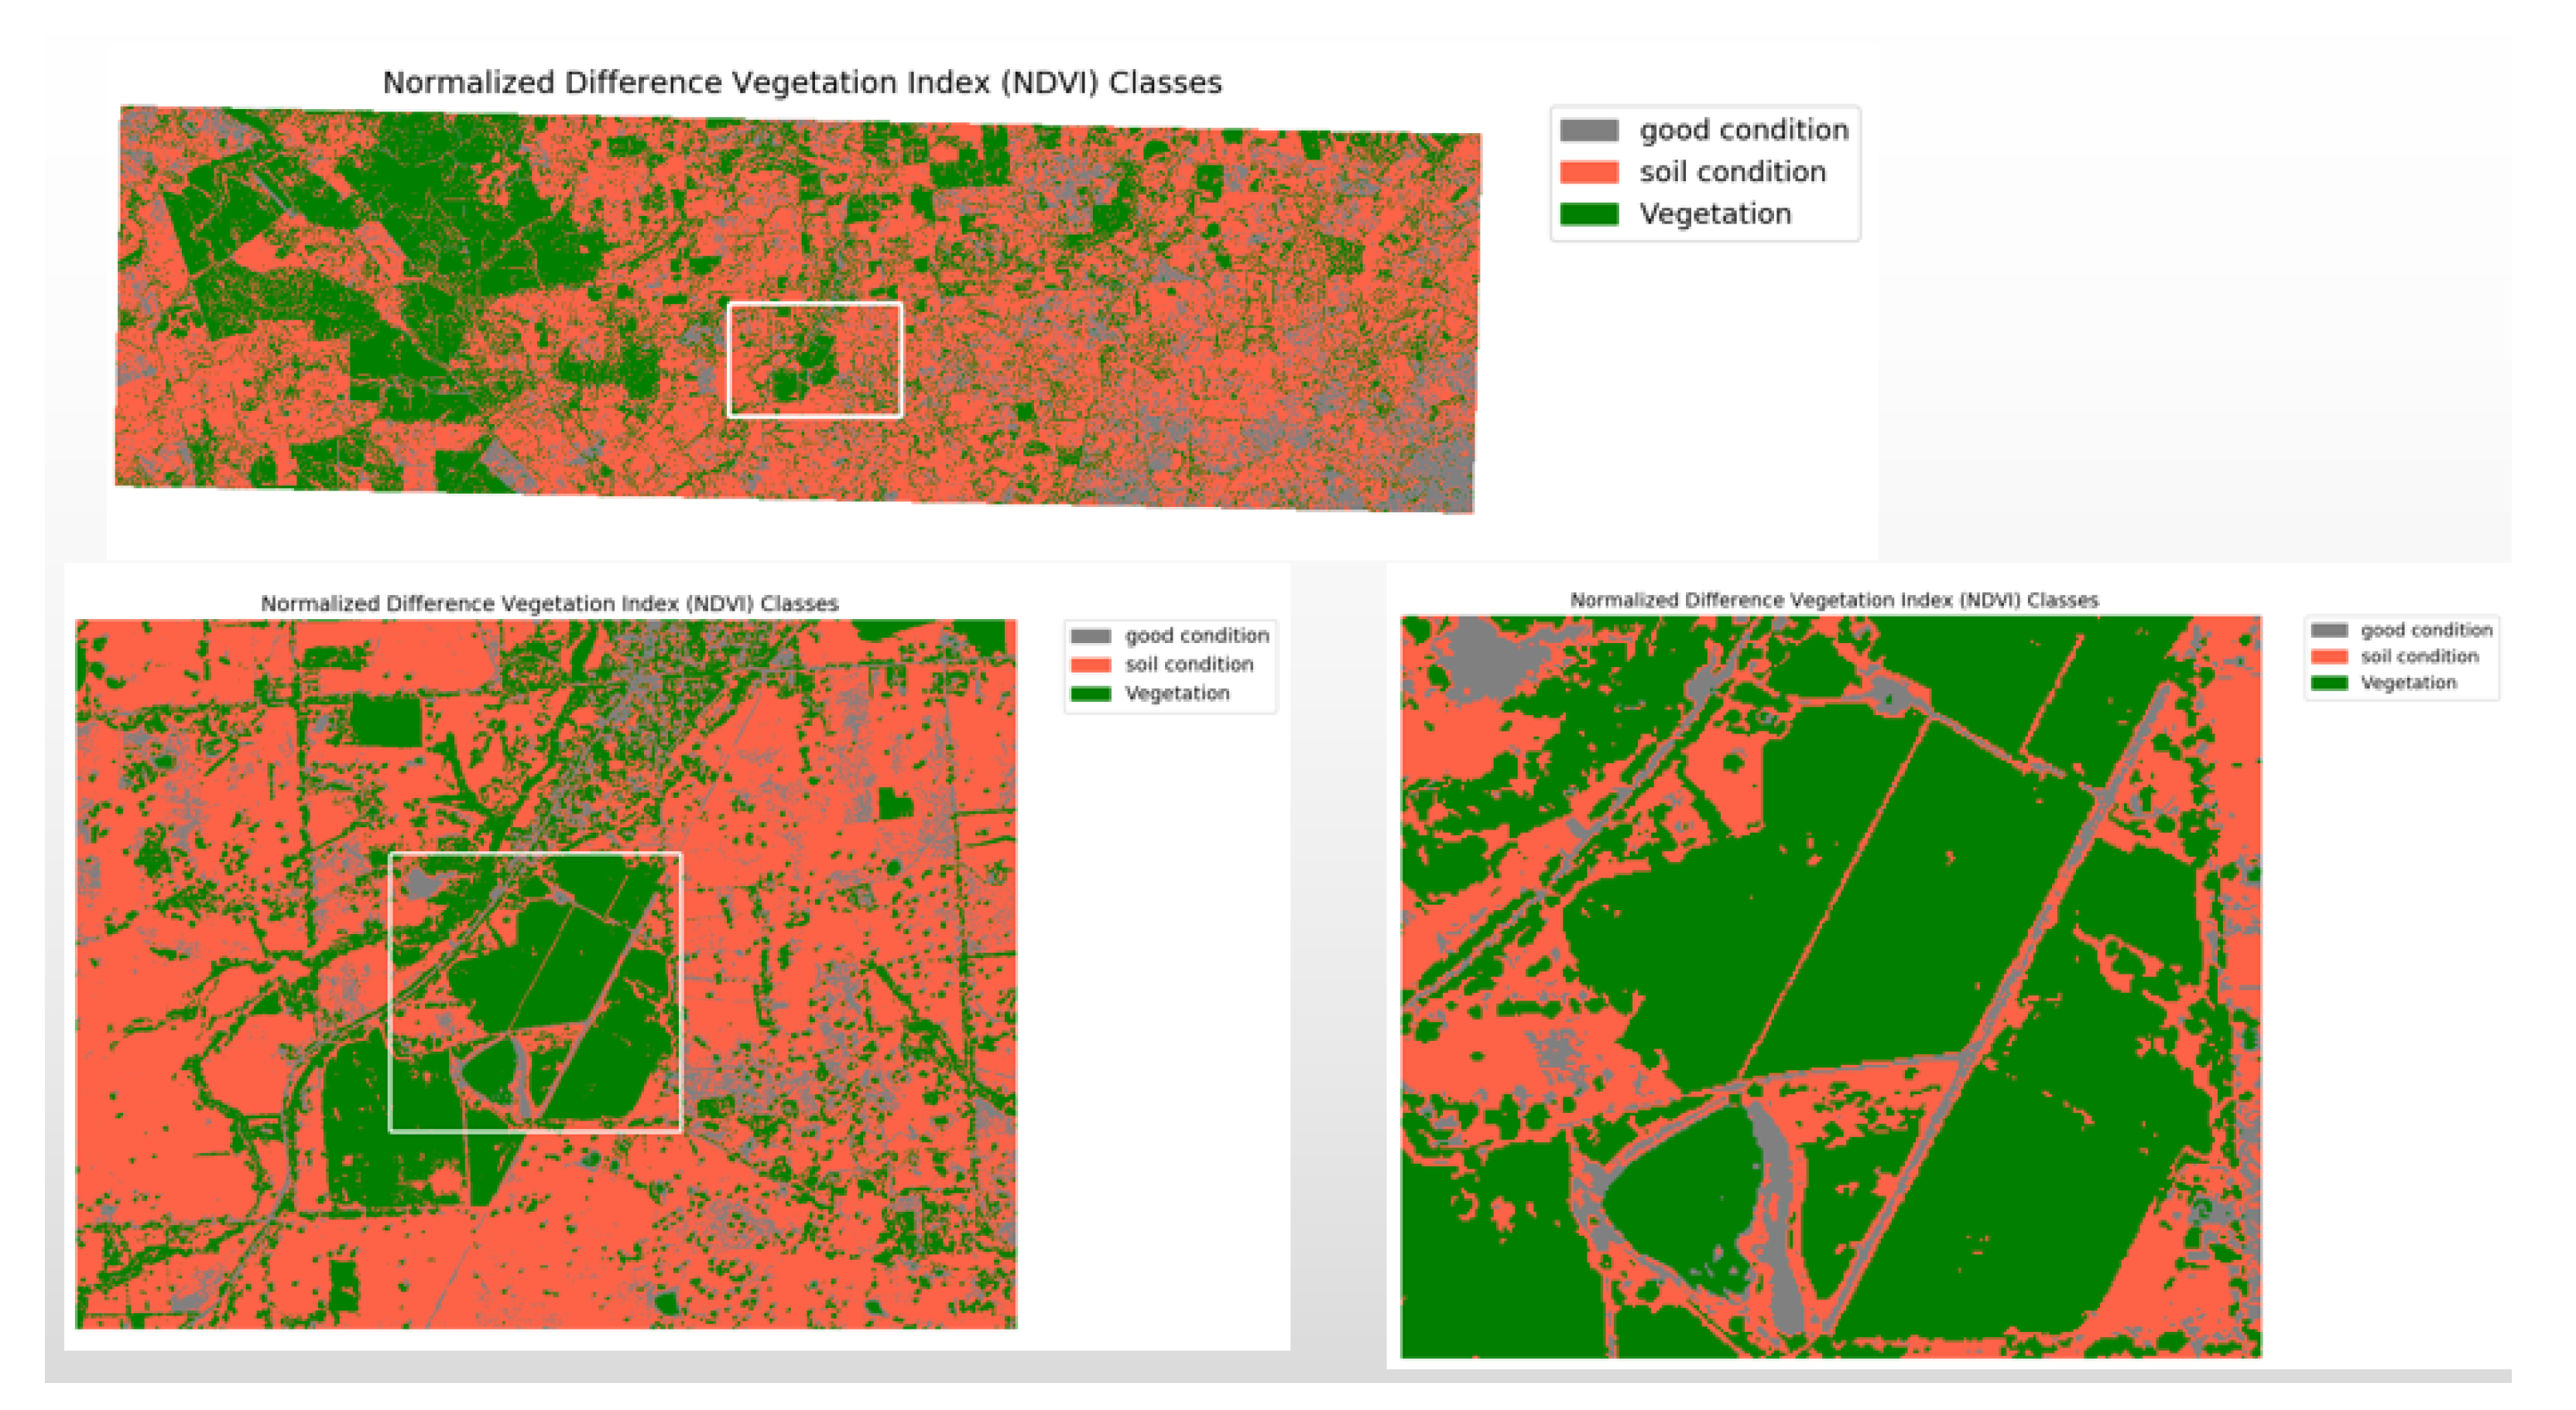
- The classification of normalized difference vegetation index (NDVI) values by multispectral images allows the differentiation of different road types. The walking speed of pedestrians on the road and the road throughput can be obtained by certain analyses;
- Road extraction allows us to obtain the length, width, and connectivity characteristics of a road. Pedestrian detection and tracking techniques allow for a theoretical evaluation of the road’s throughput. Combined with weather information and road surface materials, the walking speed of pedestrians can be estimated. In short, these are the main basis for road priority assignment;
- The model for human–UAV interaction needs to be accurate, stable, and robust enough when there is a problem with navigation or when a human is in danger and needs to be rescued. Different models need to be compared in order to select the best and most reliable one.
- The surface material of the roads in the wildness environment is classified using an immediate UAV-boarded multispectral camera or, additionally, the latest available satellite-based multispectral camera images. The main distinction was made between bare soil roads and concrete or gravel roads in good condition;
- When flying at high altitude, the UAV analyzed the road conditions based on the detected road surface materials and weather information, evaluated the throughput of different roads, and assigned different weights to the roads extracted from the map for optimal route planning;
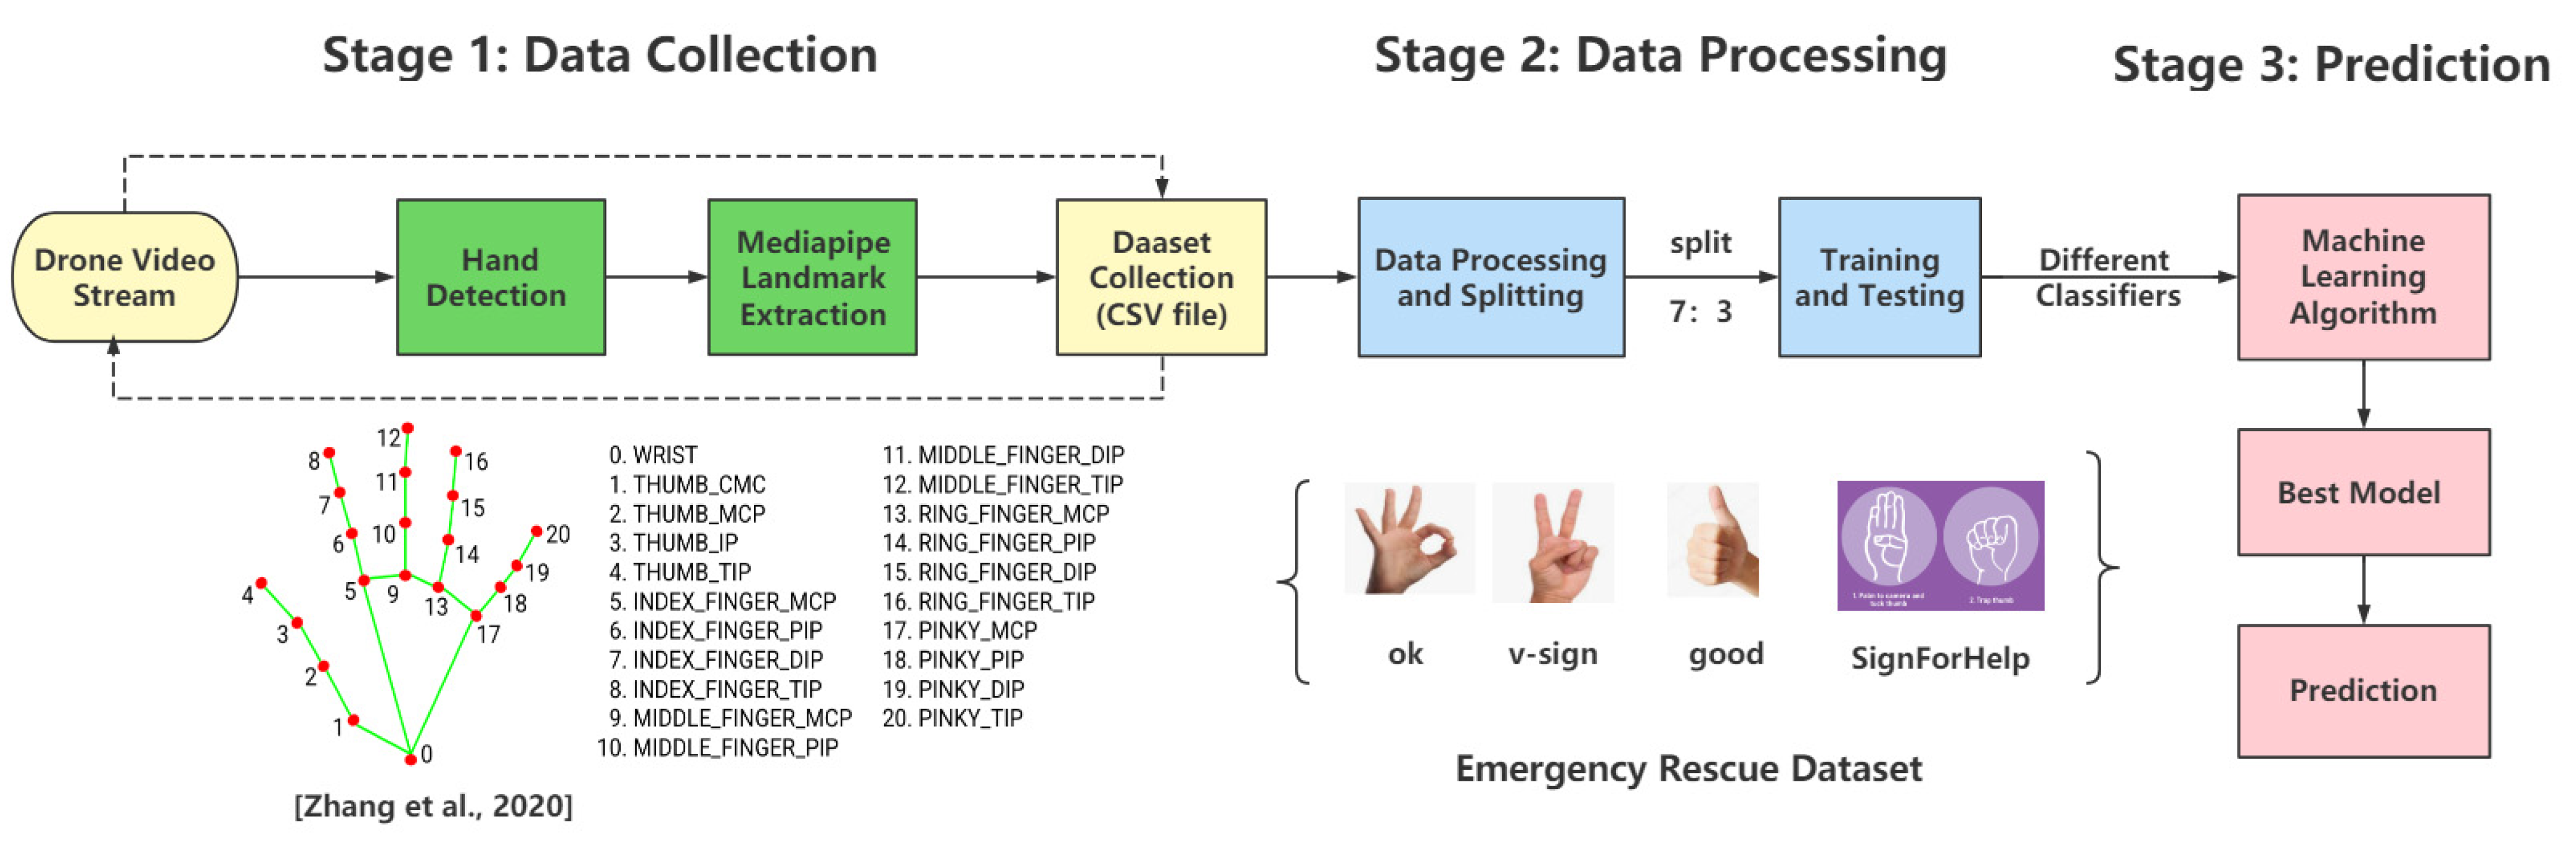
- When the UAV is flying at low altitudes, human–UAV interaction is possible. Based on the media-pipe hand landmarks, the “ok, good, v-sign, sign for help” dataset is created to identify emergency distress signals, so that corresponding measures can be taken to re-route or send rescuers;
- The fusion of low-altitude drone imagery and high-altitude satellite imagery allows for a wider range of search and rescue information. Drones use their flexibility for high-altitude road condition detection and extraction, low-altitude human–UAV interaction, and emergency hazard identification to maximize their ability to help humans in distress.
2. Related Work
2.1. Technical Background
2.2. Related Datasets and Data Processing
2.3. Road Extraction and Optimal Route Planning
3. Methodology
3.1. Proposed System
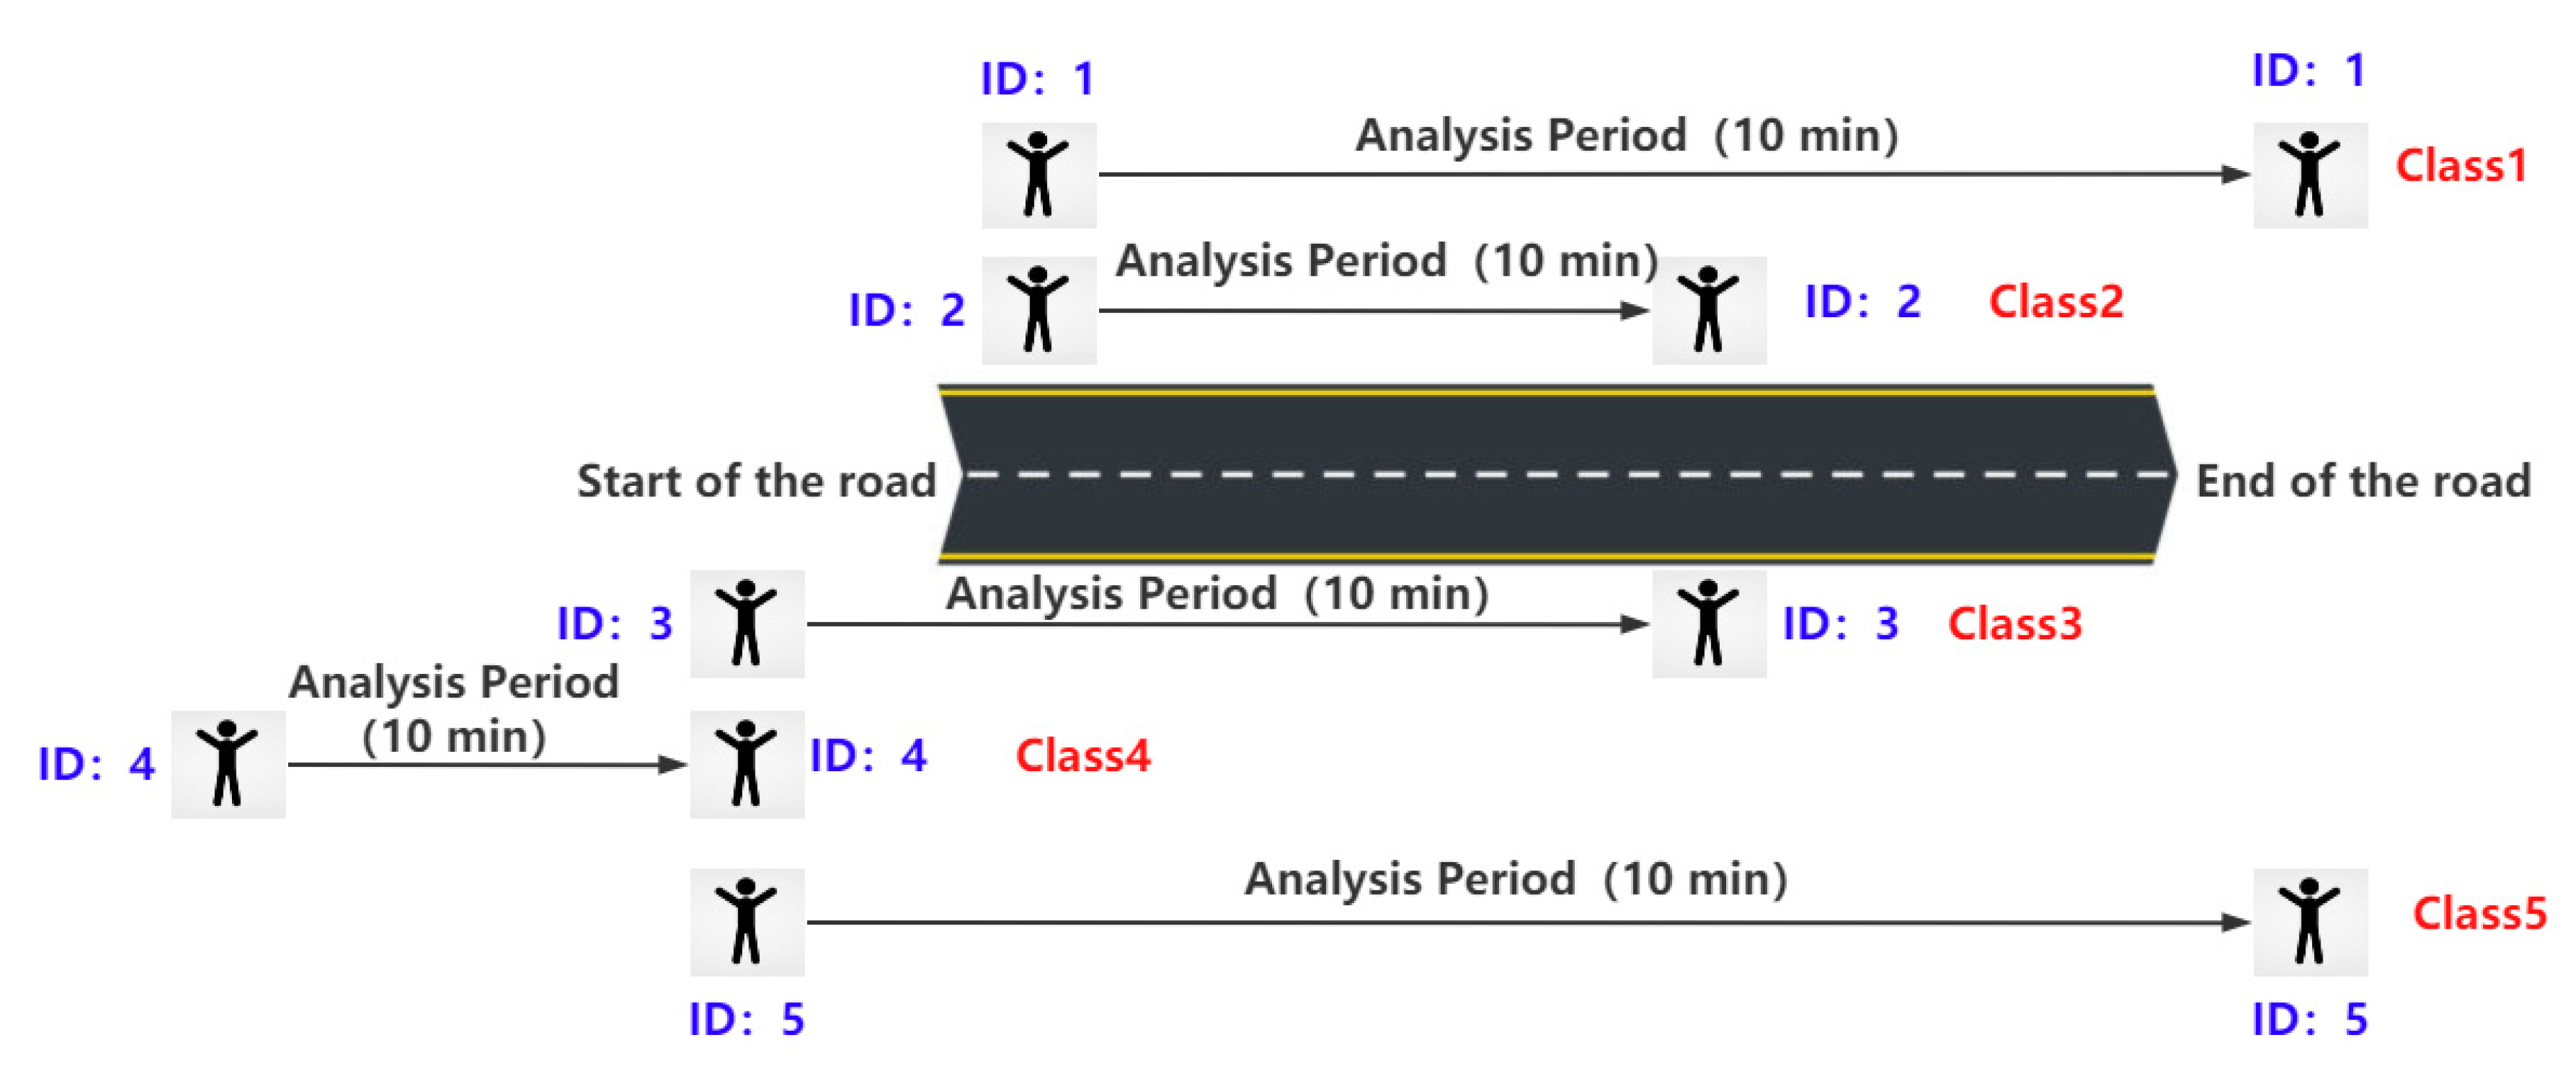
3.2. Road Surface Detection and Road Throughput Evaluation
- Human Class 1—people that were present at the start of the analysis period and were able to successfully exit the road before the end of the analysis period;
- Human Class 2—people that were present at the start of the analysis period but were unable to successfully exit the road before the end of the analysis period;
- Human Class 3—people that were able to enter the road during the analysis period but were unable to successfully exit the road before the end of the analysis period;
- Human Class 4—people that tried to enter the road during the analysis period but were completely unsuccessful;
- Human Class 5—people that entered during the analysis period and were able to successfully exit the road before the end of the analysis period.
3.3. Emergency Rescue Recognition
4. Experiments and Results
4.1. Road Surface Condition Detection and Optimal Route Planning Results
4.2. Human–UAV Interaction for Emergency Rescue Recognition
5. Discussion
6. Conclusions
- Drones can plan the optimal routes in real-time for humans in the wilderness with poor network conditions and bad weather;
- Different road types are well differentiated, the walking speed of pedestrians is estimated, and the throughput of the road can theoretically be evaluated;
- In the road extraction network map, the priority of the different roads is given on a sufficient basis, which refines our previous work;
- Here, UAVs flying at low latitudes can perform human–machine interaction tasks very accurately.
- Estimating the soil type from multispectral information;
- Estimating the road quality from the weather and soil information;
- Finding the paths/roads on the terrain;
- Weighting the paths by walking/driving quality measure;
- Finding the optimal routes based on the weighted route-map.
Author Contributions
Funding
Data Availability Statement
Acknowledgments
Conflicts of Interest
References
- Mavridou, E.; Vrochidou, E.; Papakostas, G.A.; Pachidis, T.; Kaburlasos, V.G. Machine vision systems in precision agriculture for crop farming. J. Imaging 2019, 5, 89. [Google Scholar] [CrossRef] [PubMed]
- Song, H.; Liang, H.; Li, H.; Dai, Z.; Yun, X. Vision-based vehicle detection and counting system using deep learning in highway scenes. Eur. Transp. Res. Rev. 2019, 11, 51. [Google Scholar] [CrossRef]
- Varga, D.; Szirányi, T. Robust real-time pedestrian detection in surveillance videos. J. Ambient Intell. Humaniz. Comput. 2017, 8, 79–85. [Google Scholar] [CrossRef]
- Panahi, L.; Ghods, V. Human fall detection using machine vision techniques on RGB–D images. Biomed. Signal Process. Control 2018, 44, 146–153. [Google Scholar] [CrossRef]
- Kanellakis, C.; Nikolakopoulos, G. Survey on computer vision for UAVs: Current developments and trends. J. Intell. Robot. Syst. 2017, 87, 141–168. [Google Scholar] [CrossRef]
- Kashino, Z.; Nejat, G.; Benhabib, B. Aerial wilderness search and rescue with ground support. J. Intell. Robot. Syst. 2020, 99, 147–163. [Google Scholar] [CrossRef]
- Alsamhi, S.H.; Almalki, F.A.; AL-Dois, H.; Shvetsov, A.V.; Ansari, M.S.; Hawbani, A.; Gupta, S.K.; Lee, B. Multi-drone edge intelligence and SAR smart wearable devices for emergency communication. Wirel. Commun. Mob. Comput. 2021, 2021, 6710074. [Google Scholar] [CrossRef]
- Heggie, T.W.; Heggie, T.M. Dead men hiking: Case studies from the American wilderness. Med. Sport. 2012, 16, 118–121. [Google Scholar] [CrossRef]
- Mishra, B.; Garg, D.; Narang, P.; Mishra, V. Drone-surveillance for search and rescue in natural disaster. Comput. Commun. 2020, 156, 1–10. [Google Scholar] [CrossRef]
- Alsamhi, S.H.; Shvetsov, A.V.; Kumar, S.; Shvetsova, S.V.; Alhartomi, M.A.; Hawbani, A.; Rajput, N.S.; Srivastava, S.; Saif, A.; Nyangaresi, V.O. UAV Computing-Assisted Search and Rescue Mission Framework for Disaster and Harsh Environment Mitigation. Drones 2022, 6, 154. [Google Scholar] [CrossRef]
- Harris, R. Satellite Remote Sensing—An Introduction; Routledge Kegan & Paul: London, UK, 1987. [Google Scholar]
- Patino, J.E.; Duque, J.C. A review of regional science applications of satellite remote sensing in urban settings. Comput. Environ. Urban Syst. 2013, 37, 1–17. [Google Scholar] [CrossRef]
- Lo, C. Applied Remote Sensing; Taylor & Francis: Abingdon, UK, 1986. [Google Scholar]
- Zhu, L.; Suomalainen, J.; Liu, J.; Hyyppä, J.; Kaartinen, H.; Haggren, H. A Review: Remote Sensing Sensors—Multi-Purposeful Application of Geospatial Data; IntechOpen: London, UK, 2018; pp. 19–42. [Google Scholar]
- Karthikeyan, L.; Chawla, I.; Mishra, A.K. A review of remote sensing applications in agriculture for food security: Crop growth and yield, irrigation, and crop losses. J. Hydrol. 2020, 586, 124905. [Google Scholar] [CrossRef]
- Yang, X.; Qin, Q.; Grussenmeyer, P.; Koehl, M. Urban surface water body detection with suppressed built-up noise based on water indices from Sentinel-2 MSI imagery. Remote Sens. Environ. 2018, 219, 259–270. [Google Scholar] [CrossRef]
- Özelkan, E. Water body detection analysis using NDWI indices derived from landsat-8 OLI. Polish J. Environ. Stud. 2020, 29, 1759–1769. [Google Scholar] [CrossRef]
- Yuan, K.; Zhuang, X.; Schaefer, G.; Feng, J.; Guan, L.; Fang, H. Deep-learning-based multispectral satellite image segmentation for water body detection. IEEE J. Sel. Top. Appl. Earth Obs. Remote Sens. 2021, 14, 7422–7434. [Google Scholar] [CrossRef]
- Dang, B.; Li, Y. MSResNet: Multiscale residual network via self-supervised learning for water-body detection in remote sensing imagery. Remote Sens. 2021, 13, 3122. [Google Scholar] [CrossRef]
- Sziranyi, T.; Shadaydeh, M. Segmentation of remote sensing images using similarity-measure-based fusion-MRF model. IEEE Geosci. Remote Sens. Lett. 2014, 11, 1544–1548. [Google Scholar] [CrossRef]
- Talukdar, S.; Singha, P.; Mahato, S.; Pal, S.; Liou, Y.A.; Rahman, A. Land-use land-cover classification by machine learning classifiers for satellite observations—A review. Remote Sens. 2020, 12, 1135. [Google Scholar] [CrossRef]
- Castelluccio, M.; Poggi, G.; Sansone, C.; Verdoliva, L. Land use classification in remote sensing images by convolutional neural networks. arXiv 2015, arXiv:1508.00092. [Google Scholar]
- Peng, D.; Zhang, Y.; Guan, H. End-to-end change detection for high resolution satellite images using improved UNet++. Remote Sens. 2019, 11, 1382. [Google Scholar] [CrossRef]
- Asokan, A.; Anitha, J.J.E.S.I. Change detection techniques for remote sensing applications: A survey. Earth Sci. Inform. 2019, 12, 143–160. [Google Scholar] [CrossRef]
- Szirányi, T.; Zerubia, J. Multilayer Markov Random Field Models for Change Detection in Optical Remote Sensing Images. ISPRS J. Photogramm. Remote Sens. 2015, 107, 22–37. [Google Scholar]
- Li, J.; Pei, Y.; Zhao, S.; Xiao, R.; Sang, X.; Zhang, C. A review of remote sensing for environmental monitoring in China. Remote Sens. 2020, 12, 1130. [Google Scholar] [CrossRef]
- Laurance, W.F.; Clements, G.R.; Sloan, S.; O’connell, C.S.; Mueller, N.D.; Goosem, M.; Venter, O.; Edwards, D.; Phalan, B.; Balmford, A.; et al. A global strategy for road building. Nature 2014, 513, 229–232. [Google Scholar] [CrossRef] [PubMed]
- Ciepłuch, B.; Jacob, R.; Mooney, P.; Winstanley, A.C. Comparison of the accuracy of OpenStreetMap for Ireland with Google Maps and Bing Maps. In Proceedings of the Ninth International Symposium on Spatial Accuracy Assessment in Natural Resuorces and Enviromental Sciences, Leicester, UK, 20–23 July 2010; p. 337. [Google Scholar]
- Wang, W.; Yang, N.; Zhang, Y.; Wang, F.; Cao, T.; Eklund, P. A review of road extraction from remote sensing images. J. Traffic Transp. Eng. 2016, 3, 271–282. [Google Scholar] [CrossRef]
- Liu, C.; Szirányi, T.A. Gesture Recognition for UAV-based Rescue Operation based on Deep Learning. In Proceedings of the International Conference on Image Processing and Vision Engineering (IMPROVE 2021), Anchorage, AL, USA, 19–22 September 2021; pp. 180–187. [Google Scholar]
- Jetson AGX Xavier Developer Kit. NVIDIA Developer. 2018. Available online: https://developer.nvidia.com/embedded/jetson-agx-xavier-developer-kit (accessed on 4 July 2022).
- Parrot Sequoia+. SenseFly. 2018. Available online: https://www.sensefly.com/camera/parrot-sequoia/ (accessed on 4 July 2022).
- Hossain, S.; Lee, D.-J. Deep learning-based real-time multiple-object detection and tracking from aerial imagery via a flying robot with GPU-based embedded devices. Sensors 2019, 19, 3371. [Google Scholar] [CrossRef]
- Esa.int. ESA—Home. 2019. Available online: https://www.esa.int/ (accessed on 4 July 2022).
- USGS. Science for a Changing World. Available online: https://www.usgs.gov/ (accessed on 4 July 2022).
- Mansouri, S.S.; Karvelis, P.; Georgoulas, G.; Nikolakopoulos, G. Remaining useful battery life prediction for UAVs based on machine learning. IFAC Pap. 2017, 50, 4727–4732. [Google Scholar] [CrossRef]
- Saif, A.; Dimyati, K.; Noordin, K.A.; Shah, N.S.M.; Alsamhi, S.H.; Abdullah, Q. August. Energy-efficient tethered UAV deployment in B5G for smart environments and disaster recovery. In Proceedings of the 2021 1st International Conference on Emerging Smart Technologies and Applications (eSmarTA), Sana’a, Yemen, 10–12 August 2021; IEEE: New York, NY, USA, 2021; pp. 1–5. [Google Scholar]
- Wikipedia Contributors. Biatorbágy. Wikipedia, Wikimedia Foundation. 2021. Available online: https://en.wikipedia.org/wiki/Biatorb%C3%A1gy (accessed on 5 July 2022).
- Google. Google Maps. 2022. Available online: www.google.com/maps (accessed on 5 July 2022).
- USGS EROS Archive—Commercial Satellites—OrbView 3. U.S. Geological Survey. Available online: www.usgs.gov/centers/eros/science/usgs-eros-archive-commercial-satellites-orbview-3 (accessed on 5 July 2022).
- Birdwood. Wikipedia. 2021. Available online: https://en.wikipedia.org/wiki/Birdwood (accessed on 5 July 2022).
- Mnih, V. Machine Learning for Aerial Image Labeling; University of Toronto: Toronto, ON, Canada, 2013. [Google Scholar]
- Demir, I.; Koperski, K.; Lindenbaum, D.; Pang, G.; Huang, J.; Basu, S.; Hughes, F.; Tuia, D.; Raskar, R. Deepglobe 2018: A challenge to parse the earth through satellite images. In Proceedings of the IEEE Conference on Computer Vision and Pattern Recognition Workshops, Lake City, UT, USA, 18–22 June 2018; pp. 172–181. [Google Scholar]
- Ronneberger, O.; Fischer, P.; Brox, T. U-net: Convolutional networks for biomedical image segmentation. In Proceedings of the International Conference on Medical Image Computing and Computer-Assisted Intervention, Singapore, 18–22 September 2015; Springer: Cham, Switzerland, 2015; pp. 234–241. [Google Scholar]
- Badrinarayanan, V.; Kendall, A.; Cipolla, R. Segnet: A deep convolutional encoder-decoder architecture for image segmentation. IEEE Trans. Pattern Anal. Mach. Intell. 2017, 39, 2481–2495. [Google Scholar] [CrossRef]
- Chaurasia, A.; Culurciello, E. Linknet: Exploiting encoder representations for efficient semantic segmentation. In Proceedings of the 2017 IEEE Visual Communications and Image Processing (VCIP), St. Petersburg, FL, USA, 10–13 December 2017; IEEE: New York, NY, USA, 2017; pp. 1–4. [Google Scholar]
- Zhou, L.; Zhang, C.; Wu, M. D-LinkNet: LinkNet with pretrained encoder and dilated convolution for high resolution satellite imagery road extraction. In Proceedings of the IEEE Conference on Computer Vision and Pattern Recognition Workshops, Lake City, UT, USA, 18–22 June 2018; pp. 182–186. [Google Scholar]
- Liu, C.; Szirányi, T. UAV Path Planning based on Road Extraction. In Proceedings of the International Conference on Image Processing and Vision Engineering (IMPROVE 2021), Brussels, Belgium, 16–17 June 2022; pp. 202–210. [Google Scholar]
- Goto, T.; Kosaka, T.; Noborio, H. On the heuristics of A* or A algorithm in ITS and robot path-planning. In Proceedings of the 2003 IEEE/RSJ International Conference on Intelligent Robots and Systems (IROS 2003) (Cat. No. 03CH37453), Las Vegas, NV, USA, 27–31 October 2003; IEEE: New York, NY, USA, 2003; Volume 2, pp. 1159–1166. [Google Scholar]
- Abhishek, K.; Singh, M.; Ghosh, S.; Anand, A. Weather forecasting model using artificial neural network. Procedia Technol. 2012, 4, 311–318. [Google Scholar] [CrossRef]
- Running, S.W. Estimating terrestrial primary productivity by combining remote sensing and ecosystem simulation. In Remote Sensing of Biosphere Functioning; Springer: New York, NY, USA, 1990; pp. 65–86. [Google Scholar]
- Myneni, R.B.; Hall, F.G.; Sellers, J.; Marshak, A.L. The interpretation of spectral vegetation indexes. IEEE Trans. Geosci. Remote Sens. 1995, 33, 481–486. [Google Scholar] [CrossRef]
- Papageorgiou, M.; Diakaki, C.; Dinopoulou, V.; Kotsialos, A.; Wang, Y. Review of road traffic control strategies. Proc. IEEE 2003, 91, 2043–2067. [Google Scholar] [CrossRef]
- Definition, Interpretation, and Calculation of Traffic Analysis Tools Measures of Effectiveness—6.0 Recommended MOEs. Available online: https://ops.fhwa.dot.gov/publications/fhwahop08054/sect6.htm (accessed on 1 June 2022).
- Pettorelli, N.; Vik, J.O.; Mysterud, A.; Gaillard, J.M.; Tucker, C.J.; Stenseth, N.C. Using the satellite-derived NDVI to assess ecological responses to environmental change. Trends Ecol. Evol. 2005, 20, 503–510. [Google Scholar] [CrossRef] [PubMed]
- Gupta, V.D.; Areendran, G.; Raj, K.; Ghosh, S.; Dutta, S.; Sahana, M. Assessing habitat suitability of leopards (Panthera pardus) in unprotected scrublands of Bera, Rajasthan, India. In Forest Resources Resilience and Conflicts; Elsevier: Amsterdam, The Netherlands, 2021; pp. 329–342. [Google Scholar]
- Kraetzig, N.M. 5 Things to Know about NDVI (Normalized Difference Vegetation Index). UP42 Official Website. Available online: https://up42.com/blog/tech/5-things-to-know-about-ndvi#:~:text=The%20value%20of%20the%20NDVI (accessed on 6 July 2022).
- UW-Madison Satellite Meteorology. Available online: https://profhorn.meteor.wisc.edu/wxwise/satmet/lesson3/ndvi.html (accessed on 6 July 2022).
- Gast, K.; Kram, R.; Riemer, R. Preferred walking speed on rough terrain: Is it all about energetics? J. Exp. Biol. 2019, 222, jeb185447. [Google Scholar] [CrossRef] [PubMed]
- Mohamed, O.; Appling, H. Clinical assessment of gait. Orthot. Prosthet. Rehabil. 2020, 4, 102–144. [Google Scholar]
- Liu, C.; Szirányi, T. Real-time human detection and gesture recognition for on-board UAV rescue. Sensors 2021, 21, 2180. [Google Scholar] [CrossRef]
- Signal for Help. Wikipedia. 2020. Available online: https://en.wikipedia.org/wiki/Signal_for_Hel (accessed on 1 July 2021).
- Mediapipe. Hands. Available online: https://google.github.io/mediapipe/solutions/hands.html (accessed on 1 June 2021).
- Zhang, F.; Bazarevsky, V.; Vakunov, A.; Tkachenka, A.; Sung, G.; Chang, C.L.; Grundmann, M. Mediapipe hands: On-device real-time hand tracking. arXiv 2020, arXiv:2006.10214. [Google Scholar]
- Wright, R.E. Logistic Regression; APA: Washington, DC, USA, 1995. [Google Scholar]
- Singh, A.; Prakash, B.S.; Chandrasekaran, K. A comparison of linear discriminant analysis and ridge classifier on Twitter data. In Proceedings of the 2016 International Conference on Computing, Communication and Automation (ICCCA), Greater Noida, India, 29–30 April 2016; IEEE: New York, NY, USA, 2016; pp. 133–138. [Google Scholar]
- Pal, M. Random forest classifier for remote sensing classification. Int. J. Remote Sens. 2005, 26, 217–222. [Google Scholar] [CrossRef]
- Natekin, A.; Knoll, A. Gradient boosting machines, a tutorial. Front. Neurorobot. 2013, 7, 21. [Google Scholar] [CrossRef]
- Canziani, A.; Paszke, A.; Culurciello, E. An analysis of deep neural network models for practical applications. arXiv 2016, arXiv:1605.07678. [Google Scholar]
- Carreira, J.; Zisserman, A. Quo vadis, action recognition? A new model and the kinetics dataset. In Proceedings of the IEEE Conference on Computer Vision and Pattern Recognition, San Juan, PR, USA, 17–19 June 1997. [Google Scholar]
- Chugh, G.; Bansal, D.; Sofat, S. Road condition detection using smartphone sensors: A survey. Int. J. Electron. Electr. Eng. 2014, 7, 595–602. [Google Scholar]
- Castillo Aguilar, J.J.; Cabrera Carrillo, J.A.; Guerra Fernández, A.J.; Carabias Acosta, E. Robust road condition detection system using in-vehicle standard sensors. Sensors 2015, 15, 32056–32078. [Google Scholar] [CrossRef] [PubMed]
- Jokela, M.; Kutila, M.; Le, L. Road condition monitoring system based on a stereo camera. In Proceedings of the 2009 IEEE 5th International Conference on Intelligent Computer Communication and Processing, Cluj-Napoca, Romania, 27–29 August 2009; IEEE: New York, NY, USA, 2009; pp. 423–428. [Google Scholar]
- Ranyal, E.; Sadhu, A.; Jain, K. Road condition monitoring using smart sensing and artificial intelligence: A review. Sensors 2022, 22, 3044. [Google Scholar] [CrossRef] [PubMed]
- Xie, Q.; Hu, X.; Ren, L.; Qi, L.; Sun, Z. A Binocular Vision Application in IoT: Realtime Trustworthy Road Condition Detection System in Passable Area. In IEEE Transactions on Industrial Informatics; IEEE: New York, NY, USA, 2022. [Google Scholar]
- Gupta, A.; Anpalagan, A.; Guan, L.; Khwaja, A.S. Deep learning for object detection and scene perception in self-driving cars: Survey, challenges, and open issues. Array 2021, 10, 100057. [Google Scholar] [CrossRef]
- Chun, C.; Ryu, S.K. Road surface damage detection using fully convolutional neural networks and semi-supervised learning. Sensors 2019, 19, 5501. [Google Scholar] [CrossRef] [PubMed]
- Wang, D.; Liu, Z.; Gu, X.; Wu, W.; Chen, Y.; Wang, L. Automatic Detection of Pothole Distress in Asphalt Pavement Using Improved Convolutional Neural Networks. Remote Sens. 2022, 14, 3892. [Google Scholar] [CrossRef]
- Rateke, T.; Justen, K.A.; Von Wangenheim, A. Road surface classification with images captured from low-cost camera-road traversing knowledge (rtk) dataset. Rev. De Inf. Teórica E Apl. 2019, 26, 50–64. [Google Scholar] [CrossRef] [Green Version]
- Yamazaki, Y.; Tamaki, M.; Premachandra, C.; Perera, C.J.; Sumathipala, S.; Sudantha, B.H. Victim detection using UAV with on-board voice recognition system. In Proceedings of the 2019 Third IEEE International Conference on Robotic Computing (IRC), Naples, Italy, 25–27 February 2019; IEEE: New York, NY, USA, 2019; pp. 555–559. [Google Scholar]
- Castellano, G.; Castiello, C.; Mencar, C.; Vessio, G. Preliminary evaluation of TinyYOLO on a new dataset for search-and-rescue with drones. In Proceedings of the 2020 7th International Conference on Soft Computing & Machine Intelligence (ISCMI), Stockholm, Sweden, 14–15 November 2020; IEEE: New York, NY, USA, 2020; pp. 163–166. [Google Scholar]
- Cafarelli, D.; Ciampi, L.; Vadicamo, L.; Gennaro, C.; Berton, A.; Paterni, M.; Benvenuti, C.; Passera, M.; Falchi, F. MOBDrone: A Drone Video Dataset for Man OverBoard Rescue. In Proceedings of the International Conference on Image Analysis and Processing, Bangkok, Thailand, 16–17 November 2022; Springer: Cham, Switzerland, 2022; pp. 633–644. [Google Scholar]
- Rizk, H.; Nishimur, Y.; Yamaguchi, H.; Higashino, T. Drone-based water level detection in flood disasters. Int. J. Environ. Res. Public Health 2021, 19, 237. [Google Scholar] [CrossRef]
- Tanim, A.H.; McRae, C.; Tavakol-Davani, H.; Goharian, E. Flood Detection in Urban Areas Using Satellite Imagery and Machine Learning. Water 2022, 14, 1140. [Google Scholar] [CrossRef]
- Zhang, Z.; Lu, M.; Ji, S.; Yu, H.; Nie, C. Rich CNN Features for water-body segmentation from very high-resolution aerial and satellite imagery. Remote. Sens. 2021, 13, 1912. [Google Scholar] [CrossRef]


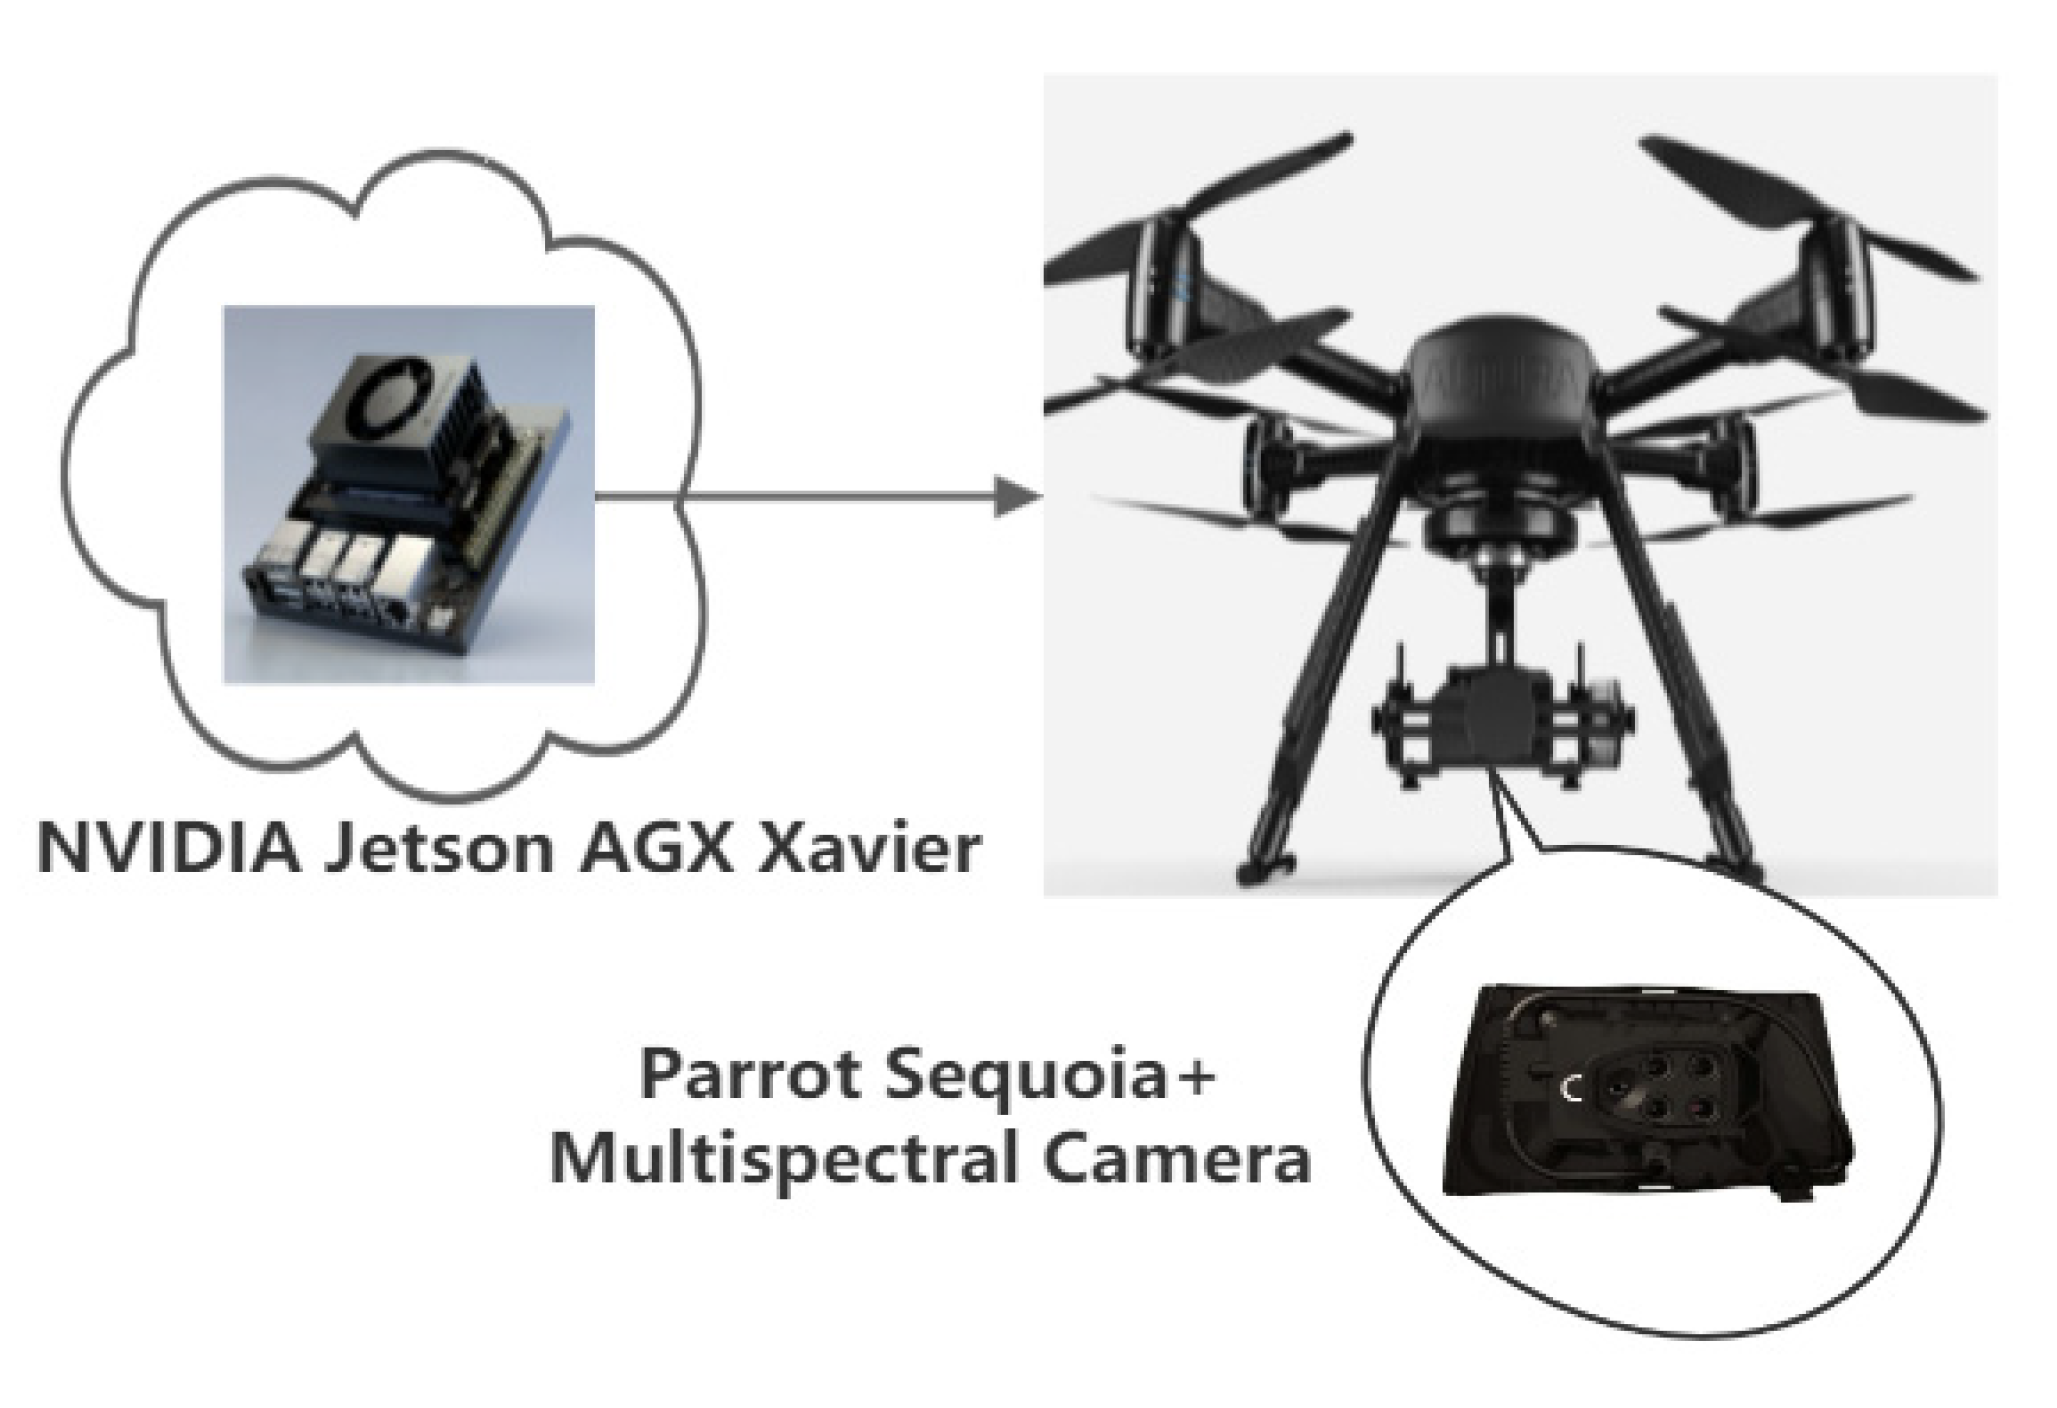
| Jetson AGX Xavier [31] | Parrot Sequoia + Multispectral Camera [32] | ||
|---|---|---|---|
| GPU | 512-core Volta GPU with Tensor Cores | Sensor | Multispectral sensor + RGB camera |
| CPU | 8-core ARM v8.2 64-bit CPU, 8MB L2 + 4MB L3 | Multispectral sensor | 4-band |
| Memory | 32GB 256-Bit LPDDR4x|137GB/s | RGB resolution | 16 MP, 4608 × 3456 px |
| Storage | 32GB eMMC 5.1 | Single-band resolution | 1.2 MP, 1280 × 960 px |
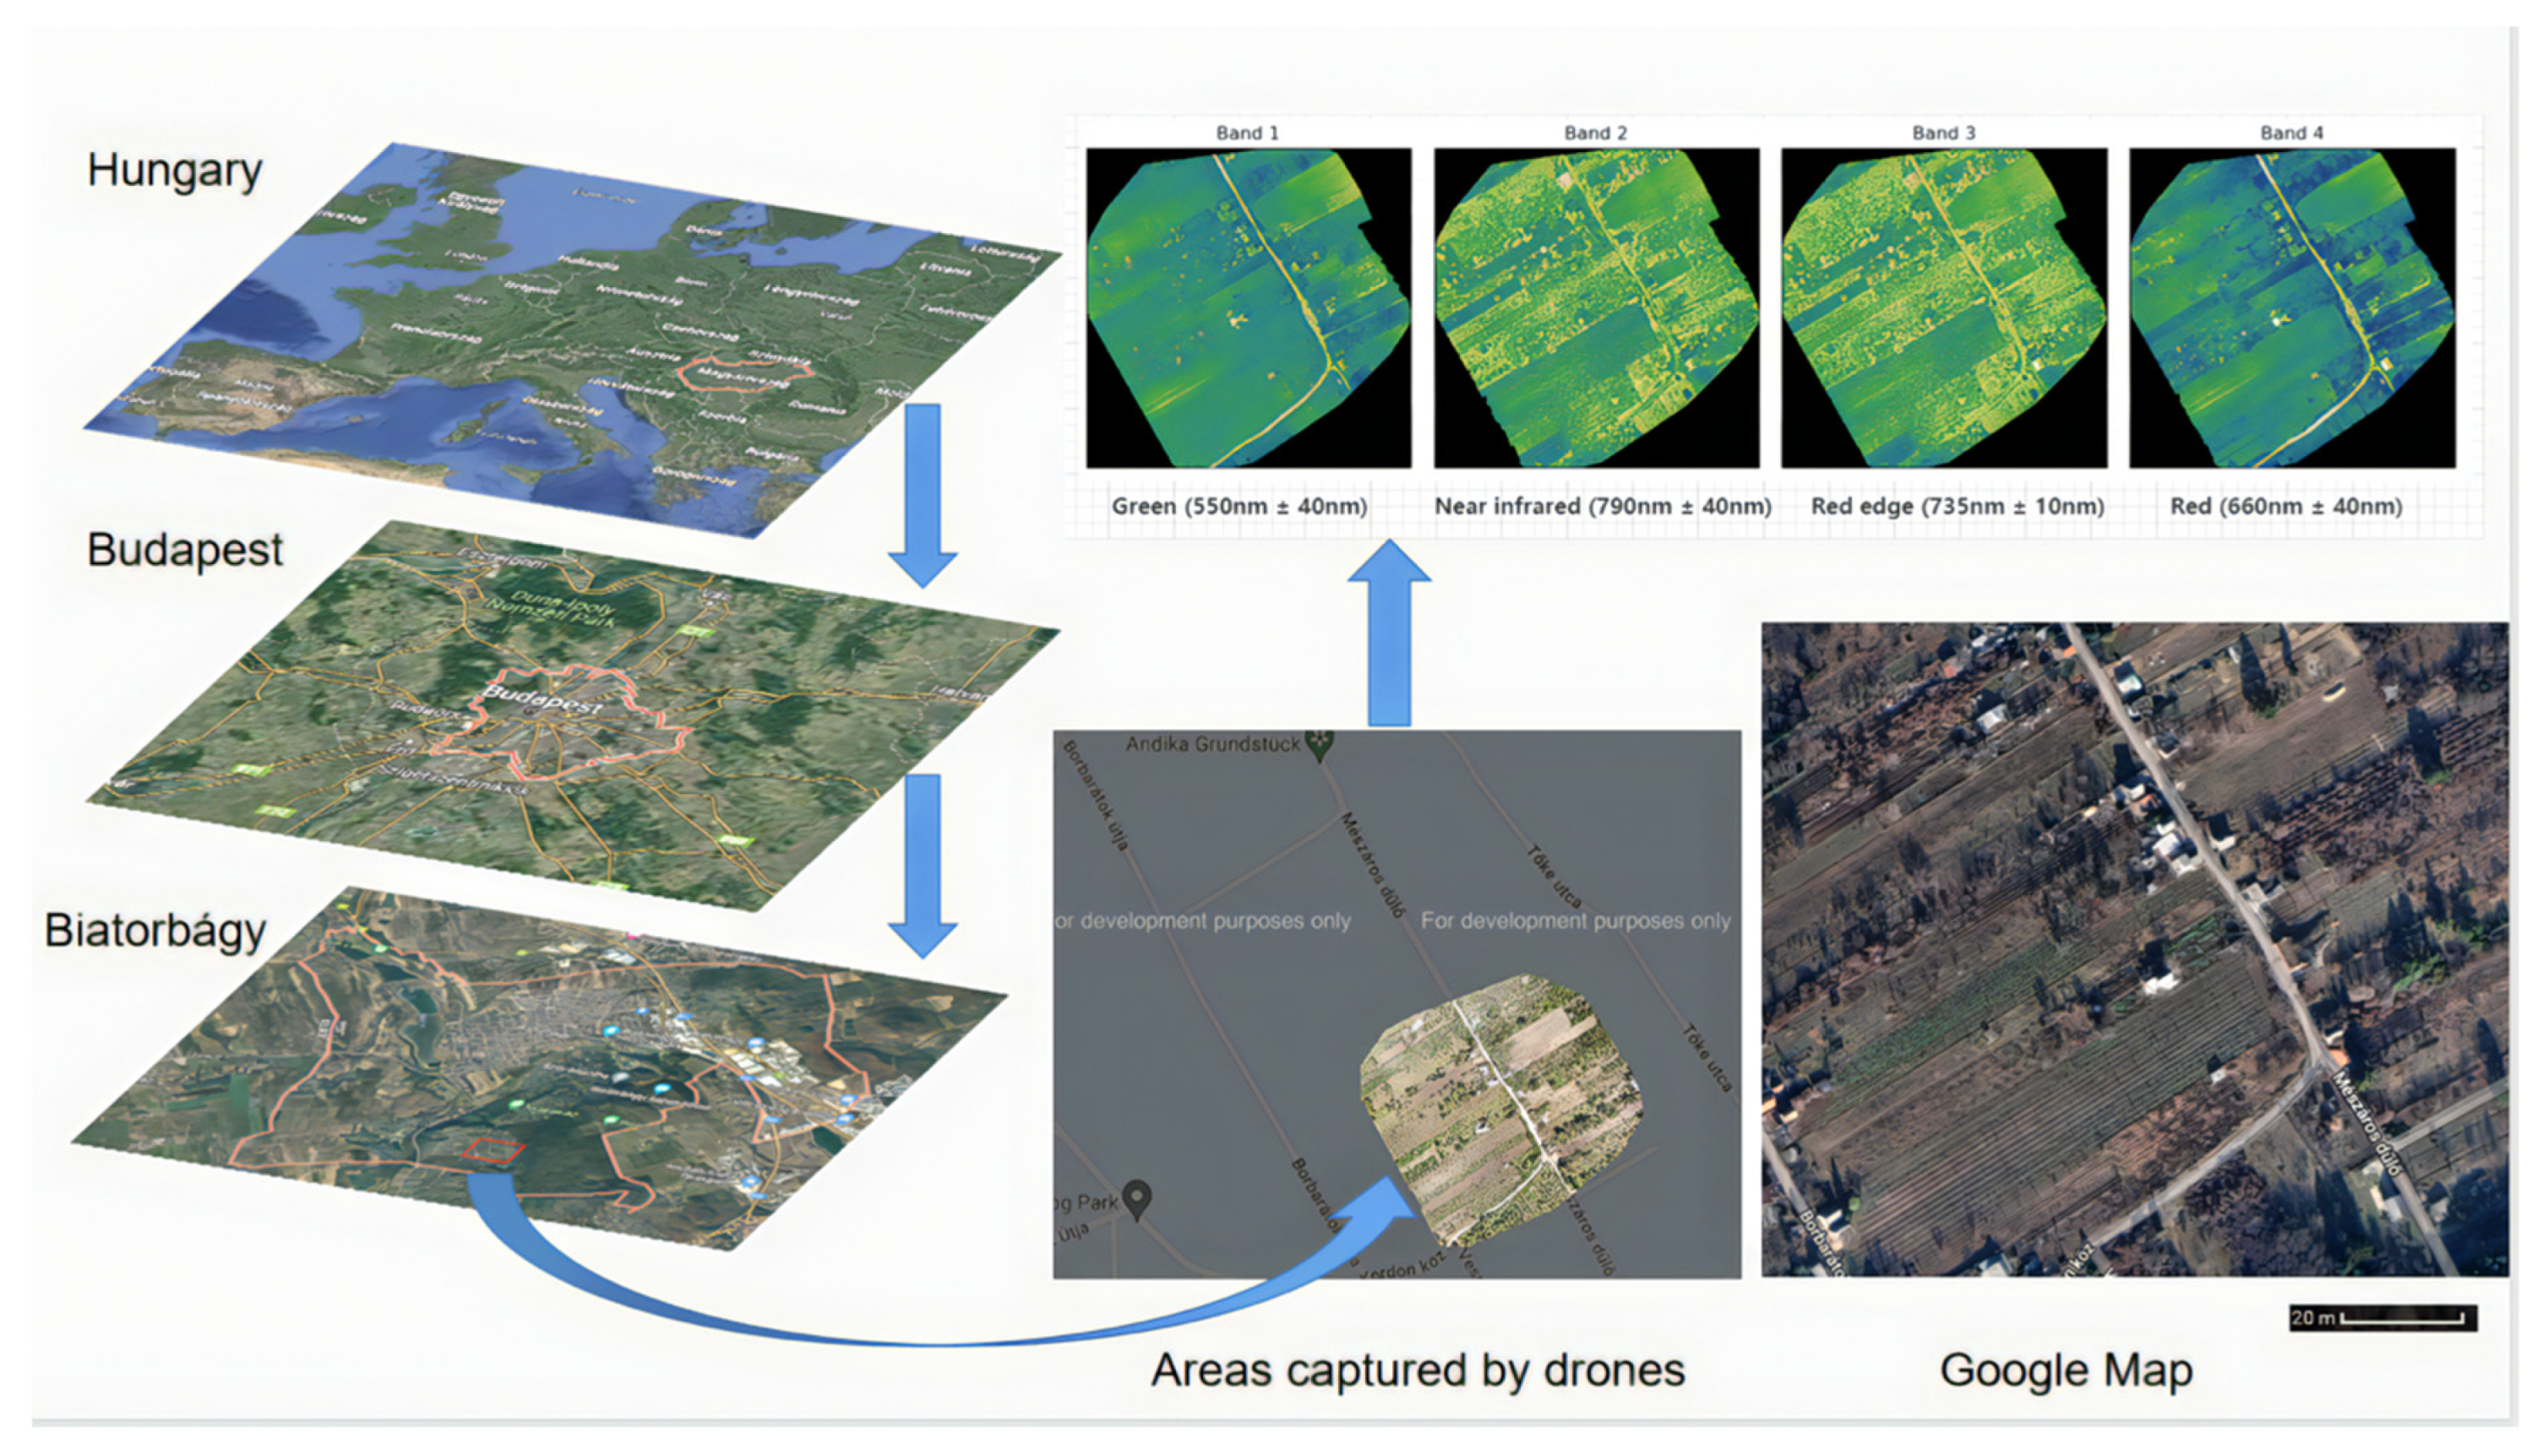
| DL Accelerator | (2×) NVDLA Engines | Multispectral bands | Green (550 ± 40 nm) Red (660 ± 40 nm) Red-edge (735 ± 10 nm) Near-infrared (790 ± 40 nm) |
| Vision Accelerator | 7-way VLIW Vision Processor | Single-band shutter | Global |
| Encoder/Decoder | (2×) 4Kp60|HEVC/(2×) 4Kp60|12-Bit Support | RGB shutter | Rolling |
| Size | 105 mm × 105 mm × 65 mm | Size | 59mm × 41mm × 28mm |
| Deployment | Module (Jetson AGX Xavier) | Weight | 72 g (2.5 oz) |
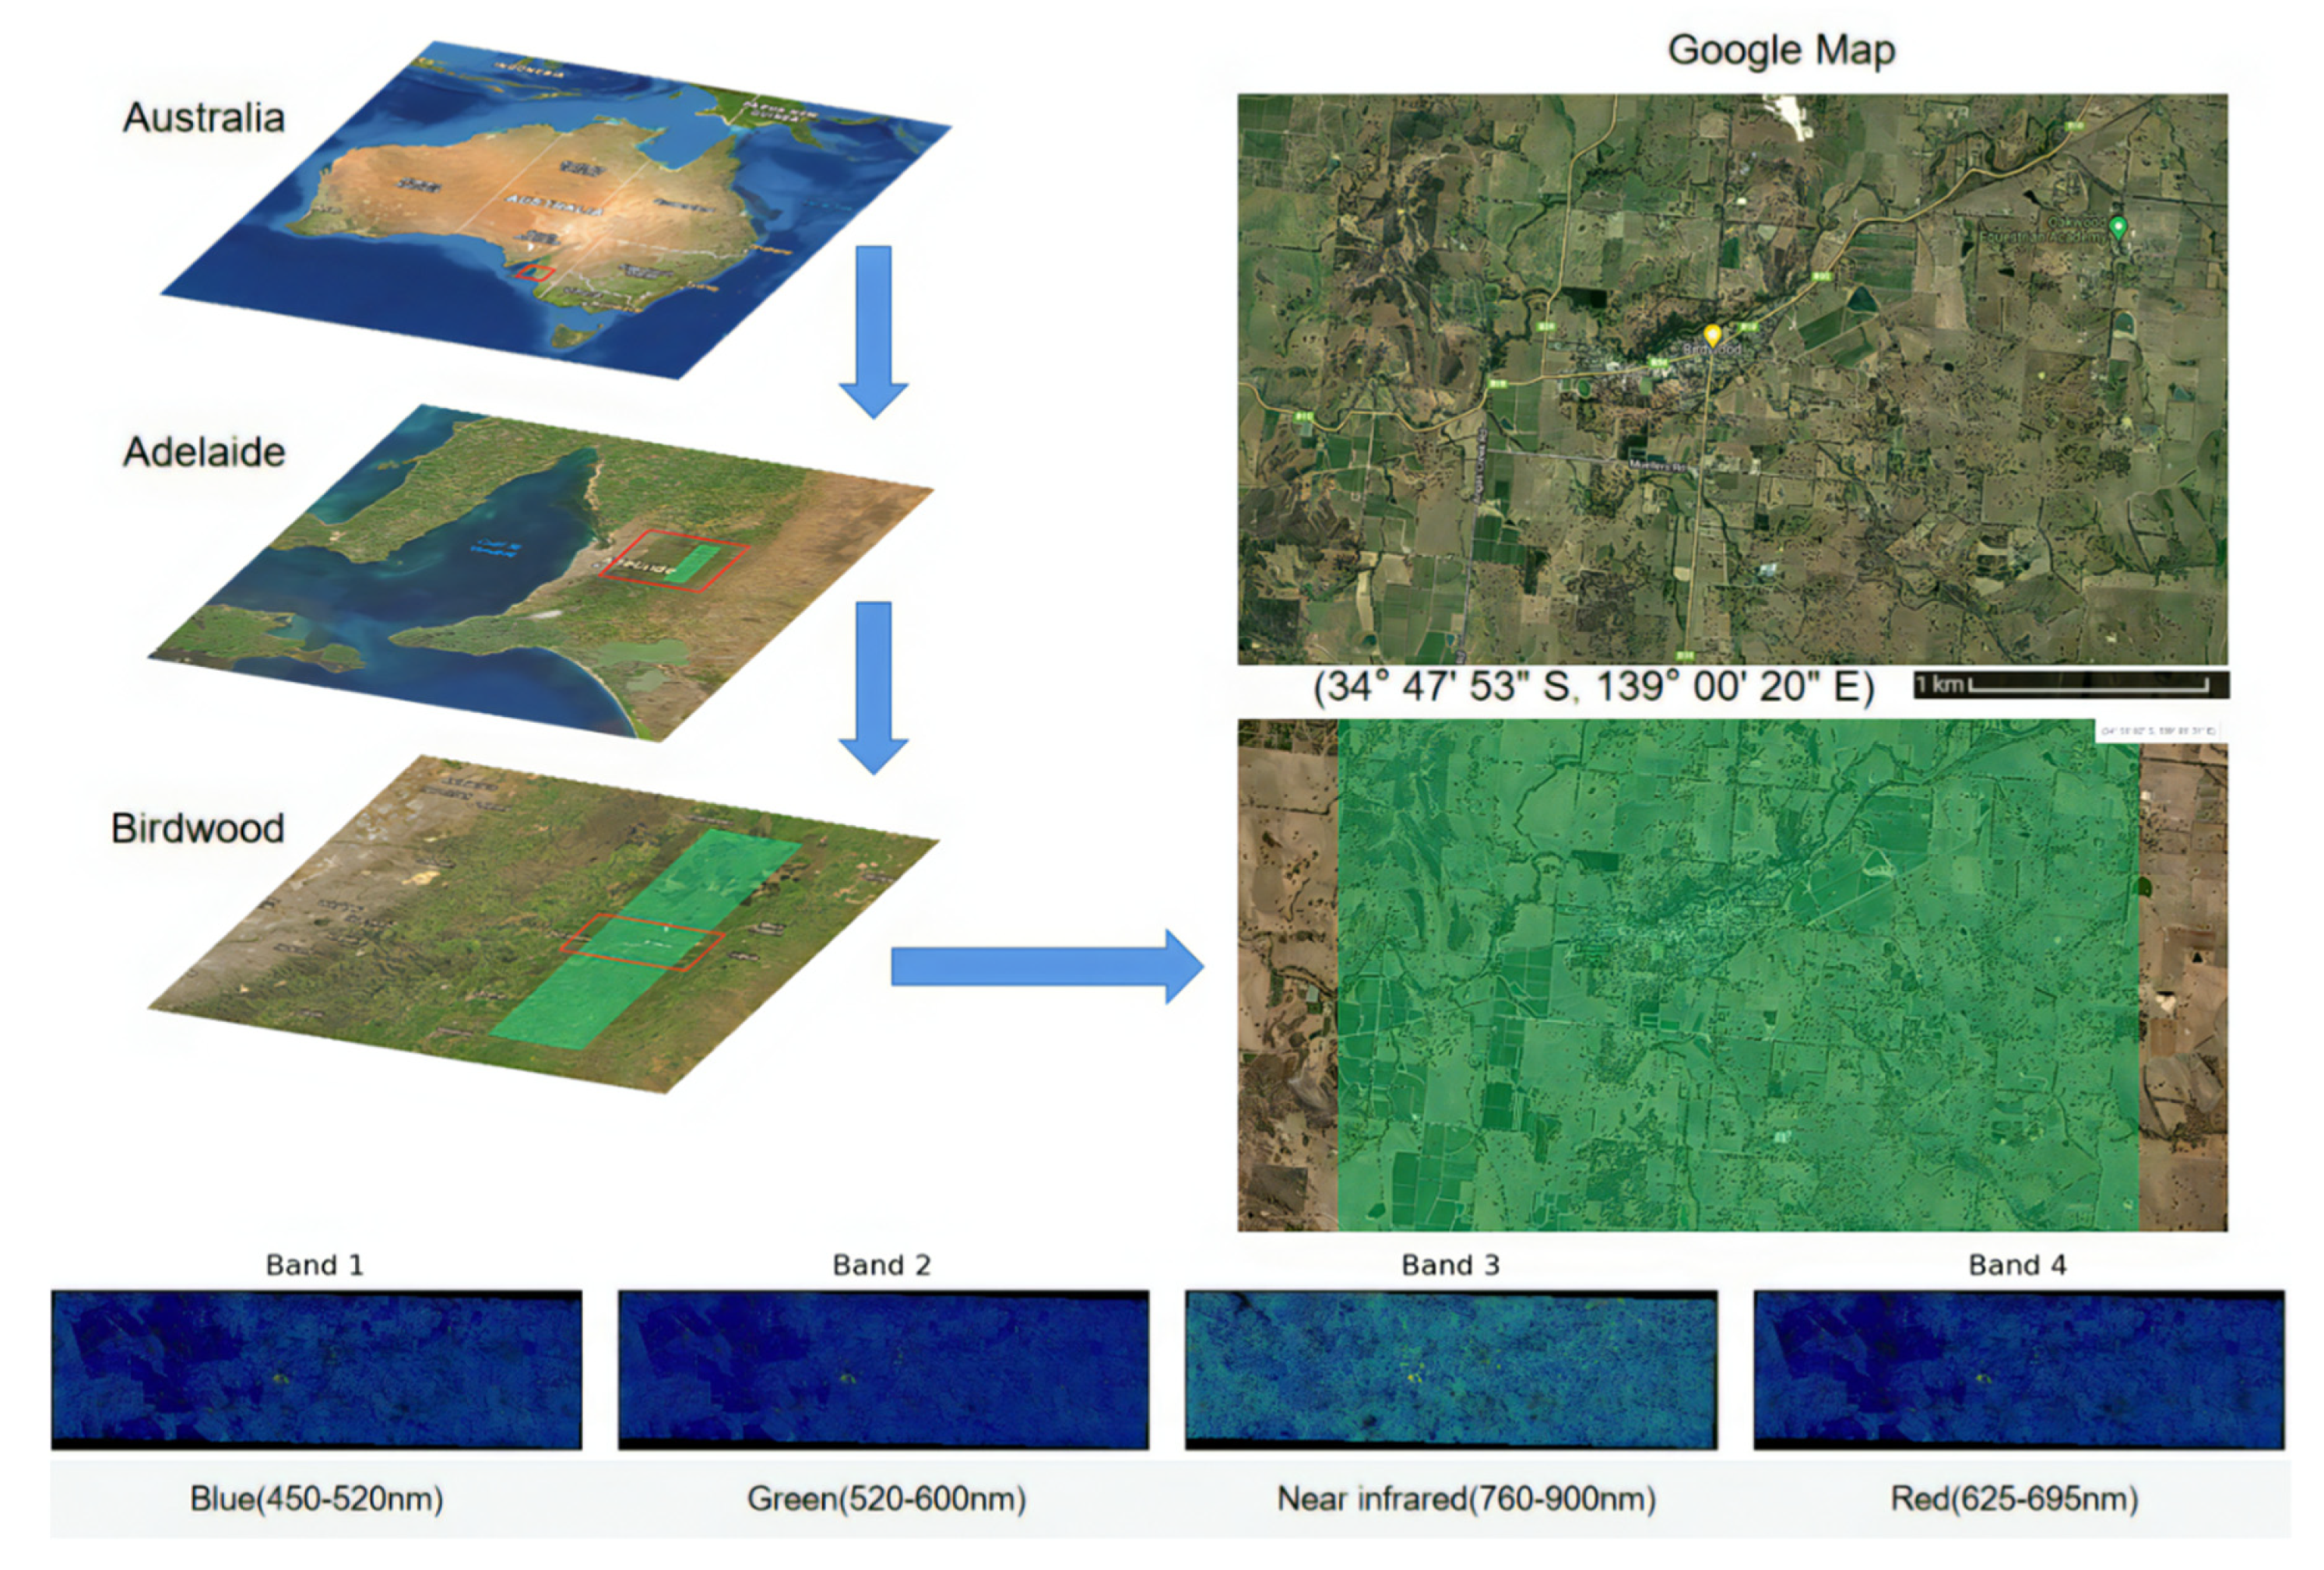
| Orbview-3 Specifications [37] | Dataset (BirdWood, Adelaide, Australia) Attribute [35] | |||
|---|---|---|---|---|
| Imaging Mode | Panchromatic | Multispectral | Entity ID | 3V070304M0001619071A520001900252M_001655941 |
| Spatial Resolution | 1 m | 4 m | Acquisition Date | 2007/03/04 |
| Imaging Channels | 1 channel | 4 channels | Map Projection | GEOGRAPHIC |
| Spectral Range | 450–900 nm | 450–520 nm (blue) 520–600 nm (green) 625–695 nm (red) 760–900 nm (NIR) | Date Entered | 2011/11/10 |
| Data Types and Features | UAV Dataset | Satellite Dataset |
|---|---|---|
| RGB Images Resolution | 15,735 × 14,355 | 7202 × 2151 |
| Multispectral Images | Red (660 ± 40 nm) Near-infrared (790 ± 40 nm) | Red (625–695 nm) Near-infrared (760–900 nm) |
| Cloud Cover | 0 | 0 |
| Coverage area | Small | large |
| Name | Number of Data | Hand Gestures |
|---|---|---|
| ok | 4232 |  |
| v-sign | 3754 |  |
| Good | 4457 |  |
| SignForHelp (dynamic) | 3504 |  |
Publisher’s Note: MDPI stays neutral with regard to jurisdictional claims in published maps and institutional affiliations. |
© 2022 by the authors. Licensee MDPI, Basel, Switzerland. This article is an open access article distributed under the terms and conditions of the Creative Commons Attribution (CC BY) license (https://creativecommons.org/licenses/by/4.0/).
Share and Cite
Liu, C.; Szirányi, T. Road Condition Detection and Emergency Rescue Recognition Using On-Board UAV in the Wildness. Remote Sens. 2022, 14, 4355. https://doi.org/10.3390/rs14174355
Liu C, Szirányi T. Road Condition Detection and Emergency Rescue Recognition Using On-Board UAV in the Wildness. Remote Sensing. 2022; 14(17):4355. https://doi.org/10.3390/rs14174355
Chicago/Turabian StyleLiu, Chang, and Tamás Szirányi. 2022. "Road Condition Detection and Emergency Rescue Recognition Using On-Board UAV in the Wildness" Remote Sensing 14, no. 17: 4355. https://doi.org/10.3390/rs14174355