


Hail Climatology in the Mediterranean Basin Using the GPM Constellation (1999–2021)


Abstract
:
1. Introduction
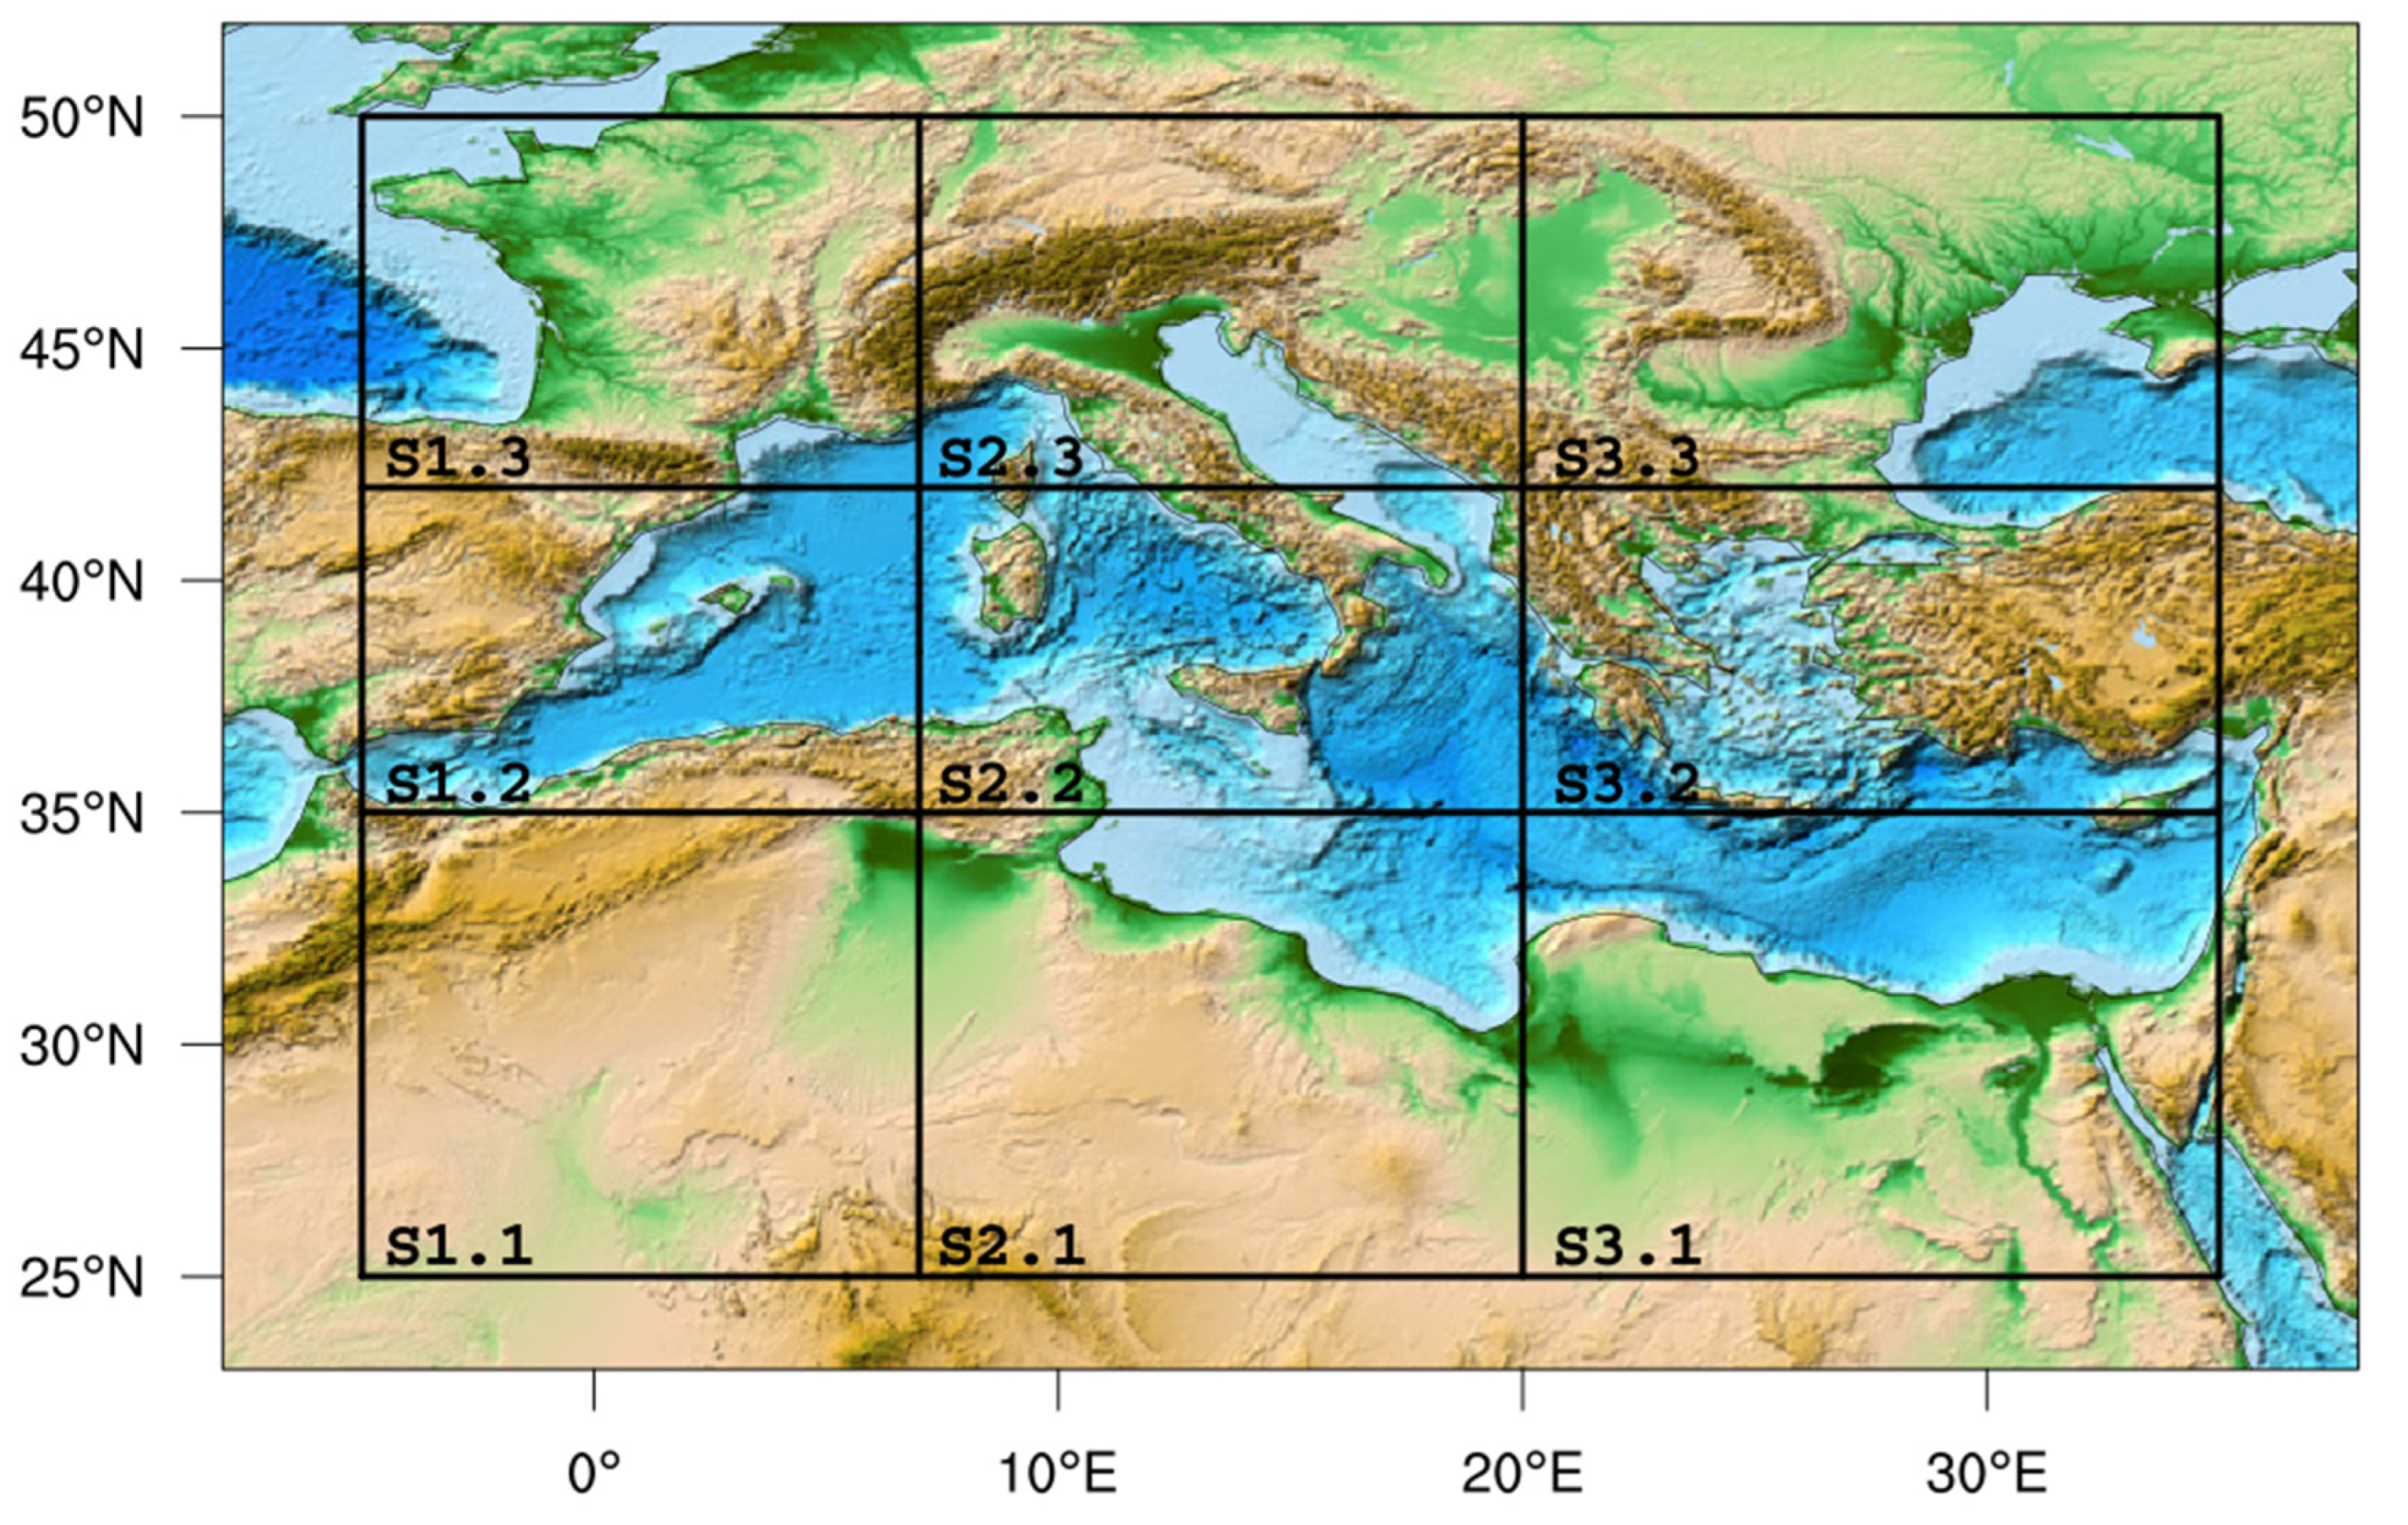
2. The Study Area
3. Materials and Methods
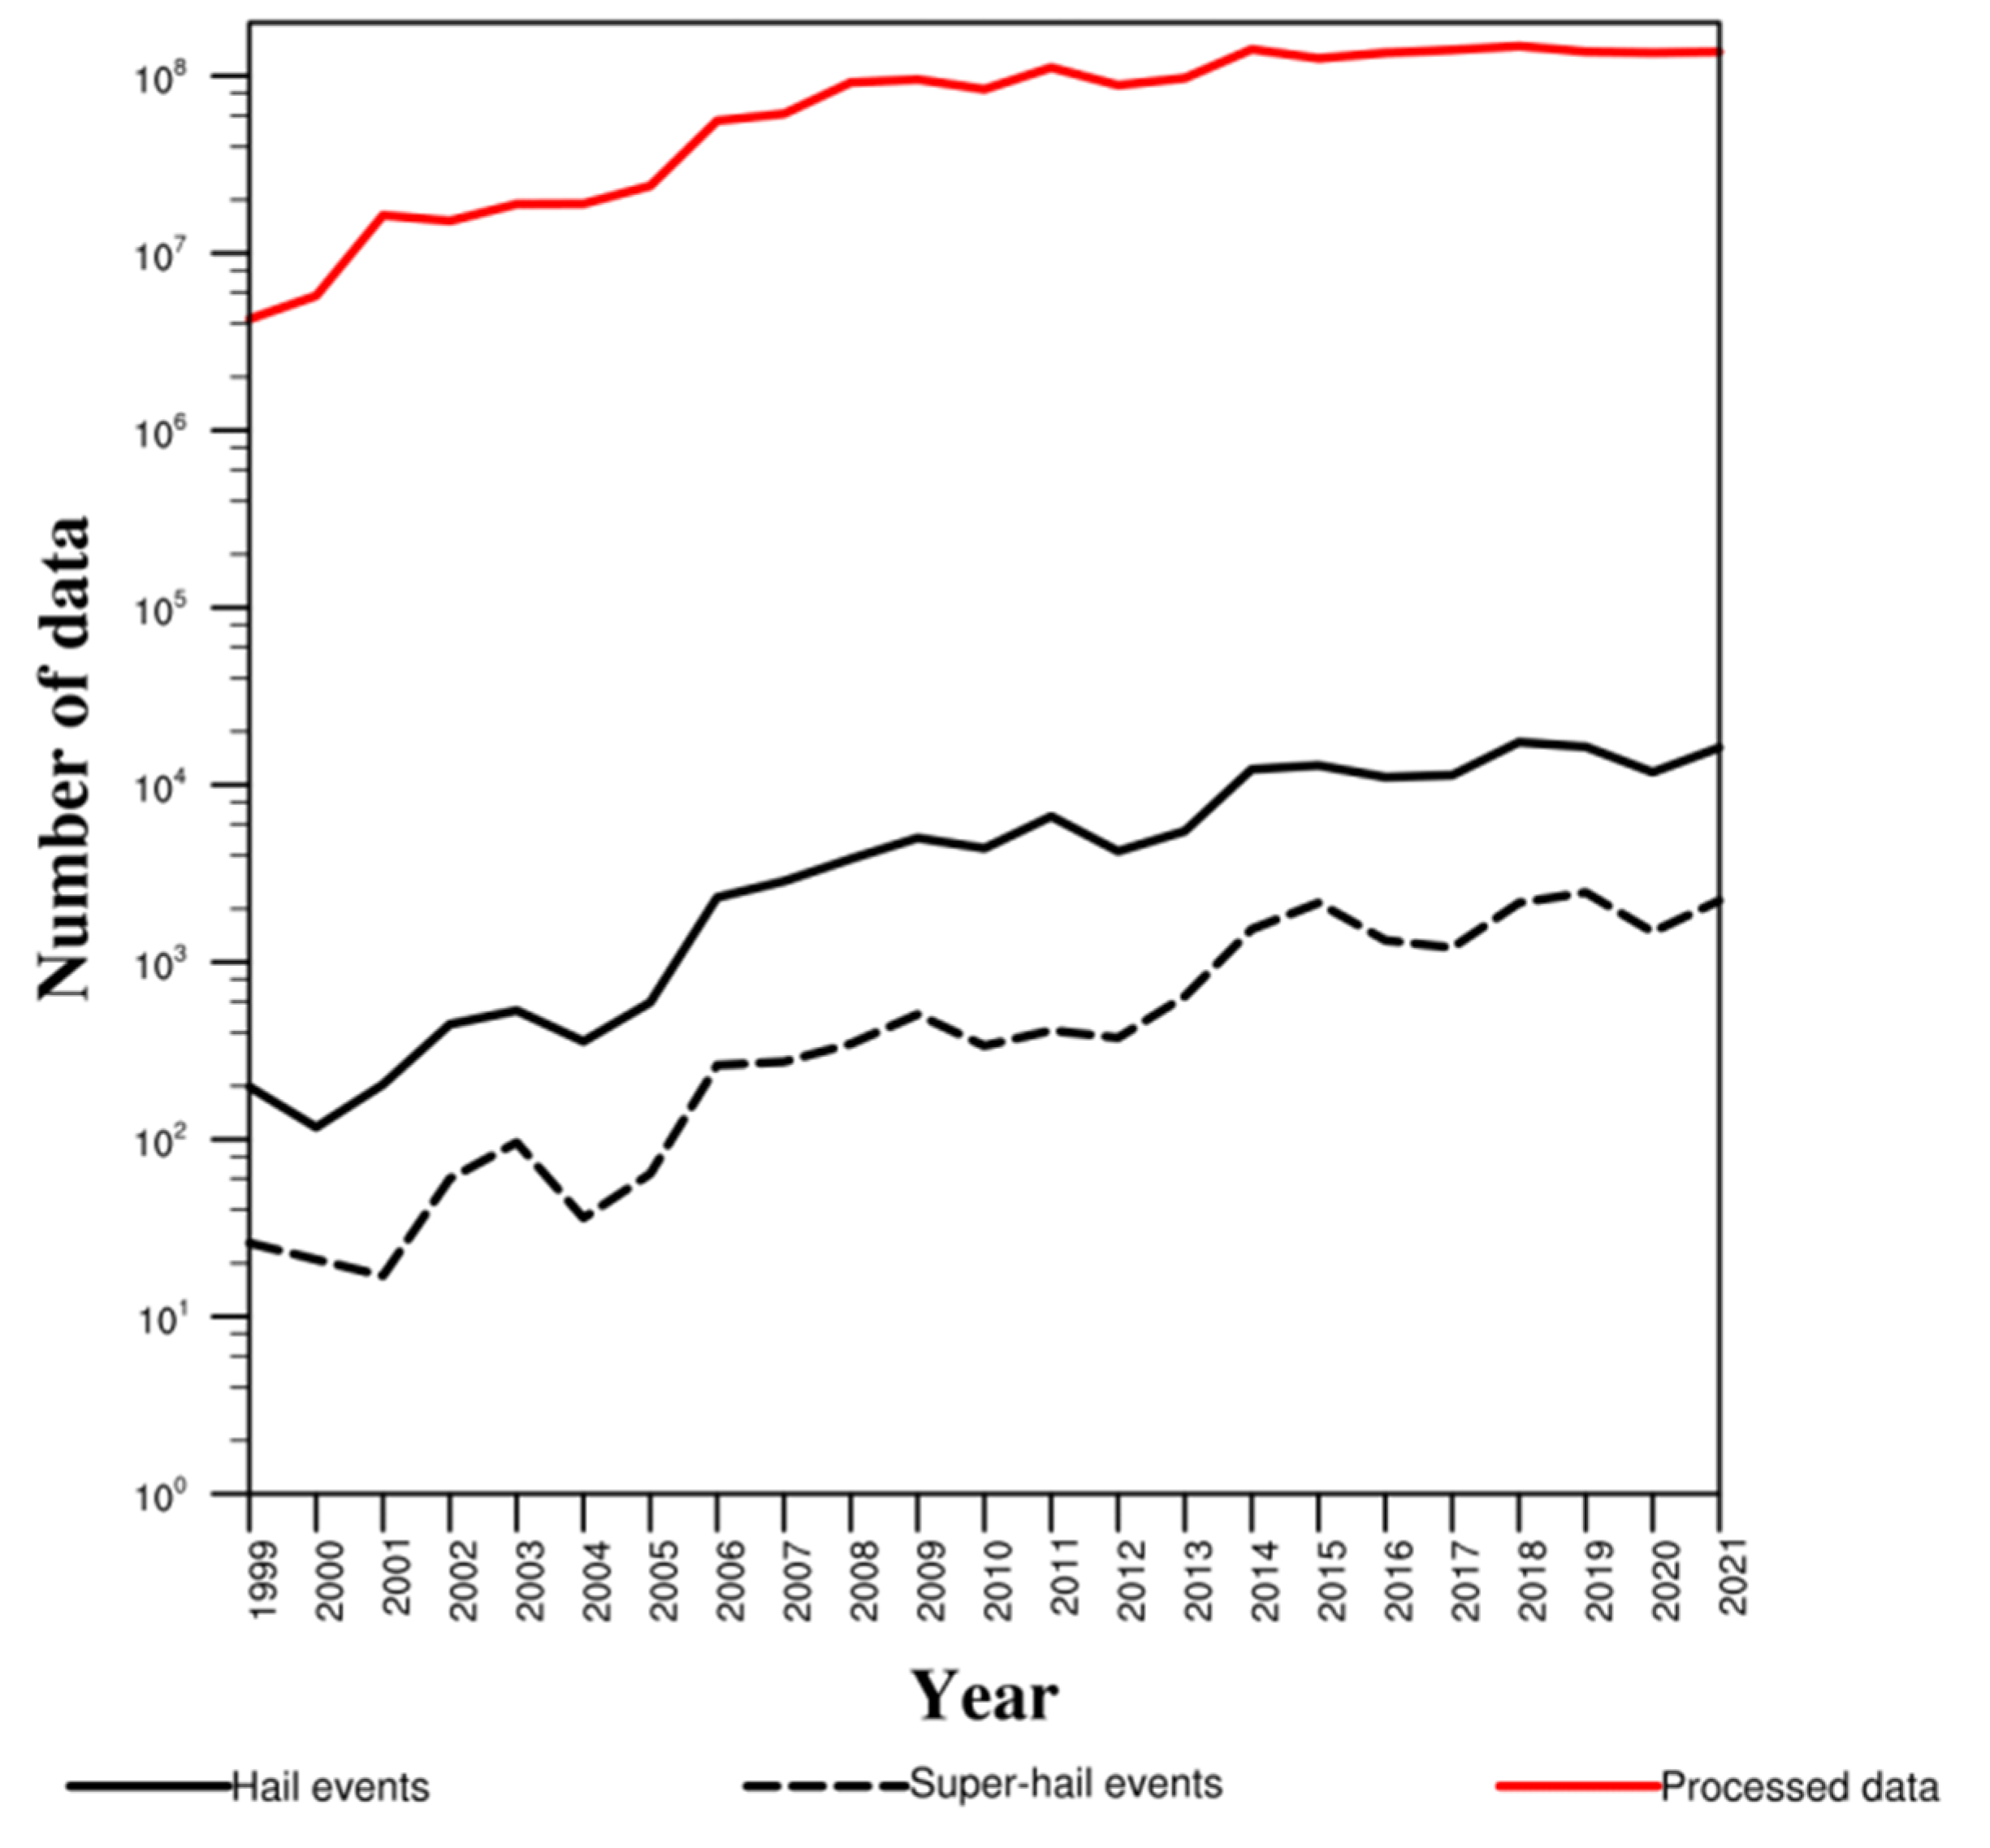
3.1. Hail Data Collection
- These months are characterized by the lowest probability of experiencing hailstorms according to the results of the MWCC-H method.
- In clear-sky conditions, the presence of snow on the ground often observed in wintertime can generate a MW radiometric signal similar to that of cloud-ice particles, thus generating a misleading response in terms of H or SH occurrences.
3.2. Trend Analysis
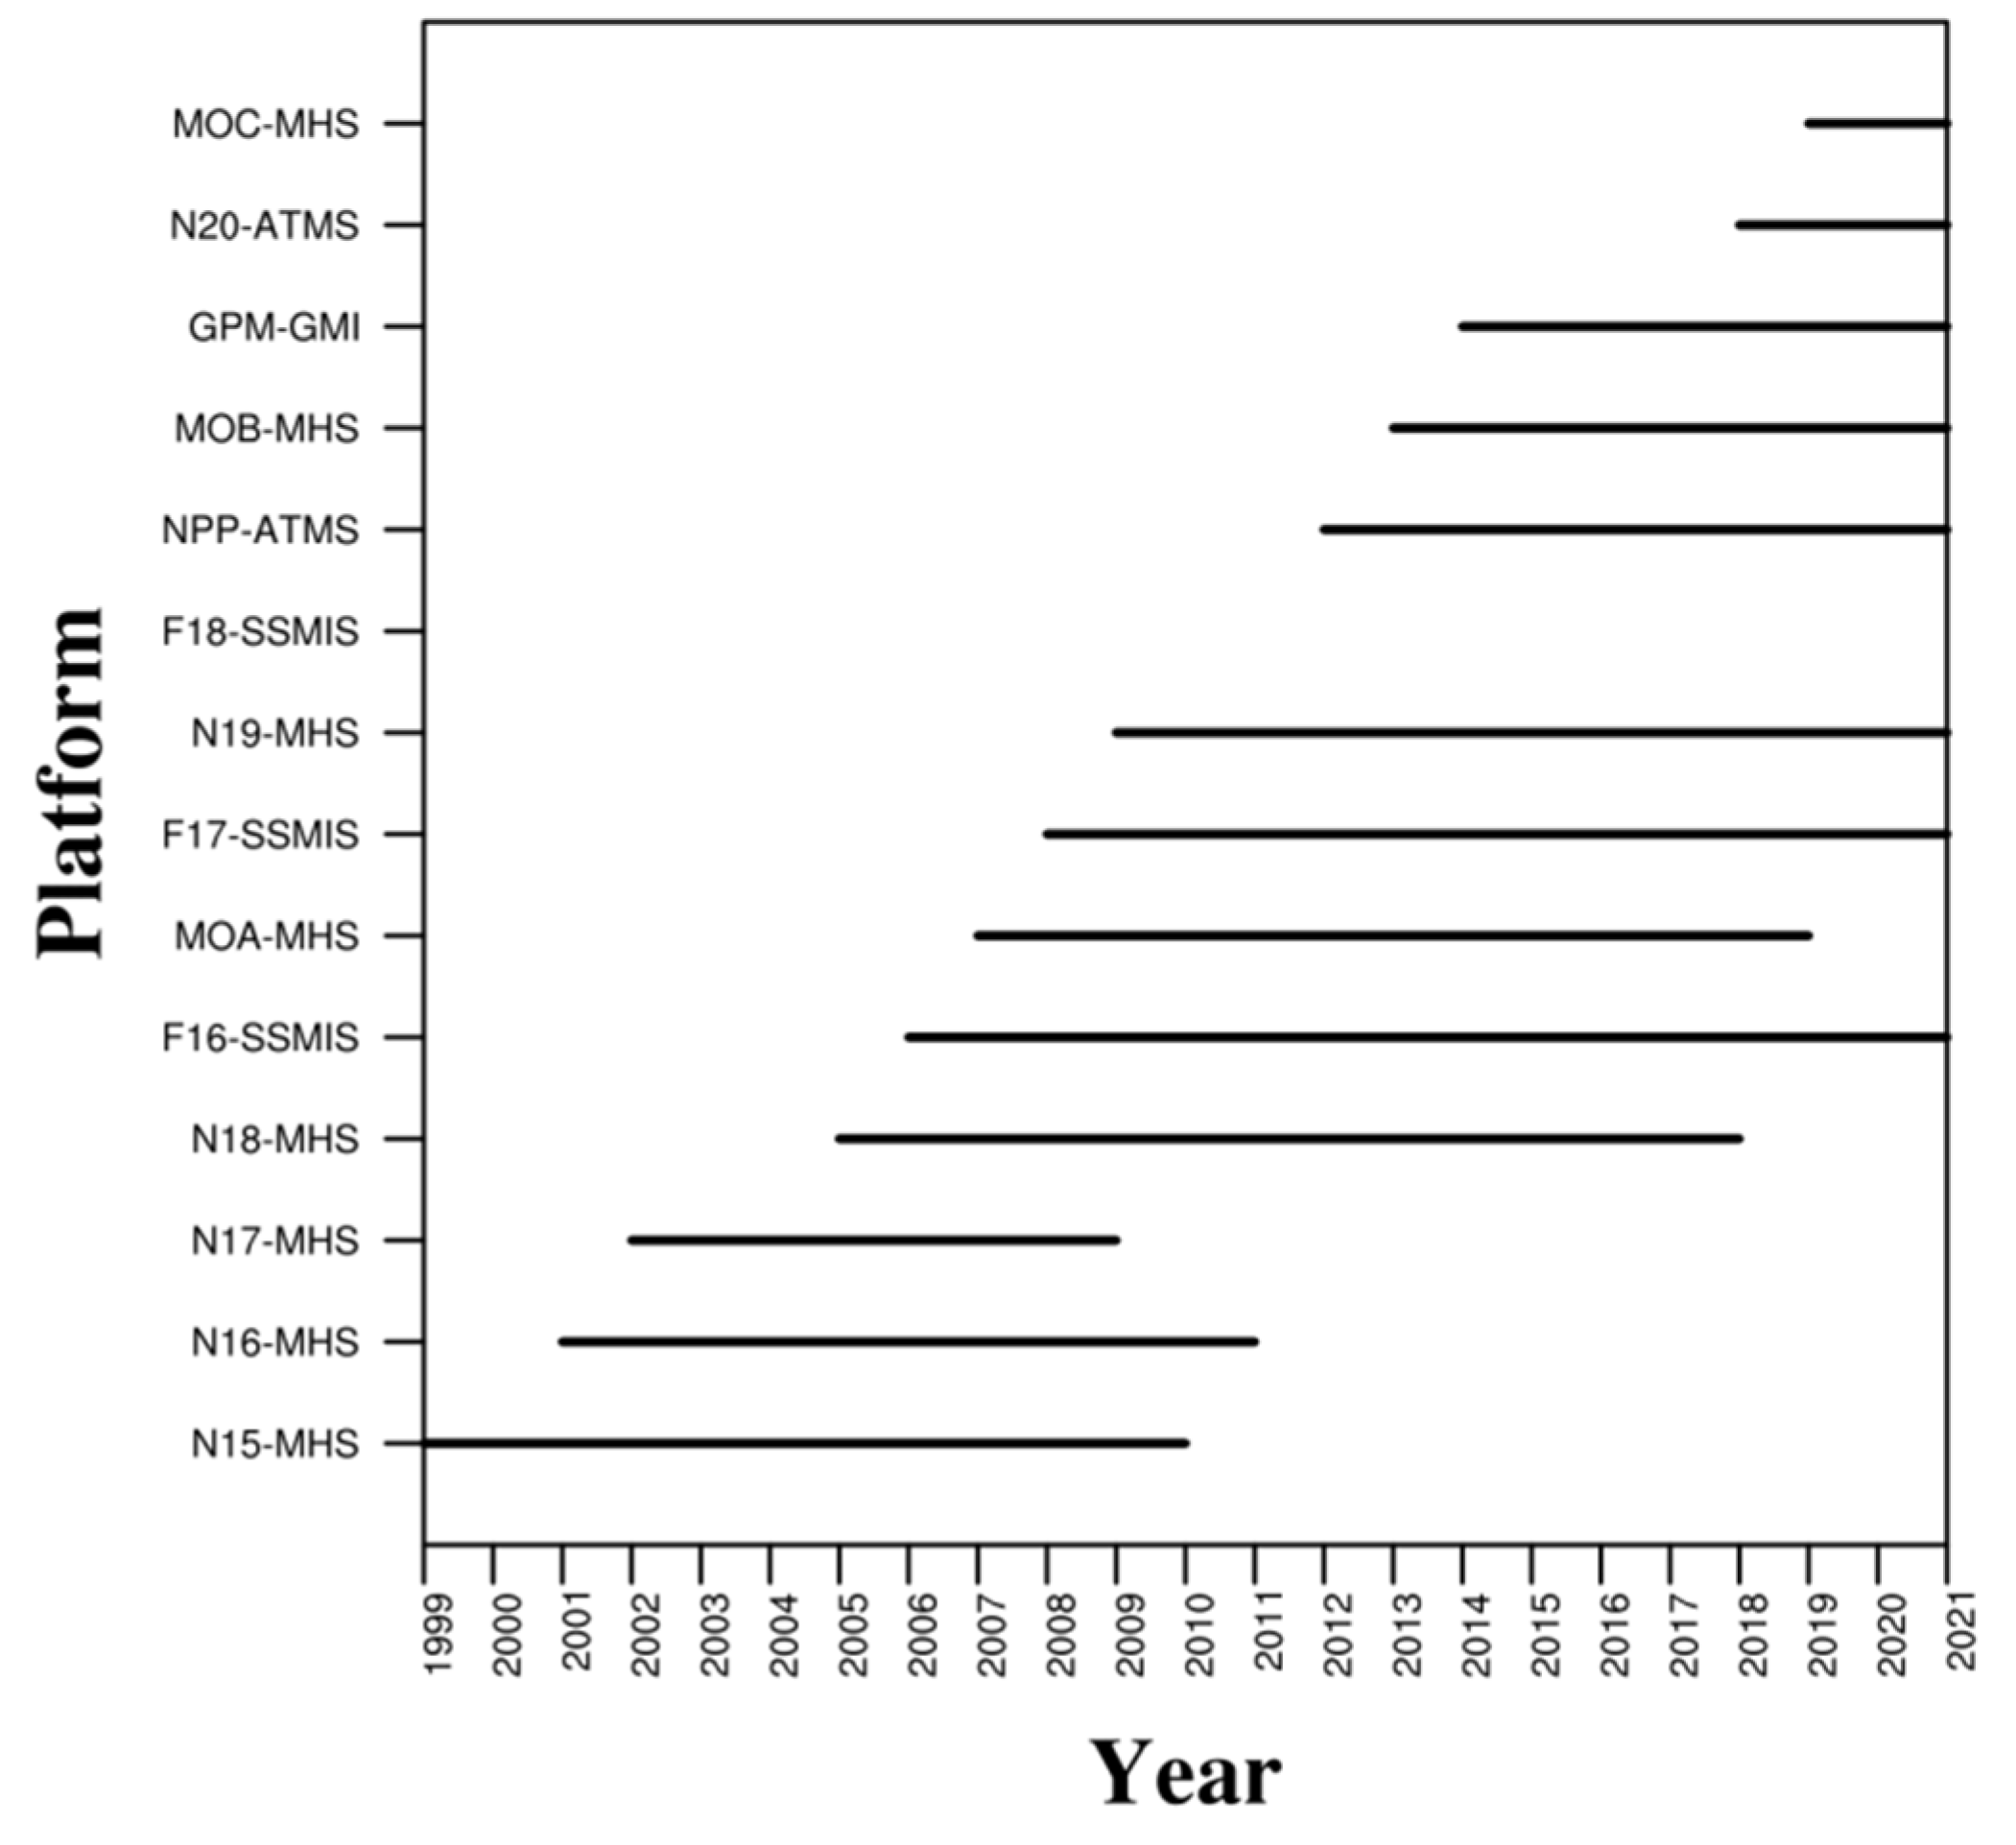
- link different platforms to cover the whole study period 1999–2021 with a single operational platform at a time;
- exploit sensors with the same spatial resolution, i.e., MHS and ATMS.
4. Results
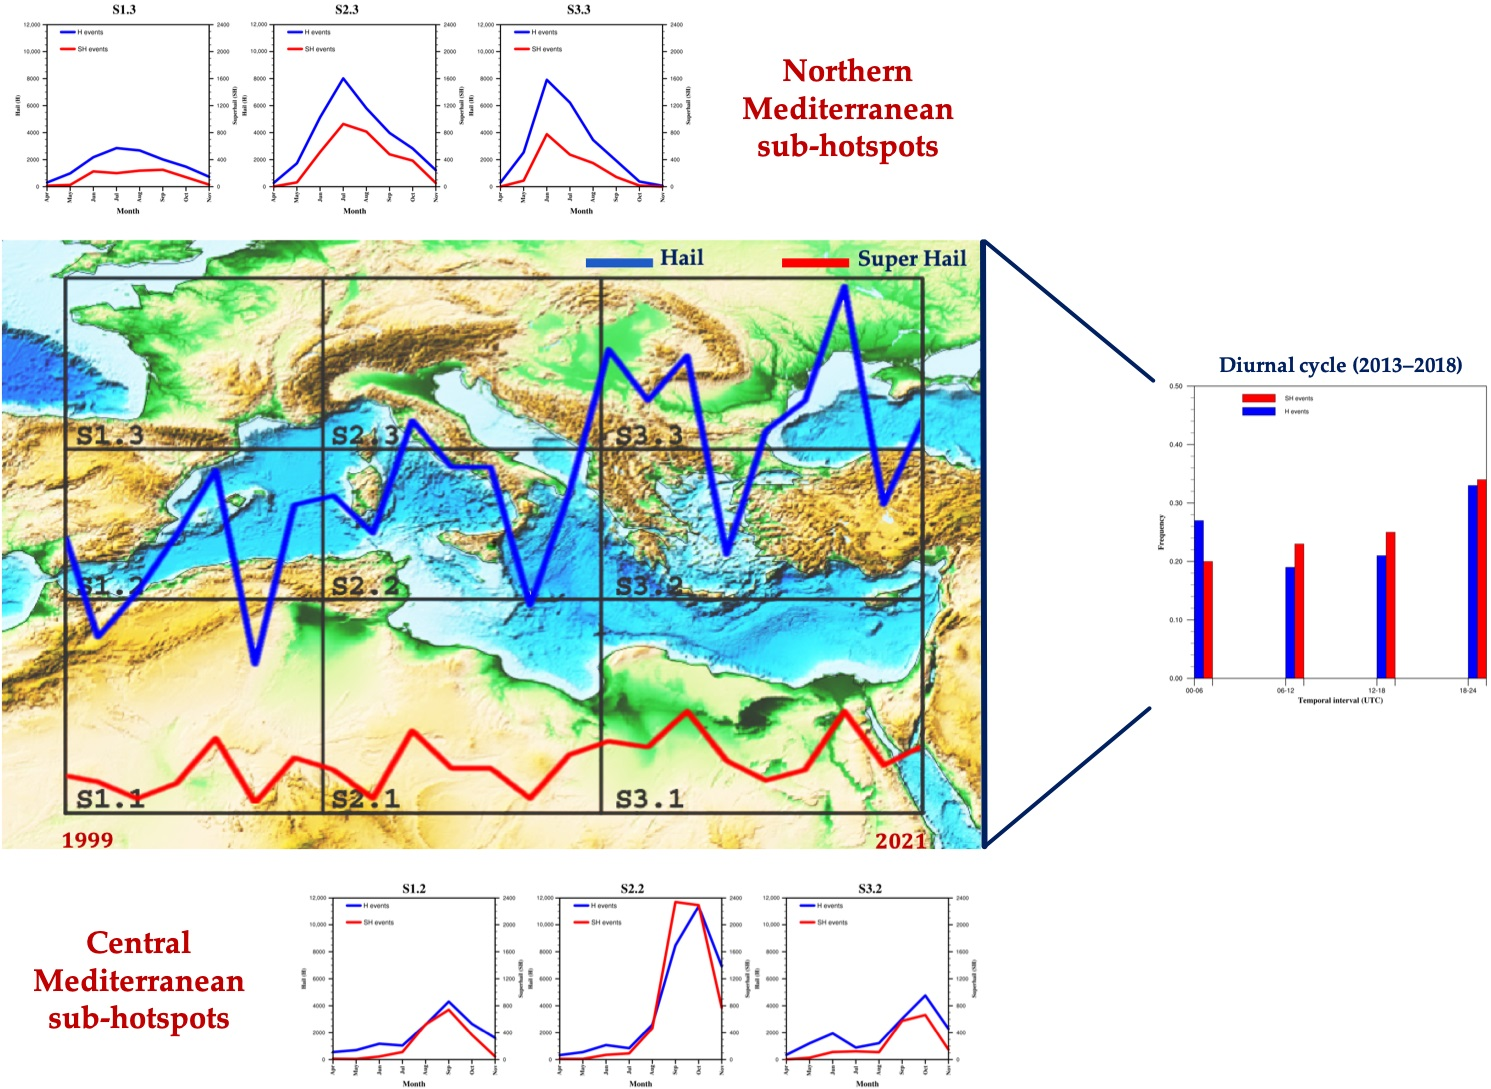
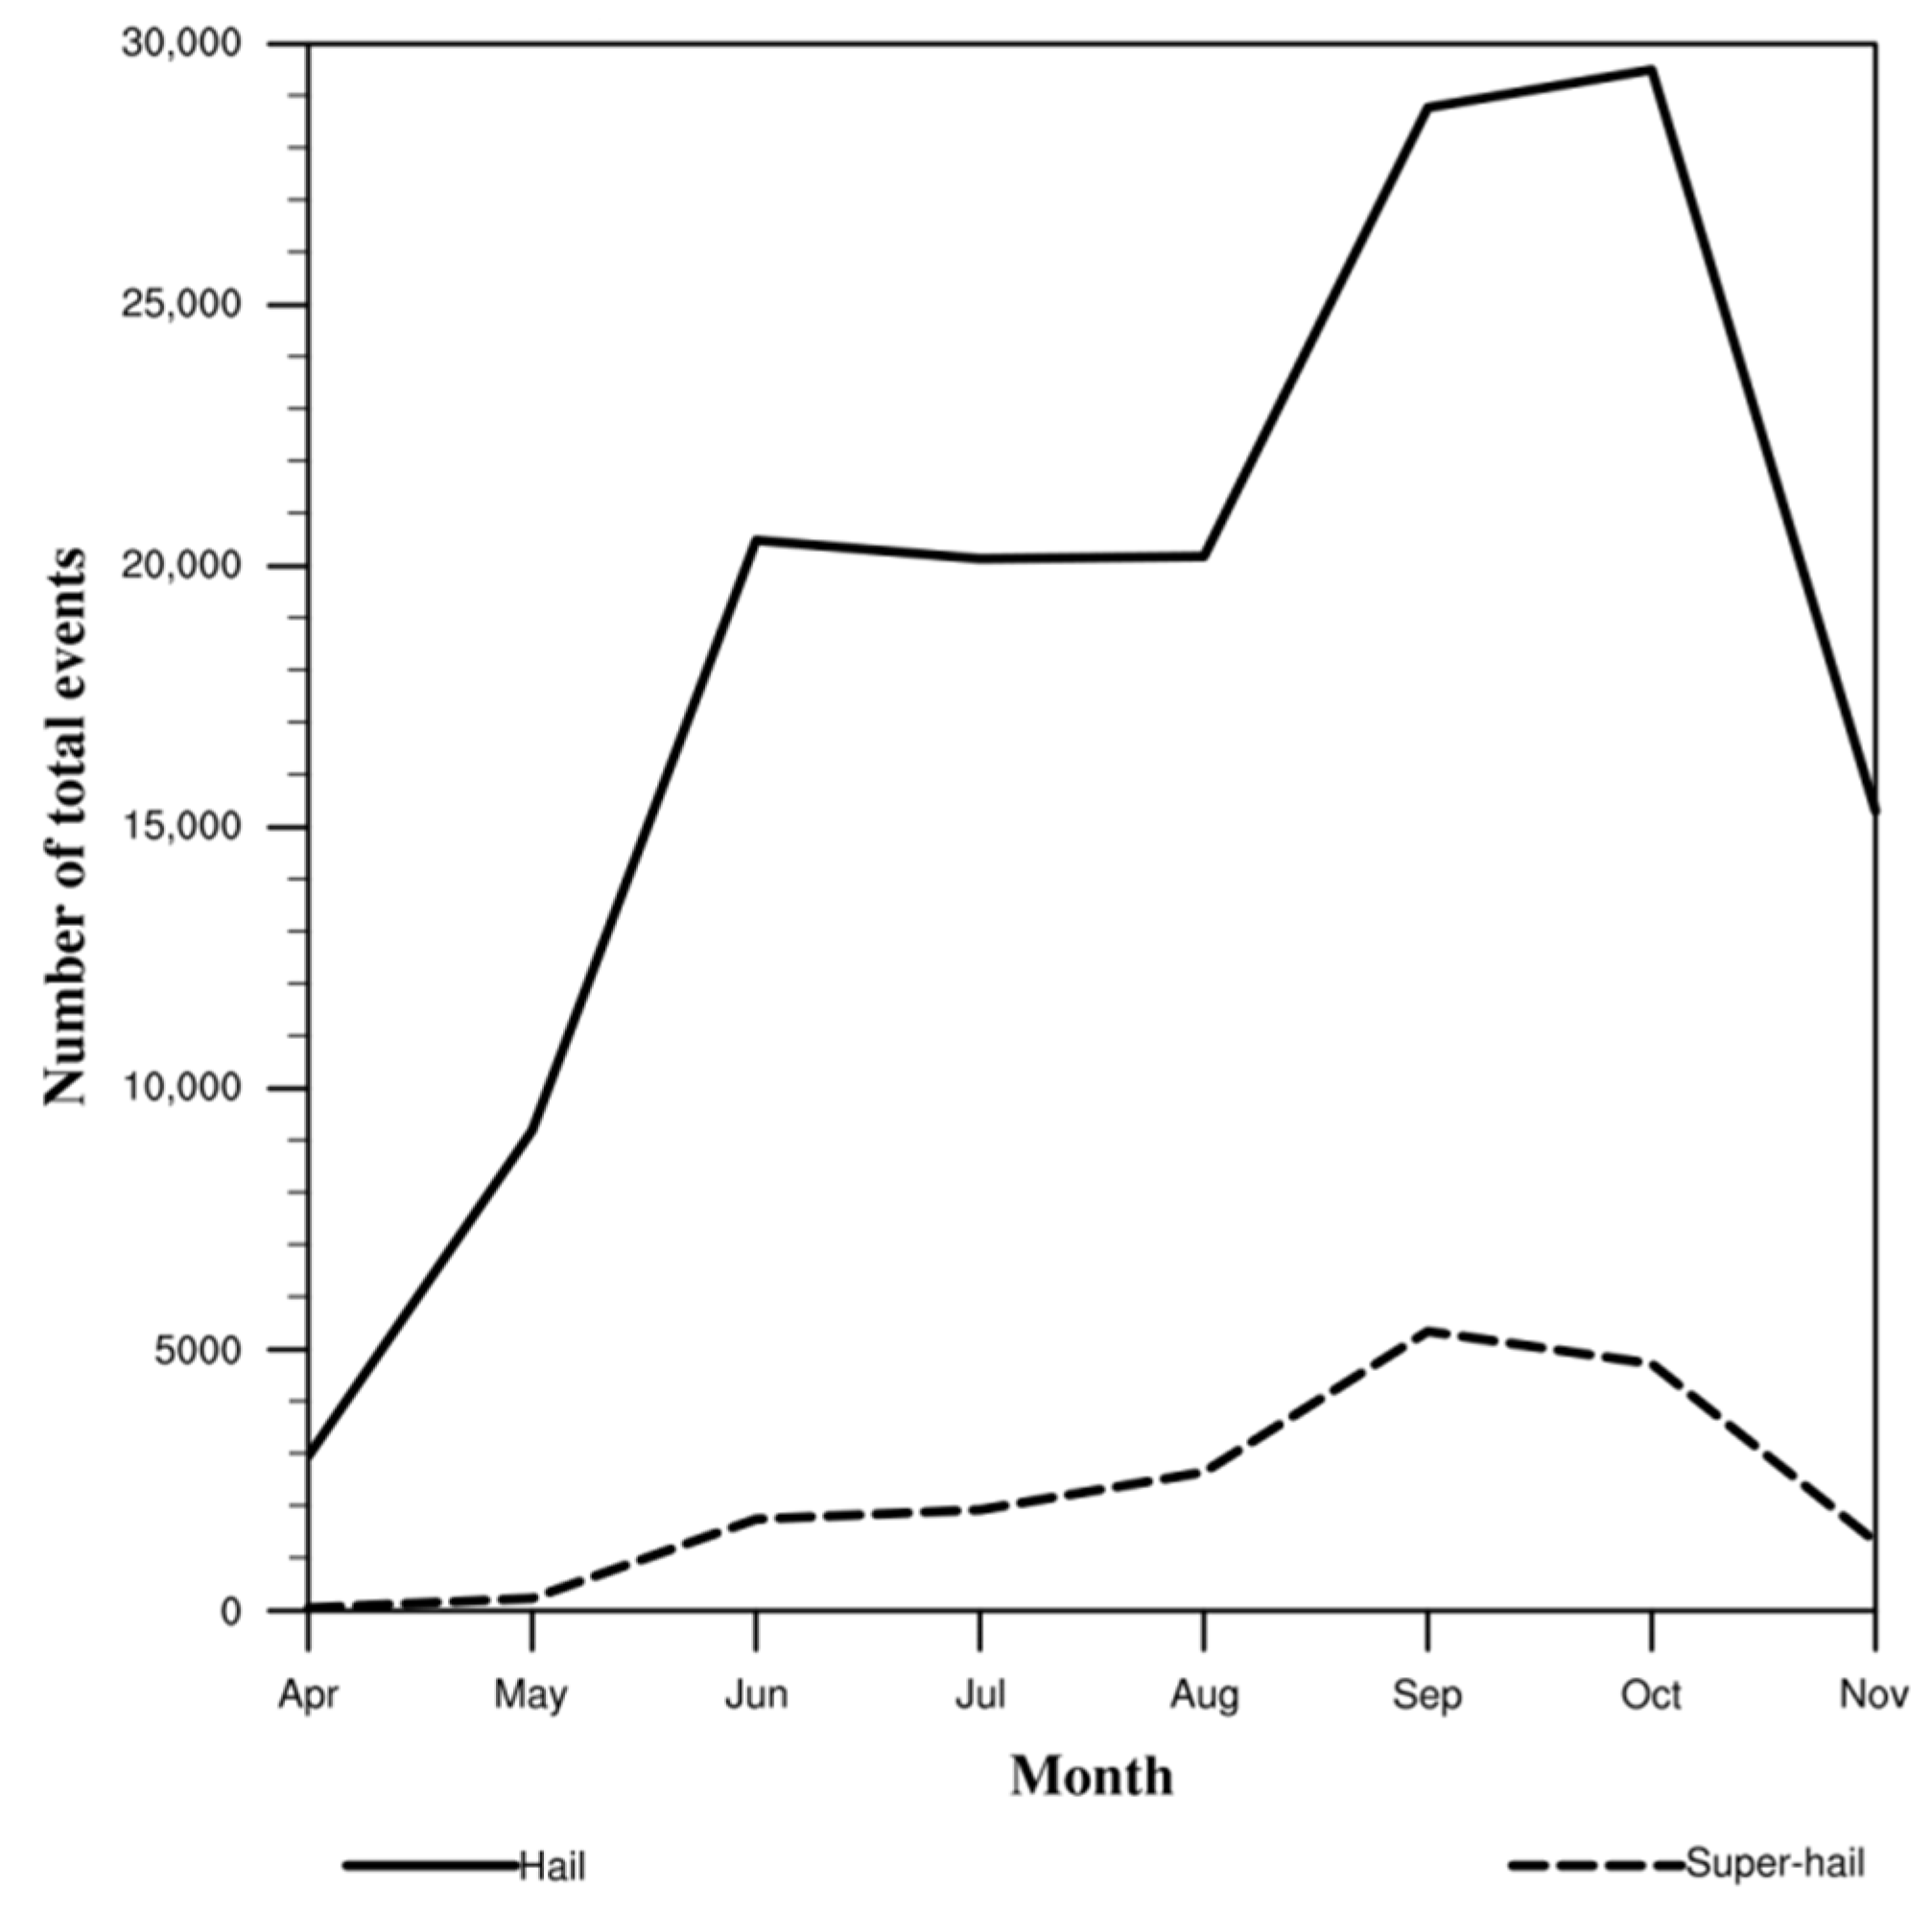
4.1. Monthly Climatology
- April is the month with the lowest number of occurrences, having S1.1 and S1.3 (Algerian basin, Spain, France, and South Belgium) the maximum number of H (571) and SH (14) with respect to the other sectors, respectively. In this month the SH events are almost absent.
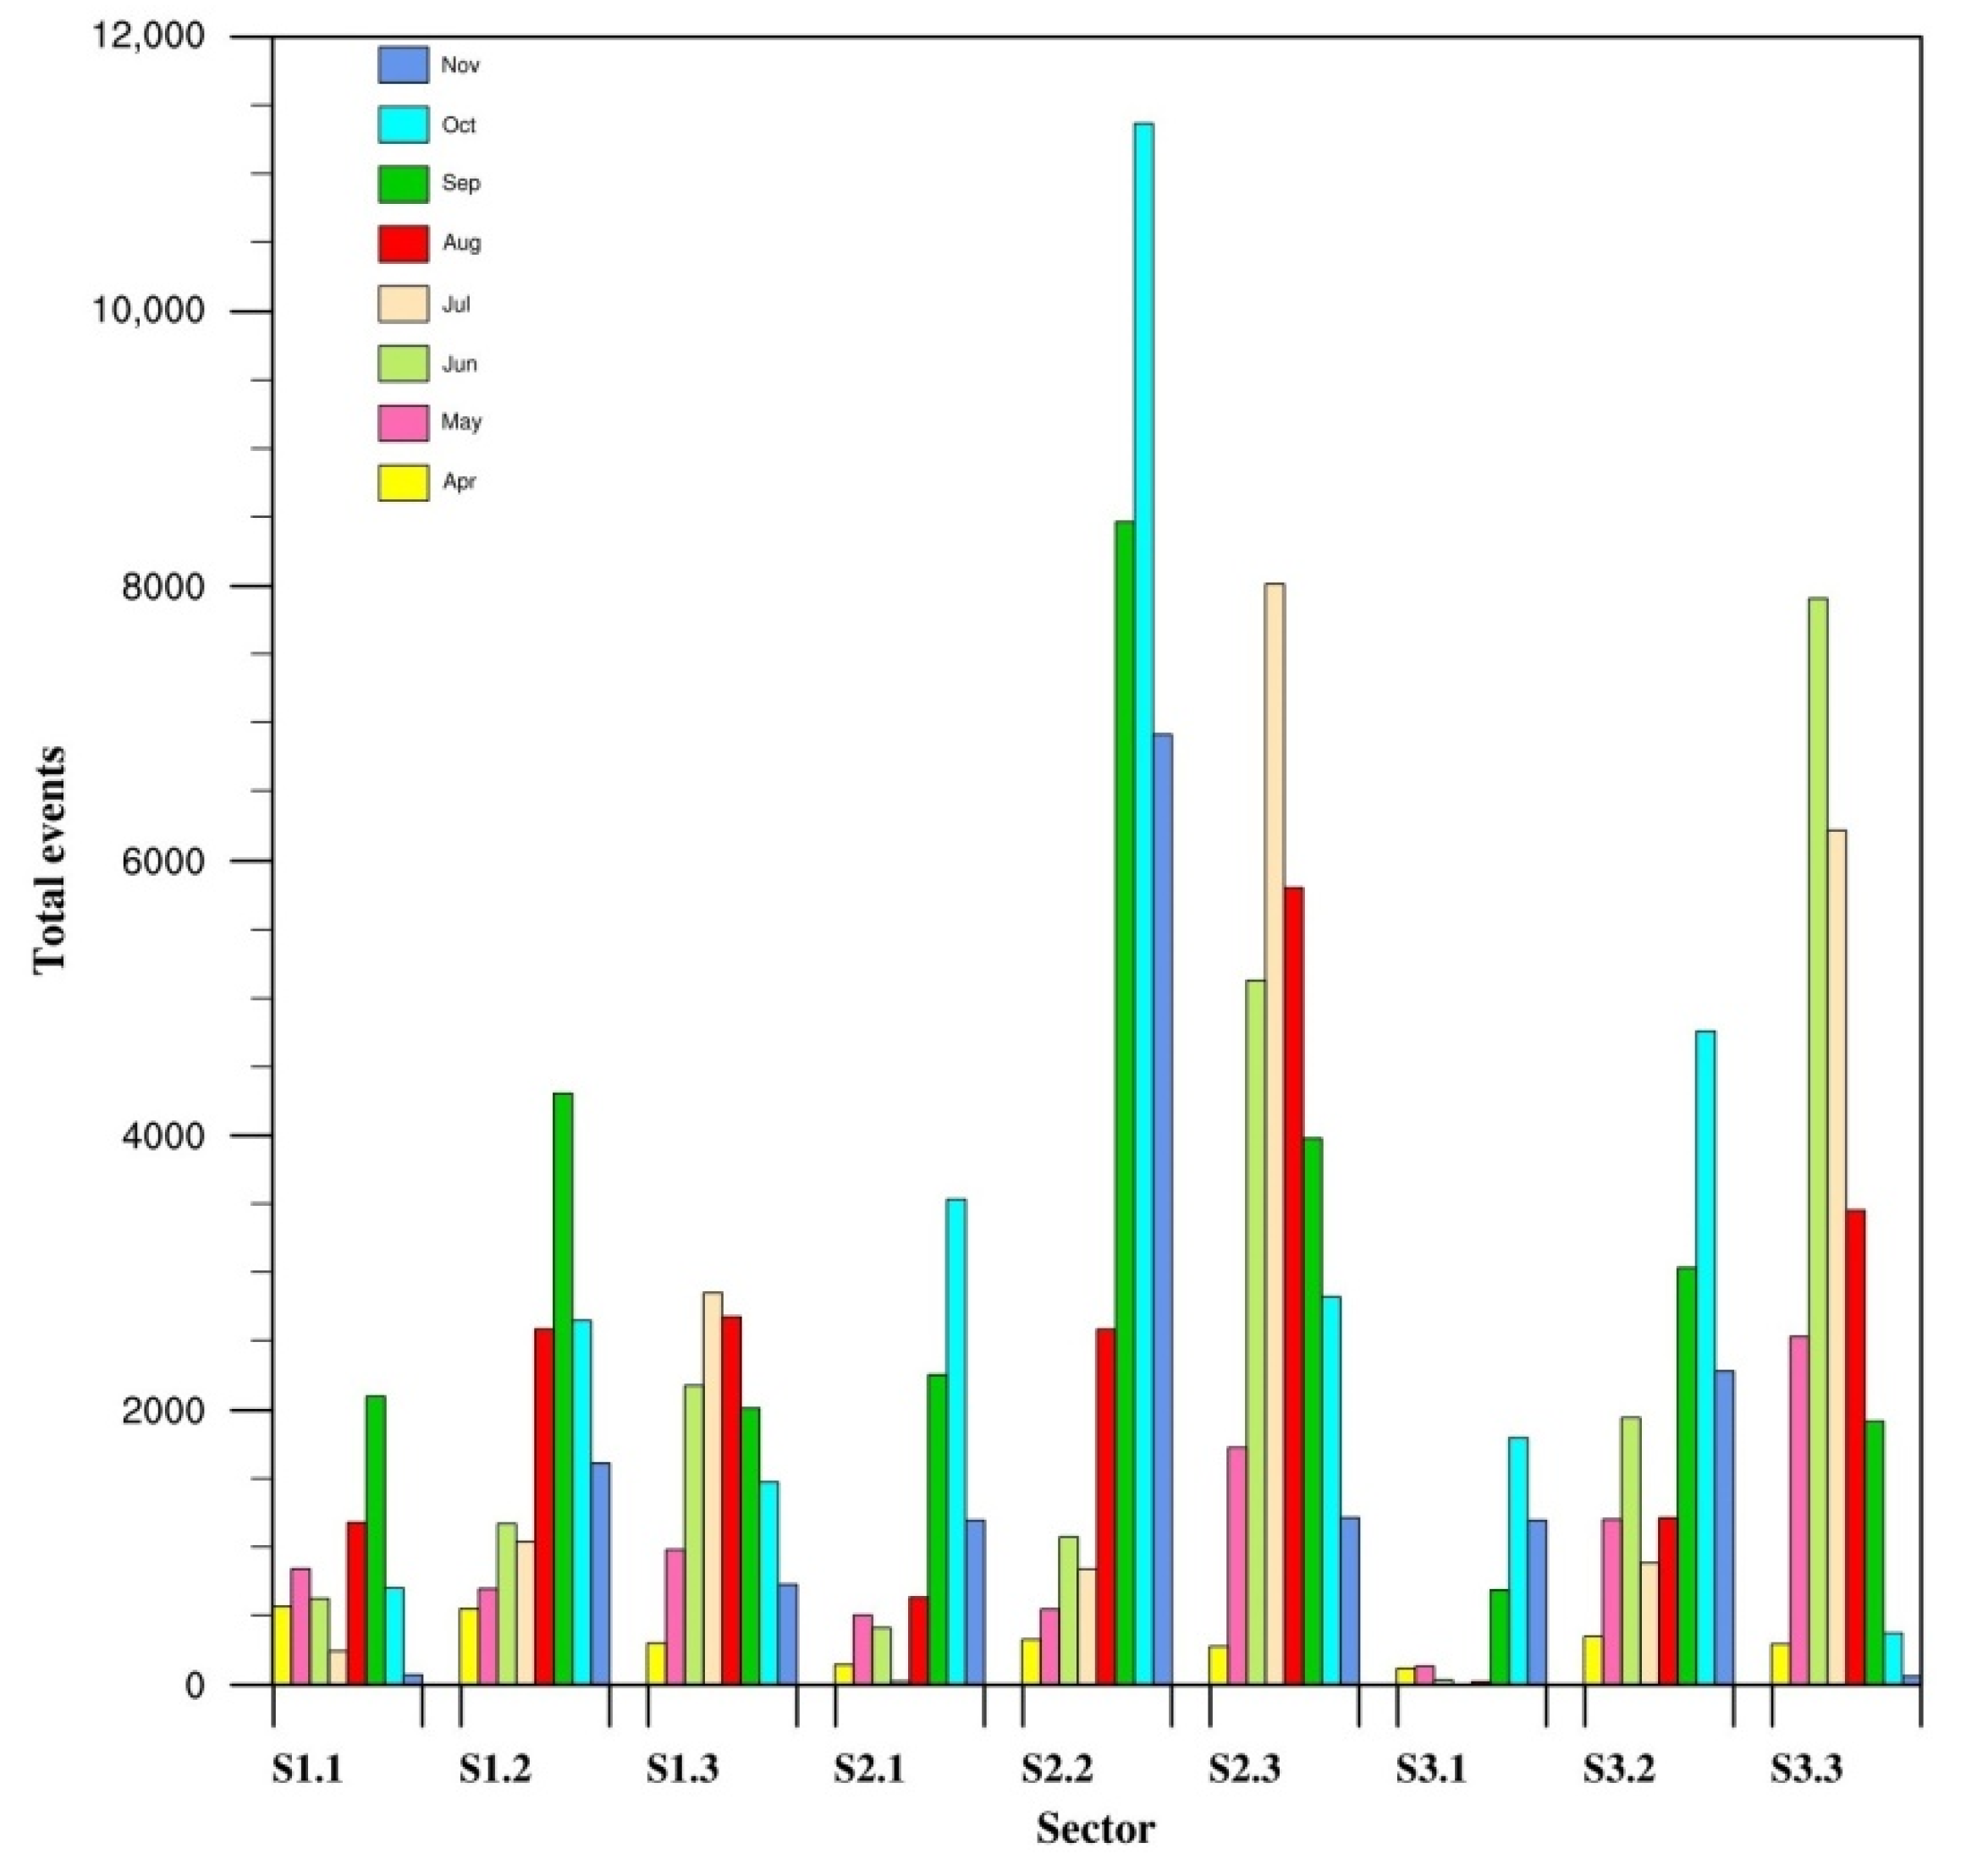
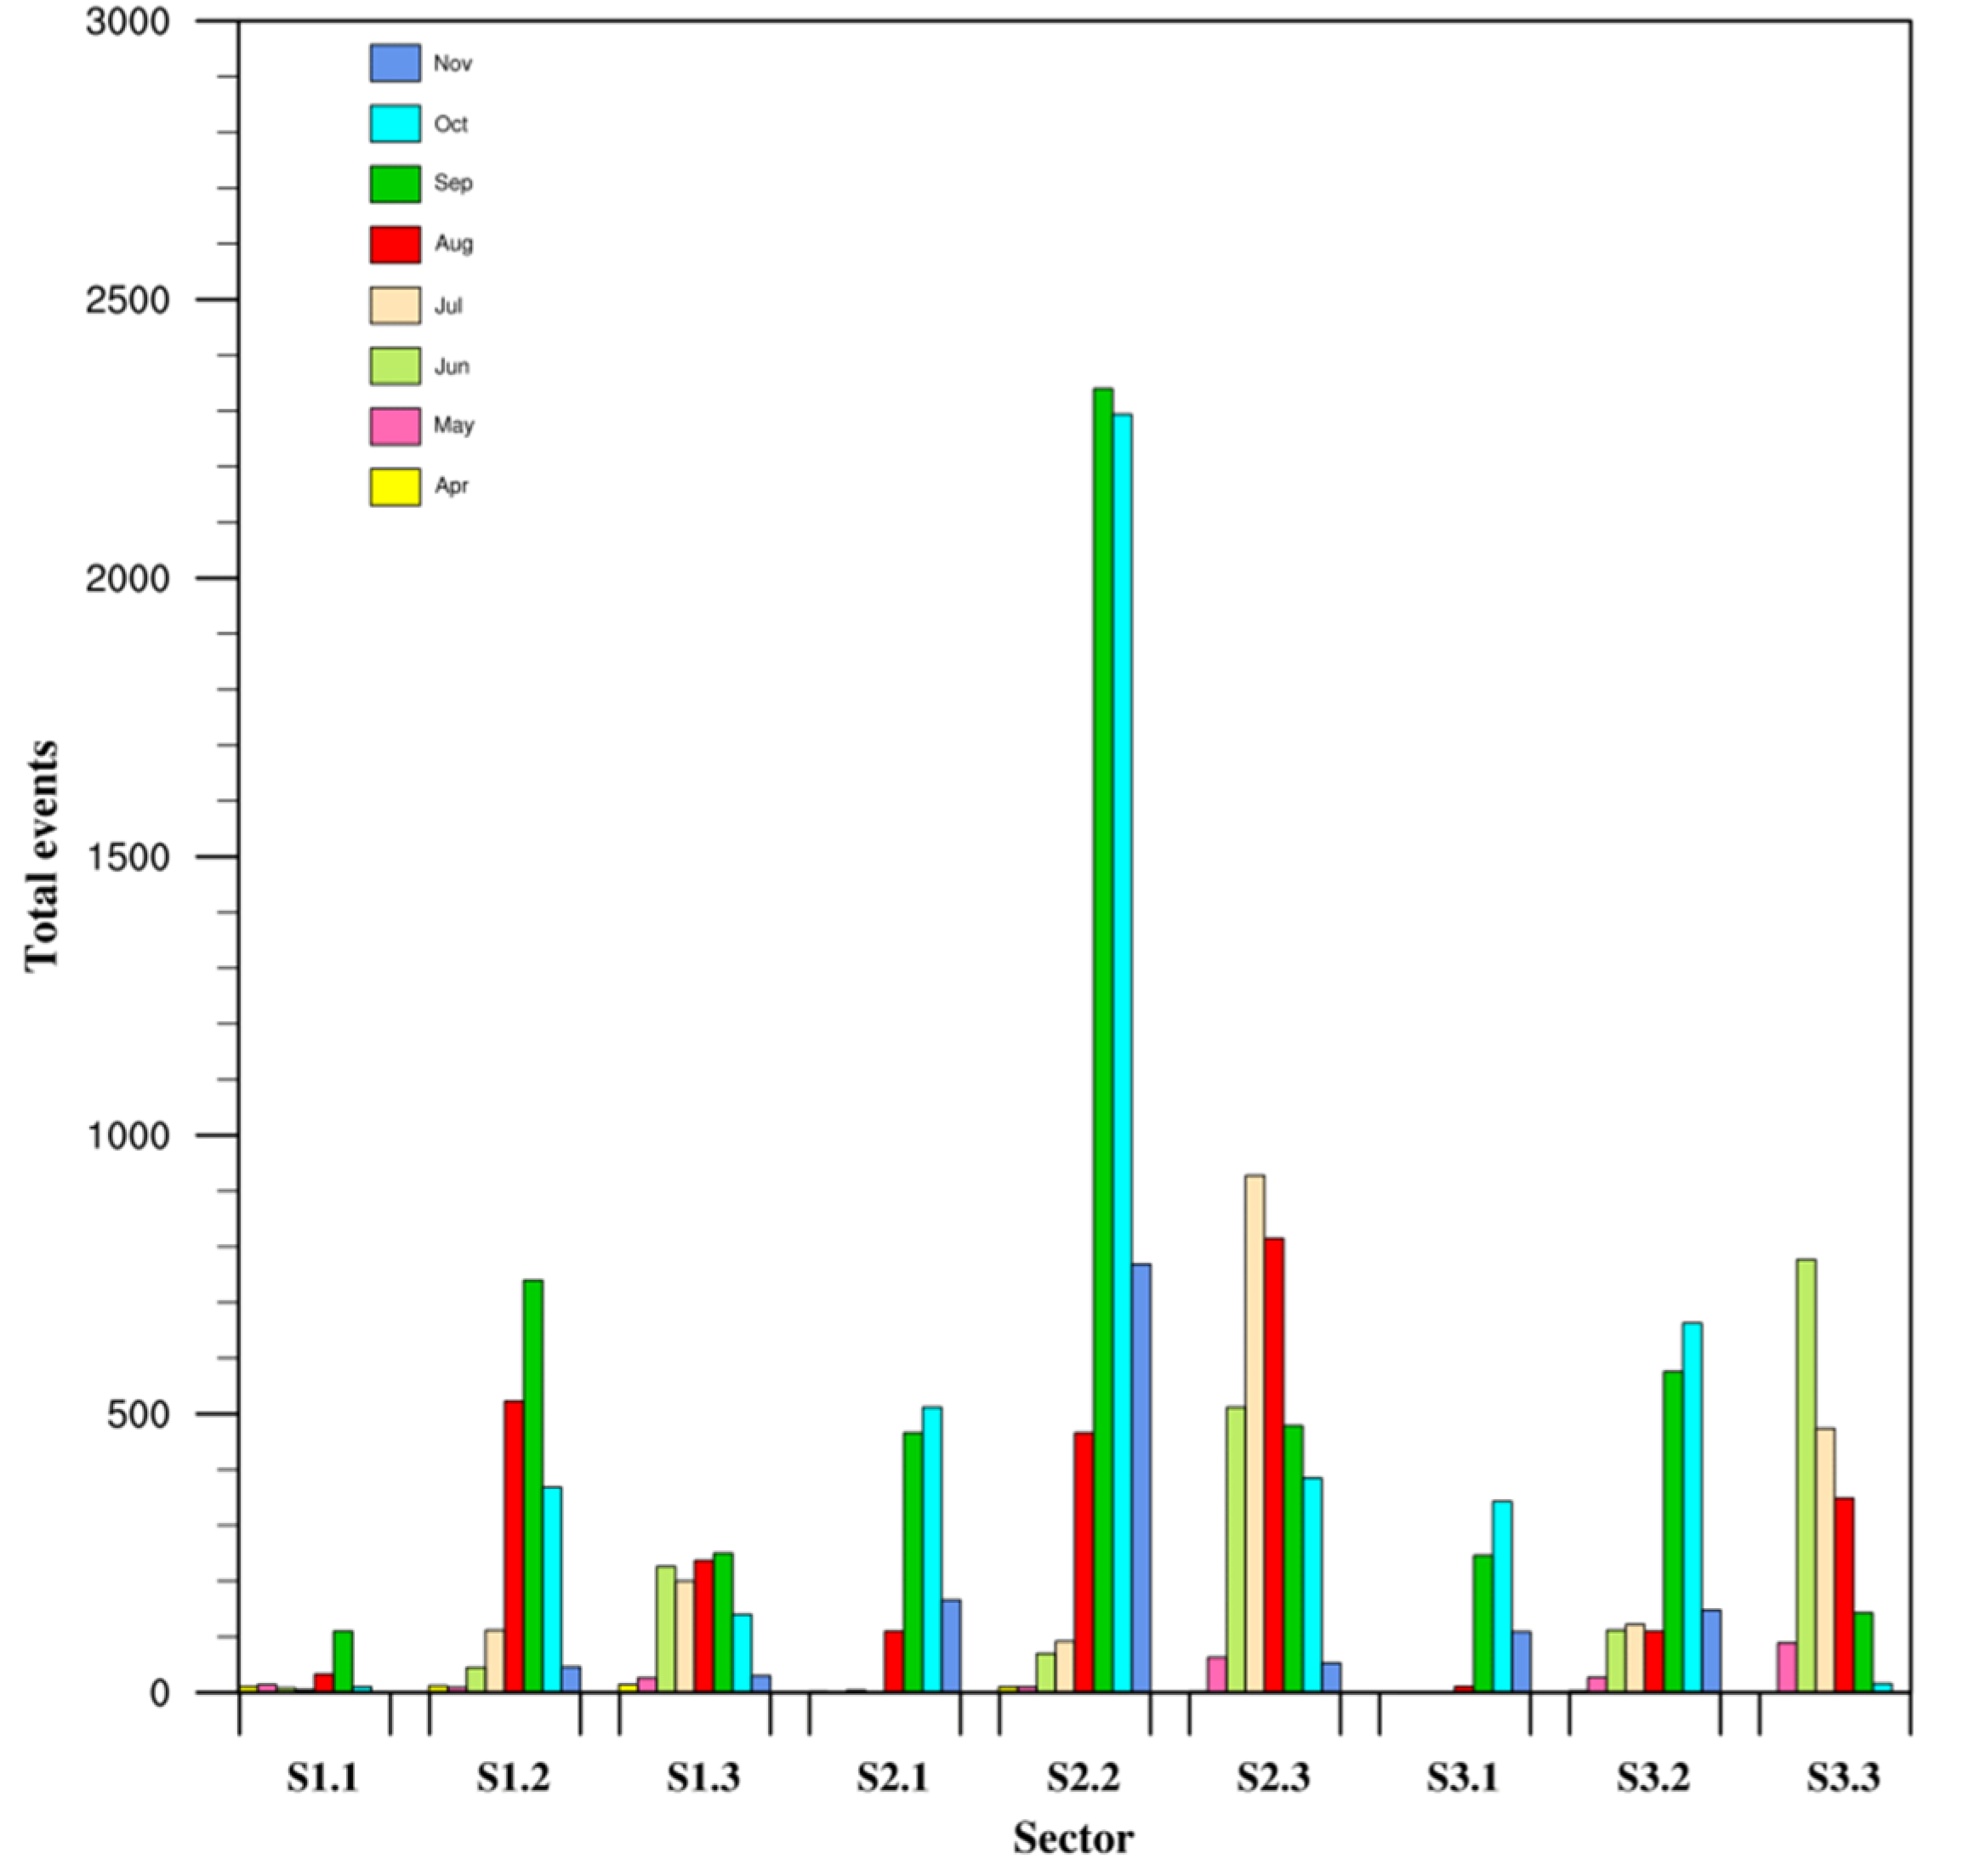
- From May to August, H events affect mainly the northern regions of the domain, in particular sectors S2.3 (Northern Italy, Alps Region, and Dinaric Alps) with the highest peak in July and August, and S3.3 (Balkans and Carpathians mountains) with highest peaks in June and July with respect to other sectors; H occurrences in S1.3 (France and Southern Belgium) is lower than those of the previous sectors. From a dynamic point of view, the distribution of H events could be explained by considering the shift towards higher latitudes that Atlantic storm tracks experience during summertime, when the Iberian Peninsula, Southern Italy, and the southern part of the Balkans are generally protected by a subtropical anticyclonic belt. A similar spatial distribution is valid also for the SH events that reach their maxima in July and August for S2.3 (928 and 815 events, respectively) and in May and June for S3.3 (89 and 777, respectively). The central sectors (S1.2, S2.2 and S3.2) had lower occurrences compared to the northern areas of the domain. Finally, H and SH events in the southern sectors of the domain (North Africa and Middle East) were negligible or even null.
- 3.
- In autumn (September to November), the highest number of H events are found in the central sectors of the domain. In particular, S2.2 (Southern Italy and Tunisia) is the sector with the highest number of H pixels in each month of the period (8496, 11,369, and 6921). The sector S1.2 (Spain, Balearic Islands and Western Mediterranean) showed its highest number of H occurrences in September (4308), while S3.2 (Greece and the Aegean Sea) experienced its highest number of H events in October (4761). Such a distribution of hail events in this period of the year could be supported by the action of the polar jet stream; as autumn approaches, a secondary branch of the jet stream often reaches the western part of the Mediterranean Sea enhancing the development of troughs that generally affect the whole basin in the W-E direction. These systems are fed along their path by humidity produced by high sea surface temperatures and can sometimes trigger severe convective instability conditions. The number of H events also generally increased in the southern sectors, even though to a lesser degree, especially in S2.1 (South Mediterranean, Southern Tunisia and Libya), probably due to the presence of high sea surface temperatures in contrast with the nearby land. Though the total number of SH events was considerably lower than that of the corresponding H events, it can be noted that in some sectors the seasonality of SH events is preserved, such as in S2.2 and S2.3, which stand out again as the sectors most affected by SH events.
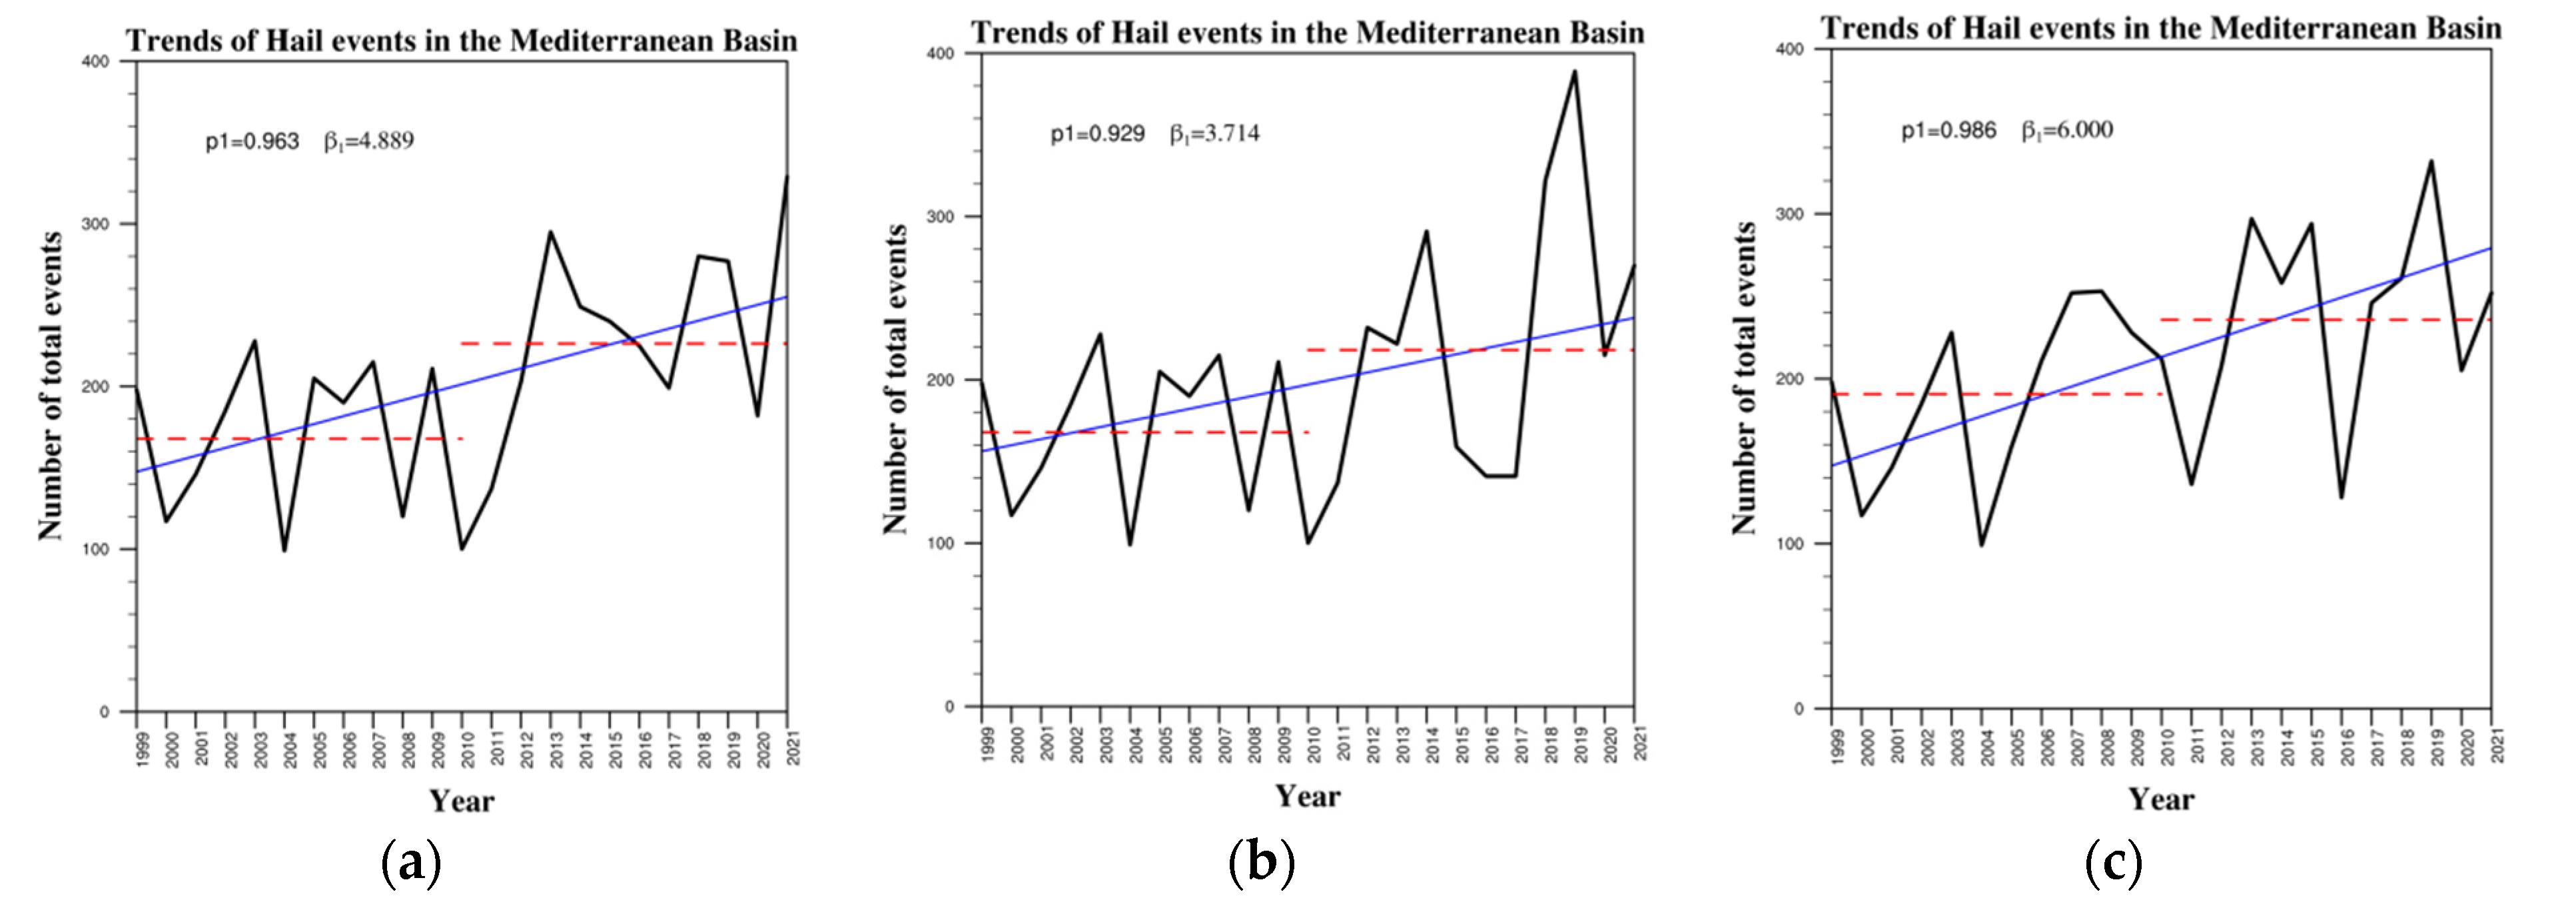
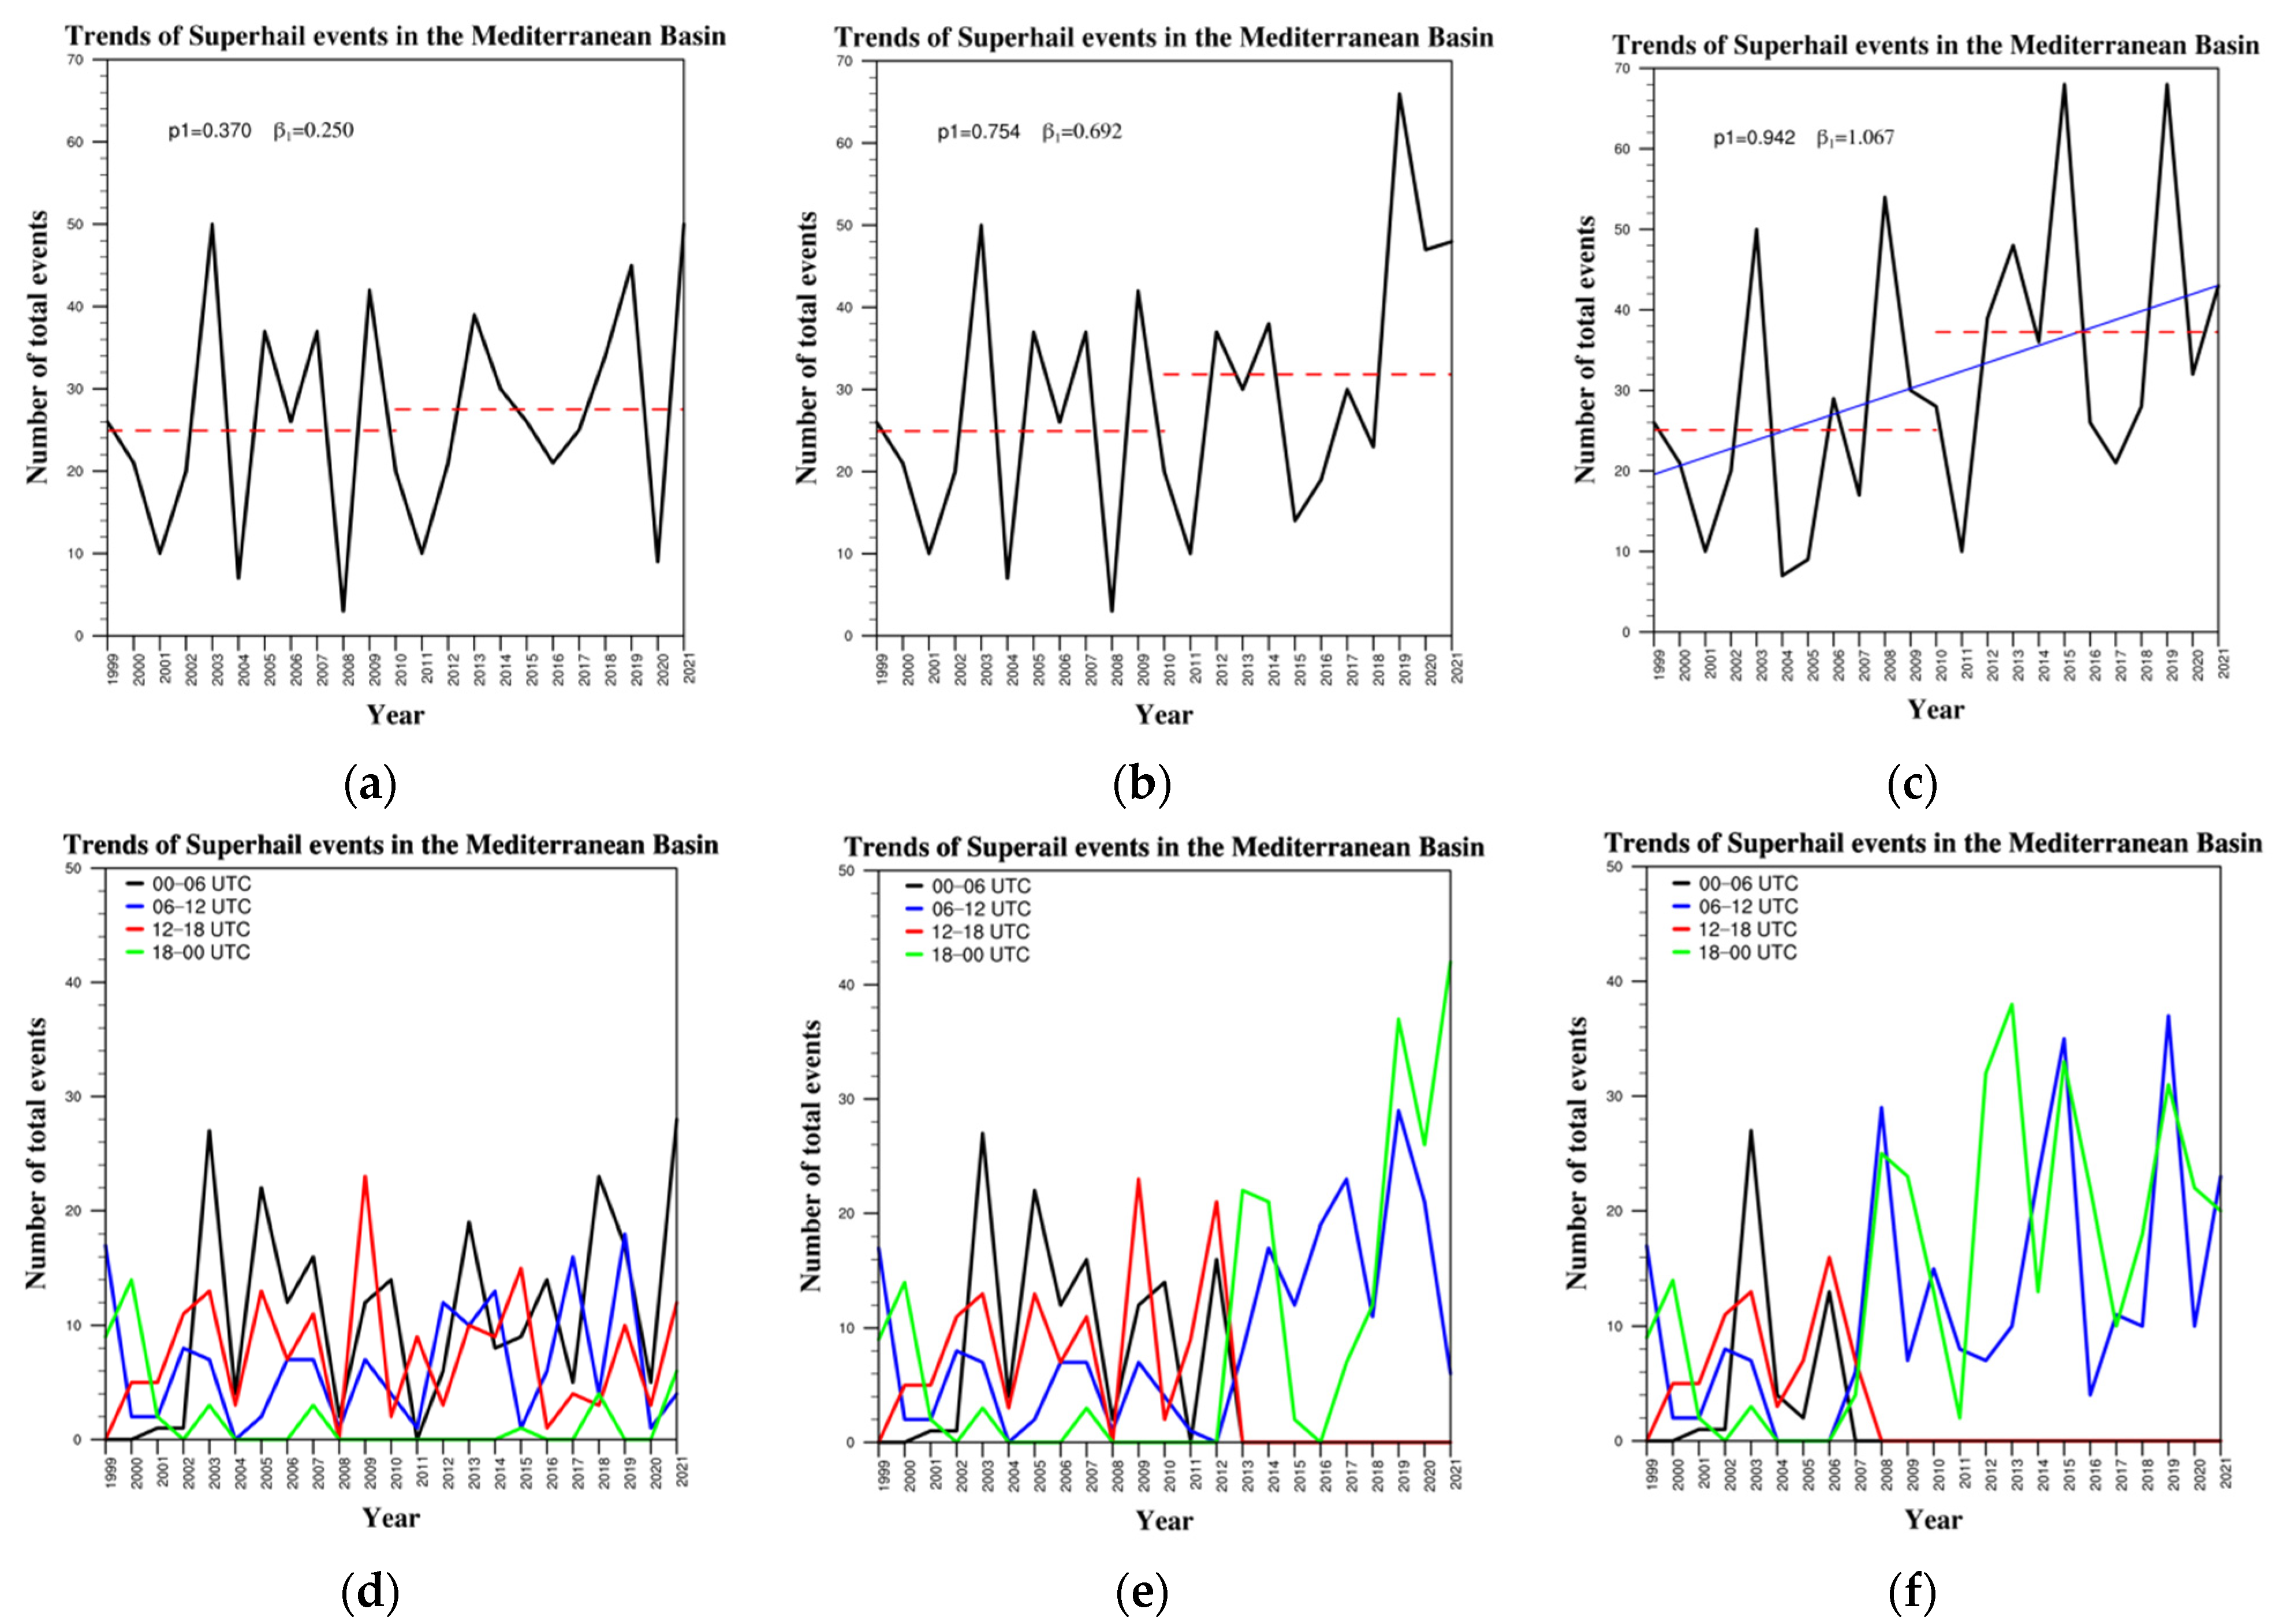
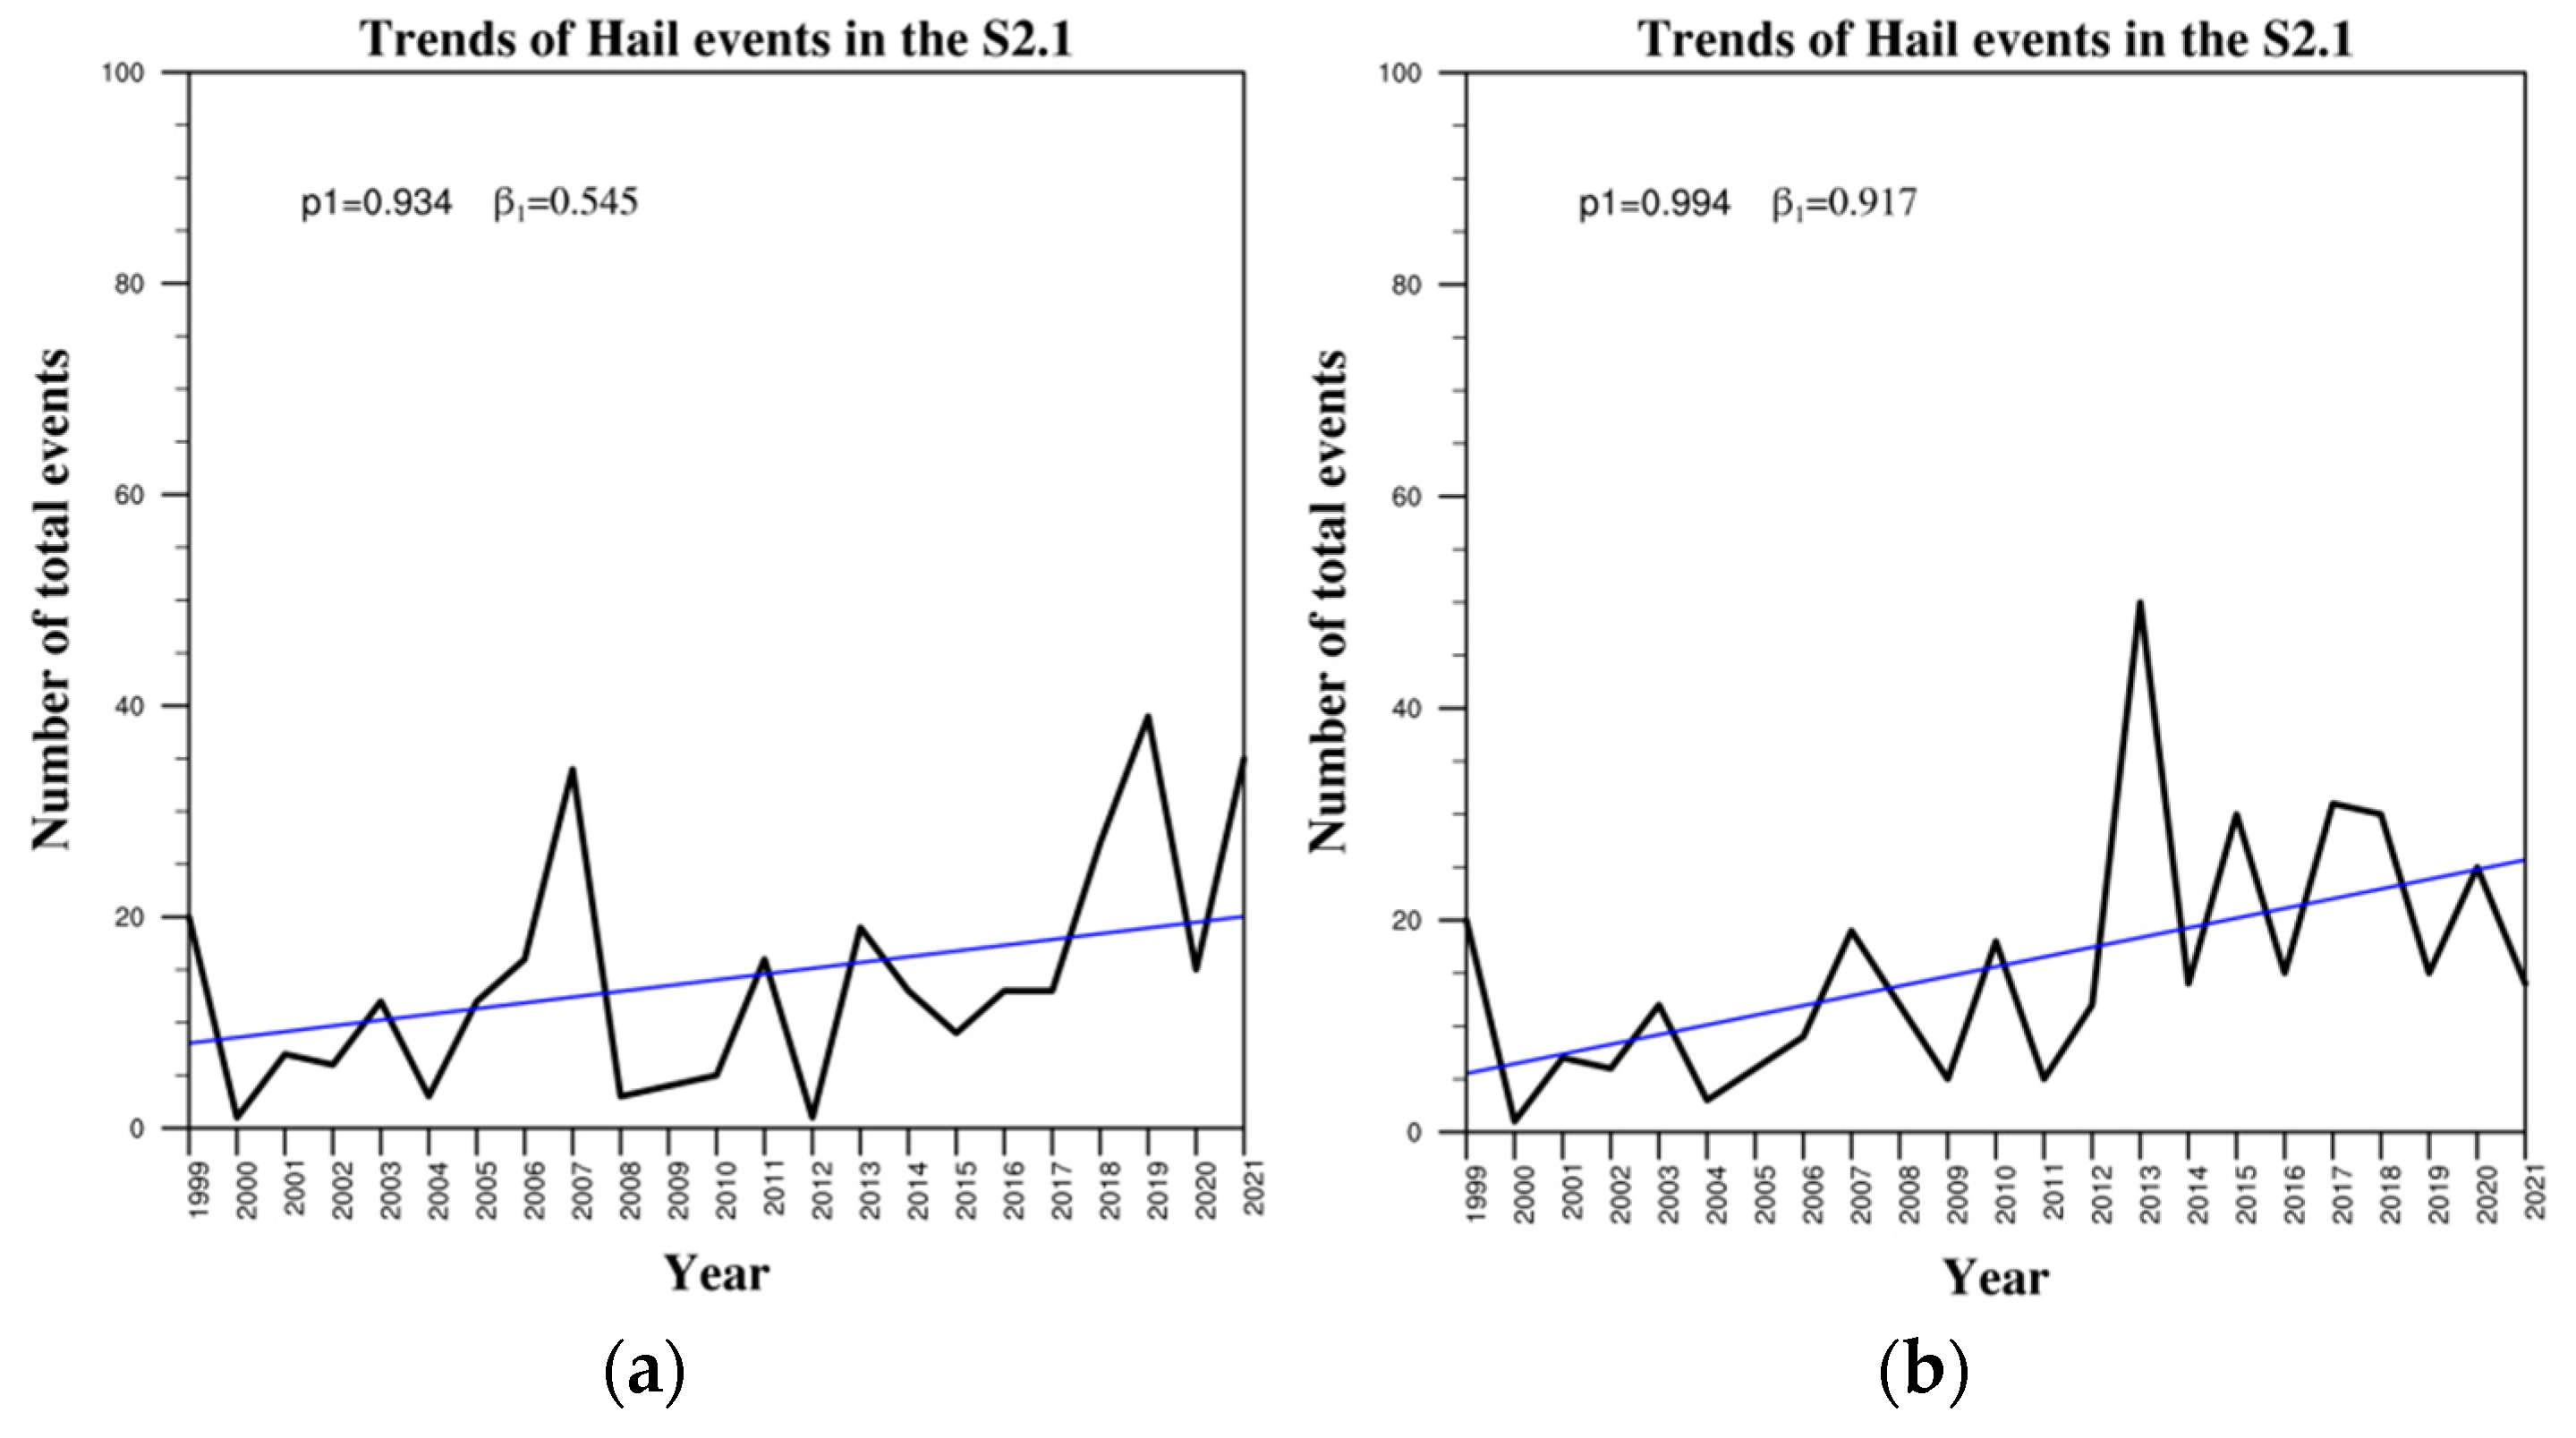
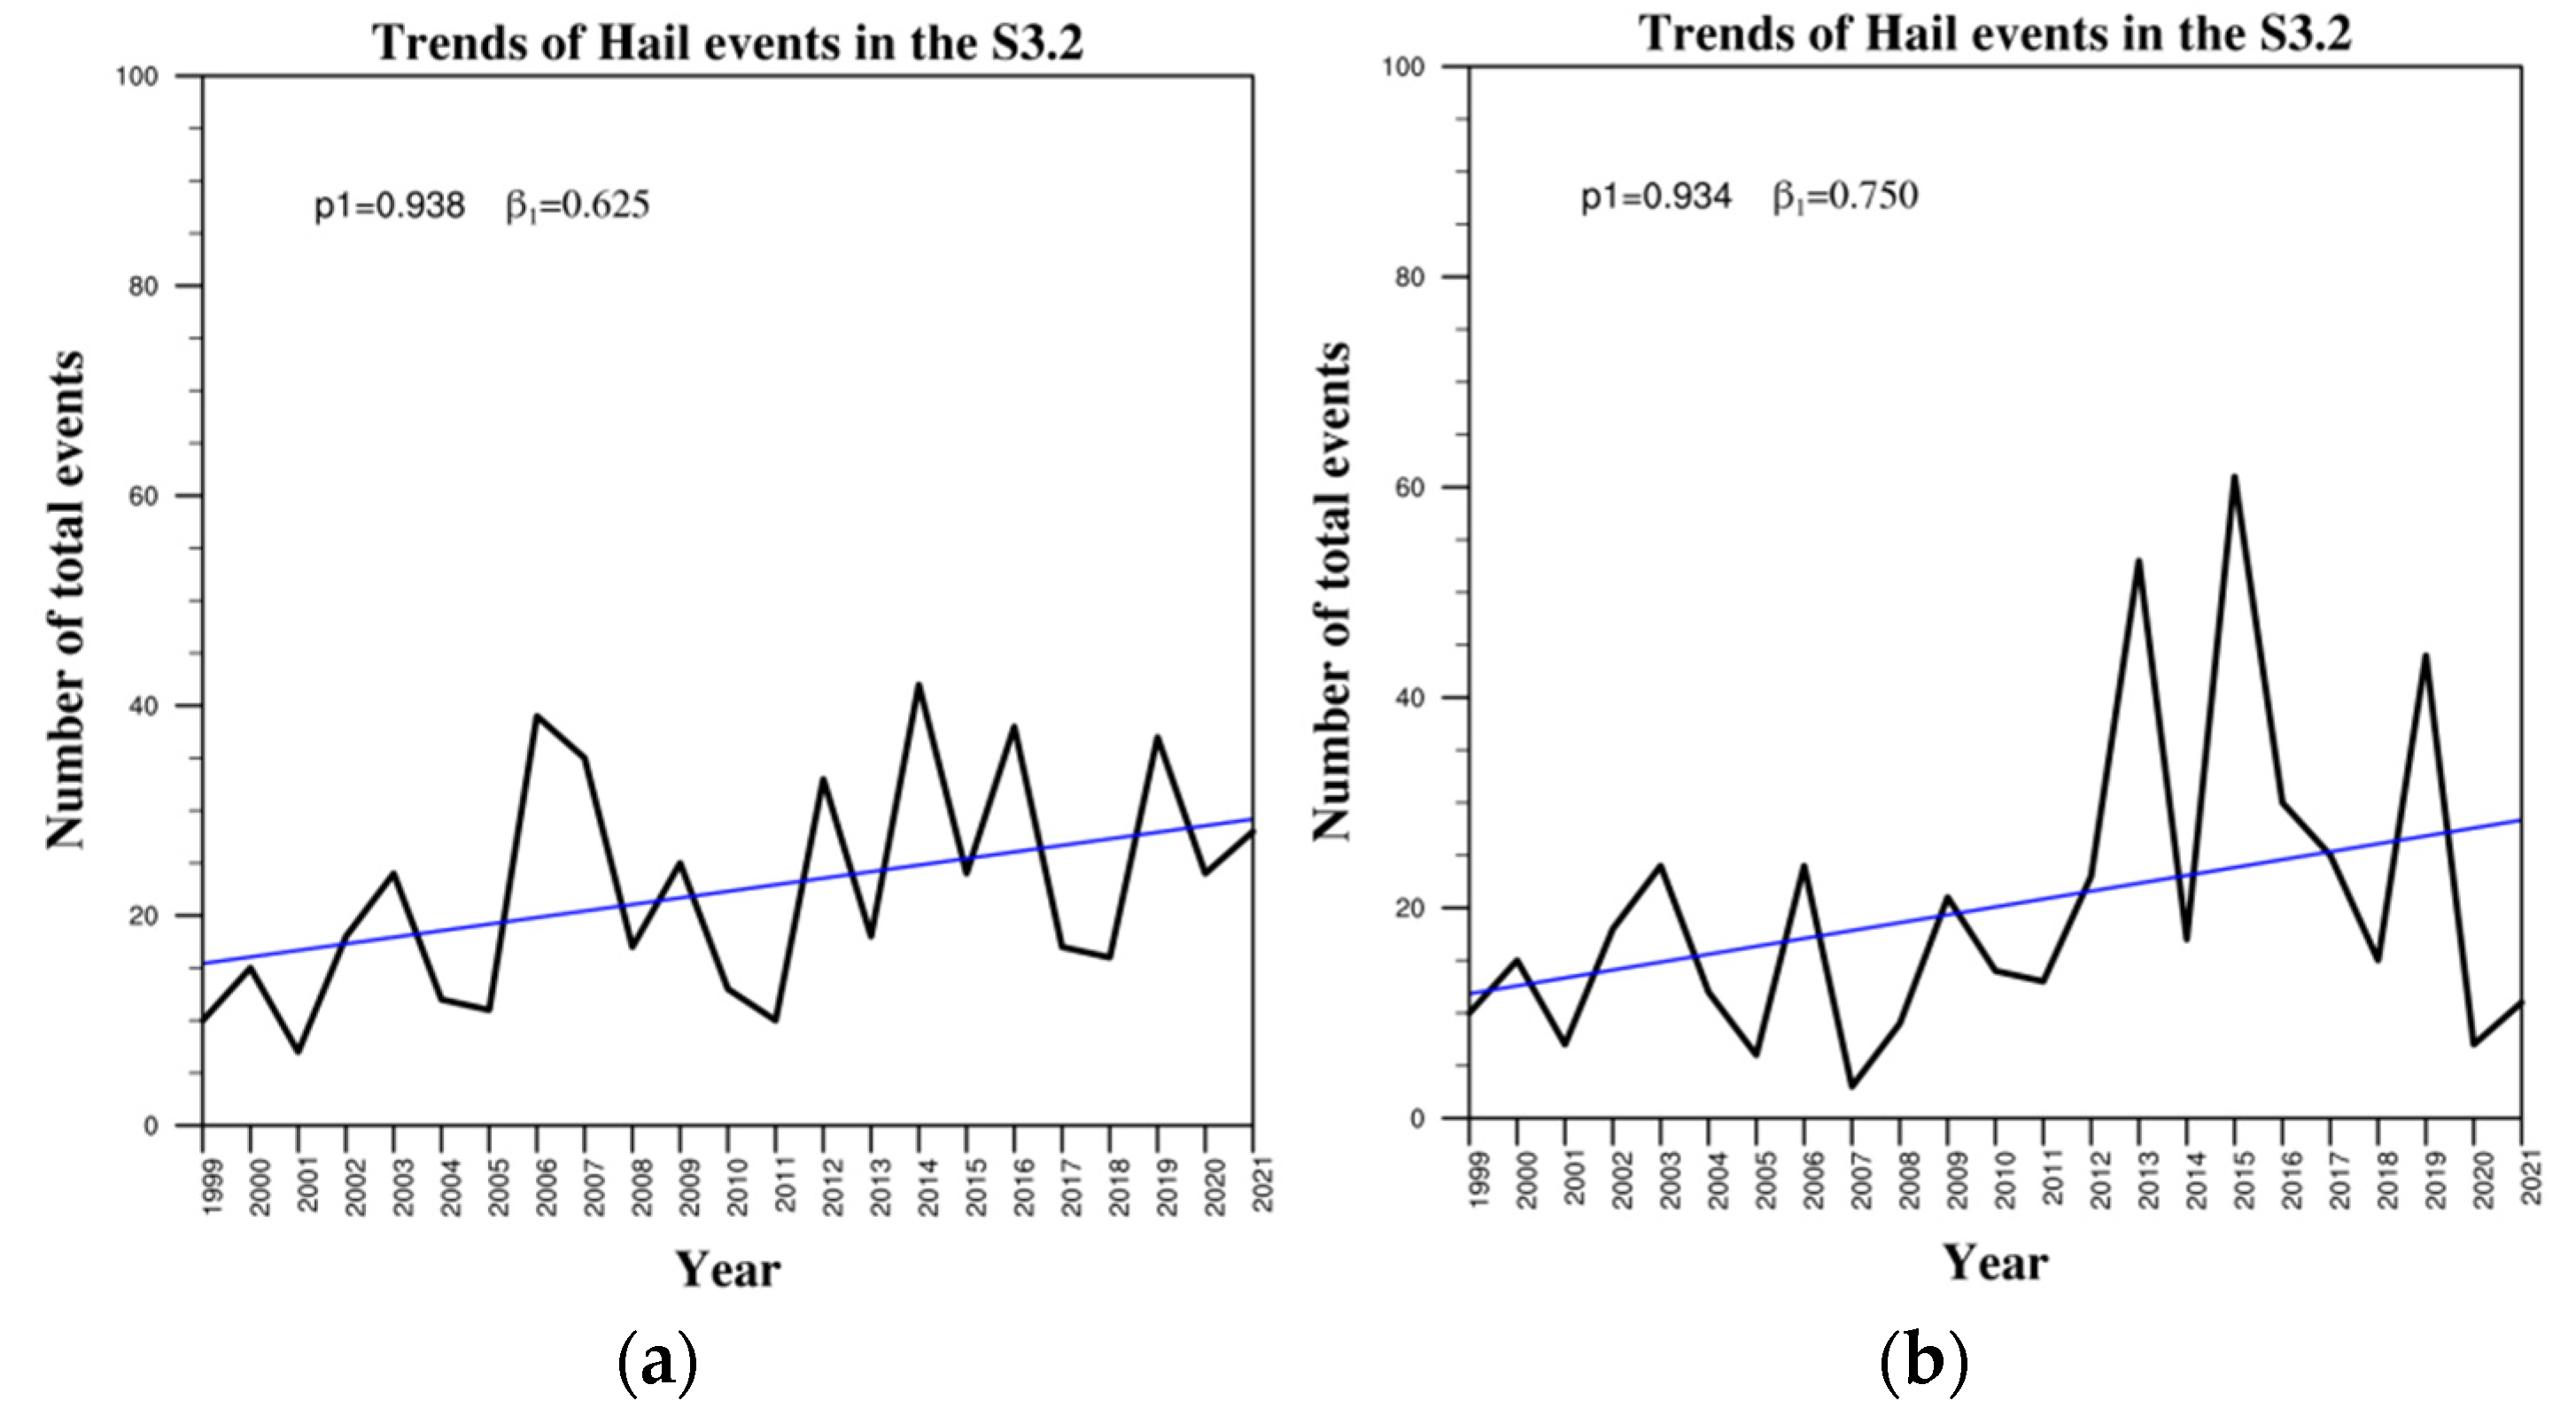
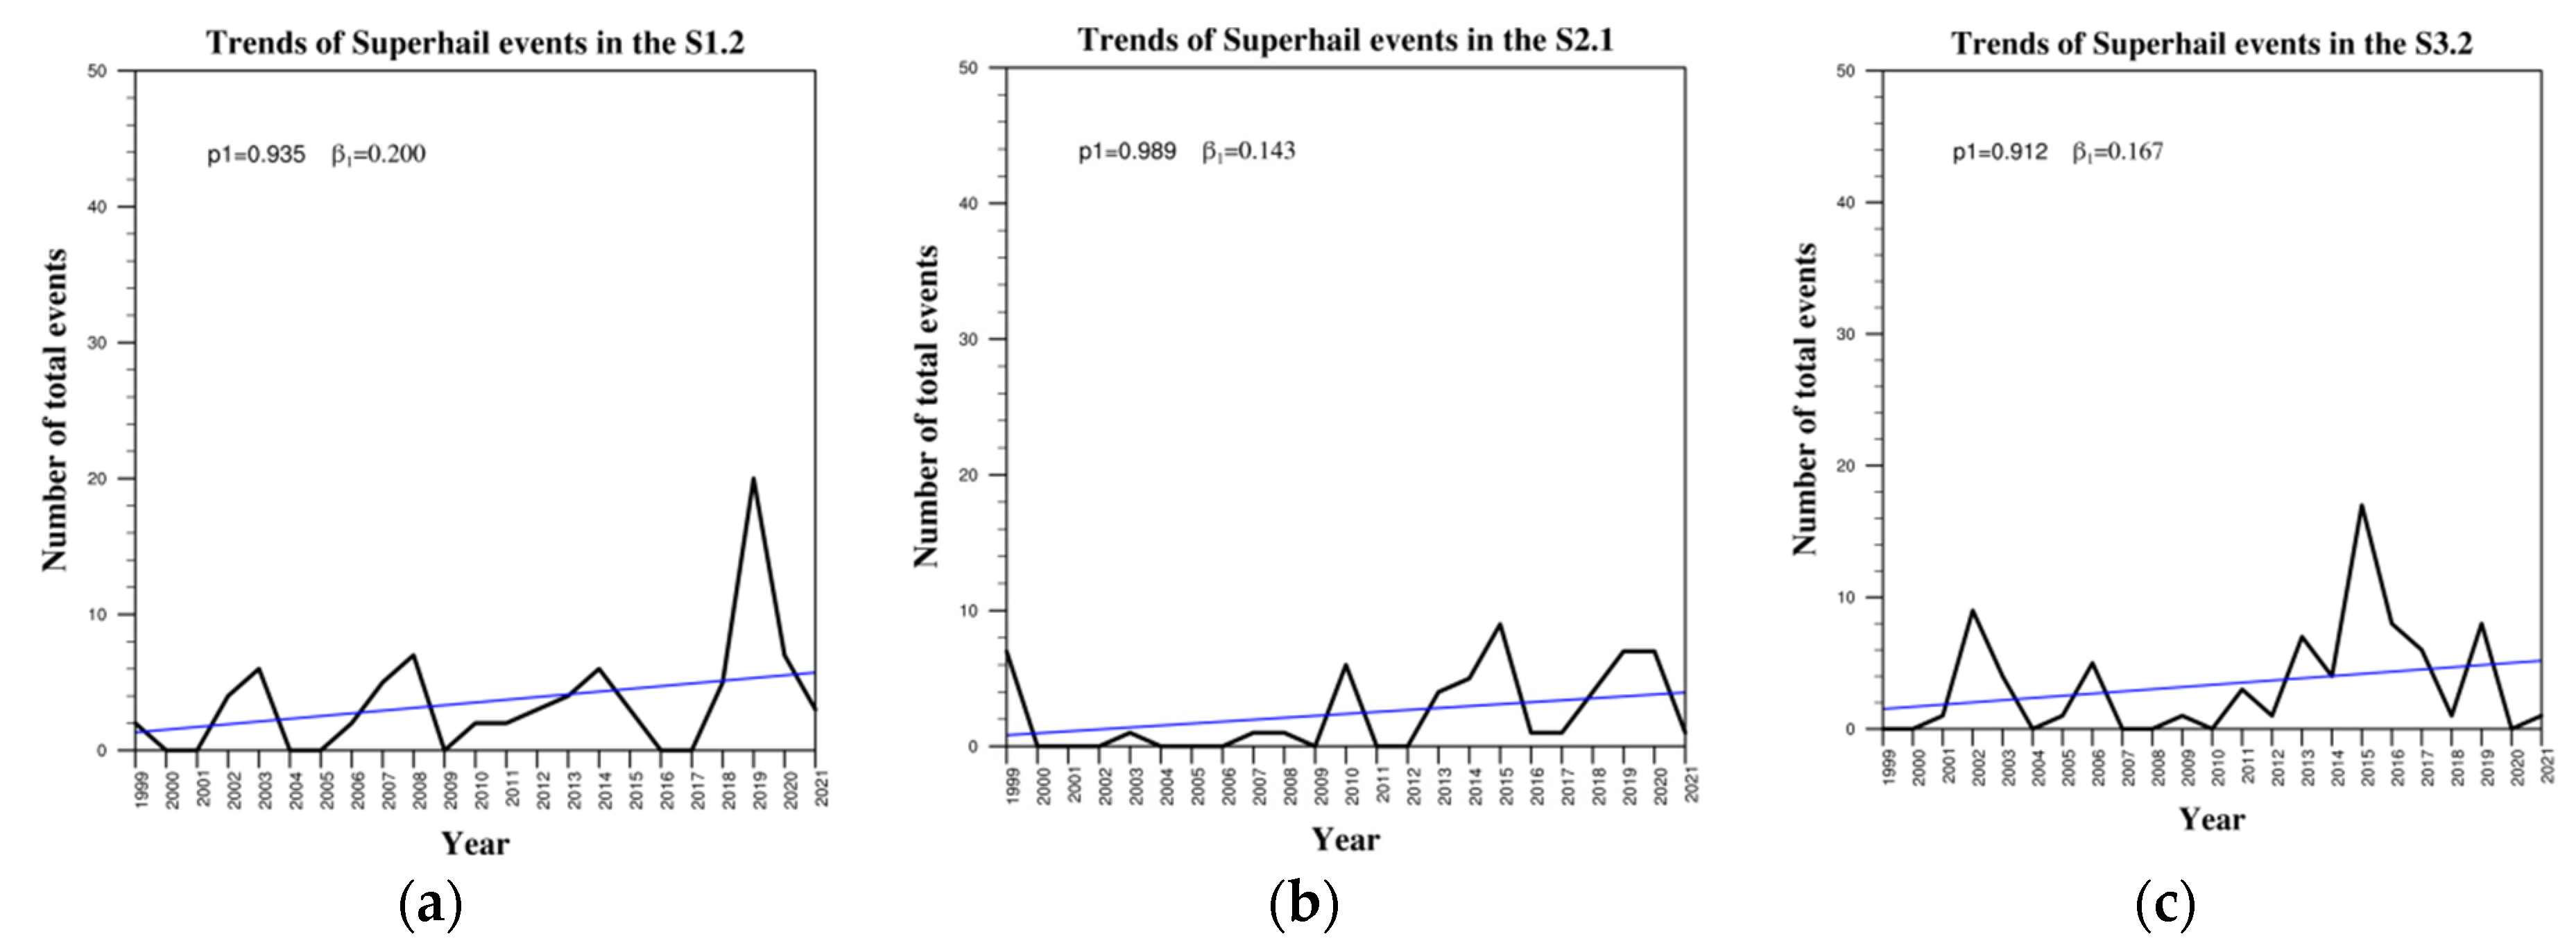
4.2. Trend Analysis
4.2.1. Trends over the Entire Mediterranean Basin
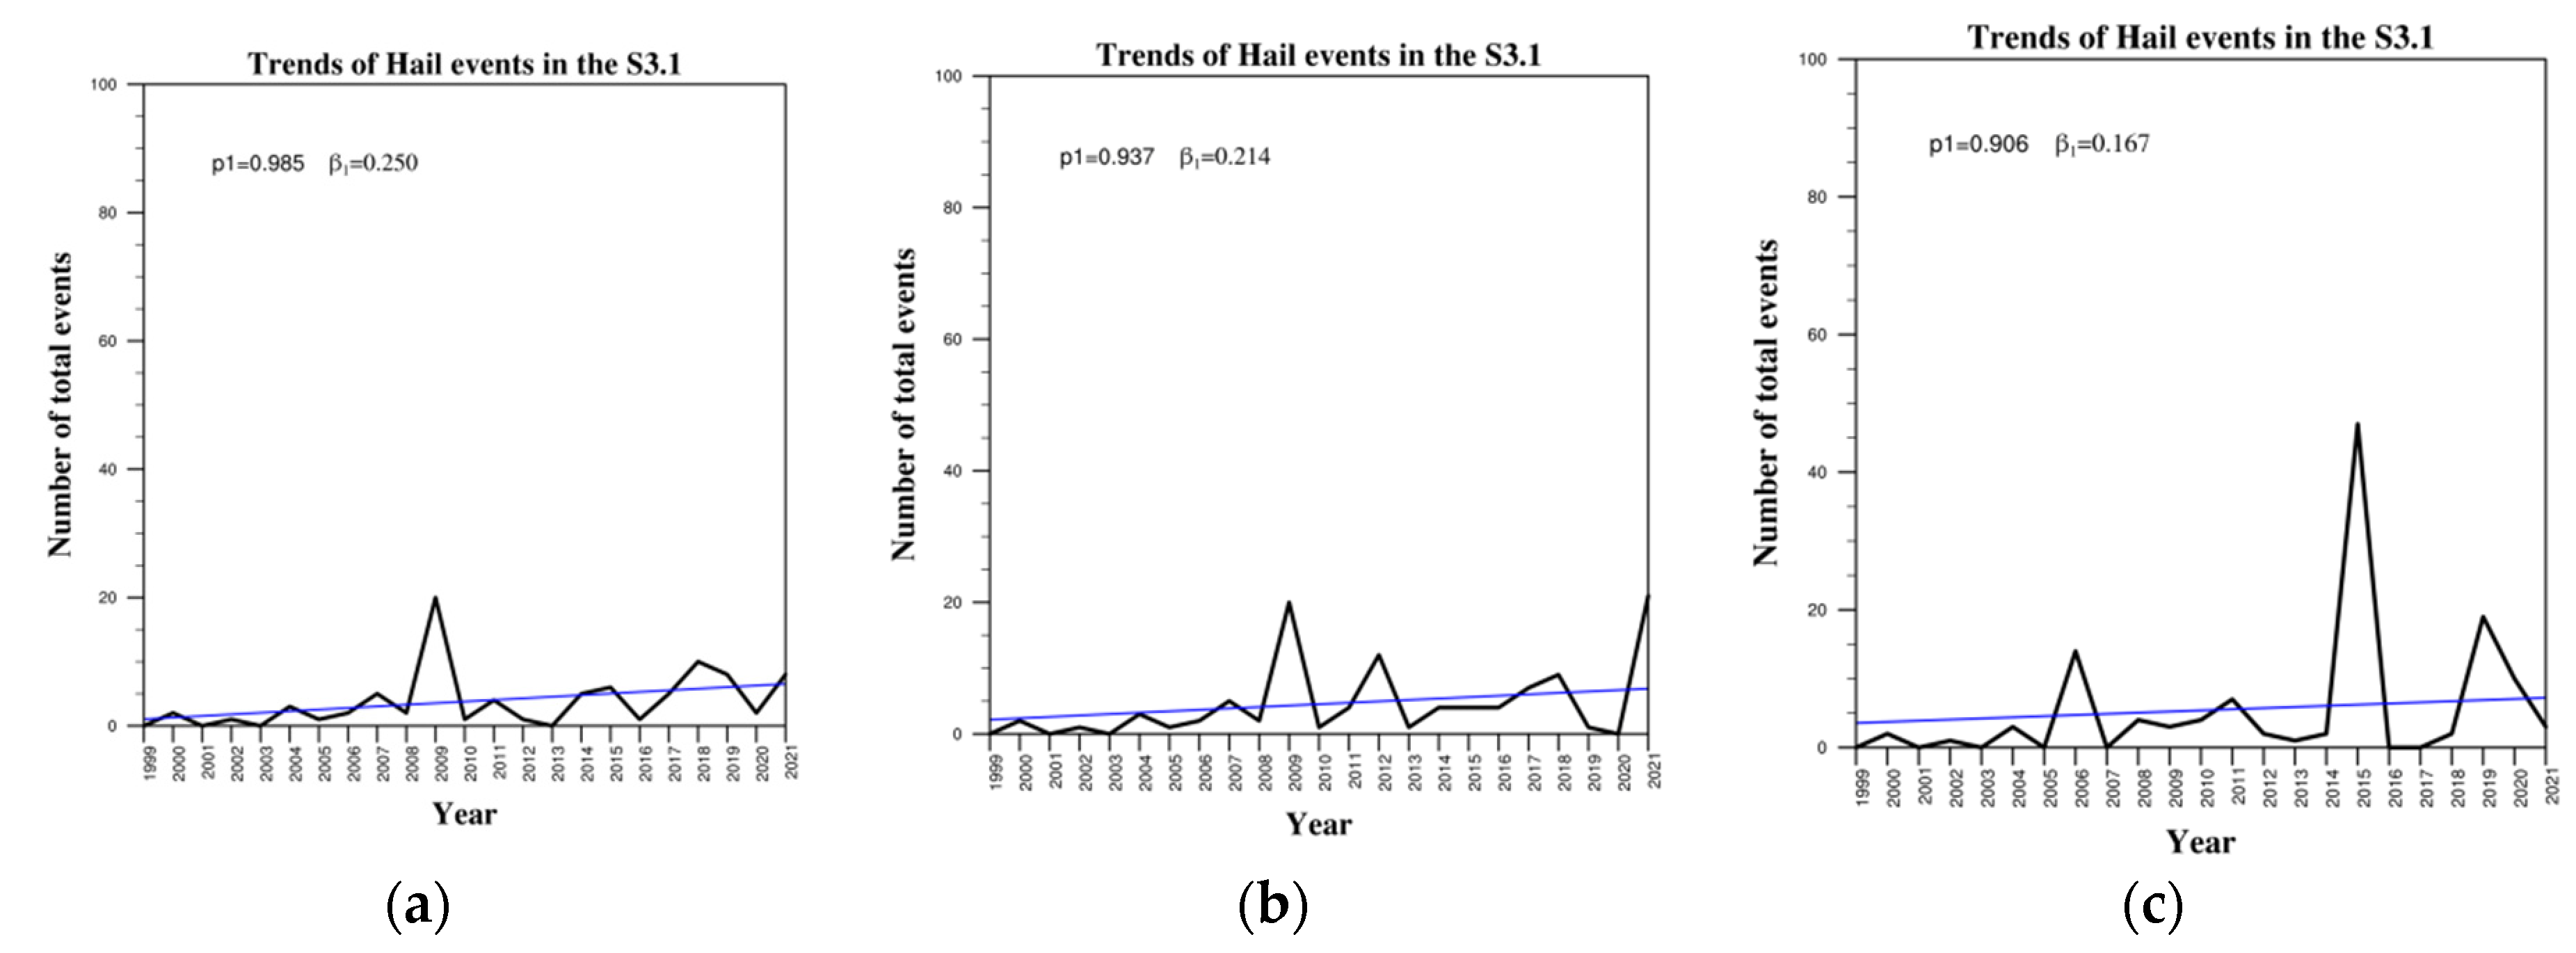
4.2.2. Trends over Sectors
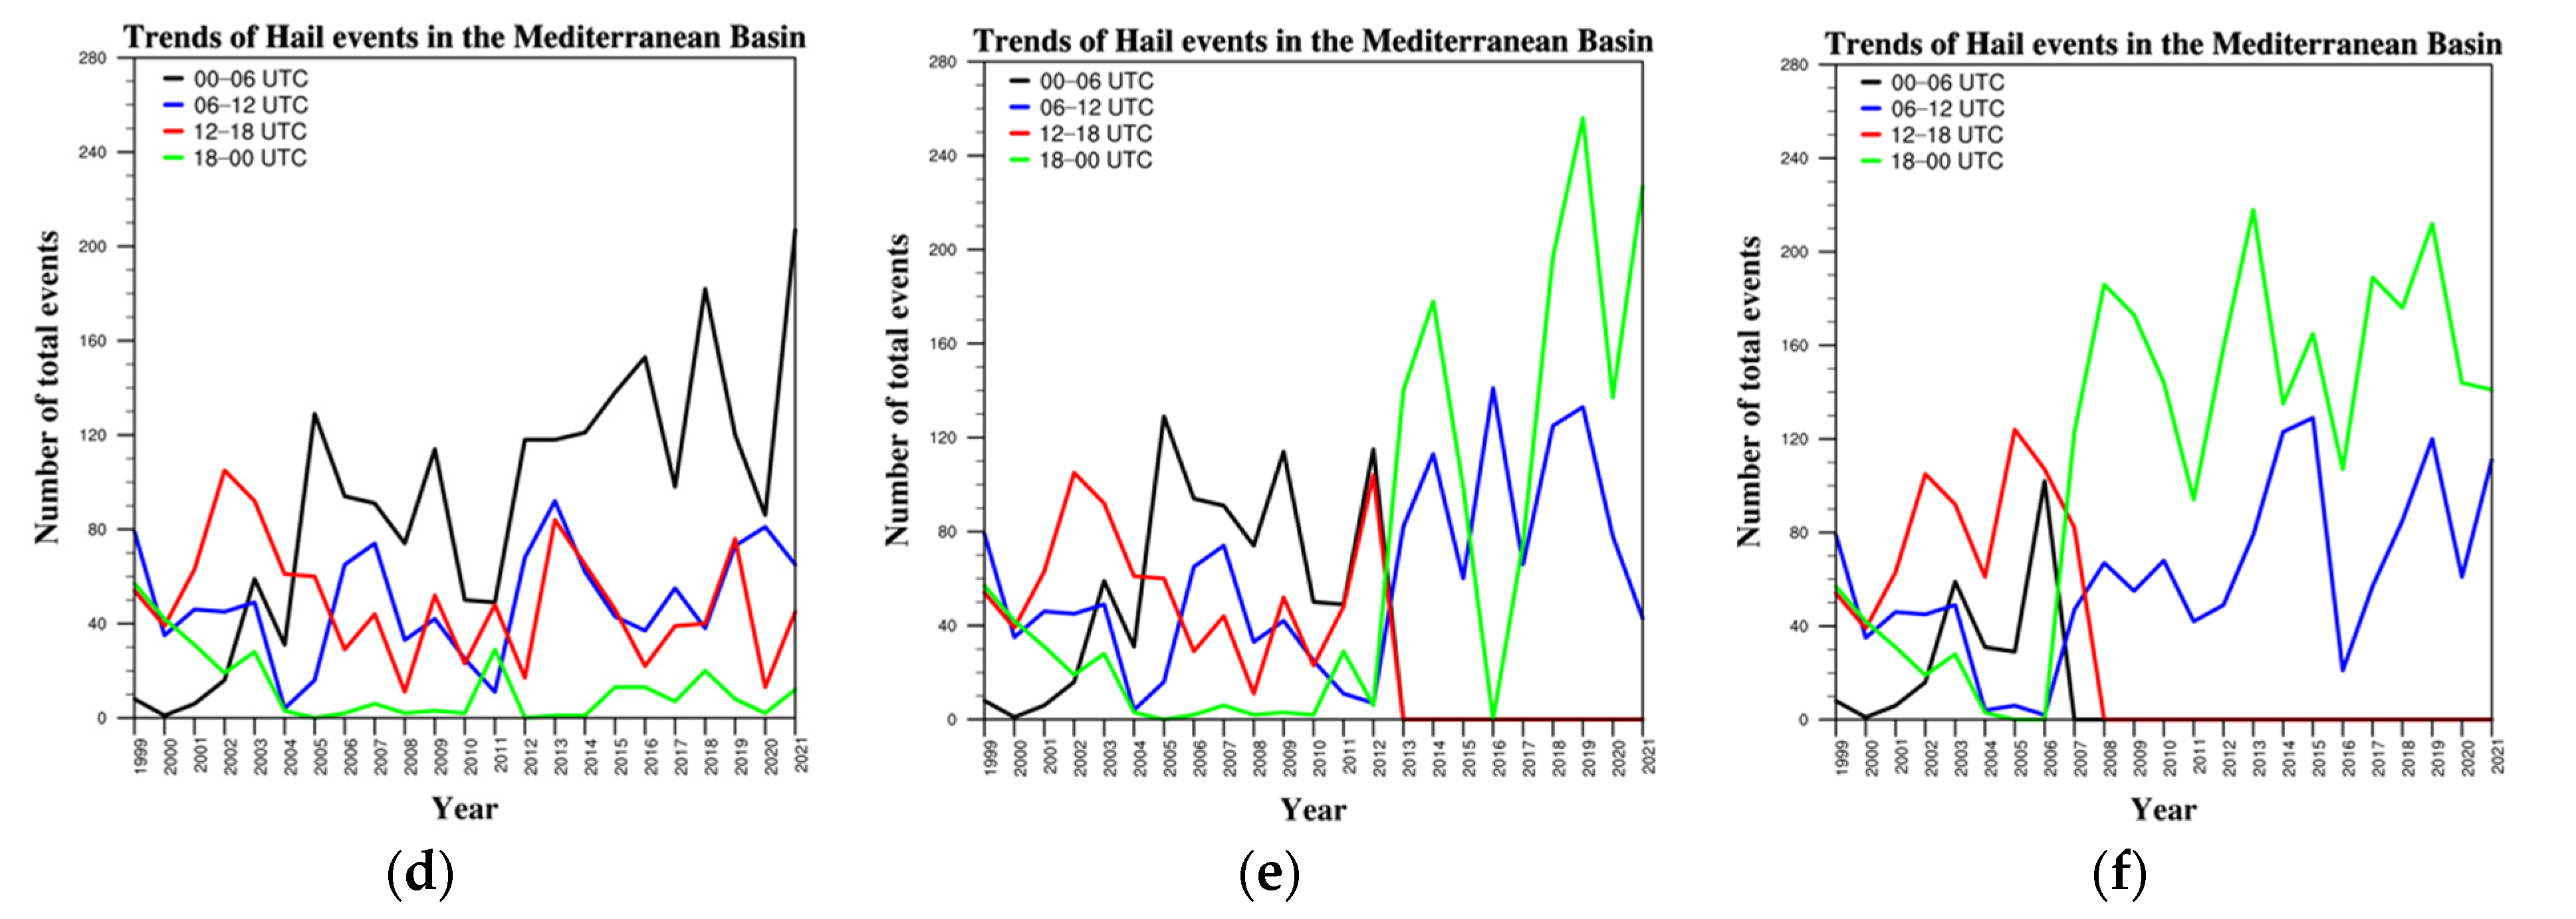
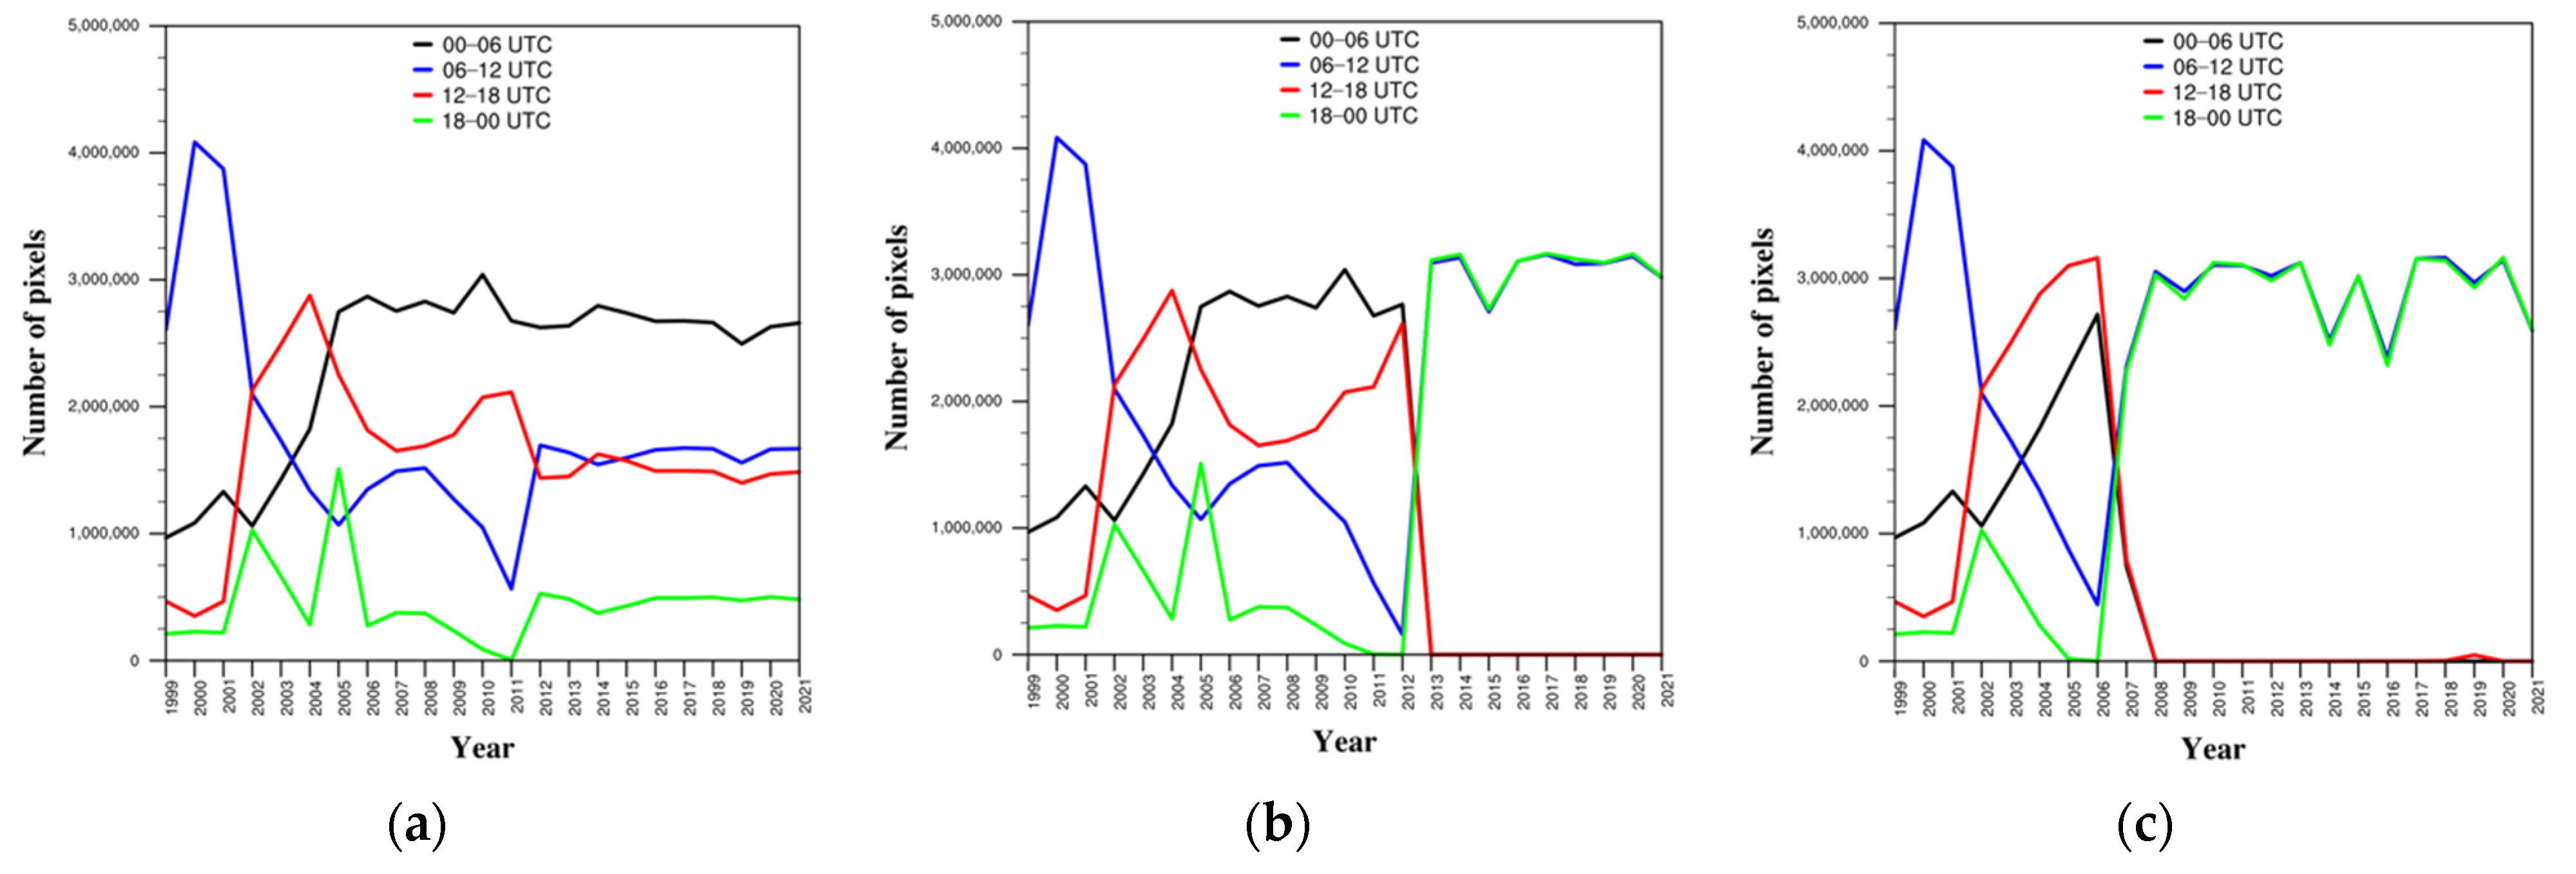
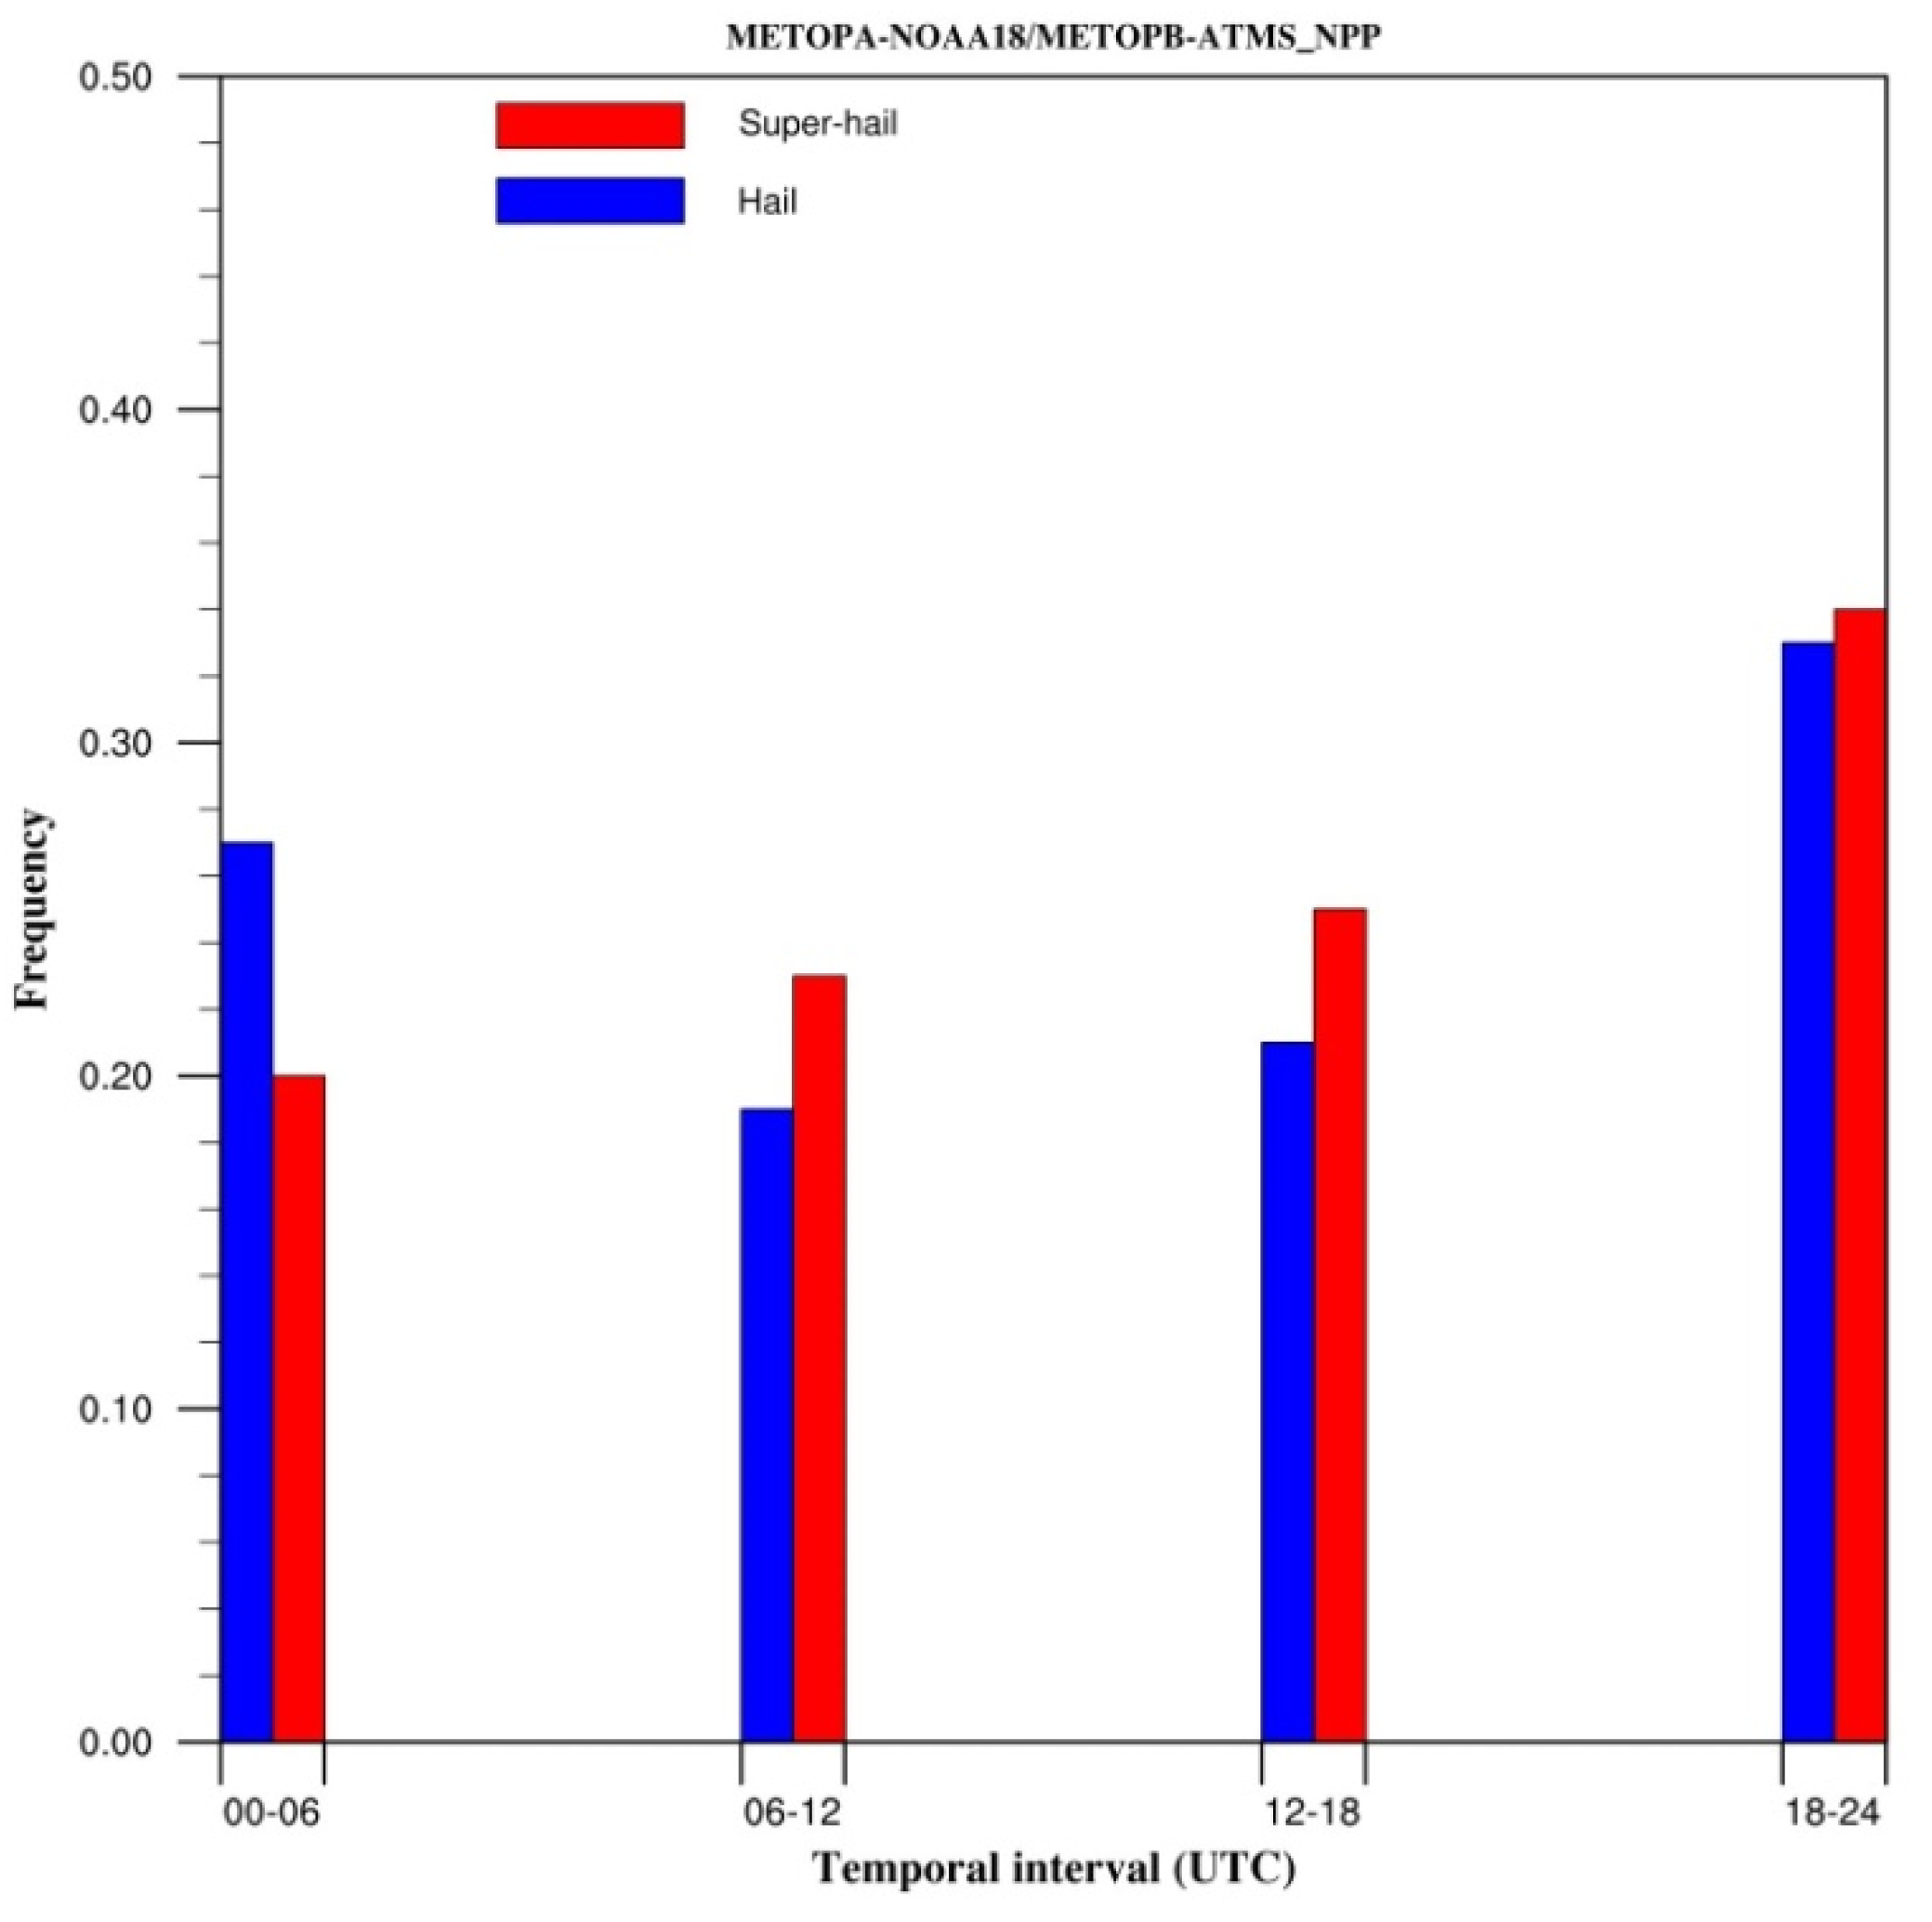
4.3. Hail Event Diurnal Cycle
- 00–06 UTC NPP-ATMS
- 06–12 UTC MOB-MHS
- 12–18 UTC N18-MHS
- 18–00 UTC MOA-MHS.
5. Discussion
6. Conclusions
Author Contributions
Funding
Data Availability Statement
Conflicts of Interest
Abbreviation
| AMSU-B | Advanced Microwave Sounding Unit-B |
| ATMS | Advanced Technology Microwave Sounder |
| CAPE | Convective Available Potential Energy |
| ESWD | European Severe Weather Database |
| HI | Hail Initiation |
| H | Large Hail |
| HP | Hail Potential |
| IFOV | Instantaneous FOV |
| GMI | GPM Microwave Imager |
| GPM | Global Precipitation Measurement mission |
| GPM-C | Global Precipitation Measurement Constellation |
| GMP-CO | GPM Core Observatory |
| MHS | Microwave Humidity Sounder |
| MWCC | MicroWave Cloud Classification method |
| MWCC-H | MWCC-Hail method |
| NCEP | National Center for Environmental Prediction |
| SH | Super Hail |
| SSMIS | Special Sensor Microwave Imager/Sounder |
| SST | Sea Surface Temperature |
| TB | Brightness Temperature |
| TRMM | Tropical Rainfall Measurement Mission |
| ZDEGL | Zero DEGree Level |
References
- Punge, H.J.; Kunz, M. Hail observations and hailstorm characteristics in Europe: A review. Atmos. Res. 2016, 176–177, 159–184. [Google Scholar] [CrossRef]
- Sanchez, J.L.; Merino, A.; Melcón, P.; García-Ortega, E.; Fernández-González, S.; Berthet, C.; Dessens, J. Are meteorological conditions favoring hail precipitation change in Southern Europe? Analysis of the period 1948–2015. Atmos. Res. 2017, 198, 1–10. [Google Scholar] [CrossRef]
- Raupach, T.H.; Martius, O.; Allen, J.T.; Kunz, M.; Lasher-Trapp, S.; Mohr, S.; Rasmussen, K.L.; Trapp, R.J.; Zhang, Q. The effects of climate change on hailstorms. Nat. Rev. Earth Environ. 2021, 2, 213–226. [Google Scholar] [CrossRef]
- Prein, A.F.; Holland, G. Global estimates of damaging hail hazard. Weather Clim. Extrem. 2018, 22, 10–23. [Google Scholar] [CrossRef]
- Tippett, M.K.; Allen, J.T.; Gensini, V.A.; Brooks, H.E. Climate and hazardous convective weather. Curr. Clim. Change Rep. 2015, 1, 60–73. [Google Scholar] [CrossRef]
- Setvák, M.; Rabin, R.M.; Doswell III, C.A.; Levizzani, V. Satellite observations of convective storm tops in the 1.6, 3.7 and 3.9 µm spectral bands. Atmos. Res. 2003, 67–68, 607–627. [Google Scholar] [CrossRef]
- Bedka, K.M. Overshooting cloud top detections using MSG SEVIRI infrared brightness temperatures and their relationship to severe weather over Europe. Atmos. Res. 2011, 99, 175–189. [Google Scholar] [CrossRef]
- Mikuš, P.; Strelec Mahović, N. Satellite-based overshooting top detection methods and an analysis of correlated weather conditions. Atmos. Res. 2013, 123, 268–280. [Google Scholar] [CrossRef]
- Setvák, M.; Bedka, K.M.; Lindsey, D.T.; Sokol, A.; Charvát, Z.; Štástka, J.; Wang, P.K. A-Train observations of deep convective storm tops. Atmos. Res. 2013, 123, 229–248. [Google Scholar] [CrossRef]
- Merino, A.; López, L.; Sánchez, J.L.; García-Ortega, E.; Cattani, E.; Levizzani, V. Daytime identification of summer hailstorm cells from MSG data. Nat. Hazards Earth Syst. Sci. 2014, 14, 1017–1033. [Google Scholar] [CrossRef] [Green Version]
- Merino, A.; Wu, X.; Gascón, E.; Berthet, C.; García-Ortega, E.; Dessens, J. Hailstorms in southwestern France: Incidence and atmospheric characterization. Atmos. Res. 2014, 140–141, 61–75. [Google Scholar] [CrossRef]
- Punge, H.J.; Bedka, K.M.; Kunz, M.; Reinbold, A. Hail frequency estimation across Europe based on a combination of overshooting top detections and the ERA-INTERIM reanalysis. Atmos. Res. 2017, 198, 34–43. [Google Scholar] [CrossRef]
- Cecil, D.J. Passive microwave brightness temperatures as proxies for hailstorms. J. Appl. Meteor. Climatol. 2009, 48, 1281–1286. [Google Scholar] [CrossRef]
- Ferraro, R.R.; Beauchamp, J.; Cecil, D.J.; Heymsfield, G. A prototype hail detection algorithm and climatology developed with the Advanced Microwave Sounding Unit (AMSU). Atmos. Res. 2015, 163, 24–35. [Google Scholar] [CrossRef]
- Laviola, S.; Levizzani, V.; Ferraro, R.R.; Beauchamp, J. Hailstorm detection by satellite microwave radiometers. Remote Sens. 2020, 12, 621. [Google Scholar] [CrossRef]
- Laviola, S.; Monte, G.; Levizzani, V.; Ferraro, R.R.; Beauchamp, J. A new method for hail detection from the GPM constellation: A prospect for a global hailstorm climatology. Remote Sens. 2020, 12, 3553. [Google Scholar] [CrossRef]
- Cecil, D.J.; Blankenship, C.B. Toward a global climatology of severe hailstorms as estimated by satellite passive microwave imagers. J. Clim. 2012, 25, 687–703. [Google Scholar] [CrossRef]
- Aragão, L.; Porcù, F. Cyclonic activity in the Mediterranean region from a high-resolution perspective using ECMWF ERA5 dataset. Clim. Dyn. 2022, 58, 1293–1310. [Google Scholar] [CrossRef]
- Flaounas, E.; Davolio, S.; Raveh-Rubin, S.; Pantillon, F.; Miglietta, M.M.; Gaertner, M.A.; Hatzaki, M.; Homar, V.; Khodayar, S.; Korres, G.; et al. Mediterranean cyclones: Current knowledge and open questions on dynamics, prediction, climatology and impacts. Weather Clim. Dynam. 2022, 3, 173–208. [Google Scholar] [CrossRef]
- Strong, G.S.; Lozowski, E.P. An Alberta study to objectively measure hailfall intensity. Atmosphere 1977, 15, 33–53. [Google Scholar] [CrossRef] [Green Version]
- Bennartz, R. Optimal convolution of AMSU-B to AMSU-A. J. Atmos. Oceanic Technol. 2000, 17, 1215–1225. [Google Scholar] [CrossRef]
- Zhang, K.; Zhou, L.; Goldberg, M.; Liu, X.; Wolf, W.; Tan, C.; Liu, Q. A methodology to adjust ATMS observations from limb effect and its applications. J. Geophys. Res. Atmos. 2017, 122, 11347–11356. [Google Scholar] [CrossRef]
- Kunz, M.; Wadel, J.; Fluck, E.; Baumstark, S.; Mohr, S.; Schemm, S. Ambient conditions prevailing during hail events in central Europe. Nat. Hazards Earth Syst. Sci. 2020, 20, 1867–1887. [Google Scholar] [CrossRef]
- Mann, H.B. Non-parametric tests against trend. Econometrica 1945, 13, 245–259. [Google Scholar] [CrossRef]
- Kendall, M.G. Rank Correlation Methods, 4th ed.; Charles Griffin: London, UK, 1975; ISBN 978-0195208375. [Google Scholar]
- Sen, P.K. Estimates of the regression coefficient based on Kendall’s tau. J. Am. Stat. Assoc. 1968, 63, 1379–1389. [Google Scholar] [CrossRef]
- The NCAR Command Language; Version 6.6.2; UCAR/NCAR/CISL/TDD: Boulder, CO, USA, 2019; Available online: https://www.ncl.ucar.edu (accessed on 6 April 2022).
- Púčik, T.; Castellano, C.; Groenemeijer, P.; Kühne, T.; Rädler, A.T.; Antonescu, B.; Faust, E. Large hail incidence and its economic and societal impacts across Europe. Mon. Weather Rev. 2019, 147, 3901–3916. [Google Scholar] [CrossRef]
- Manzato, A. Hail in northeast Italy: Climatology and bivariate analysis with the sounding-derived indices. J Appl. Meteor. Climatol. 2012, 51, 449–467. [Google Scholar] [CrossRef]
- Baldi, M.; Ciardini, V.; Dalu, J.D.; Filippis, T.D.; Maracchi, G.; Dalu, G. Hail occurrence in Italy; towards a national database and climatology. Atmos. Res. 2014, 138, 268–277. [Google Scholar] [CrossRef]
- Morgan, G.M. A general description of the hail problem in the Po Valley of Northern Italy. J. Appl. Meteor. 1973, 12, 338–353. [Google Scholar] [CrossRef]
- Punge, H.J.; Bedka, K.M.; Kunz, M.; Werner, A. A new physically based stochastic event catalog for hail in Europe. Nat. Hazards 2014, 73, 1625–1645. [Google Scholar] [CrossRef]
- Camuffo, D.; Cocheo, C.; Enzi, S. Seasonality of instability phenomena (hailstorms and thunderstorms) in Padova, northern Italy, from archive and instrumental sources since AD 1300. Holocene 2000, 10, 635–642. [Google Scholar] [CrossRef]
- Eccel, E.; Cau, P.; Riemann-Campe, K.; Biasioli, F. Quantitative hail monitoring in an alpine area: 35-year climatology and links with atmospheric variables. Int. J. Climatol. 2012, 32, 503–517. [Google Scholar] [CrossRef]
- Giaiotti, D.; Nordio, S.; Stel, F. The climatology of hail in the plain of Friuli Venezia Giulia. Atmos. Res. 2003, 67–68, 247–259. [Google Scholar] [CrossRef]
- Nanni, S. Grandine, un nemico terribile—Genesi e previsione. Tech. Rep. II (Il Divulg.) 2004. (In Italian) [Google Scholar]
- Burgaz, F. Experienca espanola; IICA Biblioteca Venezuela: Santiago, Chile, 2004; Available online: https://books.google.de/books?id=3zwqAAAAYAAJ (accessed on 25 August 2022). (In Spanish)
- Saa Requejo, A.; García Moreno, R.; Díaz Alvarez, M.C.; Burgaz, F.; Tarquis, M. Analysis of hail damages and temperature series for peninsular Spain. Nat. Hazards Earth Syst. Sci. 2011, 11, 3415–3422. Available online: http://www.nat-hazards-earth-syst-sci.net/11/ (accessed on 25 August 2022). [CrossRef]
- Castro, A.; Sánchez, J. Índices de formación de tormentas y su relación con factores geográficos y topográficos en el valle medio del Ebro. Rev. Geofís. 1990, 46, 181–192. (In Spanish) [Google Scholar]
- Catsoulis, B.; Carapiperis, L. Frequency of hail occurrence in Greece. Weather 1984, 39, 182–188. [Google Scholar] [CrossRef]
- Sioutas, M. Hail occurrence in Greece. In Proceedings of the 6th European Conference on Severe Storms (ECSS 2011), Palma de Mallorca, Spain, 3–7 October 2011; Available online: https://essl.org/ECSS/2011/programme/abstracts/224.pdf (accessed on 25 August 2022).
- Kahraman, A.; Tanriover, S.T.; Kadioglu, M. Severe hail climatology of Turkey. In Proceedings of the 6th European Conference on Severe Storms, Palma de Mallorca, Spain, 3–7 October 2011; Available online: http://www.essl.org/ECSS/2011/programme/posters/20.pdf (accessed on 25 August 2022).
- Dubief, J.J. Le climat du Sahara. Vol. Tome II, Fascicule I of Mémoire (Hors série); Institut de Météorologie et de Physique du Globe de l’Algérie: Alger, Algeria, 1963. (In French) [Google Scholar]
- Péguy, C.P.C.P. Précis de Climatologie; Masson: Paris, France, 1961. (In French) [Google Scholar]
- Prein, A.F.; Heymsfield, A.J. Increased melting level height impacts surface precipitation phase and intensity. Nat. Clim. Chang. 2020, 10, 771–776. [Google Scholar] [CrossRef]
- Miglietta, M.M.; Mazon, J.; Motola, V.; Pasini, A. Effect of a positive Sea Surface Temperature anomaly on a Mediterranean tornadic supercell. Sci. Rep. 2017, 7, 12828. [Google Scholar] [CrossRef] [Green Version]


| Category Description | Probability of Hail | Diameter Range (cm) | Kinetic Energy (J) | Terminal Velocity (m s−1) | Potential Severity |
|---|---|---|---|---|---|
| Hail Potential (HP) | 0.20 ÷ 0.36 | ~ | ~ | ~ | Absent to low |
| Graupel/Hail Initiation (HI) | 0.36 ÷ 0.45 | <2 | <33.84 × 10⁻² | <19.09 | Low to moderate |
| Large Hail (H) | 0.45 ÷ 0.60 | 2 ÷ 10 | 33.84 × 10⁻² ÷ 423 | 19.09 ÷ 42.69 | High to severe |
| Super Hail (SH) | > 0.60 | >10 | >423 | >42.69 | Severe to extreme |
| 1. Time Series N15-N18-NPP | ||
| N15 | N18 | NPP |
| 01/04/1999 31/05/2005 | 01/06/2005 30/11/2011 | 01/04/2012 30/11/2021 |
| 2. Time Series N15-N18-MOB | ||
| N15 | N18 | MOB |
| 01/04/1999 31/05/2005 | 01/06/2005 30/11/2012 | 01/04/2013 30/11/2021 |
| 3. Time Series N15-MOA-MOC | ||
| N15 | MOA | MOC |
| 01/04/1999 31/05/2007 | 01/06/2007 30/11/2019 | 01/04/2020 30/11/2021 |
Publisher’s Note: MDPI stays neutral with regard to jurisdictional claims in published maps and institutional affiliations. |
© 2022 by the authors. Licensee MDPI, Basel, Switzerland. This article is an open access article distributed under the terms and conditions of the Creative Commons Attribution (CC BY) license (https://creativecommons.org/licenses/by/4.0/).
Share and Cite
Laviola, S.; Monte, G.; Cattani, E.; Levizzani, V. Hail Climatology in the Mediterranean Basin Using the GPM Constellation (1999–2021). Remote Sens. 2022, 14, 4320. https://doi.org/10.3390/rs14174320
Laviola S, Monte G, Cattani E, Levizzani V. Hail Climatology in the Mediterranean Basin Using the GPM Constellation (1999–2021). Remote Sensing. 2022; 14(17):4320. https://doi.org/10.3390/rs14174320
Chicago/Turabian StyleLaviola, Sante, Giulio Monte, Elsa Cattani, and Vincenzo Levizzani. 2022. "Hail Climatology in the Mediterranean Basin Using the GPM Constellation (1999–2021)" Remote Sensing 14, no. 17: 4320. https://doi.org/10.3390/rs14174320