


Giant Aufeis—Unknown Glaciation in North-Eastern Eurasia According to Landsat Images 2013–2019
 , , ,
, , ,
Abstract
:
1. Introduction
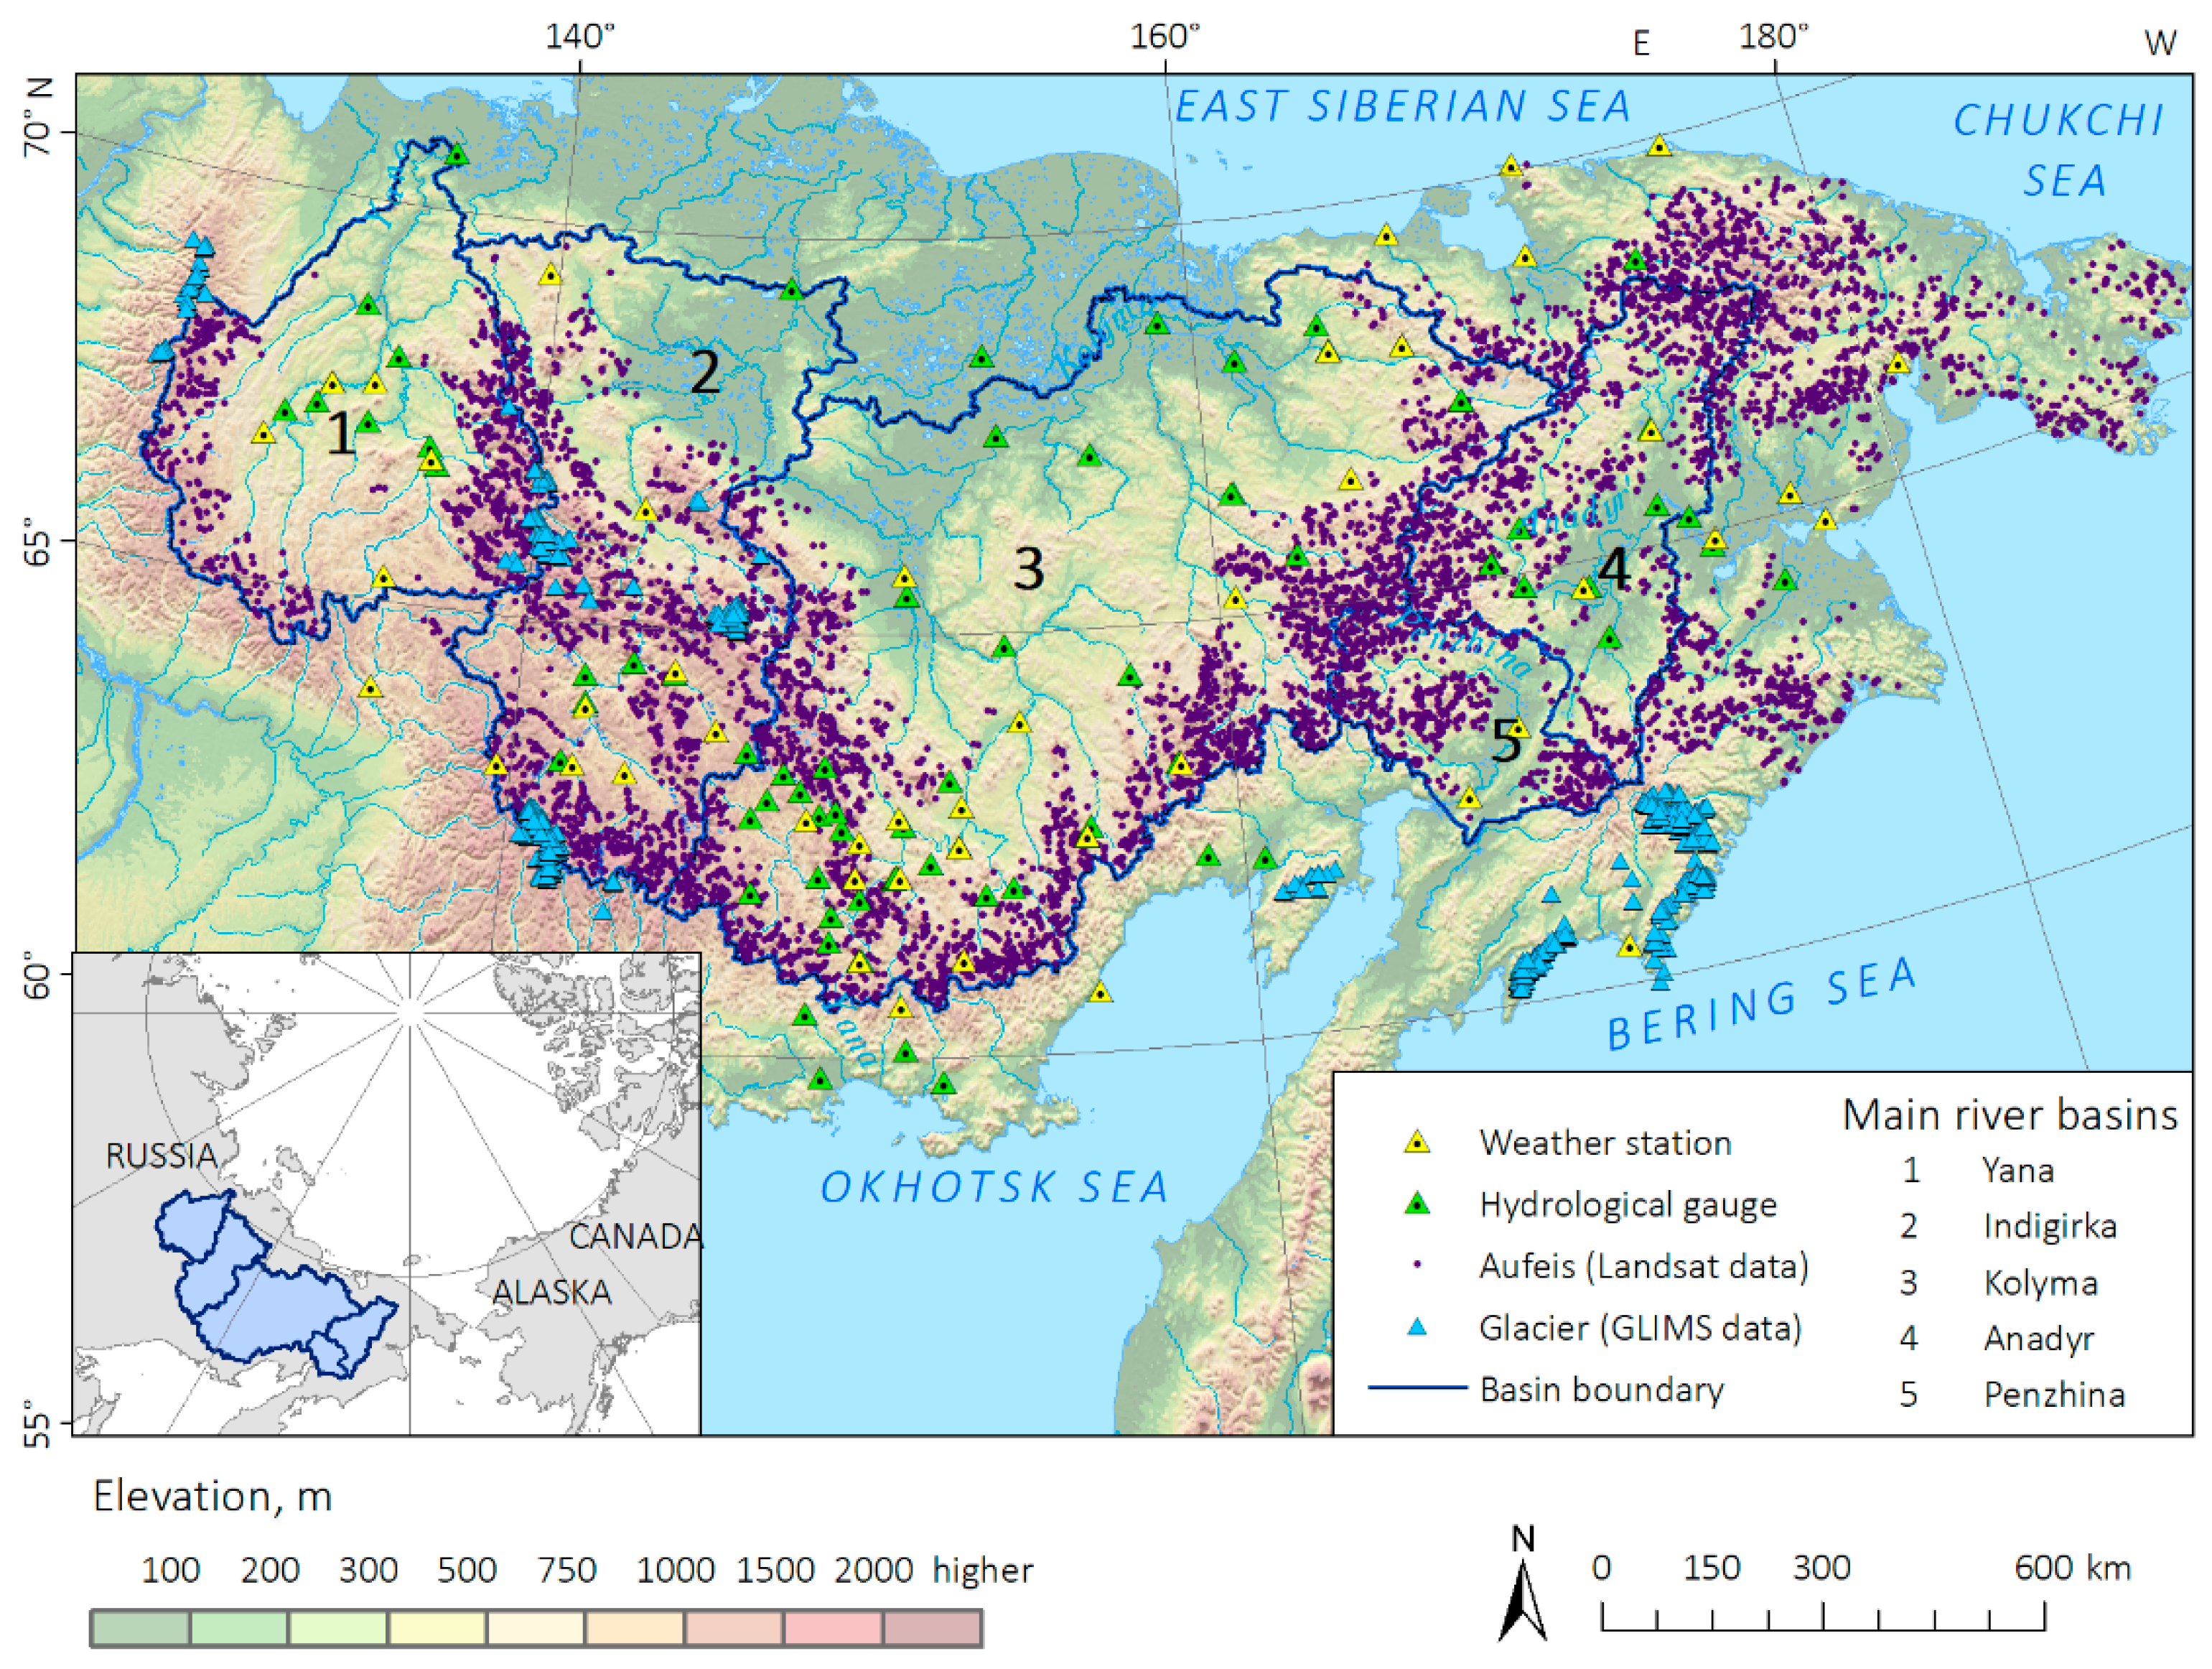
2. Study Area
3. Data and Methods
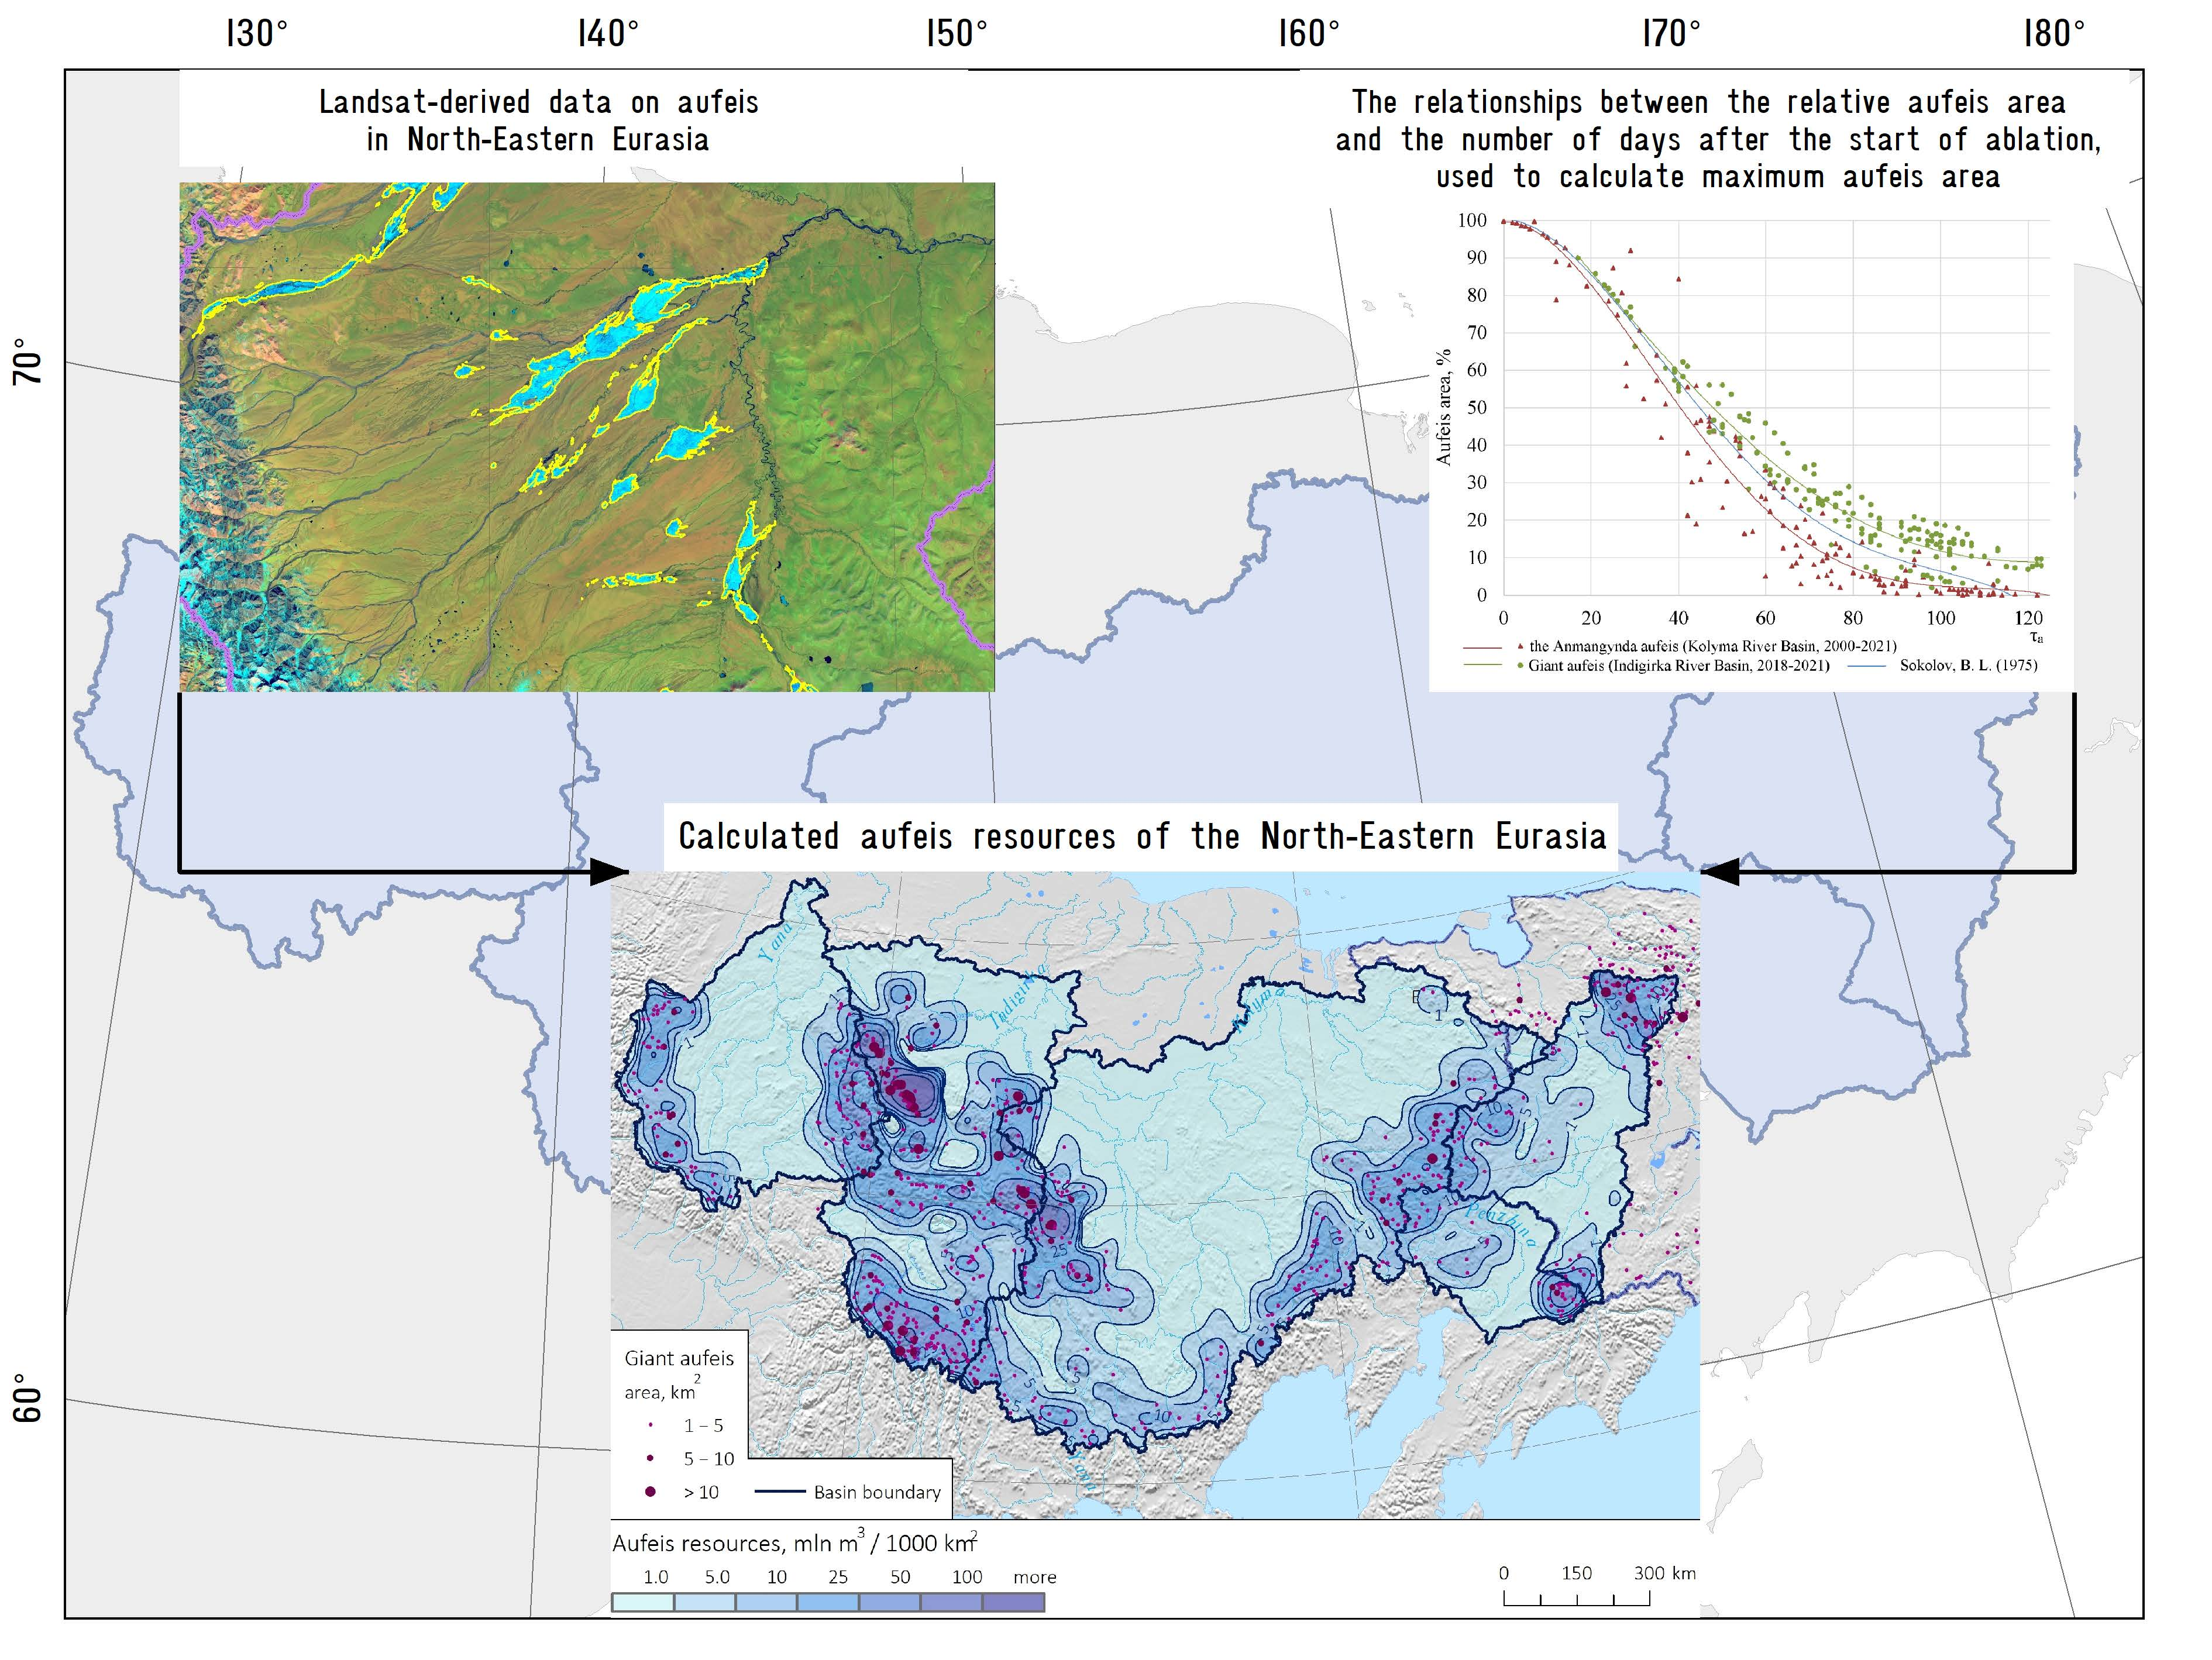
3.1. Aufeis Fields Delineation Based on Landsat Images
3.2. Hydrological Data
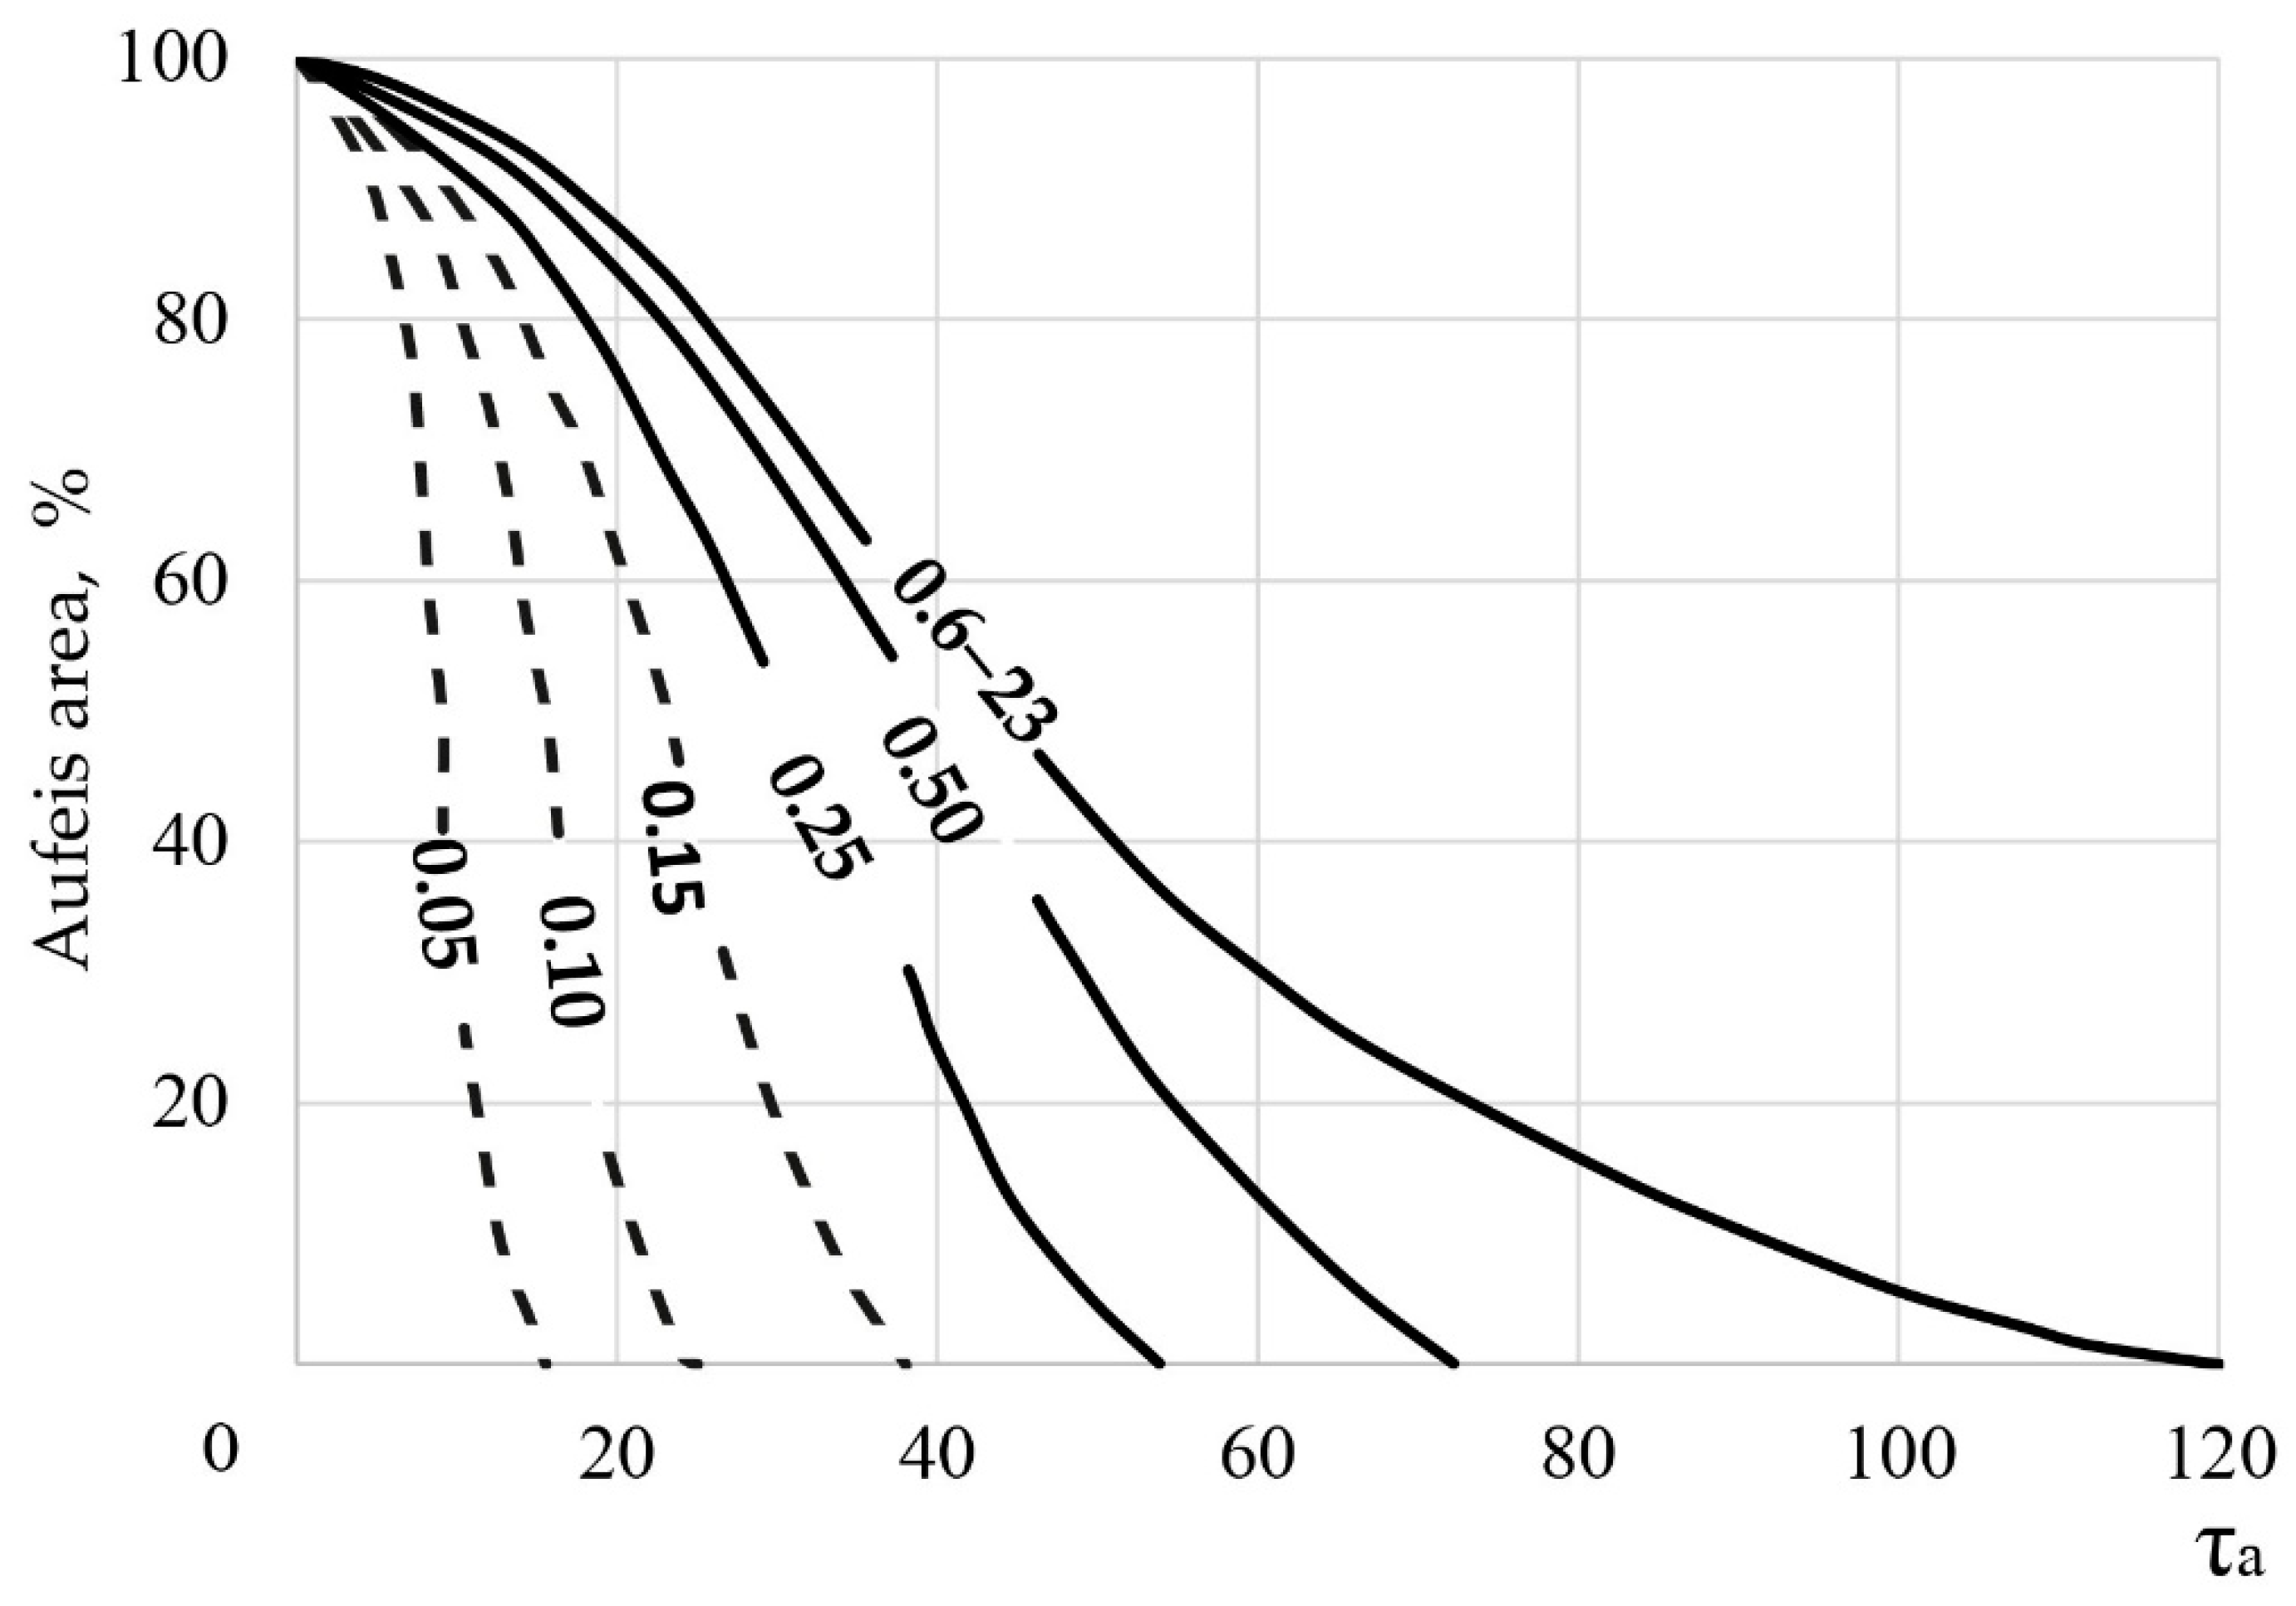
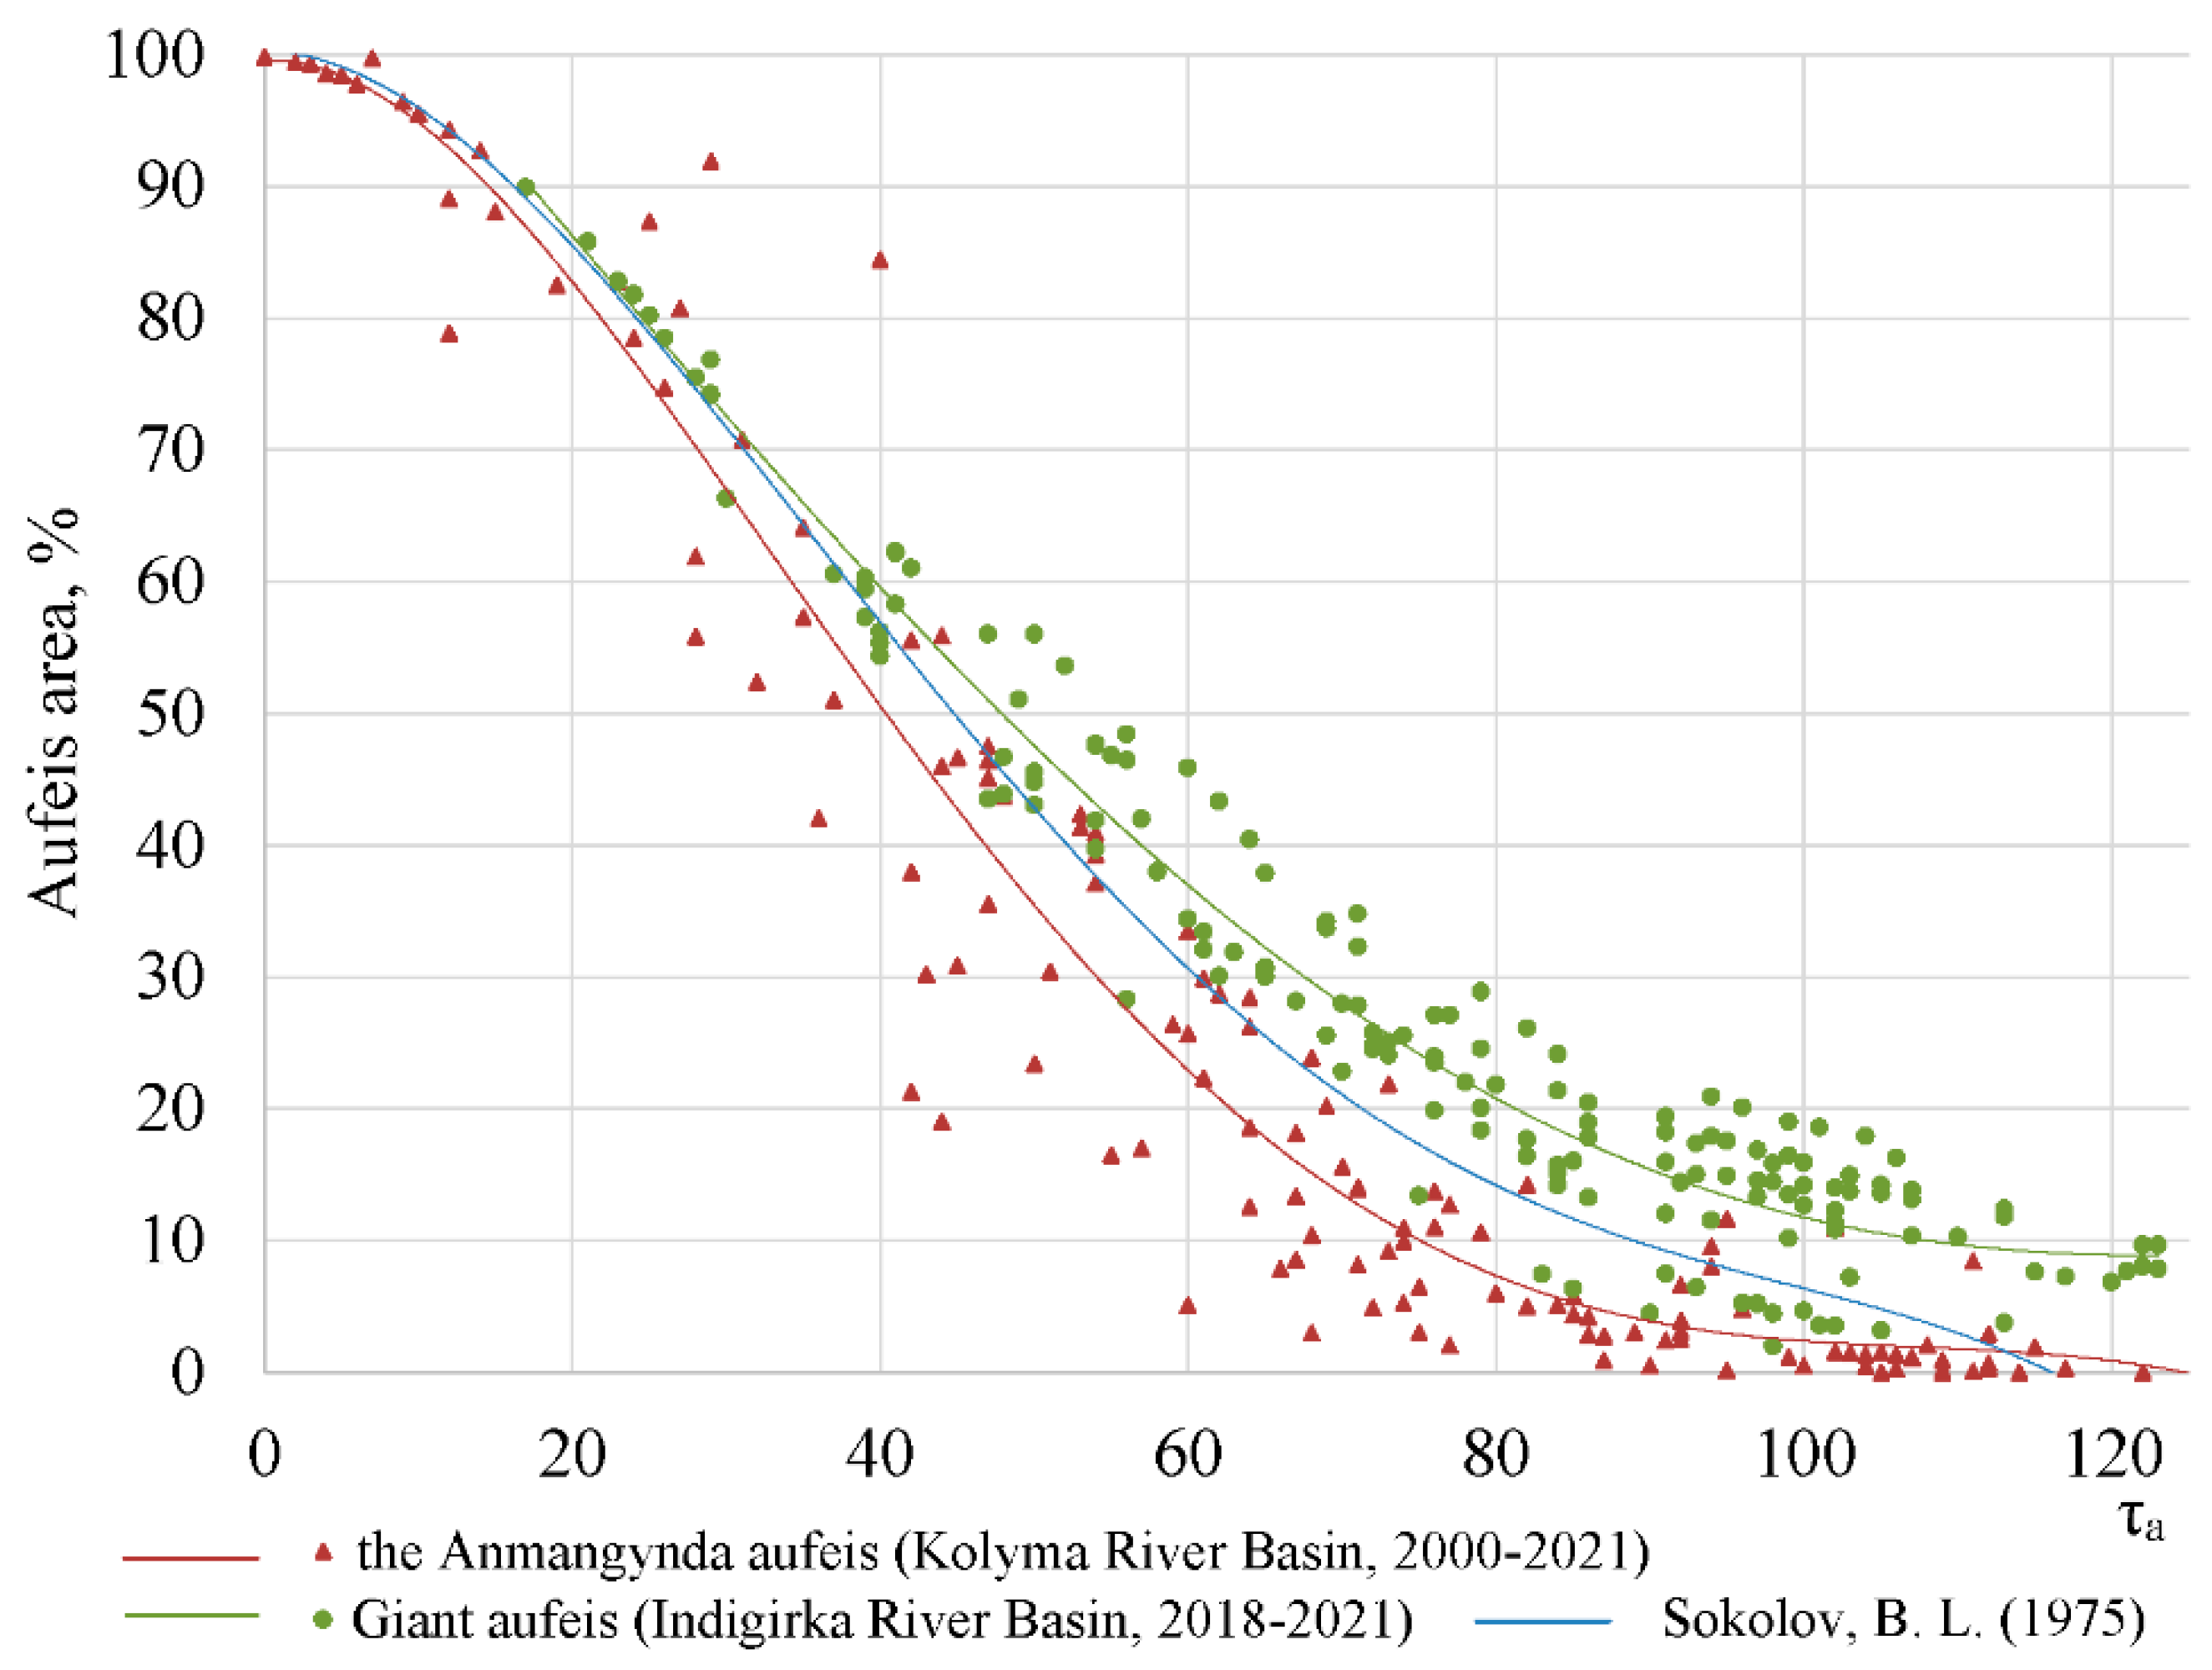
3.3. Correction of Aufeis Area
3.4. Estimation of Aufeis Resources and Their Role in Regional Water Balance
4. Results
4.1. Correction of Maximum Aufeis Area
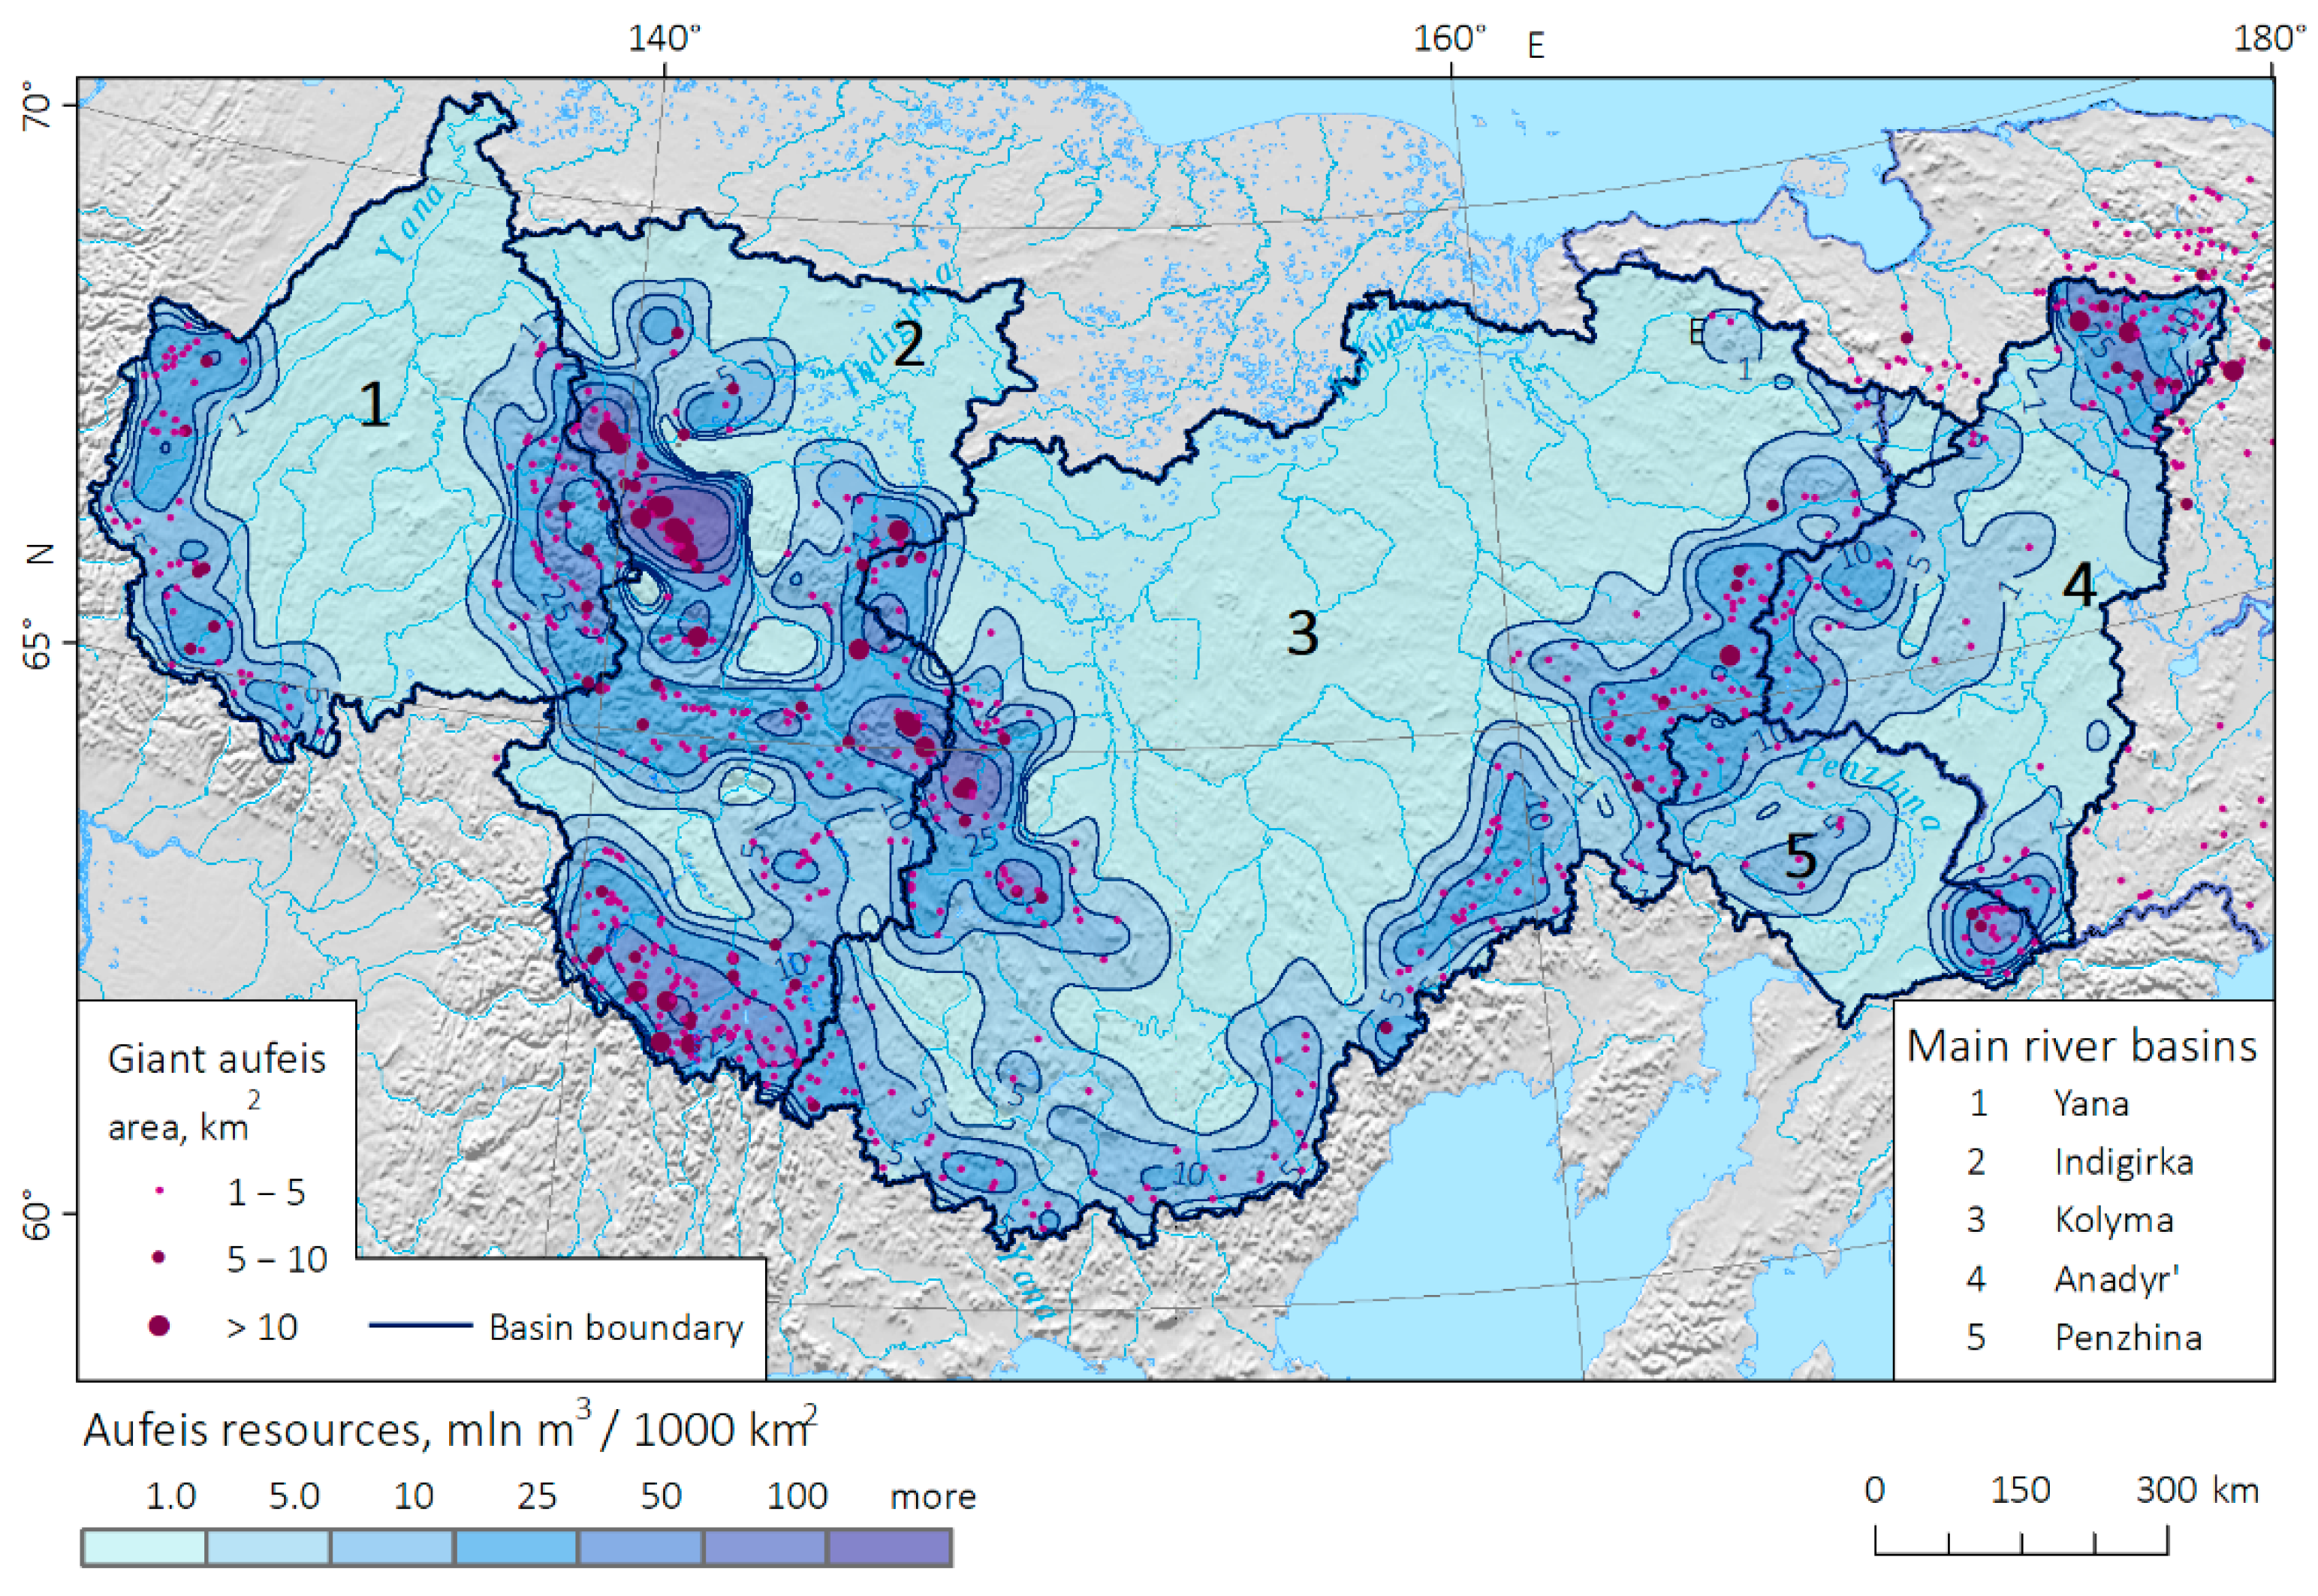
4.2. Aufeis Resources
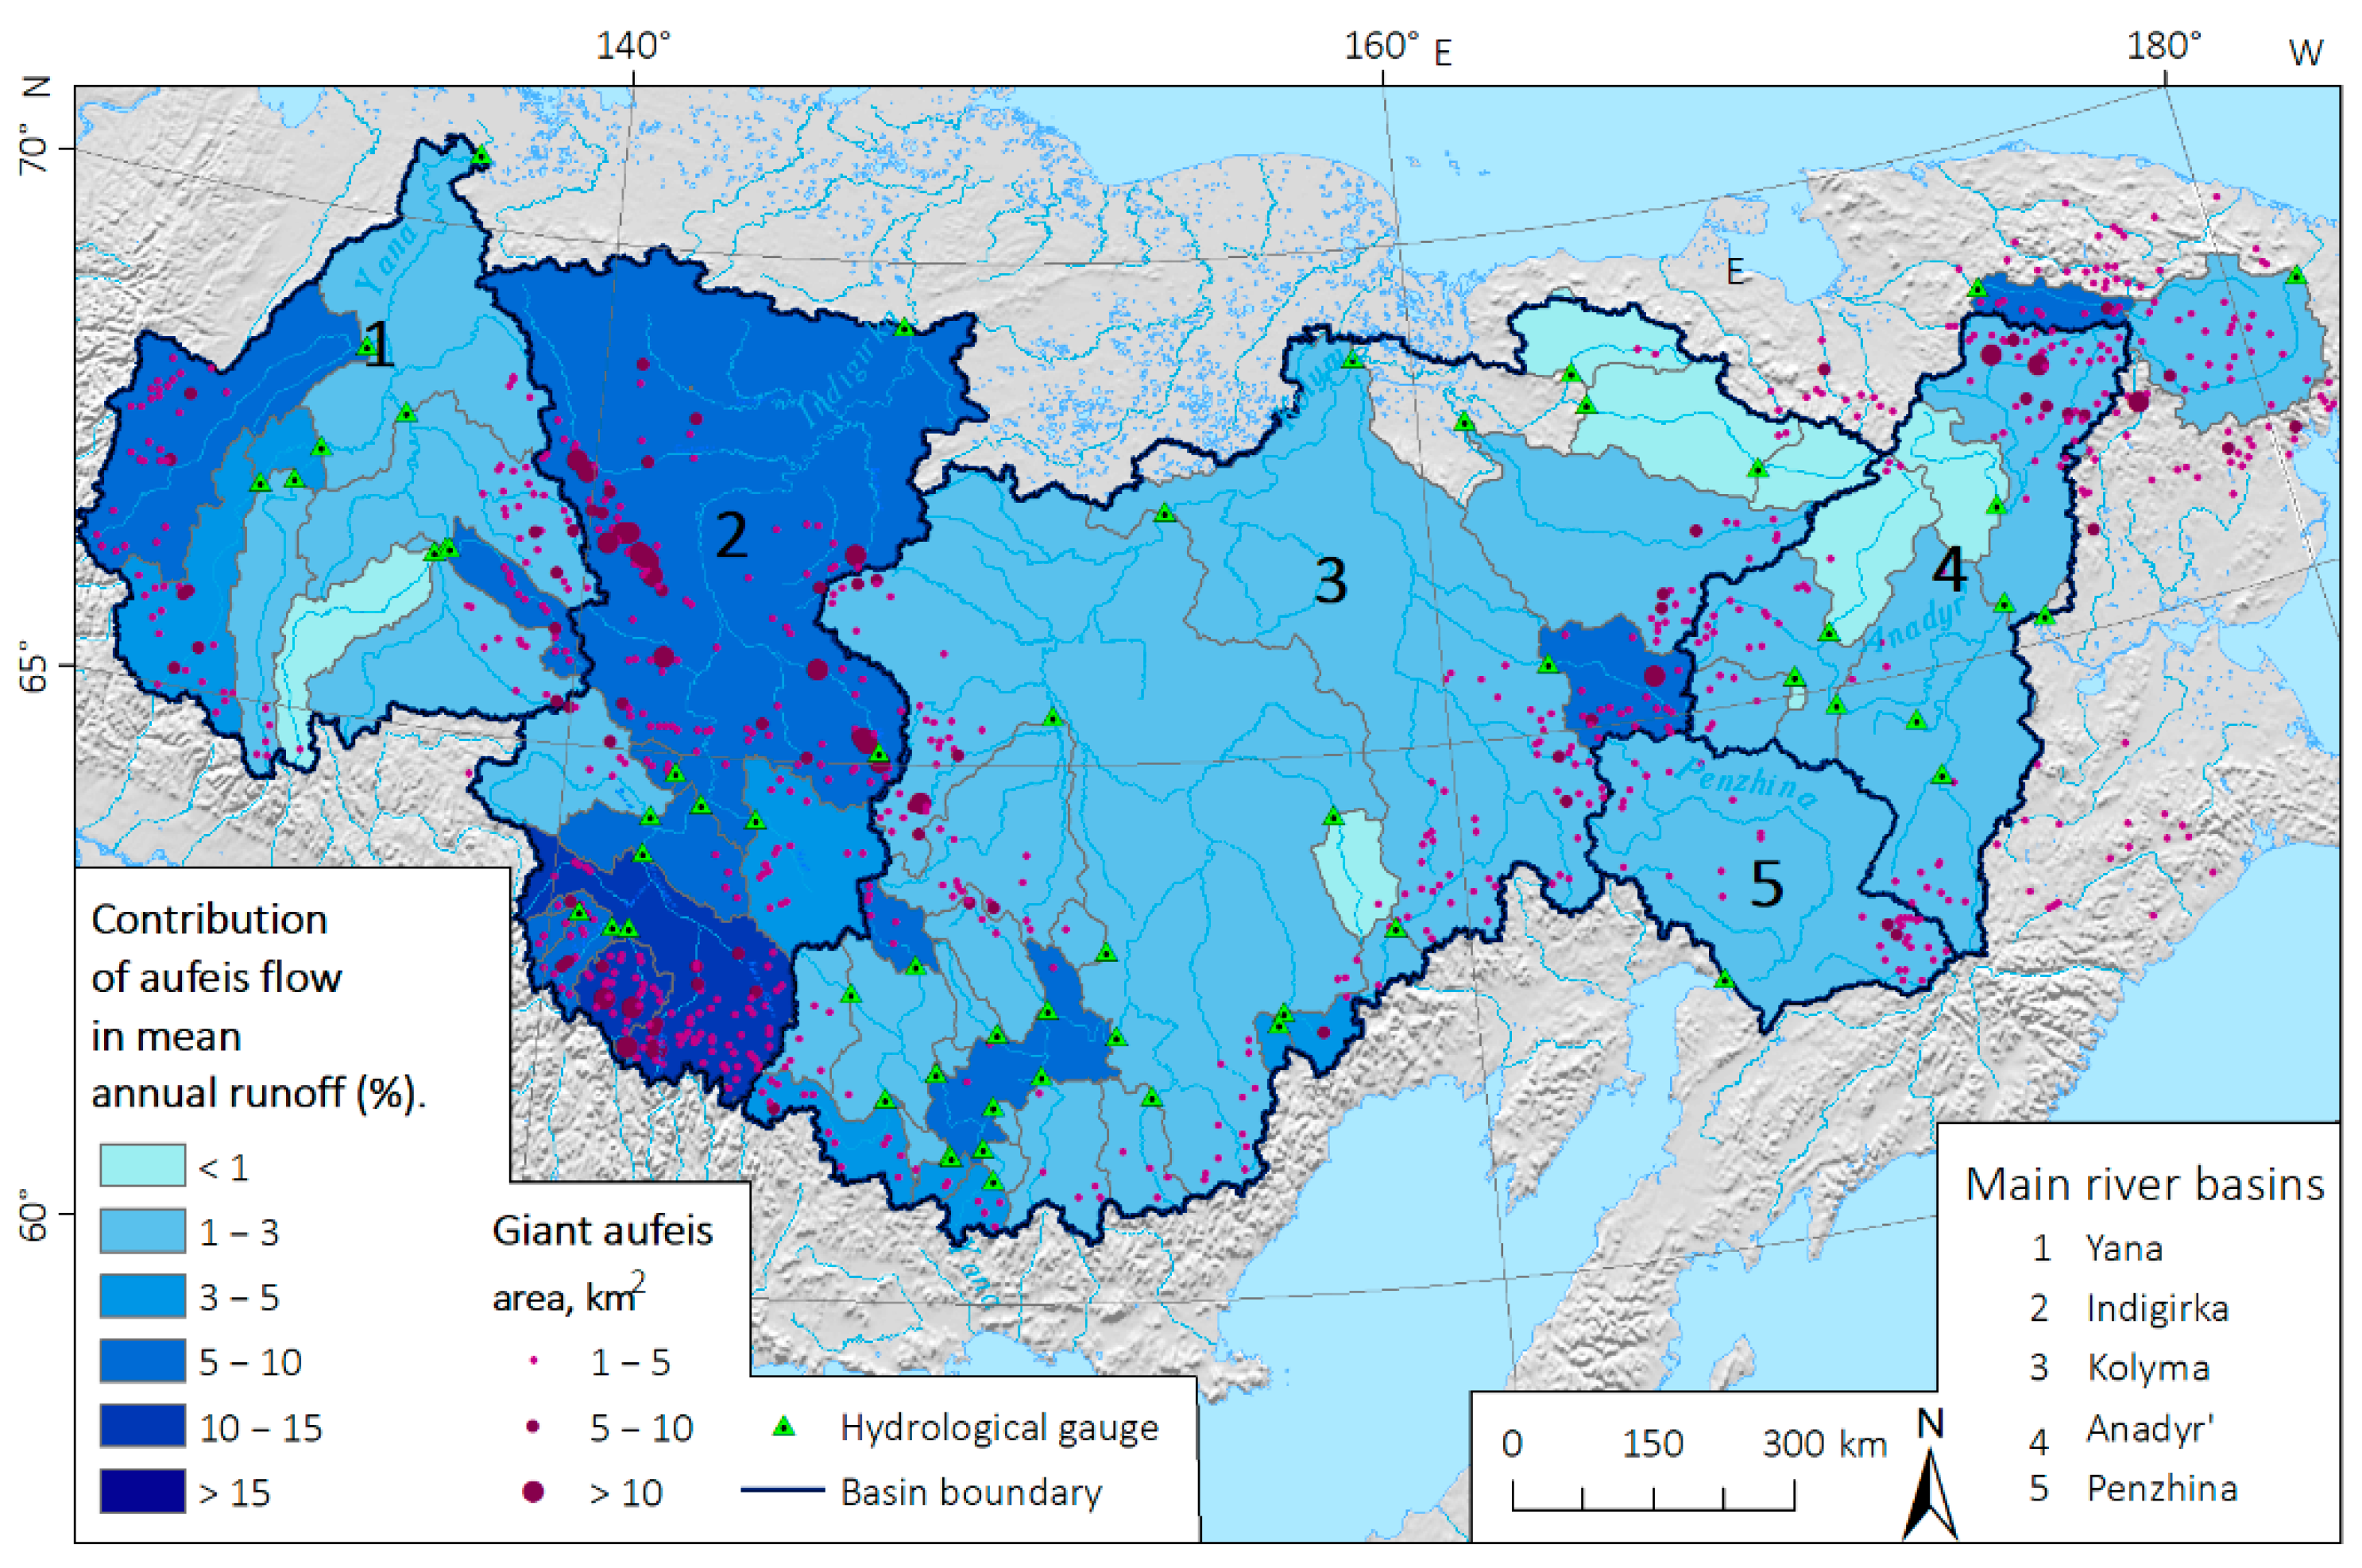
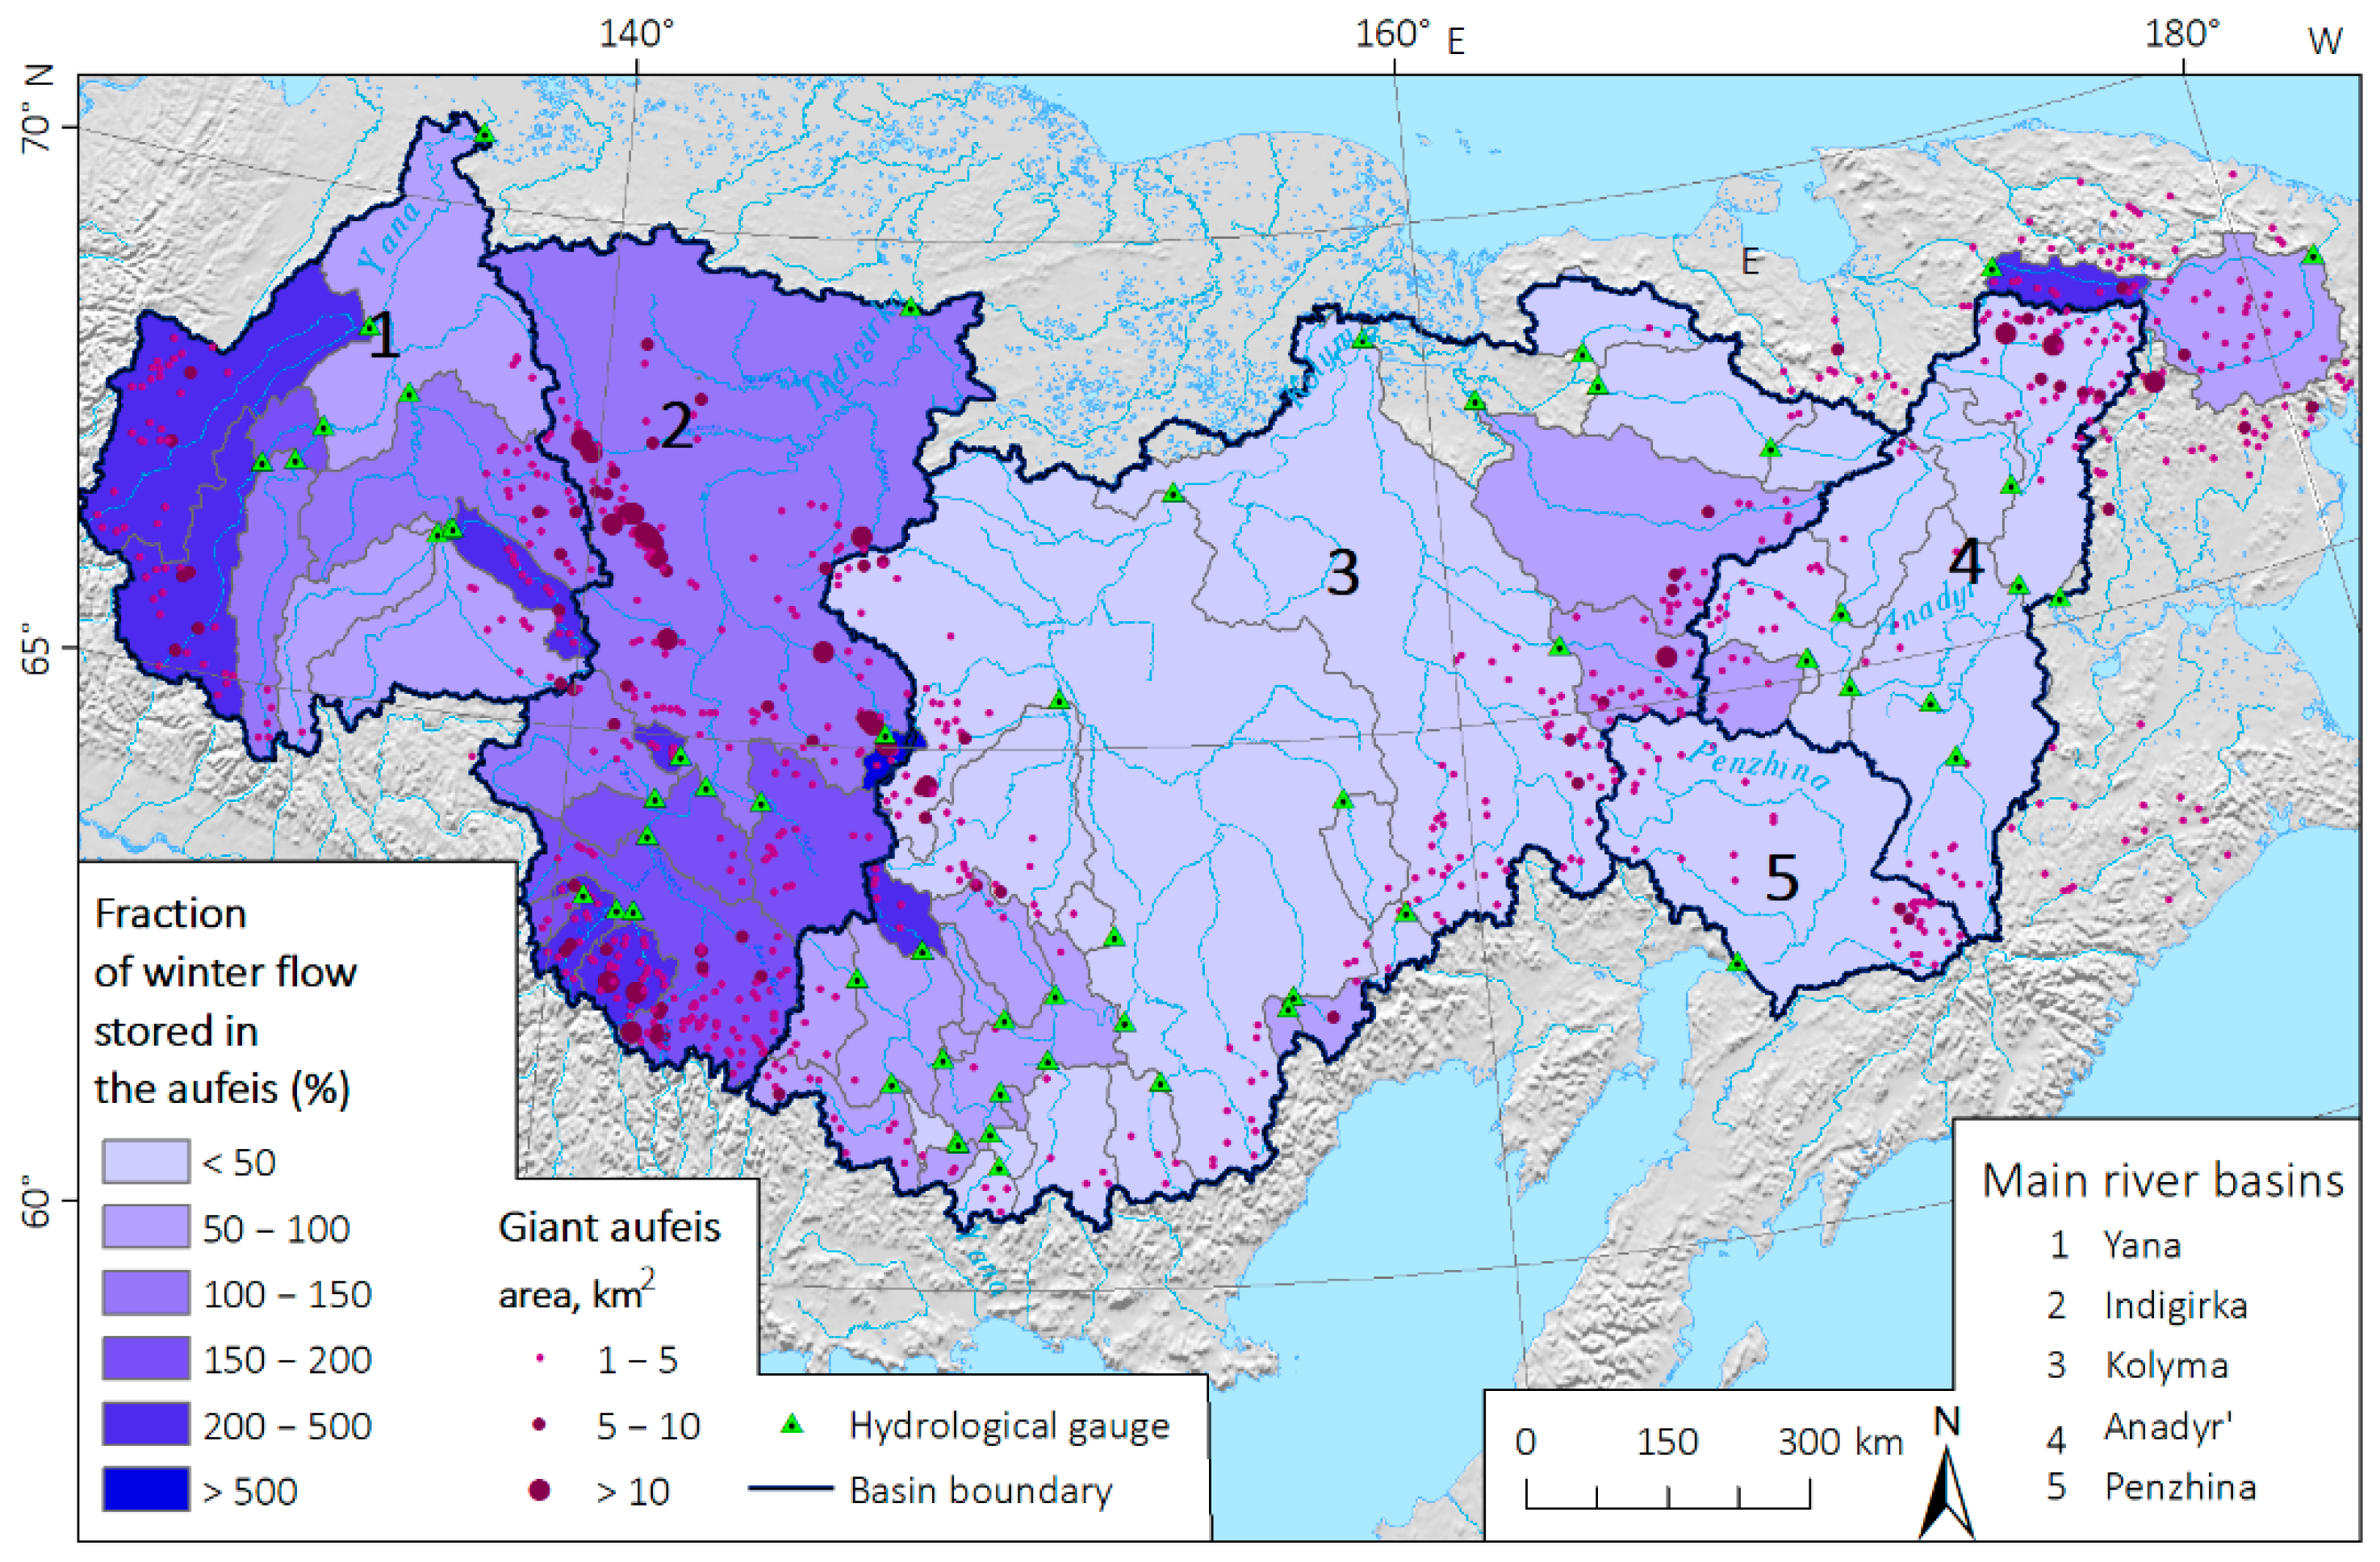
4.3. Aufeis Runoff
5. Discussion
6. Conclusions
Supplementary Materials
Author Contributions
Funding
Data Availability Statement
Conflicts of Interest
References
- Morse, P.; Wolfe, S. Geological and meteorological controls on icing (aufeis) dynamics (1985 to 2014) in subarctic Canada. Geophys. Res. Earth Surf. 2015, 120, 1670–1686. [Google Scholar] [CrossRef]
- Crites, H.; Kokeji, S.; Lacelle, D. Icings and groundwater conditions in permafrost catchments of northwestern Canada. Sci. Rep. 2020, 10, 3283. [Google Scholar] [CrossRef] [PubMed]
- Brombierstäudl, D.; Schmidt, S.; Nüsser, M. Distribution and relevance of Aufeis (icing) in the upper Indus Basin. Sci. Total Environ. 2021, 780, 146604. [Google Scholar] [CrossRef] [PubMed]
- Alekseev, V.R.; Gorin, V.V.; Kotov, S.V. Taryn aufeis in the Northern Chukotka. Ice Snow 2011, 4, 85–93. (In Russian) [Google Scholar]
- Alekseev, V.R. Long-term variability of the spring taryn-aufeises. Ice Snow 2016, 56, 73–93. (In Russian) [Google Scholar] [CrossRef]
- Alekseev, V.R.; Makarieva, O.M.; Shikhov, A.N.; Nesterova, N.V.; Ostashov, A.A.; Zemlyanskova, A.A. Atlas of Giant Aufeis-Taryn of the North-East of Russia; SB RAS: Novosibirsk, Russia, 2021; 302p, ISBN 978-5-6046428-2-5. (In Russian) [Google Scholar]
- Makarieva, O.M.; Nesterova, N.V.; Post, D.A.; Sherstyukov, A.; Lebedeva, L. Warming temperatures are impacting the hydrometeorological regime of Russian rivers in the zone of continuous permafrost. Cryosphere 2019, 13, 1635–1659. [Google Scholar] [CrossRef]
- Nesterova, N.; Makarieva, O.; Post, D.A. Parameterizing a hydrological model using a short-term observational dataset to study runoff generation processes and reproduce recent trends in streamflow at a remote mountainous permafrost basin. Hydrol. Process. 2021, 35, e14278. [Google Scholar] [CrossRef]
- Simakov, A.S.; Shilnikovskaya, Z.G. The Map of Naleds of the North-East USSR. Brief Explanatory Note; North-Eastern Geological Administration of the Main Directorate of Geology and Subsoil Resources Protection under the Council of Ministers of the RSFSR: Magadan, Russia, 1958; 40p. (In Russian) [Google Scholar]
- GLIMS; NSIDC. Global Land Ice Measurements from Space Glacier Database; Compiled and Made Available by the International GLIMS Community; The National Snow and Ice Data Center: Boulder, CO, USA; Available online: https://developers.google.cn/earth-engine/datasets/catalog/GLIMS_current?hl=ru (accessed on 15 December 2021).
- Makarieva, O.; Shikhov, A.; Nesterova, N.; Ostashov, A. Historical and recent aufeis in the Indigirka River basin (Russia). Earth Syst. Sci. Data 2019, 11, 409–420. [Google Scholar] [CrossRef]
- Romanovsky, N.N. Underground Waters in Cryolithozone; Moscow State University: Moscow, Russia, 1983; 231p. (In Russian) [Google Scholar]
- Ensom, T.P.; Makarieva, O.M.; Morse, P.D.; Kane, D.L.; Alekseev, V.R.; Marsh, P. The distribution and dynamics of aufeis in permafrost regions. Permafr. Periglac. Process. 2020, 31, 383–395. [Google Scholar] [CrossRef]
- Pavelsky, T.M.; Zarnetske, J.P. Rapid decline in river icings detected in Arctic Alaska: Implications for a changing hydrologic cycle and river ecosystems. Geophys. Res. Lett. 2017, 44, 3228–3235. [Google Scholar] [CrossRef]
- Bliss, A.; Hock, R.; Radic, V. Global response of glacier runoff to twenty-first century climate change. J. Geophys. Res. Earth Surf. 2014, 119, 717–730. [Google Scholar] [CrossRef]
- Huss, M.; Hock, R. Global-scale hydrological response to future glacier mass loss. Nat. Clim. Chang. 2018, 8, 135–140. [Google Scholar] [CrossRef]
- Brown, J.; Ferrians, O.; Heginbottom, J.A.; Melnikov, E. Circum-Arctic Map of Permafrost and Ground-Ice Conditions, Version 2; NSIDC: Boulder, CO, USA, 2002. [Google Scholar] [CrossRef]
- Ershov, E.D. (Ed.) Geocryology in the USSR. Eastern Siberia and the Far East; Nedra: Moscow, Russia, 1989; 414p. (In Russian) [Google Scholar]
- Tolstikhin, O.N. Icings and Ground Waters of North-East of USSR; Nauka: Novosibirsk, Russia, 1974; 164p. (In Russian) [Google Scholar]
- Makarieva, O.; Shikhov, A.; Ostashov, A.; Nesterova, N. Aufeis (naleds) of the North-East of Russia: GIS catalogue for the Yana River basin. Pangaea 2020, 925306. [Google Scholar] [CrossRef]
- Makarieva, O.; Shikhov, A.; Ostashov, A.; Nesterova, N. Characteristics of aufeis in the Yana River basin derived from Landsat images (2009–2018). Pangaea 2020, 925305. [Google Scholar] [CrossRef]
- Makarieva, O.; Shikhov, A.; Ostashov, A.; Nesterova, N. Characteristics of aufeis from the cadastre of naleds of the North-East of the USSR (1958) for the Yana River basin. Pangaea 2020, 925303. [Google Scholar] [CrossRef]
- Makarieva, O.; Shikhov, A.; Ostashov, A.; Nesterova, N.; Semakina, A. Characteristics of aufeis from the cadastre of naleds of the North-East of the USSR (1958) for the Penzhina River area. Pangaea 2020, 925429. [Google Scholar] [CrossRef]
- Makarieva, O.; Shikhov, A.; Ostashov, A.; Nesterova, N.; Semakina, A. Characteristics of aufeis for the Penzhina River basin derived from Landsat images (2013–2019). Pangaea 2020, 925439. [Google Scholar] [CrossRef]
- Makarieva, O.; Shikhov, A.; Ostashov, A.; Nesterova, N.; Semakina, A. Aufeis of the North-East of Russia: GIS catalogue for the Chukotka region. Pangaea 2020, 925440. [Google Scholar] [CrossRef]
- Makarieva, O.; Shikhov, A.; Ostashov, A.; Nesterova, N.; Semakina, A. Characteristics of aufeis from the cadastre of naleds of the North-East of the USSR (1958) for the Chukotka region. Pangaea 2020, 925416. [Google Scholar] [CrossRef]
- Makarieva, O.; Shikhov, A.; Ostashov, A.; Nesterova, N.; Semakina, A. Characteristics of aufeis for the Chukotka region derived from Landsat images (2013–2019). Pangaea 2020, 925430. [Google Scholar] [CrossRef]
- Makarieva, O.; Shikhov, A.; Ostashov, A.; Nesterova, N. Characteristics of aufeis from the cadastre of naleds of the North-East of the USSR (1958) for the Kolyma River basin. Pangaea 2020, 925404. [Google Scholar] [CrossRef]
- Makarieva, O.; Shikhov, A.; Ostashov, A.; Nesterova, N. Aufeis (naleds) of the North-East of Russia: GIS catalogue for the Kolyma River basin. Pangaea 2020, 925406. [Google Scholar] [CrossRef]
- Makarieva, O.; Shikhov, A.; Ostashov, A.; Nesterova, N. Characteristics of aufeis in the Kolyma River basin derived from Landsat images (2013–2017). Pangaea 2020, 925405. [Google Scholar] [CrossRef]
- Makarieva, O.; Shikhov, A.; Ostashov, A.; Nesterova, N. Aufeis (naleds) of the North-East of Russia: GIS catalogue for the Indigirka River basin. Pangaea 2018, 891036. [Google Scholar] [CrossRef]
- US Geological Survey Server. Available online: http://earthexplorer.usgs.gov (accessed on 5 February 2022).
- Chavez, P.S., Jr. Image-based atmospheric corrections—Revisited and improved. Photogram. Eng. Remote Sens. 1996, 62, 1025–1036. [Google Scholar]
- Danielson, J.J.; Gesch, D.B. Global Multi-Resolution Terrain Elevation Data 2010 (GMTED2010): U.S. Geological Survey Open-File Report 2011–1073; US Department of the Interior: Washington, DC, USA; US Geological Survey: Washington, DC, USA, 2011; p. 26.
- Hall, D.K.; Riggs, G.A.; Salomonson, V.V. Development of methods for mapping global snow cover using Moderate Resolution Imaging Spectroradiometer (MODIS) data. Remote Sens. Environ. 1995, 54, 127–140. [Google Scholar] [CrossRef]
- Xu, H. A Study on Information Extraction of Water Body with the Modified Normalized Difference Water Index (MNDWI). J. Remote Sens. 1995, 9, 589–595. [Google Scholar]
- Bulygina, O.N.; Veselov, V.M.; Razuvaev, V.N.; Aleksandrova, T.M. Description of the Dataset of Observational Data on Major Meteorological Parameters from Russian Weather Stations. Available online: http://meteo.ru/data/163-basicparameters (accessed on 15 December 2021). (In Russian).
- Sokolov, B.L. Icings and River Runoff; Gidrometeoizdat: Leningrad, Russia, 1975; 190p. (In Russian) [Google Scholar]
- USSR State Committee for Hydrometeorology and Environmental Control. Reference Book on the Climate of the USSR. Issue 24. Yakut ASSR; Gidrometeoizdat: Leningrad, Russia, 1989; 386p. (In Russian) [Google Scholar]
- USSR State Committee for Hydrometeorology and Environmental Control. Reference Book on the Climate of the USSR. Issue 33. Magadan Region; Gidrometeoizdat: Leningrad, Russia, 1990; 567p. (In Russian) [Google Scholar]
- Sokolov, B.L.; Sarkisyan, V.O. Underground Nutrition of Mountain Rivers; Gidrometeoizdat: Leningrad, Russia, 1981; 239p. (In Russian) [Google Scholar]
- Tolstikhin, O.N. Aufeis and ground waters in the North-East of the USSR. Izuchenie Ohr. Vodn. Resur. 1975, 18. (In Russian) [Google Scholar]
- Shilnikovskaya, Z.G. Cadastre to the Map of the North-East of the USSR Scale 1:2,000,000; Central Complex Thematic Expedition of the North-Eastern Geological Department: Magadan, Russia, 1958; 398p. (In Russian) [Google Scholar]
- Piguzova, V.M. Assessment of underground runoff to rivers in permafrost zones. Tr. Gos. Gidrol. Inst. 1965, 122, 87–107. (In Russian) [Google Scholar]
- Piguzova, V.M.; Shhebreneva, N.A. On the methodology of studying the underground feeding of rivers in permafrost distribution areas. Tr. Gos. Gidrol. Inst. 1966, 133, 74–81. (In Russian) [Google Scholar]
- Tolstikhin, O.N. On some linear zones of aufeis formation in the territory of North-Eastern Yakutia. In Proceeding of the VIII All-Union Interdepartmental Meeting on Geocryology (Permafrost); 3 Regional Geocryology; MPI SB of the USSR Academy of Sciences: Yakutsk, Russia, 1966; pp. 218–225. (In Russian) [Google Scholar]
- Tolstikhin, O.N. Significance and accounting of aufeis processes in the water balance of the permafrost zone. In Naledi Sibiri; Piguzova, V.M., Tolstikhin, O.N., Eds.; Nauka: Moscow, Russia, 1969; 206p. (In Russian) [Google Scholar]
- Kane, D.L. Physical mechanics of aufeis growth. Can. J. Civ. Eng. 1981, 8, 186–195. [Google Scholar] [CrossRef]
- Clark, I.D.; Lauriol, B. Aufeis of the Firth River basin, northern Yukon, Canada: Insights into permafrost hydrology and karst. Arct. Alp. Res. 1997, 29, 240–252. [Google Scholar] [CrossRef]
- Koreisha, M.M. Glaciation of the Verkhoyansk-Kolyma Region; Interdepartmental Geophysical Committee: Moscow, Russia, 1991; 143p. (In Russian) [Google Scholar]
- Makarieva, O.M.; Shikhov, A.N.; Nesterova, N.V.; Ostashov, A.A.; Zemlyanskova, A.A.; Alexeev, V.R. Giant aufeis of the North-East of Russia according to the Cadastre (1958) and “Landsat” images 1973–2021. In Proceedings of the Sixth Conference of Geocryologists of Russia “Monitoring in the Permafrost Zone”, Moscow, Russia, 14–17 June 2022; pp. 465–471. [Google Scholar] [CrossRef]
- Morse, P.; Wolfe, S. Long-Term river icing dynamics in discontinuous permafrost, subarctic Canadian Shield: River icing dynamics in discontinuous permafrost, subarctic Canada. Permafr. Periglac. Process. 2016, 28, 580–586. [Google Scholar] [CrossRef]
- McKenzie, J.M.; Voss, C.I. Permafrost thaw in a nested groundwater-flow system. Hydrogeol. J. 2013, 21, 299–316. [Google Scholar] [CrossRef]
- Spence, C.; Kokelj, S.V.; Ehsanzadeh, E. Precipitation Trends Contribute to Streamflow Regime Shifts in Northern Canada—Cold Region Hydrology in a Changing Climate; IAHS Publication: Wallingford, UK, 2011; Volume 346, pp. 3–8. [Google Scholar]
- Tananaev, N.I.; Makarieva, O.M.; Lebedeva, L.S. Trends in annual and extreme flows in the Lena River basin, Northern Eurasia. Geophys. Res. Lett. 2016, 43, 10764–10772. [Google Scholar] [CrossRef]
- Lawrence, D.; Slater, A. A projection of severe near-surface permafrost degradation during the 21st century. Geophys. Res. Lett. 2005, 32, L24401. [Google Scholar] [CrossRef]
- Burn, C.; Nelson, F. Comment on “A projection of severe near-surface permafrost degradation during the 21st century”, by Lawrence, D.M., Slater, A.G. Geophys. Res. Lett. 2006, 33, L21503. [Google Scholar] [CrossRef]
- Shepelev, V. Suprapermafrost Water in the Cryolithozone; Geo: Novosibirsk, Russia, 2011; 169p. (In Russian) [Google Scholar]
- Tetzlaff, D.; Birkel, C.; Dick, J.; Geris, J.; Soulsby, C. Storage dynamics in hydropedological units control hillslope connectivity, runoff generation, and the evolution of catchment transit time distributions. Water Resour. Res. 2014, 50, 969–985. [Google Scholar] [CrossRef]
- Liljedahl, A.K.; Gädeke, A.; O’Neel, S.; Gatesman, T.A.; Douglas, T.A. Glacierized headwater streams as aquifer recharge corridors, subarctic Alaska. Geophys. Res. Lett. 2017, 44, 6876–6885. [Google Scholar] [CrossRef]
- Comeau, L.E.L.; Pietroniro, A.; Demuth, M.N. Glacier contribution to the North and South Saskatchevan Rivers. Hydrol. Process. 2009, 23, 2640–2653. [Google Scholar] [CrossRef]
- Nikitin, S.A. Regularities of the distribution of glacial ice in the Russian Altai, assessment of their reserves and dynamics. Data Glaciol. Stud. 2009, 107, 87–96. (In Russian) [Google Scholar]
- Koreisha, M.M. Aufeis in the Suntar-Khayata mountains. Data Glaciol. Stud. 1972, 19, 247–250. (In Russian) [Google Scholar]
- Koreisha, M.M.N. Some features of the study of glaciers and aufeis in the North-East of the USSR. Data Glaciol. Stud. 1972, 19, 245–247. (In Russian) [Google Scholar]
- Gagarin, L.; Qingbai, W.; Melnikov, A.; Volgusheva, N.; Tananaev, N.; Jin, H.; Zhang, Z.; Zhizhin, V. Morphometric analysis of groundwater icings: Intercomparison of estimation techniques. Remote Sens. 2020, 12, 692. [Google Scholar] [CrossRef]
- Tennant, C.; Menounos, B.; Wheate, R.; Clague, J.J. Area change of glaciers in the Canadian Rocky Mountains, 1919 to 2006. Cryosphere 2012, 6, 1541–1552. [Google Scholar] [CrossRef]
- Alifu, H.; Tateishi, R.; Nduati, E.; Maitiniyazi, A. Glacier changes in Glacier Bay, Alaska, during 2000–2012. Int. J. Remote Sens. 2016, 37, 4132–4147. [Google Scholar] [CrossRef]
- Zemp, M.; Gärtner-Roer, I.; Nussbaumer, S.U.; Bannwart, J.; Rastner, P.; Paul, F.; Hoelzle, M. (Eds.) WGMS 2020. Global Glacier Change Bulletin No. 3 (2016–2017); World Glacier Monitoring Service: Zurich, Switzerland, 2020; 274p. [Google Scholar] [CrossRef]
- Ananicheva, M.D. Estimation of the areas, volumes and heights of the boundary of the feeding of glacier systems of the Northeast of Russia from the space images of the beginning of the 21st century. Ice Snow 2014, 1, 35–48. (In Russian) [Google Scholar]
- Makarieva, O.M.; Nesterova, N.V.; Ostashov, A.A.; Zemlyanskova, A.A.; Tumskoy, V.E.; Gagarin, L.A.; Ekaykin, A.A.; Shikhov, A.N.; Olenchenko, V.V.; Khristoforov, I.I. Perspectives of the development of complex interdisciplinary hydrological and geocryological research in the North-East of Russia. Vestn. SPbSU Earth Sci. 2021, 66, 74–90. [Google Scholar] [CrossRef]
- Chesnokova, A.; Baraër, M.; Bouchard, É. Proglacial icings as records of winter hydrological processes. Cryosphere 2020, 14, 4145–4164. [Google Scholar] [CrossRef]
- Miller, J.R.; Russell, G.L. Projected impact of climate change on the freshwater and salt budgets of the Arctic Ocean by a global climate model. Geophys. Res. Lett. 2000, 27, 1183–1186. [Google Scholar] [CrossRef]
- Weatherly, J.W.; Walsh, J.E. The effects of precipitation and river runoff in a coupled ice-ocean model of the Arctic. Clim. Dynam. 1996, 12, 785–798. [Google Scholar] [CrossRef]
- Arnell, N.W. Implications of climate change for freshwater inflows to the Arctic Ocean. J. Geophys. Res. 2005, 110, D07105. [Google Scholar] [CrossRef]
- Smith, L.C.; Alsdorf, D.E. Control on sediment and organic carbon delivery to the Arctic Ocean revealed with space-borne synthetic aperture radar: Ob’ River, Siberia. Geology 1998, 26, 395–398. [Google Scholar] [CrossRef]


| Metrics | Yana | Indigirka | Kolyma | Chukchi Peninsula | Penzhina | Total Study Area |
|---|---|---|---|---|---|---|
| The number of aufeis fields | 583 | 1213 | 2210 | 2139 | 538 | 6683 |
| Landsat-based aufeis area, km2 | 426 | 1287 | 879 | 955 | 155 | 3702 |
| Area of the largest aufeis field, km2 | 10 | 72 | 19 | 22 | 6 | |
| The earliest date of ablation | 3 May | 26 April | 23 April | 12 May | 5 May | |
| Year of Landsat image and correction | 2016 | 2017 | 2019 | 2015 | 2019 | |
| Duration of ablation period (days) before the date of Landsat image, average, maximum | 16, 31 | 18, 51 | 20, 54 | 16, 36 | 21, 39 | |
| Corrected aufeis area, km2 | 506 | 1663 | 1085 | 1086 | 189 | 4529 |
| % increase in area after correction | 19 | 29 | 23 | 14 | 22 | 22 * |
| River Basin | Basin Area, km2 | Aufeis Coverage, % | Maximum Aufeis Area, km2 | Maximum Aufeis Volume, km3 | Aufeis Runoff, mm | Glacier Coverage, % 1 | Glacier Area, km2 | Glacier Volume, km3 |
|---|---|---|---|---|---|---|---|---|
| Yana | 224,000 | 0.23 | 506 | 1.1 | 4.5 | 0.003 | 6.4 | 0.27 |
| Indigirka | 305,000 | 0.55 | 1663 | 4.25 | 11 | 0.057 | 173 | 8.19 |
| Kolyma | 643,000 | 0.19 | 1085 | 2.2 | 3.7 | 0 | 0 | 0 |
| Penzhina | 73,500 | 0.26 | 189 | 0.4 | 5.1 | 0 | 0 | 0 |
| Anadyr | 156,000 | 0.26 | 398 | 0.85 | 5.1 | 0.0004 | 0.6 | 0.02 |
| Amguama | 26,400 | 0.39 | 102 | 0.20 | 7.7 | 0.01 | 3.45 | 0.14 |
| Total | 1,950,000 | 0.23 | 4529 | 10.6 | 5 | 0.013 | 246.3 | 12.3 |
| Gauge ID | River Basin—Gauge | F 1 | H 2 | Hw 3 | Hs 4 | N 5 | S 6 | W 7 | Z 8 | H1 9 | P1 10 | P2 11 | P3 12 |
|---|---|---|---|---|---|---|---|---|---|---|---|---|---|
| 1803 | Kolyma—Kolymskoe 1 | 526,000 | 199 | 20.2 | 85 | 2021 | 981 | 2,030,300 | 0.19 | 3.7 | 1.9 | 18 | 3.1 |
| 1801 | Kolyma—Srednekolymsk | 361,000 | 198 | 19.5 | 87 | 1322 | 658.4 | 1,379,000 | 0.18 | 3.6 | 1.8 | 19 | 2.9 |
| 3871 | Indigirka—Vorontcovo | 305,000 | 166 | 7.4 | 51 | 1220 | 1663.2 | 4,251,500 | 0.55 | 10.9 | 6.6 | 147 | 15 |
| 3489 | Indigirka—Indigirskij | 83,500 | 168 | 6.5 | 54 | 491 | 503.5 | 1,134,500 | 0.6 | 12.1 | 7.2 | 186 | 15.7 |
| 3861 | Yana—Yubilejnaja | 224,000 | 156 | 4.71 | 58 | 582 | 505.4 | 1,109,600 | 0.23 | 4.5 | 2.9 | 96 | 5.4 |
| 3414 | Yana—Verhojansk | 45,300 | 112 | 2.52 | 39 | 79 | 97 | 214,000 | 0.21 | 4.3 | 3.8 | 170 | 7.6 |
| 1501 | Anadyr | 156,000 | 258 | 13 | 116 | 755 | 398.1 | 838,400 | 0.26 | 5.1 | 2 | 39 | 3.1 |
| 1594 | Amguema River—174 km | 26,400 | 321 | 8.2 | 132 | 172 | 101.9 | 210,200 | 0.39 | 7.7 | 2.4 | 94 | 4.1 |
| 2219 | Penzhina—Kamenskoe | 71,600 | 324 | 23.7 | 194 | 538 | 189.0 | 400,000 | 0.26 | 5.6 | 1.7 | 23.5 | 2.0 |
Publisher’s Note: MDPI stays neutral with regard to jurisdictional claims in published maps and institutional affiliations. |
© 2022 by the authors. Licensee MDPI, Basel, Switzerland. This article is an open access article distributed under the terms and conditions of the Creative Commons Attribution (CC BY) license (https://creativecommons.org/licenses/by/4.0/).
Share and Cite
Makarieva, O.; Nesterova, N.; Shikhov, A.; Zemlianskova, A.; Luo, D.; Ostashov, A.; Alexeev, V. Giant Aufeis—Unknown Glaciation in North-Eastern Eurasia According to Landsat Images 2013–2019. Remote Sens. 2022, 14, 4248. https://doi.org/10.3390/rs14174248
Makarieva O, Nesterova N, Shikhov A, Zemlianskova A, Luo D, Ostashov A, Alexeev V. Giant Aufeis—Unknown Glaciation in North-Eastern Eurasia According to Landsat Images 2013–2019. Remote Sensing. 2022; 14(17):4248. https://doi.org/10.3390/rs14174248
Chicago/Turabian StyleMakarieva, Olga, Nataliia Nesterova, Andrey Shikhov, Anastasiia Zemlianskova, Dongliang Luo, Andrey Ostashov, and Vladimir Alexeev. 2022. "Giant Aufeis—Unknown Glaciation in North-Eastern Eurasia According to Landsat Images 2013–2019" Remote Sensing 14, no. 17: 4248. https://doi.org/10.3390/rs14174248