Article

GeoDLS: A Deep Learning-Based Corn Disease Tracking and Location System Using RTK Geolocated UAS Imagery

1
Elmore Family School of Electrical and Computer Engineering, Purdue University, West Lafayette, IN 47907, USA
2
Department of Agricultural and Biological Engineering, Purdue University, West Lafayette, IN 47907, USA
3
Department of Botany and Plant Pathology Engineering, Purdue University, West Lafayette, IN 47907, USA
*
Author to whom correspondence should be addressed.
Remote Sens. 2022, 14(17), 4140; https://doi.org/10.3390/rs14174140
Submission received: 19 June 2022 / Revised: 13 August 2022 / Accepted: 18 August 2022 / Published: 23 August 2022
(This article belongs to the Special Issue Advances of Remote Sensing in Precision Agriculture)

Abstract

:
Deep learning-based solutions for precision agriculture have recently achieved promising results. Deep learning has been used to identify crop diseases at the initial stages of disease development in an effort to create effective disease management systems. However, the use of deep learning and unmanned aerial system (UAS) imagery to track the spread of diseases, identify diseased regions within cornfields, and notify users with actionable information remains a research gap. Therefore, in this study, high-resolution, UAS-acquired, real-time kinematic (RTK) geotagged, RGB imagery at an altitude of 12 m above ground level (AGL) was used to develop the Geo Disease Location System (GeoDLS), a deep learning-based system for tracking diseased regions in corn fields. UAS images (resolution 8192 × 5460 pixels) were acquired in cornfields located at Purdue University’s Agronomy Center for Research and Education (ACRE), using a DJI Matrice 300 RTK UAS mounted with a 45-megapixel DJI Zenmuse P1 camera during corn stages V14 to R4. A dataset of 5076 images was created by splitting the UAS-acquired images using tile and simple linear iterative clustering (SLIC) segmentation. For tile segmentation, the images were split into tiles of sizes 250 × 250 pixels, 500 × 500 pixels, and 1000 × 1000 pixels, resulting in 1804, 1112, and 570 image tiles, respectively. For SLIC segmentation, 865 and 725 superpixel images were obtained using compactness (m) values of 5 and 10, respectively. Five deep neural network architectures, VGG16, ResNet50, InceptionV3, DenseNet169, and Xception, were trained to identify diseased, healthy, and background regions in corn fields. DenseNet169 identified diseased, healthy, and background regions with the highest testing accuracy of 100.00% when trained on images of tile size 1000 × 1000 pixels. Using a sliding window approach, the trained DenseNet169 model was then used to calculate the percentage of diseased regions present within each UAS image. Finally, the RTK geolocation information for each image was used to update users with the location of diseased regions with an accuracy of within 2 cm through a web application, a smartphone application, and email notifications. The GeoDLS could be a potential tool for an automated disease management system to track the spread of crop diseases, identify diseased regions, and provide actionable information to the users.

1. Introduction

As diseases pose a serious threat to crop production systems worldwide [1], research is underway to develop high-throughput precision agricultural solutions for disease management in fields. Most current solutions rely on pesticide application over entire fields, which is expensive and destructive to healthy crops [2]. Furthermore, these ineffective approaches are subjective [3]. Therefore, there is a need to develop effective solutions capable of identifying different diseased regions, which will help overcome the limitations presented by widely practiced approaches.
Recently, researchers have relied on deep learning-based computer vision for developing solutions for various precision agricultural solutions, including weed identification [4], disease identification [5], disease severity estimation [6], insect identification [7], insect counting [8], crop counting [9], crop height estimation [10], yield prediction [6], etc. In addition, different sensors were used for acquiring imagery for training robust deep learning models, including unmanned aerial systems (UAS) [11], handheld systems [12], mounts [13], and ground robot platforms [14].
In particular, deep learning has been used extensively for crop disease diagnosis since the introduction of the PlantVillage dataset in 2015 [15]. Deep learning was used for disease identification in corn with accuracies of up to 95.99% [16]. Soybean diseases were identified with 94.29% accuracy [17]. Diseases in strawberry, grapes, tomato, and cucumber were identified with accuracies of up to 95.59% [18], 97.22% [19], 98.4% [20], and 93.4% [21], respectively. For detailed coverage of deep learning for disease identification and monitoring, readers are encouraged to refer to sample review articles [15,22,23,24]. Though deep learning has shown great promise for disease identification, developing an effective plant disease diagnosis system requires scouting entire fields to locate diseased regions. Therefore, deploying UAS mounted with sensors capable of scouting entire fields for identifying crop diseases is becoming a preferred approach within the research community.
UAS imagery acquired using hyperspectral sensors has been useful in identifying crop diseases using deep learning [25,26,27,28,29]. Multispectral imagery has also been useful for disease identification [30,31]. Although spectral sensors can help locate diseased regions, they are costly and difficult to operate [32]. On the other hand, RGB sensors cost less and are easy to operate [33]. Therefore, the use of RGB sensors is gaining popularity for identifying diseases.
UAS imagery acquired using RGB sensors was recently used to train deep learning models for identifying NLB disease in corn [34]. NLB disease lesions from UAS imagery were also identified using deep learning techniques [35]. Although high accuracies were achieved, the location of the diseased regions within the field was not reported. In addition, the studies resized the UAS images, which could lead to the loss of features for deep learning-based disease identification. Thus, splitting large images into smaller images or segments when dealing with UAS imagery can be advantageous [11].
Segmentation was used in the literature for preparing datasets to train deep learning models. Multiple different computer vision-based segmentation approaches have been proposed over the years. Recently, the simple linear iterative clustering (SLIC) segmentation approach was proposed [36]. SLIC segmentation promises a fast and computationally efficient method that can help to create superpixels corresponding to similar regions within an image [37]. SLIC segmentation was used for precision agricultural applications such as insect counting [8], tree detection in urban areas [38], and plant disease identification [39,40,41,42]. SLIC segmentation was also used for creating superpixels from UAS imagery for training deep learning models to identify diseases in soybean [8,39]. UAS imagery was used for disease identification in potato [43], wheat [44], and rice [45]. SLIC segmentation was used for plant disease identification from UAS imagery acquired in soybean [39] and rice [46]. To the best of our knowledge, SLIC segmentation has not been used for corn disease diagnosis from UAS imagery.
Current studies have reported promising results for disease diagnosis. However, it is important to accurately identify and locate diseased regions in fields to develop an effective disease management system. One practical approach can rely on using a sliding window guided by a deep learning model for identifying regions within an image. A deep learning-based approach using a sliding window was recently reported to identify diseased regions in corn fields with testing accuracies of up to 97.84% [5]. The sliding window approach was also used for identifying diseased regions using hyperspectral imagery [47]. Although the sliding window with deep learning has been used in different domains [48,49,50,51], its application for crop disease identification is limited. In addition, using different segmentation approaches and the GNSS (Global Navigation Satellite System) information from the UAS imagery was not harnessed to develop an application to alert users of existing diseased hot spots within corn fields. The RTK geolocation information from images could help farmers or robots navigate to specified locations within fields.
In this study, a new system named the Geo Disease Location System (GeoDLS) was developed to track and locate disease regions within corn fields to notify users. Deep learning was used to train disease region identification models using tile-segmented images and superpixels created using SLIC segmentation. A total of 25 deep learning models were trained using state-of-the-art deep neural network architectures: VGG16, ResNet50, InceptionV3, DenseNet169, and Xception. After comparing the different techniques for splitting the images, the real-time kinematic (RTK) geolocation information for each uploaded image was obtained. The user was then notified of diseased regions in corn fields using RTK geolocation and the deep learning model to indicate the percentage of the field infected at the location where the image was acquired. Five primary objectives were identified for developing a disease region identification and location tool to help in their management:
  • Acquire a UAS imagery dataset in diseased corn fields;
  • Use tile segmentation on UAS imagery to create datasets;
  • Use SLIC segmentation to create superpixels;
  • Train deep learning models to compare the different segmentation approaches for disease region identification;
  • Develop an application for alerting users of diseased regions in corn fields using RTK geolocated images.

2. Materials and Methods

2.1. Dataset

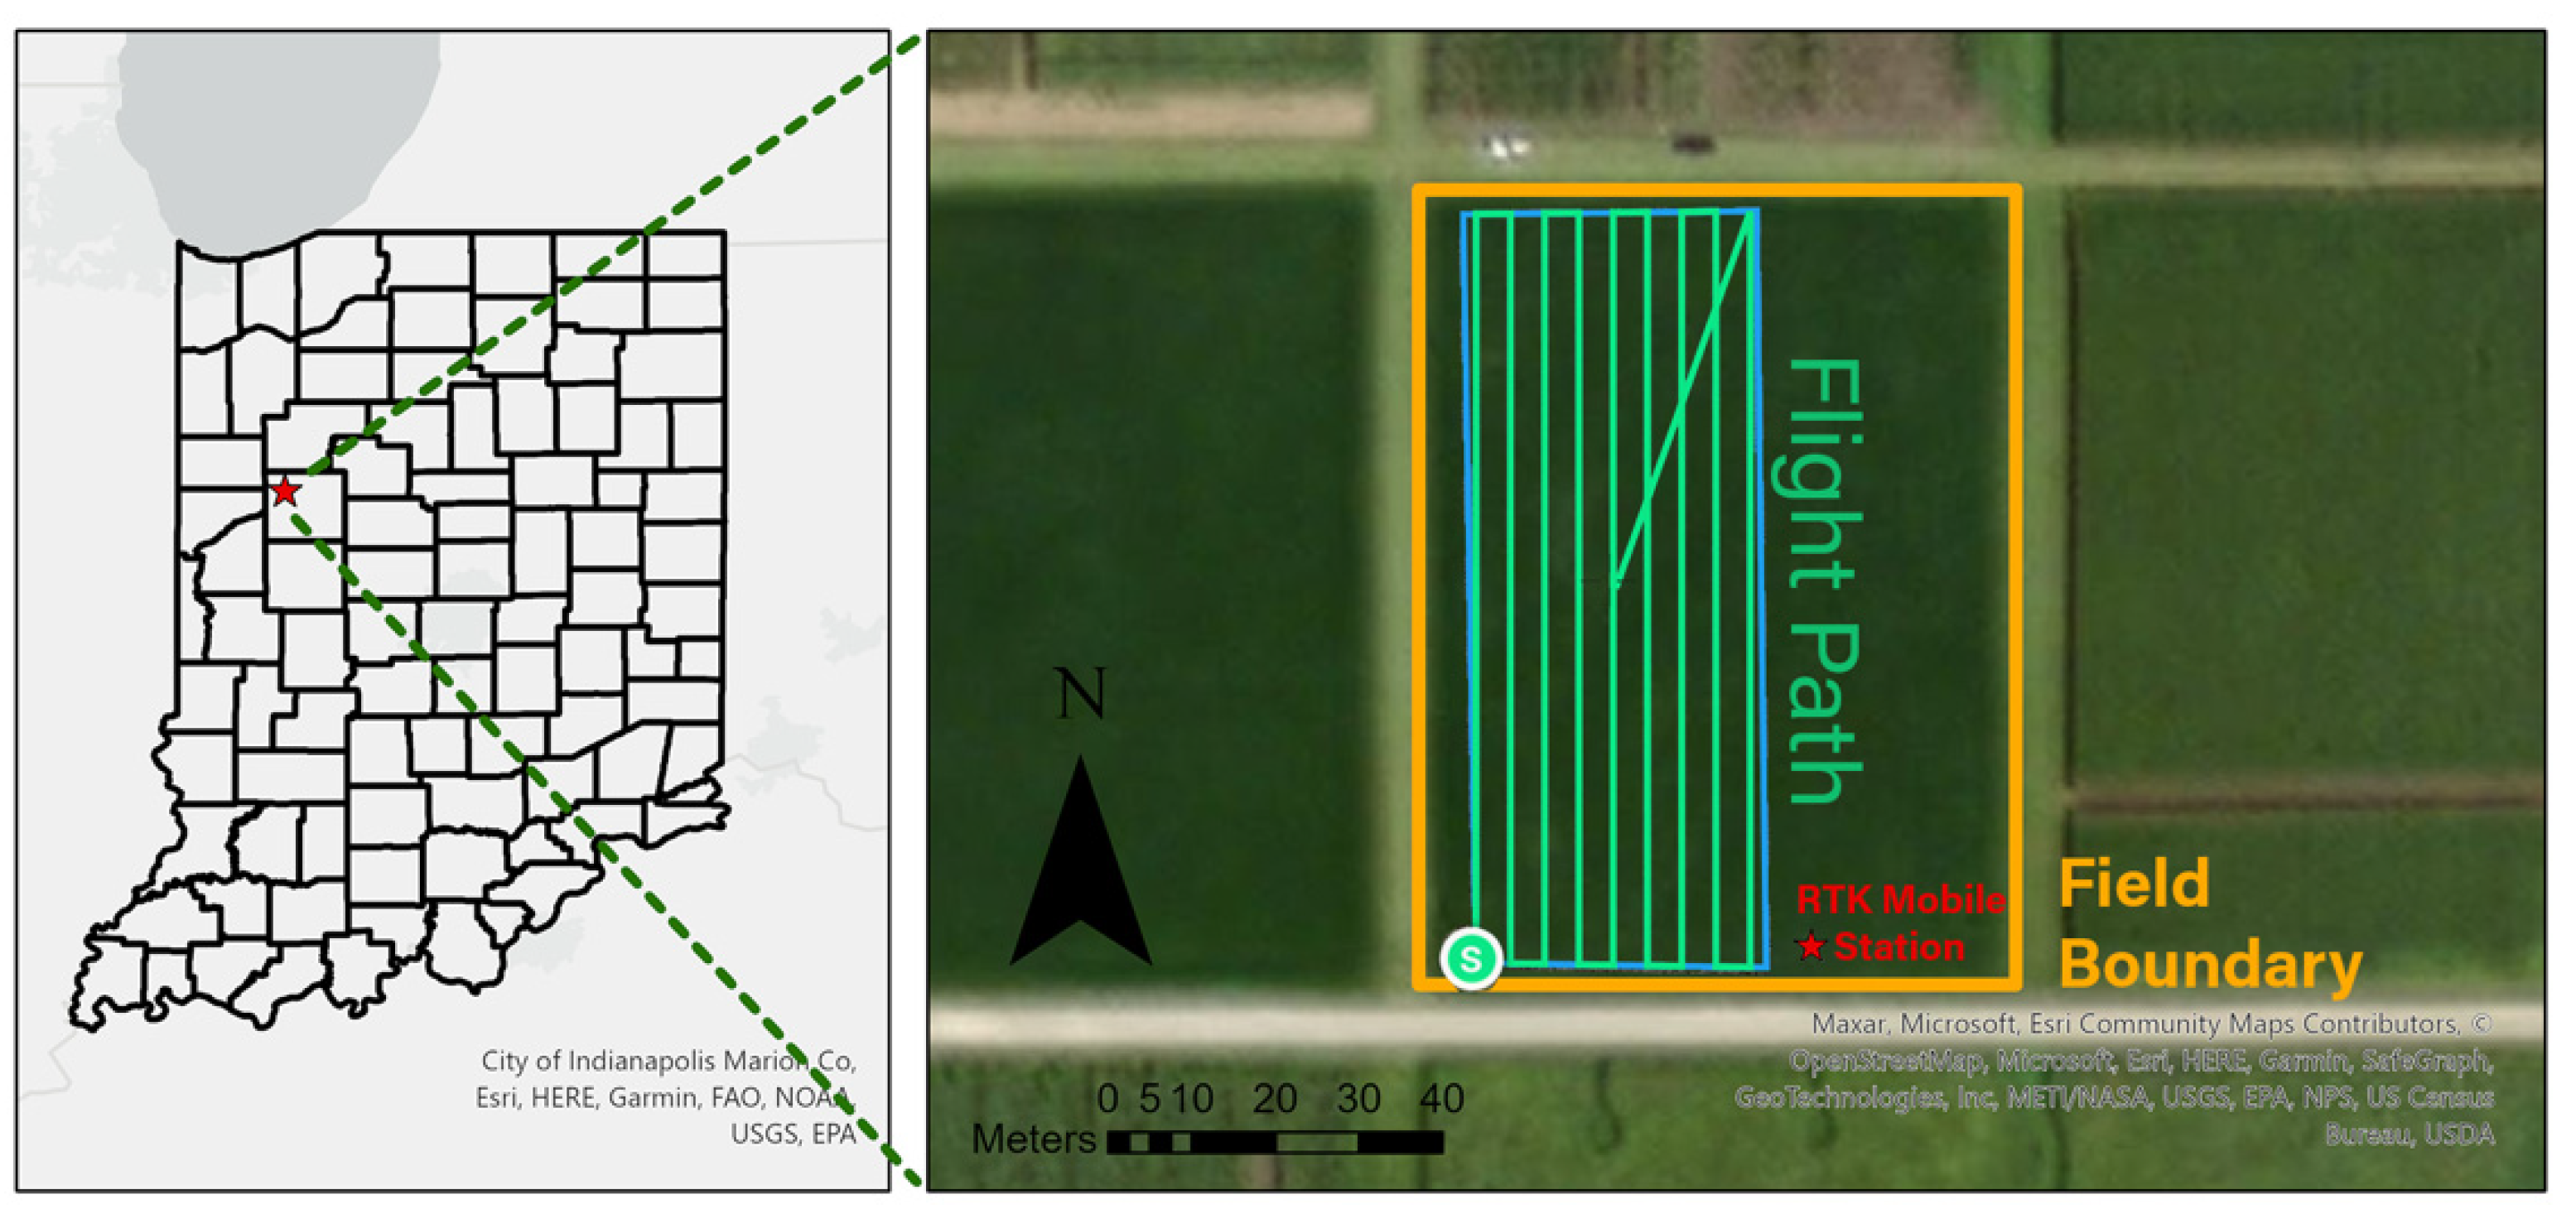
For this study, a custom dataset consisting of a total of 5076 images was created by subjecting UAS imagery to two different segmentation techniques: tile and SLIC segmentation, to develop a deep learning-based disease region identification tool. A DJI Matrice 300 quadcopter UAS with a RTK mobile station was utilized for collecting images in diseased corn fields in 2021. The UAS was mounted with a Zenmuse P1 45-megapixel RGB camera capable of acquiring 8192 × 5460 pixels resolution images. Flights were conducted at an altitude of 12 m above ground level (AGL), resulting in a ground sampling distance (GSD) of 0.15 cm/pixels. A DJI D-RTK 2 mobile station was used, which helped geotag images with an accuracy of up to 2 cm [52]. The location of the mobile station is marked in Figure 1. The mobile station was connected to the remote control and the Matrice 300 UAS. The software DJI Pilot 2 application (DJI, Shenzhen, China) then automatically corrected the geolocation error and stored the corrected coordinates in image EXIF data [53,54]. A total of 151 images corresponding to diseased regions in the corn field from flights conducted on July 30th, August 2nd, August 4th, and August 13th were used to segment into tiles and superpixels. Data collection started 65 days after planting in corn field 21B (Figure 1), located at Purdue University’s Agronomy Center of Research and Education (ACRE), when the crop was at stage V14, the recommended time to scout for diseases [55]. Regions in the field were infected with northern leaf blight, gray leaf spot, northern leaf spot, and common rust diseases. Tile and SLIC segmentation were then used to segment the UAS-acquired images into tiles and superpixels for training deep learning models to identify diseased, healthy, and background regions within corn fields.

2.1.1. Tile Segmentation

The UAS-acquired images from different dates were first split into a total of 3486 tiles using tile segmentation. The images were split into tiles of sizes 250 × 250 pixels, 500 × 500 pixels, and 1000 × 1000 pixels to prepare the datasets for training deep learning models. Each original image of size 8192 × 5460 pixels was first split as per the three tile sizes, resulting in a total of 672, 160, and 40 images, respectively (Figure 2). Each tile was manually labelled as diseased, healthy, or background and organized into training and testing folders using a 50–50% training–testing split ratio to train deep learning models. Overall, the datasets corresponding to images of sizes 250 × 250 pixels, 500 × 500 pixels, and 1000 × 1000 pixels comprised 1804, 1112, and 570 images, respectively (Table 1).

2.1.2. SLIC Segmentation

Superpixels are segments of an image created by grouping together different pixels within an image into perceptually meaningful atomic regions that may be similar in color, texture, and shape [38]. Although different algorithms exist for creating superpixels, simple linear iterative clustering (SLIC) segmentation is a popular and computationally efficient method to segment an image into multiple superpixels [36].
When creating superpixels, the SLIC algorithms rely on two primary parameters, i.e., the number of segments that need to be created (K) and compactness (m). The compactness determines the compactness of the pixels corresponding to superpixels. Essentially, more regular quadrilateral contours are generated by increasing the compactness (m). However, by reducing the compactness (m), the superpixels are more irregular, and it was observed to be better for differentiating between diseased and healthy regions within UAS-acquired corn field imagery. Therefore, different compactness (m) values were used to test their impact. The number of segments (K) was fixed in this study to maintain consistency. The parameters for SLIC segmentation were chosen after experimenting with different values, as shown by [39,56].
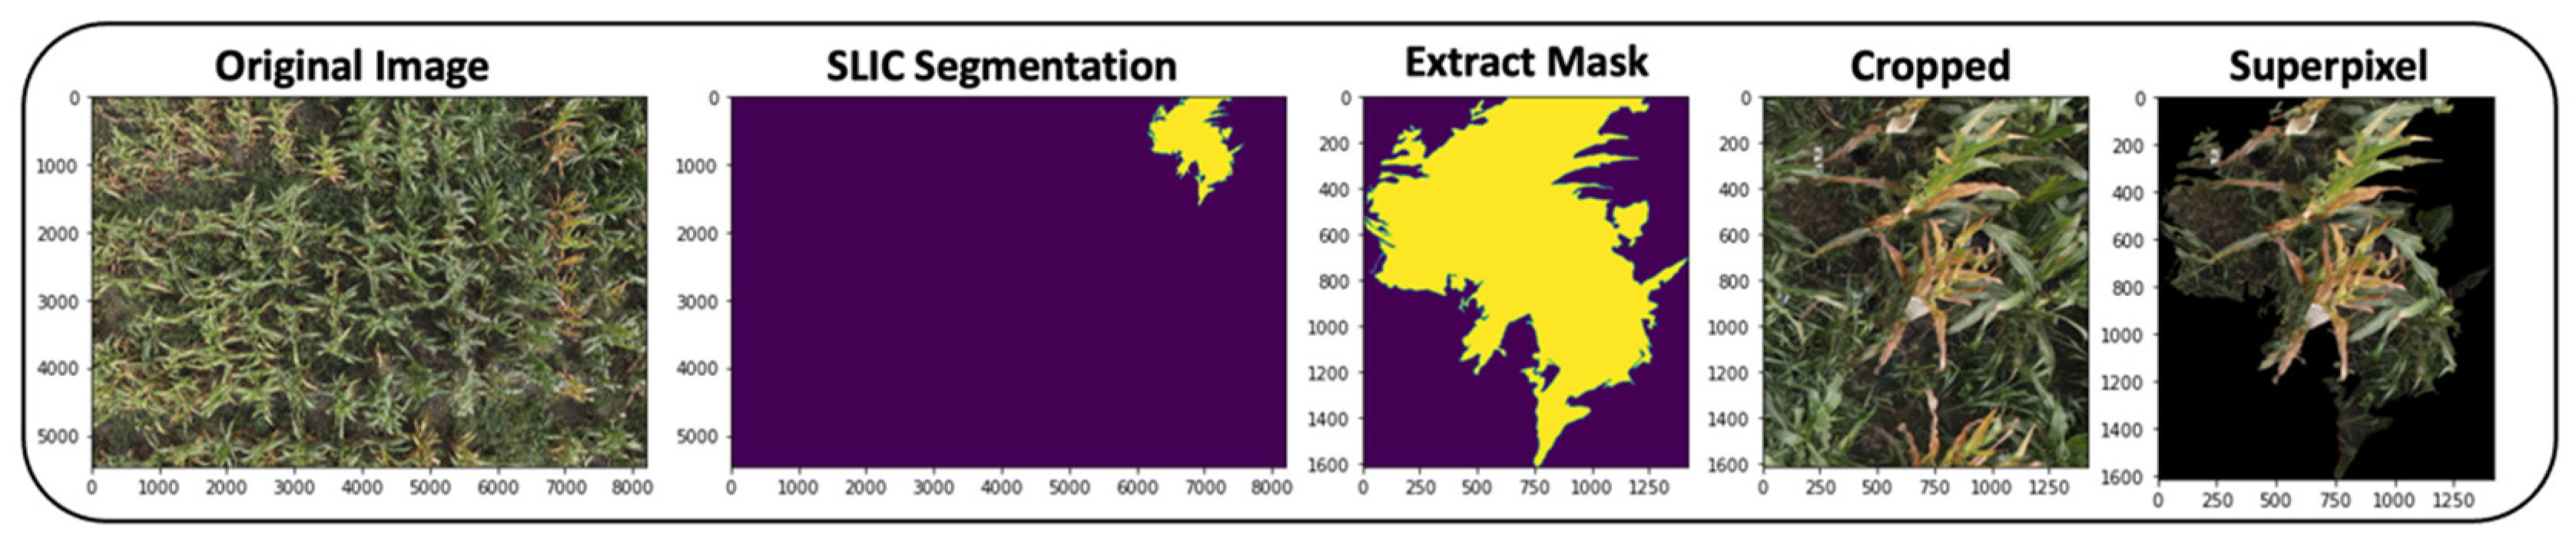
For SLIC segmentation in this study, a total of 1590 superpixels were created using different combinations of parameters (Figure 3). After testing various compactness (m) values and the number of segments, the compactness (m) values of 5 and 10 were used (Table 2). In addition, the number of segments (K) was 100. Individual segments were labeled as diseased, healthy, or background to prepare the dataset for training deep learning models.

2.2. Deep Learning

Deep learning is a machine learning technique that relies on using deep neural networks (DNN) that can accurately learn important features from training data for identification purposes.
A DNN typically consists of input, hidden, and output layers. The input layer takes in the input images as tensors in a specified size as per the deep learning DNN architecture requirements. Multiple hidden layers follow the input layer. Hidden layers comprise convolutional, dense, pooling, or batch normalization layers. In addition, fully connected layers are then presented, followed by an output layer. The output layer consists of neurons corresponding to the total number of classes identified using either the sigmoid activation function for a binary classification problem or the Softmax activation function for a multiclass classification problem.
Image classification is a deep learning technique in which a probability is assigned to an image corresponding to different classes used to train the model. Unlike object detection and semantic segmentation, traditional image classification cannot accurately locate the identified objects using bounding boxes or masks. Therefore, in this study, each UAS image was split using tile or SLIC segmentation, which helped overcome the tedious annotation task required for training object detection and semantic segmentation models. Image classification was then used to accurately identify the diseased, healthy, and background regions.
Training robust deep learning-based image classification requires access to large imagery datasets consisting of thousands of images. One of the most popular datasets, ImageNet, comprises of 14 million images. Due to limited efforts or resources, access to such large datasets for disease identification is limited. Therefore, transfer learning was used for training each model in this study.
Transfer learning is a technique commonly used to train deep learning models when access to large datasets and computational resources is limited. Transfer learning helps train deep learning models by utilizing pre-trained weights from models trained for similar but different tasks. For image classification, the pre-trained ImageNet weights are most commonly used.
A total of five different state-of-the-art DNN architectures, namely VGG16 [57], ResNet50 [58], InceptionV3 [59], DenseNet169 [60], and Xception [61], were utilized for the interest of this study. Transfer learning was used by utilizing pre-trained ImageNet weights for training deep learning models capable of locating diseased regions in corn fields from UAS imagery.
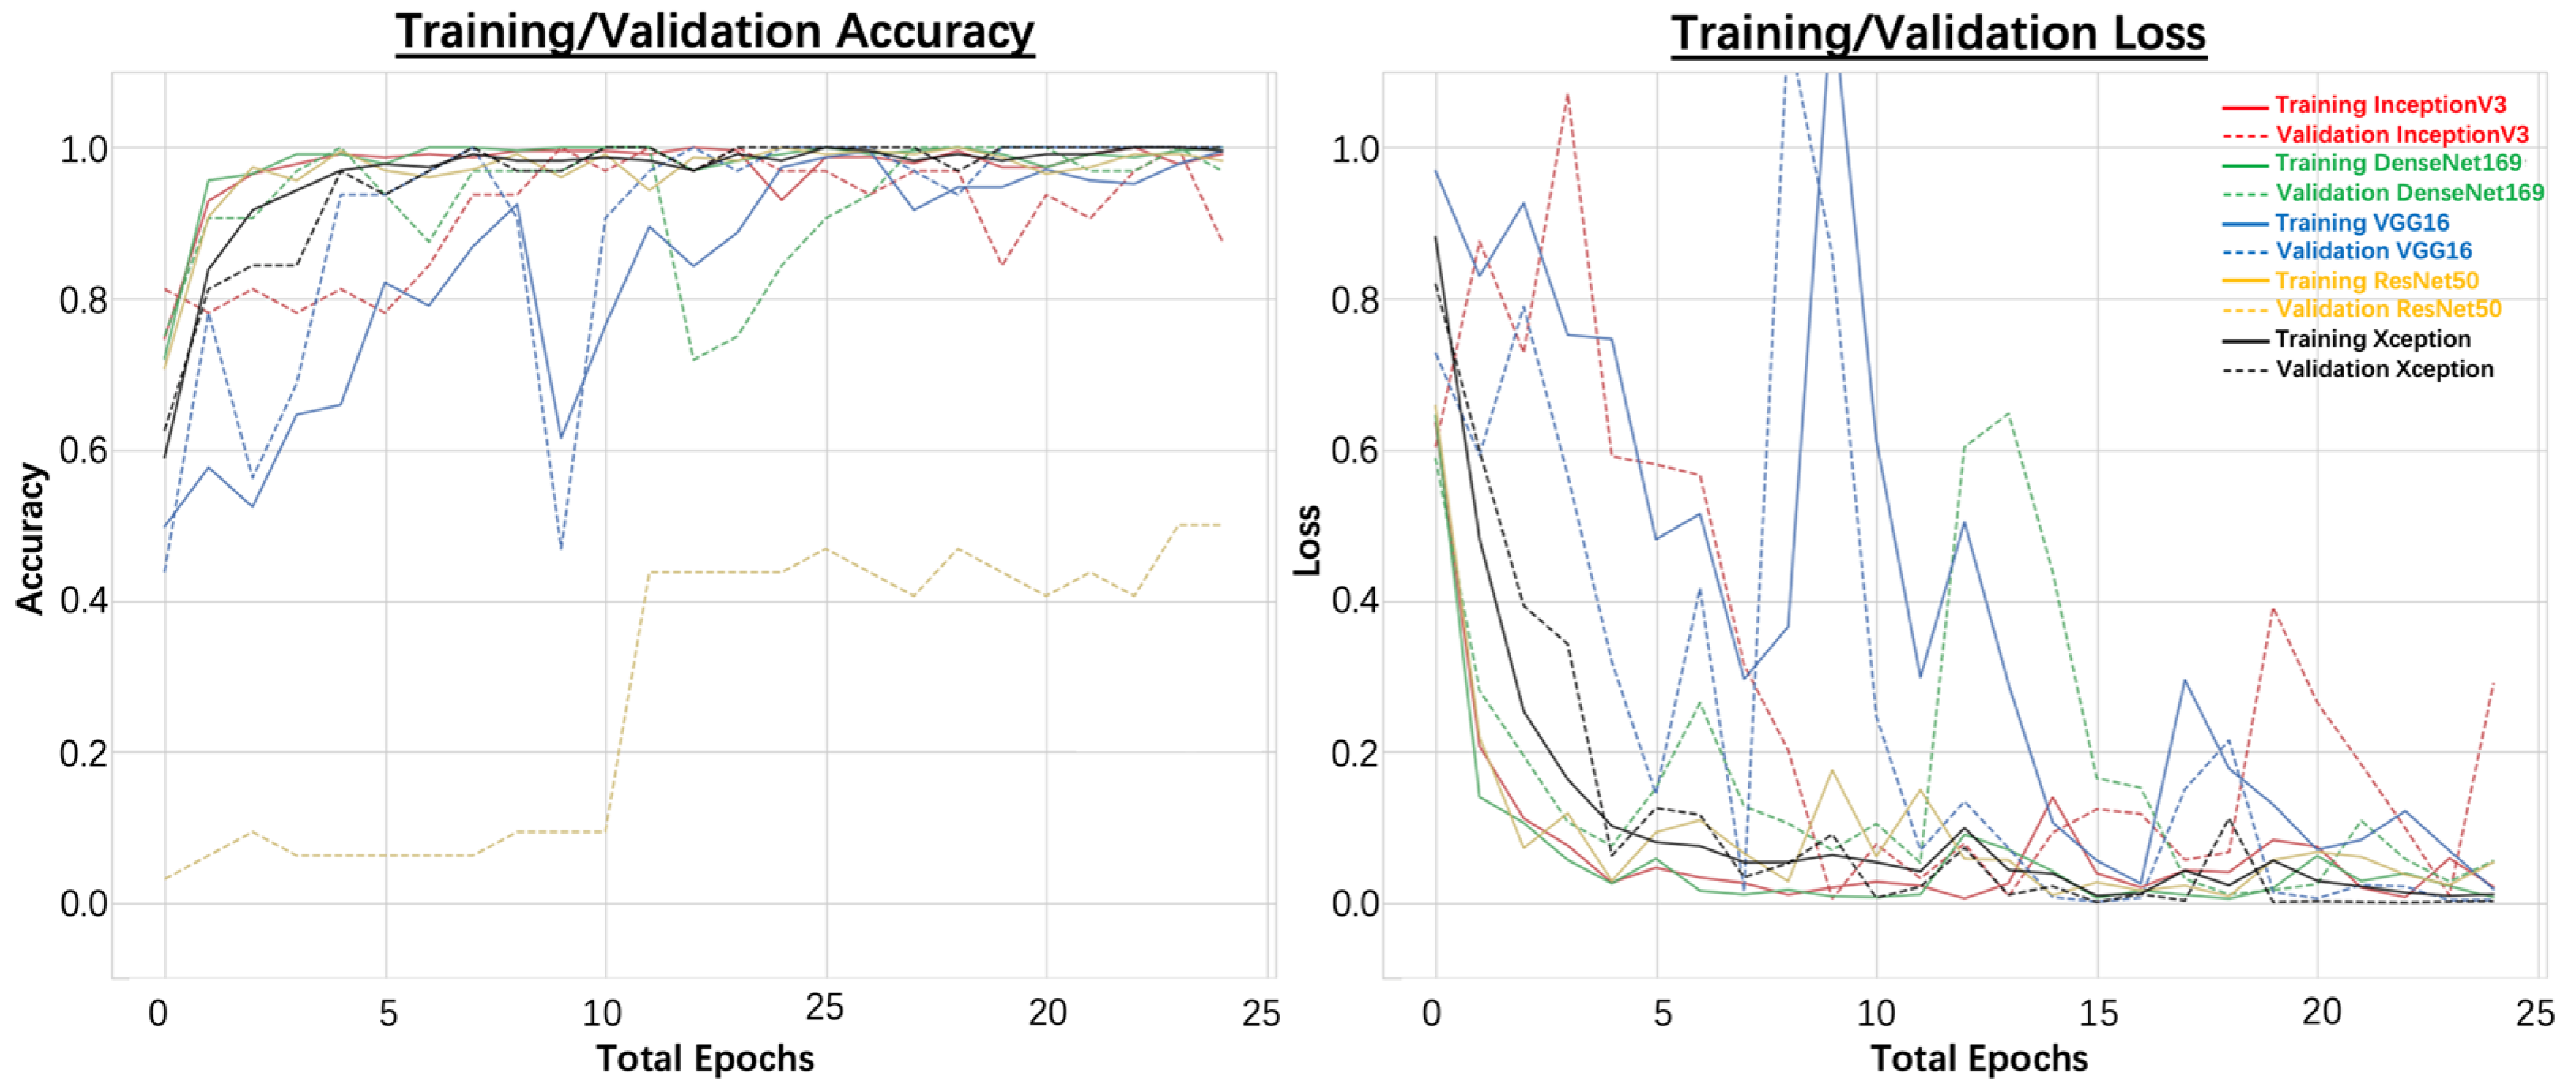
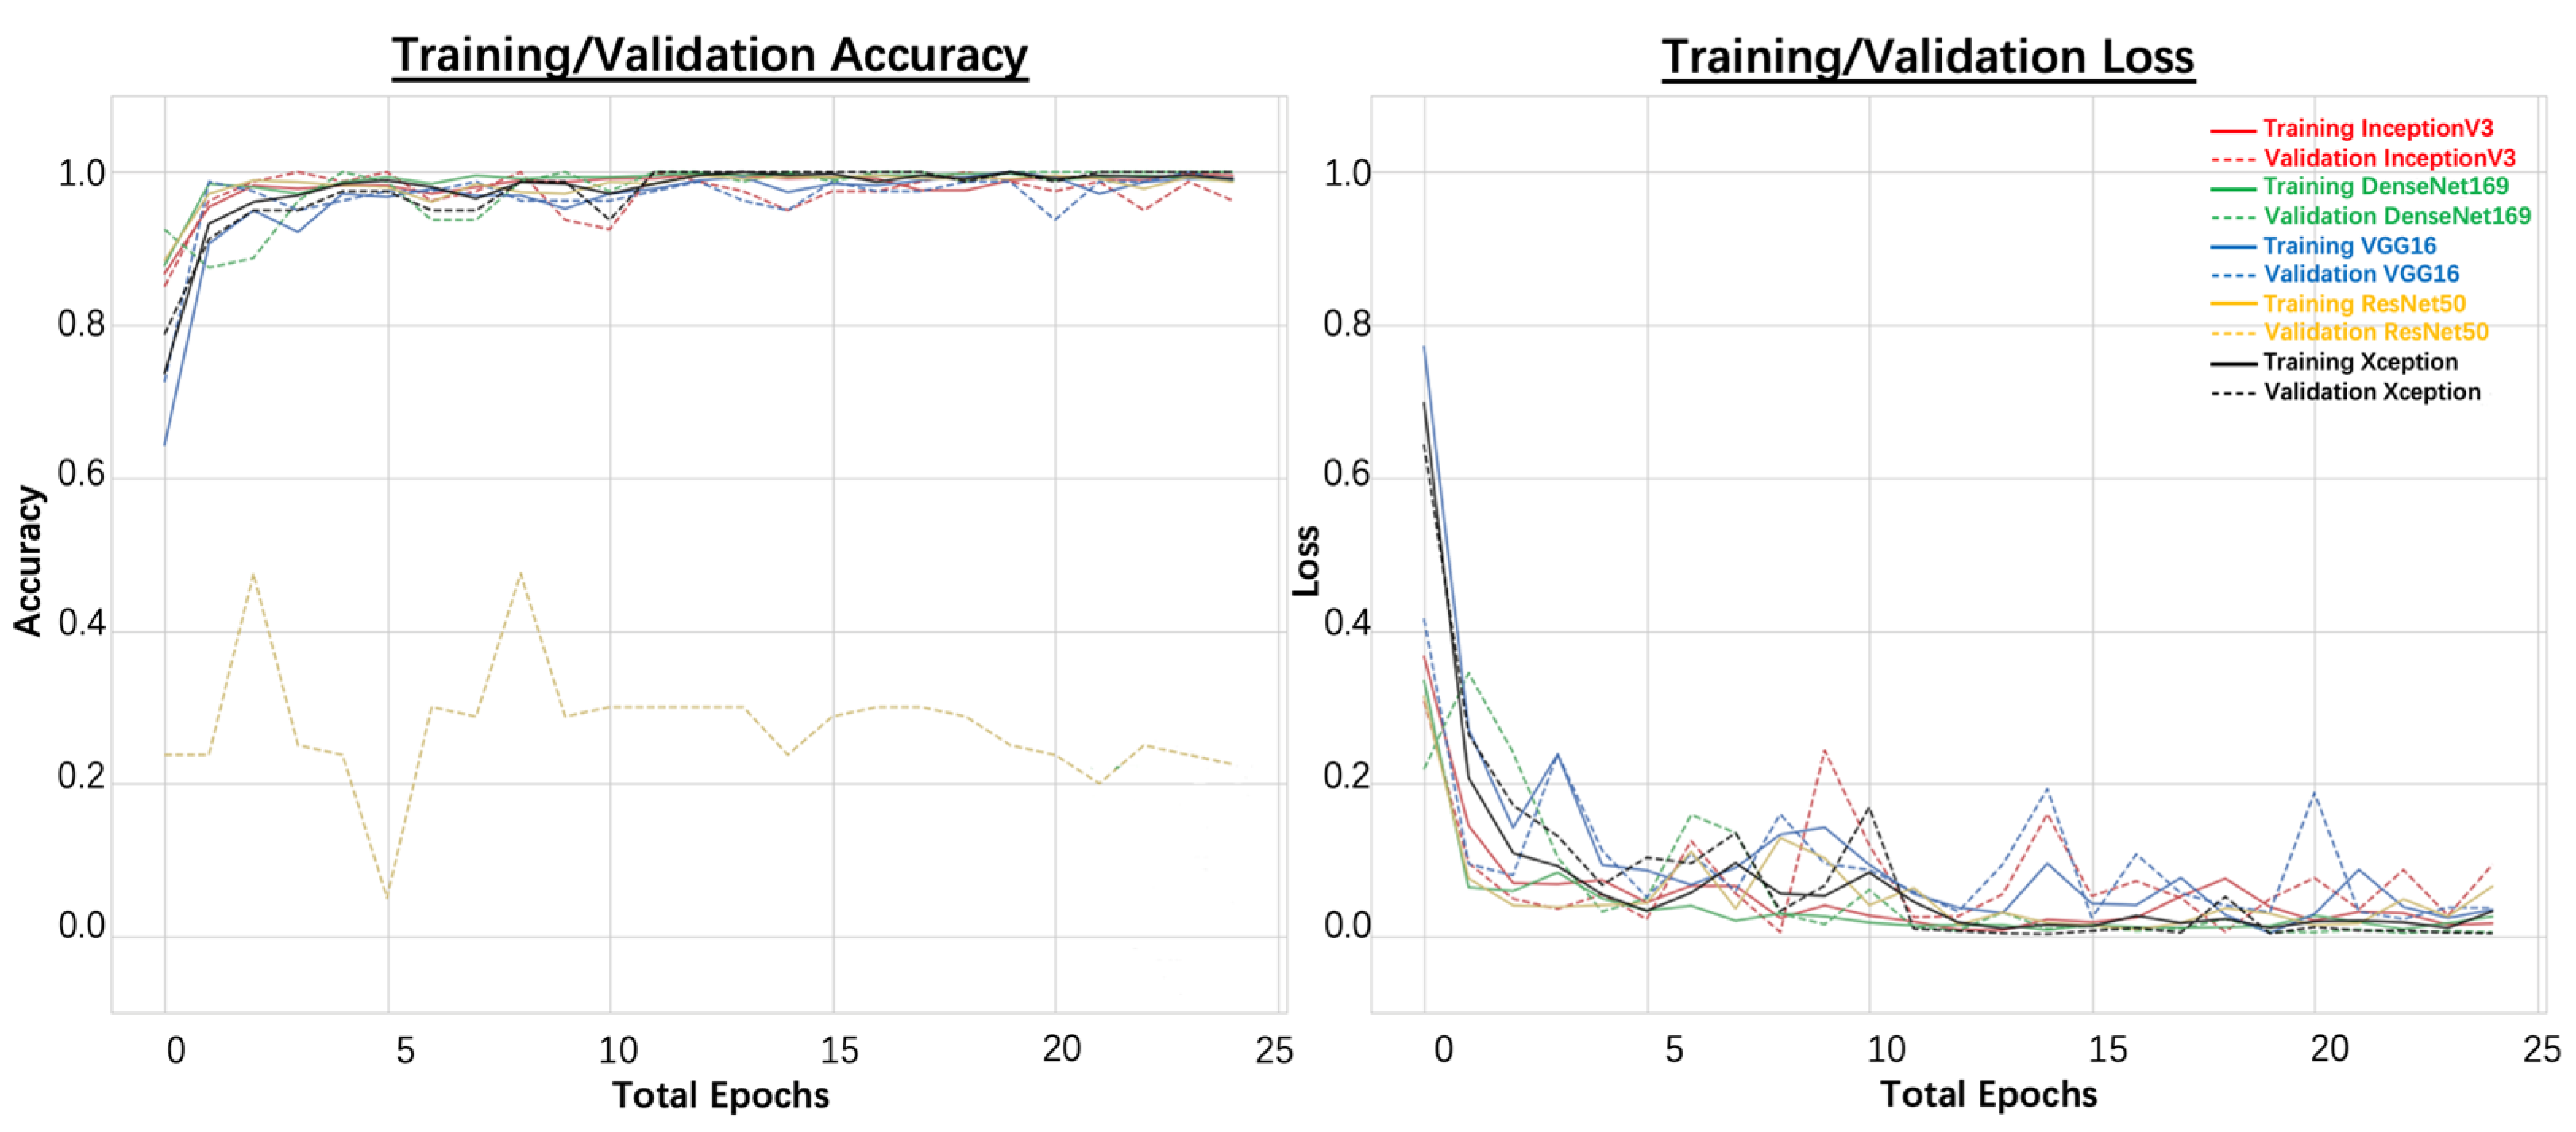
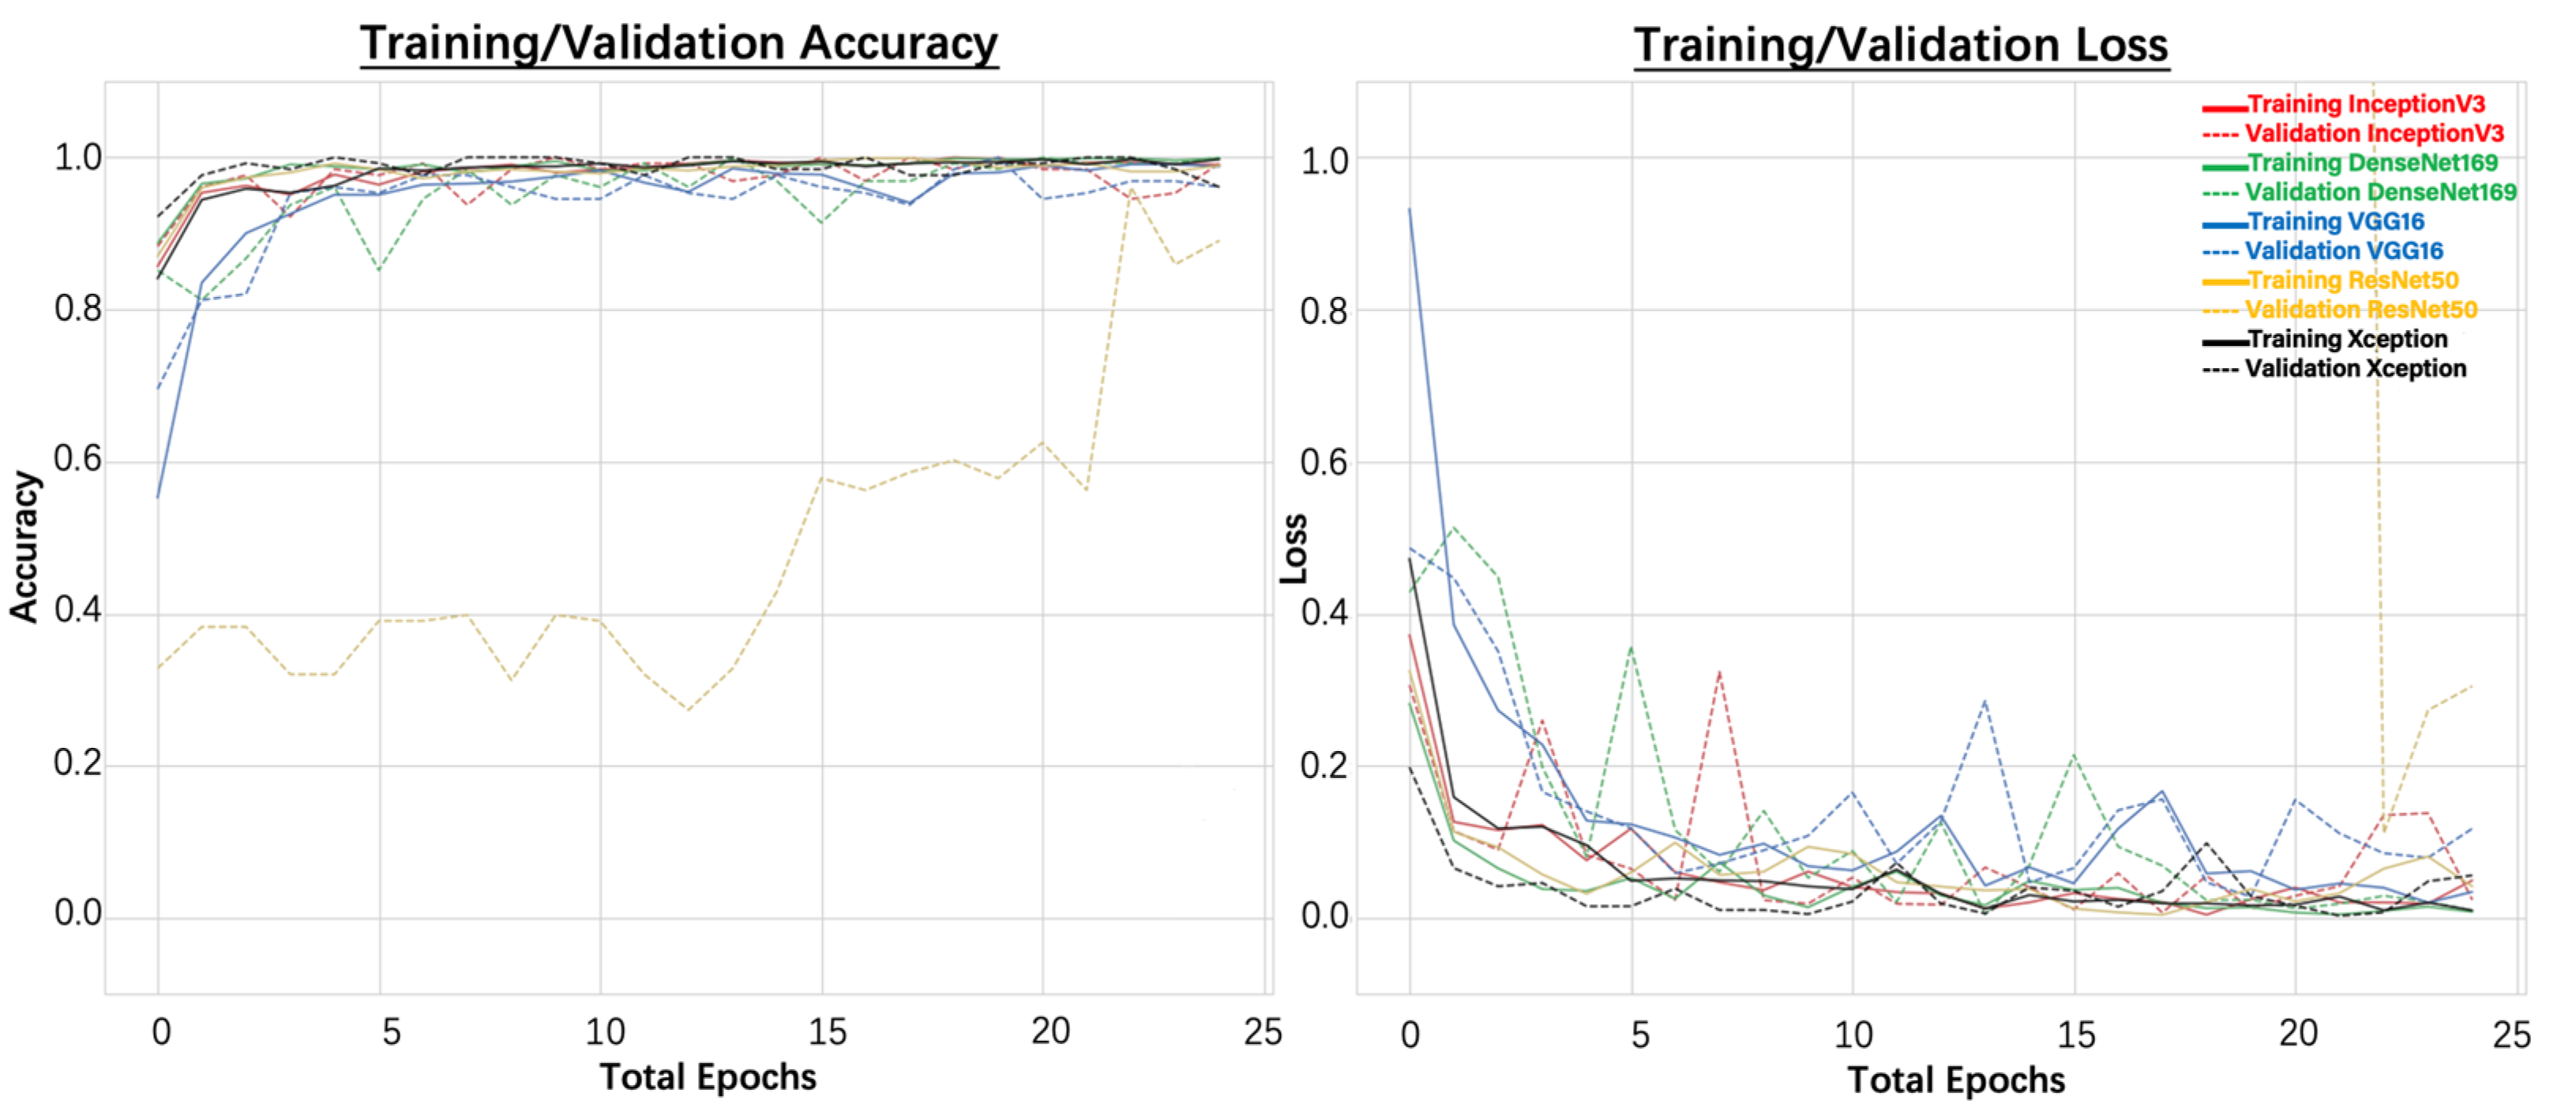
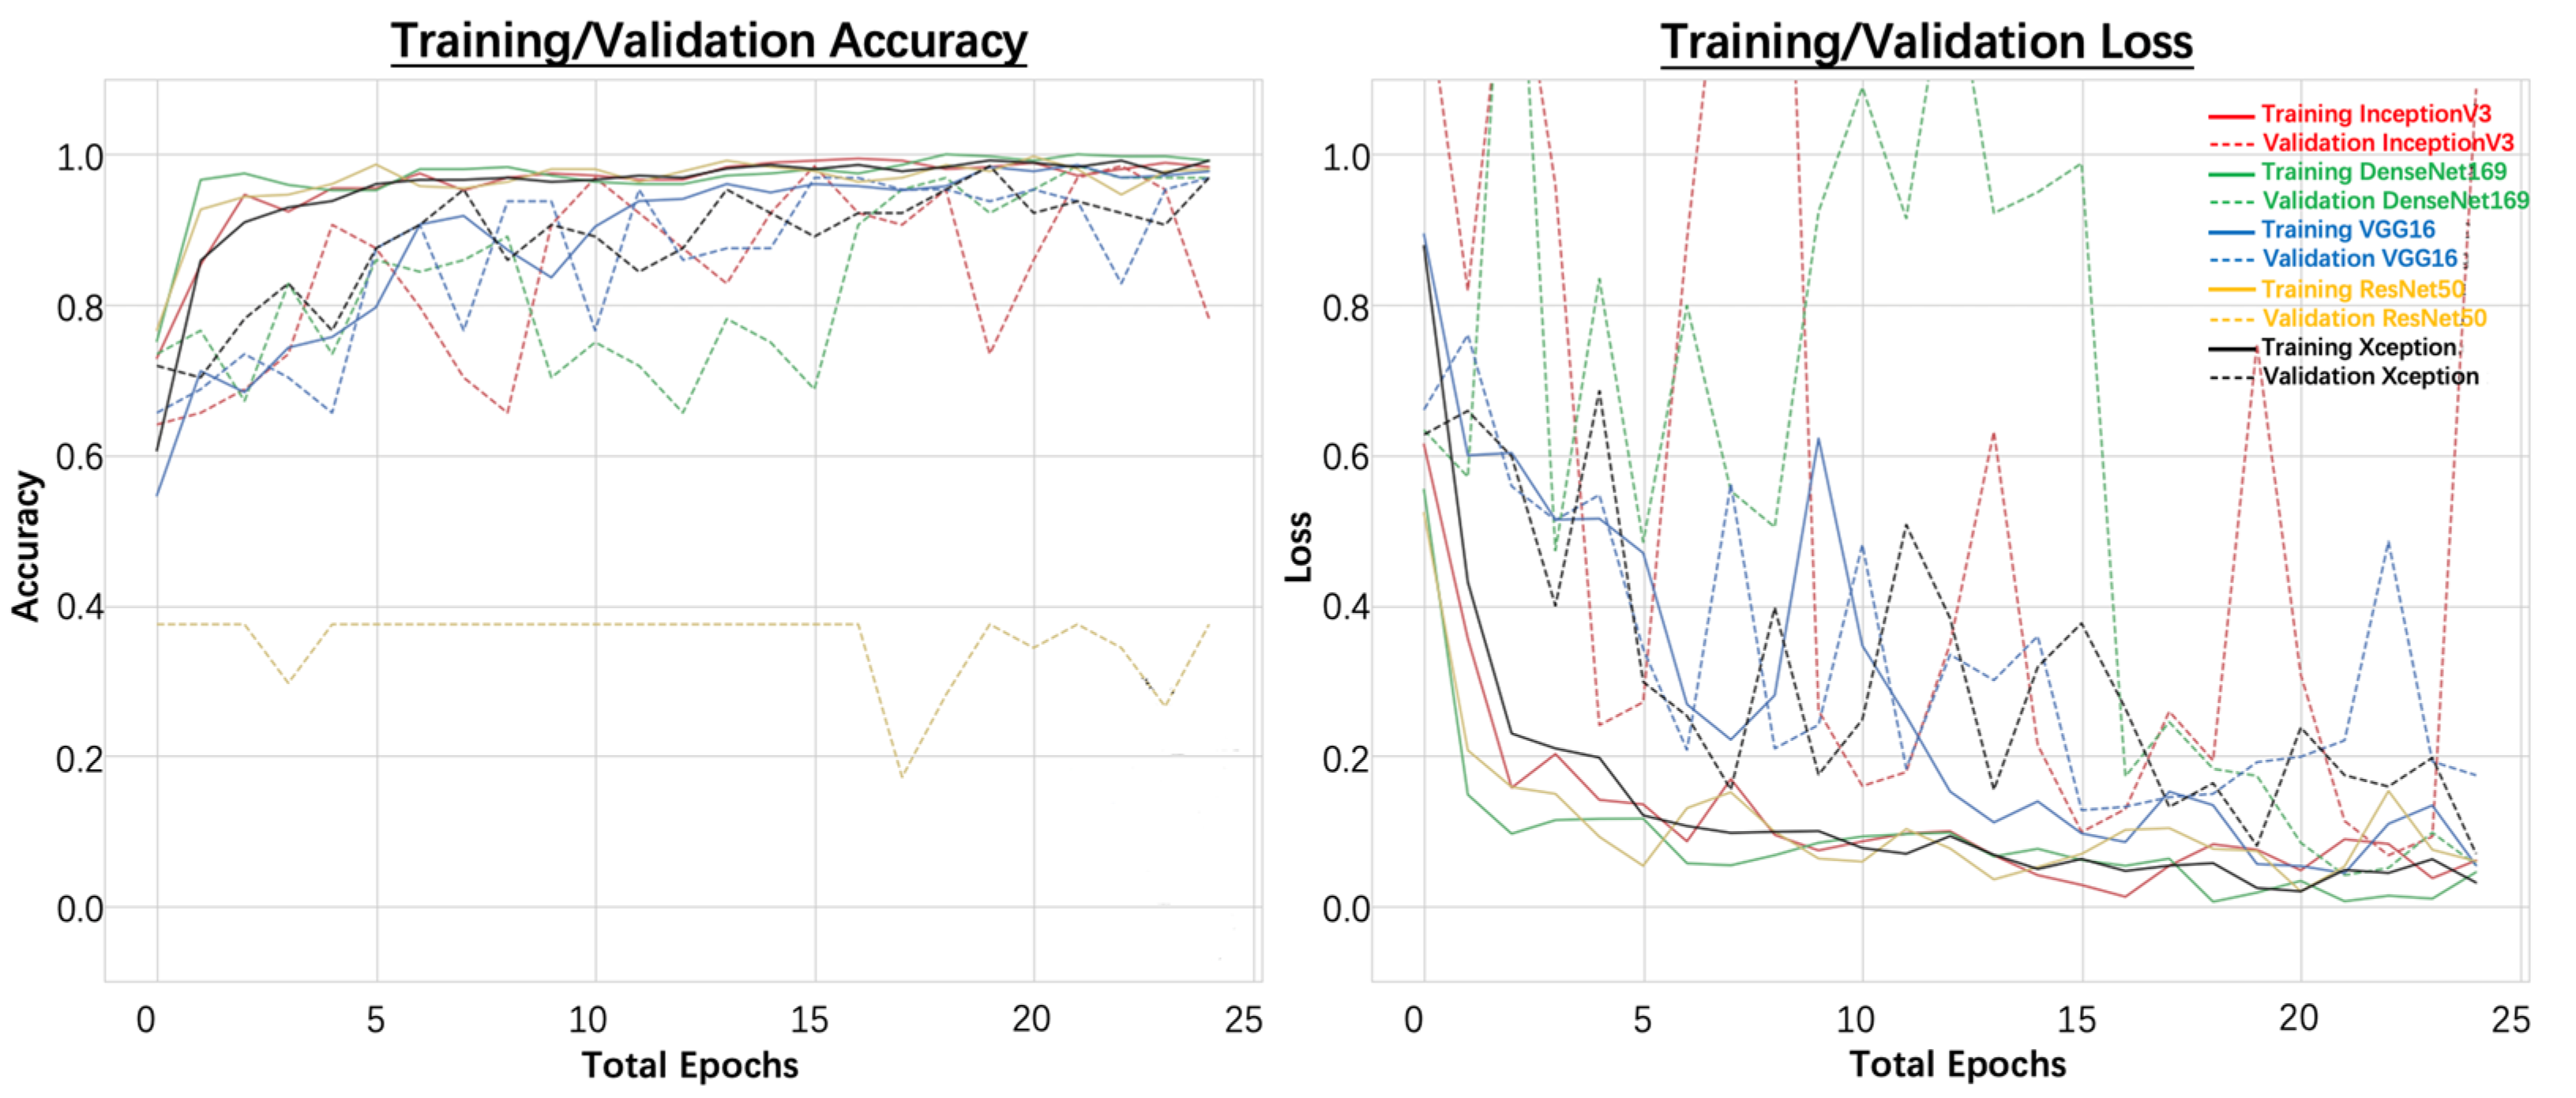
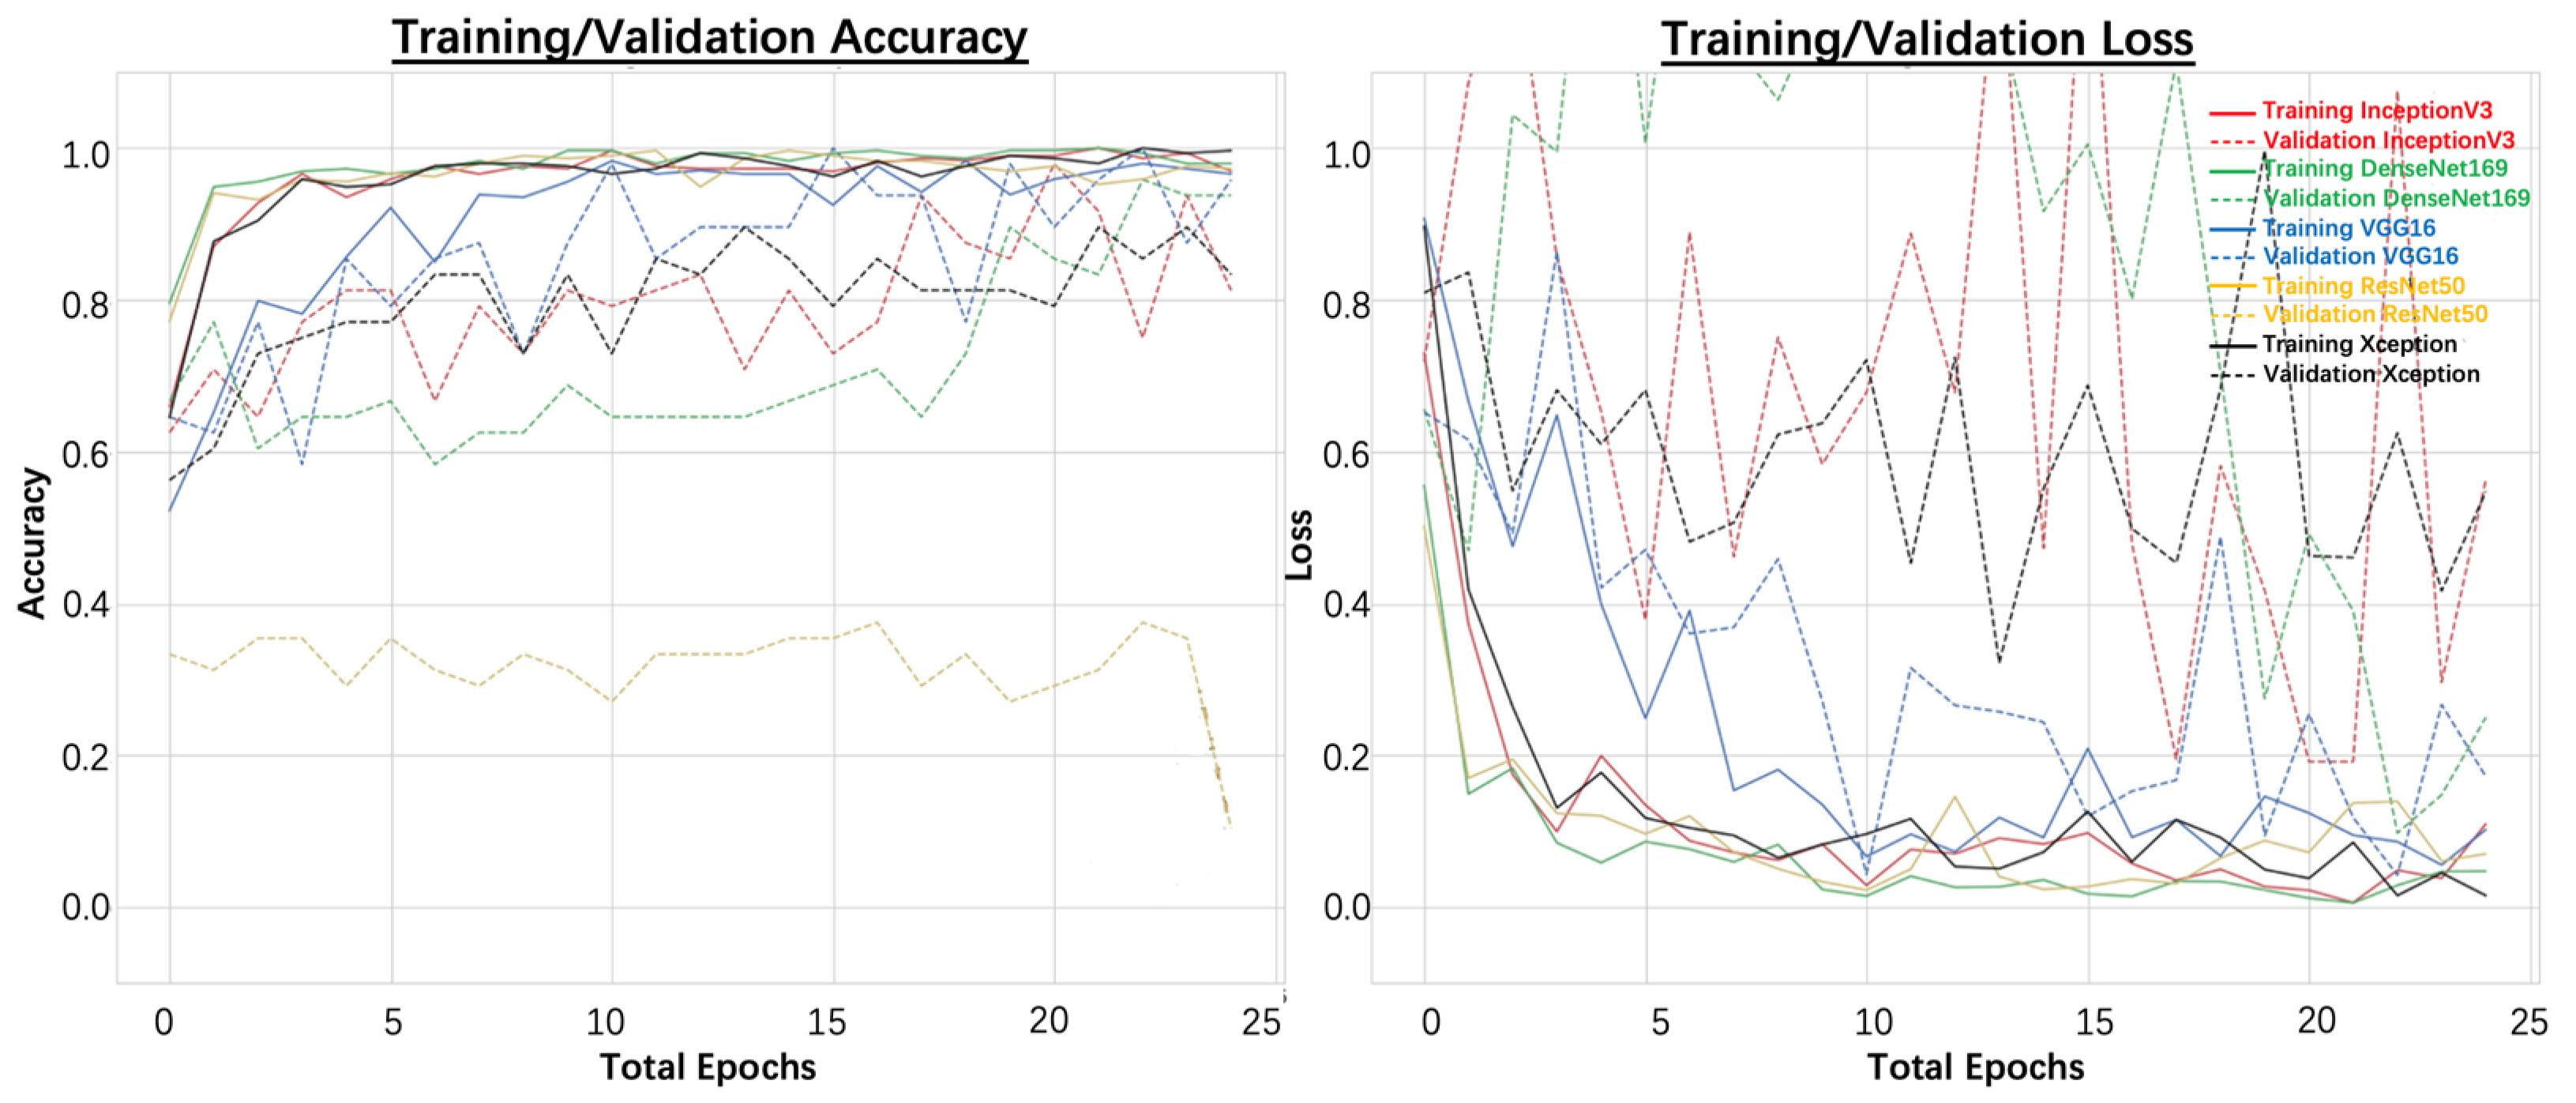
A total of 25 deep learning models were trained for this study using the datasets created using the tile segmentation and SLIC segmentation approaches. Using each of the DNN architectures, five models were trained for the tile segmentations created using tile sizes of 250 × 250, 500 × 500, and 1000 × 1000 pixels. The same five DNN architectures were then used to train the superpixel datasets that were created using compactness (m) values of 5 and 10. Before training the models, the data augmentation techniques were used. Each image was augmented using the built-in TensorFlow functions by rotating, flipping, and zooming the images. In addition, each image was converted into tensors of input size corresponding to the input image size requirements for each DNN architecture. For VGG16, ResNet50, DenseNet169, and Xception, the training images were resized to 224 × 224 pixels. The input image size for InceptionV3 was 299 × 299 pixels. Each model was trained for 25 epochs with a learning rate of 0.0001, the ADAM optimizer, and a batch size of 32. The categorical cross-entropy loss function was also used. After training all the models, different metrics were used for evaluating and comparing their performances.

2.3. Evaluation Metrics

Two primary evaluation matrices were utilized to evaluate the trained deep learning models: confusion matrices and testing accuracies.
t e s t i n g   a c c u r a c y = T P + F N T P + F P + T N + F P
where TP = true positive, FP = false positive, TN = true negative, FN = false negative.

2.4. GeoDLS: Web and Smartphone Application for Disease Region Identification

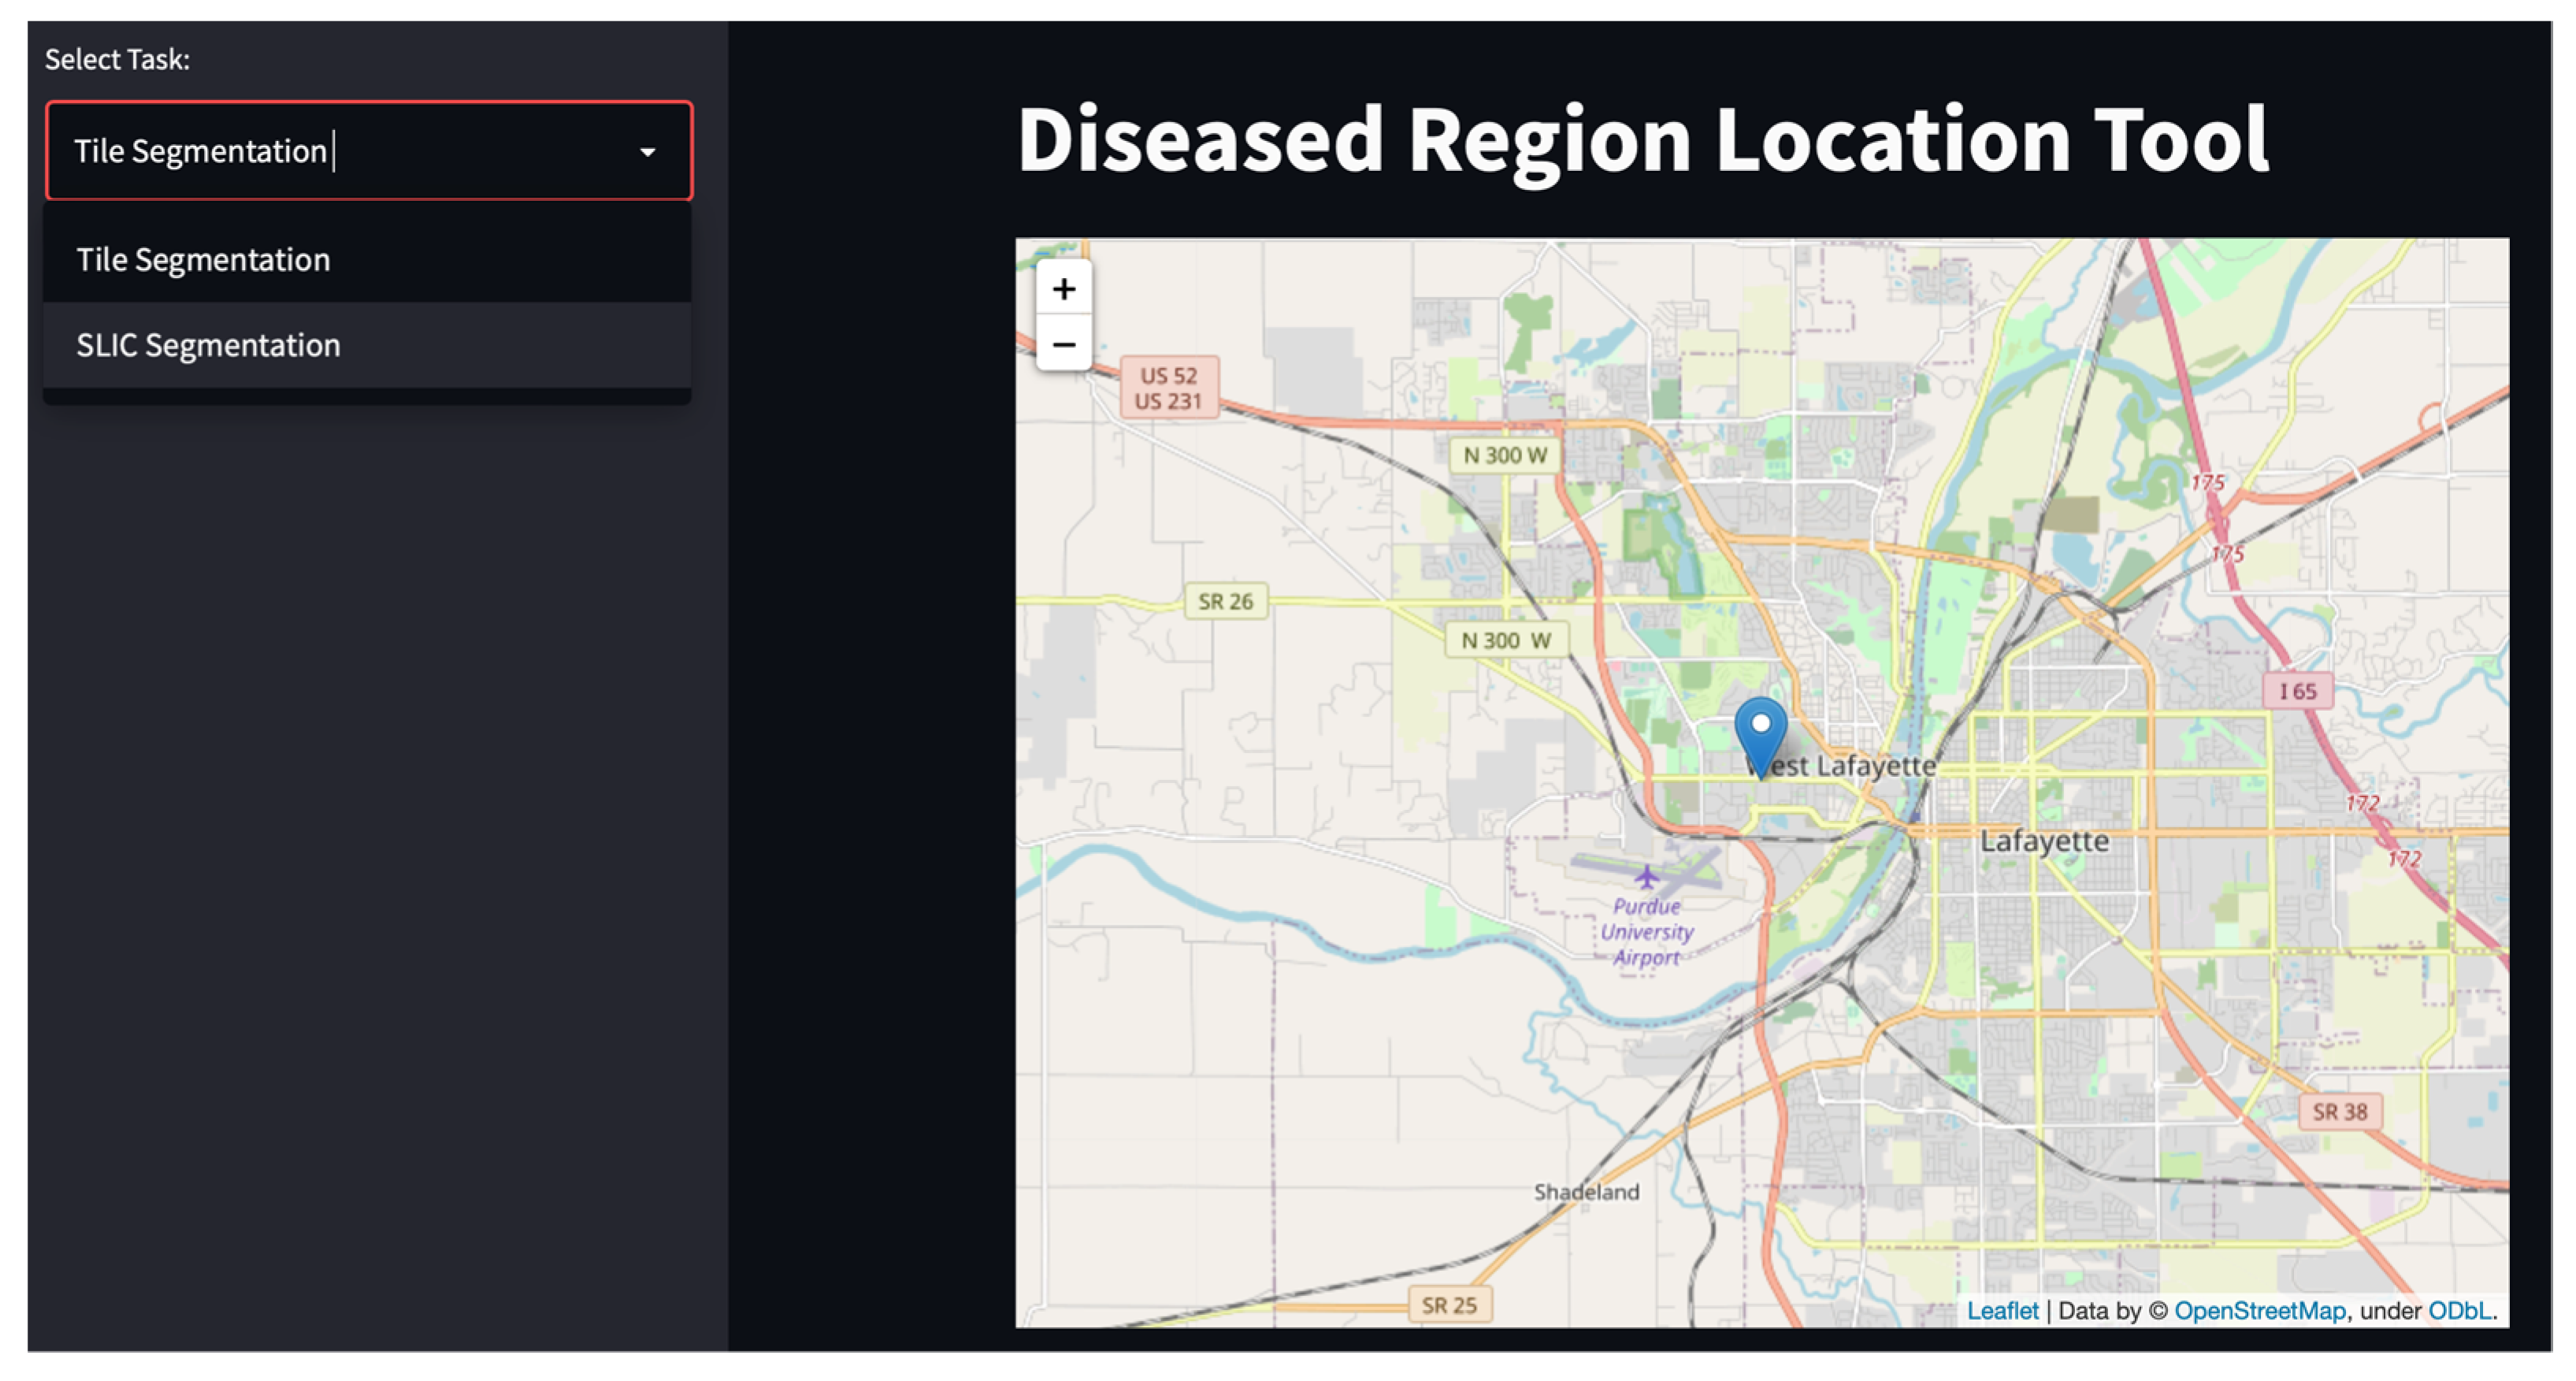
After training and comparing the deep learning models for accurately locating and identifying diseased regions within corn fields from UAS imagery, a disease region identification tool named Geo Disease Location System (GeoDLS) was developed for use via web browsers and smartphones. The “Streamlit” Python library was used for creating the application. Streamlit is a library that helps to easily deploy deep learning models for various tasks. In addition, Streamlit offers multiple additional promising tools to help users easily upload images for analysis.
The home page was developed to allow users to use tile segmentation or SLIC segmentation to identify different diseased regions. The application’s title is displayed at the top of the home page. It also shows a map of the farm from where the data were collected.
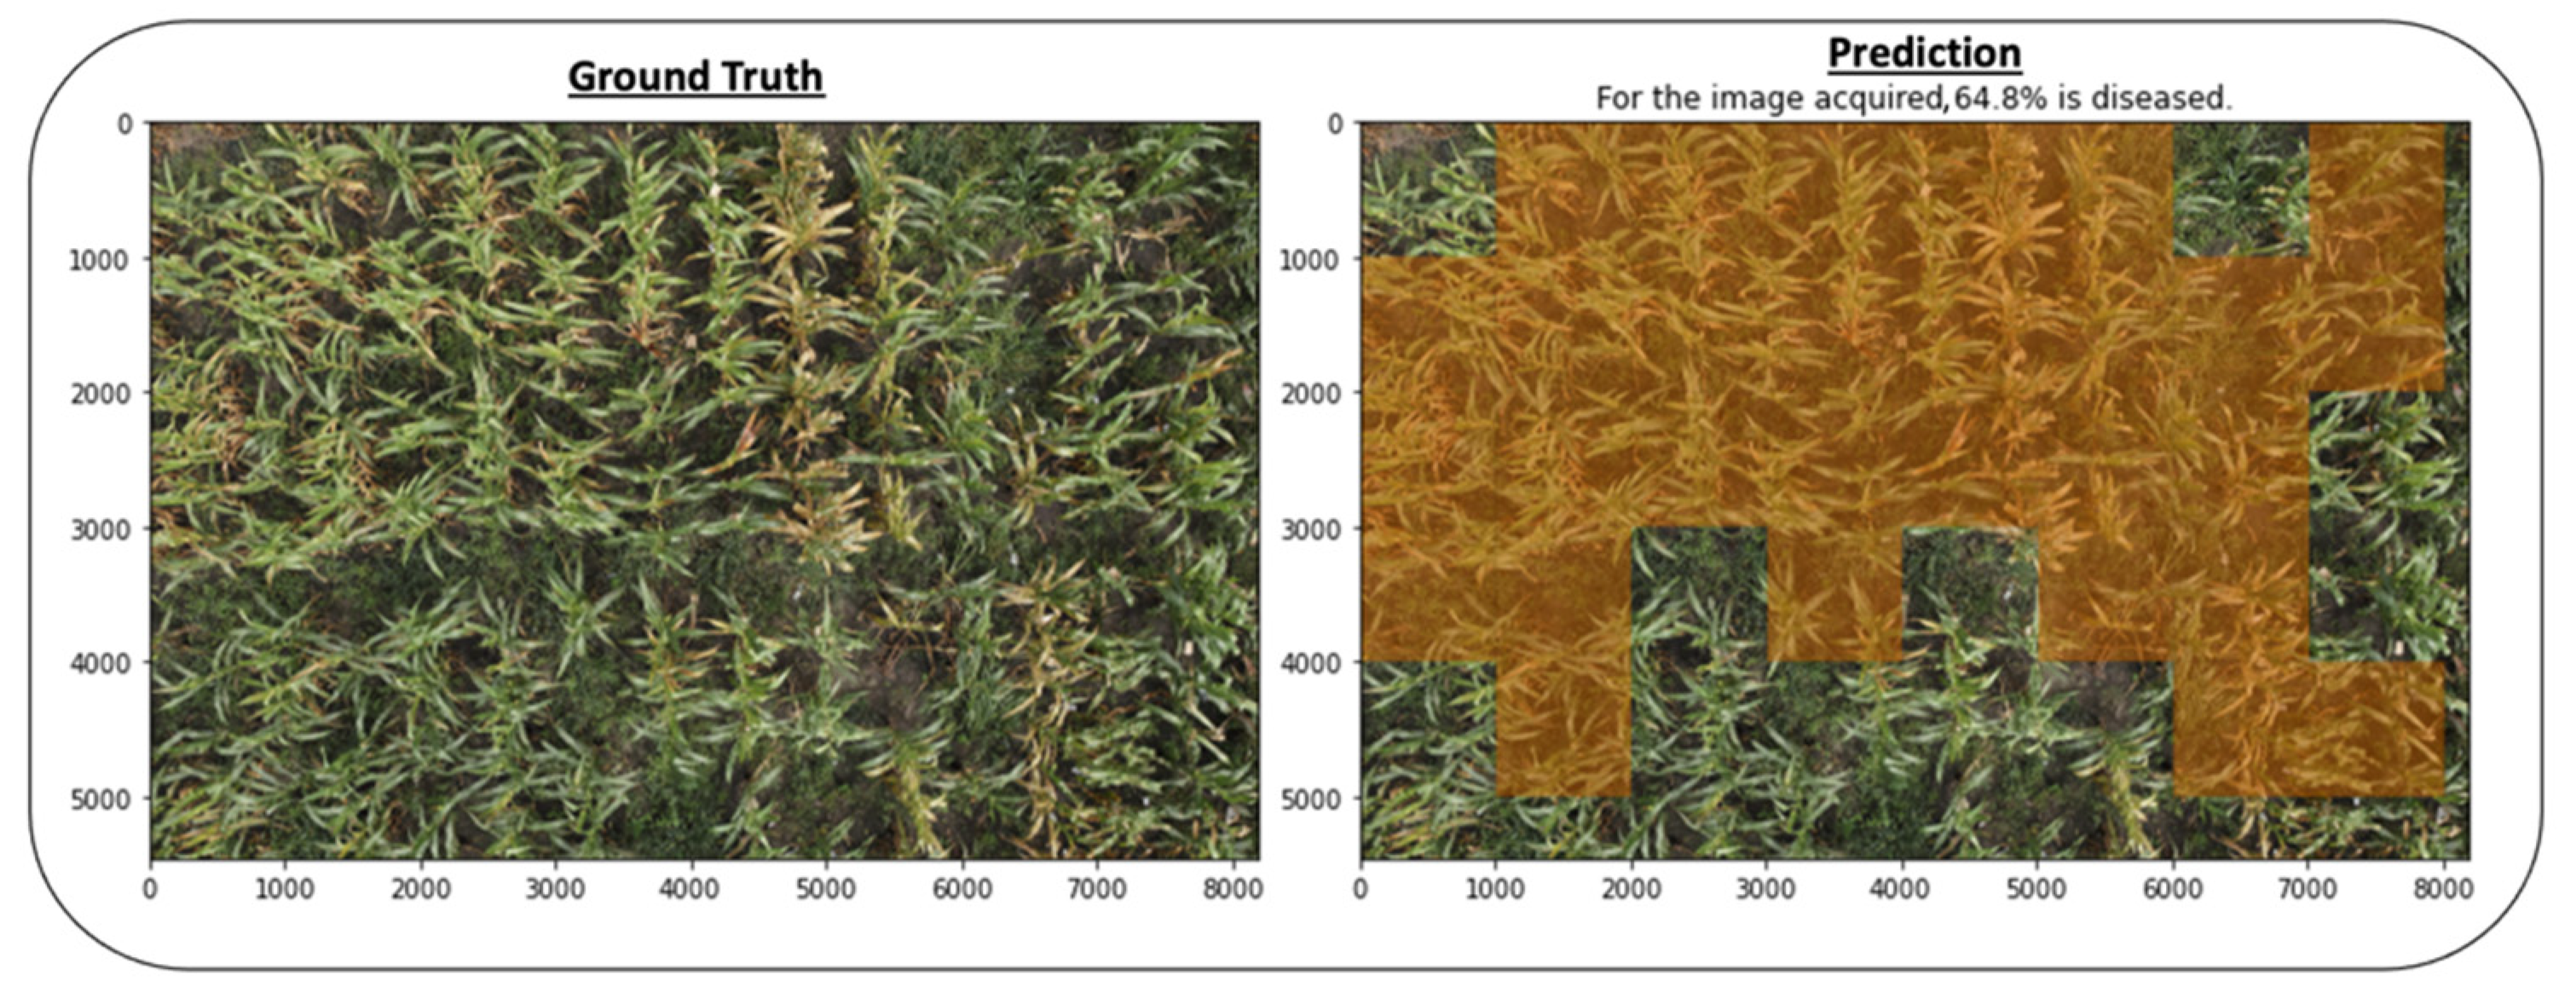
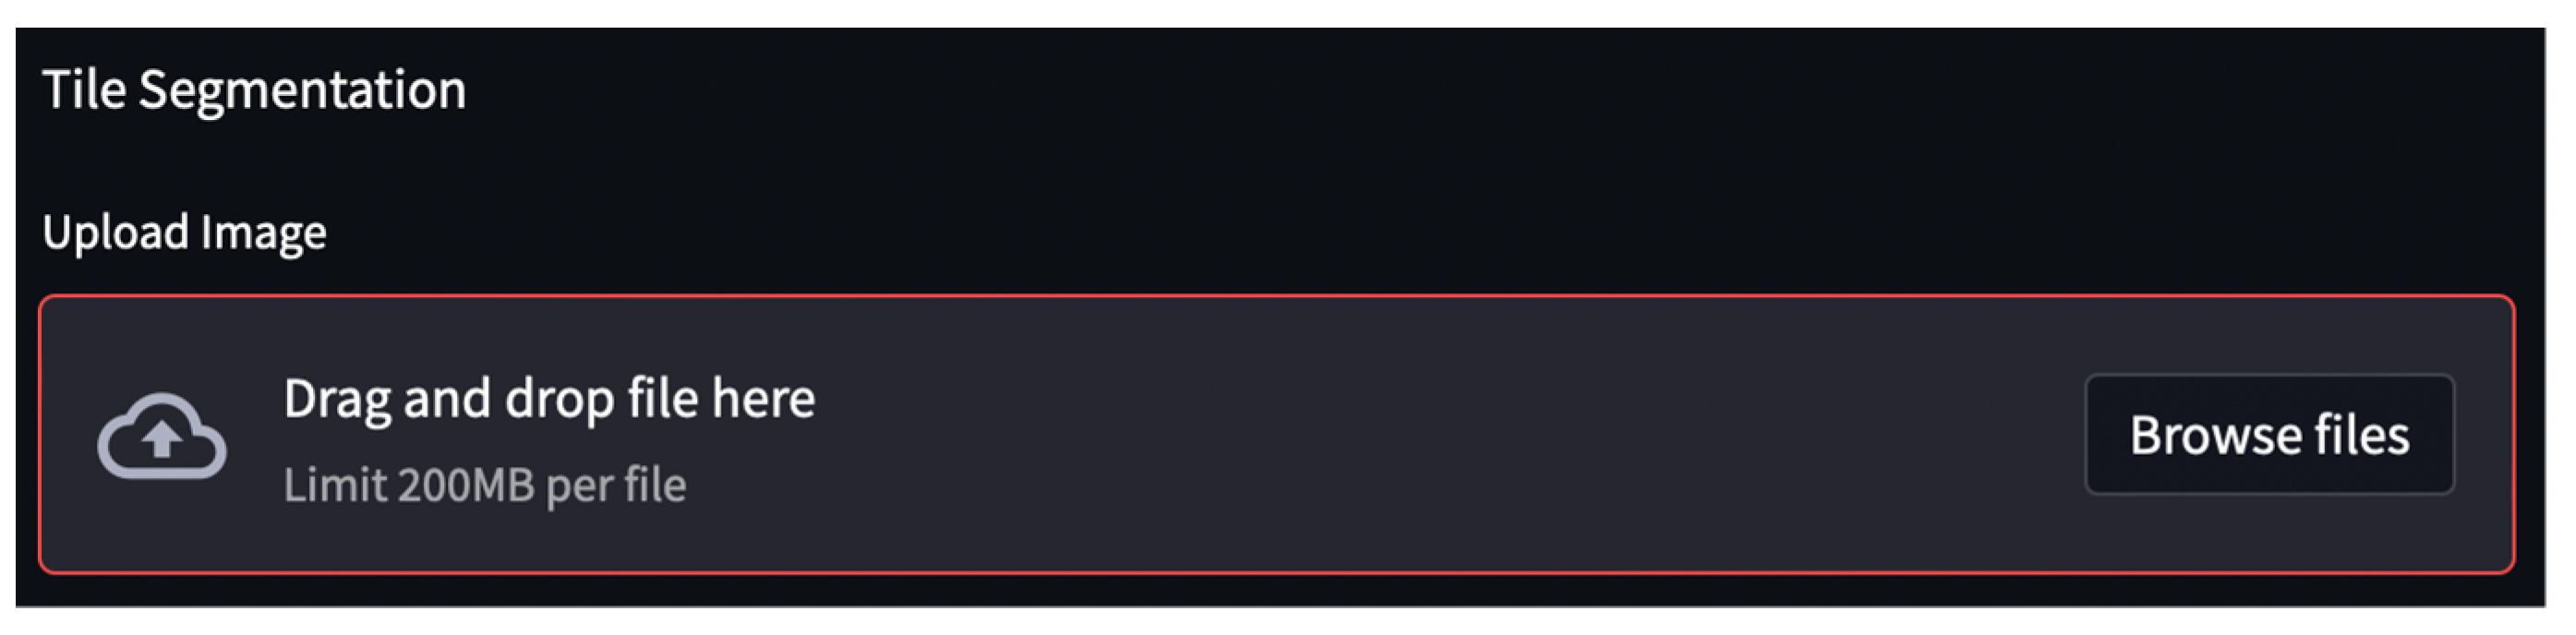
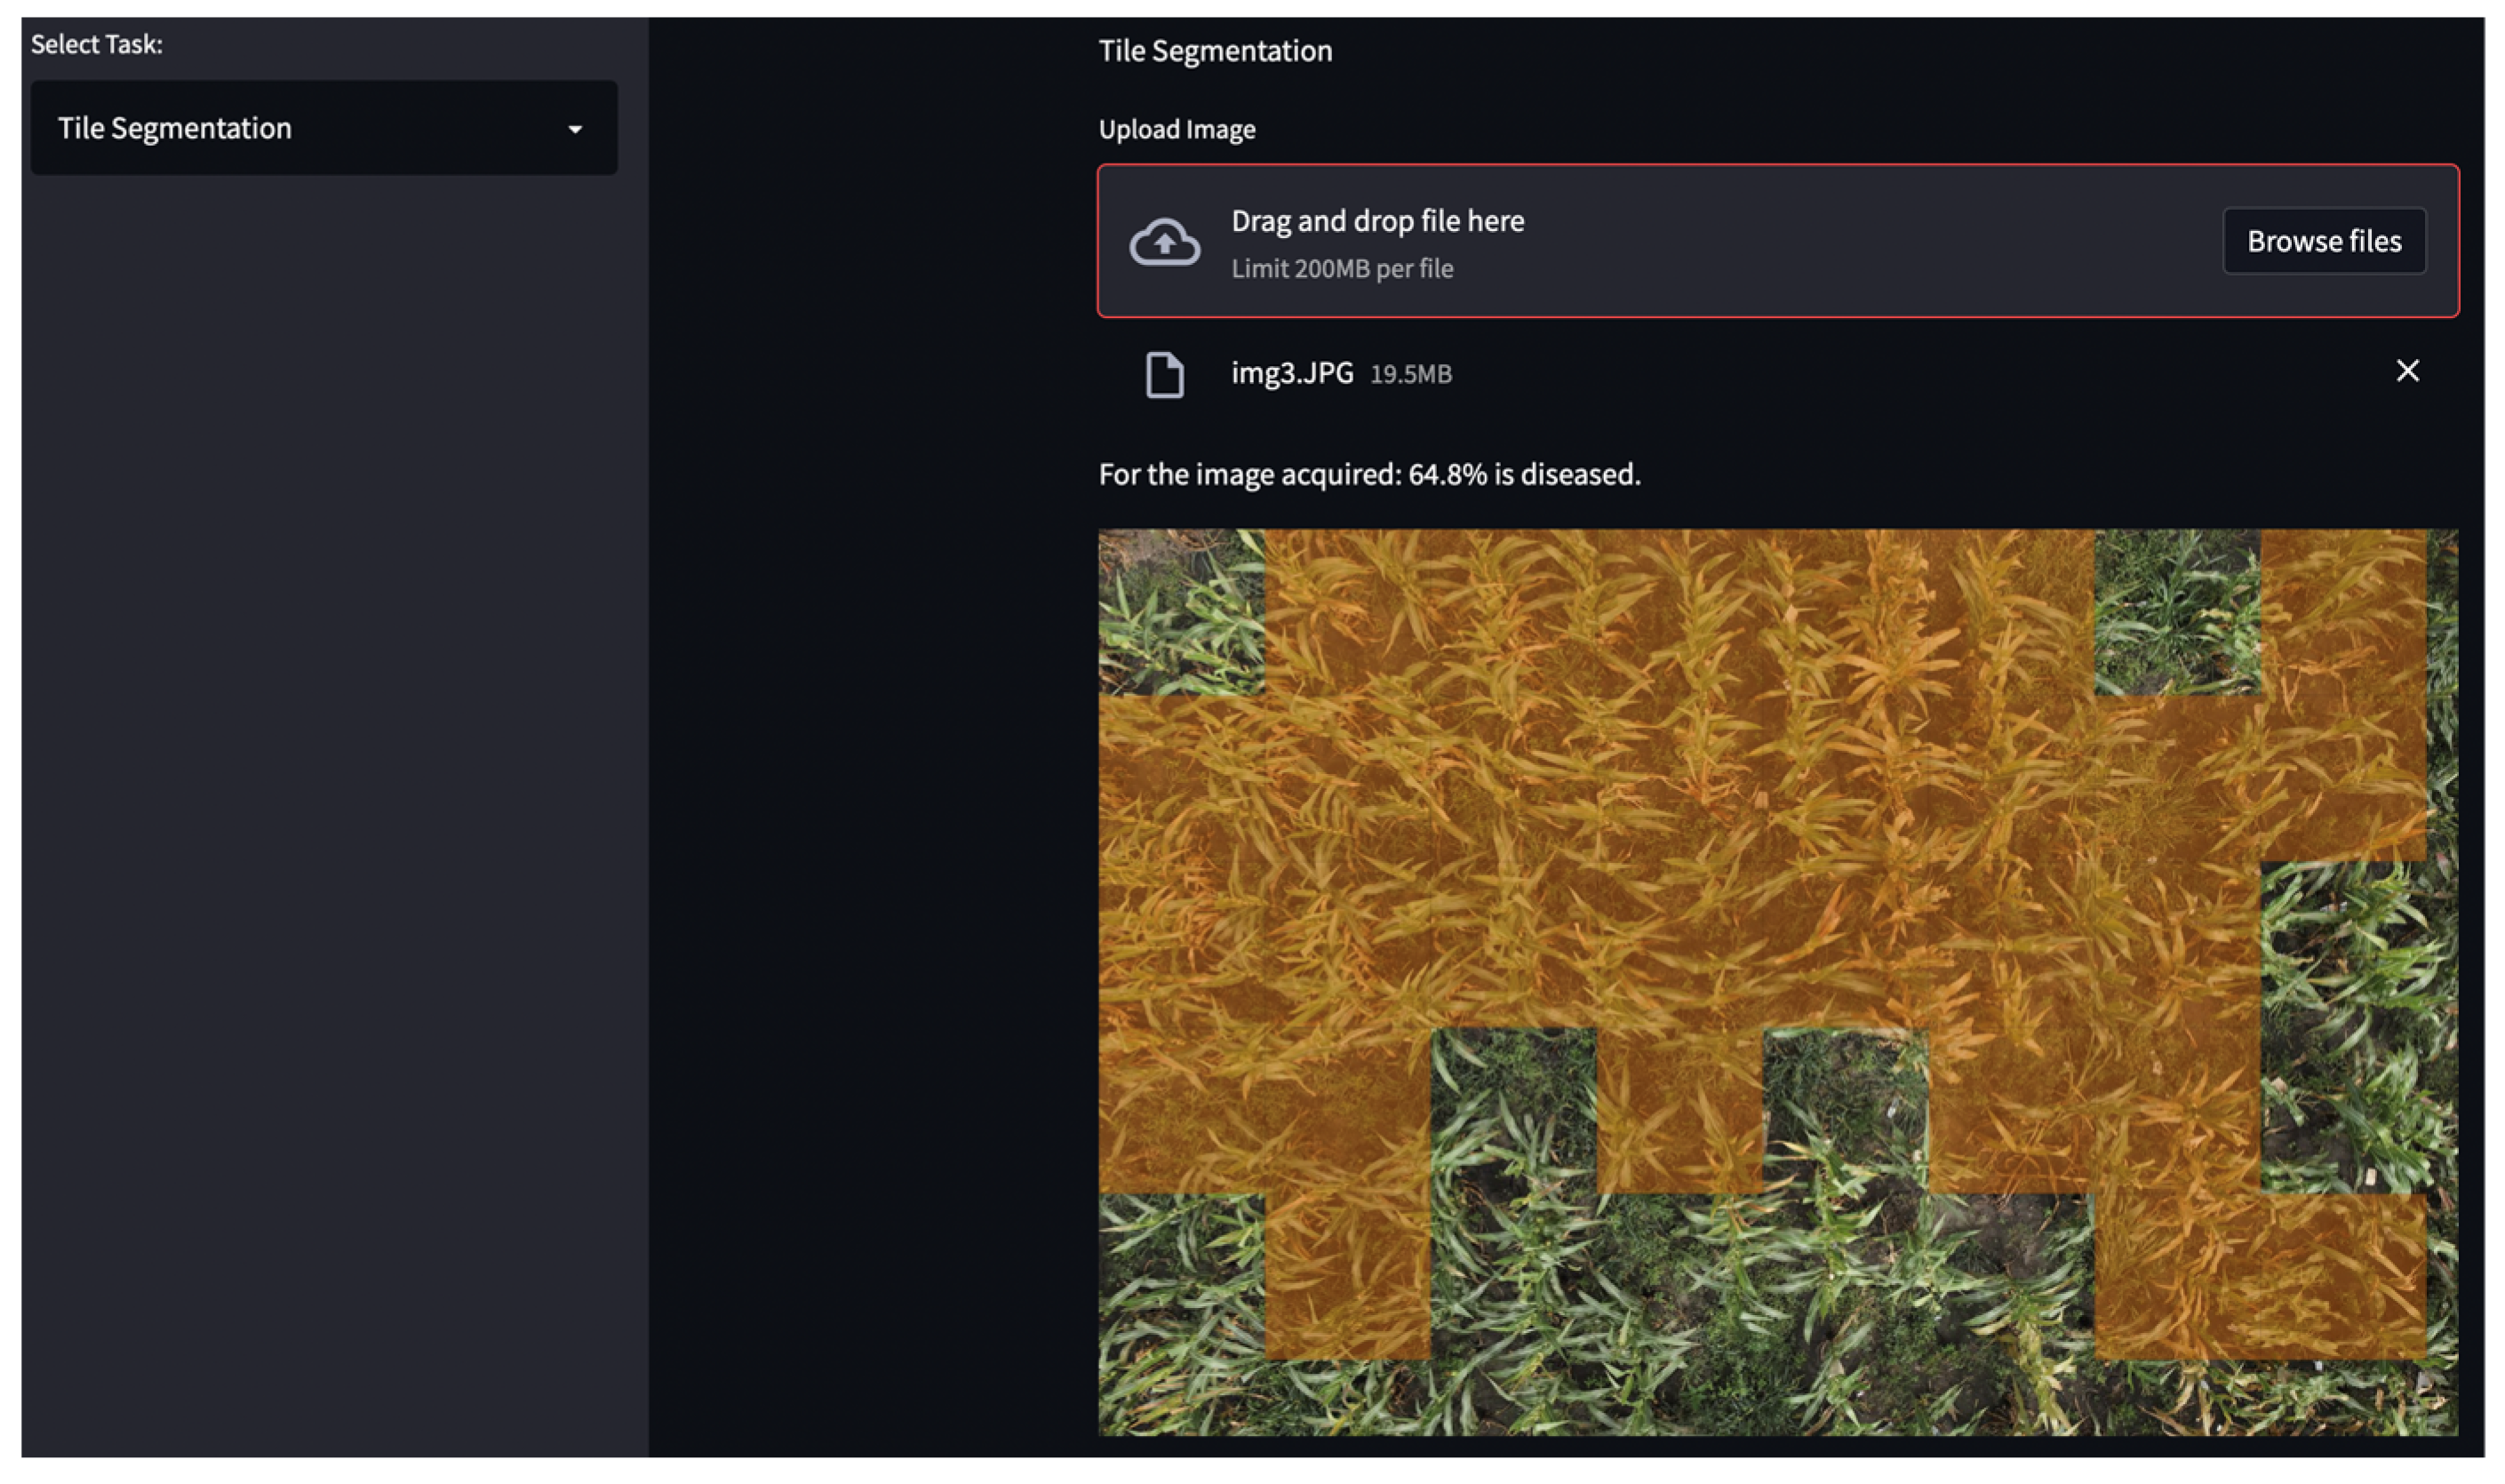
After the user selects the type of segmentation, another prompt is provided to upload an image for analysis. The uploaded image is fed into a sliding window algorithm that iterates over each segment and classifies them as either diseased, healthy, or background using the trained deep learning model. If the region is identified as diseased, it will be highlighted orange on the analyzed image.
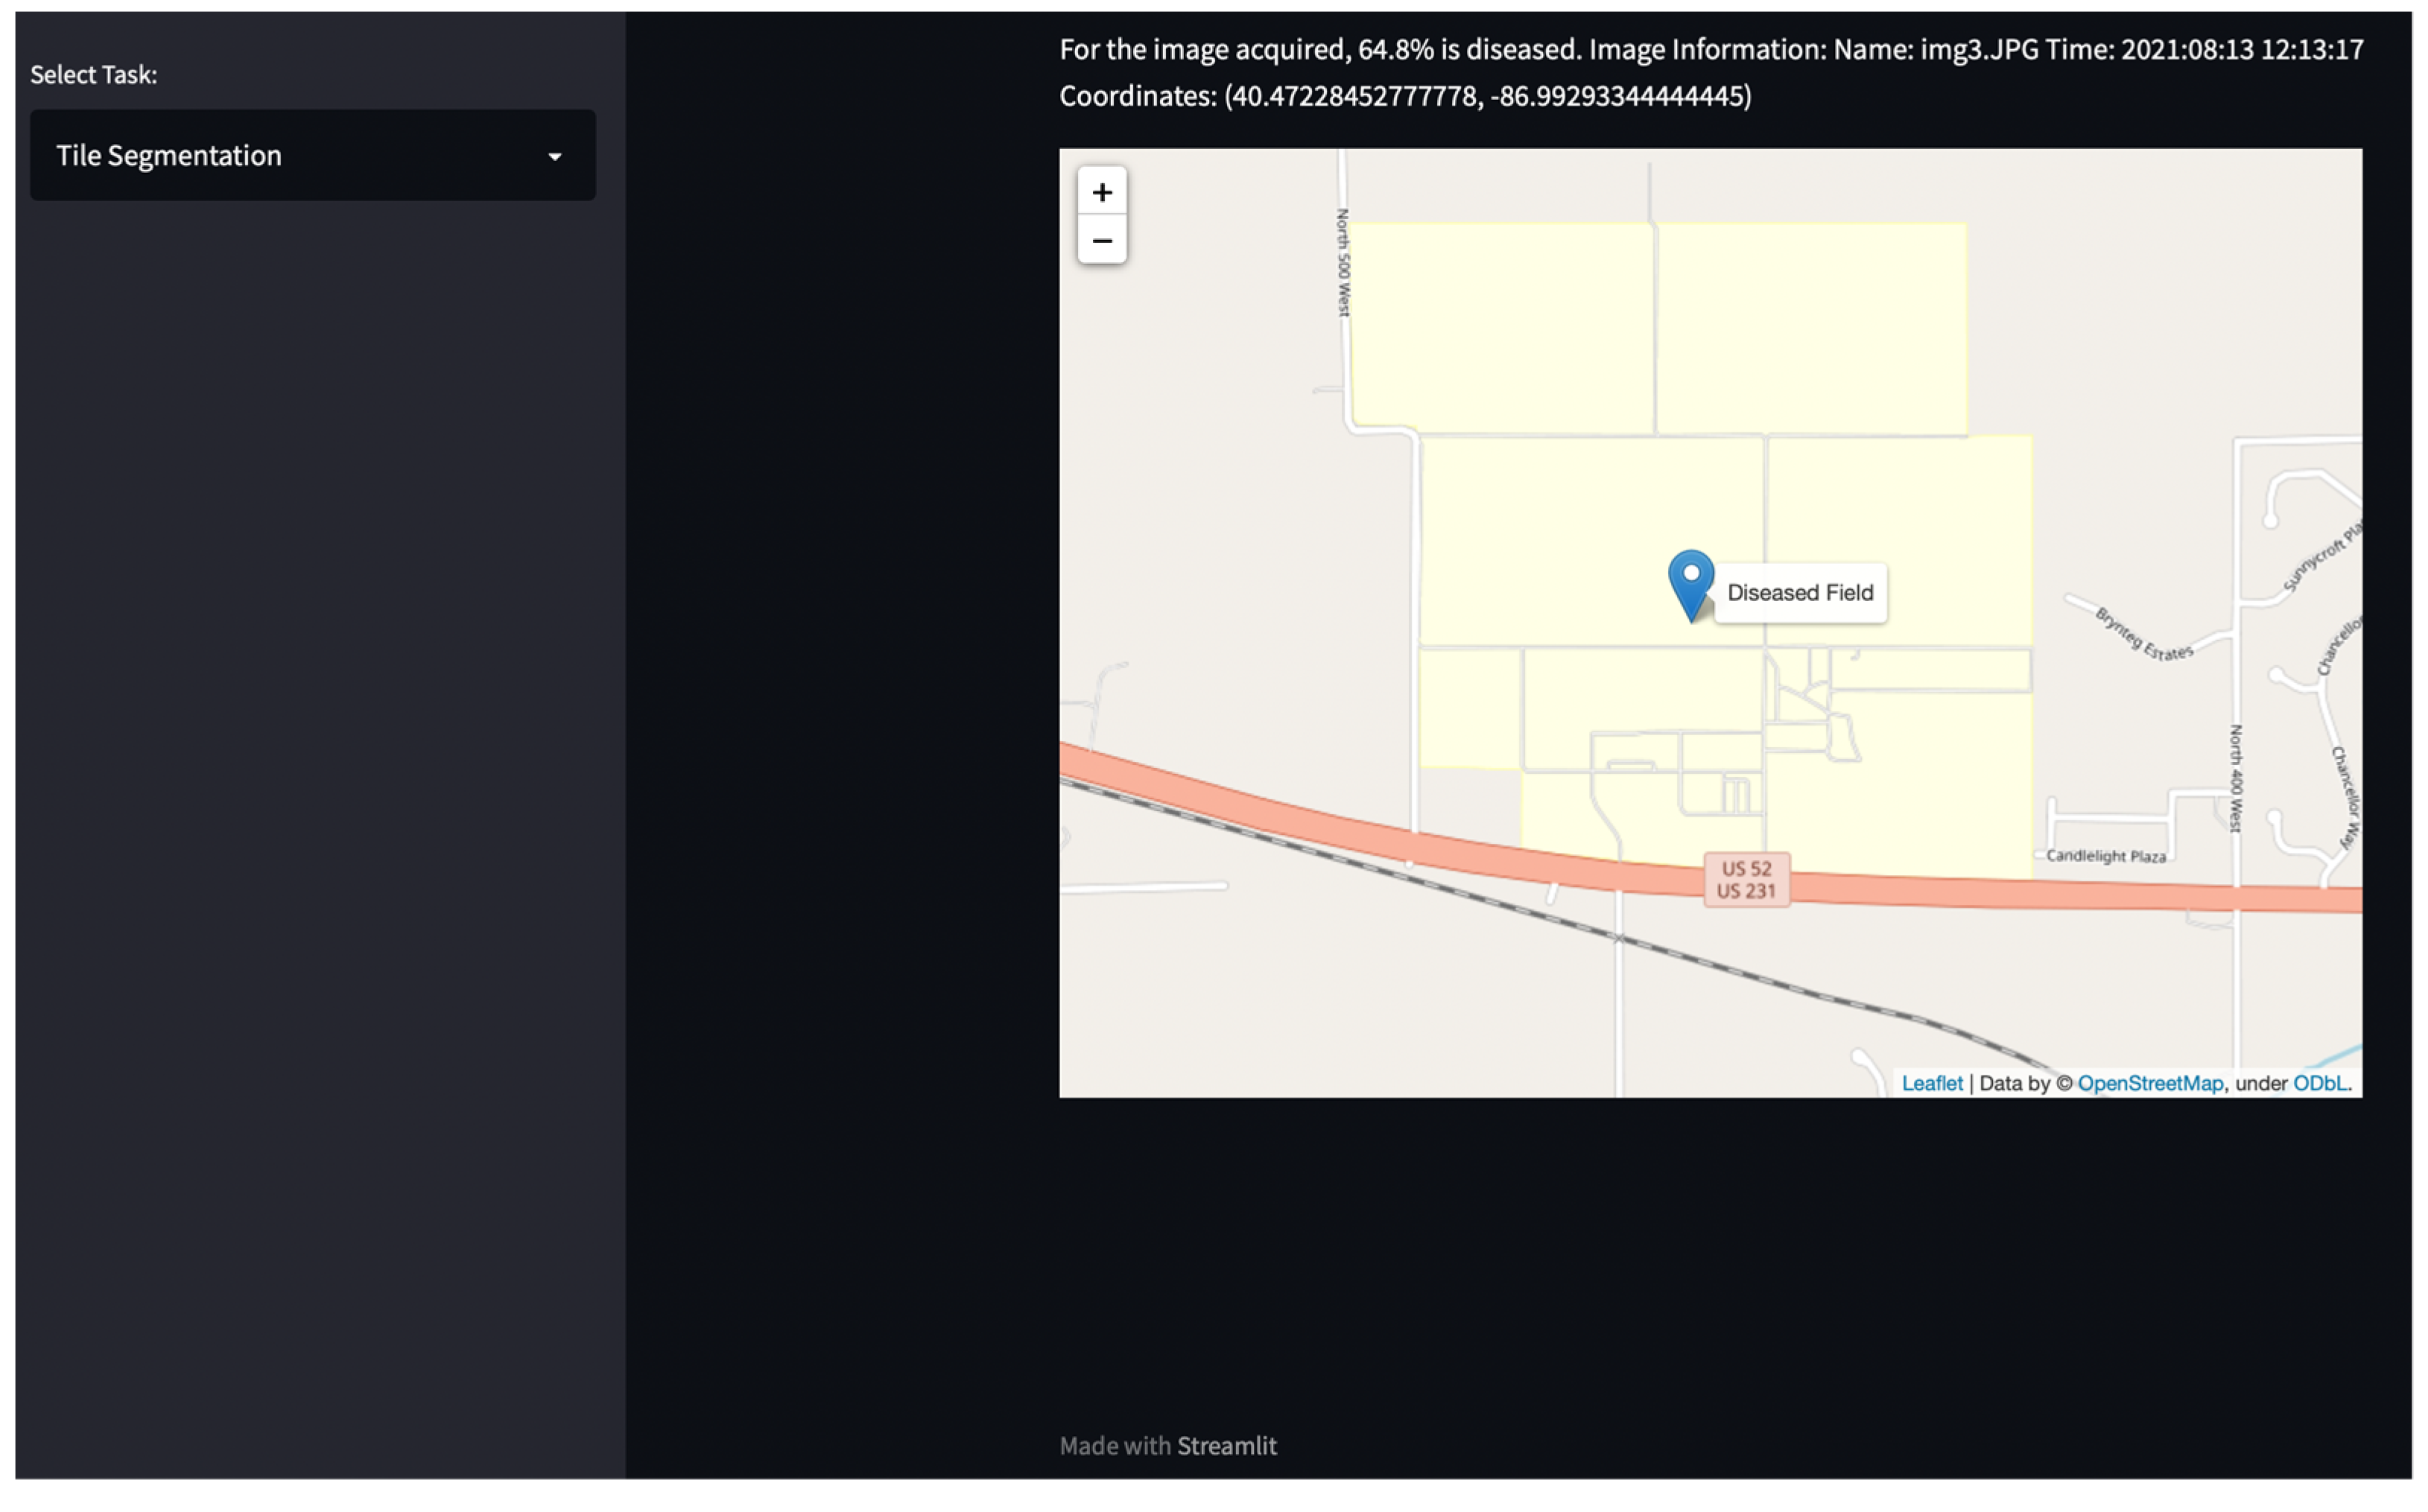
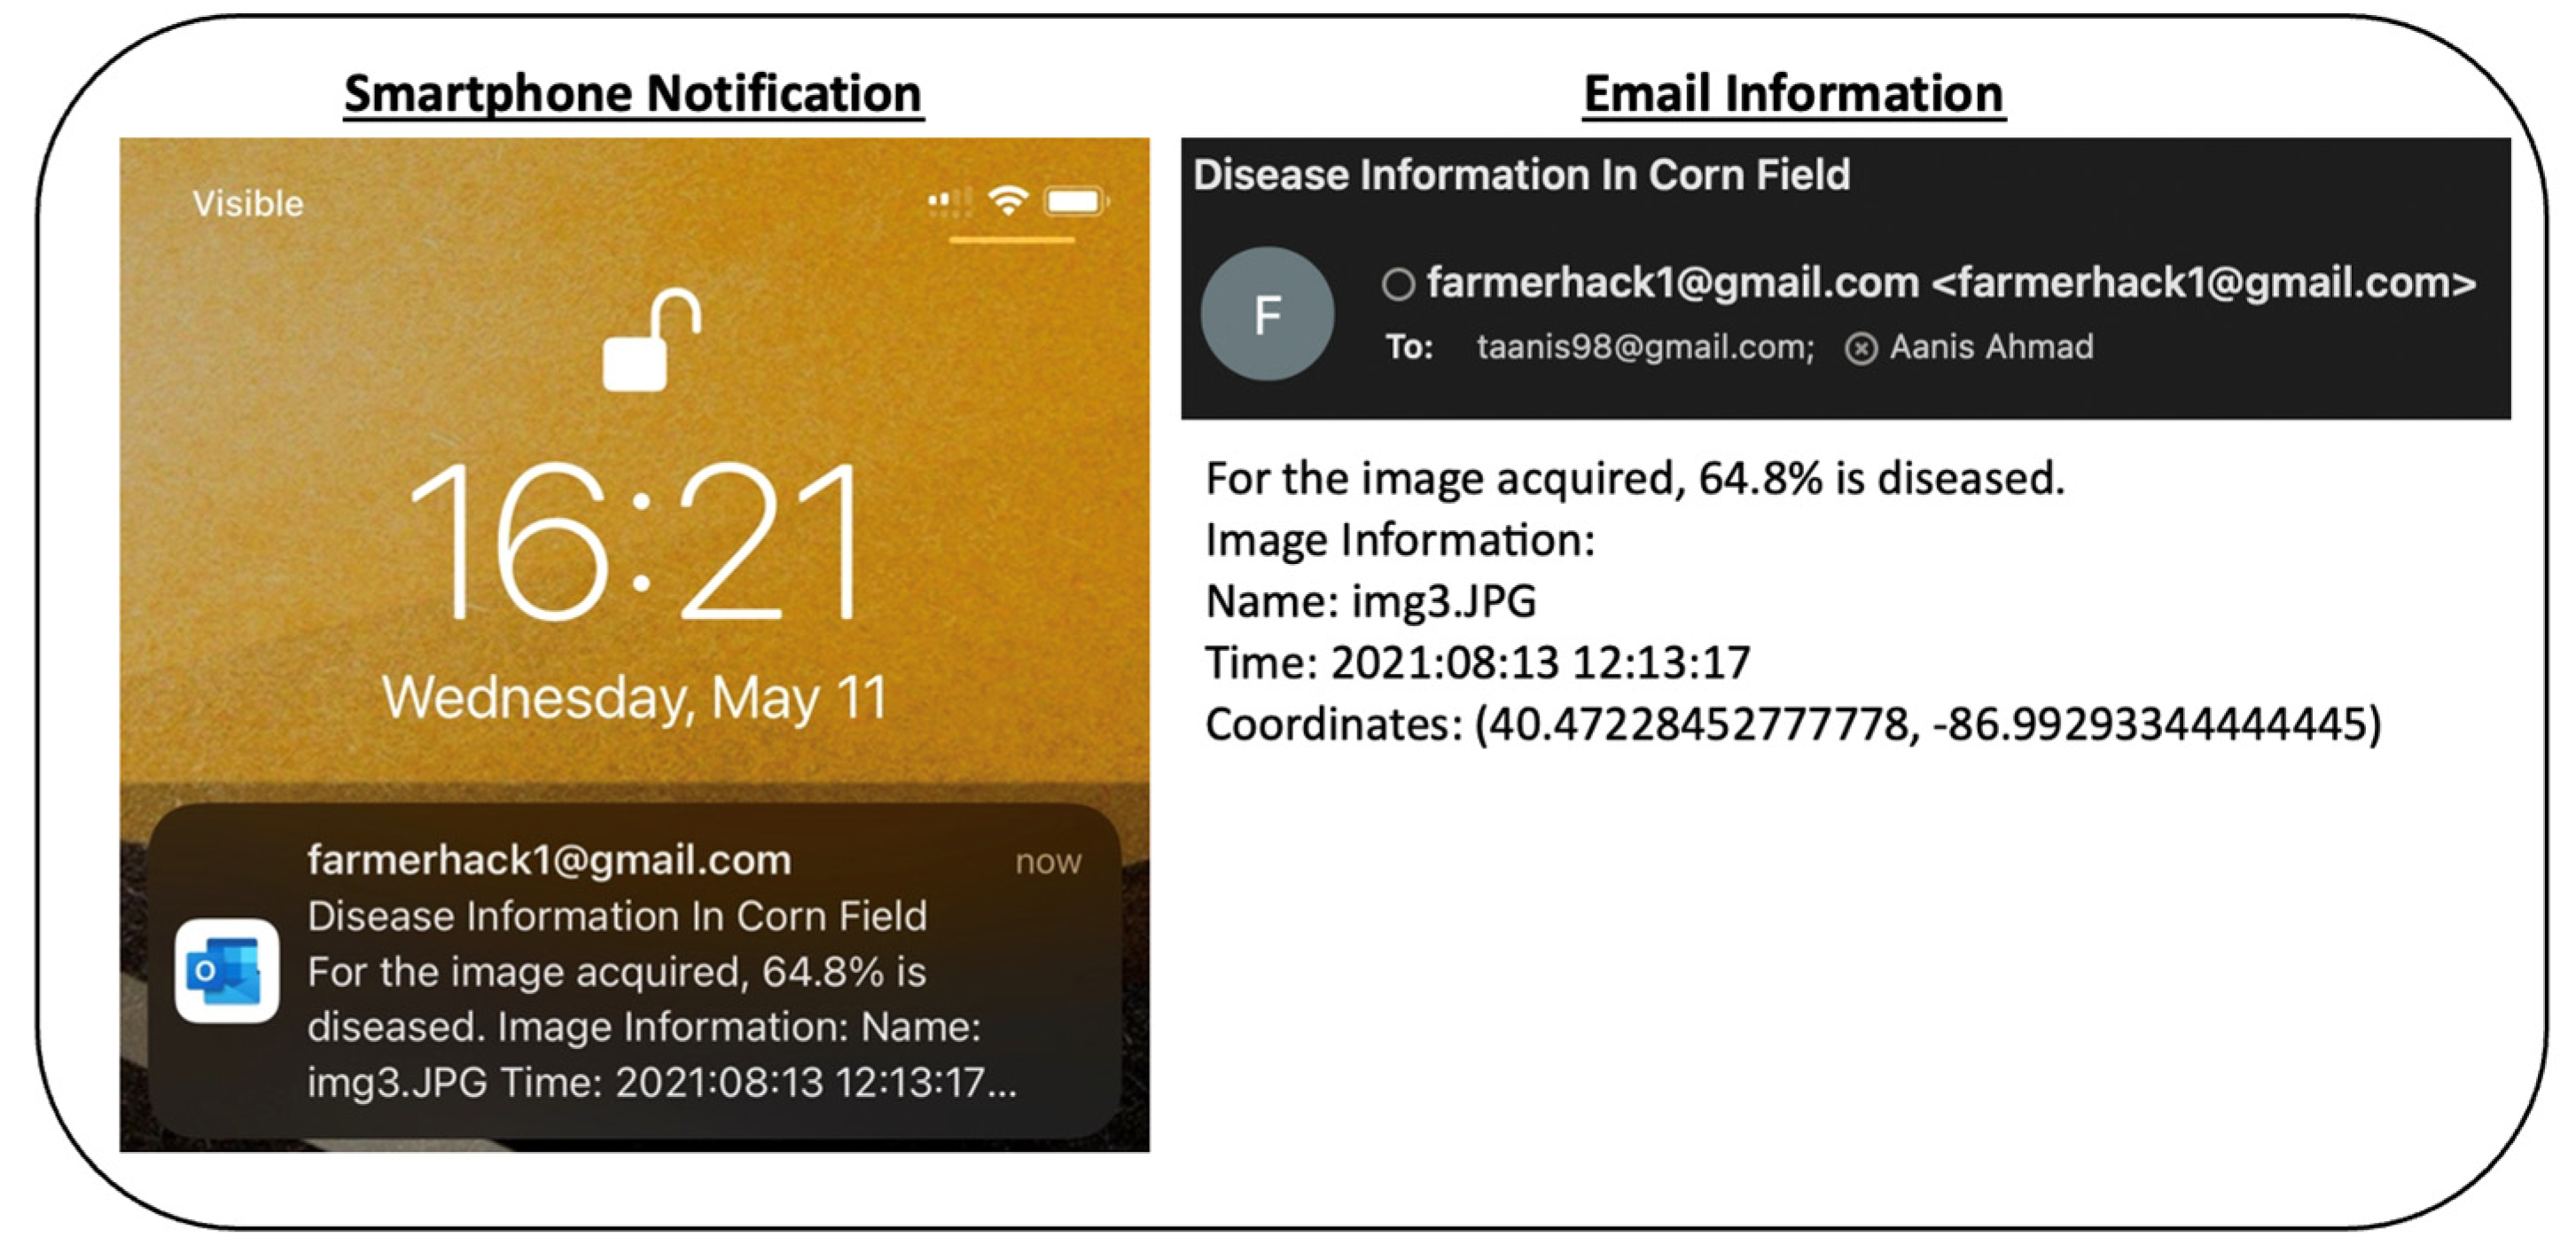
Using the “Exif” library from Python, the name of the image, the time at which the image was acquired, and the RTK geolocation coordinates at which the image was acquired were extracted. The area of the diseased image and the Exif information obtained from the image was then sent to the user via email. The “smtplib” library from Python for setting up an SMTP server was used to send email notifications. For this study, a temporary Gmail account named farmerhack1@gmail.com was created to send emails with information corresponding to diseased regions identified from UAS imagery acquired in corn fields.

2.5. Computational Resources

This study’s code was primarily written using the Python programming language. The TensorFlow 2.0 deep learning framework was utilized for training the deep learning models. Each model was trained using an NVIDIA RTX 3090 GPU. In addition, Python was used to develop the web application.

3. Results and Discussion

3.1. Tile Segmentation

For the first set of experiments, the dataset that was created by splitting the UAS images into tiles of size 250 × 250 pixels, 500 × 500 pixels, and 1000 × 1000 pixels was used.

3.1.1. Tile Size of 250 × 250 Pixels

The first set of models was trained using the tile segments of size 250 × 250 pixels. After the models were trained, the training and validation accuracy and loss plots were created (Figure 4). It was observed that apart from the ResNet50 model, the validation accuracy for models reached 100.00%. In addition, it was observed from the plots that the VGG16 had a higher degree of overfitting and the validation accuracy for the inception model started to decrease towards the end of the training, which indicates some degree of overfitting. Nevertheless, evaluating the models by comparing the testing accuracies is important.
In addition, the testing accuracies and testing losses were also obtained using the testing dataset, as shown in Table 3. It was observed that 100.00% testing accuracy was achieved for the VGG16, DenseNet169, and Xception models. The lowest testing loss was achieved for the Xception model. Therefore, when a tile size of 250 × 250 pixels was used, the Xception model performed the best.

3.1.2. Tile Size of 500 × 500 Pixels

Here, five models were trained to identify diseased regions within the UAS imagery of diseased corn fields using a tile size of 500 × 500 pixels. First, the training and validation accuracies and losses were plotted (Figure 5). In addition, almost no overfitting was observed as there were very small fluctuations in the generated plots. The ResNet50 model, again, failed to train, and validation accuracy did not cross 50%.
After the plots were generated, the testing accuracy and testing losses were obtained and compared. The testing accuracies were 100.00% for InceptionV3, VGG16, DenseNet169, and Xception. After evaluating the testing losses, it was observed that the InceptionV3 achieved the best performance as it had the lowest testing loss of 0.0045. The results are shown in Table 4.

3.1.3. Tile Size of 1000 × 1000 Pixels

Finally, tile segments of size 1000 × 1000 pixels were used to train the models. A low degree of overfitting was observed as almost no fluctuation existed in the training and validation accuracy and loss plots, as shown in Figure 6. In the case of larger tile sizes, the testing accuracy for ResNet50 improved.
Testing accuracies and losses were again compared to evaluate the overall performance of the models. The testing accuracies for InceptionV3, VGG16, DenseNet169, and Xception were 100.00%. Unlike the models that were trained using ResNet50 for tile segments of sizes 250 × 250 pixels and 500 × 500 pixels, the testing accuracy was high at 87.50% when tile segments were 1000 × 1000 pixels. However, the best model was the DenseNet169 model, as it achieved the highest testing accuracy of 100.00% at the lowest testing loss of 0.0003 (Table 5).

3.2. SLIC Segmentation

For the second set of experiments, the dataset was created by splitting the UAS images into superpixels using SLIC segmentation. Two compactness (m) values, i.e., 5 and 10, were used.

3.2.1. Superpixels Created Using Compactness (m) Value of 5

When the compactness (m) value was set to 5, the created superpixels consisted of more irregular boundaries. After the dataset was prepared with diseased, healthy, and background superpixels, the five DNN architectures were used to train five different models. After training, the training and validation accuracy and loss plots were created, as shown in Figure 7. It was observed that there was a larger degree of overfitting as the validation loss values fluctuated throughout training. The ResNet50 model once again failed to train well, and validation accuracy did not cross 50%.
In addition, the testing accuracies and testing losses were also obtained using the testing dataset, as shown in Table 6. The highest testing accuracy of 93.75% was achieved for the VGG16 model and the corresponding testing loss was 0.1872. No other model achieved testing accuracies of greater than 90%.

3.2.2. Superpixels Created Using Compactness (m) Value of 10

Superpixels created using a compactness (m) value of 10 were used to conduct further experiments. With a higher compactness (m) value, the validation accuracy and loss values did not closely follow the training accuracy and loss, representing a higher degree of overfitting. The training and validation accuracy and loss plots were created and are shown in Figure 8.
However, to further assess the performance of the models, the testing accuracies and losses were compared. It was observed that the DenseNet169 model achieved the highest testing accuracy and lowest testing loss of 93.75% and 0.2469, respectively (Table 7).

3.3. Sliding Window Disease Region Identification

After comparing the performances of the different segmentation types, it was observed that the tile segmentation yielded higher overall results for accurately identifying the diseased regions present within corn fields. The testing accuracies using tile segmentation reached up to 100%, whereas for SLIC segmentation, the highest testing accuracy was 93.75%. Therefore, the DenseNet169 model that was trained to identify tiles of size 1000 × 1000 pixels was selected to identify diseased, healthy, and background regions. A sliding window was then guided by the DenseNet169 model to identify and highlight the diseased regions within the image. If the regions were diseased, they were highlighted orange, as shown in Figure 9. In addition, the area of the diseased region was calculated with respect to the area of the entire image, and it was reported in the title of the image.

3.4. GeoDLS Web and Smartphone Applications

After training the deep learning models capable of accurately locating the different diseased regions present within corn fields using two different segmentation approaches and developing the sliding window algorithm for highlighting the diseased regions, a web application was developed using the Streamlit API.
The application’s home page displays the title and consists of a map with a pinpoint on the locations of the farms or fields where data were collected. In addition, the drop-down box on the top left of the screen prompts the user to select the type of different segmentation algorithm, as shown in Figure 10. If the user selected the tile segmentation algorithm, as shown in Figure 10, the best model that achieved the highest testing accuracy was used for identifying the diseased regions.
After the user chooses the option to identify different diseased regions within corn fields, the user is prompted to upload an image, as shown in Figure 11. The image can be selected from the computer.
Once the image is uploaded, the Pillow library in Python is used to read the information and perform the segmentation. If the tile segmentation was selected, the original images were split into sizes of 1000 × 1000 pixels. Each of the tiles was then passed into the trained deep learning model and was identified as either diseased, healthy, or soil. All the diseased regions were highlighted orange to indicate the diseased parts of the image corresponding to a region in the field, as shown in Figure 12. In addition, the percentage of the image, which consists of diseased regions, was calculated and the information was displayed to the user.
Finally, the RTK geolocation information stored in the image’s EXIF data was used to locate the image on the map (Figure 13). The total area corresponding to the diseased regions, the name of the image, the date and time of image acquisition, and the coordinates were then sent to the user in the form of an email. This link could be opened using a smartphone or a web browser to help update users on diseased region-related information for their fields.
Once the email was sent, the notification was then displayed in a smartphone’s notifications. A sample of the email sent/received is shown in Figure 14. The information can help users keep track of disease information in different parts of their fields until the time to harvest.
Although a web application is useful, many users are also likely to use the application in fields. Therefore, the application has also been designed for smartphones, as shown in Figure 15. The task can be selected, and the original location is shown on the home page. The images can be uploaded from the gallery when uploading the image for analysis and disease diagnosis. In addition, the smartphone application provides the benefit of taking an image on the go. After the image is uploaded, the diseased regions are again identified, and a map is displayed with the information for the diseased corn field. Finally, the information is also sent to the user in an email.

4. Discussion

The use of deep learning-based solutions for agricultural applications is on the rise. Disease identification is a complex task and deep learning has shown great promise within the literature. Accurate disease identification is necessary for the development of disease management systems. However, accurately identifying diseased regions within corn fields is an essential component to aid farmers control/track their spread. Although traditional approaches for disease region identification that rely on manual scouting are common, it is important to explore efficient modern solutions. Therefore, this study relied on RGB UAS imagery with RTK geolocation information for identifying and locating diseased regions in corn fields.
The availability of UAS imagery data from diseased corn fields is limited. However, a publicly available UAS imagery dataset was acquired in corn fields [13]. The NLB dataset was used for disease identification resulting in high accuracies. However, the dataset only comprises UAS images corresponding to NLB foliar disease of corn without harnessing the geolocation information. Thus, the dataset cannot be used to train deep learning models for identifying and locating diseased regions in corn fields. Therefore, in this study, a UAS imagery dataset was acquired to train deep learning models for accurately identifying diseased regions. The UAS-acquired images were then subject to different techniques: tile and SLIC segmentation, which were used to split each image into multiple smaller tiles or superpixels. Tiles of sizes 250 × 250 pixels, 500 × 500 pixels, and 1000 × 1000 pixels were created with 1804, 1112, and 570 images, respectively. Superpixels with compactness (m) values of 5 and 10 were created with 865 and 725 images, respectively. Overall, in this study, a total of 5076 images were created and used for training and evaluating deep learning models.
The images were used to train a total of 25 deep learning models using state-of-the-art neural network architectures to compare the performance of the different segmentation approaches for diseased region identification. It was observed that the tile segmentation approach performed better for identifying diseased regions when compared with the SLIC segmentation approach. For SLIC segmentation, testing accuracies of up to 93.75% were achieved using the DenseNet169 model. Similar testing accuracies of up to 93.82% were reported for soybean pest identification using UAS imagery subject to SLIC segmentation [8]. For soybean disease identification using UAS imagery and SLIC segmentation, testing accuracies of up to 99.04% were reported [39]. However, both studies were conducted by flying the UAS 2 m above the canopy. UAS imagery and SLIC segmentation were also used for rice disease diagnosis; however, accuracy values were not reported [46]. For SLIC segmentation, we achieved an accuracy of 93.75% for corn disease region identification from UAS imagery acquired at 12 m. Conducting flights at a higher altitude helps to cover larger areas in a shorter time. Furthermore, as a high-resolution sensor capable of acquiring images at a resolution of 8192 × 5460 pixels was used, we maintained a high spatial resolution with a GSD of 0.14 cm/pixels.
In this study, tile segmentation outperformed SLIC segmentation for deep learning-based corn disease region identification using each of the different tile sizes. In the literature, deep learning was used for disease diagnosis using hyperspectral UAS imagery with an accuracy of 85% [47]. Deep learning was also used, along with a sliding window for identifying diseased regions in a corn field with a testing accuracy of up 97.84% [5]. In this study, however, testing accuracies up to 100% were observed for disease region identification in corn fields. The DenseNet169 deep learning model that was trained on tile segments of size 1000 × 1000 pixels was the best, as the lowest loss value of 0.0003 was achieved. Therefore, after achieving testing accuracies of up to 100% in this study, it can be concluded that RGB imagery has a great potential to be used for identifying diseased regions with confidence.
After the best deep learning model was identified, the model was deployed in the form of a web and smartphone application. Although different tools were created for plant disease diagnosis [62,63,64], most tools are not capable of UAS-based corn disease diagnosis. The GeoDLS tool, however, supports UAS imagery-based corn disease region identification by providing an interactive user interface via a web and smartphone application. Additionally, the location of diseased regions was identified and communicated using email. The application will be further enhanced by supporting UAS-based disease identification in mosaiced images and identifying different disease types in a future study.

5. Conclusions

The development of tools for managing crop diseases using modern solutions, such as UAS and deep learning, is vital to help overcome yield losses. Therefore, this study proposed a deep learning-based disease region identification tool called GeoDLS to notify users about the presence of diseased regions within corn fields. Five DNN architectures, namely VGG16, ResNet50, InceptionV3, DenseNet169, and Xception, were trained for identifying diseased, healthy, and background regions from UAS imagery acquired in corn fields using two different segmentation techniques, namely tile and SLIC segmentation. The findings and achievements of the study are as follows:
(1)
Densenet169 achieved the highest testing accuracy of 100.00% for 1000 × 1000 pixel tile segmentation;
(2)
SLIC segmentation led to inferior performance compared to tile-based segmentation, with testing accuracies of only 93.75%;
(3)
A sliding window algorithm helped in quantifying the percentage of diseased regions in each UAS image;
(4)
The trained model was deployed on a web and smartphone application to log and update users about diseased regions in corn fields.
Overall, this study developed a deep learning-based tool to help users analyze diseased corn fields using UAS imagery. The tool will be enhanced in the future by allowing the UAS to send the acquired images directly to the GeoDLS in real-time.

Author Contributions

Conceptualization, A.A. and D.S.; data curation: V.A.; formal analysis, A.A. and V.A.; funding acquisition, D.S.; investigation: A.E.G. and G.S.J.; methodology, A.A., A.E.G. and G.S.J.; project administration, D.S.; resources, D.S.; software, A.A. and V.A.; supervision, D.S. and A.E.G.; validation, V.A. and A.E.G.; visualization, A.A. and V.A.; writing—original draft, A.A. and V.A.; writing—review and editing, D.S., A.E.G., and G.S.J. All authors have read and agreed to the published version of the manuscript.

Funding

The research was made possible by the funding provided by the Wabash Heartland Innovation Network (WHIN) grant number 18024589 and the USDA National Institute of Food and Agriculture (NIFA) Hatch project 1012501.

Data Availability Statement

Not applicable.

Acknowledgments

Not applicable.

Conflicts of Interest

The authors declare no conflict of interest.

References

  1. Chen, J.; Zhang, D.; Zeb, A.; Nanehkaran, Y.A. Identification of Rice Plant Diseases Using Lightweight Attention Networks. Expert Syst. Appl. 2021, 169, 114514. [Google Scholar] [CrossRef]
  2. Tudi, M.; Ruan, H.D.; Wang, L.; Lyu, J.; Sadler, R.; Connell, D.; Chu, C.; Phung, D.T. Agriculture Development, Pesticide Application and Its Impact on the Environment. Int. J. Environ. Res. Public Health 2021, 18, 1112. [Google Scholar] [CrossRef] [PubMed]
  3. Bock, C.H.; Poole, G.H.; Parker, P.E.; Gottwald, T.R. Plant Disease Severity Estimated Visually, by Digital Photography and Image Analysis, and by Hyperspectral Imaging. Crit. Rev. Plant Sci. 2010, 29, 59–107. [Google Scholar] [CrossRef]
  4. Ahmad, A.; Saraswat, D.; Aggarwal, V.; Etienne, A.; Hancock, B. Performance of Deep Learning Models for Classifying and Detecting Common Weeds in Corn and Soybean Production Systems. Comput. Electron. Agric. 2021, 184, 106081. [Google Scholar] [CrossRef]
  5. Ahmad, A.; Saraswat, D.; El Gamal, A.; Johal, G.S. Comparison of Deep Learning Models for Corn Disease Identification, Tracking, and Severity Estimation Using Images Acquired from Uav-Mounted and Handheld Sensors. In Proceedings of the 2021 Annual International Meeting ASABE Virtual and On Demand, virtual, 12–16 July 2021; pp. 2–12. [Google Scholar]
  6. Wang, A.X.; Tran, C.; Desai, N.; Lobell, D.; Ermon, S. Deep Transfer Learning for Crop Yield Prediction with Remote Sensing Data. In Proceedings of the 1st ACM SIGCAS Conference on Computing and Sustainable Societies, COMPASS 2018, San Jose, CA, USA, 20–22 June 2018; Association for Computing Machinery, Inc.: New York, NY, USA, 2018. [Google Scholar] [CrossRef]
  7. Thenmozhi, K.; Srinivasulu Reddy, U. Crop Pest Classification Based on Deep Convolutional Neural Network and Transfer Learning. Comput. Electron. Agric. 2019, 164, 104906. [Google Scholar] [CrossRef]
  8. Tetila, E.C.; MacHado, B.B.; Menezes, G.V.; de Souza Belete, N.A.; Astolfi, G.; Pistori, H. A Deep-Learning Approach for Automatic Counting of Soybean Insect Pests. IEEE Geosci. Remote Sens. Lett. 2020, 17, 1837–1841. [Google Scholar] [CrossRef]
  9. Kitano, B.T.; Mendes, C.C.T.; Geus, A.R.; Oliveira, H.C.; Souza, J.R. Corn Plant Counting Using Deep Learning and UAV Images. IEEE Geosci. Remote Sens. Lett. 2019, 1–5. [Google Scholar] [CrossRef]
  10. Xie, Q.; Wang, J.; Lopez-Sanchez, J.M.; Peng, X.; Liao, C.; Shang, J.; Zhu, J.; Fu, H.; Ballester-Berman, J.D. Crop Height Estimation of Corn from Multi-Year Radarsat-2 Polarimetric Observables Using Machine Learning. Remote Sens. 2021, 13, 392. [Google Scholar] [CrossRef]
  11. Etienne, A.; Ahmad, A.; Aggarwal, V.; Saraswat, D. Deep Learning-Based Object Detection System for Identifying Weeds Using Uas Imagery. Remote Sens. 2021, 13, 5182. [Google Scholar] [CrossRef]
  12. Jahan, N.; Zhang, Z.; Liu, Z.; Friskop, A.; Flores, P.; Mathew, J.; Das, A.K. Using Images from a Handheld Camera to Detect Wheat Bacterial Leaf Streak Disease Severities. In Proceedings of the American Society of Agricultural and Biological Engineers Annual International Meeting, ASABE 2021, online, 12–16 July 2021; Volume 1, pp. 392–401. [Google Scholar] [CrossRef]
  13. Wiesner-Hanks, T.; Stewart, E.L.; Kaczmar, N.; Dechant, C.; Wu, H.; Nelson, R.J.; Lipson, H.; Gore, M.A. Image Set for Deep Learning: Field Images of Maize Annotated with Disease Symptoms. BMC Res. Notes 2018, 11, 440. [Google Scholar] [CrossRef] [Green Version]
  14. Young, S.N.; Kayacan, E.; Peschel, J.M. Design and Field Evaluation of a Ground Robot for High-Throughput Phenotyping of Energy Sorghum. Precis. Agric. 2019, 20, 697–722. [Google Scholar] [CrossRef] [Green Version]
  15. Barbedo, J.G.A. Factors Influencing the Use of Deep Learning for Plant Disease Recognition. Biosyst. Eng. 2018, 172, 84–91. [Google Scholar] [CrossRef]
  16. Haque, M.; Marwaha, S.; Deb, C.K.; Nigam, S.; Arora, A.; Hooda, K.S.; Soujanya, P.L.; Aggarwal, S.K.; Lall, B.; Kumar, M. Deep Learning-Based Approach for Identification of Diseases of Maize Crop. Sci. Rep. 2022, 12, 6334. [Google Scholar] [CrossRef] [PubMed]
  17. Wu, Q.; Zhang, K.; Meng, J. Identification of Soybean Leaf Diseases via Deep Learning. J. Inst. Eng. Ser. A 2019, 100, 659–666. [Google Scholar] [CrossRef]
  18. Shin, J.; Chang, Y.K.; Heung, B.; Nguyen-Quang, T.; Price, G.W.; Al-Mallahi, A. A Deep Learning Approach for RGB Image-Based Powdery Mildew Disease Detection on Strawberry Leaves. Comput. Electron. Agric. 2021, 183, 106042. [Google Scholar] [CrossRef]
  19. Liu, B.; Ding, Z.; Tian, L.; He, D.; Li, S.; Wang, H. Grape Leaf Disease Identification Using Improved Deep Convolutional Neural Networks. Front. Plant Sci. 2020, 11, 1082. [Google Scholar] [CrossRef]
  20. Agarwal, M.; Gupta, S.K.; Biswas, K.K. Development of Efficient CNN Model for Tomato Crop Disease Identification. Sustain. Comput. Inform. Syst. 2020, 28, 100407. [Google Scholar] [CrossRef]
  21. Ma, J.; Du, K.; Zheng, F.; Zhang, L.; Gong, Z.; Sun, Z. A Recognition Method for Cucumber Diseases Using Leaf Symptom Images Based on Deep Convolutional Neural Network. Comput. Electron. Agric. 2018, 154, 18–24. [Google Scholar] [CrossRef]
  22. Neupane, K.; Baysal-Gurel, F. Automatic Identification and Monitoring of Plant Diseases Using Unmanned Aerial Vehicles: A Review. Remote Sens. 2021, 13, 3841. [Google Scholar] [CrossRef]
  23. Barbedo, J.G.A. A Review on the Main Challenges in Automatic Plant Disease Identification Based on Visible Range Images. Biosyst. Eng. 2016, 144, 52–60. [Google Scholar] [CrossRef]
  24. Ahmad, A.; Saraswat, D.; El Gamal, A. A Survey on Using Deep Learning Techniques for Plant Disease Diagnosis and Recommendations for Development of Appropriate Tools. Smart Agric. Technol. 2022, 3, 100083. [Google Scholar] [CrossRef]
  25. Zhu, H.; Chu, B.; Zhang, C.; Liu, F.; Jiang, L.; He, Y. Hyperspectral Imaging for Presymptomatic Detection of Tobacco Disease with Successive Projections Algorithm and Machine-Learning Classifiers. Sci. Rep. 2017, 7, 4125. [Google Scholar] [CrossRef] [PubMed] [Green Version]
  26. Nguyen, C.; Sagan, V.; Maimaitiyiming, M.; Maimaitijiang, M.; Bhadra, S.; Kwasniewski, M.T. Early Detection of Plant Viral Disease Using Hyperspectral Imaging and Deep Learning. Sensors 2021, 21, 742. [Google Scholar] [CrossRef]
  27. Abdulridha, J.; Ampatzidis, Y.; Qureshi, J.; Roberts, P. Laboratory and UAV-Based Identification and Classification of Tomato Yellow Leaf Curl, Bacterial Spot, and Target Spot Diseases in Tomato Utilizing Hyperspectral Imaging and Machine Learning. Remote Sens. 2020, 12, 2732. [Google Scholar] [CrossRef]
  28. Abdulridha, J.; Ampatzidis, Y.; Roberts, P.; Kakarla, S.C. Detecting Powdery Mildew Disease in Squash at Different Stages Using UAV-Based Hyperspectral Imaging and Artificial Intelligence. Biosyst. Eng. 2020, 197, 135–148. [Google Scholar] [CrossRef]
  29. Abdulridha, J.; Ampatzidis, Y.; Kakarla, S.C.; Roberts, P. Detection of Target Spot and Bacterial Spot Diseases in Tomato Using UAV-Based and Benchtop-Based Hyperspectral Imaging Techniques. Precis. Agric. 2020, 21, 955–978. [Google Scholar] [CrossRef]
  30. Kerkech, M.; Hafiane, A.; Canals, R. Vine Disease Detection in UAV Multispectral Images Using Optimized Image Registration and Deep Learning Segmentation Approach. Comput. Electron. Agric. 2020, 174, 105446. [Google Scholar] [CrossRef]
  31. Ye, H.; Huang, W.; Huang, S.; Cui, B.; Dong, Y.; Guo, A.; Ren, Y.; Jin, Y. Recognition of Banana Fusarium Wilt Based on UAV Remote Sensing. Remote Sens. 2020, 12, 938. [Google Scholar] [CrossRef] [Green Version]
  32. Farber, C.; Mahnke, M.; Sanchez, L.; Kurouski, D. Advanced Spectroscopic Techniques for Plant Disease Diagnostics. A Review. TrAC—Trends Anal. Chem. 2019, 118, 43–49. [Google Scholar] [CrossRef]
  33. Ngugi, L.C.; Abelwahab, M.; Abo-Zahhad, M. Recent Advances in Image Processing Techniques for Automated Leaf Pest and Disease Recognition–A Review. Inf. Process. Agric. 2021, 8, 27–51. [Google Scholar] [CrossRef]
  34. Wu, H.; Wiesner-Hanks, T.; Stewart, E.L.; DeChant, C.; Kaczmar, N.; Gore, M.A.; Nelson, R.J.; Lipson, H. Autonomous Detection of Plant Disease Symptoms Directly from Aerial Imagery. Plant Phenome J. 2019, 2, 1–9. [Google Scholar] [CrossRef]
  35. Stewart, E.L.; Wiesner-Hanks, T.; Kaczmar, N.; DeChant, C.; Wu, H.; Lipson, H.; Nelson, R.J.; Gore, M.A. Quantitative Phenotyping of Northern Leaf Blight in UAV Images Using Deep Learning. Remote Sens. 2019, 11, 2209. [Google Scholar] [CrossRef] [Green Version]
  36. Achanta, R.; Shaji, A.; Smith, K.; Lucchi, A.; Fua, P.; Süsstrunk, S. SLIC Superpixels. Tech. Rep. EPFL 2010. [Google Scholar]
  37. Achanta, R.; Shaji, A.; Smith, K.; Lucchi, A.; Fua, P.; Süsstrunk, S. SLIC Superpixels Compared to State-of-the-Art Superpixel Methods. IEEE Trans. Pattern Anal. Mach. Intell. 2012, 34, 2274–2281. [Google Scholar] [CrossRef] [PubMed] [Green Version]
  38. Martins, J.A.C.; Menezes, G.; Gonçalves, W.; Sant’Ana, D.A.; Osco, L.P.; Liesenberg, V.; Li, J.; Ma, L.; Oliveira, P.T.; Astolfi, G.; et al. Machine Learning and SLIC for Tree Canopies Segmentation in Urban Areas. Ecol. Inform. 2021, 66, 101465. [Google Scholar] [CrossRef]
  39. Tetila, E.C.; Machado, B.B.; Menezes, G.K.; da Silva Oliveira, A.; Alvarez, M.; Amorim, W.P.; de Souza Belete, N.A.; da Silva, G.G.; Pistori, H. Automatic Recognition of Soybean Leaf Diseases Using UAV Images and Deep Convolutional Neural Networks. IEEE Geosci. Remote Sens. Lett. 2020, 17, 903–907. [Google Scholar] [CrossRef]
  40. Trindade, L.D.G.; Basso, F.P.; de Macedo Rodrigues, E.; Bernardino, M.; Welfer, D.; Müller, D. Analysis of the Superpixel Slic Algorithm for Increasing Data for Disease Detection Using Deep Learning. Electr. Distrib. 2021, 488–497. [Google Scholar] [CrossRef]
  41. Salazar-Reque, I.F.; Huamán, S.G.; Kemper, G.; Telles, J.; Diaz, D. An Algorithm for Plant Disease Visual Symptom Detection in Digital Images Based on Superpixels. Int. J. Adv. Sci. Eng. Inf. Technol. 2019, 9, 194–203. [Google Scholar] [CrossRef] [Green Version]
  42. Zhang, S.; You, Z.; Wu, X. Plant Disease Leaf Image Segmentation Based on Superpixel Clustering and EM Algorithm. Neural Comput. Appl. 2019, 31, 1225–1232. [Google Scholar] [CrossRef]
  43. Sugiura, R.; Tsuda, S.; Tsuji, H.; Murakami, N. Virus-Infected Plant Detection in Potato Seed Production Field by UAV Imagery. In Proceedings of the 2018 ASABE Annual International Meeting, Detroit, MI, USA, 31 July 2018; American Society of Agricultural and Biological Engineers: St. Joseph, MO, USA, 2018; p. 1. [Google Scholar]
  44. Pan, Q.; Gao, M.; Wu, P.; Yan, J.; Li, S. A Deep-Learning-Based Approach for Wheat Yellow Rust Disease Recognition from Unmanned Aerial Vehicle Images. Sensors 2021, 21, 6540. [Google Scholar] [CrossRef]
  45. Cai, N.; Zhou, X.; Yang, Y.; Wang, J.; Zhang, D.; Hu, R. Use of UAV Images to Assess Narrow Brown Leaf Spot Severity in Rice. Int. J. Precis. Agric. Aviat. 2019, 2, 38–42. [Google Scholar] [CrossRef]
  46. Li, Y.; Qian, M.; Liu, P.; Cai, Q.; Li, X.; Guo, J.; Yan, H.; Yu, F.; Yuan, K.; Yu, J. The Recognition of Rice Images by UAV Based on Capsule Network. Clust. Comput. 2019, 22, 9515–9524. [Google Scholar] [CrossRef]
  47. Zhang, X.; Han, L.; Dong, Y.; Shi, Y.; Huang, W.; Han, L.; González-Moreno, P.; Ma, H.; Ye, H.; Sobeih, T. A Deep Learning-Based Approach for Automated Yellow Rust Disease Detection from High-Resolution Hyperspectral UAV Images. Remote Sens. 2019, 11, 1554. [Google Scholar] [CrossRef] [Green Version]
  48. Alqudah, A.; Alqudah, A.M. Sliding Window Based Support Vector Machine System for Classification of Breast Cancer Using Histopathological Microscopic Images. IETE J. Res. 2022, 68, 59–67. [Google Scholar] [CrossRef]
  49. Ammour, N.; Alhichri, H.; Bazi, Y.; Benjdira, B.; Alajlan, N.; Zuair, M. Deep Learning Approach for Car Detection in UAV Imagery. Remote Sens. 2017, 9, 312. [Google Scholar] [CrossRef] [Green Version]
  50. Lian, R.; Huang, L. DeepWindow: Sliding Window Based on Deep Learning for Road Extraction from Remote Sensing Images. IEEE J. Sel. Top. Appl. Earth Obs. Remote Sens. 2020, 13, 1905–1916. [Google Scholar] [CrossRef]
  51. Samantaray, S.; Deotale, R.; Chowdhary, C.L. Lane Detection Using Sliding Window for Intelligent Ground Vehicle Challenge. Lect. Notes Data Eng. Commun. Technol. 2021, 59, 871–881. [Google Scholar] [CrossRef]
  52. DJI Official. D-RTK 2—Product Information. Available online: https://www.dji.com/d-rtk-2/info#specs (accessed on 17 August 2022).
  53. Zhao, B.; Li, J.; Wang, L.; Shi, Y. Positioning Accuracy Assessment of a Commercial RTK UAS. Auton. Air Ground Sens. Syst. Agric. Optim. Phenotyping V 2020, 11414, 7–53. [Google Scholar]
  54. Yuan, X.; Qiao, G.; Li, Y.; Li, H.; Xu, R. Modelling of Glacier and Ice Sheet Micro-Topography Based on Unmanned Aerial Vehicle Data, Antarctica. Int. Arch. Photogramm. Remote Sens. Spat. Inf. Sci. 2020, 43, 919–923. [Google Scholar] [CrossRef]
  55. Wise, K. Northern Corn Leaf Blight. Purdue Extension Publication BP-84-W. Available online: http://www.extension.purdue.edu/extmedia/BP/BP-84-W.pdf (accessed on 17 August 2022).
  56. Bah, M.D.; Hafiane, A.; Canals, R. Weeds Detection in UAV Imagery Using SLIC and the Hough Transform. In Proceedings of the 2017 Seventh International Conference on Image Processing Theory, Tools and Applications (IPTA), Montreal, QC, Canada, 28 November–1 December 2017; IEEE: Piscataway, NJ, USA, 2017; pp. 1–6. [Google Scholar]
  57. Simonyan, K.; Zisserman, A. Very Deep Convolutional Networks for Large-Scale Image Recognition. arXiv 2014, arXiv:1409.1556. [Google Scholar]
  58. He, K.; Zhang, X.; Ren, S.; Sun, J. Deep Residual Learning for Image Recognition. In Proceedings of the IEEE Computer Society Conference on Computer Vision and Pattern Recognition, San Francisco, CA, USA, 18–20 June 1996; IEEE Computer Society: Washington, DC, USA, 2016; pp. 770–778. [Google Scholar] [CrossRef] [Green Version]
  59. Szegedy, C.; Vanhoucke, V.; Ioffe, S.; Shlens, J.; Wojna, Z. Rethinking the Inception Architecture for Computer Vision. In Proceedings of the IEEE Computer Society Conference on Computer Vision and Pattern Recognition, San Juan, PR, USA, 17–19 June 1997; IEEE Computer Society: Washington, DC, USA, 2016; pp. 2818–2826. [Google Scholar] [CrossRef] [Green Version]
  60. Huang, G.; Liu, Z.; van der Maaten, L.; Weinberger, K.Q. Densely Connected Convolutional Networks. In Proceedings of the IEEE Conference on Computer Vision and Pattern Recognition, Salt Lake City, UT, USA, 18–23 June 2018. [Google Scholar]
  61. Chollet, F. Xception: Deep Learning with Depthwise Separable Convolutions. In Proceedings of the 30th IEEE Conference on Computer Vision and Pattern Recognition, CVPR 2017, Honolulu, HI, USA, 21–26 July 2016; Institute of Electrical and Electronics Engineers Inc.: Piscataway, NJ, USA, 2017; pp. 1800–1807. [Google Scholar] [CrossRef] [Green Version]
  62. Pethybridge, S.J.; Nelson, S.C. Leaf Doctor: A New Portable Application for Quantifying Plant Disease Severity. Plant Dis. 2015, 99, 1310–1316. [Google Scholar] [CrossRef] [PubMed] [Green Version]
  63. Valdoria, J.C.; Caballeo, A.R.; Fernandez, B.I.D.; Condino, J.M.M. IDahon: An Android Based Terrestrial Plant Disease Detection Mobile Application through Digital Image Processing Using Deep Learning Neural Network Algorithm. In Proceedings of the 2019 4th International Conference on Information Technology (InCIT), Bangkok, Thailand, 24–25 October 2019; IEEE: Piscataway, NJ, USA, 2019; pp. 94–98. [Google Scholar]
  64. Andrianto, H.; Faizal, A.; Armandika, F. Smartphone Application for Deep Learning-Based Rice Plant Disease Detection. In Proceedings of the 2020 International Conference on Information Technology Systems and Innovation (ICITSI), Bandung-Padang, Indonesia, 19–23 October 2020; IEEE: Piscataway, NJ, USA, 2020; pp. 387–392. [Google Scholar]
Figure 1. Field 21B located at Purdue University’s ACRE farm and UAS flight path for data collection.
Remotesensing 14 04140 g001
Figure 2. Overall Tile Dataset Generation Workflow.
Remotesensing 14 04140 g002
Figure 3. Overall SLIC Segmentation and Superpixels Dataset Generation Workflow.
Remotesensing 14 04140 g003
Figure 4. Training and validation accuracy and loss plots for training deep learning models to identify diseased regions using tile segments of size 250 × 250 pixels.
Remotesensing 14 04140 g004
Figure 5. Training and validation accuracy and loss plots for training deep learning models to identify diseased regions using tile segments of size 500 × 500 pixels.
Remotesensing 14 04140 g005
Figure 6. Training and validation accuracy and loss plots for training deep learning models to identify diseased regions using tile segments of size 1000 × 1000 pixels.
Remotesensing 14 04140 g006
Figure 7. Training and validation accuracy and loss plots for training deep learning models to identify diseased regions using SLIC segments with a compactness (m) value of 5.
Remotesensing 14 04140 g007
Figure 8. Training and validation accuracy and loss plots for training deep learning models to identify diseased regions using SLIC segments with a compactness (m) value of 10.
Remotesensing 14 04140 g008
Figure 9. The sliding window algorithm identifies and highlights diseased regions in UAS imagery acquired in diseased fields.
Remotesensing 14 04140 g009
Figure 10. Home page of the GeoDLS web application.
Remotesensing 14 04140 g010
Figure 11. Image upload box.
Remotesensing 14 04140 g011
Figure 12. The GeoDLS web application identifies diseased regions in corn fields.
Remotesensing 14 04140 g012
Figure 13. Pinpoint diseased regions on maps using RTK geolocation information.
Remotesensing 14 04140 g013
Figure 14. Email notification corresponding to diseased corn fields sent to users from the GeoDLS.
Remotesensing 14 04140 g014
Figure 15. GeoDLS smartphone application.
Remotesensing 14 04140 g015
Table 1. Dataset distribution for training deep learning models for identifying diseased regions using tile segmentation.
ClassTraining ImagesTesting Images
Diseased (250 × 250 pixels)349348
Healthy (250 × 250 pixels)251251
Background (250 × 250 pixels)303302
Diseased (500 × 500 pixels)255254
Healthy (500 × 500 pixels)164163
Background (500 × 500 pixels)138138
Diseased (1000 × 1000 pixels)124123
Healthy (1000 × 1000 pixels)137136
Background (1000 × 1000 pixels)2525
TOTAL17461740
Table 2. Dataset distribution for training deep learning models for identifying diseased regions using SLIC segmentation.
ClassTraining ImagesTesting Images
Diseased (m = 10)121121
Healthy (m = 10)121120
Background (m = 10)121121
Diseased (m = 5)137135
Healthy (m = 5)136136
Background (m = 5)161160
TOTAL797793
Table 3. Testing accuracies and testing loss when tile size of 250 × 250 pixels was used.
ModelTesting AccuracyTesting Loss
VGG16100.00%0.0041
ResNet5056.25%15.0615
InceptionV393.75%0.1242
DenseNet169100.00%0.0251
Xception100.00%0.0007
Table 4. Testing accuracies and testing loss when tile size of 500 × 500 pixels was used.
ModelTesting AccuracyTesting Loss
VGG16100.00%0.0077
ResNet5025.00%8.3028
InceptionV3100.00%0.0045
DenseNet169100.00%0.0048
Xception100.00%0.0265
Table 5. Testing accuracies and testing loss when tile size of 1000 × 1000 pixels was used.
ModelTesting AccuracyTesting Loss
VGG16100.00%0.0190
ResNet5087.50%0.3000
InceptionV3100.00%0.0242
DenseNet169100.00%0.0003
Xception100.00%0.0023
Table 6. Testing accuracies and loss when SLIC segmentation was used to create superpixels with a compactness (m) value of 5.
ModelTesting AccuracyTesting Loss
VGG1693.75%0.1872
ResNet5025.00%5.4016
InceptionV381.25%0.9234
DenseNet16981.25%0.2556
Xception81.25%0.4240
Table 7. Testing accuracies and testing loss when SLIC segmentation was used to create superpixels with a compactness (m) value of 10.
ModelTesting AccuracyTesting Loss
VGG1681.25%0.3636
ResNet506.25%3.6130
InceptionV387.50%0.5060
DenseNet16993.75%0.2469
Xception75.00%0.6832
Publisher’s Note: MDPI stays neutral with regard to jurisdictional claims in published maps and institutional affiliations.

