1. Introduction
Unmanned aerial vehicles (UAVs) have recently seen increased use in the field of surveillance and monitoring. Depending on the payload, they can be used for environmental monitoring, fire control, search and rescue, visual inspections, or other applications. Most systems require a high-resolution or thermal camera. Although it might be useful to have visual information, such systems are in principle not required for environmental monitoring of radioactivity. It is, after all, not possible to detect, identify. and characterize radioactive material with this equipment [
1,
2,
3,
4].
Most radioactive materials emit gamma and/or X-rays as they decay. The fact that this type of radiation can be detected over large distances in the environment, due to the limited attenuation in air, makes gamma spectroscopy the most common detection technique of radioactivity using UAVs [
5]. While the environmental monitoring of gamma and X-ray radiation with UAVs creates new opportunities for radiological protection in routine and emergency scenarios, as well as for the monitoring of radioactivity in the environment, it also poses new challenges. A first advantage of the use of UAVs is the possible autonomy, i.e., not requiring an operator to perform the measurements. With most radiological surveys, an operator has to systematically map the area of investigation with a hand-held detector. Operators could be exposed to increased levels of ionizing radiation, which is a safety concern. Additionally, operators could possibly influence measurements by shielding the detector with their bodies. By using a UAV, both issues are resolved. No dose is absorbed by operators and the UAV does not shield the detector from the ground [
6,
7]. A second advantage is accessibility. People are restricted in their movement because of terrain or vegetation. Although UAVs must also be operated cautiously near high structures and trees, UAVs are less restricted in their movement and can easily reach difficult-to-access places. A third advantage is the reproducibility of UAV surveys. The flight plans can be repeated to see the evolution of a contaminated site over time or to follow up remedial actions [
8]. A fourth advantage is the speed of UAVs, making them able to map large areas in a relatively short timeframe. This is especially important in emergency scenarios where decisions on protective measures need to be made quickly. An alternative for UAVs are helicopters. However, helicopters require both a pilot and an operator, which puts two people at risk of exposure to ionizing radiation.
A downside of using UAVs as an instrument for surveys is the minimal flight altitude of the UAV, which causes a decreased efficiency of the measurement. Depending on the geometry of the radioactive source, the reduction in efficiency can be caused by a combination of the inverse-square law and the attenuation in air. For point sources, the inverse-square law will cause the most significant part of the reduction, while for a surface source the attenuation will be the main parameter that influences the efficiency. Besides the reduction in efficiency, an increase in height also increases the field of view of the detector and therefore decreases the spatial resolution. The decrease in spatial resolution due to the field of view can be improved by using a collimator. However, this makes detection more complex and adds weight to the payload. A second problem specific to battery-powered drones is their power consumption. On the one hand, if a UAV would fly too slowly over an area of investigation, it will not be able to carry out the full site survey due to the limited battery power. On the other hand, by flying too fast, the measurements will be integrated over a larger area, resulting in a decrease in spatial resolution. A final issue is the presence of high structures that have to be avoided. This requires pre-flight visits to acquire the position of the obstacle, and pilots might have to intervene during an automated flight when there is a risk of collision.
In recent years, new experiences have been reported regarding radiological monitoring and surveillance using drones. Several studies were performed with both fixed-wing and multicopter drones incorporating a detector system as payload [
9,
10,
11,
12,
13,
14,
15]. Depending on the task, payloads were optimized in regard to their efficiency, detection method, or mapping. In this paper, we will discuss the development and first results of a new fully optimized drone–detector system using a fixed-wing UAV. For the intended applications, namely radiological monitoring in accident scenarios with gamma-ray-emitting nuclides, we do not require data that are highly spatially resolved. Therefore, the minimal height does not pose a problem. However, during accidents, it is beneficial to use a system that can be airborne for multiple hours and that has the ability to identify and quantify the release or contamination based on gamma spectroscopy. The optimization and development of the new drone–detector system described in this paper is focused on these parameters and requirements.
In principle, if the geometry is known, the gamma-ray flux can be calculated. Combined with the characterization of the detector this allows to quantify the source. For point sources, the gamma-ray flux at the detector location can be easily determined. For surface contaminations, however, the procedure is slightly more involved. To determine the gamma-ray flux in this case, the historic work of Beck et al. [
16] on in-situ gamma-ray spectroscopy or the IAEA technical document 1092 [
17] can be extended to UAV measurements. Their theoretical frameworks allow for calculating the flux at the detector that originates from either contamination or naturally occurring radioactivity in the soil. This requires extensive knowledge of the detector response as well as a good approximation of the distribution of radioactivity in the soil as a function of the depth.
A spectroscopic system allows us to detect increased radiation levels either as an increase in the total count rate or as the presence of certain lines in the gamma-ray energy spectrum. The latter allows for the identification of radioisotopes. However, the geometry of a source has a significant influence on the measurements. This can make the quantification of a radioactive source a challenging task. The relation between the detector signal (e.g., the net gamma peak area count rates in gamma spectroscopy) as measured during the drone flight and the radiation source (i.e., the calibration factor
, which is specific for every gamma-ray energy), can in general be written as:
where
is the net peak area counting rate obtained from the measured spectrum,
is the surface or soil concentrations expressed in Bq/m² or Bq/m
3 respectively,
is the net peak area counting rate from a point source measurement with the point source positioned normal to the detector face, and
the flux of incoming gamma rays expressed in gammas/cm² s. Beck et al. and IAEA split the detector response in three factors as shown in Equation (1). The first factor,
, is the estimate of the counts per second under the net peak counting rate due to a unit flux incident normal to the detector face. The second factor,
, is the angular correction factor for the detector and depends on the gamma energy incident on the detector. The angular response is integrated over the spatial distribution in the ground. The last factor,
, is the ratio of the incident flux over the concentration.
In this paper, we describe the development and testing of an optimized drone–detector combination for monitoring during the threat, release, and post-release phases of a nuclear or radiological event. Further, it is demonstrated that the system at different flying altitudes is capable of quantifying a radioactive source. This is done for naturally present potassium-40 in the soil by comparing the UAV results with soil sampling results. This experiment demonstrates that the system can also be used for other applications outside nuclear and radiological emergency response.
In
Section 2, the fixed-wing UAV parameters are described as well as the design and hardware structure of the detector system. Additionally, Equation (1) will be explained in more depth, especially regarding the quantification of radioactive concentration in soil.
In
Section 3, we will present the data obtained during two separate flights. The flights were performed above agricultural fields that contain only natural radioactivity typical for the region and soil type. The gathered data were then used to calculate the potassium-40 (K-40) concentration in the soil. K-40 is a natural radioactive material that emits a gamma ray with an energy of 1460.8 keV that can be measured by a gamma spectroscopy device. To test the detector system, we compared the measured concentrations with concentrations obtained by taking soil samples at the surrounding fields.
2. Materials and Methods
2.1. Penguin C
The Penguin C is a fixed-wing drone with a gas-powered engine with electronic fuel injection. It can fly with a maximum payload of 2 kg and has a maximum take-off weight (MTOW) of 23 kg. With a flight endurance of up to 12 h, it can easily manage to stay airborne during accidental radiological releases to give live updates on the situation. The wingspan of the Penguin C is 3.3 m, and it has a length of 2.3 m. A pressurized catapult is used to launch the drone with an acceleration of 6 G. To cope with these forces, it is necessary to have a robust detector system. To land, the drone uses a parachute in combination with an airbag. The landing procedure is started a couple of minutes in advance, taking into account wind, location, and heading to make sure the drone lands in a clear zone without trees or other obstacles. The airbag is used to reduce the impact and minimize the risk of damaging the drone and payload. The drone and ground control station communicate with each other over long-range data transmission using a tracking antenna. The antenna has a range of 100 km and can send data at a speed of 12 Mbps. The altitude range of the fixed wing is between 120 m (400 ft) and 5000 m (FL160). For radiological mapping using drones, the lowest altitude is determined by the automatic deployment altitude of the parachute, which Sabca set to a height of around 150 m for safety reasons. This range is ideal to survey the area of a nuclear site and its surroundings. In the threat and release phases of a radiological accident, the UAV can fly at high altitudes to avoid contamination by potentially released radioactive material. In the post-release phase, the UAV can fly at lower altitudes, typically just above common structures in the landscape, to map the area in detail. The drone has a nominal cruise speed of 19–22 m/s and a maximum speed of 32 m/s.
Figure 1 shows the fixed-wing drone mounted on the pressurized catapult.
The flight plan can be created and adapted on the spot with the ‘Piccolo’ software [
18]. The Piccolo software can adapt the flightpath during the flight. For accident scenarios, adapting the height is useful to avoid contamination by the released radiological plume or to improve the spatial resolution and efficiency for monitoring contaminated sites. For the performed flights, we used two flightpaths. The first path was a circle with a 300-m radius at multiple heights, while the second path was a scanning grid. The path can be closely monitored since the drone transmits all parameters each 0.1 s. Afterwards, these parameters can be used for post-processing. For example, this involves incorporating the tilt angle into the angular dependence and correcting the altitude due to topography changes.
2.2. Overal Requirements and Limits
The design of the payload has certain limits and requirements. Firstly, the weight limit of the payload is 2 kg. In case of additional weight, the flight performance of the Penguin C is significantly worsened, and adaptations are required for stabilizing the drone. Secondly, to achieve a decent spatial resolution, the detector has to take spectra every second. However, to obtain better counting statistics in the spectra, it is possible to combine multiple spectra, which reduces the spatial resolution but improves the counting statistics of the spectra. Thirdly, data can be transmitted with a maximum bandwidth of 12 Mbps. The bandwidth is meant to be used for camera footage and therefore it is certainly possible to transmit text files that contain time, height, GPS coordinates, and spectrum data, which add up to approximately 24 kbps. Fourthly, the efficiency of the payload has to be optimized, as the height will cause the efficiency to drop due to the inverse-square law for point sources and due to attenuation for surface contaminations. Fifthly, because the drone–detector system is subject to strong accelerations and vibrations, a secure and safe connection has to be established between the payload and the drone. Therefore, we use a micro-D connector. These connectors are mainly used in the aerospace industry and comply with our needs regarding vibration resistance because of their shape and fastening screws between both ends of the connectors.
2.3. Detector Design
One of the main limitations of using a fixed-wing drone is the minimum height required to fly safely. For the Penguin C, this is approximately 150 m. Because of the inverse-square law and attenuation effects, the efficiency of a detector system is reduced significantly compared to a measurement at or near ground level. This can be compensated by increasing the detector volume. This, however, cannot be done irrespective of the payload of the UAV system. Consequently, to maximize the efficiency of the detector system it is necessary that the detector geometry and material be optimized. This was done by performing Monte Carlo simulations using the Monte Carlo code PENELOPE (2018), more specifically the main program penmain [
19,
20,
21,
22,
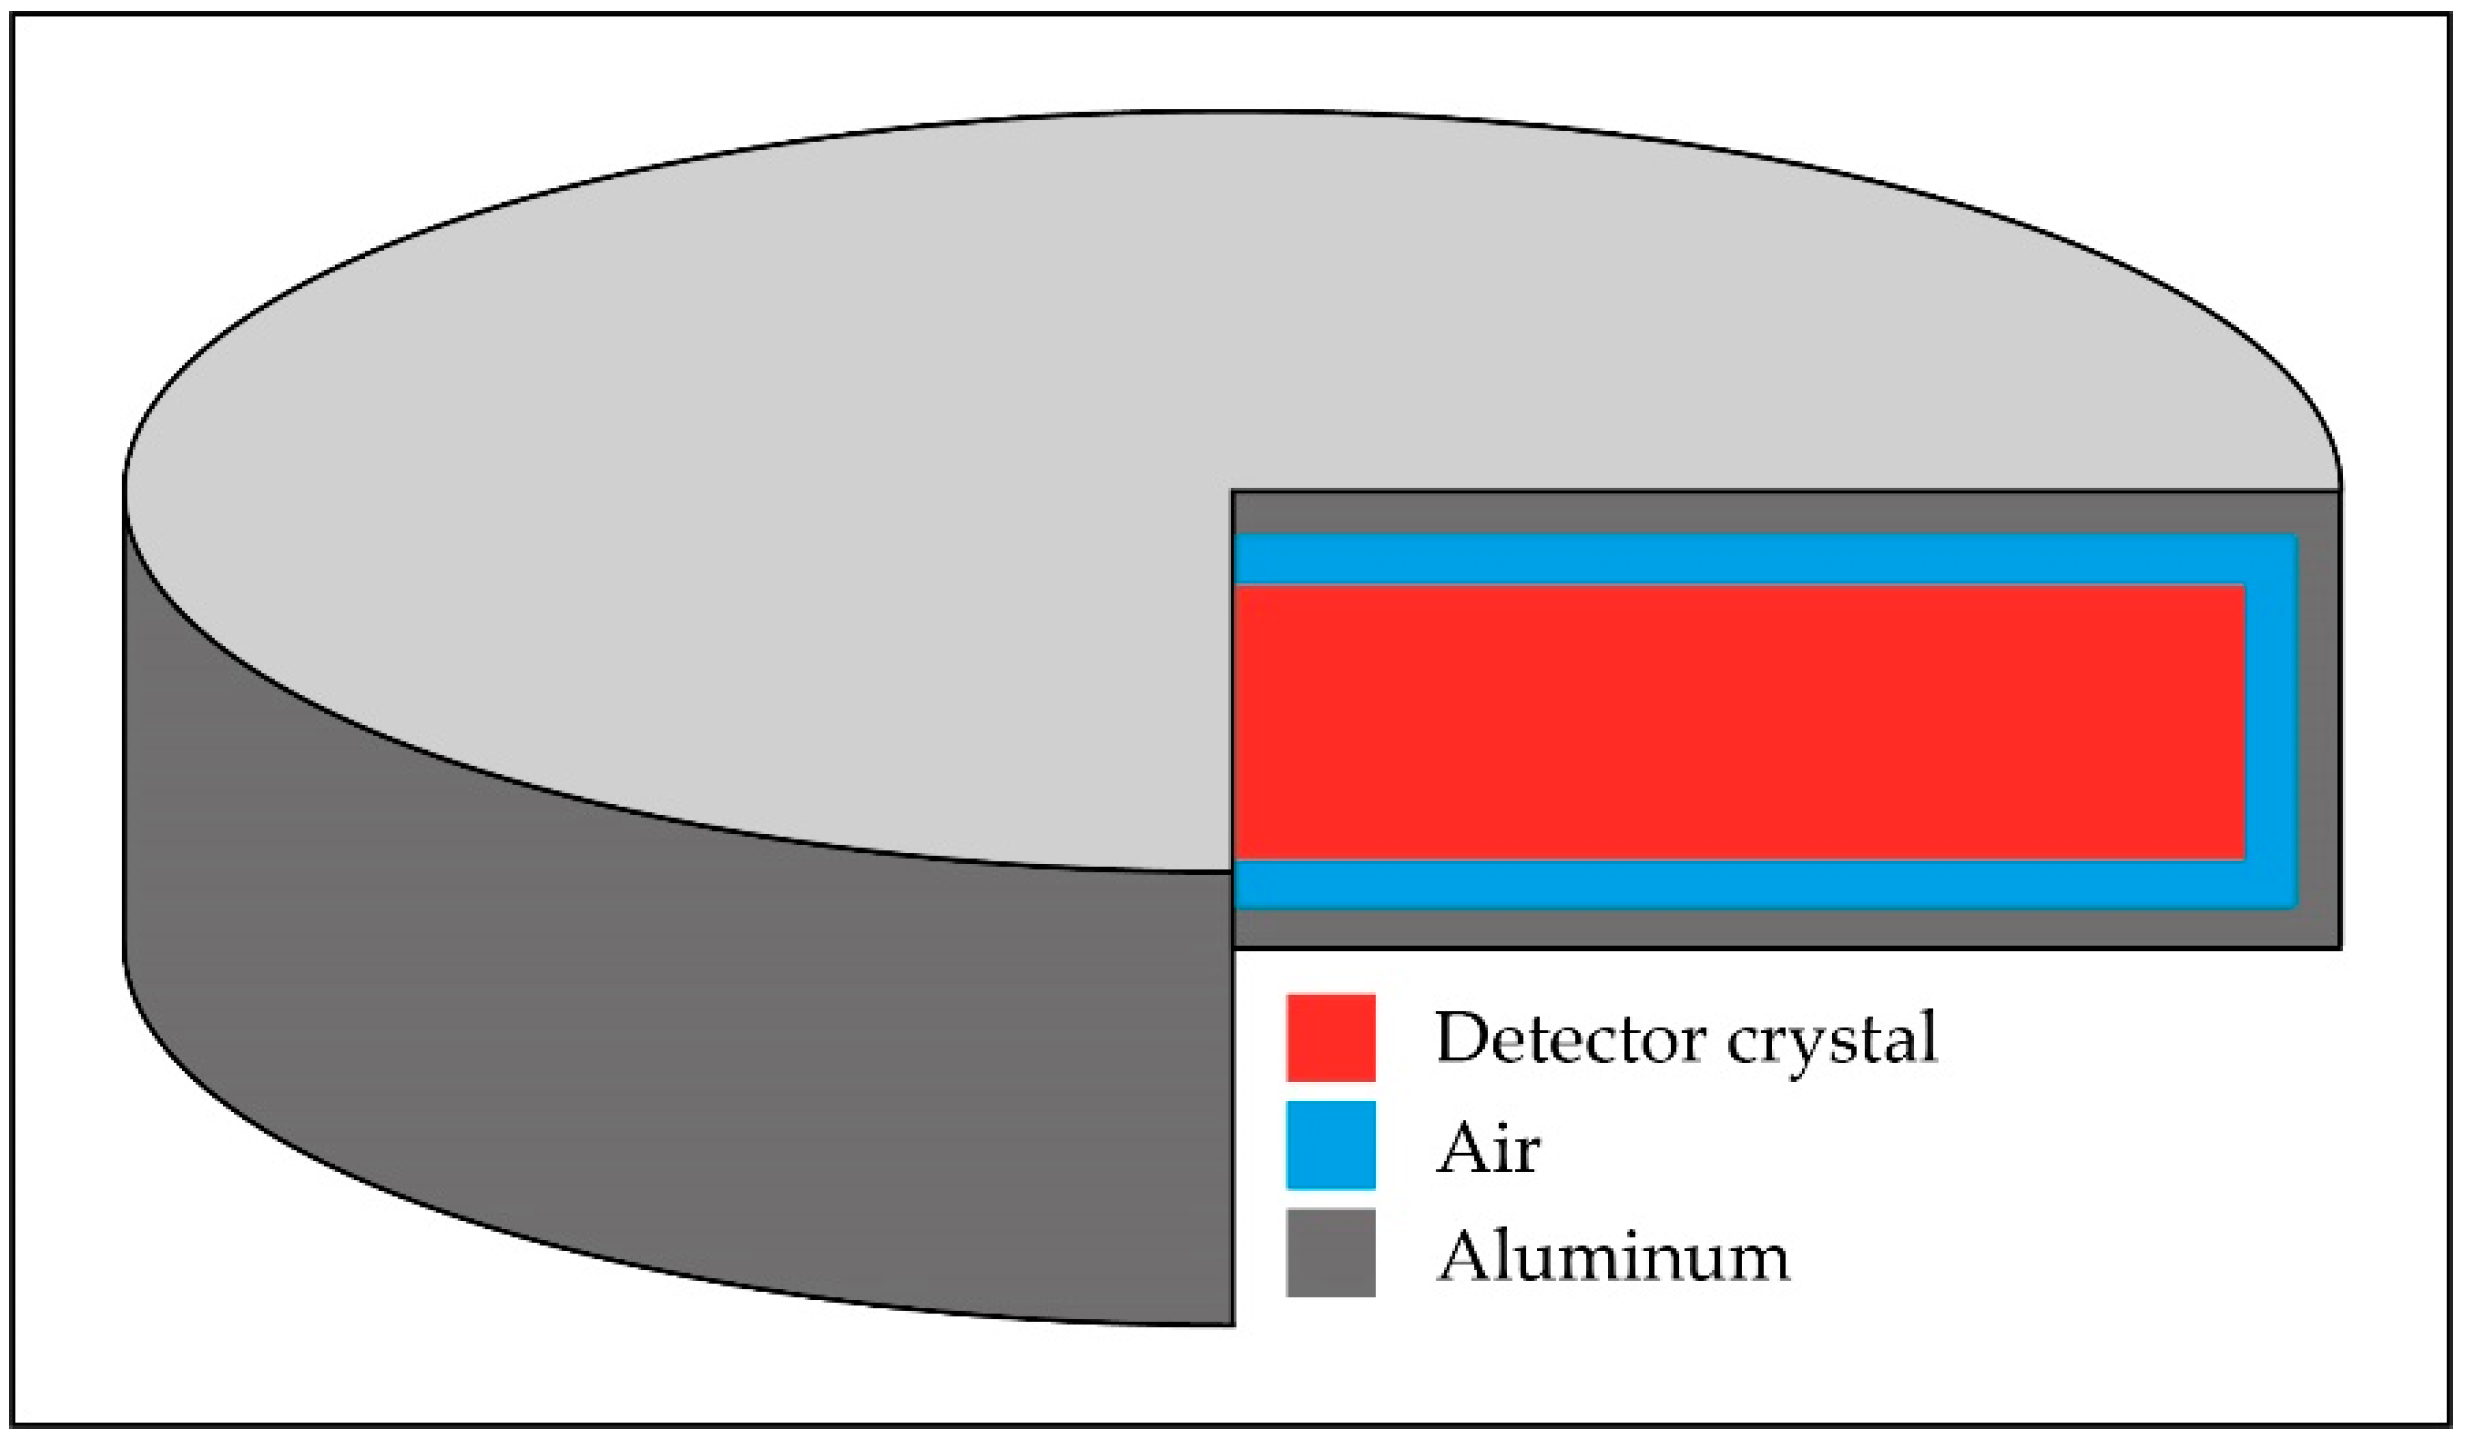
23]. Four types of detector material were selected (CsI, NaI, CeBr, and LaBr) and tested by simulating a cobalt-60 (Co-60) point source. Three other materials, CZT, BGO, and HPGe, were also taken into consideration initially but respectively discarded because of production volume, spectroscopic resolution, and cooling requirements. Each simulated detector was enclosed in an aluminum housing with a thickness of 1 mm that was separated from the detector crystal by another 1 mm of air. An example of the simulated detector geometry can be seen in
Figure 2, although please note that it is not to scale. We constrained the weight of the crystal to 1 kg and varied the thickness and radius of the crystal to keep the same volume and weight of detector crystal. This allowed us to add 1 kg of additional hardware materials, such as detector housing, electronics, cables, etc. The detection efficiency is strongly dependent on the gamma-ray energy emitted by the radionuclide. Co-60 was used because of its main gamma energies at 1173 keV and 1332 keV. These energies are on the high end when compared to gamma energies encountered in the decay of the most common artificial radionuclides. By optimizing the detector for higher energies, we make sure that the lower gamma ray energies will also be detected. Besides the gamma-ray energy, Co-60 is also easily available as a point source for calibrations.
The simulations were performed on the supercomputer of VSC (Vlaams Supercomputer Centrum) to perform parallelization to increase the number of counts in the spectrum and reach a statistical uncertainty of less than 0.2%. Parallelization was performed by running multiple instances of the simulations on different cores of the supercomputer. For each instance, a different seed was selected for the pseudo-random number generator. Afterwards, the results of the separate simulations were combined to obtain one simulation.
In
Table 1, all simulations are listed together with the geometries of the crystals and their full energy peak efficiencies calculated from the combined Co-60 peaks corrected for the gamma ray intensity. The simulations with the square slab geometry were slightly worse in regard to solid angle than their cylindrical counterparts. A last reason to prefer the cylindrical geometry is the symmetry: the cylindrical geometry makes it easier to determine the angular dependence and implement corrections for this effect. Therefore, we chose to investigate the cylindrical geometry further.
In the simulations, we worked with both an energy deposition detector and an energy impact detector defined to the detector crystal. Energy deposition detectors keep track of the distribution of the amount of energy that is absorbed by the entire crystal per decay while the energy impact detectors keep track of the distribution of the gamma rays that reach the detector crystal. Using these two types of detectors allowed us to calculate the solid angle, the full energy peak efficiency, and the detector efficiency of the detector crystal.
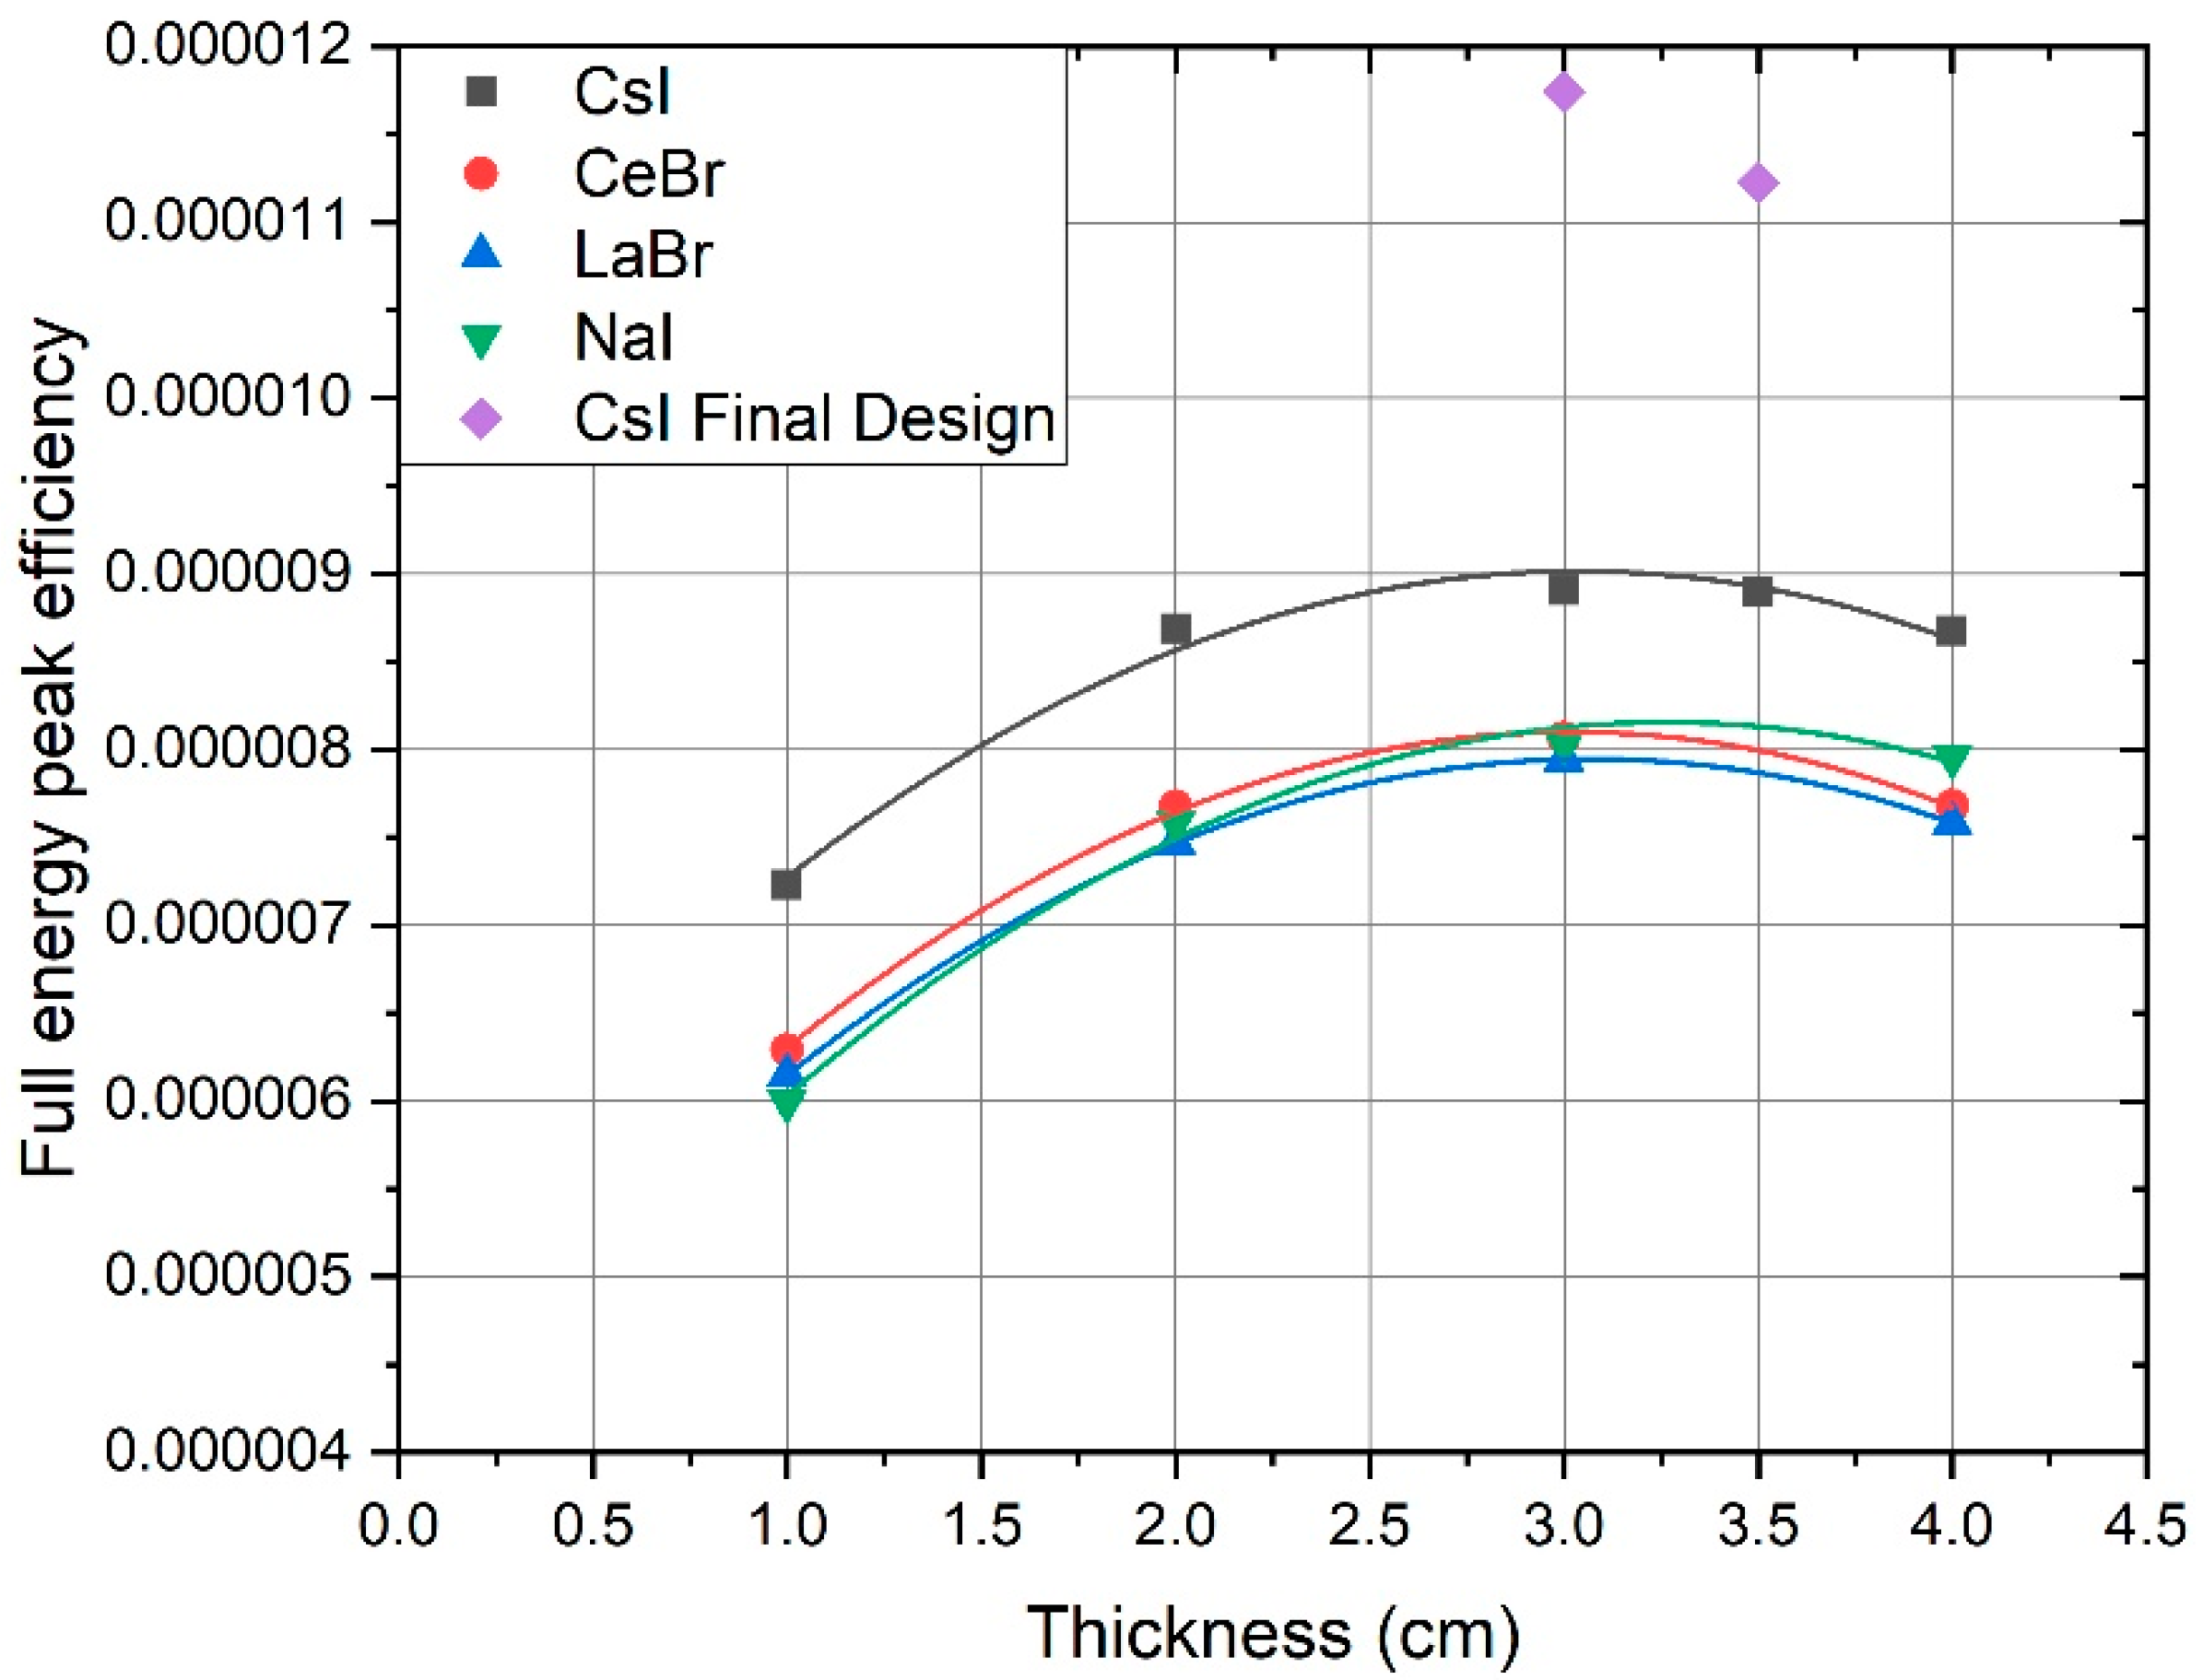
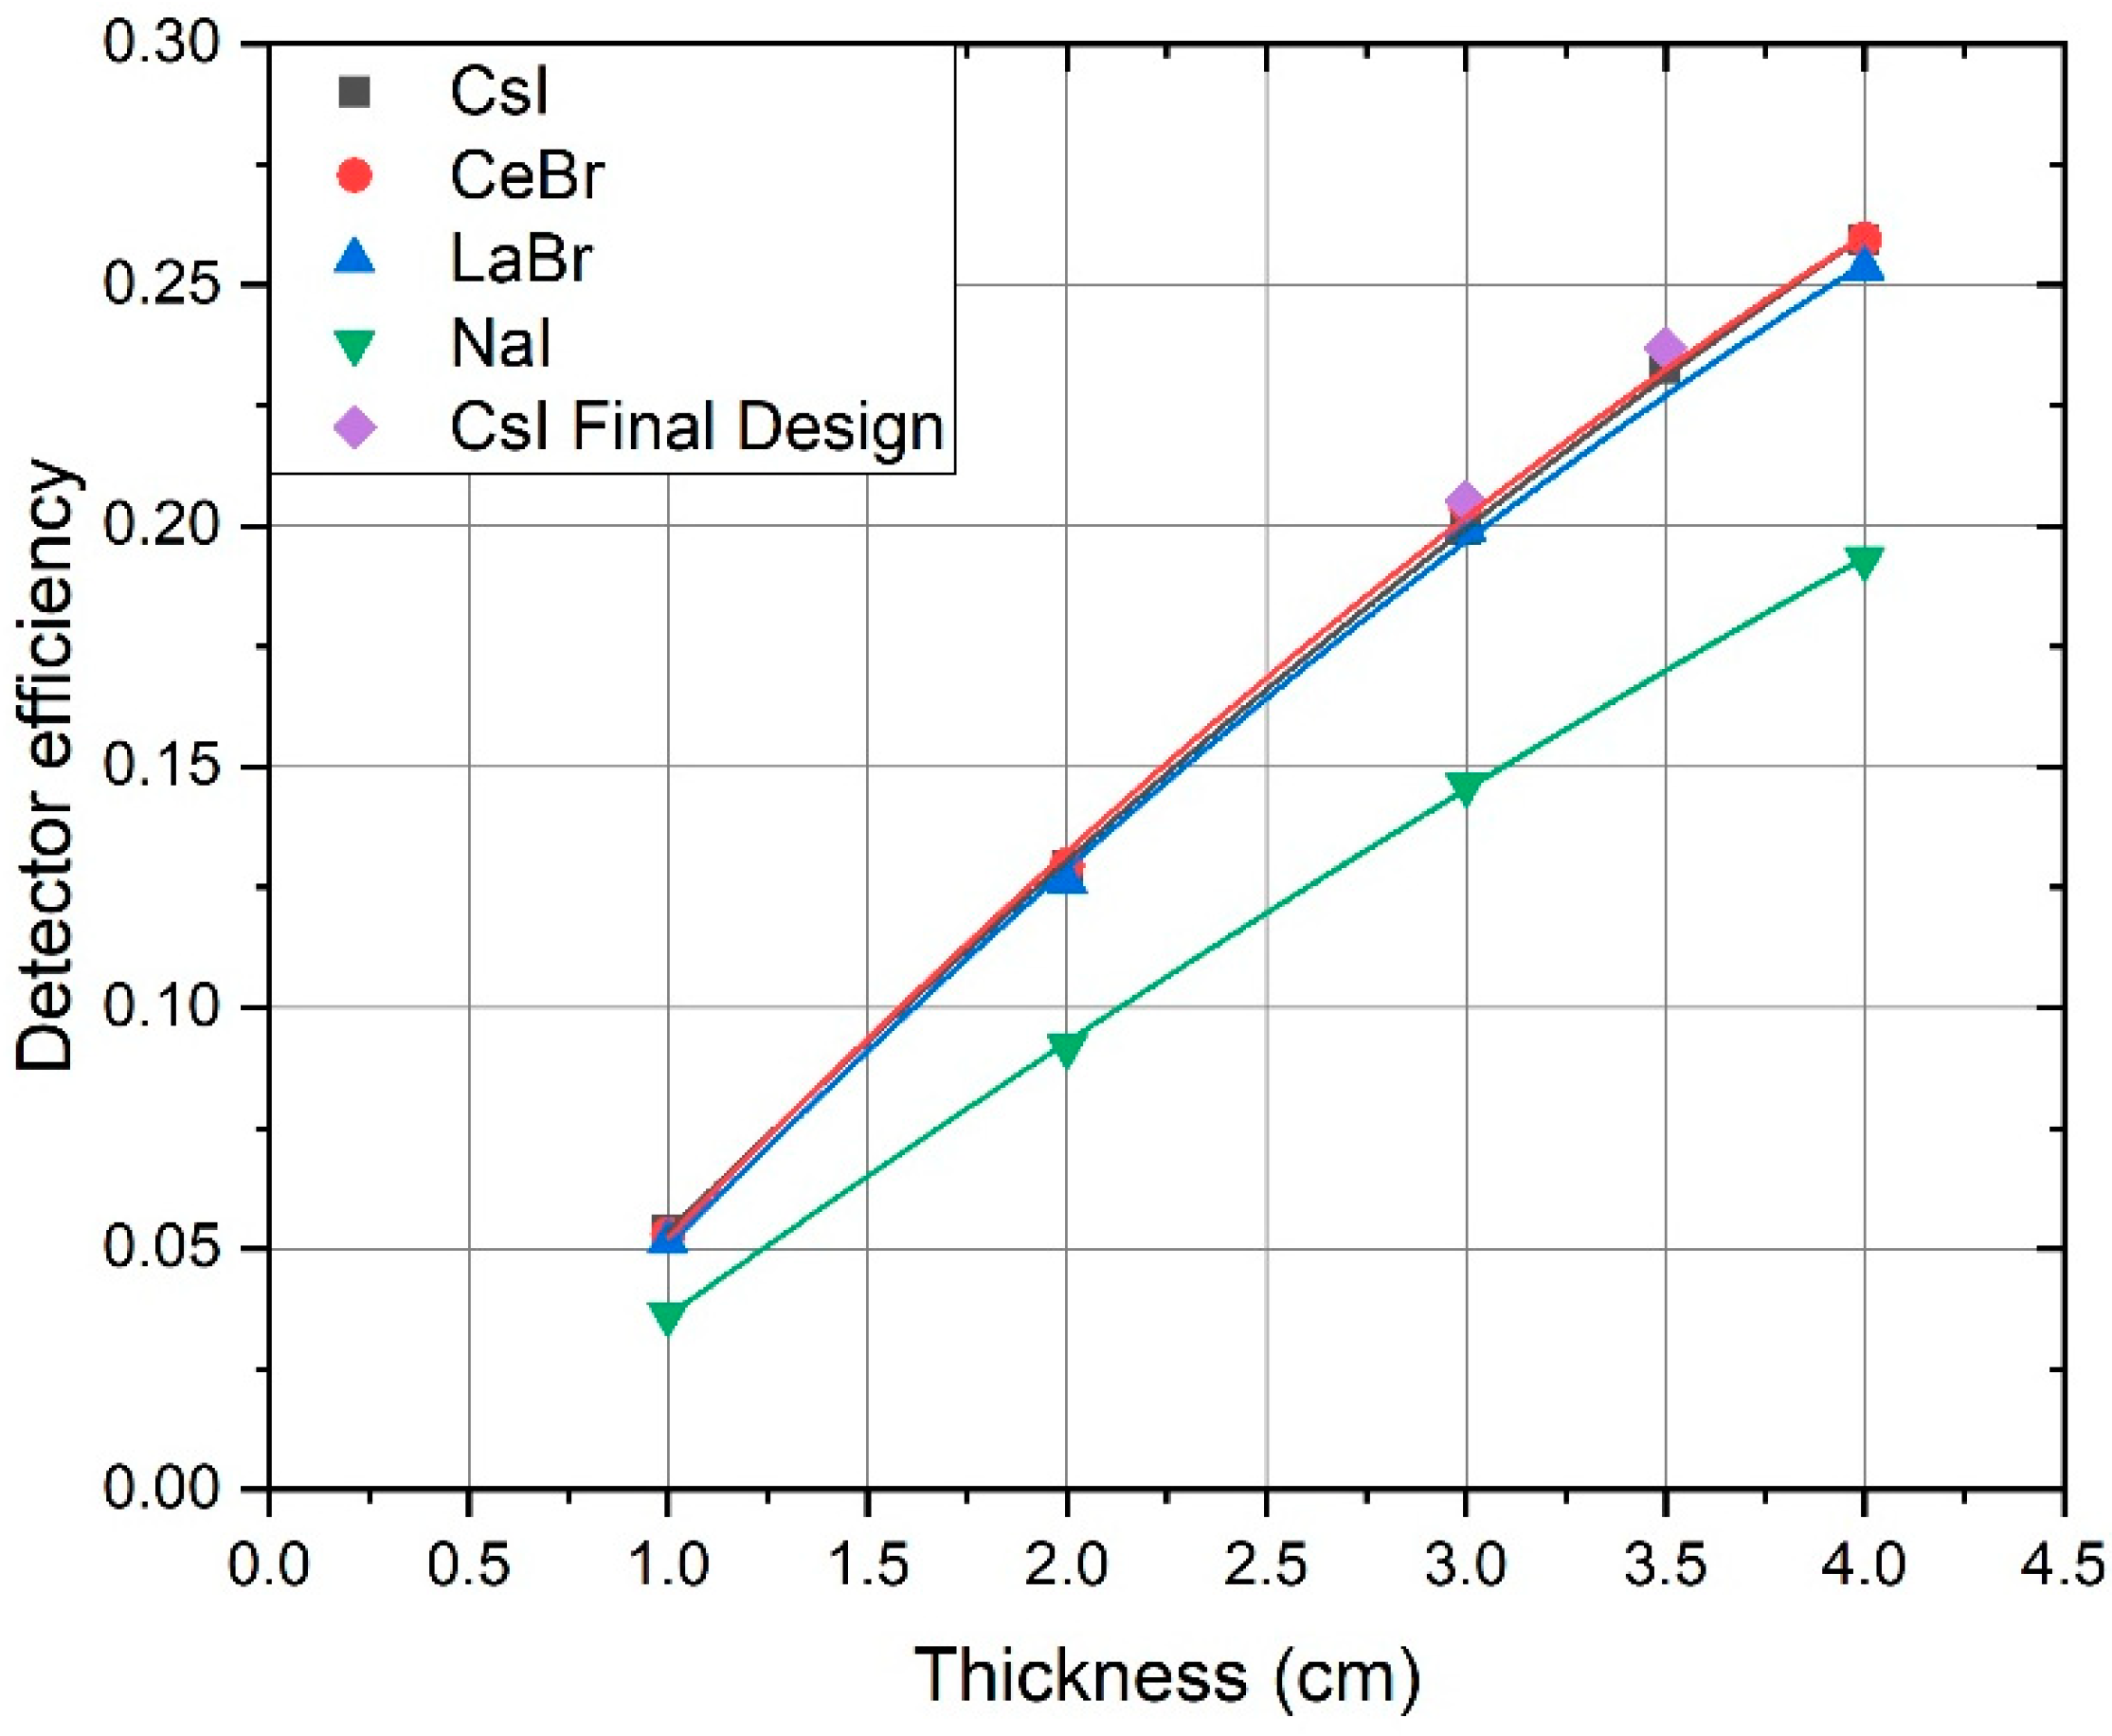
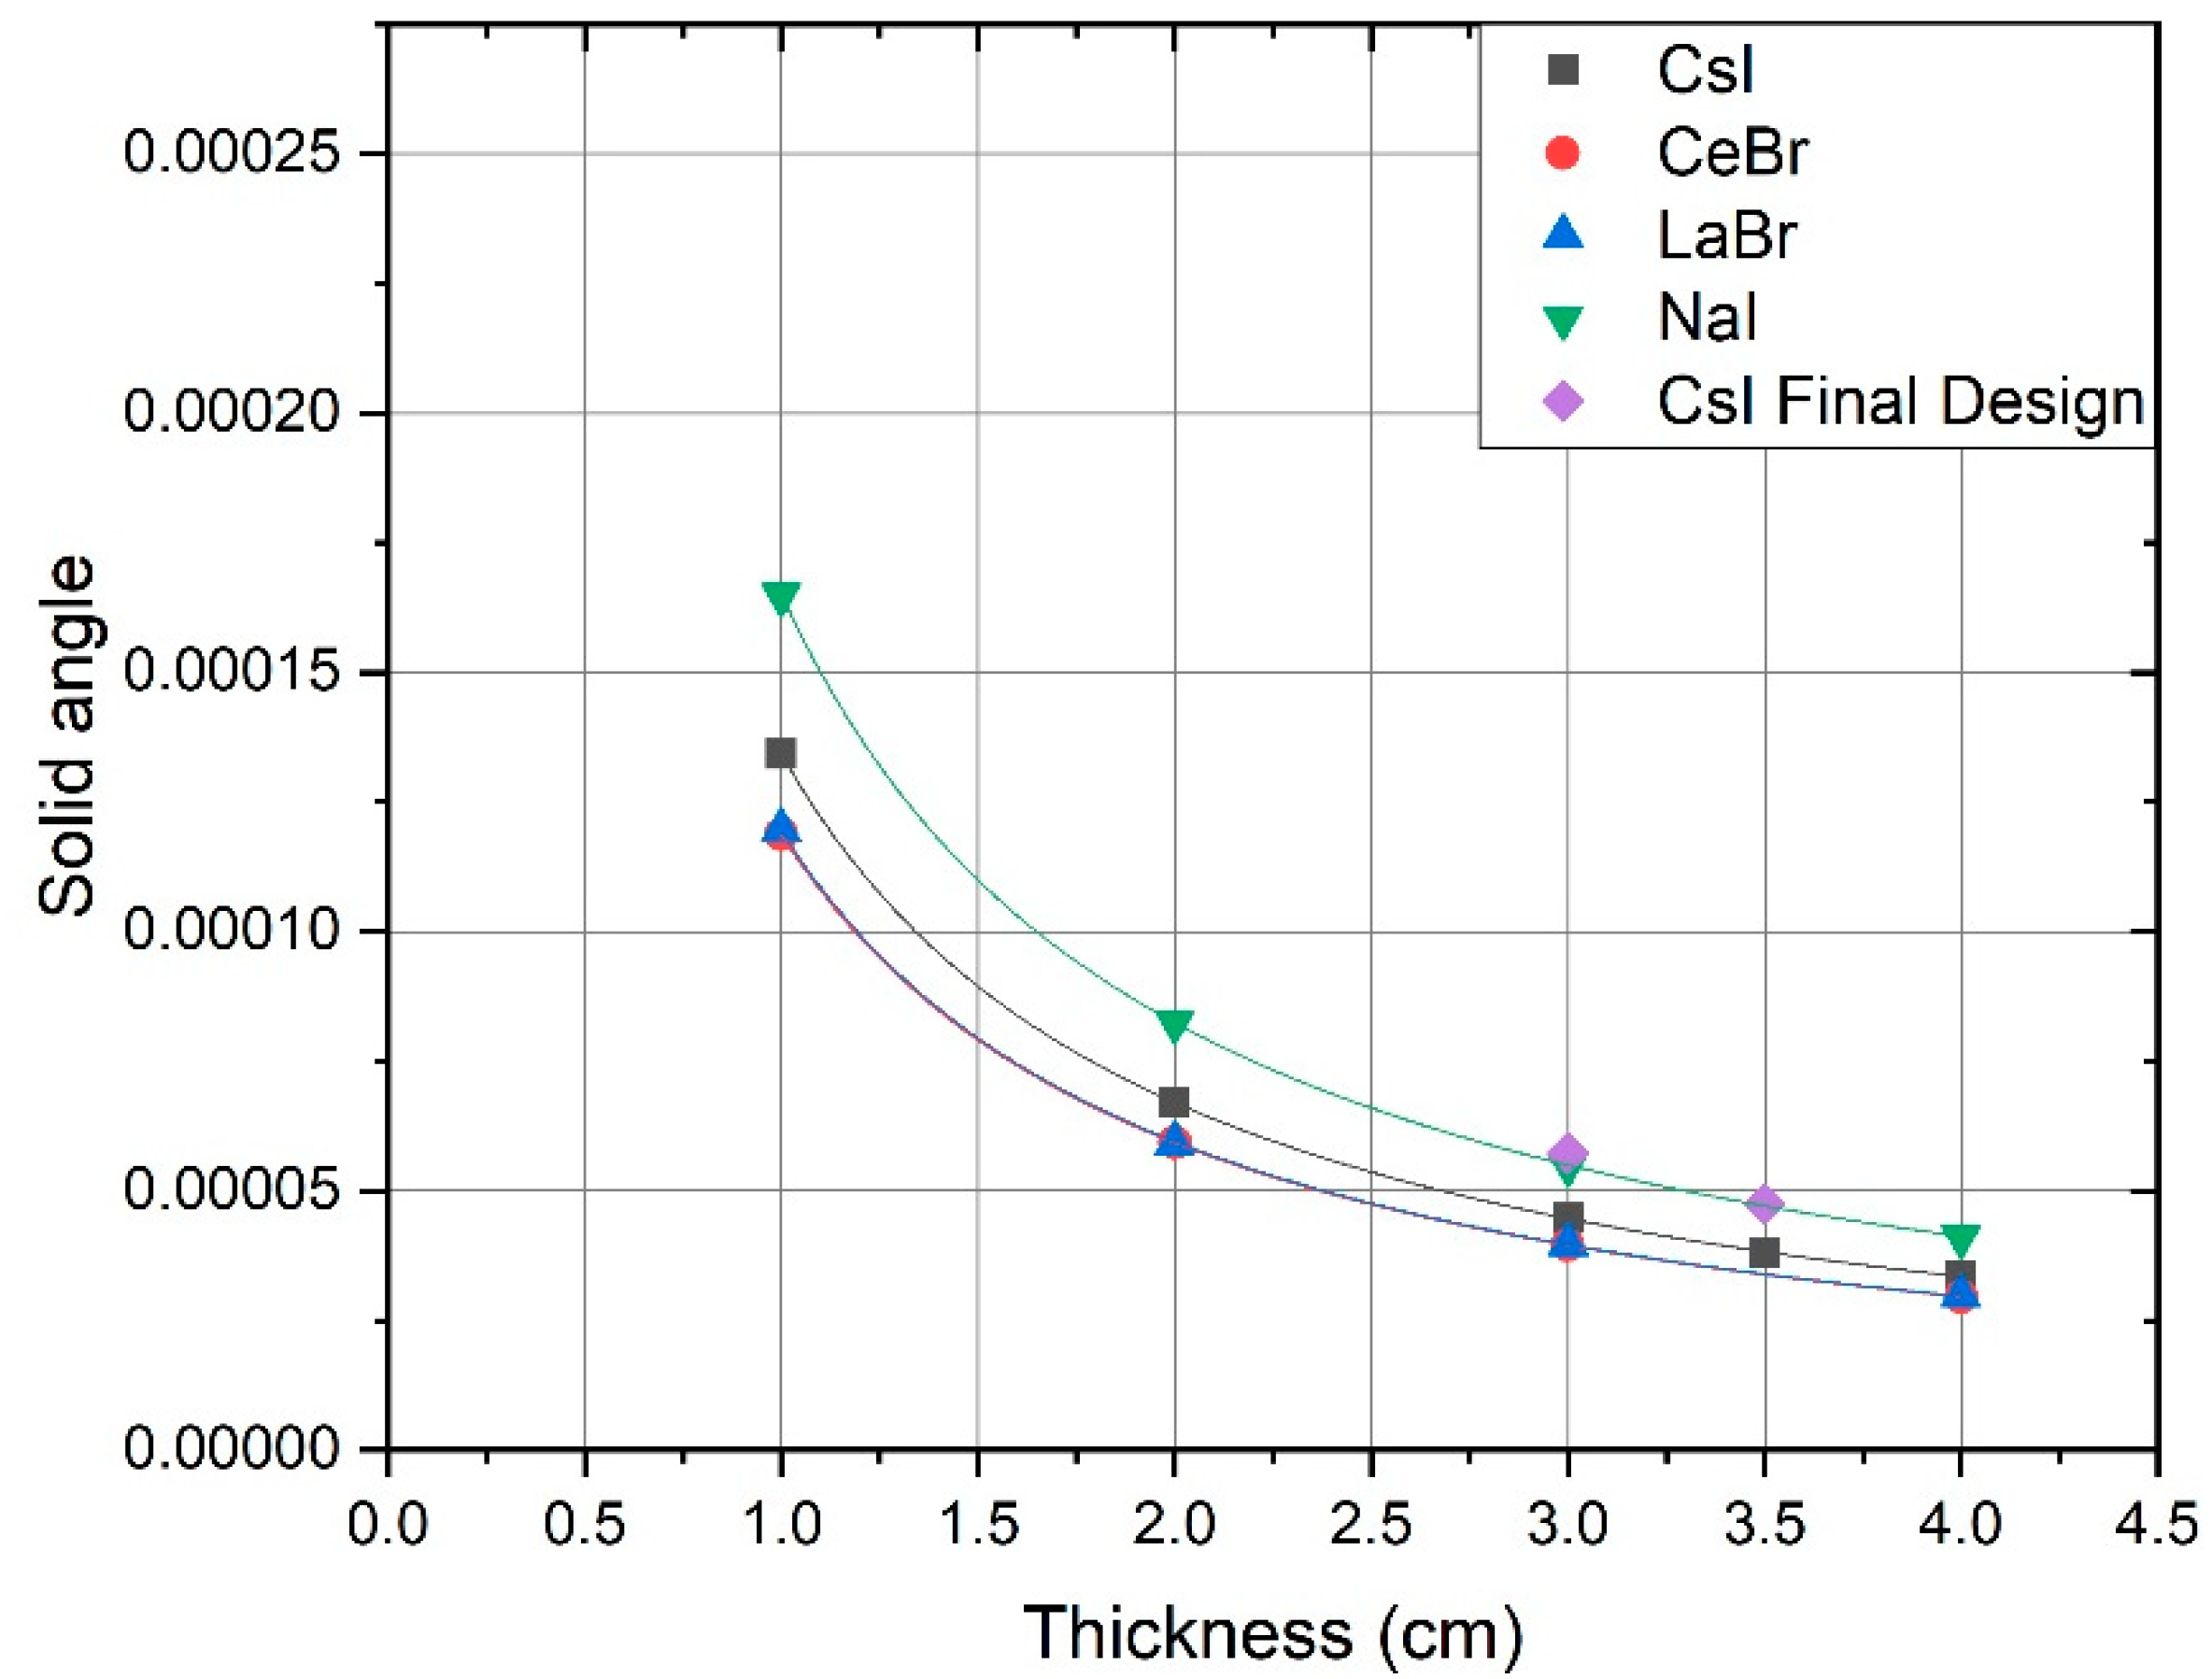
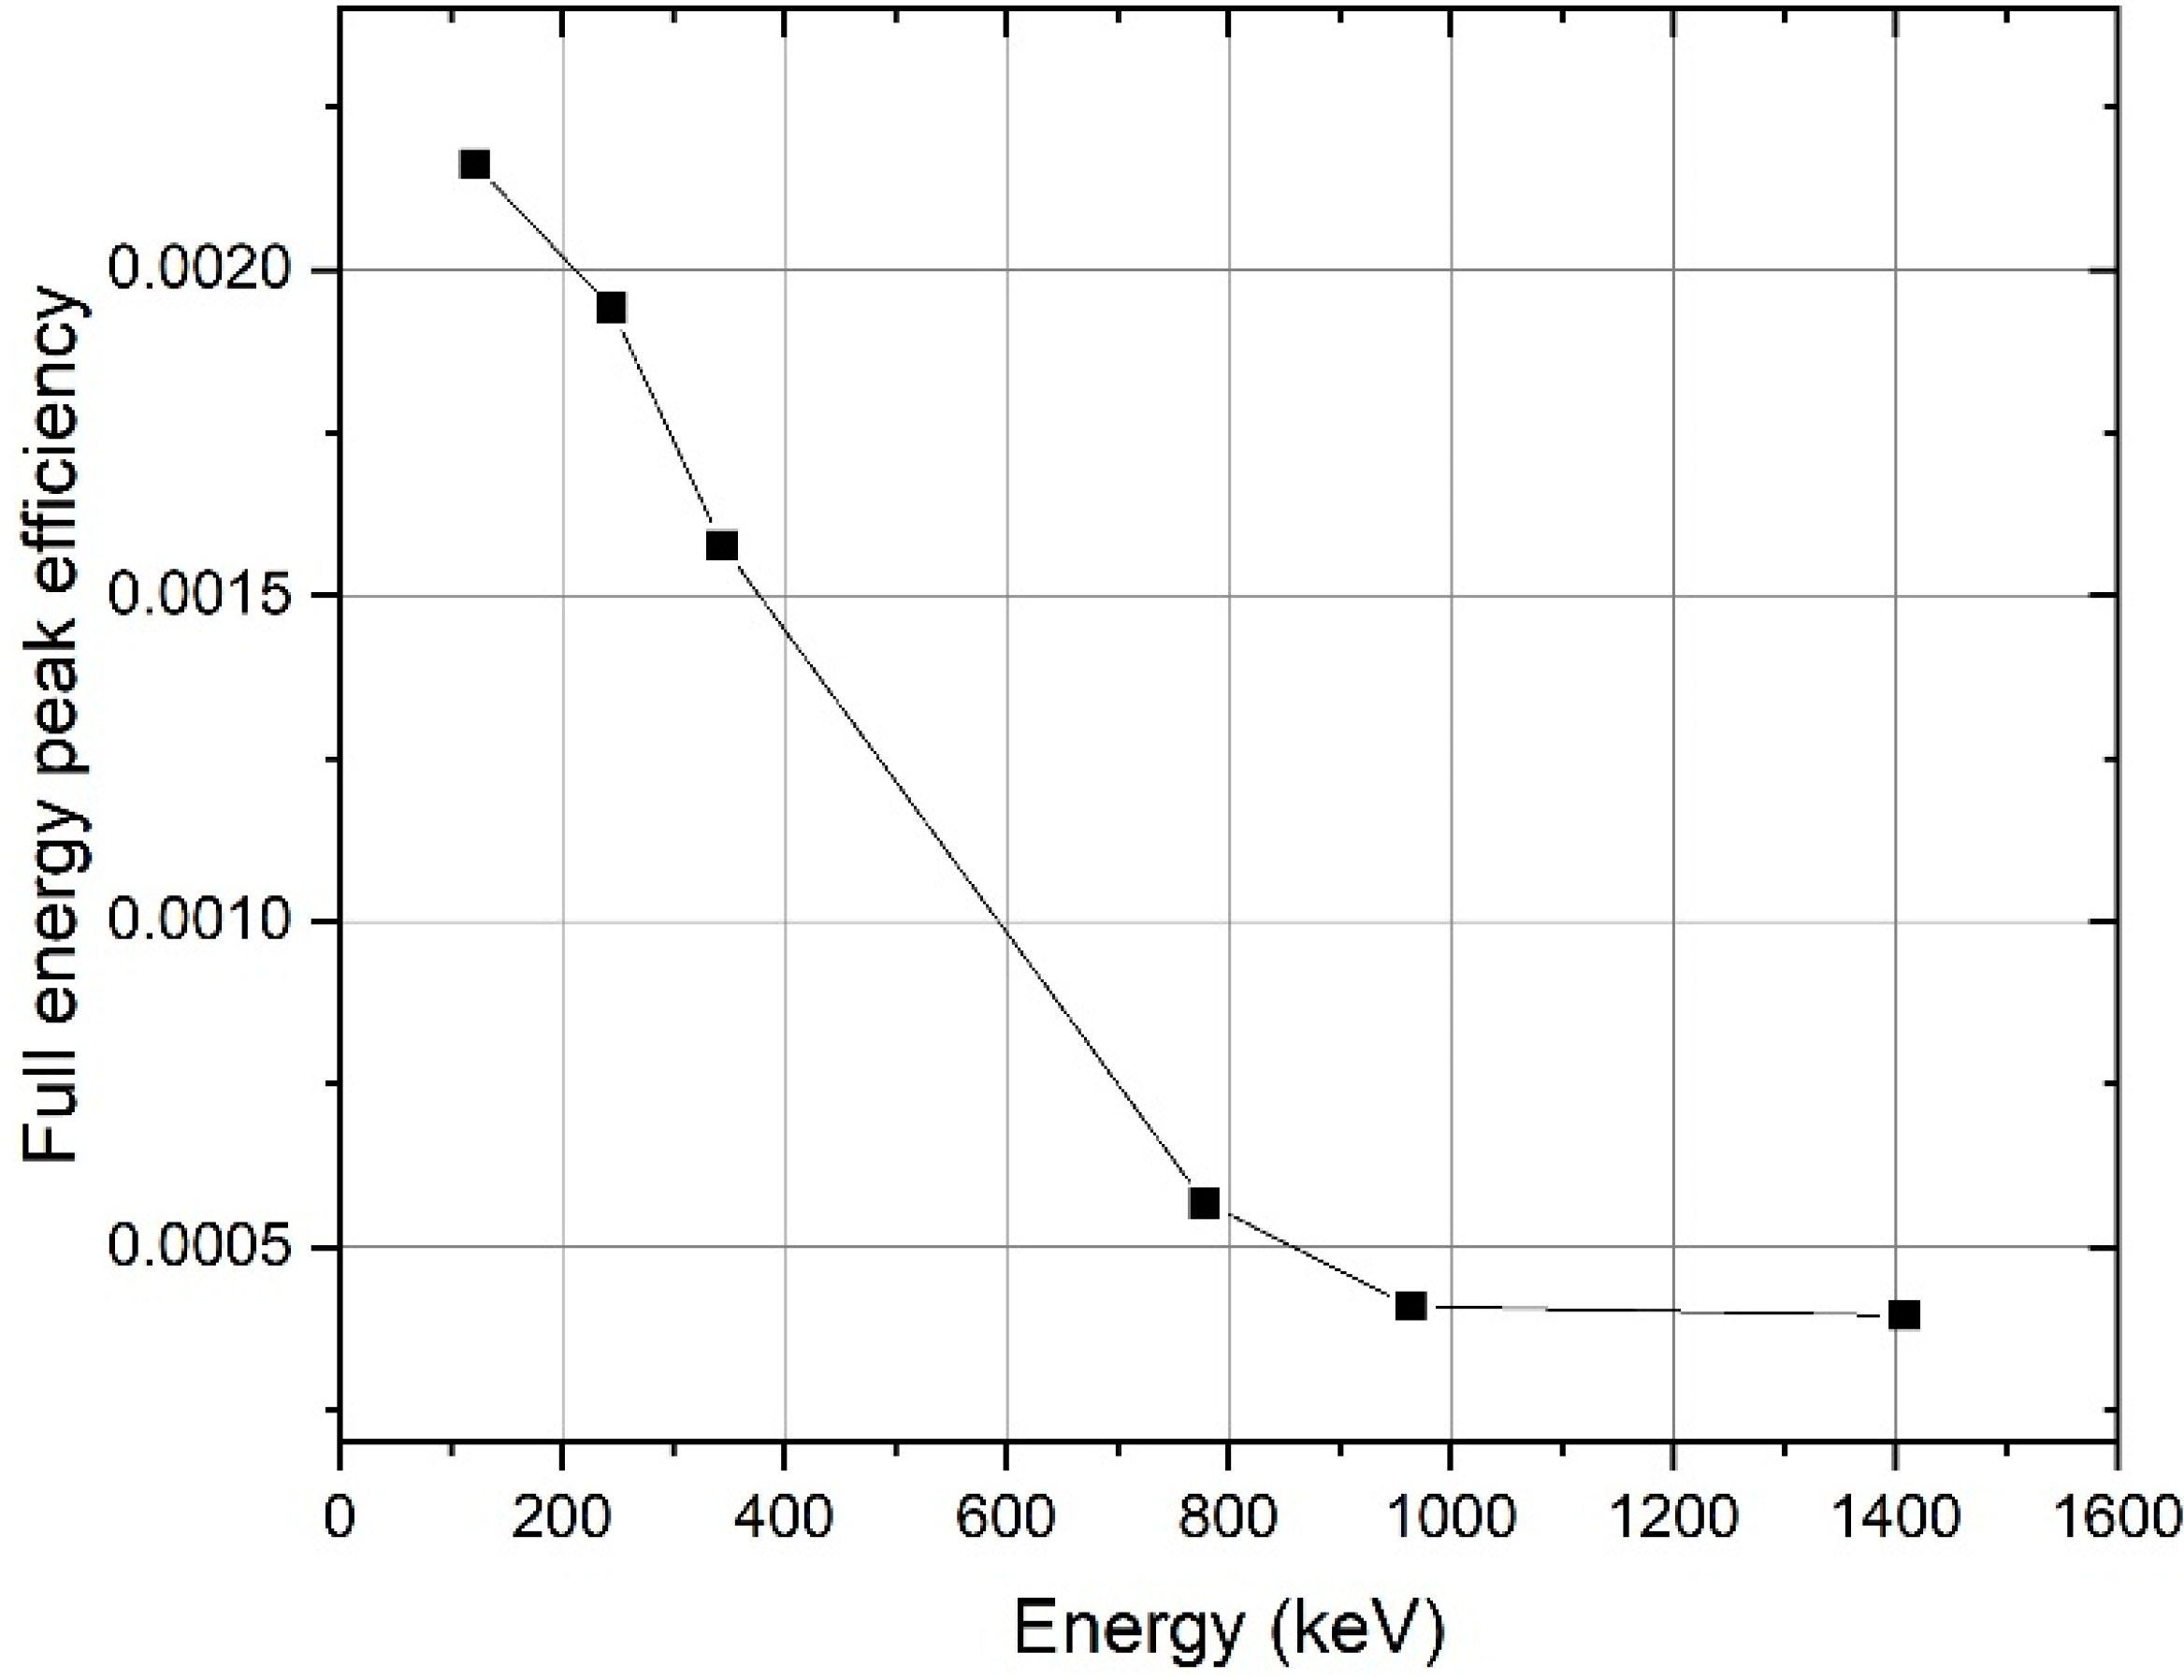
The solid angle, full energy peak efficiency, and detector efficiency calculated for different detector thicknesses are given respectively in
Figure 3,
Figure 4 and
Figure 5. The solid angle is defined as the ratio of the number of gamma-rays (with energy
) that reach the detector and the number of gamma rays (with energy
) emitted by the simulated source. The absolute full energy peak efficiency is defined as the ratio of counts in the simulated full energy peak and the number of gamma rays (with energy
) emitted by the simulated source. The detector efficiency is defined as the ratio of counts in the simulated full energy peak and the number of gamma rays (with energy
) that reach the detector.
Figure 3 demonstrates that CsI with a thickness of 3.0 cm gives the highest full energy peak efficiency. The source–detector distance is 5 m in the simulations because the simulation efficiency at a distance of 200 m is too low. For the extrapolation to larger distances, the detector efficiency, shown in
Figure 4, can be used as a decision parameter for the selection of a suitable detector material and size or the inverse square law can be used to apply a correction factor to account for the reduction in efficiency. In both cases, CsI comes out as an optimal option. We chose CsI because of these simulations and because it is less expensive than CeBr and LaBr. Furthermore, aerial measurements do not require high spectral resolution, making CsI a valid candidate [
24].
In the final design, it was noticed that the weight of the complete detector system was still below the predefined limit of 2 kg. Therefore, we adapted the detector shape slightly by increasing the radius of the detector to 5.5 cm. We chose to adapt the radius instead of the thickness by running a final set of Monte Carlo simulations investigating both options. The results of the simulations are shown in
Figure 3,
Figure 4 and
Figure 5. The final detector shape was set to a CsI disk with 3.0-cm thickness and a radius of 5.5 cm. This results in a detector weight of approximately 1.4 kg, including the aluminum housing with a thickness of 0.8 mm at the entrance window of the detector.
Usually, scintillation detectors require a photomultiplier tube (PMT) to amplify the signal caused by the light-output from the crystal. However, a PMT is large and heavy. Therefore, it is better to use silicon photomultipliers (SiPM) that are smaller and lighter. Their downside is that the resolution of the spectra will be slightly worse, but since we are already using a CsI detector, the reduced resolution will have a limited influence, as shown in [
25,
26,
27,
28].
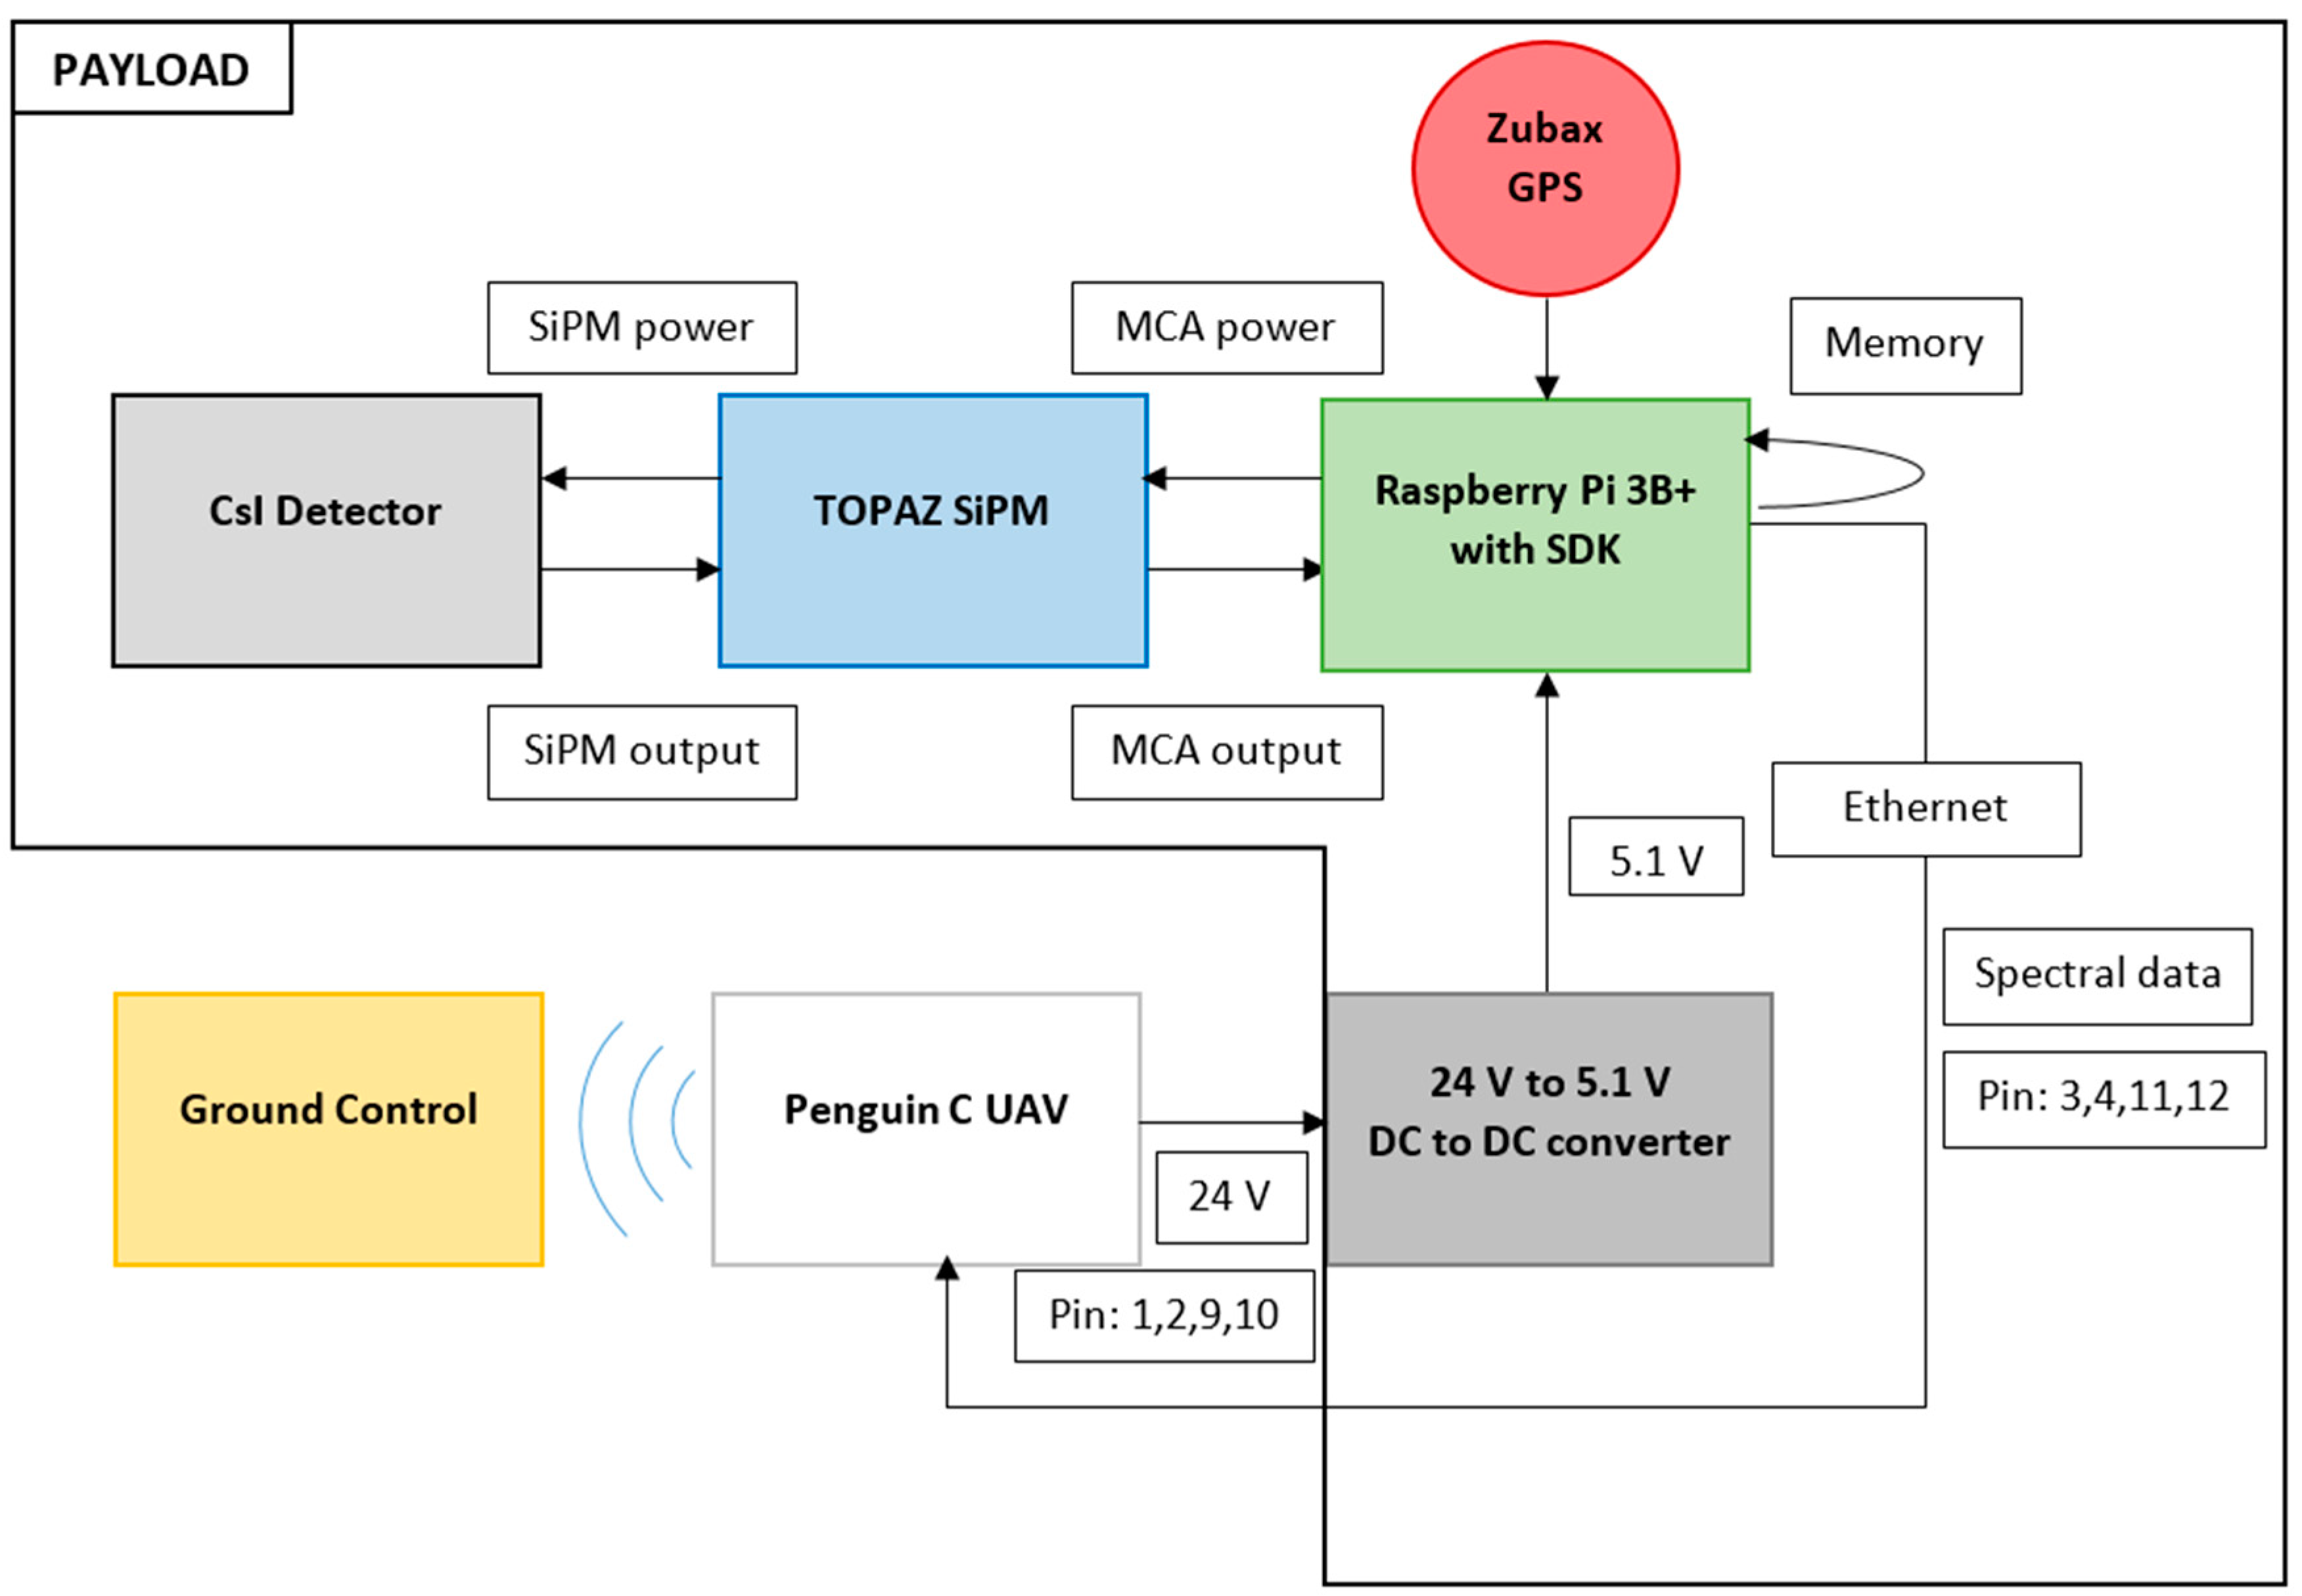
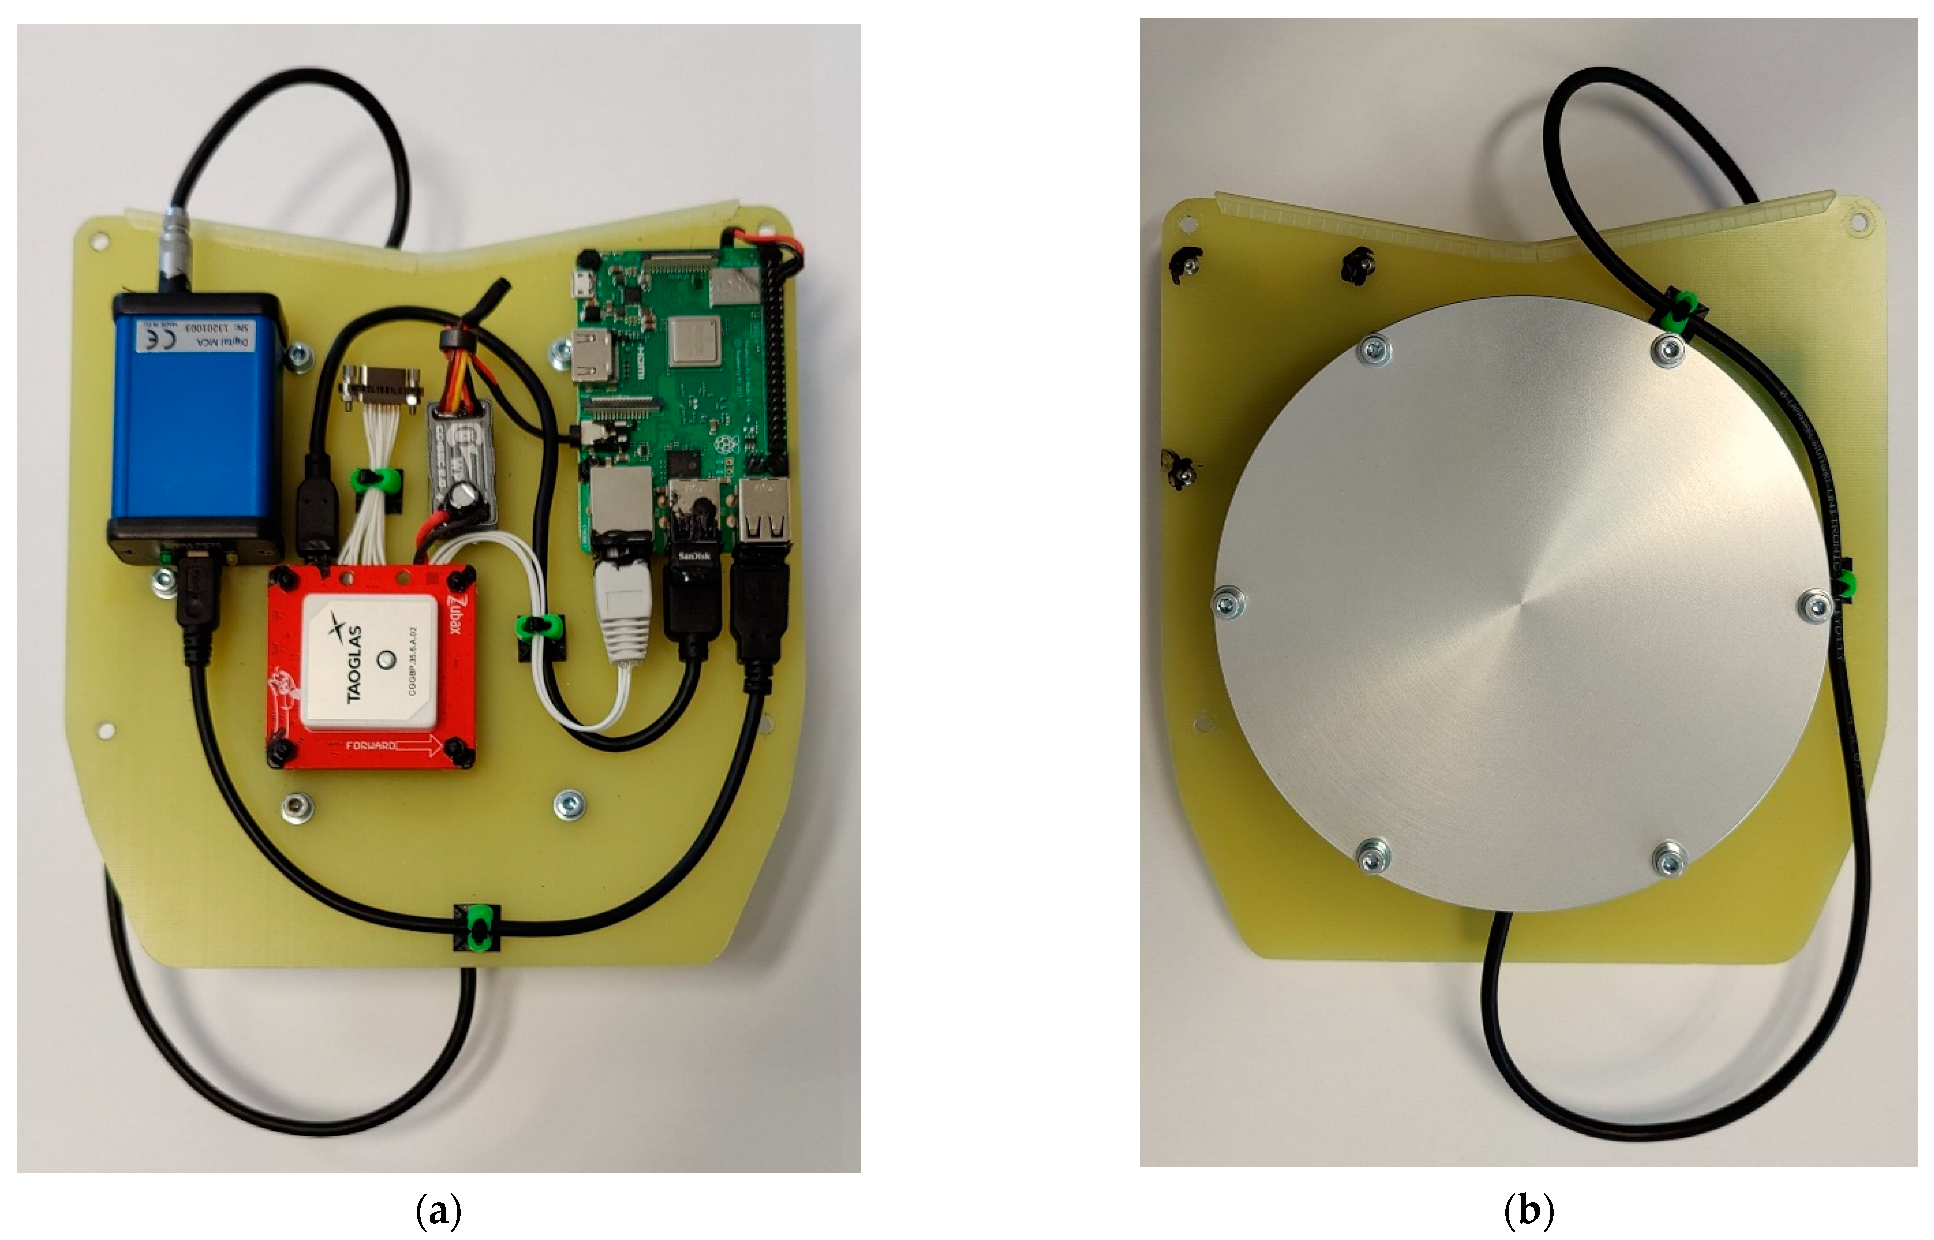
Figure 6 gives a schematic overview of the detector system and the necessary connections between all the components. In
Figure 7a,b, the final product can be seen mounted on the fiberglass interface plate to mount it in the drone.
2.4. Topaz Sipm Multi Channel Analyzer
The Brightspec Topaz-SiPM multichannel analyzer (MCA) is developed specifically for scintillation detectors that use SiPMs. The MCA uses 1024 channels, but the number of channels can be increased to 4096 channels if necessary. However, since spectra of approximately 1-s integration time are recorded, most of the channels will contain zero counts, and therefore 1024 channels are sufficient. The MCA is controlled by the Raspberry Pi using Python and the C++ library from Brightspec [
29,
30].
2.5. Raspberry Pi and Peripherals
The Raspberry Pi 3B+ is a single-board computer with the Raspbian operating system. When the payload/detector is turned on, a Python script is initiated automatically on this computer. The script reads GPS coordinates from the Zubax GPS module together with the date and time in UTC, the above-mean-sea-level (AMSL) height, and the pressure. From the MCA, the spectrum together with the live and real-time of the measurement are obtained. With these data, a text file is created and saved in the Raspberry Pi’s memory. In addition to being stored on the Raspberry Pi, the text file is also sent to the ground control station to provide data for a live feed.
The Zubax GNSS 2.0 [
31] is a GPS module specifically designed to be used in combination with UAVs or drones. The outputs are divided into multiple lines that show the GNSS data (Global Navigation Satellite System). Among these data, there are latitude, longitude, AMSL height, UTC time, date, magnetic heading, and pressure. The data obtained from the GPS module are then read by the Raspberry Pi and added to the text file containing the spectrum. The BEC 2.0 DC-DC converter is used to reduce the 24 V coming from the drone to the 5.1 V that is required to power the Raspberry Pi.
2.6. Detector Integration
The detector system is located in the front of the drone in a fiberglass casing of 0.85-mm thickness to protect it from wind and rain. It also has dampers to counteract vibrations and shocks. These measures are necessary to avoid damage to the detector system. We verified that the possible attenuation due to the encasement will be limited to less than 1% for the gamma energy of K-40 (1460.8 keV) by Monte Carlo simulations using Penelope. The detector and the drone are connected by a micro-D connector to make sure they will not detach due to vibrations.
2.7. Theoretical Framework
Following Beck et al. [
16], we find that Equation (1) requires three factors: (1) the angular dependence, (2) the efficiency, and (3) the theoretical distribution of the source in the soil. For K-40 measurements, the theoretical distribution is homogeneous in depth. However, for contaminations that originate from incidents, it is possible to define the distribution as an exponential function.
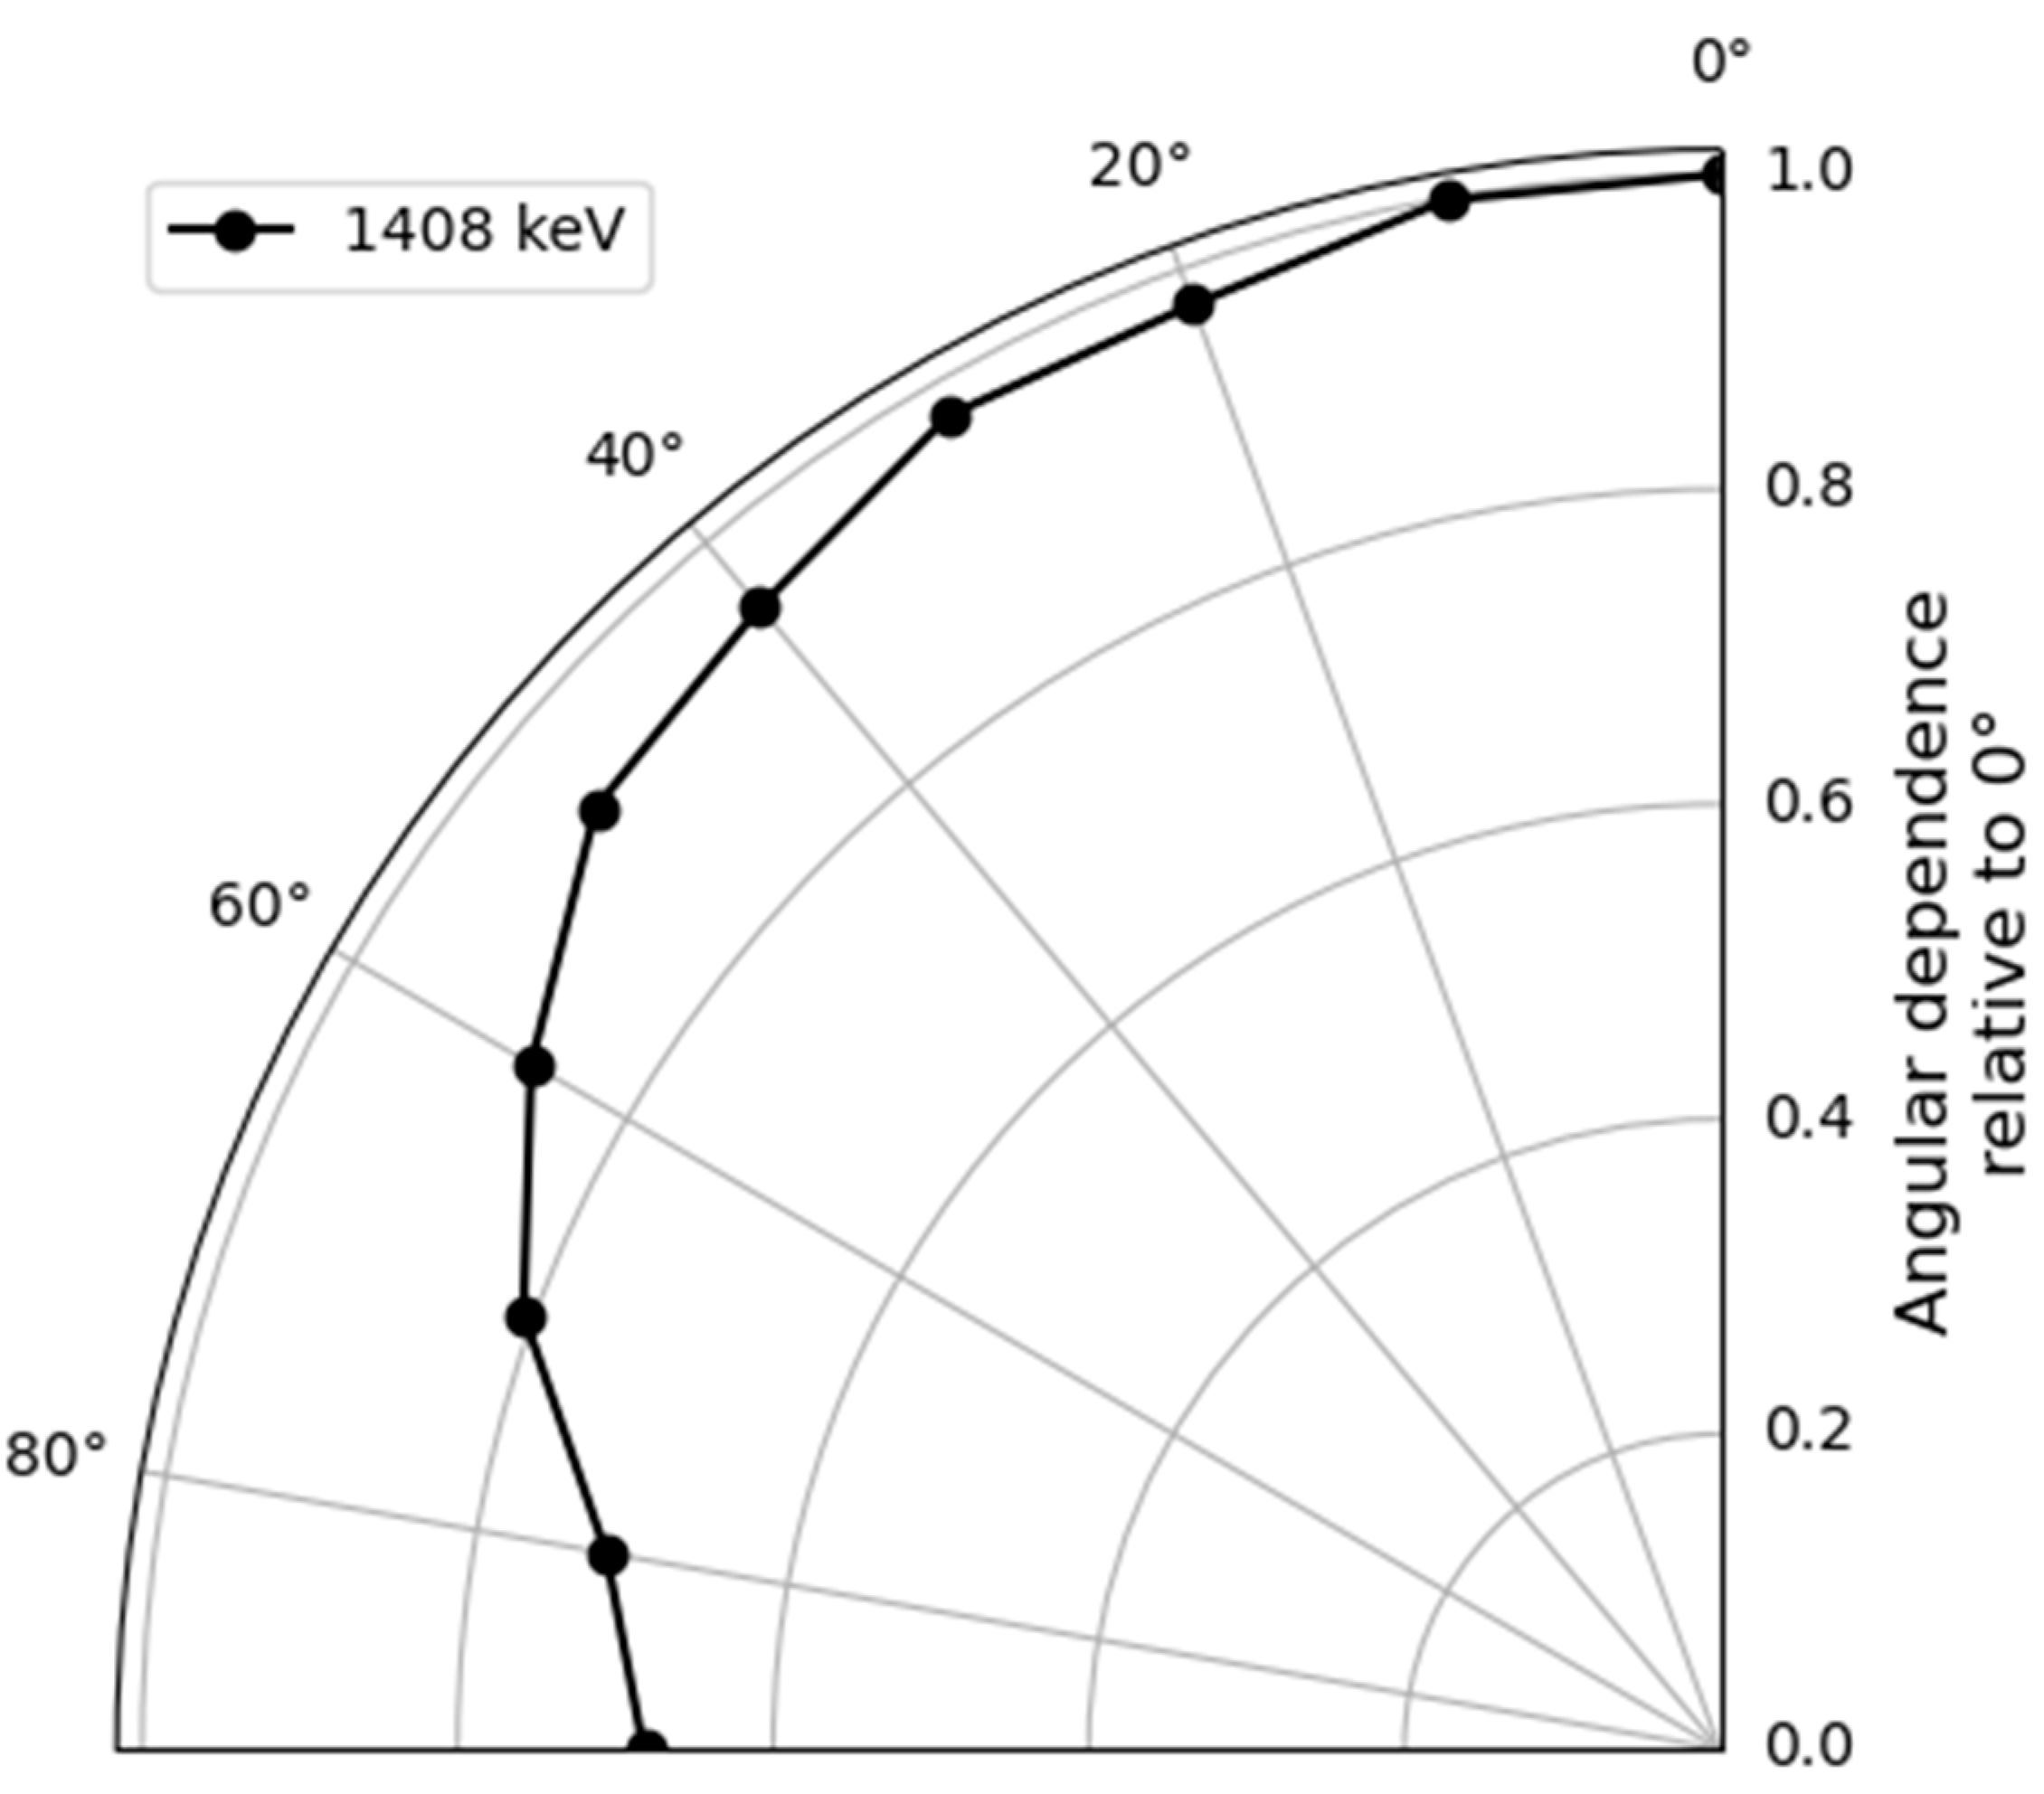
The first two factors have to be determined experimentally using point sources and measurements under different angles. Monte Carlo calculations, as used during the optimization process, can be used to determine the first two factors in Equation (1). However, for a real detector with its housing, exact position of crystal, and SiPMs, it was decided to determine these factors experimentally. The results from these experiments are shown in
Figure 8 and
Figure 9. For the angular dependence and the full energy peak efficiency
, we used a europium-152 (Eu-152) point source. The full peak energy efficiency is given as
where
is the number of net counts in the gamma peak,
the activity of the point source at the time of the measurement,
live time of the measurement, and
the gamma-ray intensity. For the angular dependence, multiple measurements were taken with a constant distance between the source and the detector but under different angles ranging from 0° to 90°, with 0° normal to the detector surface. For the full energy peak efficiency, we used the measurement at 0°. Europium-152 was chosen because it has multiple gamma-ray energies, mainly between 122 and 1408 keV, allowing for the determination of these factors for a wide range of gamma energies. Additionally, the peak at 1408 keV is relatively close to the 1460-keV peak coming from K-40 which is the nuclide used for testing the methodology for quantifying the concentration in soil.
The last factor can be determined by calculating the theoretical flux at the detector location. We start with the equation for the theoretical flux coming from a point source at a distance
(m) and an activity
(Bq), as can be seen in Equation (3). Herein, we adapt the source term by incorporating the exponential distribution in the soil and the self-attenuating effects. However, the point source used Cartesian coordinates while polar coordinates will be of more use to incorporate the angular dependency of the detector. Therefore, we substitute the Cartesian integrals with their polar counterparts. After integrating over the azimuthal angle, this results in Equation (4).
In Equation (4),
is the distance from each element of differential volume to the detector position in m,
h is the height above ground in m,
with
the angle of the photon incident on the detector,
is the depth beneath the surface in cm,
is the surface activity in photons/cm² s,
is the reciprocal of the relaxation length of the approximately exponentially distributed source activity with depth in cm
−1,
and
are respectively the soil and air density expressed in g/cm³, and
and
are respectively the air and soil mass attenuation coefficients in cm
−1. By integration over
and moving from
to
, we obtain Equation (5).
In the work of Beck et al., an exponential function is used to define the activity as a function of depth with an exponent . However, for naturally occurring radioactivity, such as K-40 in soil, this exponent is equal to zero since K-40 can be assumed to be homogeneously distributed with respect to depth.
2.8. Topography
One of the factors that influences the results obtained by the theoretical framework of Beck et al. is the topography of the area of interest. In case of terrain that cannot be assumed flat, the results need to be corrected for the roughness and irregularities found in the region [
32]. Using height maps from the region obtained from Geopunt Vlaanderen [
33], it is clear that there are only slight differences in height over the measurement site. The changes have a maximum value of 2.3 m or 1.1% of the flight height of 209.9 m. Therefore, it is assumed that the topography has no significant influence on the measurements over this region regarding the attenuation of soil. However, the changes in the height above ground do have a significant influence due to the attenuation of air and therefore have to be accounted for by a height correction. This is different in the sense that the topography correction would correct for radiation coming from higher areas or areas that attenuate the contamination. Meanwhile, the height correction is only correcting for the above ground level (AGL) height. The AGL height is calculated by obtaining the AMSL height from the drone and subtracting the average AMSL height of the topography.
3. Results
The test flights were performed above Droneport Sint-Truiden (50°47′31″N 005°12′06″E) [
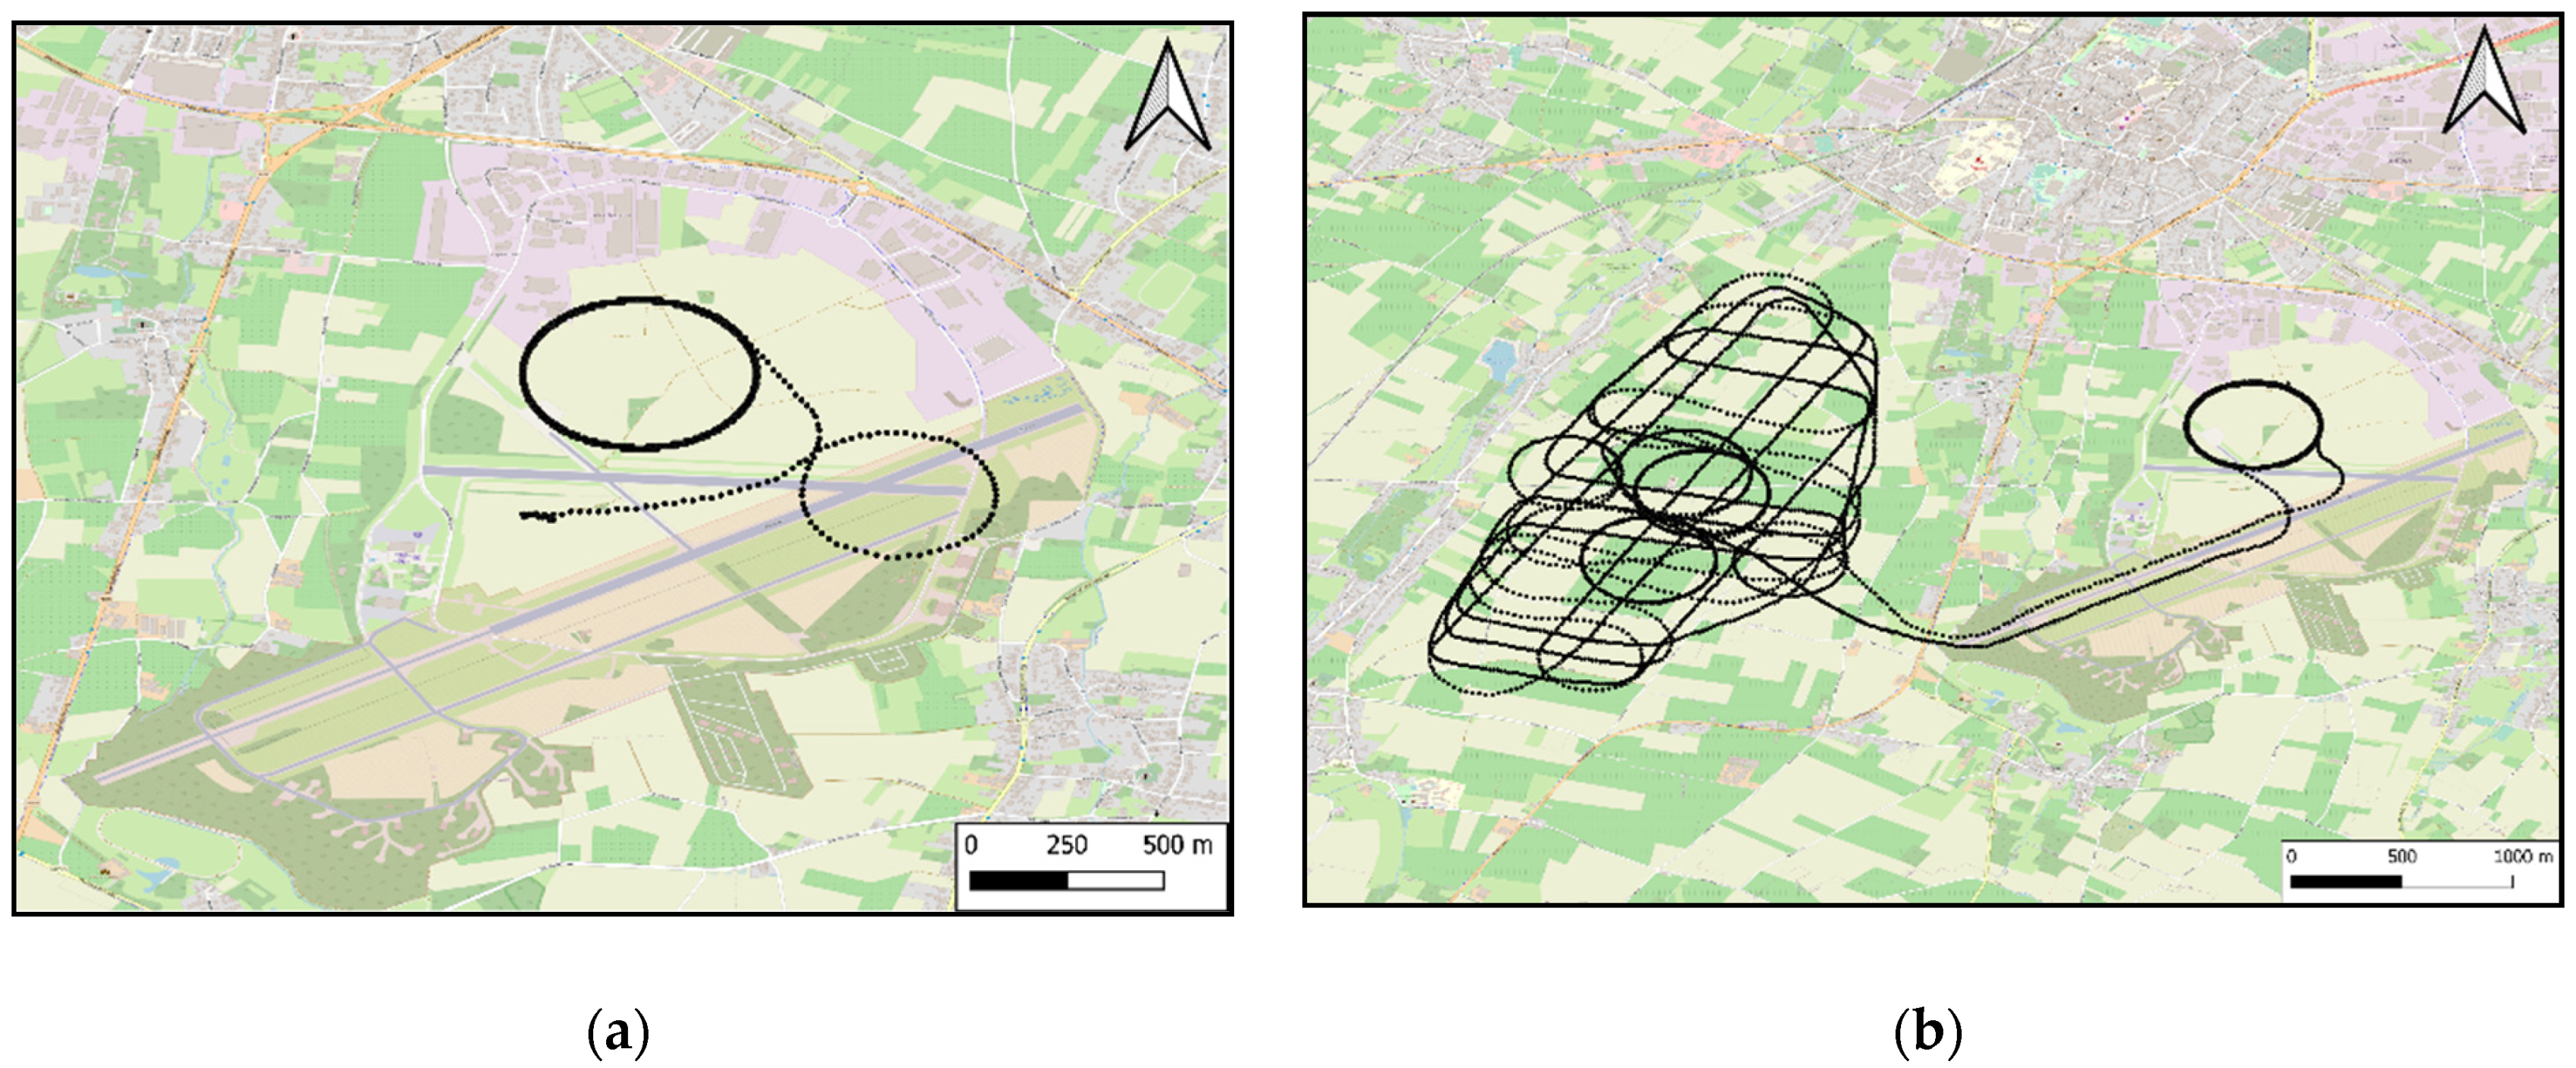
34]. Droneport is a small airfield that combines both the flight control of small airplanes (e.g., logistics of personal aircraft) and UAVs (e.g., logistics of multicopter and fixed-wing drones). The test flights had different goals; firstly, to demonstrate the good functioning of the detector–drone system (data collection, transmission, etc.), and secondly to test the reproducibility of results collected during the flight, and, finally, to demonstrate that quantitative results can be obtained with the system if a source geometry can be assumed.
A first flight to evaluate the performance of the Penguin C UAV and CsI detector took place at Droneport in Sint-Truiden, Belgium on 7 October 2021. After a calibration and check-up of both the UAV and the detector system, the Penguin C drone was launched. The detector system was powered off during the launch to avoid any interference. After the take-off, the detector system was turned on and a connection to the ground control station was established. Thereafter, a circular flight pattern was executed at multiple heights.
On a second flight on 22 January 2022, we used the same flight plan as in the first to verify the reproducibility of the flights and measurements and to collect more data as a function of the detector height above ground. In the second part of this flight, a grid pattern flight path was used to investigate the implications on the measurements regarding tilt angle and turning radius. The tilt angle is influenced by the turning radius and alters the geometry from a detector parallel to the ground to a geometry with a tilted detector relative to the ground. This can be corrected with the use of the tilt angle coming from the UAV log files and the angular dependence. However, for grid patterns, the tilt angle will be 0° for the straight flight lines. Only during the changes in direction will it have an influence on the detector geometry and since these changes happen outside the border of the area of investigation, their impact on the overall results will be limited.
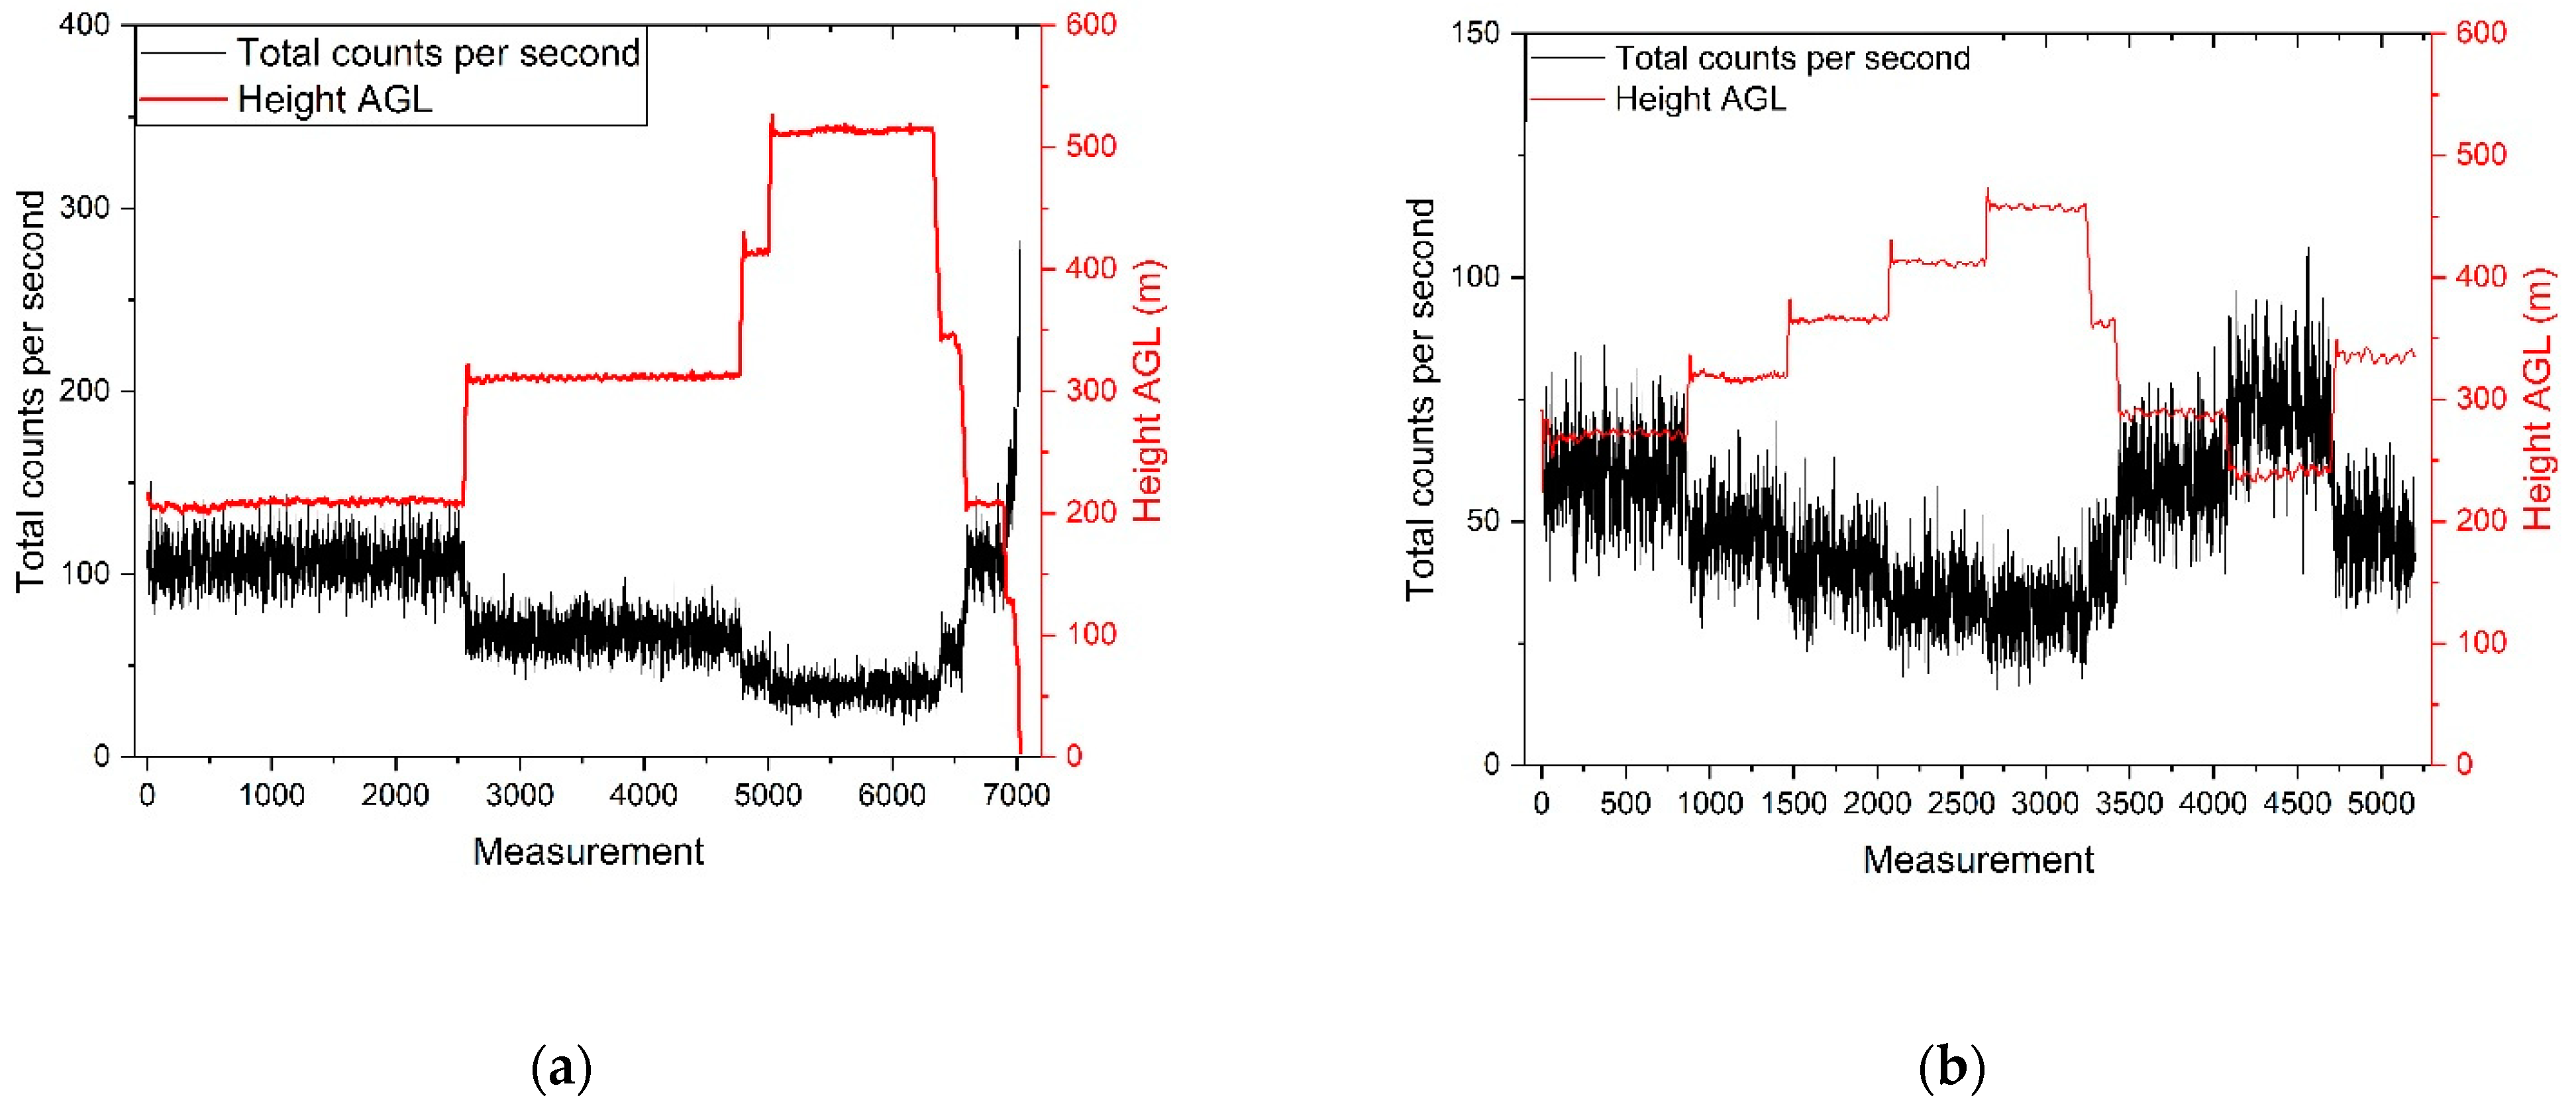
Figure 10a,b show the total counts per second for every measurement at different heights and illustrates how the changes in height influence the number of counts per second. We can clearly see the inverse connection between the height of the drone and the total number of counts per second. However, in
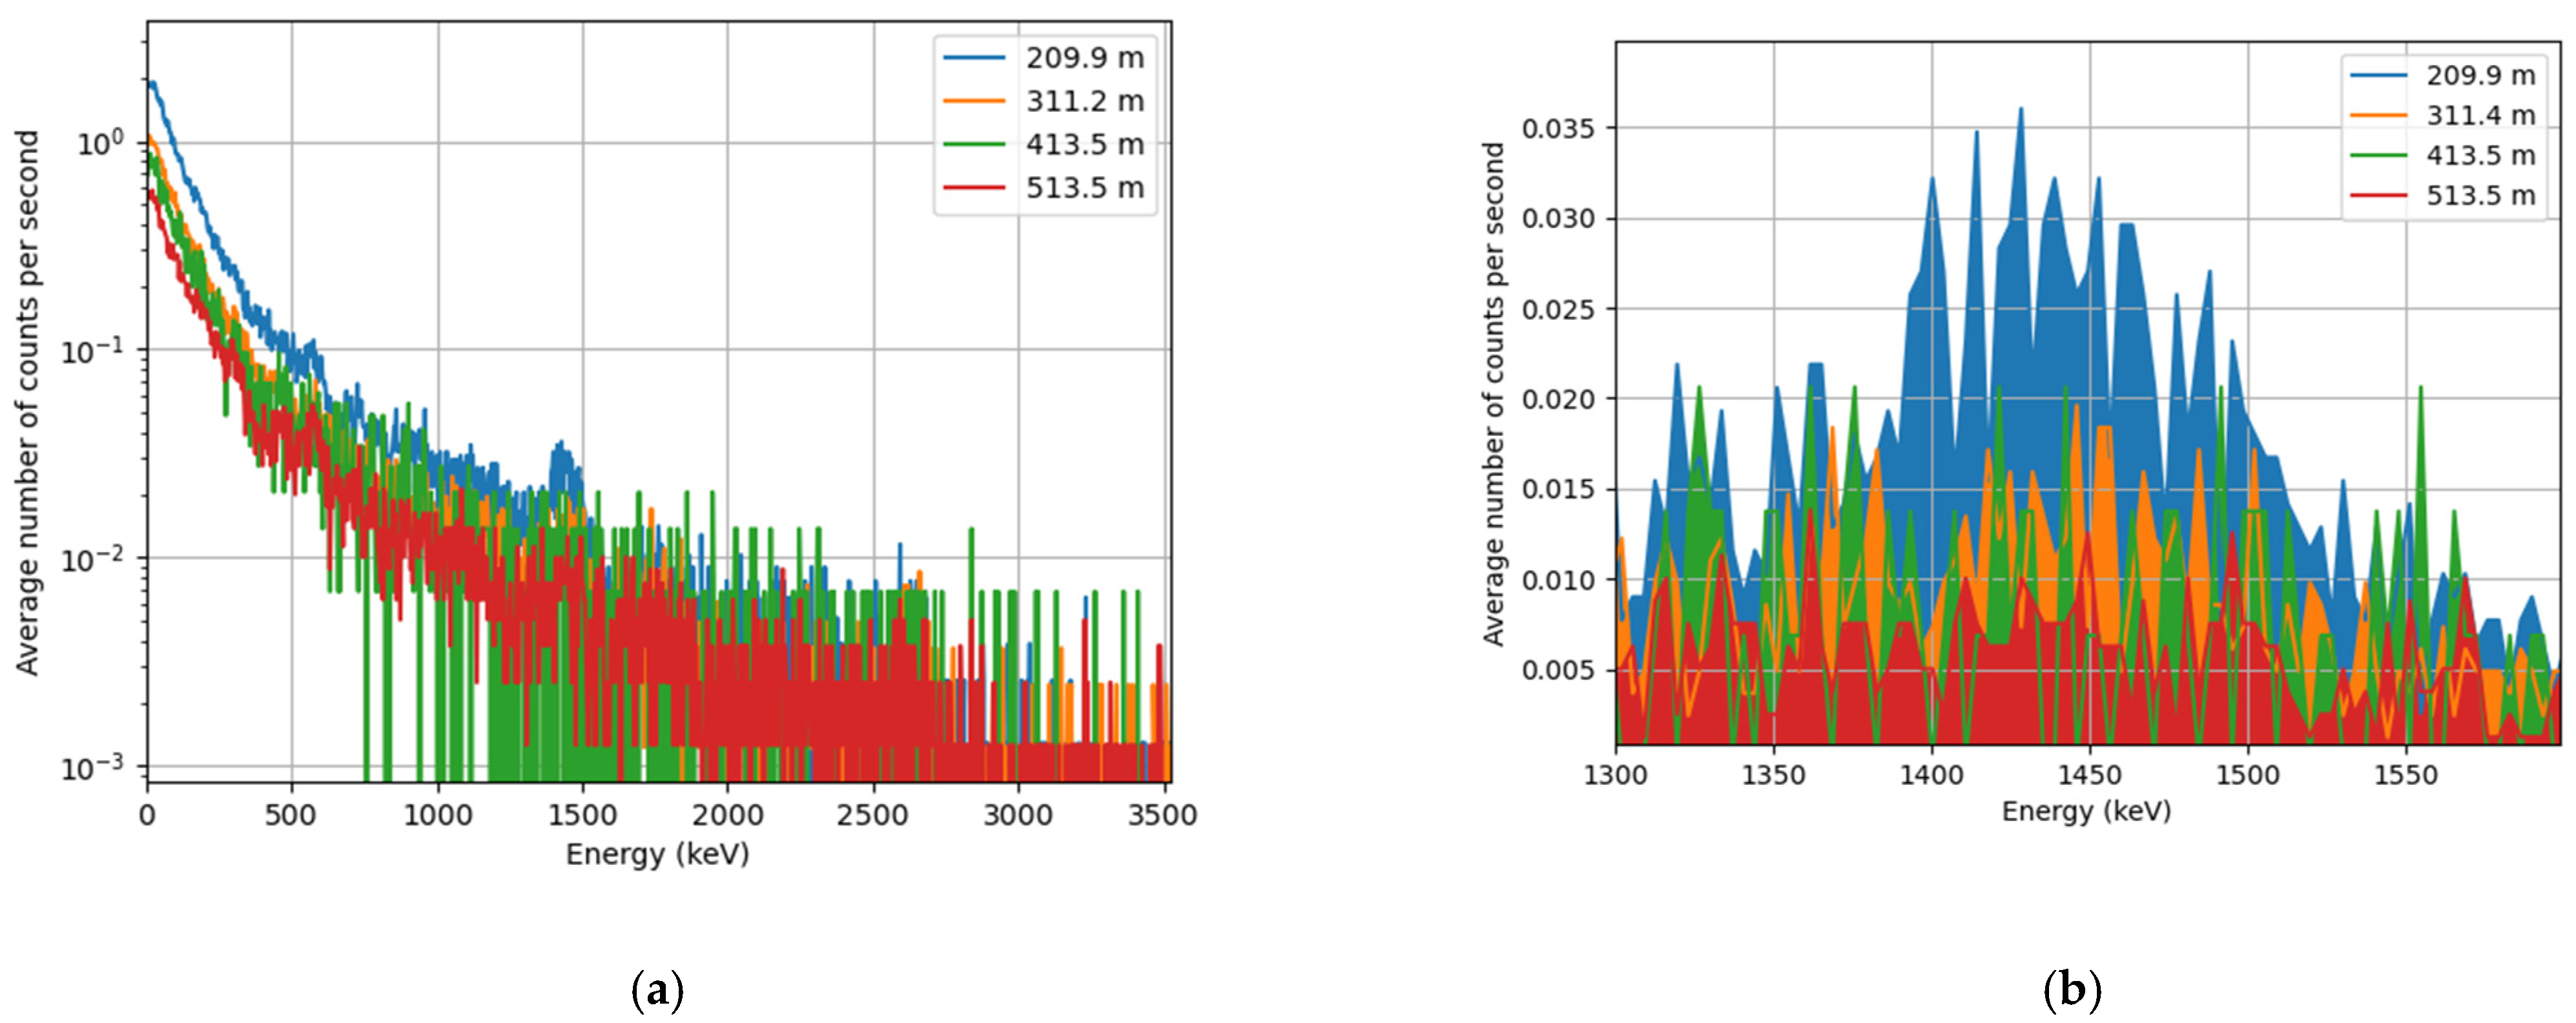
Figure 11a,b, the only clear K-40 peak is visible for the AGL height of 209.9 m. The K-40 peak at 311.4 m is still measureable but at higher altitudes it was not possible to measure a net peak count.
In these spectra, the gamma peak of K-40 at 1460 keV is visible and is used to calculate the K-40 concentration. To verify our calculated results, three samples were taken near the site of measurement. The results from these samples are shown in
Table 2. The obtained results were verified by using the samples taken by FANC (Federal Agency for Nuclear Control) at multiple sites in Belgium [
35].
Figure 12a,b show the flight paths of both flights. For the heights between 209.9 m and 311.4 m, we were able to find a K-40 peak. In
Table 3, the K-40 peaks are used to calculate the K-40 concentrations and compare them with the concentrations of the ground samples. The efficiency is corrected from 1408 keV to 1460.8 keV by Monte Carlo simulations. Two simulations were executed with a point source and the final detector geometry, but one with an energy of 1408 keV and another one with an energy of 1460.8 keV. The detector efficiencies of both simulations were then taken, and the ratio of both efficiencies used to correct for the efficiency used in Equation (1). At higher altitudes, the gamma rays of K-40 are more strongly attenuated and therefore they cannot be seen in these spectra.
Using Equation (5), the theoretical fluxes from a homogeneously distributed source were calculated at different flight heights. The theoretical flux can then be used together with the full energy peak efficiency and the counts per seconds from the K-40 peak to calculate the concentration at the ground using Equation (1). Results are shown in
Table 3. The uncertainty in the concentration is mainly caused by the limited number of counts in the K-40 peak.
A measurement at the site of the sampling was executed and in the same way as with the drone measurements a K-40 concentration was calculated. At a height of 1 m, we measured a net peak counting rate of 4.945 ± 0.052 counts per second and calculated a theoretical flux of 0.83 ± 0.04 gammas/cm² s. These values give us the corresponding K-40 concentration of 492.6 ± 28.4 Bq/kg. All uncertainties are for one standard deviation.
4. Discussion
The drone–detector system for radiological monitoring as presented here started from the pre-requisite to be a system with a long flight autonomy (more than 8 h, ideally 12 h) and an extended range of operation. The range should allow for operating the system remotely from a safe location in case of a nuclear or radiological emergency. Autonomy is important to guarantee continuous surveillance and minimal downtime to recharge or refuel. During the Fukushima accident, for example, releases to the environment continued for two weeks [
36]. Having remote access to data during this period with flights over different areas and different altitudes, depending on, e.g., the meteorological situation, with a drone–detector system as described here, would have been an important asset in the radiation protection strategy. Further, the system has been designed to be flexible: the UAV can be launched by catapult and recuperated with a parachute from nearly all locations with limited resources needed. The used flight patterns are chosen for specific reasons. The circular flight patterns can be used for monitoring an installation and detecting possible anomalies, while the grid pattern can be used to map contaminated site or to search for a lost source.
The restrictions defined in the certificate of conformity of the UAV put limitations on the payload available for the radiation detection system. The radiation detection system was fully optimized to yield the highest efficiency for the available payload. Both the type of detector as well as its size were optimized. To allow radionuclide identification, only detection methods allowing gamma spectroscopy have been included in this optimization process. The optimization using the Penelope Monte Carlo code (2018) allowed us to further investigate the detector efficiency and solid angle for four detector materials: LaBr, CeBr, CsI, and NaI. The best detector option was a CsI using SiPMs with a miniature MCA. Other detector materials, such as HPGe or CZT, have drawbacks, e.g., cooling or limited volumes, and were not included in the simulations.
The detector takes a spectrum every second. The one-second spectra create a flexible data flow in which we can combine several spectra for increased statistics since the statistics for the one-second spectra are very limited.
The results in
Table 3 are within the range as stated by FANC [
36]. The calculated concentrations from the UAV measurements can differ somewhat from the samples due to the differences in sampled area, as is also the case for measurements at different heights due to a different field of view. However, for the measurement at 1 m height, the result agrees well with the ground sample concentrations.
The sensitivity of the system is dependent on the altitude. We can use this to our advantage to obtain a required sensitivity for a specific case or during radiological releases by flying at higher altitudes to avoid contamination. If sensitivity is important, we can use the repeatability of the flight controller software to accumulate statistics, similar to what was done for K-40. The drone–detector combination can also be used for other applications, such as the screening for radiation and/or radioactivity during public events in the context of security, locating orphan radioactive sources, or radiological mapping of large areas such as legacy uranium mines. For the location of orphan radioactive sources, the system could scan large areas to obtain an area of interest which can be scanned more accurately using a multicopter drone. This application will require more extensive knowledge on the minimum detectable activities of the detector. The radiological mapping of large areas can be done in a similar way to what was done for K-40 in this paper. However, to obtain a correct calibration, it might be more useful to work with calibration pads, especially for uranium or thorium mines. Their energies are significantly higher, and it would be difficult to get a full energy peak efficiency for these energies using point sources.


