Article

Pomelo Tree Detection Method Based on Attention Mechanism and Cross-Layer Feature Fusion

1
School of Engineering, South China Agricultural University, Guangzhou 510642, China
2
School of Mathematics, Jiaying University, Meizhou 514015, China
3
Guangdong Provincial Key Laboratory of Conservation and Precision Utilization of Characteristic Agricultural Resources in Mountainous Areas, Jiaying University, Meizhou 514015, China
4
School of Mathematics, Sun Yat-sen University, Guangzhou 510275, China
5
School of Geography and Tourism, Jiaying University, Meizhou 514015, China
*
Author to whom correspondence should be addressed.
These authors contributed equally to this work.
Remote Sens. 2022, 14(16), 3902; https://doi.org/10.3390/rs14163902
Submission received: 9 July 2022 / Revised: 5 August 2022 / Accepted: 9 August 2022 / Published: 11 August 2022
(This article belongs to the Topic Computational Intelligence in Remote Sensing)

Abstract

:
Deep learning is the subject of increasing research for fruit tree detection. Previously developed deep-learning-based models are either too large to perform real-time tasks or too small to extract good enough features. Moreover, there has been scarce research on the detection of pomelo trees. This paper proposes a pomelo tree-detection method that introduces the attention mechanism and a Ghost module into the lightweight model network, as well as a feature-fusion module to improve the feature-extraction ability and reduce computation. The proposed method was experimentally validated and showed better detection performance and fewer parameters than some state-of-the-art target-detection algorithms. The results indicate that our method is more suitable for pomelo tree detection.

Graphical Abstract

1. Introduction

Citrus is the world’s largest fruit group, and pomelo is the largest citrus fruit [1]. High-quality pectin can be extracted from the peel of the pomelo, and the pulp can be processed into juice and wine. Pomelo tree-planting information is vital to growers, as it can provide a basis to scientifically manage planting and improve income per unit area and unit time. Detecting the location and quantity of pomelo trees helps growers to develop precision and intelligence in orchard management, such as in fertilization and irrigation [2], pruning [3], and pesticide application [4], to reduce production costs, reduce environmental pollution, and improve fruit yield and quality [5]. However, in actual production, data are obtained largely manually, which requires much labor, and samples limited numbers of trees. This will result in inaccurate data analysis and unreliable experimental results. Therefore, a quick, non-destructive, and accurate pomelo tree-detection method is needed to replace manual inspection.
Remote sensing technology has developed rapidly, and studies have demonstrated its applicability to agriculture. For example, a plant water stress model was established by combining satellite remote-sensing data with ground agrometeorological data [6], an orange tree-detection model was established by a remote sensing platform combined with unmanned aerial vehicles (UAVs) and sensors [4], and phytophthora root rot (PRR) disease on avocado tree roots was detected by remote sensing and hyperspectral imaging [7]. Aerial and satellite remote sensing are limited by weather conditions and monitoring costs [8]. Compared with satellites, UAVs are less dependent on weather conditions [9], and they can be deployed in harsh environments with fast data collection [10].
Tree-detection methods for remote-sensing images are mainly based on three kinds of methods: traditional image processing, traditional machine learning, and deep learning. Traditional image processing-based tree-detection methods have no parameter-learning process, such as the local maximum method [11], watershed segmentation algorithm [12], and multi-scale segmentation algorithm [13]. Srestasathiern et al. [14] proposed a method for oil palm identification based on algorithms such as feature selection, semi-variance function calculation, and local maximum filtering. Dos Santos et al. [15] proposed a palm tree-detection method based on shadow extraction and template matching, which correctly detected 75.45% of the trees in a study area of about 95 square kilometers. However, traditional image-processing methods have lower recognition accuracy. Furthermore, they require manual setting of many parameters.
Traditional machine learning-based methods typically comprise steps such as feature extraction, image segmentation, classifier training, and prediction [16,17,18]. López-López et al. [19] proposed a method for detecting unhealthy trees based on image segmentation and support vector machine classifiers. Nevalainen et al. [20] proposed a method for tree detection and species classification, which includes tree detection using local maximum filtering, feature extraction, and tree species classification using random forest and artificial neural network methods. Wang et al. [21] proposed utilizing a gradient histogram operator and a support vector machine classifier to identify oil palm trees in UAV imagery. In general, traditional machine-learning-based methods outperform traditional image-processing-based methods. However, their feature extraction capability is insufficient, which limits them regarding achieving higher detection accuracy.
A deep-learning-based algorithm can extract complex structural information from huge amounts of high-dimensional data, using a neural network with multiple hidden layers to automatically learn features from the original image [22]. Convolutional Neural Networks (CNNs) are among the best-known deep learning-based methods owing to their good image interpretability. CNNs are widely used to solve agricultural production problems, including plant pest detection and classification [23,24], plant leaf identification and classification [25,26], weed identification and classification [27,28], fruit and vegetable harvesting and identification [29,30], and land cover classification [31,32].
Deep-learning-based algorithms have improved tree-detection performance. Li et al. [33] proposed a CNN-based framework for detection and counting of oil palm trees in high-resolution remote-sensing images, and this framework showed greater accuracy than three other models. Pibre et al. [34] proposed a tree-identification method using multi-scale sliding windows and neural networks. Wu et al. [35] researched the dead branches of apple trees in winter, using remote-sensing data collected by UAVs, and used Faster R-CNN to determine the number and location of trees. Zheng et al. [36] proposed a multi-type method to accurately detect oil palm trees and monitor their growth. The method is based on Faster R-CNN [37], and uses a refine pyramid feature module for feature extraction, which can integrate deep and shallow features to help distinguish similar classes and detect smaller oil palms. Osco et al. [38] proposed a method to estimate the number and location of citrus trees in an orchard using an estimated density map, and this method achieved higher F1-scores than Faster R-CNN and RetinaNet. Zheng et al. [39] proposed a coconut tree crown-detection method, which contains three major procedures: feature extraction, a multi-level Region Proposal Network (RPN), and a large-scale coconut tree-detection workflow. The method achieves a higher average F1-score than pure Faster R-CNN. Some methods based on domain adaption methods were proposed for tree detections [40,41]. They divide the data into a target domain that has few or no labels and a source domain that has many labels. These techniques achieve detection by applying the information acquired in the source domain to the target domain.
Most of the above methods use a two-stage target-detection network: (1) generation of candidate region proposals through a RPN; and (2) classification and bounding-box regression tasks for selected candidates. Two-stage detection networks more time-consuming and have lower computational efficiency than single-stage detection networks [42]. As a single-stage target detector, SSD [43] and YOLO [44,45,46] treat target detection as a regression problem. YOLOx-nano [47], the lightweight version of the model, has fewer model parameters and runs faster, so it is suitable for real-time tasks, but it is not good enough due to the complex and changeable environment of remote-sensing systems in agriculture. Moreover, there is scant research on the detection of pomelo trees.
To improve recognition accuracy in complex environments, some researchers incorporated attention mechanisms into neural network models [48,49,50], and some researchers used feature-fusion modules that combine features at different scales to enable the network to extract richer features [51,52,53]. However, they did not consider that shallow and deep feature information in deep networks have complimentary characteristics.
In summary, the existing methods for tree detection have the following problems:
  • The two-stage algorithm has good performance in tree detection, but the algorithm is complex, leading to computational inefficiency and slow detection.
  • The one-stage algorithm runs faster than the two-stage one, but the model size is still too large for real-time application. The lightweight version of the one-stage algorithm is fast enough, but the feature-extraction ability is limited.
  • Some studies used an attention mechanism and a feature-fusion module to improve feature-extraction ability. However, they did not consider the advantage of the complimentary characteristics between different layers.
To address the above problems, we propose a pomelo tree-detection method for UAV remote-sensing images based on YOLOx-nano; it utilizes the complementary characteristics of features at different levels to hierarchically aggregate rich information, thereby achieving more accurate detection and counting of pomelo trees. A hybrid attention mechanism module learns more representative features from the underlying features extracted from the backbone feature extraction network. A feature-fusion module utilizes the complementary characteristics of the extracted low-level detail information and high-level semantic information to perform cross-layer fusion of feature maps. A Ghost module replaces the convolution module for better computational efficiency.
In this study, we make the following contributions:
  • A hybrid attention mechanism module weights the pixels of the feature map with channel attention and spatial attention to improve feature extraction and highlight pomelo tree regions in backgrounds;
  • A feature-fusion module fuses the feature maps of different layers without greatly increasing computation, so it effectively aggregates feature maps;
  • A Ghost module replaces the convolution module, reducing the number of parameters and the computational complexity of the deep network, so as to further improve the model-detection effect.

2. Materials and Methods

2.1. Materials

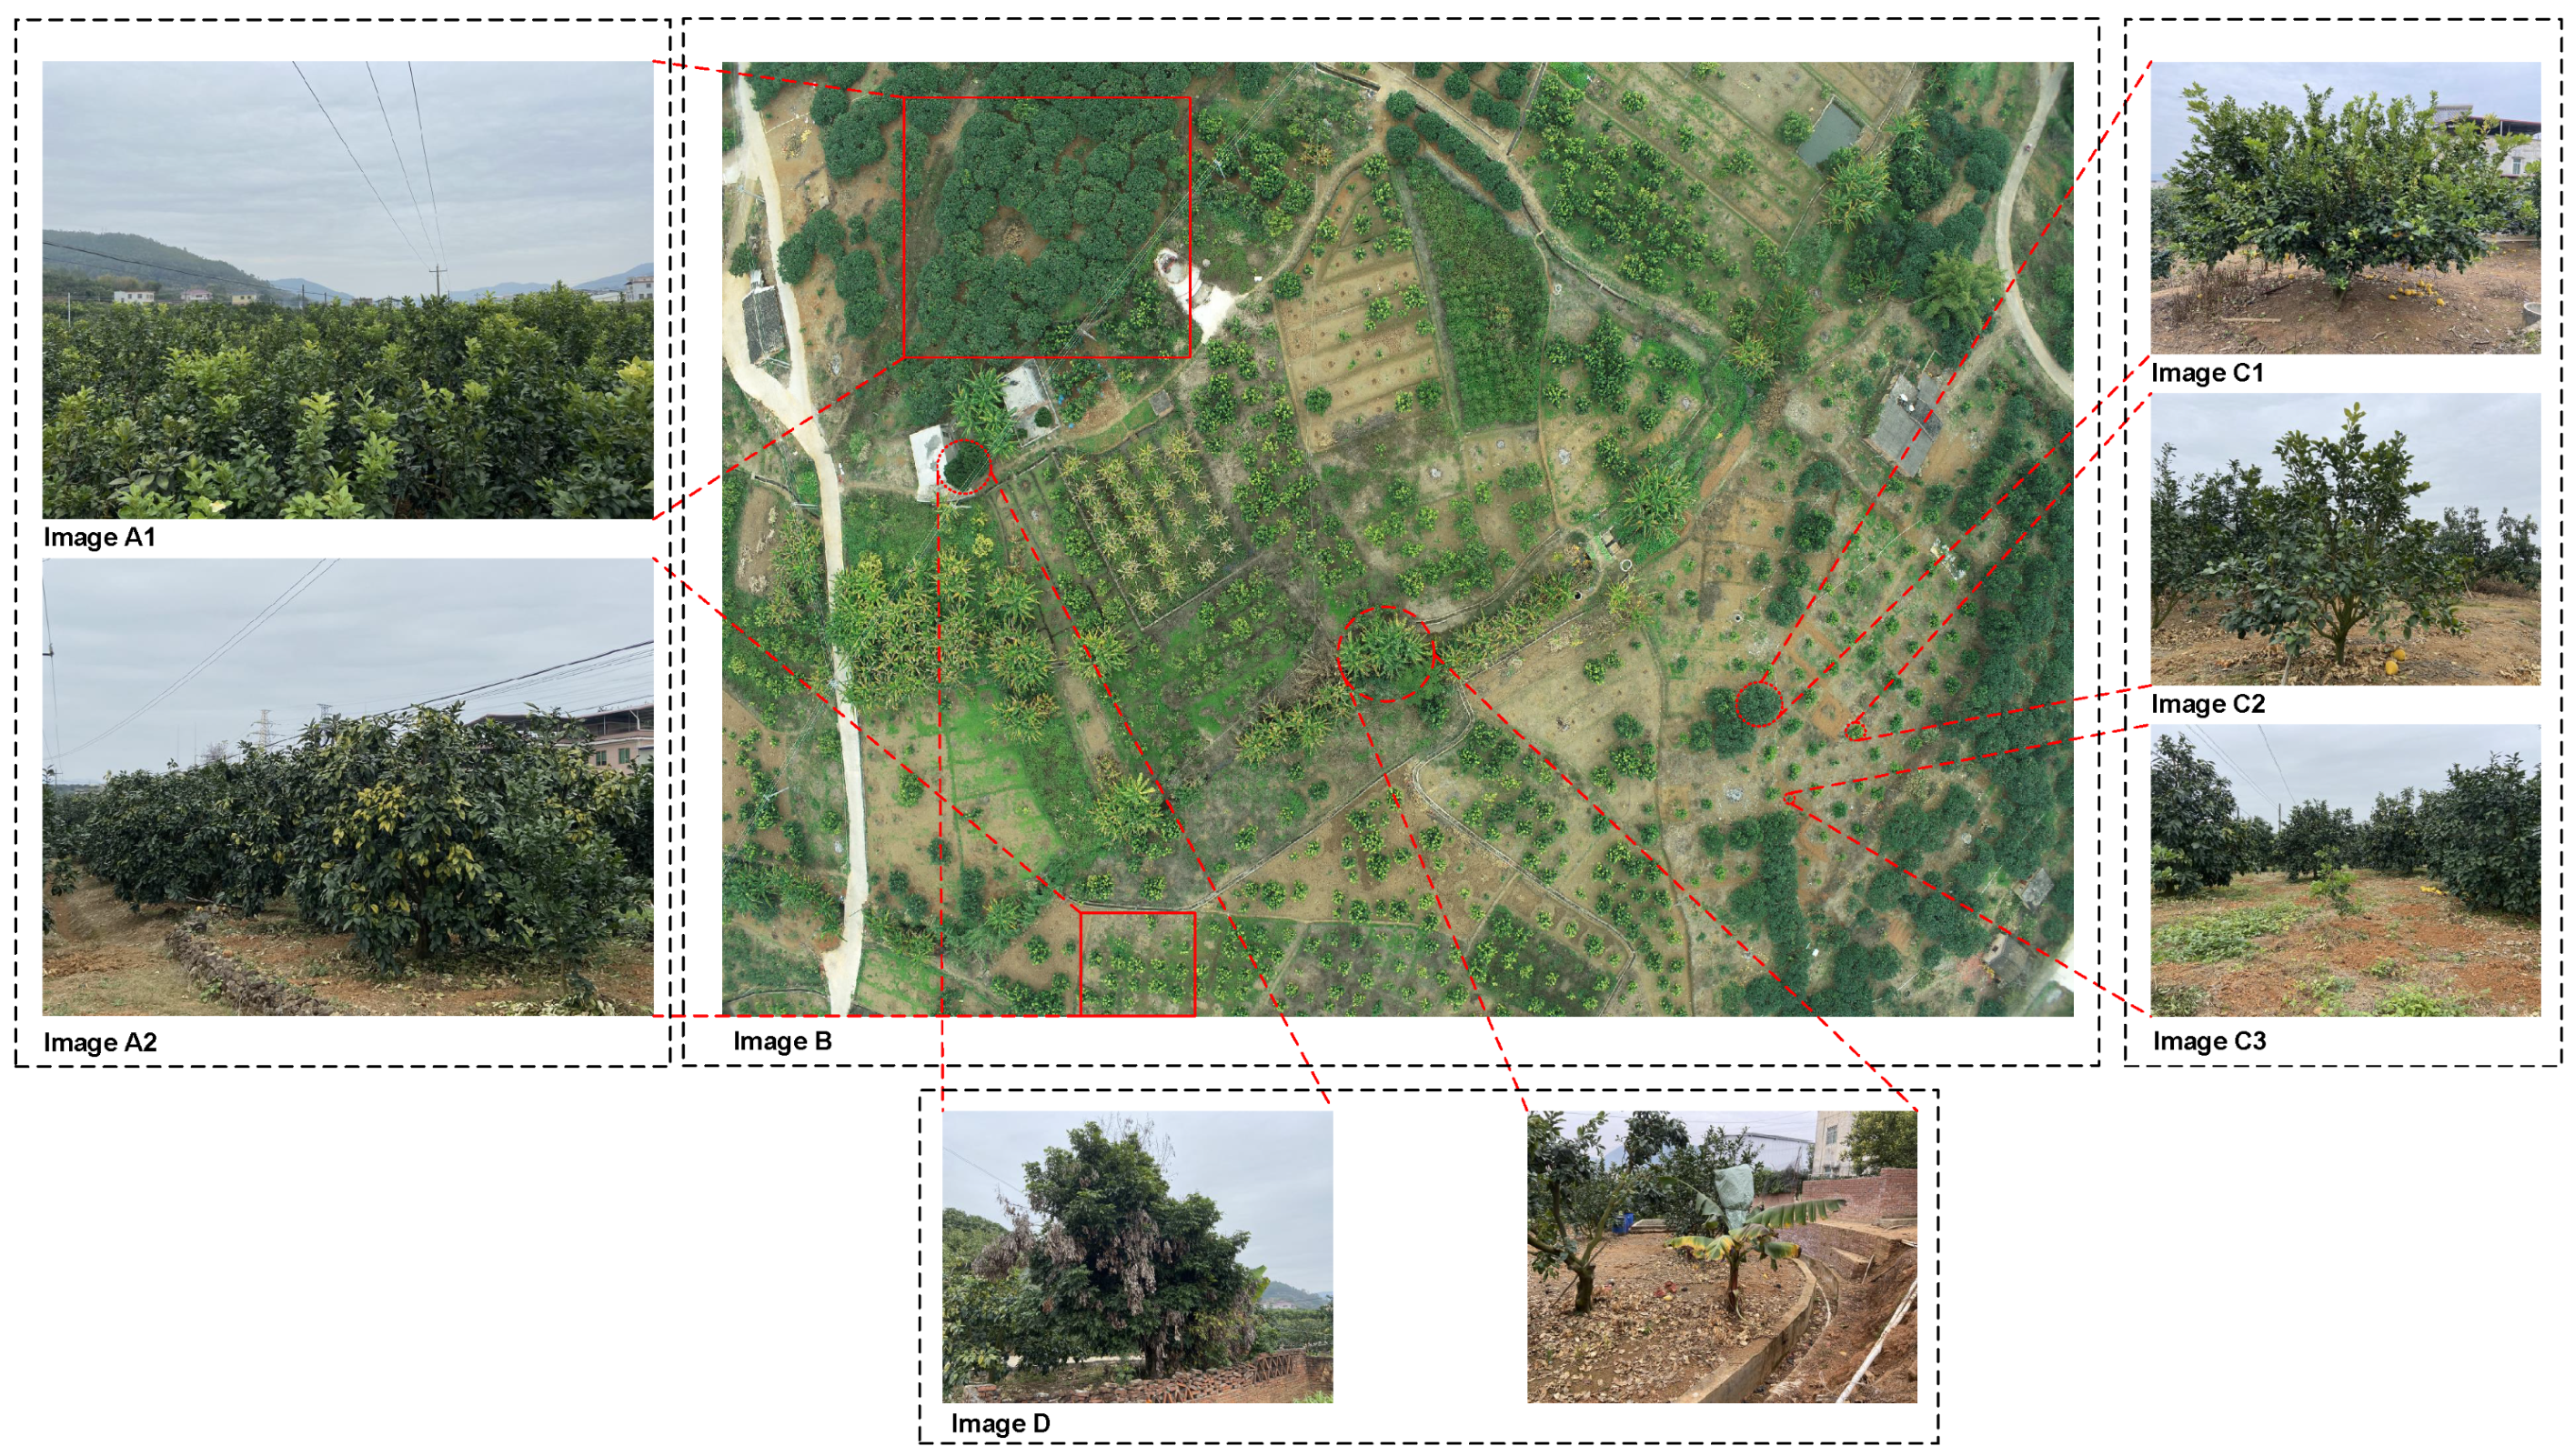
2.1.1. Image Data Collection

The remote-sensing dataset used in this study was obtained from an orchard of pomelo trees in ShiShan and Yanyang Town, Meizhou City, Guangdong Province, China ( 23 23 ~ 24 56 N and 115 18 ~ 116 56 E). Known as the “hometown of the pomelo”, Meizhou is in the eastern part of Guangdong Province. The warm and humid climate, abundant rainfall, and deep and well-drained soil provide good conditions for pomelo cultivation. The test site covers an area of about 50 hectares, and the spacing of pomelo trees is 4 × 4 m. UAV remote-sensing images were collected from a quadrotor UAV (Phantom 4, DJi, Guangdong, China) equipped with a visual spectral (RGB) camera with a spatial resolution of 0.05 m. A total of 1222 UAV remote-sensing images (5642 × 3648 pixels) were collected, from an altitude of 120 m, with an overlap rate of 60%, in two areas heavily planted with pomelo trees, including images of other trees, houses, and roads, as shown in Figure 1.
The first dataset was collected at 10:00 on 26 December 2021 in Shishan town ( 24 26 N and 116 05 N), Meizhou City, Guangdong Province, China. The shooting location was on a flat terrain, as shown in Figure 2a–c. A large number of pomelo trees were planted in this region. We used UAVs for vertical overhead photography and collected 1022 UAV remote-sensing photos in this area.
The second dataset was captured at 16:00 on 16 January 2022 in Yanyang Town ( 24 22 N and 116 22 N), Meizhou City, Guangdong Province, China. The shooting area is located in hilly mountainous terrain. This dataset is more challenging than the first one. Due to the diverse topography undulations, pomelo trees were planted at various heights and were exposed to varying amounts of sunshine, as shown in Figure 2d–f. In addition, there is a large amount of other vegetation planted in mountainous areas with a complex environment of overgrown trees. For vertical overhead photography, we obtained 233 remote-sensing images using UAVs.

2.1.2. Image Annotation and Data Generation

We selected 20 and 8 images (5642 × 3648 pixels) from the Shishan and Yanyang Town UAV image database, which were cropped without overlap to obtain 1674 cropped images, respectively. Each image contained 0–20 pomelo trees, and was of the size 640 × 640 pixels, as shown in Figure 2. We used the open-source image-editing tool LabelImg to manually label the images, with one box to label a pomelo tree. For each dataset, we randomly selected 60% for training, 20% for validation, and 20% for testing. Half of the images in the training dataset were brightened, darkened, flipped, and scaled to increase the richness of the training sample data.

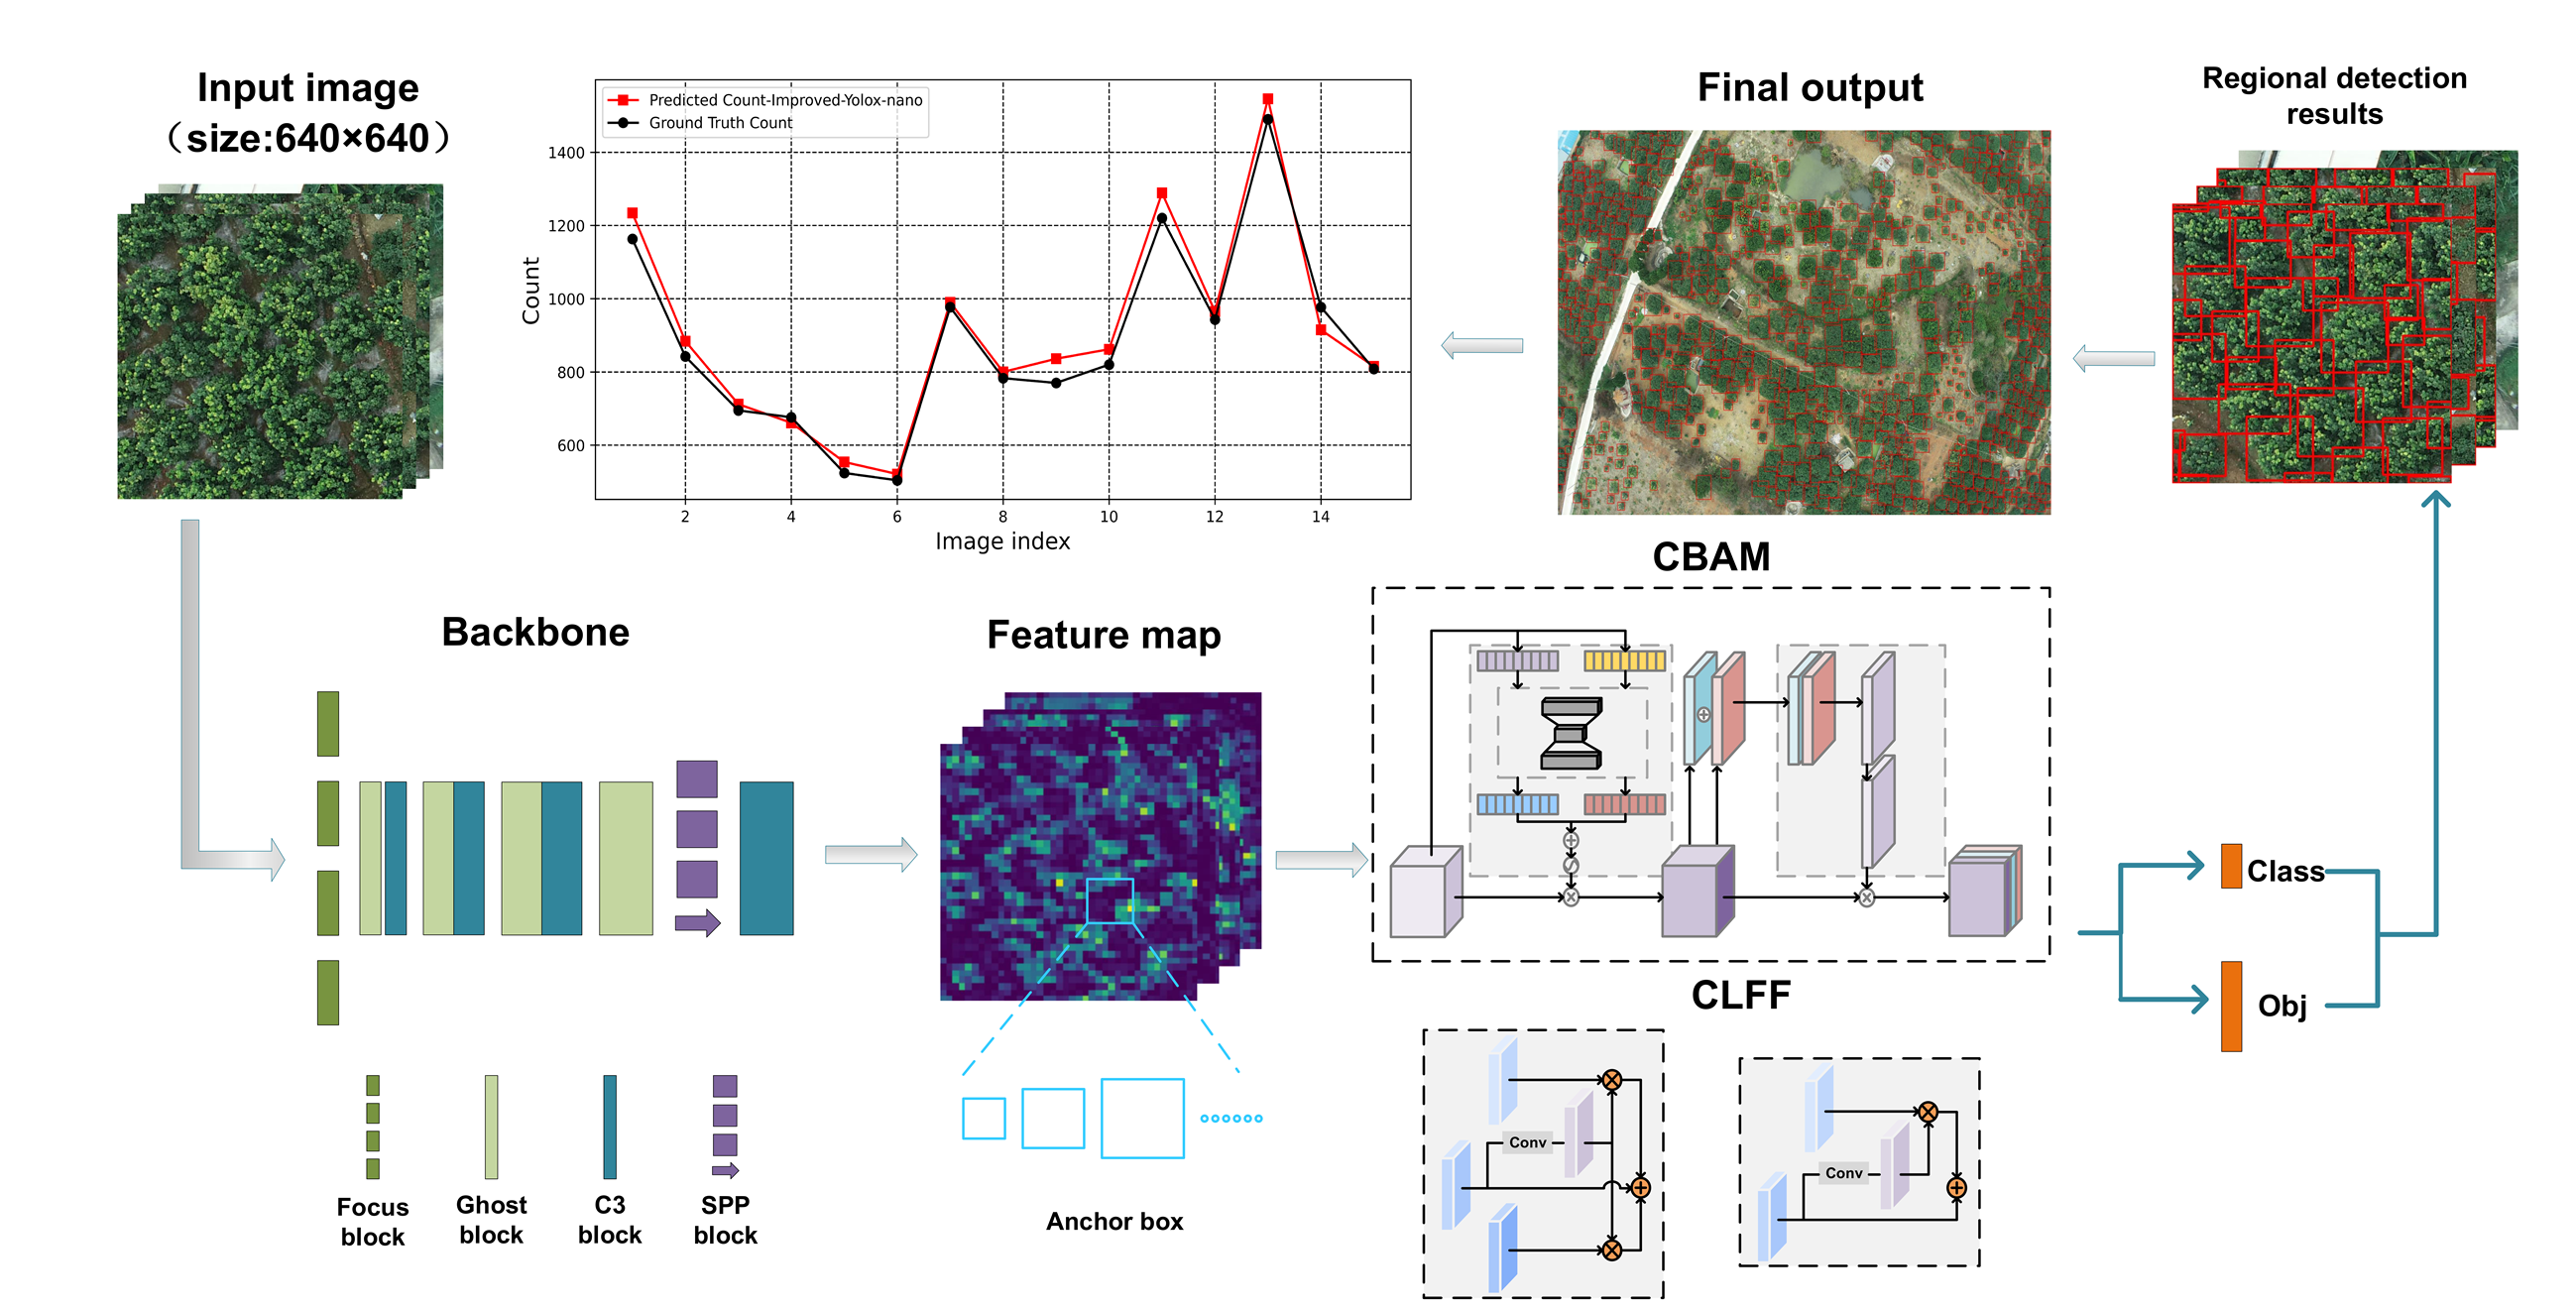
2.2. Proposed Method

We introduce an attention mechanism behind the backbone feature extraction network, which allows the model to focus on the pomelo canopy, improving the differentiation of the pomelo trees from the backdrop. A cross-layer feature-fusion model (CLFF) helps the network to more effectively fuse features at different layers so as to enrich feature information extracted by the model and improve model-detection capability. The CNN module can create a large number of similar feature maps, and it has been shown that these redundant feature maps enable the CNN’s excellent feature-extraction capabilities [54]. The proposed method can reduce model parameters and improve feature extraction. The proposed network structure is shown in Figure 3.

2.2.1. Hybrid Attention Mechanism Module

Despite the increasing resolution of remote-sensing images, there is still ambiguity in the boundaries between objects, which increases false detection. In addition, the sizes of pomelo trees vary by growth stages, causing poor performance. To address this problem, we use an attention mechanism [55] to enhance the importance of target pixels in both channels and space, which can strengthen the information of pomelo trees and weaken background information by weighting the features extracted by the backbone feature network. The attention score indicates the degree of correlation between pixels and targets [56], and can be used to focus on pomelo trees and reduce the impact of canopy sizes.
The hybrid attention mechanism (Figure 4) has channel and spatial attention mechanisms, focusing on both channel and pixel point weighting during model training.
In the channel attention mechanism, maximum and average pooling are applied to the h × w × c feature map to obtain two 1 × w × c feature strips, which are fed into the shared full-connected module, which contains two full-connected layers. The number of neurons in the first full connection is small, and the number in the second full connection is equal to the number of input channels. The resulting two features are summed, and the weight coefficients of each 1 × w × c channel are obtained by the sigmoid function. The weight coefficients are multiplied with the input feature map.
In the spatial attention mechanism, maximum and average pooling are applied for the feature map on the channels, and the outputs are stacked in the channel dimension to obtain an h × w × 2 feature map. The stacked feature map is fed to a convolution module, and the weight of each feature point is obtained by the sigmoid function. The input feature map is multiplied by the weight of each feature point.
The channel and spatial attention mechanisms are formulated as
M c ( F ) = σ ( M L P ( A v g P o o l ( F ) ) + M L P ( M a x P o o l ( F ) ) )
M s ( F ) = σ ( f 7 × 7 ( [ A v g P o o l ( F ) ; M a x P o o l ( F ) ] ) ) ,
where σ denotes the sigmoid function, F represents the feature map, M L P represents the fully connected neural network, and f 7 × 7 represents convolution with a 7 × 7 filter.
In this study, the spatial attention module uses a 7 × 7 convolution kernel, which empirically outperforms a 3 × 3 convolution kernel. Within a certain interval, the larger the convolution kernel, the better the performance of the network. We maintain the original backbone feature network structure. To retain the excellent feature extraction capability of the original model, a hybrid attention mechanism is added after the backbone network.

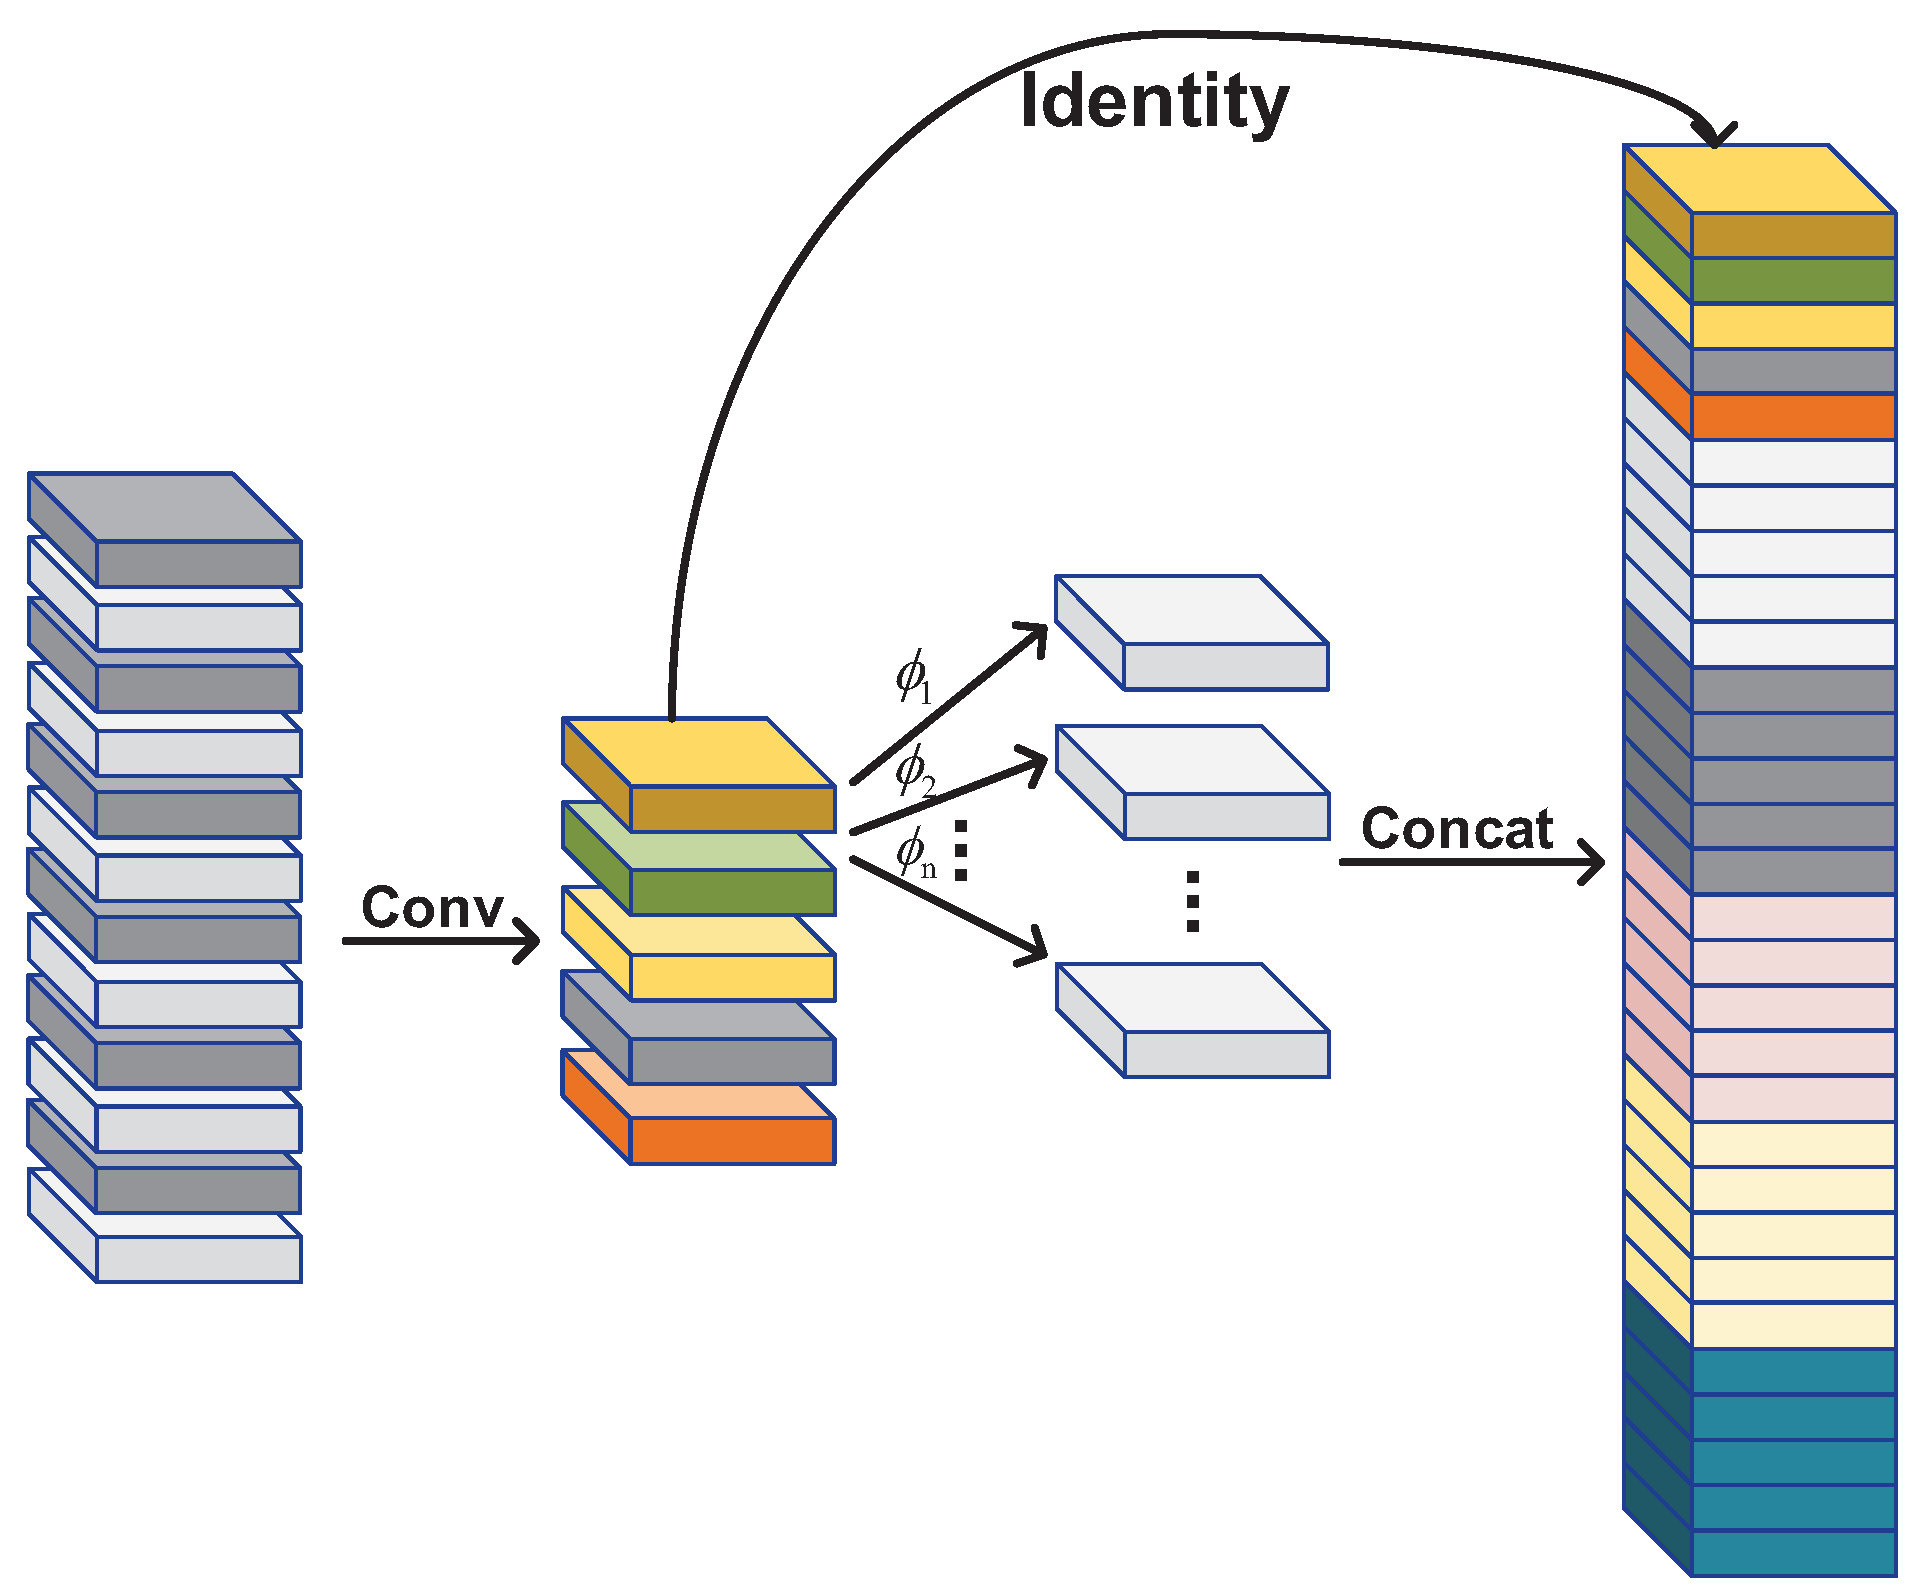
2.2.2. Cross-Layer Feature Fusion Pyramid

The low-level features from the shallow layers of the network contain much fine-grained feature information and background noise, while features extracted from the deeper layers have more semantic information [57]. Therefore, integrating low- and high-level features can produce high-quality feature maps that complement each other. The original model feature fusion section uses a feature pyramid network (FPN) with a path-aggregation network (PANet) structure. The FPN structure conveys the deep feature information by upsampling to fuse and obtain the predicted feature map. A bottom-up feature pyramid containing two PANet structures is added after the FPN structure. The PANet can convey strongly localized features in a bottom-up manner. However, the FPN+PAN structure uses some transformations to feature maps so that their sizes are equal, which leads to the loss of some useful information. Furthermore, the FPN+PAN structure does not fully use the complementary features across the shallow and deep layers of the network, so it does not achieve better performance.
EfficientDet [58] uses BiFPN to combine different levels of features to detect objects, using features with stronger semantic information to detect large objects, and features with stronger spatial information to detect small objects. It shows good performance.
Inspired by EfficientDet, we propose the CLFF module (Figure 5) to extend the feature fusion network structure of BiFPN, which exploits the complementary features of the shallow and deep layers of the network. Unlike the aggregation strategy of series or additive operations, we consider the complementary features between different layers of the network to overcome the lack of some detailed and semantic information of deep and shallow features, respectively, about the pomelo tree. We multiply the masks of the feature maps of the middle layer with those of the shallow and deep layers to take full advantage of the complementary features between layers, which can enable one to more effectively focus on the pomelo tree region, while reducing the interference of background noise. We use the feature maps in the bottom-up path to generate the masks. The steps are as follows.
1.
For the middle feature map s , we generate the semantic mask w using a convolution with a 3 × 3 kernel;
2.
We multiply the semantic mask w and shallow-feature map h , and the semantic mask w and deep-feature map g ;
3.
We sum the above two results, and feed the sum to a 3 × 3 convolution layer to obtain the output of the feature-fusion module.

2.2.3. Ghost Convolution Module

The feature maps obtained by traditional convolution have high similarity and redundancy, resulting in a large computational cost. We replace this with the Ghost module to reduce the computational cost and make the model more lightweight and efficient. The Ghost module uses linear operations instead of some convolutions, as shown in Figure 6.
The Ghost module has two steps. Traditional convolution generates a small number of intrinsic feature maps, and a linear operation expands features and increases the number of channels. Linear operations can produce similar feature maps with fewer parameters and less computing cost. The total number of required parameters and the computational complexity of the Ghost module are less than those of traditional convolution.

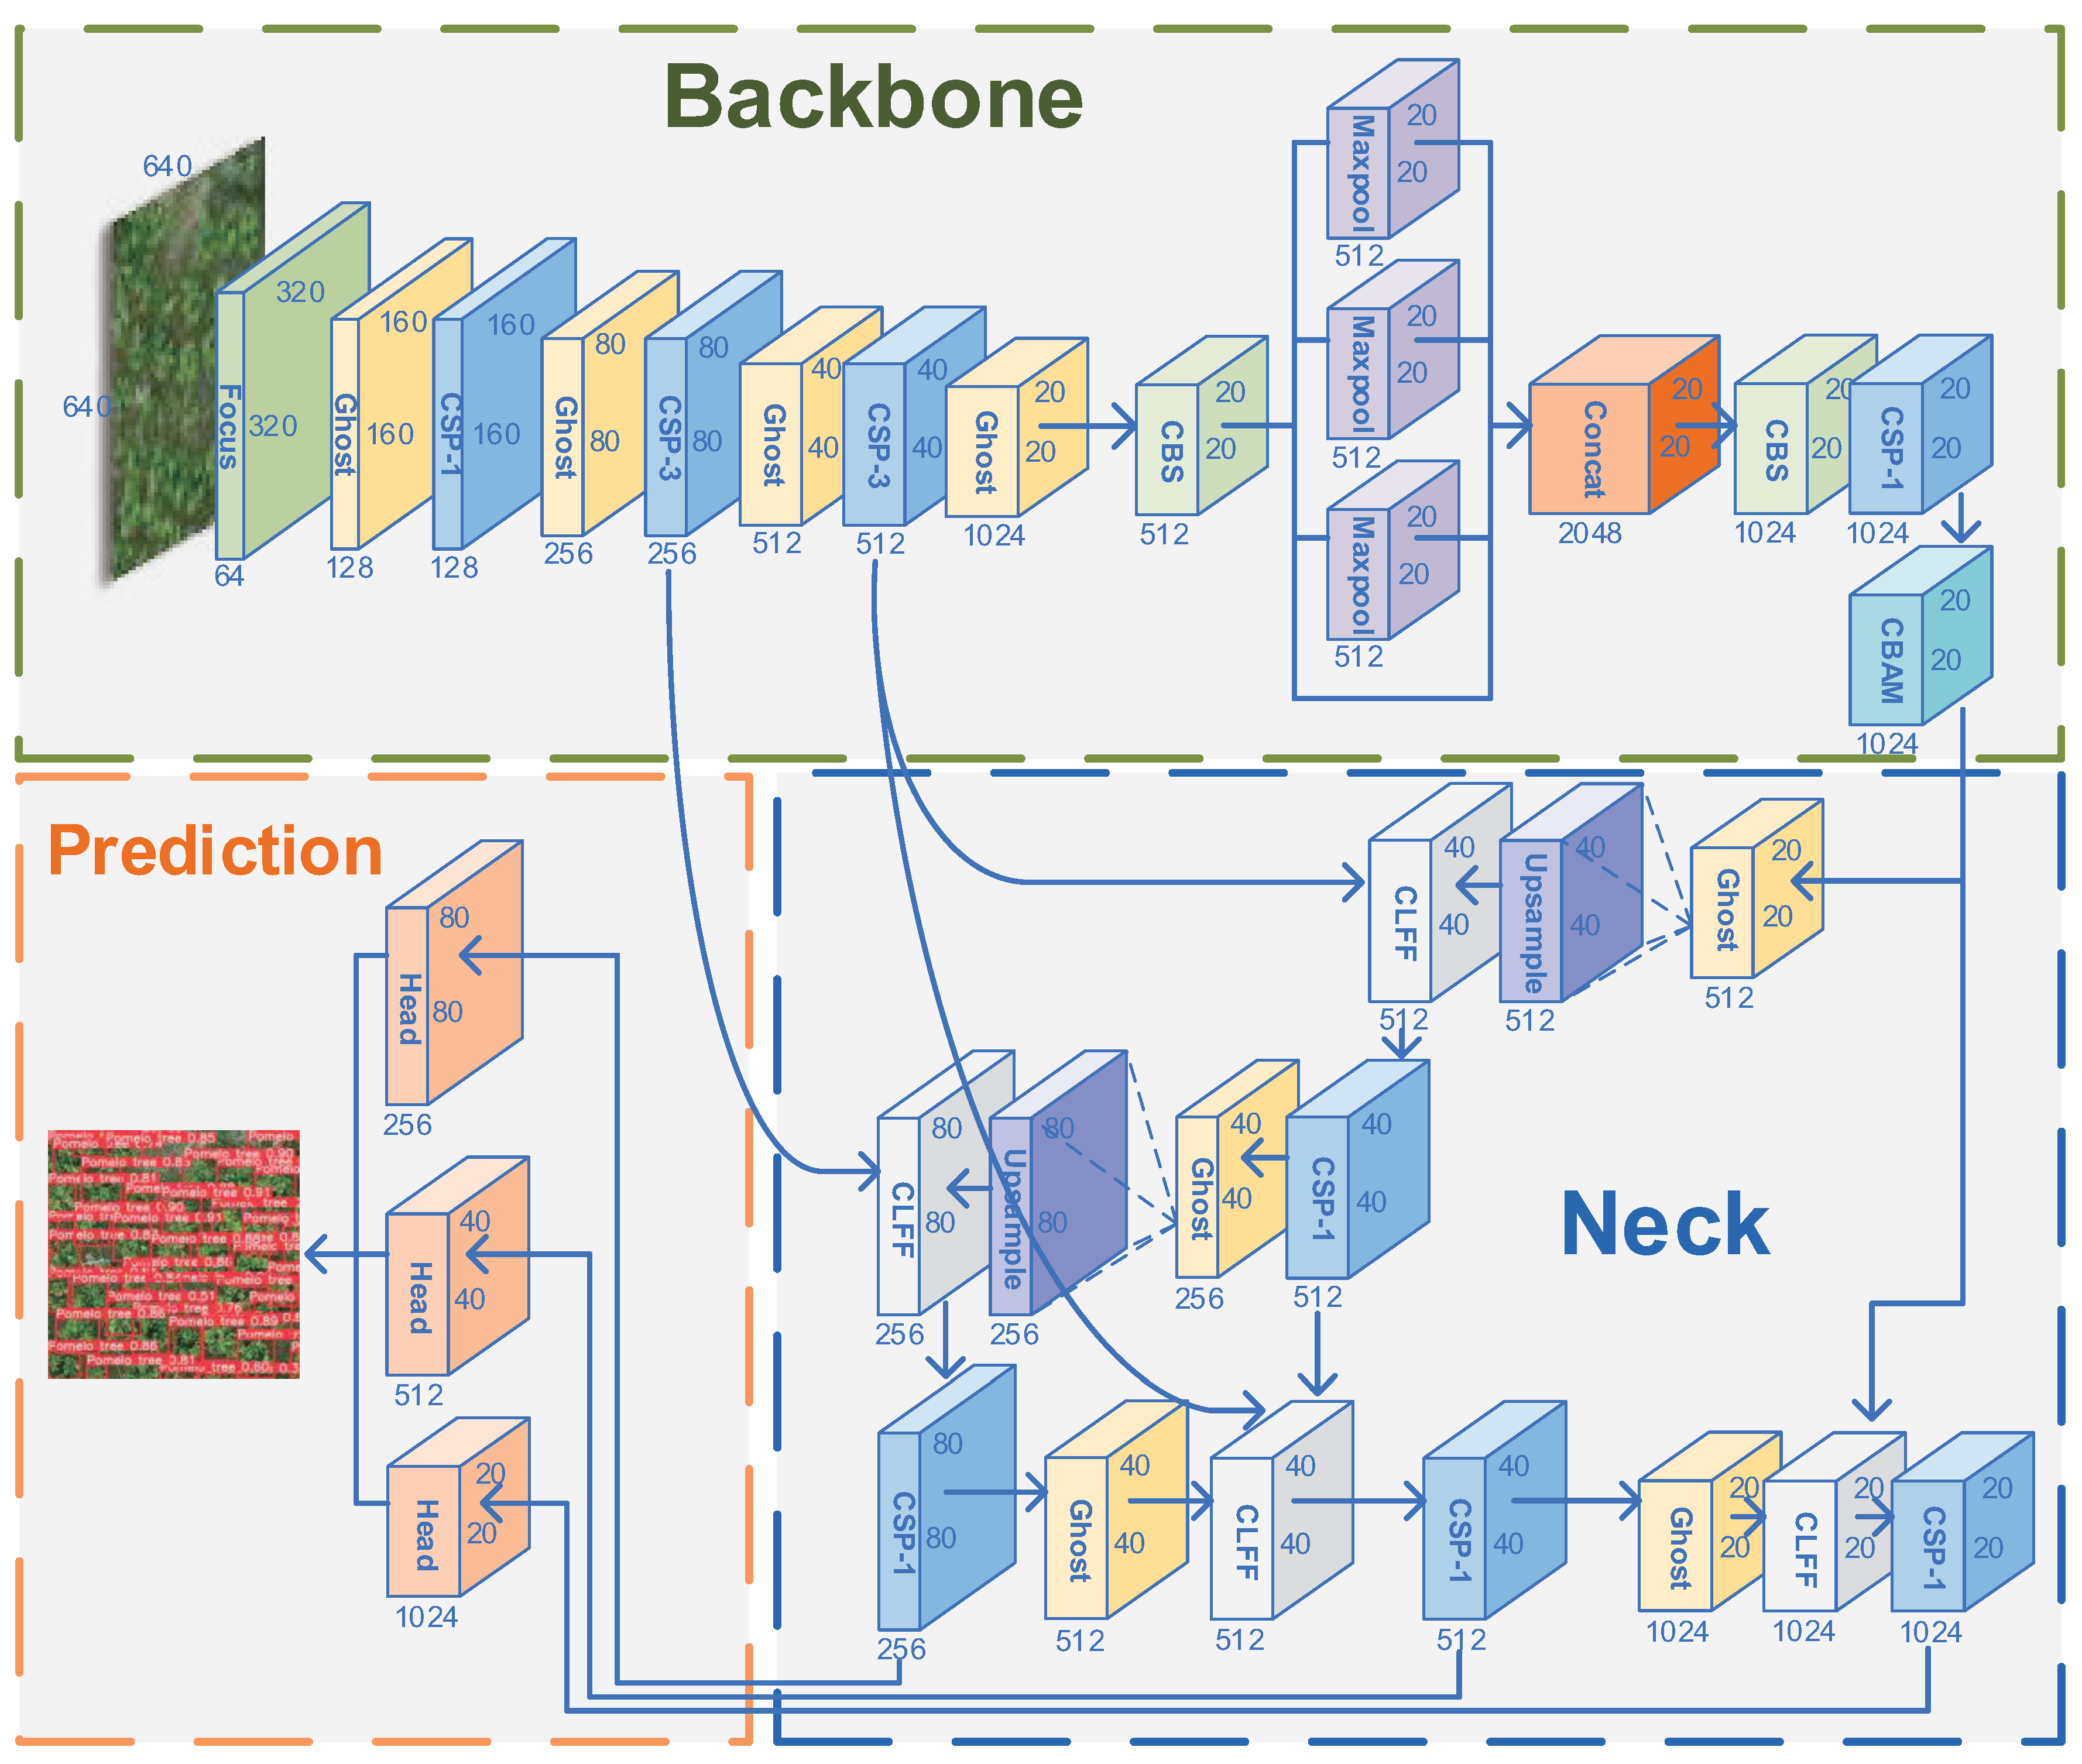
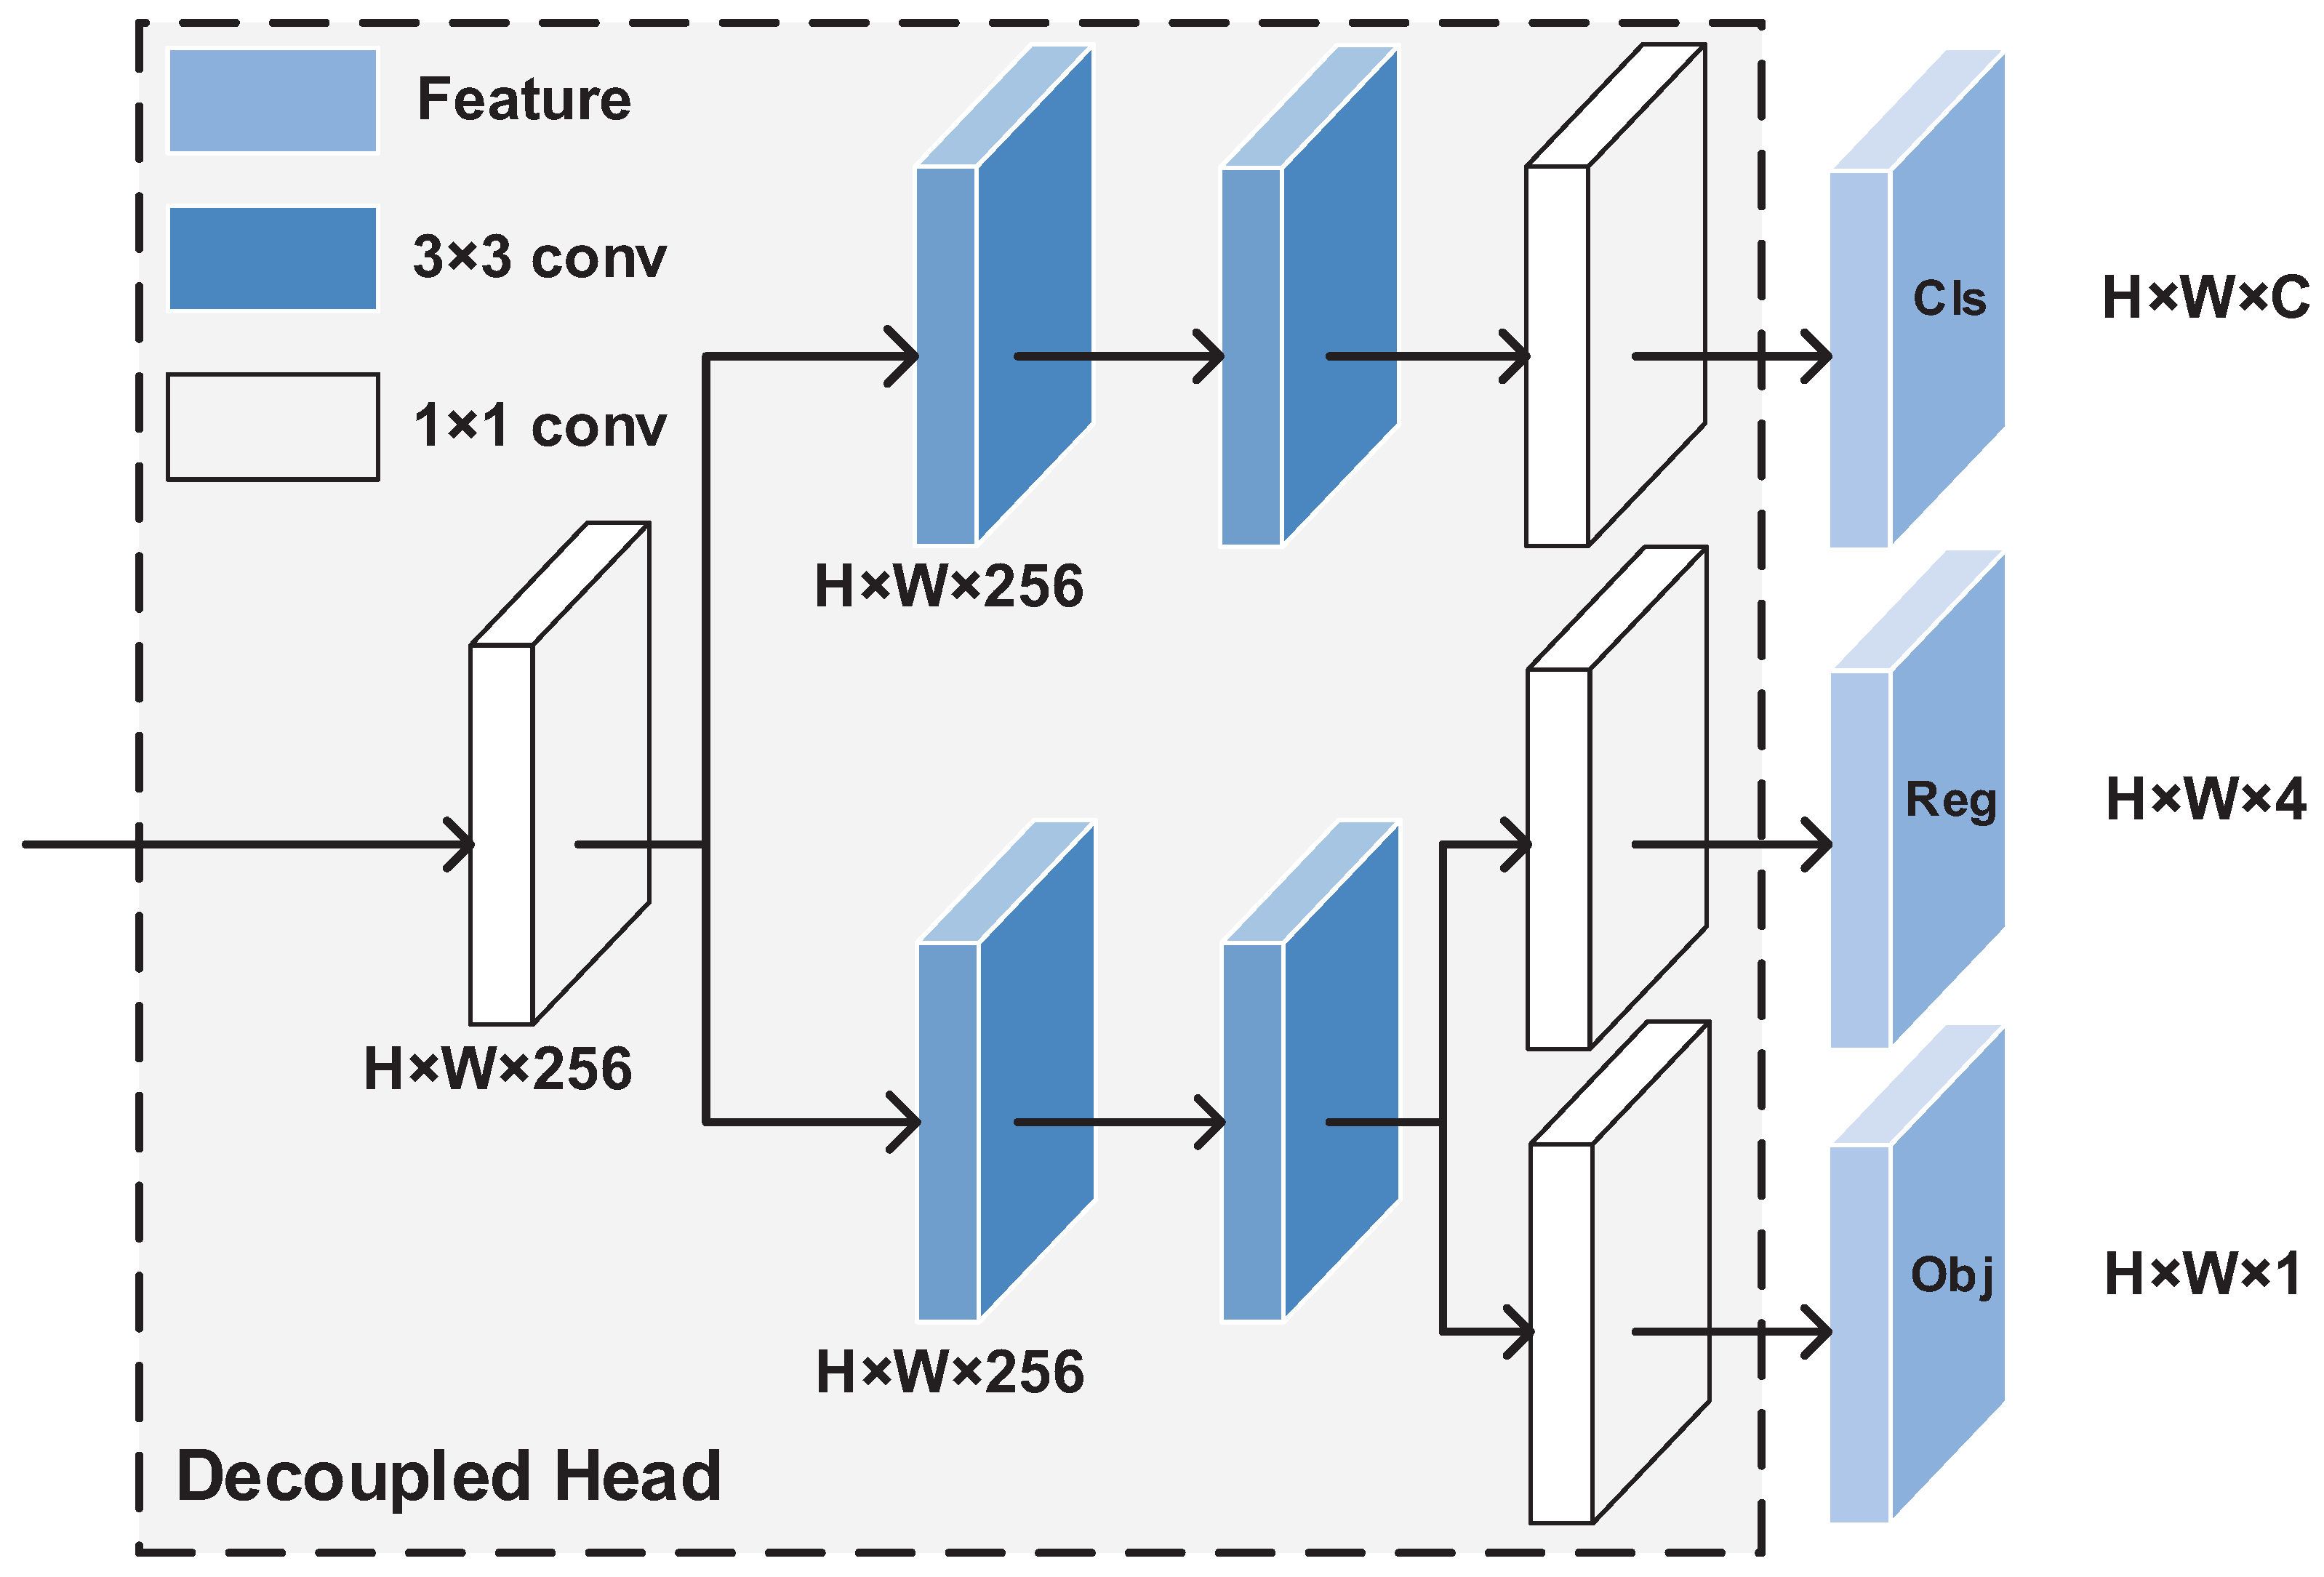
2.3. Pomelo Tree-Detection Network

Figure 3 shows the proposed network structure for pomelo tree detection. Following the divide-and-conquer principle, module y1 focuses on large-scale object detection, and modules y2 and y3 focus on medium- and small-scale objects, respectively. A hybrid attention mechanism, a cross-layer feature-fusion pyramid, and the Ghost module improve performance.
The proposed network has a backbone, neck, and prediction sections, including a Focus module, CBS structure, CSP residual structure, and SPP module.
  • The Focus module uses a slicing operation to split a high-resolution feature map into multiple low-resolution feature maps. This module samples and splices the input feature maps in each column and obtains output feature maps by convolution operations, which can reduce information loss due to downsampling;
  • The CBS structure consists of convolutional layers, normalization processing, and SiLU activation functions, which have the characteristics of no upper or lower bound, smoothness, and non-monotonicity, which can improve accuracy;
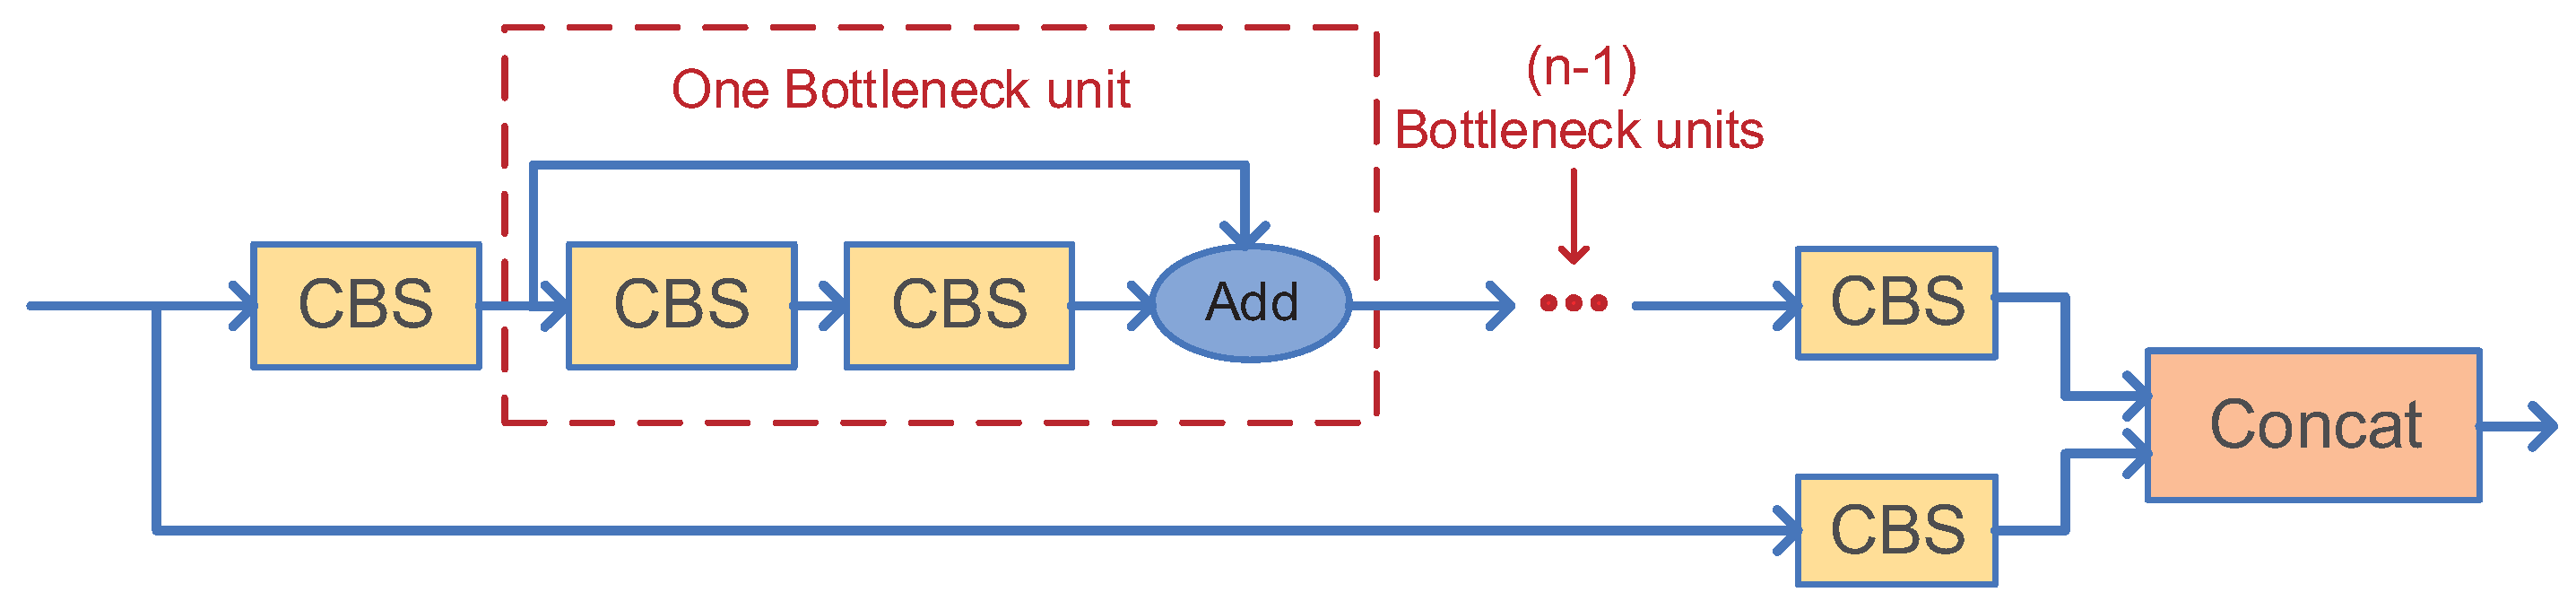
  • The CSP structure consists of a standard convolutional structure and a bottleneck module, which reduces and then expands the number of channels, with the final number of input and output channels remaining the same. The input feature layer of the CSP has two branches, one with multi-bottleneck stacking and standard convolution, and the other with a basic convolution module, as shown in Figure 7. The feature maps of the two branches are aggregated by a concat operation. To reduce the model size, we only stack the bottleneck modules once in the CSP structure;
  • The SPP module can realize the fusion of local and global features, which enriches the information of the feature map. It performs well in the case of large differences in target size.
Figure 7. CSP−n structure. The input feature layer of the CSP has two branches, one with multi-bottleneck stacking and standard convolution, and the other with a basic convolution module. CSP−1 means one bottleneck unit, CSP−n means n bottleneck units.
Remotesensing 14 03902 g007
We describe the flow of our proposed algorithm. The input of the backbone feature network is a 640 × 640 × 3 image, which is turned into a 320 × 320 × 12 feature map by the Focus module after one convolution operation with 64 convolution kernels. Through one layer of CBS and CSP modules, the shallow features are aggregated, and the feature dimension is transformed to 160 × 160 × 128 , where the CBS module changes the size and number of channels of the feature map, and the CSP module divides the feature map into two parts and merges them through the cross-stage hierarchy. The features are further extracted by three CBS and CSP combination modules to obtain two effective feature layers, y1 and y2, whose respective feature maps are 80 × 80 × 256 and 40 × 40 × 512 , respectively. An SPP module is inserted between the subsequent CBS and CSP structures, and the 20 × 20 × 512 feature map is fused with local and global features to improve its expressiveness. The third effective feature layer, y3, is obtained, which has a 20 × 20 × 1024 feature map.
The deep feature information enhances the network’s ability to capture the target by blending the attention mechanism and fusing its weights. The cross-layer feature fusion network achieves the fusion and multiplexing of multi-level features, thus obtaining effective feature layers of the size 80 × 80 × 256 , 40 × 40 × 512 , and 20 × 20 × 1024 . After prediction, three results are obtained for each feature layer by decoupled head: the category (cls), coordinates (Reg), and foreground background judgment of the target frame (Obj), as shown in Figure 8. Reg has four channels, representing the offset of the center of the prediction frame compared to the feature points, and the offset of the width and height of the prediction frame compared to the logarithmic index of the reference. Obj has one channel, representing the probability of each feature point predicting the objects contained in the frame. Cls has num_classes channels, representing the probability that each feature point corresponds to a class of objects.
We use complete-IoU ( C I o U ) loss instead of intersection over union ( I o U ) in the prediction phase. I o U is commonly used as a matching degree evaluation metric of prediction bounding boxes and ground-truth boxes in a dataset, calculated by the ratio of their area intersection and union. We consider the effects of the overlap region, centroid distance, and aspect ratio on the loss function, which makes the regression of target-detection frames more stable. The C I o U loss is defined as
C I o U = I o U ρ 2 ( b , b g t ) c 2 α ν
α = ν 1 I o U + ν
ν = 4 π 2 ( a r c t a n w g t h g t a r c t a n w h ) 2
L O S S C I o U = 1 I o U + ρ 2 ( b , b g t ) c 2 α ν ,
where c is the diagonal distance of the smallest closed area that can contain both the predicted and real bounding boxes; ρ 2 ( b , b g t ) is the Euclidean distance between the center point of the predicted and real boxes, and the corresponding loss is 1 C I o U .

3. Results

Table 1 shows the experimental environment. The proposed method used stochastic gradient descent (SGD) for training with 500 iterations, where the batch size was 16, the momentum coefficient was 0.937, the weight decay rate was 0.0005, and the initial learning rate was 0.01 and dynamically decreased to 0.0001. The enhancement factors of hue (H), saturation (S), and luminance (V) were set to 0.015, 0.7, and 0.4, respectively. The final output was the identified pomelo canopy location boxes and the probability of belonging to the pomelo tree category. The training, validation, and testing sets are described in Section 2.1. The source code for the proposed method is available at https://github.com/hr8yhtzb/PTDM.

3.1. Standard of Performance Evaluation

We used the common index A P to evaluate the performance of different methods. Because the detection target of this study only belonged to one class, the value of m A P was equal to the single-target A P value. Hence, m A P was not used as an evaluation metric. A P was calculated as
A P = 0 1 P ( R ) d R ,
where P and R are the respective precision and recall of the detection model,
P = T P T P + F P
R = T P T P + F N ,
where T P , F P , T N , and F N denote true positive, false positive, true negative, and false negative, respectively.
The counting performance was evaluated using mean error ( M A E ), counting accuracy ( A C C ), R 2 , and root mean square error ( R M S E ). M A E reflects the accuracy of counting, and R M S E reflects the robustness of the counting network. They were defined as
M A E = 1 n 1 n t i c i
A C C = ( 1 1 n 1 n t i c i t i )
R 2 = 1 1 n ( t i c i ) 2 1 n ( t i t ˜ i ) 2
R M S E = 1 n ( t i c i ) 2 n ,
where t i , t ˜ i , and c i are the actual count, average true count, and predicted count, respectively, of image i (total number of anchors detected), and n is the number of UAV images in the test set. M A E and A C C quantify prediction accuracy. R 2 and R M S E were used to evaluate the counting performance of the proposed method.

3.2. Comparison to State-of-the-Art Object-Detection Algorithms

We compare our proposed method with state-of-the-art object-detection algorithms, including Faster R-CNN [37], SSD [43], YOLOv3 [45], YOLOv4-tiny [46], Libra [42], and CCTD [39]. Faster R-CNN is a famous two-stage detection algorithm, and many tree-detection models are based on Faster R-CNN. SSD, YOLOv3, and YOLOv4-tiny are famous single-stage detection algorithms. They do not have the bounding box proposal and resampling steps, so they have a faster computational speed. YOLOv4-tiny is a lightweight version of YOLOv4 with fewer parameters and faster detection speed. Libra and CCTD are state-of-the-art two-stage detection algorithms. Libra optimized two-stage detection using IoU-balanced sampling. CCTD used a multi-level region proposal network to optimize the selection of region proposals. The two datasets described in Section 2.1 were selected for experiments.

3.2.1. Comparison of Detection Performance

We first evaluated the precision, recall, AP, F1-score and complexity for different state-of-the-art algorithms, as shown in Table 2, Table 3 and Table 4, where the best value of different methods is shown in bold, from which we can observe the following.
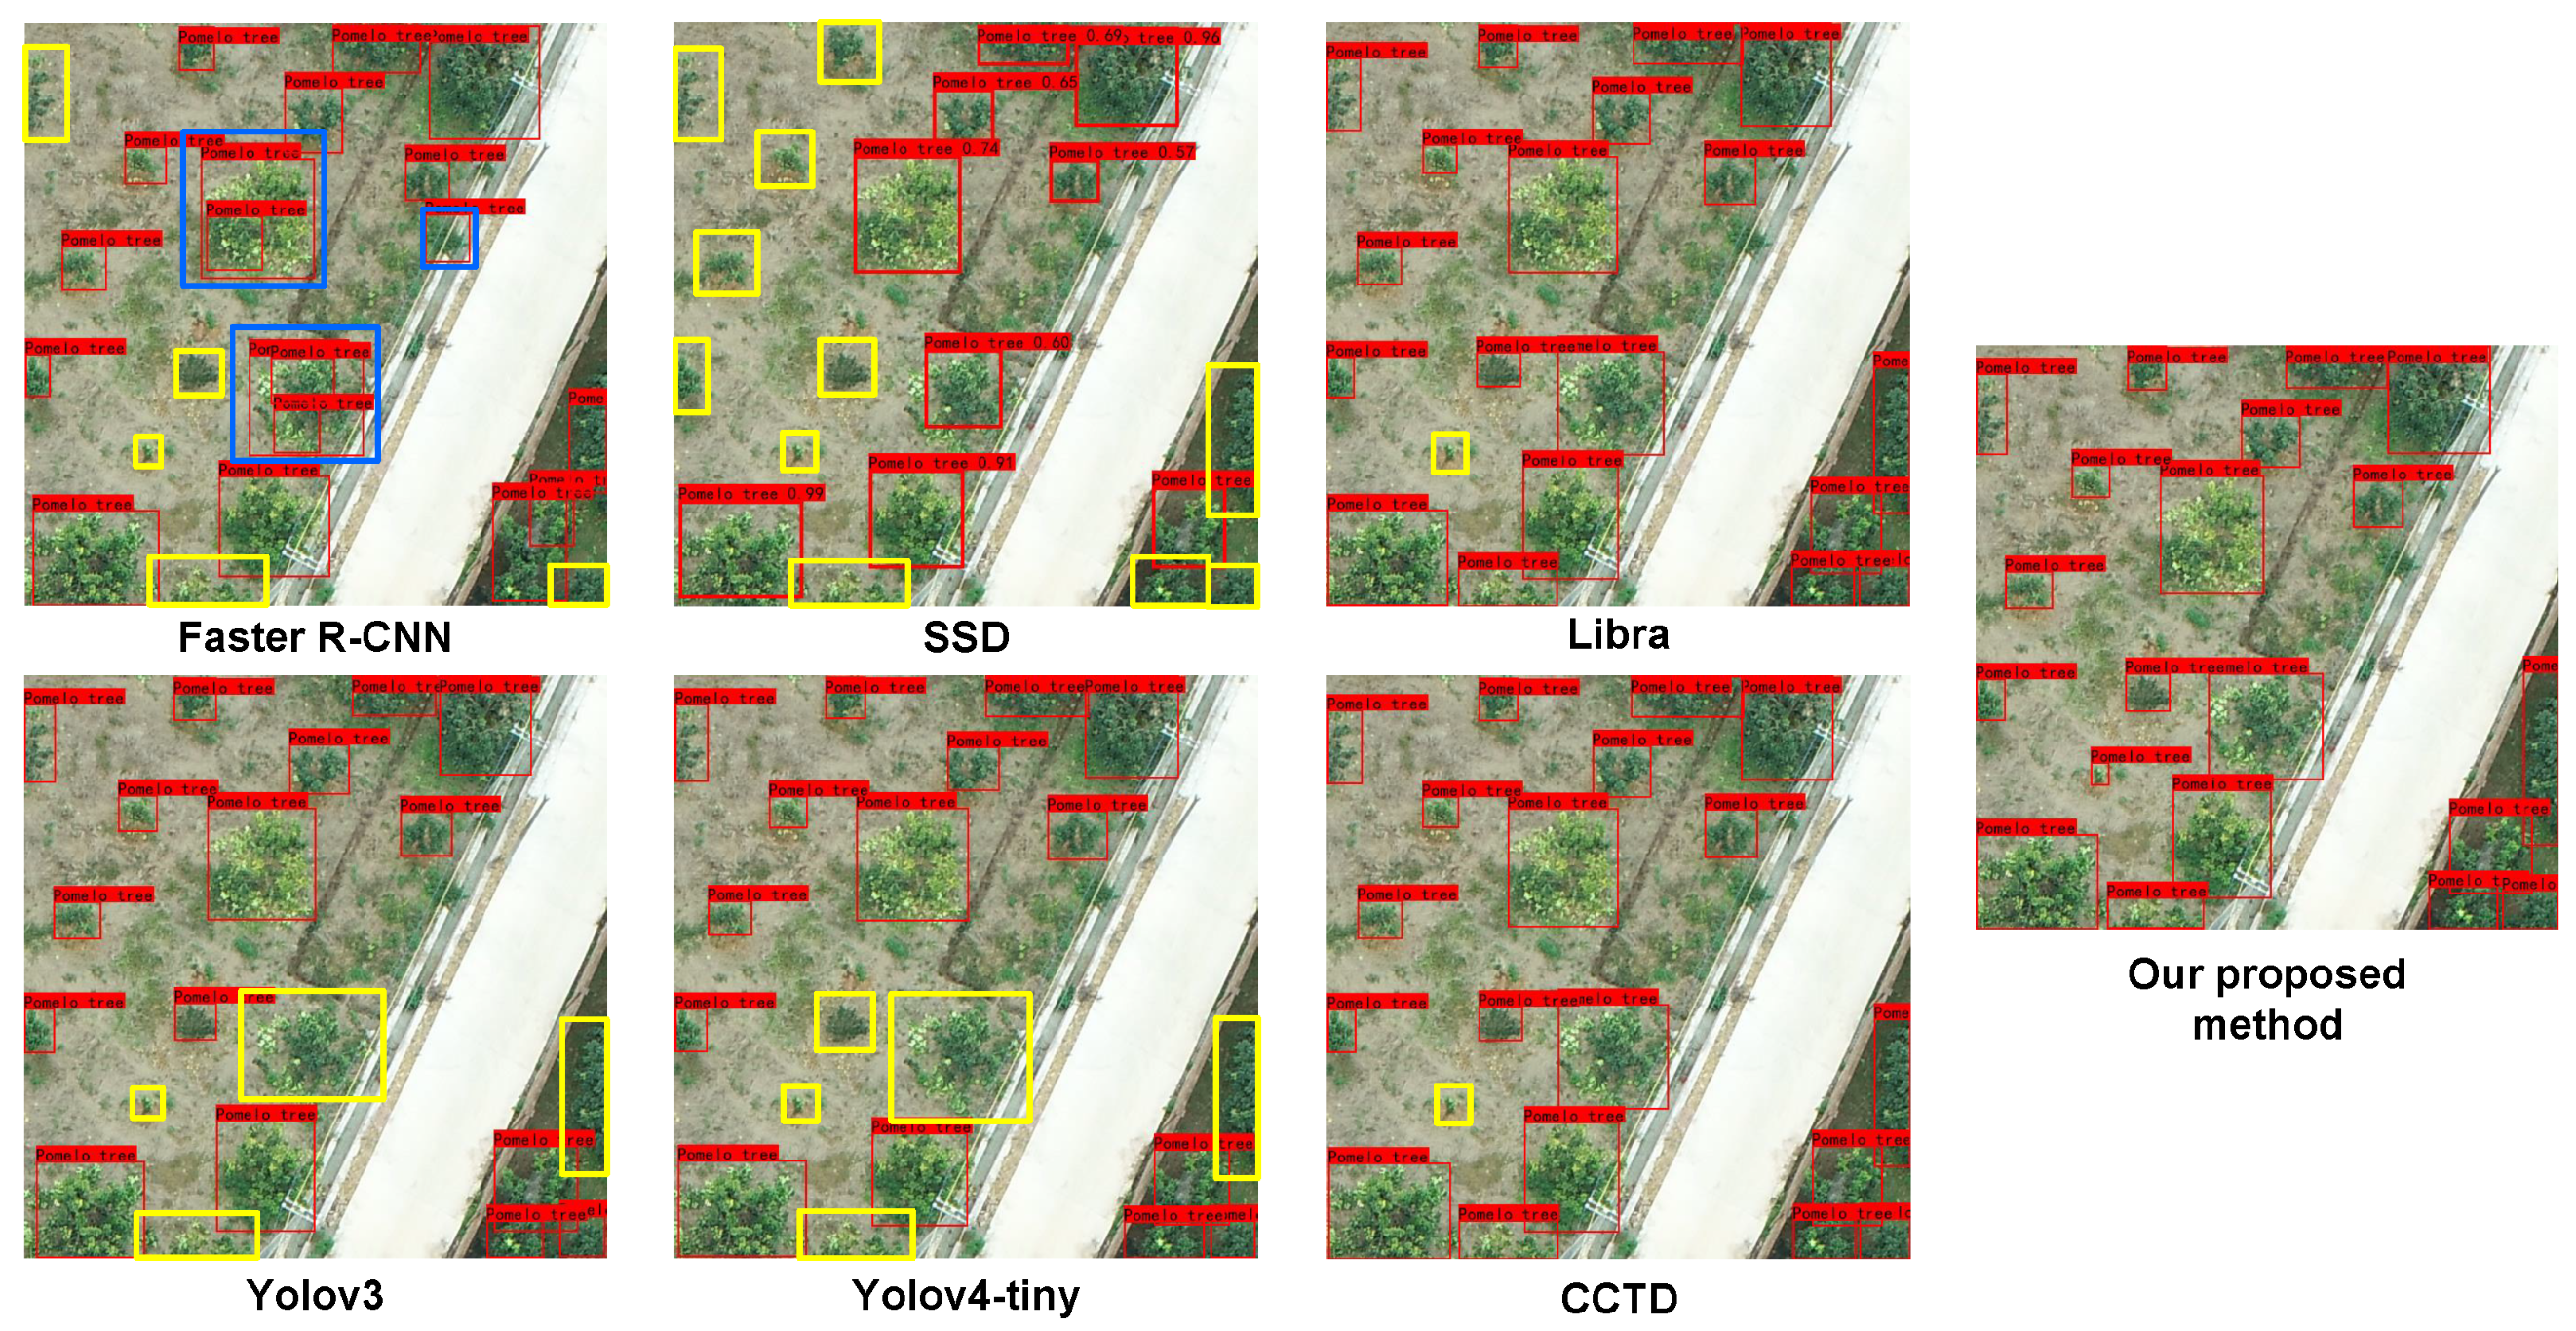
  • Faster R-CNN had the lowest precision, with just 43.17% and 16.08%, respectively, in datasets 1 and 2, perhaps because of the complex background. Faster R-CNN does not build an image feature pyramid, and cannot effectively use shallow and small-scale features, resulting in a high number of false detections and low precision. In addition, this method appears to overfit, which resulted in much lower accuracy than other methods, indicating that this method is unsuitable for pomelo tree detection.
  • SSD had an extremely low recall, with 58.23% and 30.06% in datasets 1 and 2, respectively, because SSD has no feature pyramid, the same as in Faster R-CNN. The recall rate of SSD was 1% to 4% lower than that of Faster R-CNN, which uses two-step detection. It first generates the region of interest, and then detects within it. Therefore, two-step detection could reduce the number of missed objects, and had a higher recall rate. However, the recall rates of SSD and Faster R-CNN were both lower than those of other methods owing to the lack of a feature pyramid.
  • YOLOv3 had the highest precision of all methods, reaching over 93% in the first dataset and 91% in the second region. However, its recall was less than 80% and 50% in the two datasets, respectively. YOLOv3 is the most complex because it includes a large number of convolution modules, which incur more computational cost.
  • YOLOv4-tiny had similar detection results to YOLOv3, as they are both single-stage detectors. Although YOLOx-nano is also a single-stage detector, it had about 6% to 25% higher recall than YOLOv4-tiny and YOLOv3 in both regions because it has two PANet structures that can constitute a bottom-up feature pyramid, which can enhance feature extraction. In addition, YOLOx-nano is anchor-free, which is better than an anchor-based detector for single-tree detection in remote-sensing images [59]. Because an anchor-based detector matches the object based on the anchor box’s size, it misses detection if the object’s size exceeds that of the anchor box. The anchor free detector efficiently eliminates the problem that the anchor box does not match the object size and lowers the possibility of missed detection.
  • Libra and CCTD are both two-stage detectors and therefore have a high recall rate on both datasets, with about 87% in the first dataset and 80% in the second dataset. This result indicated that Libra and CCTD method had fewer missed detections. However, because Libra and CCTD are anchor-based method, their accuracy is limited, with only about 63% to 75% in the second dataset.
  • Our method obtained the highest A P among all algorithms, which demonstrates its effectiveness. The precision was 92.41% and 87.18% in datasets 1 and 2, respectively, the recall was 87.07% and 75.35%, and the AP value was 93.74% and 87.81%. Among all compared methods, the A P value of ours was the highest. The outstanding performance of our method can be attributed to the attention mechanism, the cross-layer feature-fusion pyramid, and the Ghost module. The attention mechanism improves the capacity to extract feature information across space and channels, and provides enough feature suppression background information. The cross-layer feature-fusion pyramid combines semantic information from feature maps at different levels of layers, allowing it to learn rich information. Use of the Ghost module instead of 3 × 3 convolution reduces the variance of the feature geometry, thus deepening the feature information association between deep and shallow feature maps.
  • The model size of our proposed method was 7.8 MB only, which is 98% and 96% smaller than that of Libra and YOLOv3, respectively, and is just slightly more than that of YOLOx-nano. In addition, our method was the fastest of all methods. It is worth noting that the size of our proposed method is larger than YOLOx-nano, but it runs faster than YOLOx-nano. This is because the ghost module we used can reduce the computational complexity. In summary, our improvements make the model lighter and more computationally efficient.
Figure 9 shows the visual detection effects of different methods. Faster R-CNN and SSD had a large number of missed detections, whereas YOLOv3, YOLOv4-tiny, Libra, and CCTD had a small number. This result showed that the recalls of the Faster R-CNN and SSD detectors were much lower than those of the YOLO series because they lack an image pyramid and are unable to properly integrate the information from the feature layer. Libra and CCTD are both anchor-based detection methods, and they are insensitive to tiny targets. Overall, our method outperformed the other methods, without the yellow box and the blue box for the testing image. Moreover, as a lightweight model, our method is better suited for pomelo tree recognition.
Figure 10 shows the ability of the proposed method to distinguish similar targets. In Figure 10a,b, an area planted with a large number of pomelo trees is confused with a small number of orange trees. The proposed method could accurately treat orange trees with slightly different leaf colors as negative samples. In Figure 10c, the proposed method could accurately treat other trees with mostly the same leaf color but with a few white leaves as negative samples. Overall, our proposed method had good ability to distinguish trees similar to pomelo trees.

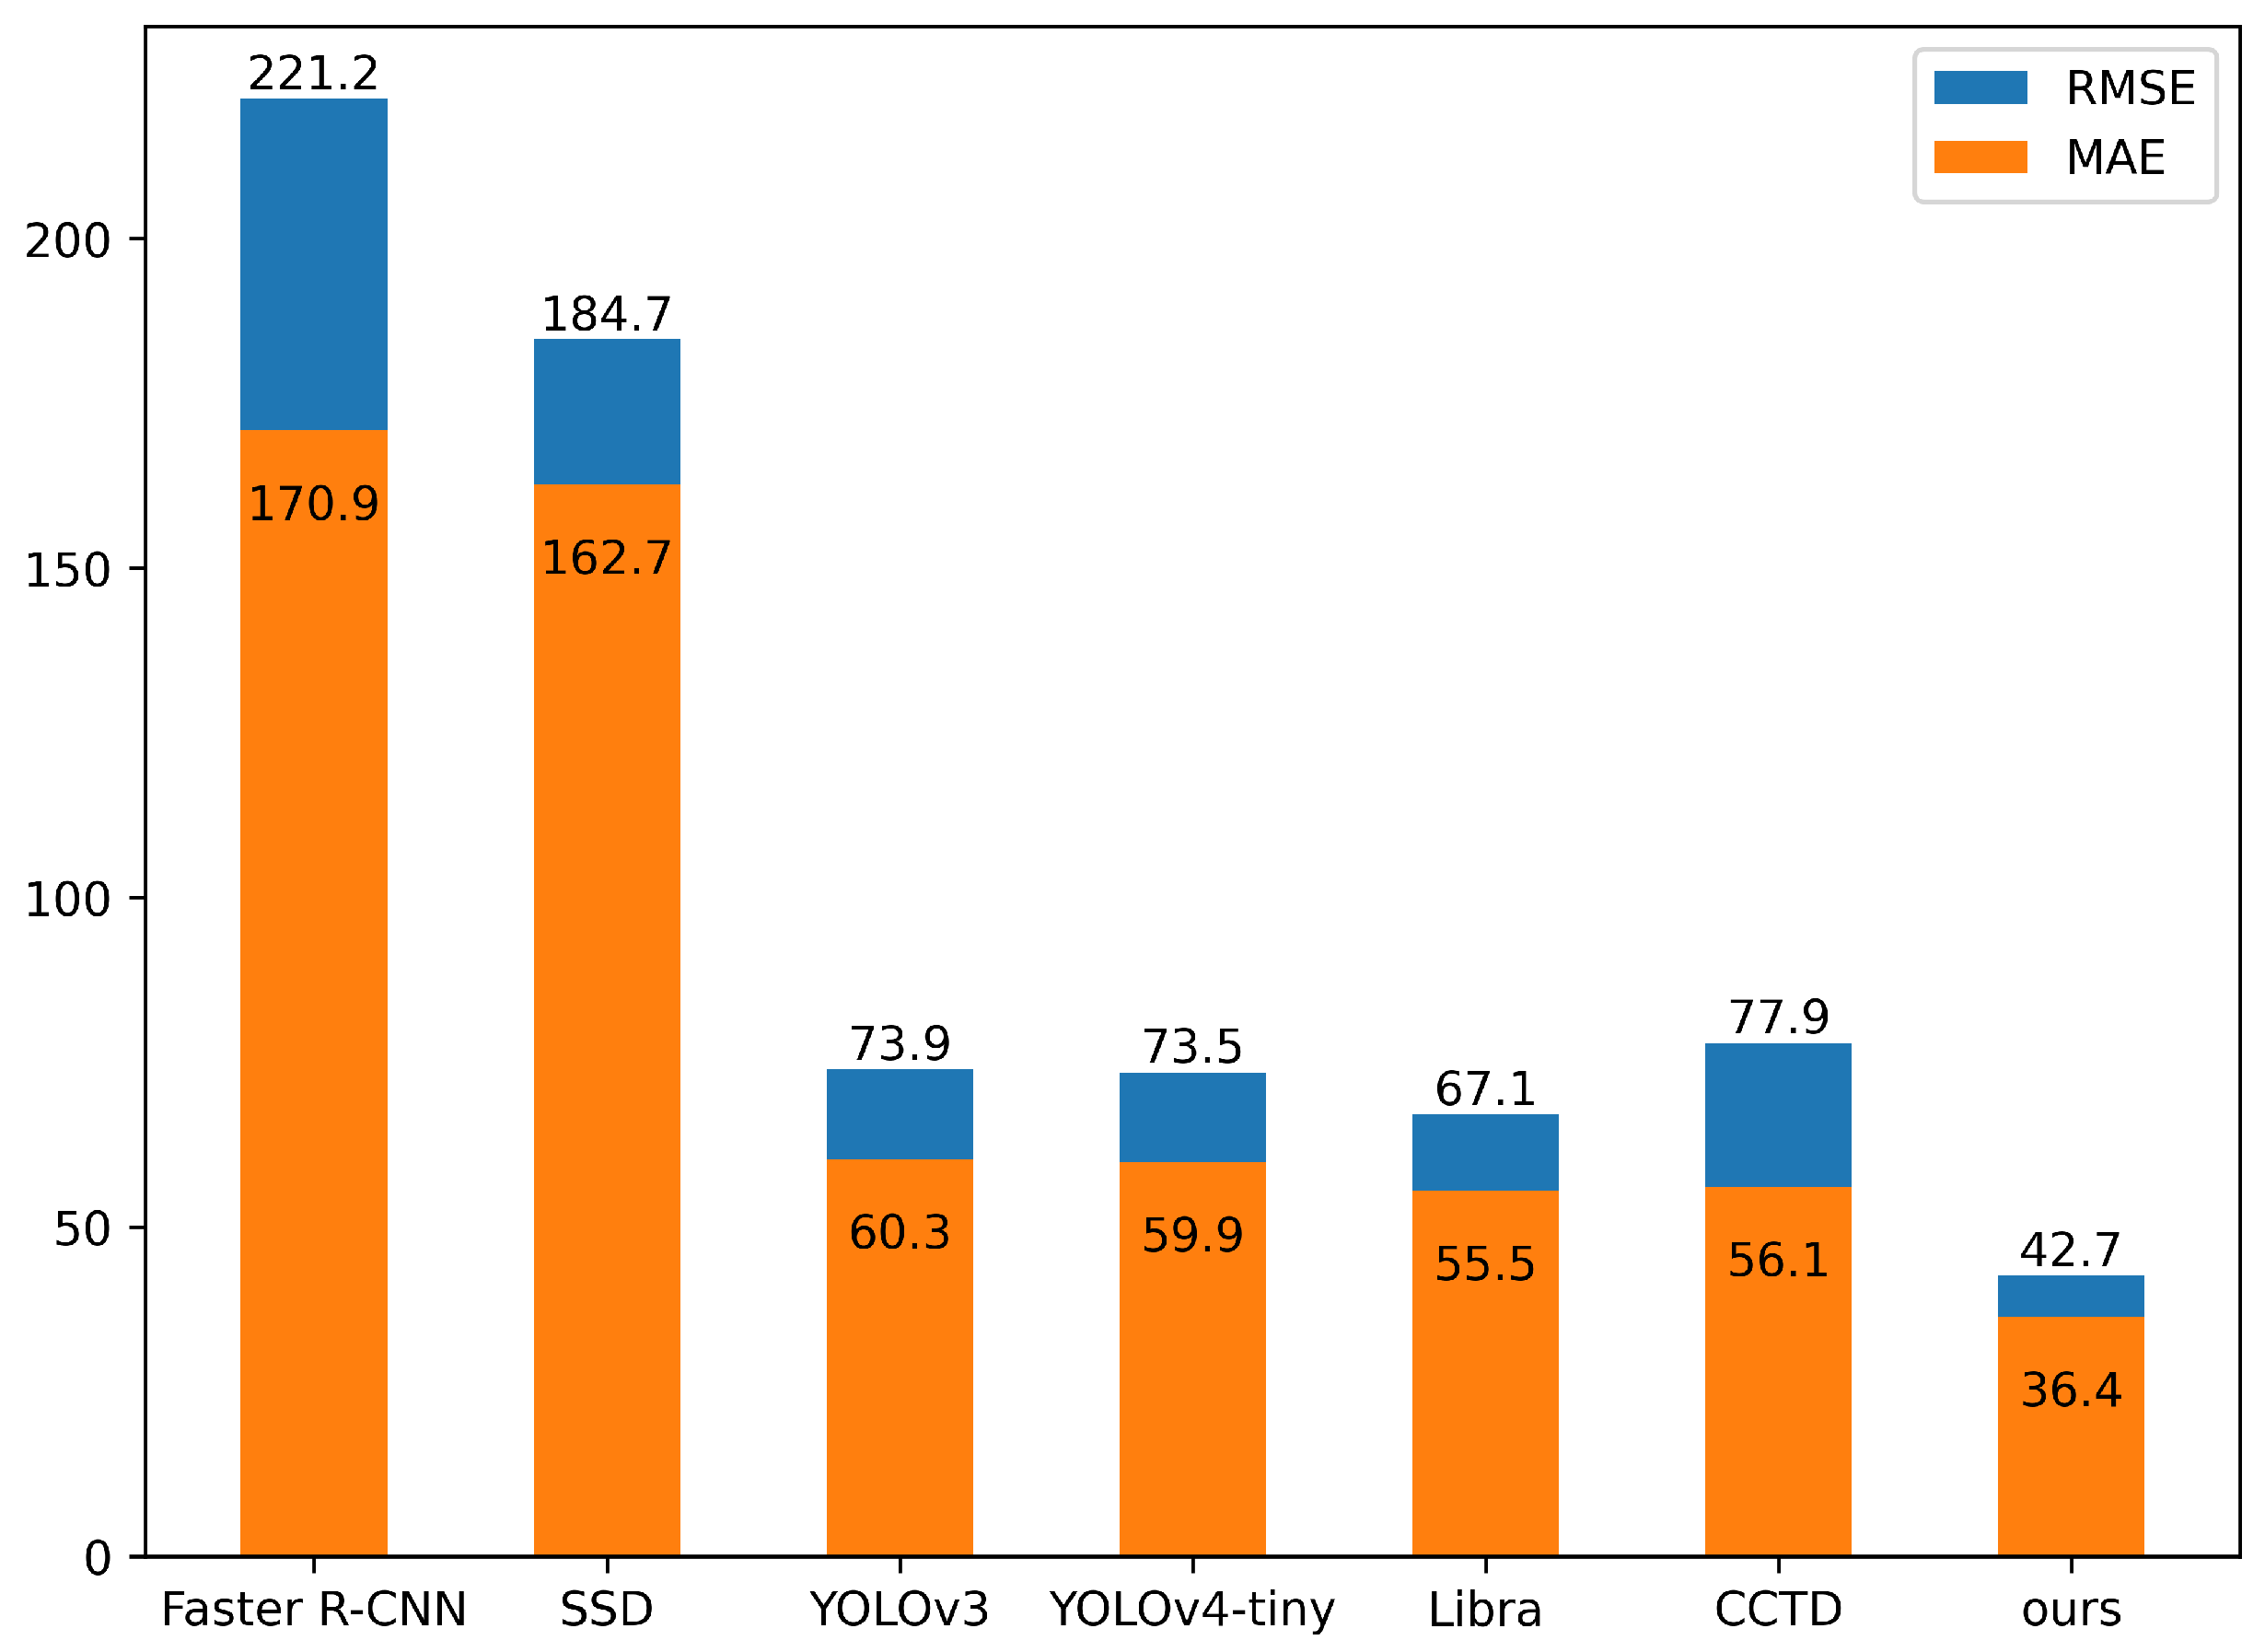
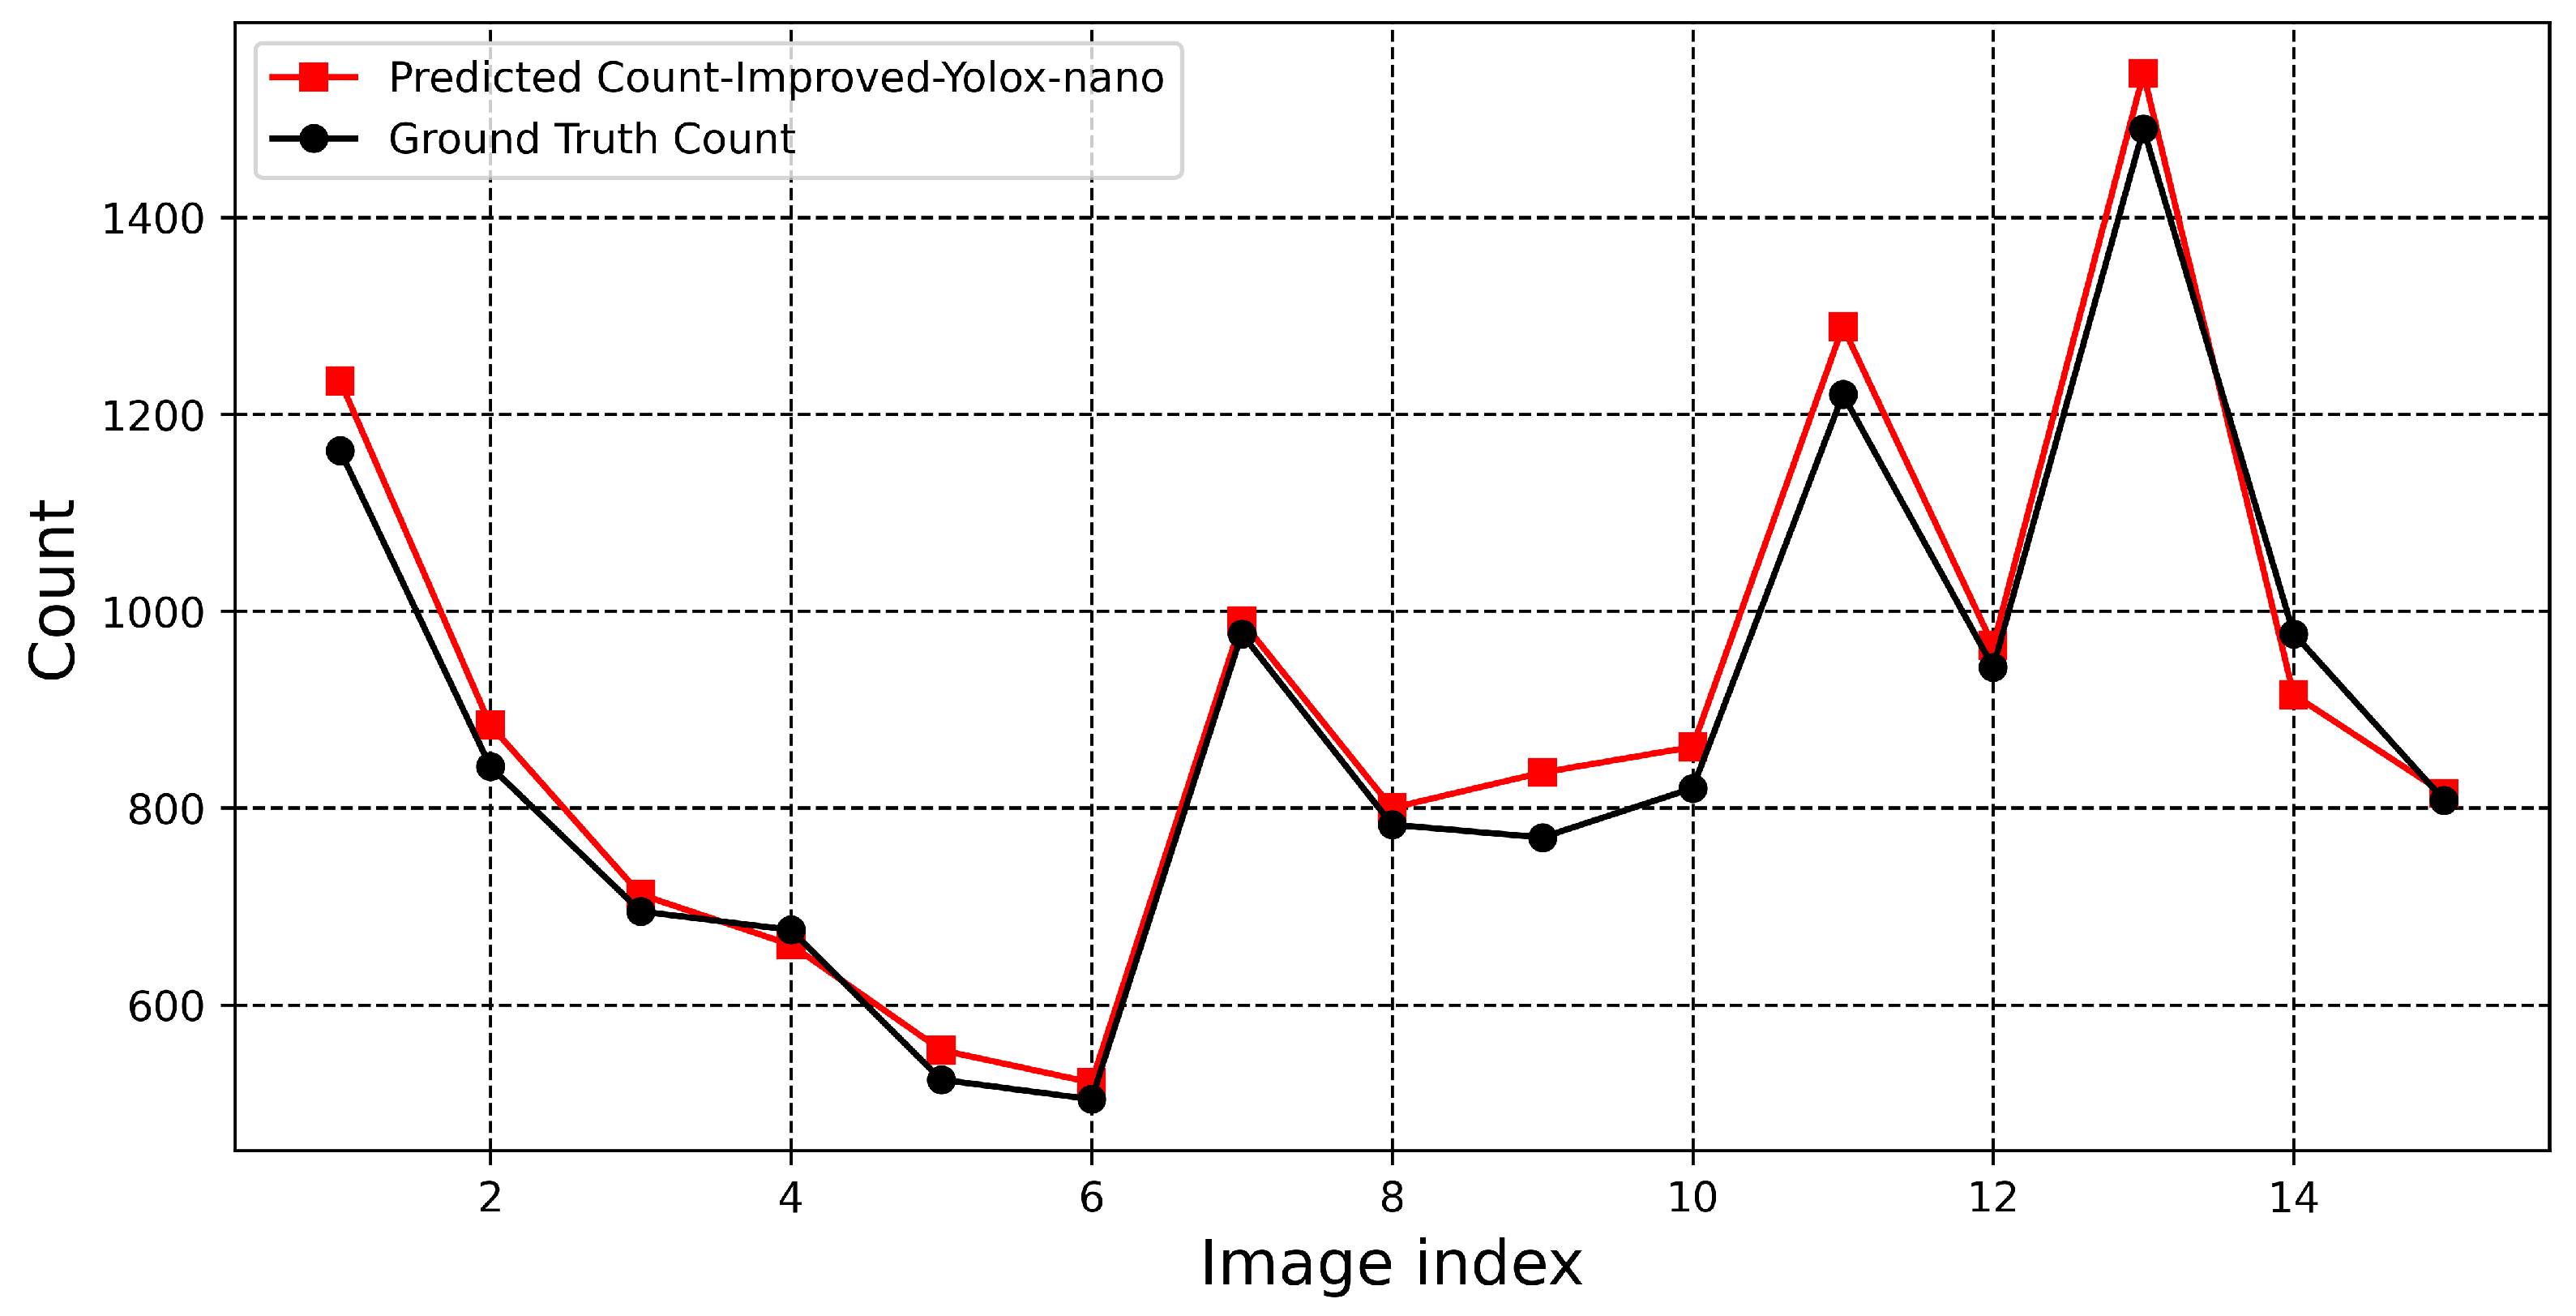
3.2.2. Counting Performance

We evaluated the detection of the number of pomelo trees for different state-of-the-art methods, choosing 15 images of pomelo orchards captured by a UAV as the dataset. Each image contained 504 to 1490 pomelo trees, in terrain types of flat plains and uneven mountains, with both dense and sparse distributions of pomelo trees. The comparison results are shown in Table 5. The M A E and R M S E of the proposed method were 36.4 and 42.7, respectively, significantly better compared with Faster R-CNN, SSD, YOLOv3, YOLOv4-tiny, CTDD, and Libra. In particular, the M A E and R M S E of the proposed method were significantly better than those of YOLOv3, with improvements of 39.6% and 42.2%, respectively. Therefore, the proposed method can better extract features of different scales, and can deal with multi-scale changing scenes as well as negative samples.
Figure 11 compares the M A E and R M S E counting results for different methods. The M A E and R M S E of Faster R-CNN were the highest, with 170.9 and 221.2, respectively. This result confirmed that Faster R-CNN performs poorly in two locations for detection. SSD’s M A E and R M S E were much higher than those of YOLOv3 and YOLOv4-tiny and only slightly lower than those of Faster R-CNN. This is because SSD lacks the feature pyramid structure, which prevents the method from extracting sufficient features to identify pomelo tree. The M A E and R M S E of YOLOv3, YOLOv4-tiny, Libra, and CCTD were similar, with M A E fluctuating between 55 and 60 and R M S E between 65 and 80. The M A E and R M S E of our proposed method were lower than those of other methods, with 36.4 and 42.7, which indicates its advantages in terms of computational accuracy and robustness.
Figure 12 illustrates the predicted counts of the proposed method and true counts of the 15 images, including the predicted counts obtained by the result of detection, and the ground truth counts. For almost all images, the proposed method predicted counts that were extremely near to ground-truth box counts for all images. The errors between the predicted counts and the true counts were from 7 to 71. In the UAV images with large errors, the orchards are complex and contain many additional plants, such as bushes. The number of false detections increased because they were mistakenly identified as pomelo trees. Even yet, the accuracy of prediction exceeded 95%, which indicates the proposed method produces a reasonable estimate of the number of pomelo trees. Note that most images in the test data set contain over 900 pomelo trees, and the counting results here are the correctly detected fruit trees.

3.3. Ablation Experiments

Through ablation experiments, we could analyze the impact of different components on the proposed method. We chose A P . 5 and A P .5:.95 as assessment indicators after testing the model’s performance with several modules. A P . 5 was the AP value when I o U was taken as 0.5. A P .5:.95 is the A P value when I o U increased from 50% to 95% in steps of 5%. A P . 5 could reflect the performance of model detection, and A P .5:.95 could reflect the robustness of model-detection performance. The experimental results in Table 6 show that our method (last row) significantly improved the detection effect compared with the original method.

3.3.1. Attention Mechanism

When we added a hybrid attention mechanism module at the end of the backbone feature extraction network, A P increased from 93.08% to 93.38%. Owing to the relatively simple backbone structure of the original lightweight network, it performed poorly when the background and target were not sufficiently distinguished. The hybrid attention mechanism module weights the pixels of the feature map with channel attention and spatial attention, which can improve the ability of feature extraction and effectively highlight pomelo tree regions over backgrounds.

3.3.2. Use of Cross-Layer Fusion Feature Pyramid

When we added the cross-layer fusion feature module, A P improved from 93.08% to 93.21%. This indicates that the CLFF module improves detection performance because it utilizes complementary characteristics between the extracted shallow detail information and deep semantic information.

3.3.3. Use of Ghost Module

When we used the Ghost module instead of traditional convolution for feature extraction, A P increased from 93.08% to 93.36% because the Ghost module can obtain a large number of redundant feature maps with a simple linear operation. In addition, the Ghost module could reduce the effect of feature geometry variation, reduce the parameters and computational complexity of the deep network, and extract more effective feature information. It is worth noting that when the Ghost, CBAM, and CLFF modules were combined, the A P improved from 93.08% to 93.74%, which indicates that the proposed method is more capable of feature extraction and has better detection performance than the original method.

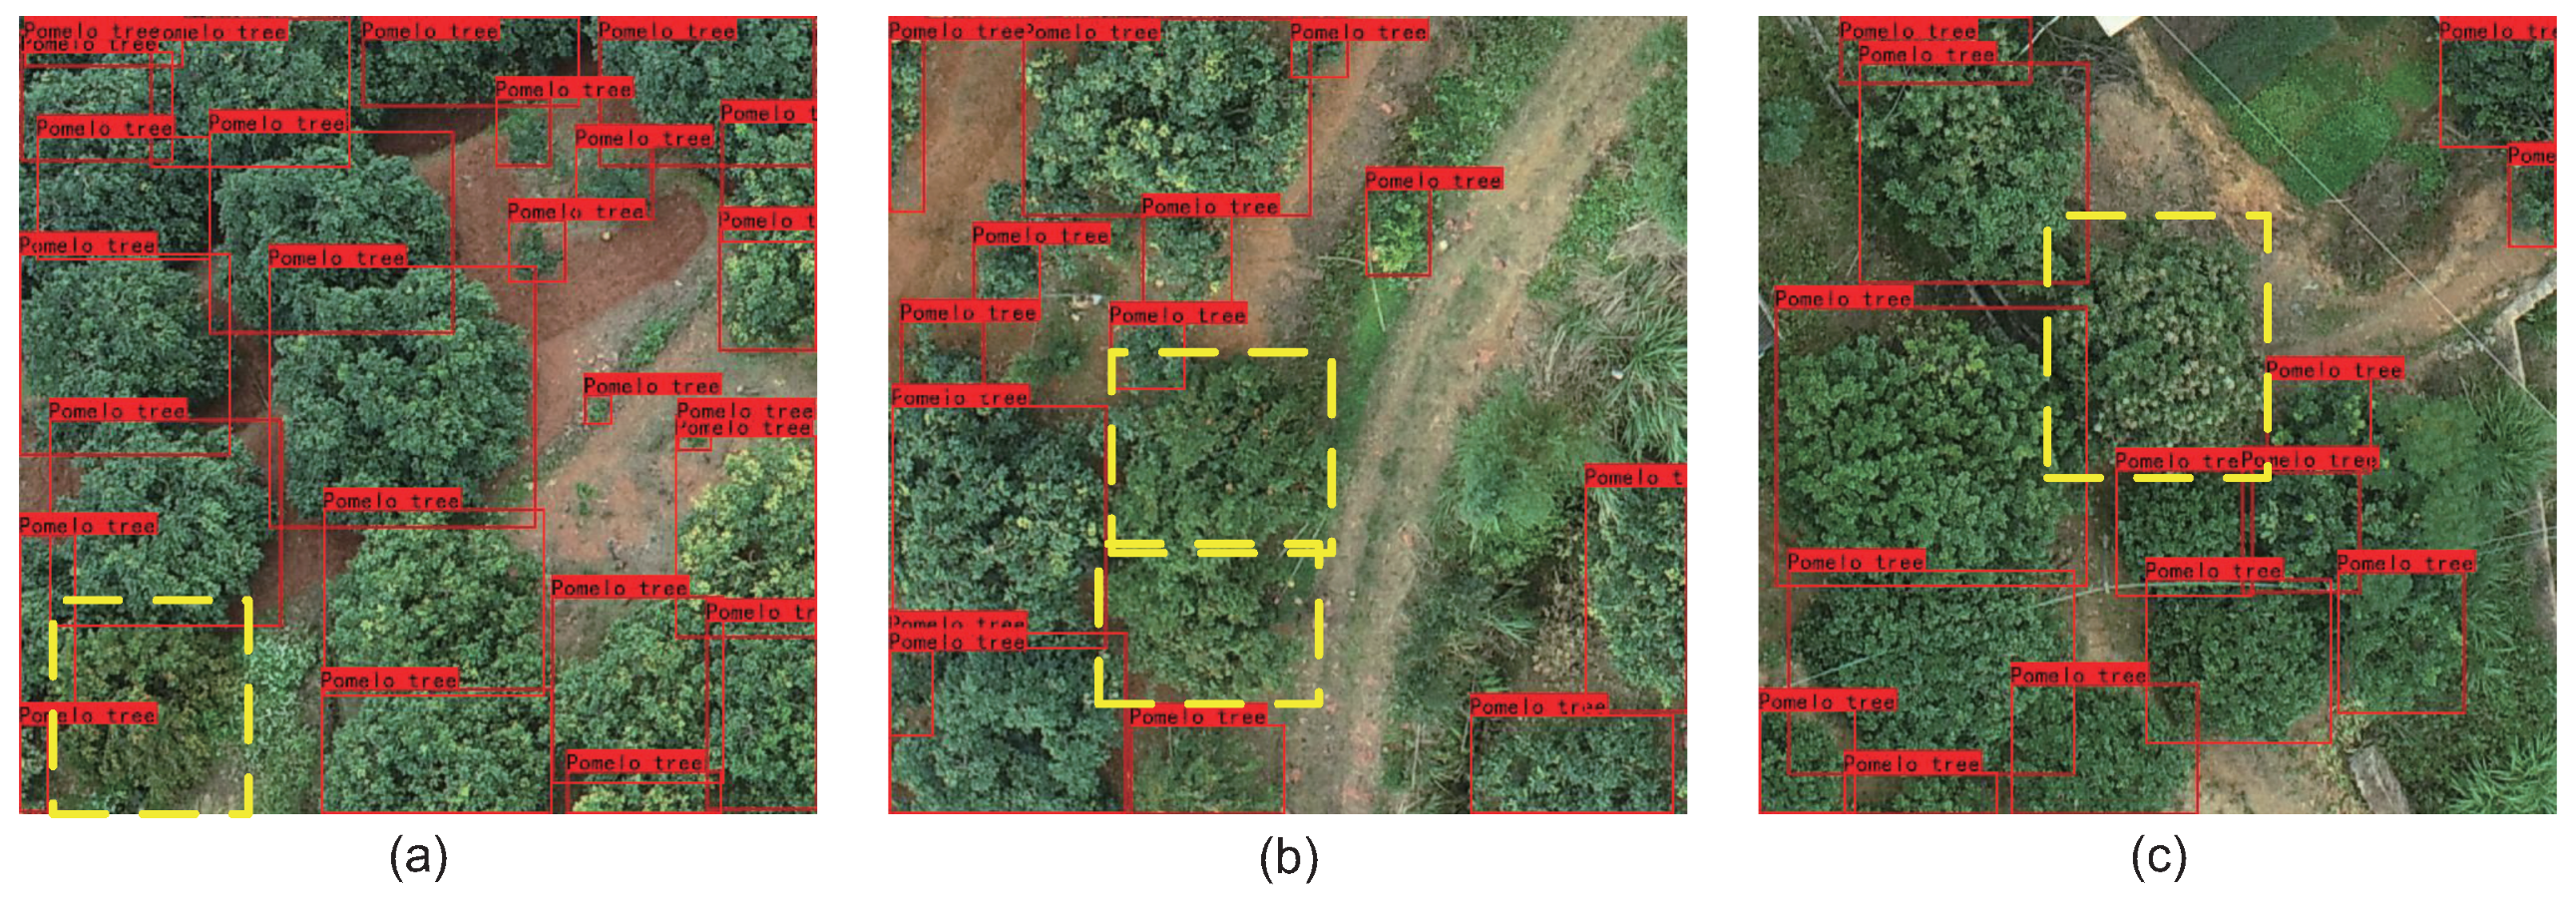
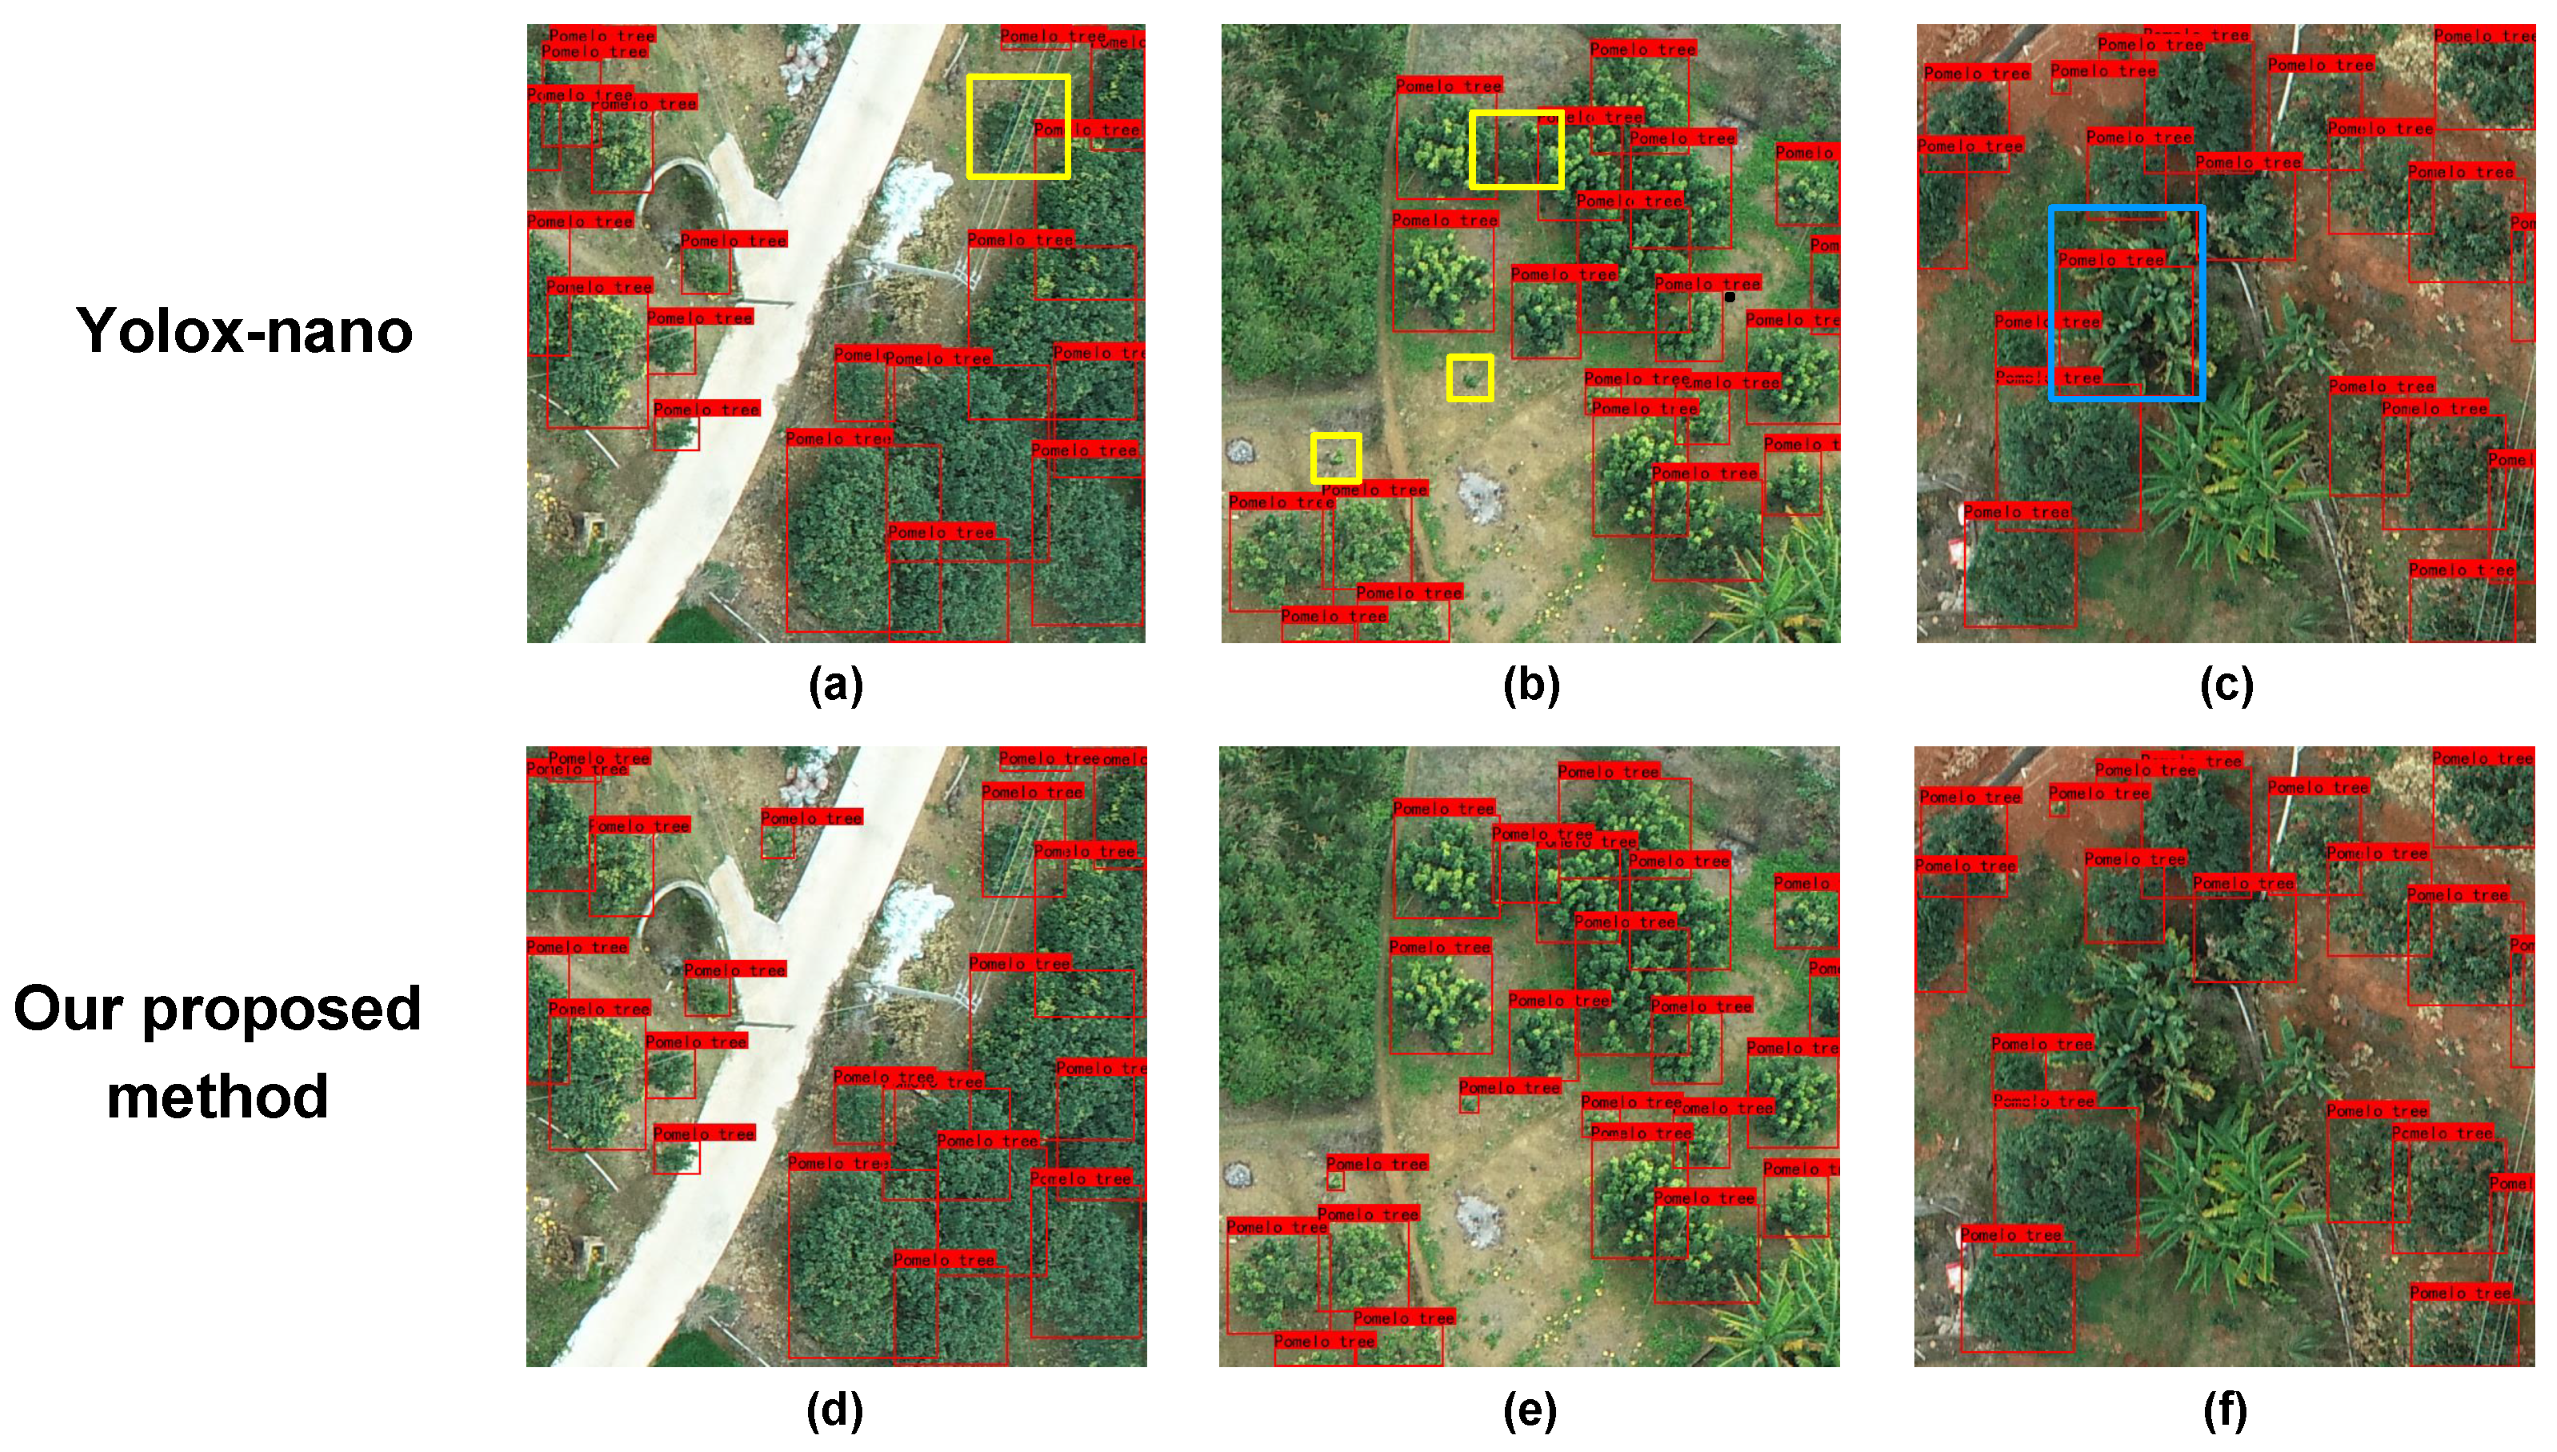
3.3.4. Visual Effect

Figure 13 compares the original YOLOx-nano and the proposed method. From Figure 13a,d, we can find that the pomelo trees partially obscured by wires are not recognized by the original method, while the proposed method successfully identifies them, which indicates our method’s better robustness against and recognition of obscured objects.
According to Figure 13b,e, the young pomelo trees had small canopies that the original method could not recognize. In addition, the original method ignored two closely adjacent pomelo trees, treating them as negative samples with no obvious boundary. In contrast, the proposed method could accurately identify small objects and pomelo trees with inconspicuous edges. The original method expands the perceptual field under the layer-by-layer convolution, which ignores some small pomelo trees. The proposed method adds an attention mechanism and a cross-layer feature-fusion mechanism, making it more capable of identifying small targets and targets with unclear edges.
According to Figure 13c,d, the original method incorrectly identified a banana tree as a pomelo tree, while the proposed method avoided this error. This is because the original method has fewer parameters in the backbone feature extraction network, and the extracted features are insufficient. The proposed method adds an attention mechanism, improving feature fusion and making the scale of feature differentiation between positive and negative samples more obvious.

4. Discussion

We proposed a pomelo tree-detection method for UAV remote-sensing images. We introduced a hybrid attention mechanism module to improve the ability of feature extraction and effectively highlight pomelo tree regions over backgrounds. We designed a feature-fusion module to fuse feature maps of the same scale but different levels, without greatly increasing computation. We replaced the convolution module with a Ghost module to improve model detection. The proposed method reduces model parameters while extracting more effective feature information. Compared with some state-of-the-art target-detection algorithms, our method experimentally showed better detection performance and fewer parameters, so it is better suited for pomelo tree detection in UAV images.
In our future work, we will research how to use domain adaption to detect pomelo trees according to a different time and space, and extend our proposed method to different types of trees in orchards.

Author Contributions

Conceptualization, H.Y. and K.H.; Data curation, H.Y., K.H. and Y.X.; Formal analysis, H.Y., K.H., Y.X. and J.D.; Funding acquisition, K.H., J.D. and Z.Y.; Investigation, H.Y., K.H., C.R., Y.X. and J.D.; Methodology, H.Y., K.H. and C.R.; Project administration, K.H. and Z.Y.; Resources, H.Y., K.H. and Y.X.; Software, H.Y. and K.H.; Supervision, K.H., C.R., J.D. and Z.Y.; Validation, H.Y., K.H., C.R., J.D. and Z.Y.; Visualization, H.Y., K.H. and J.D.; Writing—original draft, H.Y. and K.H.; Writing—review & editing, H.Y., K.H., C.R., Y.X., J.D. and Z.Y. All authors have read and agreed to the published version of the manuscript.

Funding

This work is supported by the National Natural Science Foundation of China under Grants 61976104, 61906046, and 61976229, the Natural Science Foundation of Guangdong Province under Grant 2020A1515010702, the Guangdong Province Special Project in Key Fields for Universities under Grant 2020ZDZX3044, the Open Research Projects of Zhejiang Lab under Grant 2021KH0AB08 and the Science and Technology Program of Guangdong Province under Grant 2020B121201013: Guangdong Provincial Key Laboratory of Conservation and Precision Utilization of Characteristic Agricultural Resources in Mountainous Areas.

Data Availability Statement

The data presented in this study are available on request from the corresponding author.

Conflicts of Interest

The authors declare no conflict of interest.

Abbreviations

The following abbreviations are used in this manuscript:
ACCAccuracy
BiFPNBidirectional Feature Pyramid Network
CBMAConvolutional Block Attention Module
CBSConvolution, Batch normalization and SiLU activation
C I o U Complete-IoU
CLFFCross-Layer Feature Fusion
CNNsConvolutional Neural Networks
CSPCross-Stage Partial
I O U Intersection Over Union
FPNFeature Pyramid Network
MAEMean Error
PANetPath Aggregation Network
RMSERoot Mean Square Error
RPNRegion Proposal Network
R 2 Correlation Coefficient
SGDStochastic Gradient Descent
SiLUSigmoid Weighted Liner Unit
SPPSpatial Pyramid Pooling
UAVsUnmanned Aerial Vehicles

References

  1. Morton, J.F. Fruits of Warm Climates; JF Morton: Miami, FL, USA, 1987. [Google Scholar]
  2. Jiménez-Brenes, F.M.; López-Granados, F.; De Castro, A.; Torres-Sánchez, J.; Serrano, N.; Peña, J. Quantifying pruning impacts on olive tree architecture and annual canopy growth by using UAV-based 3D modelling. Plant Methods 2017, 13, 55. [Google Scholar] [CrossRef] [PubMed]
  3. Castillo-Ruiz, F.J.; Jimenez-Jimenez, F.; Blanco-Roldán, G.L.; Sola-Guirado, R.R.; Agueera-Vega, J.; Castro-Garcia, S. Analysis of fruit and oil quantity and quality distribution in high-density olive trees in order to improve the mechanical harvesting process. Span. J. Agric. Res. 2015, 13, e0209. [Google Scholar] [CrossRef]
  4. Garcia-Ruiz, F.; Sankaran, S.; Maja, J.M.; Lee, W.S.; Rasmussen, J.; Ehsani, R. Comparison of two aerial imaging platforms for identification of Huanglongbing-infected citrus trees. Comput. Electron. Agric. 2013, 91, 106–115. [Google Scholar] [CrossRef]
  5. Zhang, C.; Valente, J.; Kooistra, L.; Guo, L.; Wang, W. Orchard management with small unmanned aerial vehicles: A survey of sensing and analysis approaches. Precis. Agric. 2021, 22, 2007–2052. [Google Scholar] [CrossRef]
  6. Barbagallo, S.; Consoli, S.; Russo, A. A one-layer satellite surface energy balance for estimating evapotranspiration rates and crop water stress indexes. Sensors 2009, 9, 1–21. [Google Scholar] [CrossRef] [PubMed]
  7. Salgadoe, A.S.A.; Robson, A.J.; Lamb, D.W.; Dann, E.K.; Searle, C. Quantifying the severity of phytophthora root rot disease in avocado trees using image analysis. Remote Sens. 2018, 10, 226. [Google Scholar] [CrossRef]
  8. Moran, M.S.; Inoue, Y.; Barnes, E. Opportunities and limitations for image-based remote sensing in precision crop management. Remote Sens. Environ. 1997, 61, 319–346. [Google Scholar] [CrossRef]
  9. Wal, T.; Abma, B.; Viguria, A.; Prévinaire, E.; Zarco-Tejada, P.J.; Serruys, P.; Valkengoed, E.V.; Voet, P. Fieldcopter: Unmanned aerial systems for crop monitoring services. In Precision Agriculture ’13; Wageningen Academic Publishers: Wageningen, The Netherlands, 2013; pp. 169–175. [Google Scholar]
  10. Ochoa, K.S.; Guo, Z. A framework for the management of agricultural resources with automated aerial imagery detection. Comput. Electron. Agric. 2019, 162, 53–69. [Google Scholar] [CrossRef]
  11. Swetnam, T.L.; Falk, D.A. Application of metabolic scaling theory to reduce error in local maxima tree segmentation from aerial LiDAR. For. Ecol. Manag. 2014, 323, 158–167. [Google Scholar] [CrossRef]
  12. Yang, J.; He, Y.; Caspersen, J.P.; Jones, T.A. Delineating individual tree crowns in an uneven-aged, mixed broadleaf forest using multispectral watershed segmentation and multiscale fitting. IEEE J. Sel. Top. Appl. Earth Obs. Remote Sens. 2016, 10, 1390–1401. [Google Scholar] [CrossRef]
  13. Jing, L.; Hu, B.; Noland, T.; Li, J. An individual tree crown delineation method based on multi-scale segmentation of imagery. ISPRS J. Photogramm. Remote Sens. 2012, 70, 88–98. [Google Scholar] [CrossRef]
  14. Srestasathiern, P.; Rakwatin, P. Oil palm tree detection with high resolution multi-spectral satellite imagery. Remote Sens. 2014, 6, 9749–9774. [Google Scholar] [CrossRef]
  15. Dos Santos, A.M.; Mitja, D.; Delaître, E.; Demagistri, L.; de Souza Miranda, I.; Libourel, T.; Petit, M. Estimating babassu palm density using automatic palm tree detection with very high spatial resolution satellite images. J. Environ. Manag. 2017, 193, 40–51. [Google Scholar] [CrossRef] [PubMed]
  16. Pu, R.; Landry, S. A comparative analysis of high spatial resolution IKONOS and WorldView-2 imagery for mapping urban tree species. Remote Sens. Environ. 2012, 124, 516–533. [Google Scholar] [CrossRef]
  17. Hung, C.; Bryson, M.; Sukkarieh, S. Multi-class predictive template for tree crown detection. ISPRS J. Photogramm. Remote Sens. 2012, 68, 170–183. [Google Scholar] [CrossRef]
  18. Dalponte, M.; Ørka, H.O.; Ene, L.T.; Gobakken, T.; Næsset, E. Tree crown delineation and tree species classification in boreal forests using hyperspectral and ALS data. Remote Sens. Environ. 2014, 140, 306–317. [Google Scholar] [CrossRef]
  19. López-López, M.; Calderón, R.; González-Dugo, V.; Zarco-Tejada, P.J.; Fereres, E. Early detection and quantification of almond red leaf blotch using high-resolution hyperspectral and thermal imagery. Remote Sens. 2016, 8, 276. [Google Scholar] [CrossRef]
  20. Nevalainen, O.; Honkavaara, E.; Tuominen, S.; Viljanen, N.; Hakala, T.; Yu, X.; Hyyppä, J.; Saari, H.; Pölönen, I.; Imai, N.N.; et al. Individual tree detection and classification with UAV-based photogrammetric point clouds and hyperspectral imaging. Remote Sens. 2017, 9, 185. [Google Scholar] [CrossRef]
  21. Wang, Y.; Zhu, X.; Wu, B. Automatic detection of individual oil palm trees from UAV images using HOG features and an SVM classifier. Int. J. Remote Sens. 2019, 40, 7356–7370. [Google Scholar] [CrossRef]
  22. Huang, K.K.; Ren, C.X.; Liu, H.; Lai, Z.R.; Yu, Y.F.; Dai, D.Q. Hyperspectral image classification via discriminant Gabor ensemble filter. IEEE Trans. Cybern. 2021, 52, 8352–8365. [Google Scholar] [CrossRef] [PubMed]
  23. Albetis, J.; Duthoit, S.; Guttler, F.; Jacquin, A.; Goulard, M.; Poilvé, H.; Féret, J.B.; Dedieu, G. Detection of Flavescence dorée grapevine disease using unmanned aerial vehicle (UAV) multispectral imagery. Remote Sens. 2017, 9, 308. [Google Scholar] [CrossRef]
  24. Lei, S.; Luo, J.; Tao, X.; Qiu, Z. Remote Sensing Detecting of Yellow Leaf Disease of Arecanut Based on UAV Multisource Sensors. Remote Sens. 2021, 13, 4562. [Google Scholar] [CrossRef]
  25. Zhang, Y.; Wa, S.; Liu, Y.; Zhou, X.; Sun, P.; Ma, Q. High-Accuracy Detection of Maize Leaf Diseases CNN Based on Multi-Pathway Activation Function Module. Remote Sens. 2021, 13, 4218. [Google Scholar] [CrossRef]
  26. Nofrizal, A.Y.; Sonobe, R.; Yamashita, H.; Seki, H.; Mihara, H.; Morita, A.; Ikka, T. Evaluation of a One-Dimensional Convolution Neural Network for Chlorophyll Content Estimation Using a Compact Spectrometer. Remote Sens. 2022, 14, 1997. [Google Scholar] [CrossRef]
  27. Milioto, A.; Lottes, P.; Stachniss, C. Real-time semantic segmentation of crop and weed for precision agriculture robots leveraging background knowledge in CNNs. In Proceedings of the 2018 IEEE International Conference on Robotics and Automation (ICRA), Brisbane, Australia, 21–25 May 2018; pp. 2229–2235. [Google Scholar]
  28. Potena, C.; Nardi, D.; Pretto, A. Fast and accurate crop and weed identification with summarized train sets for precision agriculture. In Proceedings of the International Conference on Intelligent Autonomous Systems, Shanghai, China, 3–7 July 2016; pp. 105–121. [Google Scholar]
  29. Milella, A.; Marani, R.; Petitti, A.; Reina, G. In-field high throughput grapevine phenotyping with a consumer-grade depth camera. Comput. Electron. Agric. 2019, 156, 293–306. [Google Scholar] [CrossRef]
  30. Qi, X.; Dong, J.; Lan, Y.; Zhu, H. Method for Identifying Litchi Picking Position Based on YOLOv5 and PSPNet. Remote Sens. 2022, 14, 2004. [Google Scholar] [CrossRef]
  31. Huang, B.; Zhao, B.; Song, Y. Urban land-use mapping using a deep convolutional neural network with high spatial resolution multispectral remote-sensing imagery. Remote Sens. Environ. 2018, 214, 73–86. [Google Scholar] [CrossRef]
  32. Huang, K.K.; Ren, C.X.; Liu, H.; Lai, Z.R.; Yu, Y.F.; Dai, D.Q. Hyperspectral image classification via discriminative convolutional neural network with an improved triplet loss. Pattern Recognit. 2021, 112, 107744. [Google Scholar] [CrossRef]
  33. Li, W.; Fu, H.; Yu, L.; Cracknell, A. Deep learning based oil palm tree detection and counting for high-resolution remote-sensing images. Remote Sens. 2016, 9, 22. [Google Scholar] [CrossRef]
  34. Pibre, L.; Chaumon, M.; Subsol, G.; Lenco, D.; Derras, M. How to deal with multi-source data for tree detection based on deep learning. In Proceedings of the 2017 IEEE Global Conference on Signal and Information Processing (GlobalSIP), Montreal, QC, Canada, 14–16 November 2017; pp. 1150–1154. [Google Scholar]
  35. Wu, J.; Yang, G.; Yang, H.; Zhu, Y.; Li, Z.; Lei, L.; Zhao, C. Extracting apple tree crown information from remote imagery using deep learning. Comput. Electron. Agric. 2020, 174, 105504. [Google Scholar] [CrossRef]
  36. Zheng, J.; Fu, H.; Li, W.; Wu, W.; Yu, L.; Yuan, S.; Tao, W.Y.W.; Pang, T.K.; Kanniah, K.D. Growing status observation for oil palm trees using Unmanned Aerial Vehicle (UAV) images. ISPRS J. Photogramm. Remote Sens. 2021, 173, 95–121. [Google Scholar] [CrossRef]
  37. Ren, S.; He, K.; Girshick, R.; Sun, J. Faster r-cnn: Towards real-time object detection with region proposal networks. Adv. Neural Inf. Process. Syst. 2015, 28, 91–99. [Google Scholar] [CrossRef] [PubMed]
  38. Osco, L.P.; De Arruda, M.d.S.; Junior, J.M.; Da Silva, N.B.; Ramos, A.P.M.; Moryia, É.A.S.; Imai, N.N.; Pereira, D.R.; Creste, J.E.; Matsubara, E.T.; et al. A convolutional neural network approach for counting and geolocating citrus-trees in UAV multispectral imagery. ISPRS J. Photogramm. Remote Sens. 2020, 160, 97–106. [Google Scholar] [CrossRef]
  39. Zheng, J.; Wu, W.; Yu, L.; Fu, H. Coconut Trees Detection on the Tenarunga Using High-Resolution Satellite Images and Deep Learning. In Proceedings of the 2021 IEEE International Geoscience and Remote Sensing Symposium IGARSS, Brussels, Belgium, 11–16 July 2021; pp. 6512–6515. [Google Scholar]
  40. Zheng, J.; Wu, W.; Yuan, S.; Fu, H.; Li, W.; Yu, L. Multisource-domain generalization-based oil palm tree detection using very-high-resolution (vhr) satellite images. IEEE Geosci. Remote Sens. Lett. 2021, 19, 1–5. [Google Scholar] [CrossRef]
  41. Zheng, J.; Fu, H.; Li, W.; Wu, W.; Zhao, Y.; Dong, R.; Yu, L. Cross-regional oil palm tree counting and detection via a multi-level attention domain adaptation network. ISPRS J. Photogramm. Remote Sens. 2020, 167, 154–177. [Google Scholar] [CrossRef]
  42. Pang, J.; Chen, K.; Shi, J.; Feng, H.; Ouyang, W.; Lin, D. Libra r-cnn: Towards balanced learning for object detection. In Proceedings of the IEEE/CVF Conference on Computer Vision and Pattern Recognition, Long Beach, CA, USA, 15–20 June 2019; pp. 821–830. [Google Scholar]
  43. Liu, W.; Anguelov, D.; Erhan, D.; Szegedy, C.; Reed, S.; Fu, C.Y.; Berg, A.C. Ssd: Single shot multibox detector. In Proceedings of the European Conference on Computer Vision, Amsterdam, The Netherlands, 11–14 October 2016; pp. 21–37. [Google Scholar]
  44. Redmon, J.; Divvala, S.; Girshick, R.; Farhadi, A. You only look once: Unified, real-time object detection. In Proceedings of the IEEE Conference on Computer Vision and Pattern Recognition, Las Vegas, NV, USA, 27–30 June 2016; pp. 779–788. [Google Scholar]
  45. Redmon, J.; Farhadi, A. Yolov3: An incremental improvement. arXiv 2018, arXiv:1804.02767. [Google Scholar]
  46. Wang, C.Y.; Bochkovskiy, A.; Liao, H.Y.M. Scaled-yolov4: Scaling cross stage partial network. In Proceedings of the IEEE/CVF Conference on Computer Vision and Pattern Recognition, Nashville, TN, USA, 20–25 June 2021; pp. 13029–13038. [Google Scholar]
  47. Ge, Z.; Liu, S.; Wang, F.; Li, Z.; Sun, J. Yolox: Exceeding yolo series in 2021. arXiv 2021, arXiv:2107.08430. [Google Scholar]
  48. Liu, R.; Tao, F.; Liu, X.; Na, J.; Leng, H.; Wu, J.; Zhou, T. RAANet: A Residual ASPP with Attention Framework for Semantic Segmentation of High-Resolution Remote Sensing Images. Remote Sens. 2022, 14, 3109. [Google Scholar] [CrossRef]
  49. Han, Z.; Hu, W.; Peng, S.; Lin, H.; Zhang, J.; Zhou, J.; Wang, P.; Dian, Y. Detection of Standing Dead Trees after Pine Wilt Disease Outbreak with Airborne Remote Sensing Imagery by Multi-Scale Spatial Attention Deep Learning and Gaussian Kernel Approach. Remote Sens. 2022, 14, 3075. [Google Scholar] [CrossRef]
  50. Gong, H.; Mu, T.; Li, Q.; Dai, H.; Li, C.; He, Z.; Wang, W.; Han, F.; Tuniyazi, A.; Li, H.; et al. Swin-Transformer-Enabled YOLOv5 with Attention Mechanism for Small Object Detection on Satellite Images. Remote Sens. 2022, 14, 2861. [Google Scholar] [CrossRef]
  51. Li, X.; Pan, J.; Xie, F.; Zeng, J.; Li, Q.; Huang, X.; Liu, D.; Wang, X. Fast and accurate green pepper detection in complex backgrounds via an improved Yolov4-tiny model. Comput. Electron. Agric. 2021, 191, 106503. [Google Scholar] [CrossRef]
  52. Yu, J.; Wu, T.; Zhou, S.; Pan, H.; Zhang, X.; Zhang, W. An SAR Ship Object Detection Algorithm Based on Feature Information Efficient Representation Network. Remote Sens. 2022, 14, 3489. [Google Scholar] [CrossRef]
  53. Cheng, G.; Yang, C.; Yao, X.; Guo, L.; Han, J. When deep learning meets metric learning: Remote-sensing image scene classification via learning discriminative CNNs. IEEE Trans. Geosci. Remote Sens. 2018, 56, 2811–2821. [Google Scholar] [CrossRef]
  54. Han, K.; Wang, Y.; Tian, Q.; Guo, J.; Xu, C.; Xu, C. Ghostnet: More features from cheap operations. In Proceedings of the IEEE/CVF Conference on Computer Vision and Pattern Recognition, Seattle, WA, USA, 14–19 June 2020; pp. 1580–1589. [Google Scholar]
  55. Woo, S.; Park, J.; Lee, J.Y.; Kweon, I.S. Cbam: Convolutional block attention module. In Proceedings of the European Conference on Computer Vision (ECCV), Munich, Germany, 8–14 September 2018; pp. 3–19. [Google Scholar]
  56. Li, M.; Zhai, Y.M.; Luo, Y.W.; Ge, P.F.; Ren, C.X. Enhanced transport distance for unsupervised domain adaptation. In Proceedings of the IEEE/CVF Conference on Computer Vision and Pattern Recognition, Seattle, WA, USA, 14–19 June 2020; pp. 13936–13944. [Google Scholar]
  57. Liu, J.J.; Hou, Q.; Cheng, M.M.; Feng, J.; Jiang, J. A simple pooling-based design for real-time salient object detection. In Proceedings of the IEEE/CVF Conference on Computer Vision and Pattern Recognition, Long Beach, CA, USA, 15–20 June 2019; pp. 3917–3926. [Google Scholar]
  58. Tan, M.; Pang, R.; Le, Q.V. Efficientdet: Scalable and efficient object detection. In Proceedings of the IEEE/CVF Conference on Computer Vision and Pattern Recognition, Seattle, WA, USA, 14–19 June 2020; pp. 10781–10790. [Google Scholar]
  59. Zamboni, P.; Junior, J.M.; Silva, J.d.A.; Miyoshi, G.T.; Matsubara, E.T.; Nogueira, K.; Gonçalves, W.N. Benchmarking Anchor-Based and Anchor-Free State-of-the-Art Deep Learning Methods for Individual Tree Detection in RGB High-Resolution Images. Remote Sens. 2021, 13, 2482. [Google Scholar] [CrossRef]
Figure 1. Aerial image of pomelo orchard. Image B is the original image from the vertical overhead shot of the UAV. Images A1 and A2 contain dense and sparse pomelos, respectively; images C1–C3 contain pomelo trees in the adult, middle-aged, and young-growth stages, respectively; image D contains other trees in the orchard.
Remotesensing 14 03902 g001
Figure 2. Samples of dataset 1 (ac) and dataset 2 (df). The pomelo trees in dataset 1 are planted on a plain, under uniform lighting. The pomelo trees in dataset 2 were planted on hillsides with uneven distribution, under drastic lighting variation.
Remotesensing 14 03902 g002
Figure 3. Proposed network structure. Backbone: Focus, CBS (convolution, batch normalization, and sigmoid weighted liner unit (SiLU) activation), Ghost, and cross-stage partial (CSP) module downsample input image and convolve data. Spatial pyramid pooling (SPP) module is embedded in last Ghost and CSP module, including three maxpooling layers and concat mode. End of backbone: convolutional block attention module (CBAM) adds weight for target information. Neck section: bidirectional feature pyramid network (BiFPN) and CLFF module transfer feature information. Three convolution sets predict class label and object location.
Remotesensing 14 03902 g003
Figure 4. Hybrid attention mechanism. Maximum and average pooling are applied for the feature map to obtain channel attention as well as spatial attention.
Remotesensing 14 03902 g004
Figure 5. Neck structure and CLFF module. On the neck section, we delete low-utilization nodes and connect nodes with different layers. On CLFF, we generate the mask using the feature map of the bottom-up feature pyramid, and multiply the mask with the shallow and deep-feature maps. The two or three feature maps are fused by addition.
Remotesensing 14 03902 g005
Figure 6. Ghost module. Convolution module generates intrinsic feature maps with small channels. Linear operation expands features and increases number of channels.
Remotesensing 14 03902 g006
Figure 8. Decoupled head structure. For each level of neck output feature, we first adopt a 1 × 1 convolution layer to reduce the feature channel to 256 and then add two parallel branches with two 3 × 3 convolution layers each for classification and regression tasks, respectively. Obj branch is added on the regression branch.
Remotesensing 14 03902 g008
Figure 9. Detection effects of different methods (yellow box: missed detection; blue box: error detection). It can be seen that Faster R-CNN and SSD without feature pyramids had a large number of missed detections. YOLO series with feature pyramids had a small number of missed detections. Libra and CCTD could not detect tiny targets. The proposed method had no missed detection.
Remotesensing 14 03902 g009
Figure 10. The ability of the proposed method to distinguish different citrus trees (yellow box: other citrus fruit tree). In (a,b) the proposed method distinguishes orange trees well. In (c), the method can accurately distinguish other trees with slightly different leaf colors. It can be seen that proposed method had a good ability to distinguish similar targets.
Remotesensing 14 03902 g010
Figure 11. Comparison of M A E and R M S E counting results for different methods. The proposed method has the lowest M A E and R M S E .
Remotesensing 14 03902 g011
Figure 12. Predicted counts of proposed method and true counts of 15 images.
Remotesensing 14 03902 g012
Figure 13. Comparison of the detection effect between the original and proposed methods (yellow box: missed detection; blue box: error detection): (a) the original method missed a pomelo tree obscured by power lines; (b) the original method missed pomelo trees with small canopies and inconspicuous canopy boundaries; (c) the original method incorrectly treated banana trees as pomelo trees; (df) the proposed method avoids all the above errors to accurately identify all pomelo trees.
Remotesensing 14 03902 g013
Table 1. Lab environment.
ConfigurationParameter
CPUIntel Core i9-10900kes
GPU2 NVIDIA GeForce RTX 3090
Accelerated environmentCUDA 11.3 CUDNN8.2.1
DevelopmentPyCharm2021.1.1
Operating systemUbantu 18.04
Model framePyTorch 1.10
Table 2. Comparison of state-of-the-art object-detection algorithms in dataset 1.
AlgorithmPrecision (%)Recall (%)AP (%)F1-Score
Faster R-CNN43.1763.9953.980.52
SSD82.5658.2368.920.68
YOLOv393.6479.2491.740.86
YOLOv4-tiny89.9381.2689.530.85
YOLOx-nano90.9986.4393.080.89
Libra87.1287.8589.250.87
CCTD87.2987.6491.610.87
ours92.4187.0793.740.90
Table 3. Comparison of state-of-the-art object-detection algorithms in dataset 2.
AlgorithmPrecision (%)Recall (%)AP (%)F1-Score
Faster R-CNN16.0830.168.990.21
SSD87.9130.0660.260.45
YOLOv391.8146.7273.310.62
YOLOv4-tiny84.7362.3779.090.72
YOLOx-nano84.4171.0983.660.77
Libra63.9872.2269.250.68
CCTD76.6783.8484.720.80
ours87.1875.3587.810.81
Table 4. Comparison of computational complexity.
AlgorithmsModel SizeThe AverageThe Shortest
(MB)Detection TimeDetection Time
Faster R-CNN107.860.262 s0.248 s
SSD90.070.159 s0.125 s
YOLOv3234.690.196 s0.174 s
YOLOv4-tiny22.410.133 s0.119 s
YOLOx-nano2.70.133 s0.121 s
Libra4660.872 s0.828 s
CCTD3150.615 s0.588 s
ours7.80.099 s0.091 s
Table 5. Tree counting performance for different methods.
AlgorithmMAERMSEACC (%) R 2
Faster R-CNN170.9221.282.180.24
SSD162.7184.782.610.47
YOLOv360.373.992.910.92
YOLOv4-tiny59.973.593.120.92
Libra55.567.192.970.93
CCTD56.177.993.070.91
ours36.442.795.930.97
Table 6. Comparison of components of proposed method.
YOLOx-NanoCBAMCLFFGhost AP .5 (%) AP .5:.95 (%)
93.0861.0
93.3861.1
93.2160.9
93.3661.1
93.5361.3
93.7461.5
Publisher’s Note: MDPI stays neutral with regard to jurisdictional claims in published maps and institutional affiliations.

