Article

Inundation Resilience Analysis of Metro-Network from a Complex System Perspective Using the Grid Hydrodynamic Model and FBWM Approach: A Case Study of Wuhan

1
College of Engineering, Ocean University of China, Qingdao 266100, China
2
Key Laboratory of Marine Environment and Ecology, Ministry of Education, Ocean University of China, Qingdao 266100, China
3
Guangdong Provincial Seismological Bureau, Guangzhou 510070, China
4
College of Civil Engineering and Architecture, Qingdao Agricultural University, Qingdao 266109, China
5
School of Architecture and Built Environment, Deakin University, Melbourne, NSW 2751, Australia
*
Author to whom correspondence should be addressed.
Remote Sens. 2022, 14(14), 3451; https://doi.org/10.3390/rs14143451
Submission received: 19 May 2022 / Revised: 2 July 2022 / Accepted: 13 July 2022 / Published: 18 July 2022
(This article belongs to the Special Issue Remote Sensing for Mapping Global Land Surface Parameters)

Abstract

:
The upward trend of metro flooding disasters inevitably brings new challenges to urban underground flood management. It is essential to evaluate the resilience of metro systems so that efficient flood disaster plans for preparation, emergency response, and timely mitigation may be developed. Traditional response solutions merged multiple sources of data and knowledge to support decision-making. An obvious drawback is that original data sources for evaluations are often stationary, inaccurate, and subjective, owing to the complexity and uncertainty of the metro station’s actual physical environment. Meanwhile, the flood propagation path inside the whole metro station network was prone to be neglected. This paper presents a comprehensive approach to analyzing the resilience of metro networks to solve these problems. Firstly, we designed a simplified weighted and directed metro network module containing six characteristics by a topological approach while considering the slope direction between sites. Subsequently, to estimate the devastating effects and details of the flood hazard on the metro system, a 100-year rainfall–flood scenario simulation was conducted using high-precision DEM and a grid hydrodynamic model to identify the initially above-ground inundated stations (nodes). We developed a dynamic node breakdown algorithm to calculate the inundation sequence of the nodes in the weighted and directed network of the metro. Finally, we analyzed the resilience of the metro network in terms of toughness strength and organization recovery capacity, respectively. The fuzzy best–worst method (FBWM) was developed to obtain the weight of each assessment metric and determine the toughness strength of each node and the entire network. The results were as follows. (1) A simplified three-dimensional metro network based on a complex system perspective was established through a topological approach to explore the resilience of urban subways. (2) A grid hydrodynamic model was developed to accurately and efficiently identify the initially flooded nodes, and a dynamic breakdown algorithm realistically performed the flooding process of the subway network. (3) The node toughness strength was obtained automatically by a nonlinear FBWM method under the constraint of the minimum error to sustain the resilience assessment of the metro network. The research has considerable implications for managing underground flooding and enhancing the resilience of the metro network.

Graphical Abstract

1. Introduction

Floods are one of the most devastating and frequent natural disasters in the world [1]. From 1960 to 2014, floods have directly caused USD 2.5 billion in economic losses and 1254 deaths annually [2]. In recent decades, most urban areas with high vulnerability worldwide have been exposed to the risk of flood hazards due to rapid urbanization and varying climate change [3,4,5,6,7]. The United Nations indicates that urban flood disasters have caused massive damage to infrastructure and livelihoods, resulting in billions in economic losses and cascading effects on the public assets such as metro infrastructure [3]. By 2050, the global population of cities will grow by more than two-thirds, and the critical urban infrastructure networks, such as energy, power, and transportation systems, will increase dramatically [8]. This rapid urbanization has contributed to high-density economies and facilitated urban development. Still, it has also resulted in higher risk and more vulnerability of cities to the threat of flooding hazards. Worse still, the frequency and intensity of flood events are expected to increase in the coming years due to more frequent extreme precipitation events [9,10,11].
With the expansion of urbanization, urban underground space has been exploited and used to various degrees. As a vital part of the urban transportation system, the metro undertakes many public responsibilities and plays an essential role in alleviating traffic congestion and benefiting commuters. By 2018, 56 countries and 178 cities worldwide operated metros with an average of 168 million passengers per day, and this number is growing every year [12]. However, metro systems below the ground are the first places where flooding invades. Long-term subsidence and dense passenger traffic cause the metro system to be more vulnerable to flooding and at greater risk than other infrastructure. In recent years, metro floods have been increasing in severity and frequency due to the impermeable concrete surface and untimely update of drainage facilities [13,14]. In July 2021, the flood inundated the Shenzhoulu station, resulting in six stations on Line 21 of Guangzhou Metro being suspended for 7 h, with a direct economic loss of CNY 9115 million (Figure 1a). On 18 July 2021, the protective walls of Zhengzhou Metro line 5 were destroyed by heavy rain, and a flood flowed into the metro tunnel, causing 500 passengers to be trapped and 14 deaths (Figure 1b). On 2 September 2021, flooding occurred at approximately 46 places in the New York metro, almost shutting down the entire metro network (Figure 1c). Thus, metro flooding disasters should be highly emphasized by urban safety management personnel.
Research on metro flood disasters, such as flood simulation and disaster risk management, is crucial for urban metro resilience assessment [15,16,17]. Previous research mainly studied the static risk assessment of metro lines and highly vulnerable metro stations [18]. A few studies focused on evaluating urban flood risk using the rainfall index system and multi-criteria decision-making methods; others deeply researched the emergency response capability of public emergency departments in urban floods. For example, Lyu evaluated the flood risk of the Guangzhou metro system by a GIS-based modeling approach and obtained the high-risk metro lines and nodes [19]. Wang studied the influence of ground subsidence on the increasing flood risk of the metro system and finally found that land subsidence is an essential factor affecting flood risk [20]. Yin used FloodMap to assess the impact of coastal floods on on-road emergency response in New York [21]. However, there is a gap in research considering the inundation resilience analysis of underground floods for the metro system from a network perspective. Due to the varying elevations of each station and the interconnectedness of the stations, a failure at a single station would bring down the entire system or even trap a large number of people, making rescue difficult. Therefore, there is an urgent need to study the cascading effect of nodes (stations) of the metro network to better cope with metro flooding caused by heavy rainfall in the process of urban resilience management [22].
Structured network analysis methods could be employed in many applications, from traffic planning to scheduling, evacuation planning, network resilience, and robustness assessment [23,24]. The network topology analysis approach could be carried out to study the disaster resistance of metro networks [25,26]. Some studies have considered passenger flow and passenger paths in network construction [24,27]. Meanwhile, a set of indicators has been developed to quantify metro networks, for example, connectivity, clustering, and shortest paths [28,29]. Due to their common functional characteristics, metro networks in different cities also have similar statistical properties [30,31]. However, floodwater intrusion into the metro has a direction and speed, and the previously constructed network is no longer suitable for the dynamic investigation of flood hazards. Therefore, it is necessary to establish a novel and practical metro network for disaster resilience analysis, which combines the dynamic and structural characteristics of disasters.
Resilience is the ability of a system to respond to damage and varies with the intensity of the hazard. The acquisition of an accurate estimate of the extent and intensity of flood inundation is an essential prerequisite for resilience assessment. For metro networks, damage caused by flooding could spread from the ground to the subsurface. Current metro flood hazard analysis on the ground was based on the statistical analysis of historical rainfall data to quantify hazards such as average rainfall and average rainy day [13,20,32]. However, the flood evolution and metro flood details are not available by the methods mentioned above to better perceive the flood risk. Modeling approaches specialize in simulating and obtaining evaluation parameters to predict future hydrological responses in different scenarios [33,34,35]. Two-dimensional flood inundation models commonly used for simulation include MIKE 21, SOBEX, JFLOW, and UIM [36,37,38]. The above models could get more accurate information about flooding with time and space, such as water depth and flow velocity at different moments and locations, but requires high-resolution topography and roughness data. Additionally, these raw data need to be converted to a specific input format before being fed into the computational model, and the conversion process of files in different formats commonly results in some loss of information and accuracy. In addition, traditional two-dimensional hydrodynamic models are complex and time-consuming to manipulate and compute and cannot be adapted to real-time applications. Therefore, recent hydrodynamic models make an effort to simplify calculations and increase efficiency [39]. The grid hydrodynamic model was a spatially distributed and physically based rainfall–runoff model that was conveniently and efficiently integrated with the GIS system and directly simulated using DEM data [40,41].
However, there is still very limited research on how flooding spreads within the metro network. Despite the evidence that urban flooding has a probability of intruding into the subway of up to 50% [42], existing studies have not investigated the issue of flood propagation paths in the subway network. Toda had taken Kyoto City in Japan as an example to analyze the flood spreading process and flow characteristics of ground floods inundating underground space [43]. Based on the volume of fluid (VOF) method, Yoneyama simulated the flood flow on the straight stairs in an underground area to obtain a more accurate velocity field [44]. Wu combined the smoothed particle hydrodynamics (SPH) method with a graphics processing unit (GPU) to calculate the step flow in the subsurface space, obtaining a better step flow pattern with higher computational efficiency [45]. Forero-Ortiz used Mike21 to simulate the evolution of surface water flow near Barcelona metro stations and quantify extreme rainfall weather’s contribution to exacerbating metro accidents [46]. Previous studies have only focused on the intrusion characteristics and stepwise flow but have not studied the dynamic inundation process between subway stations [47,48,49,50,51].
Resilience evaluation could be of great utility in enhancing prevention and emergency response capabilities. The evaluation procedure generally involves the establishment of a comprehensive indicator system, of which the determination of relative weights among indicators is another important research aspect. In recent years, the indicator weights comparison methods could be divided into multi-criteria decision methods (MCDM) and machine learning (ML) techniques. MCDM methods that are used to compare the weights of the indicators, such as the analytic hierarchy process (AHP), entropy weight method, TOPSIS method (technique for order preference by similarity to an ideal solution), grey theory, and fuzzy methods [51,52,53,54,55,56]. The disadvantage of these methods, however, is that they rely excessively on the experience of experts to compare these indicators [57,58]. ML methods, such as artificial neural networks (ANN), support vector machine (SVM), Bayesian network (B.N.), random forest (F.R.), and so on, has good application in classification and index processing, especially when dealing with extensive sample data [49,59,60,61]. However, in the case of a small sample, the performance of ML methods will be significantly reduced.
To solve those problems, we developed a hybrid approach from the perspective of urban metro network flood management. The study’s objectives are (1) to establish a simplified network based on flood characteristics, combining the metro topology features, node functions, and node social attributes, (2) to use a grid hydrodynamic model to identify nodes susceptible to flooding and develop a dynamic node breakdown algorithm to simulate the subway’s flood propagation path and node inundation sequence, and (3) to estimate toughness strength of the metro network using the FBWM method and quantify organization recovery capacity. This paper is organized as follows. In Section 2, the methodology and materials are introduced. The data sources and results are presented in Section 3.

2. Methodology and Materials
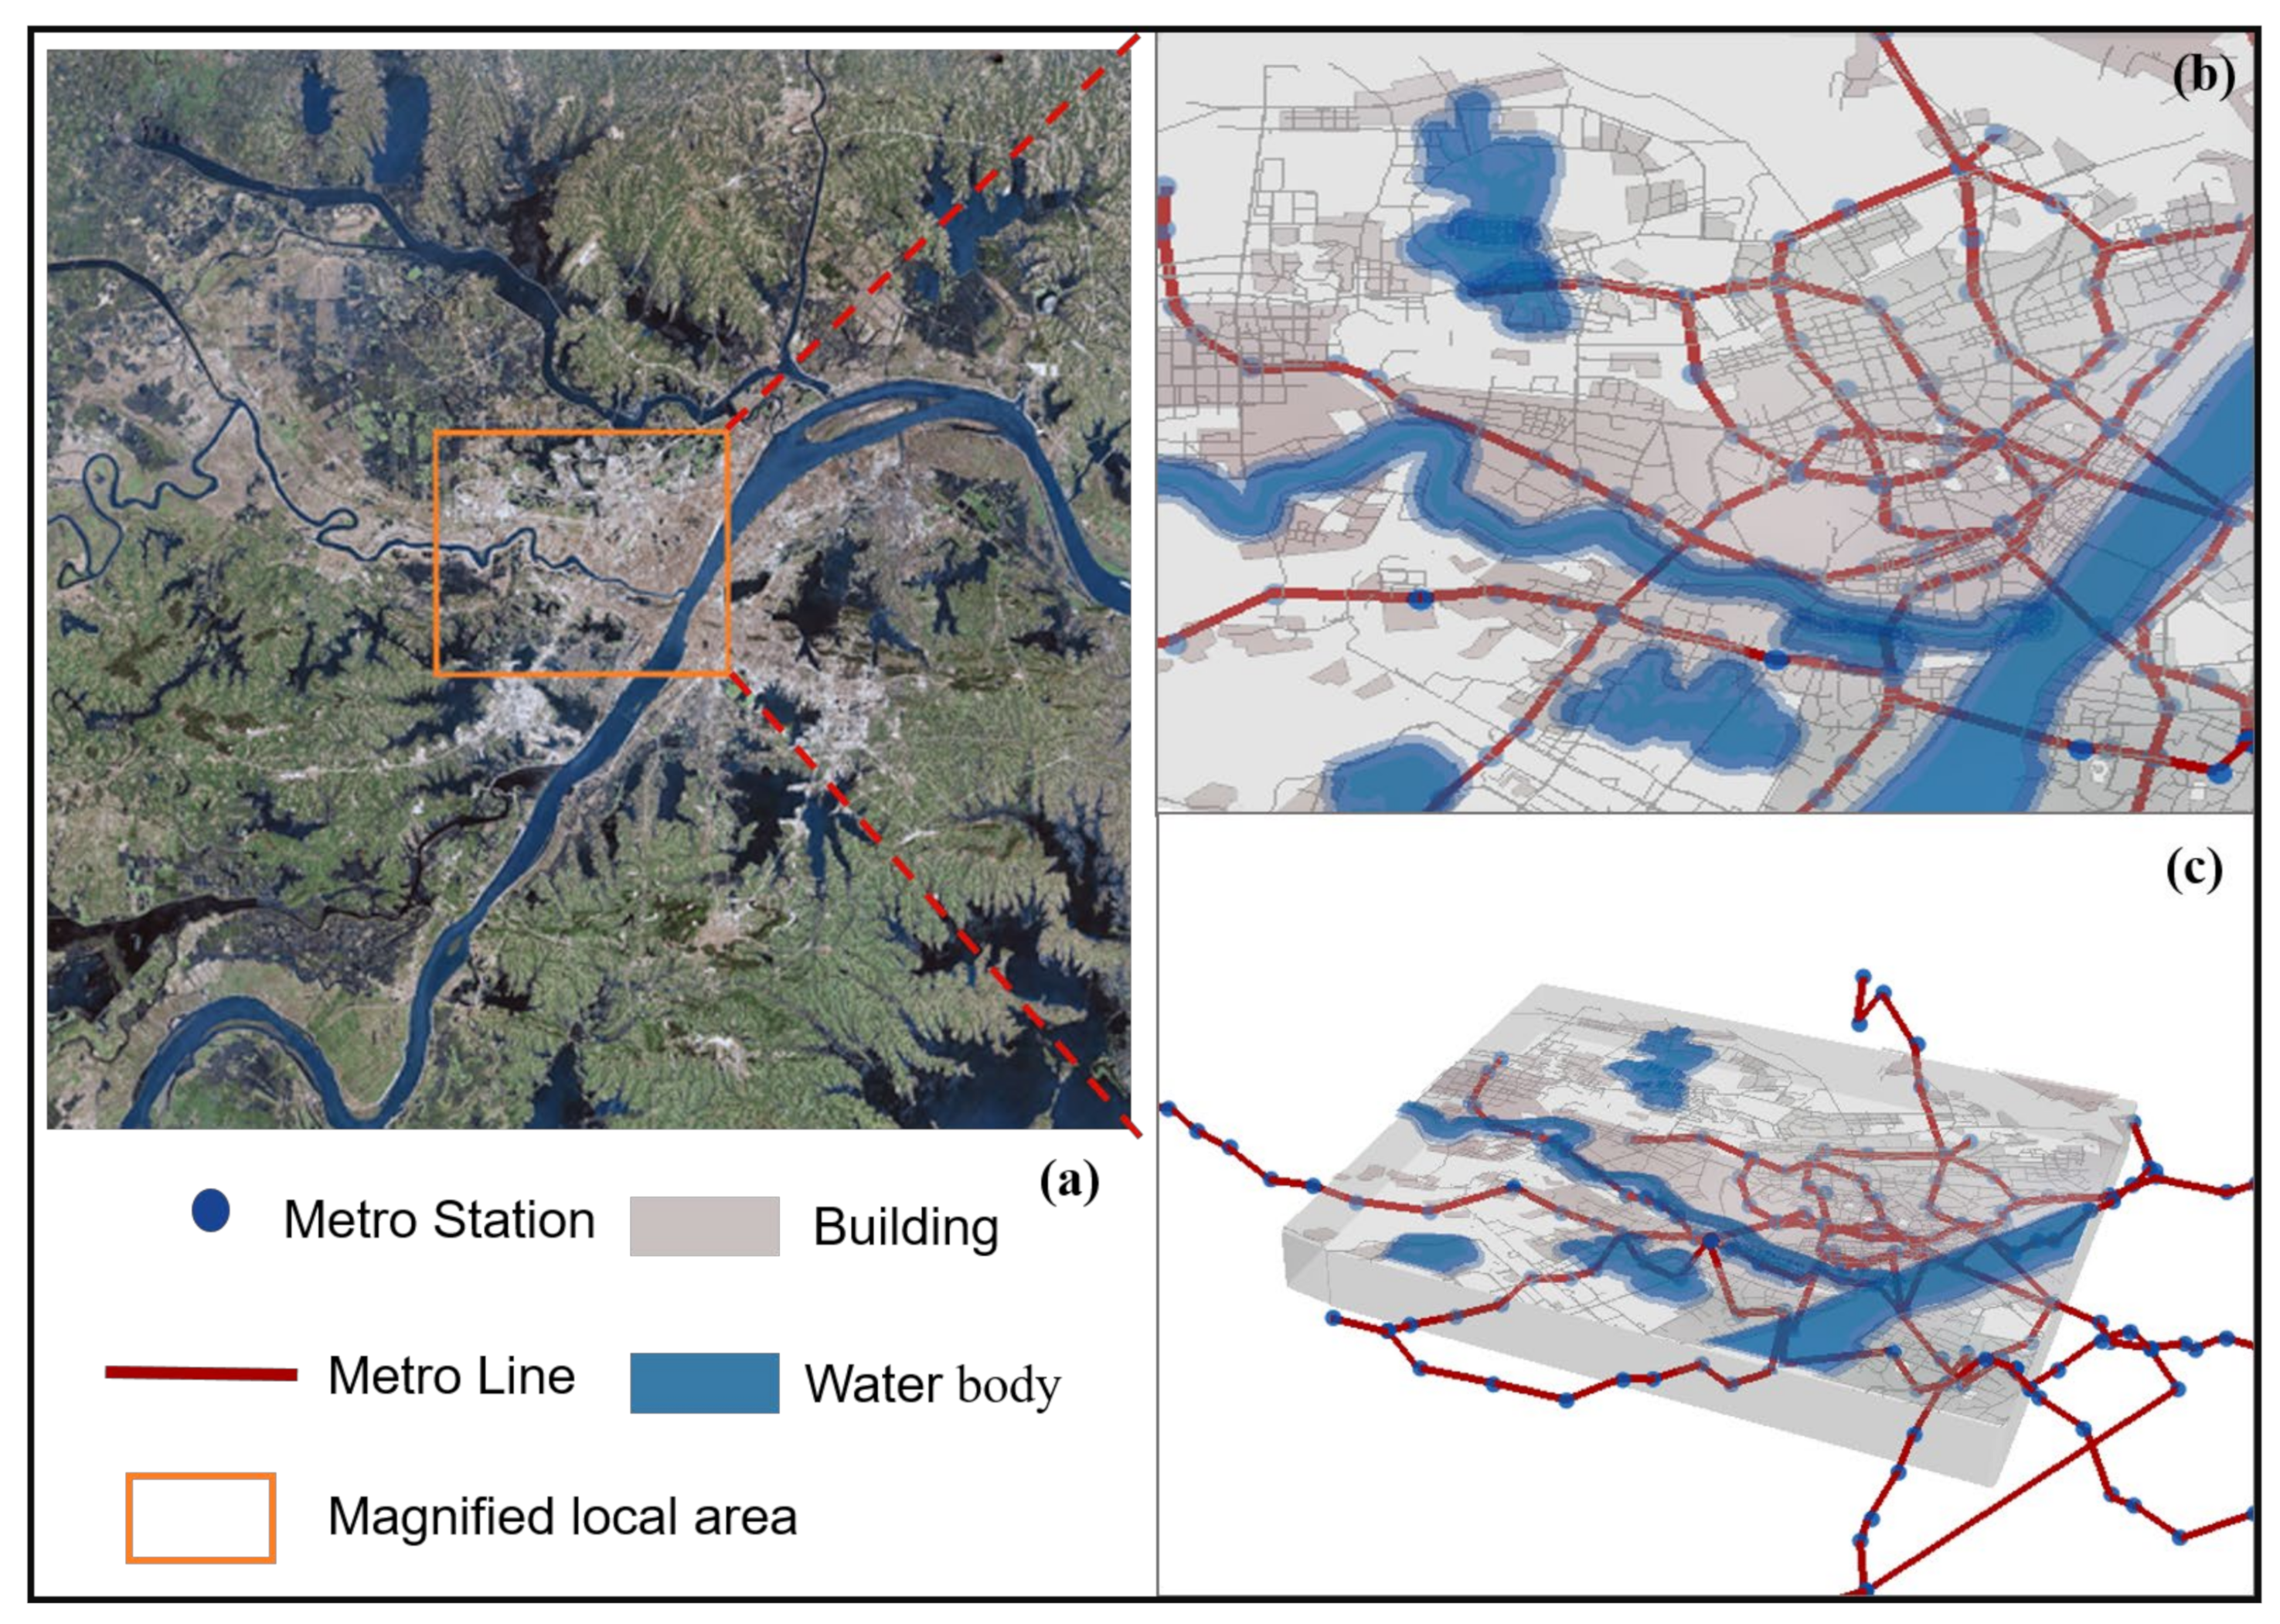
The main objective of this study is to propose an integrated modeling approach for the resilience of the metro system. The process consists of three steps. Firstly, we designed a simplified weighted and directed network model of the metro by combining a topological approach and the slope direction between sites. Subsequently, a 100-year rainfall flood scenario simulation was conducted using high-precision DEM and a grid hydrodynamic model to identify the initially above-ground inundated stations (nodes). A dynamic node breakdown algorithm was also developed to calculate the inundation order of the nodes. Finally, we evaluated the resilience of the metro network concerning its toughness strength and organization recovery capacity, respectively. Figure 2 demonstrates the framework of the methodology used in this paper.

2.1. Study Area

To validate the practicality of the proposed method, we chose Wuhan metro network as an instance as there are countless rivers and abundant rainfall in Wuhan region, and the metro was exposed to extremely high-level flood risk with respect to other cities. Wuhan is located in the eastern Hubei Province of China (as shown in Figure 3a), at the Yangtze River and the Hanjiang River junction. The city is intertwined with rivers and lakes, and the waters cover a quarter of the city’s total area. Wuhan has a north subtropical monsoon climate with an average annual temperature of 15.8–17.5 °C (as shown in Figure 3b). It has an annual precipitation of 1150 mm to 1450 mm (as shown in Figure 3c), all concentrated between June and August each year, accounting for about 40% of the annual precipitation (as shown in Figure 3d). The city’s topography is dominated by low mountains, hills and plains, most of which are below 50 m above sea level and with relatively low terrain. Most of the geological layers on which the metro is located are clay, silt and silty soft soil. In July 2016, three metro stations in Wuhan were submerged, and two were inundated in June 2019. Therefore, Wuhan is characterized by frequently rainfall and low terrain owing to the geography and climatology, and that is the main reason we decided to select Wuhan as the research area. Since the construction of hydraulic facilities around the region recently, the risk of large-scale Flooding in Wuhan has been significantly reduced. The primary risk to the subway originates from the frequent heavy rainfall that caused the water accumulation on the ground, and the water poured through the subway entrance resulting in an emergency risk situation. Figure 3 illustrates the administration area, the metro lines and climate of Wuhan.

2.2. Network Modeling: Simplified Three-Dimensional Model of Metro Network under Flood Evolution Scenario

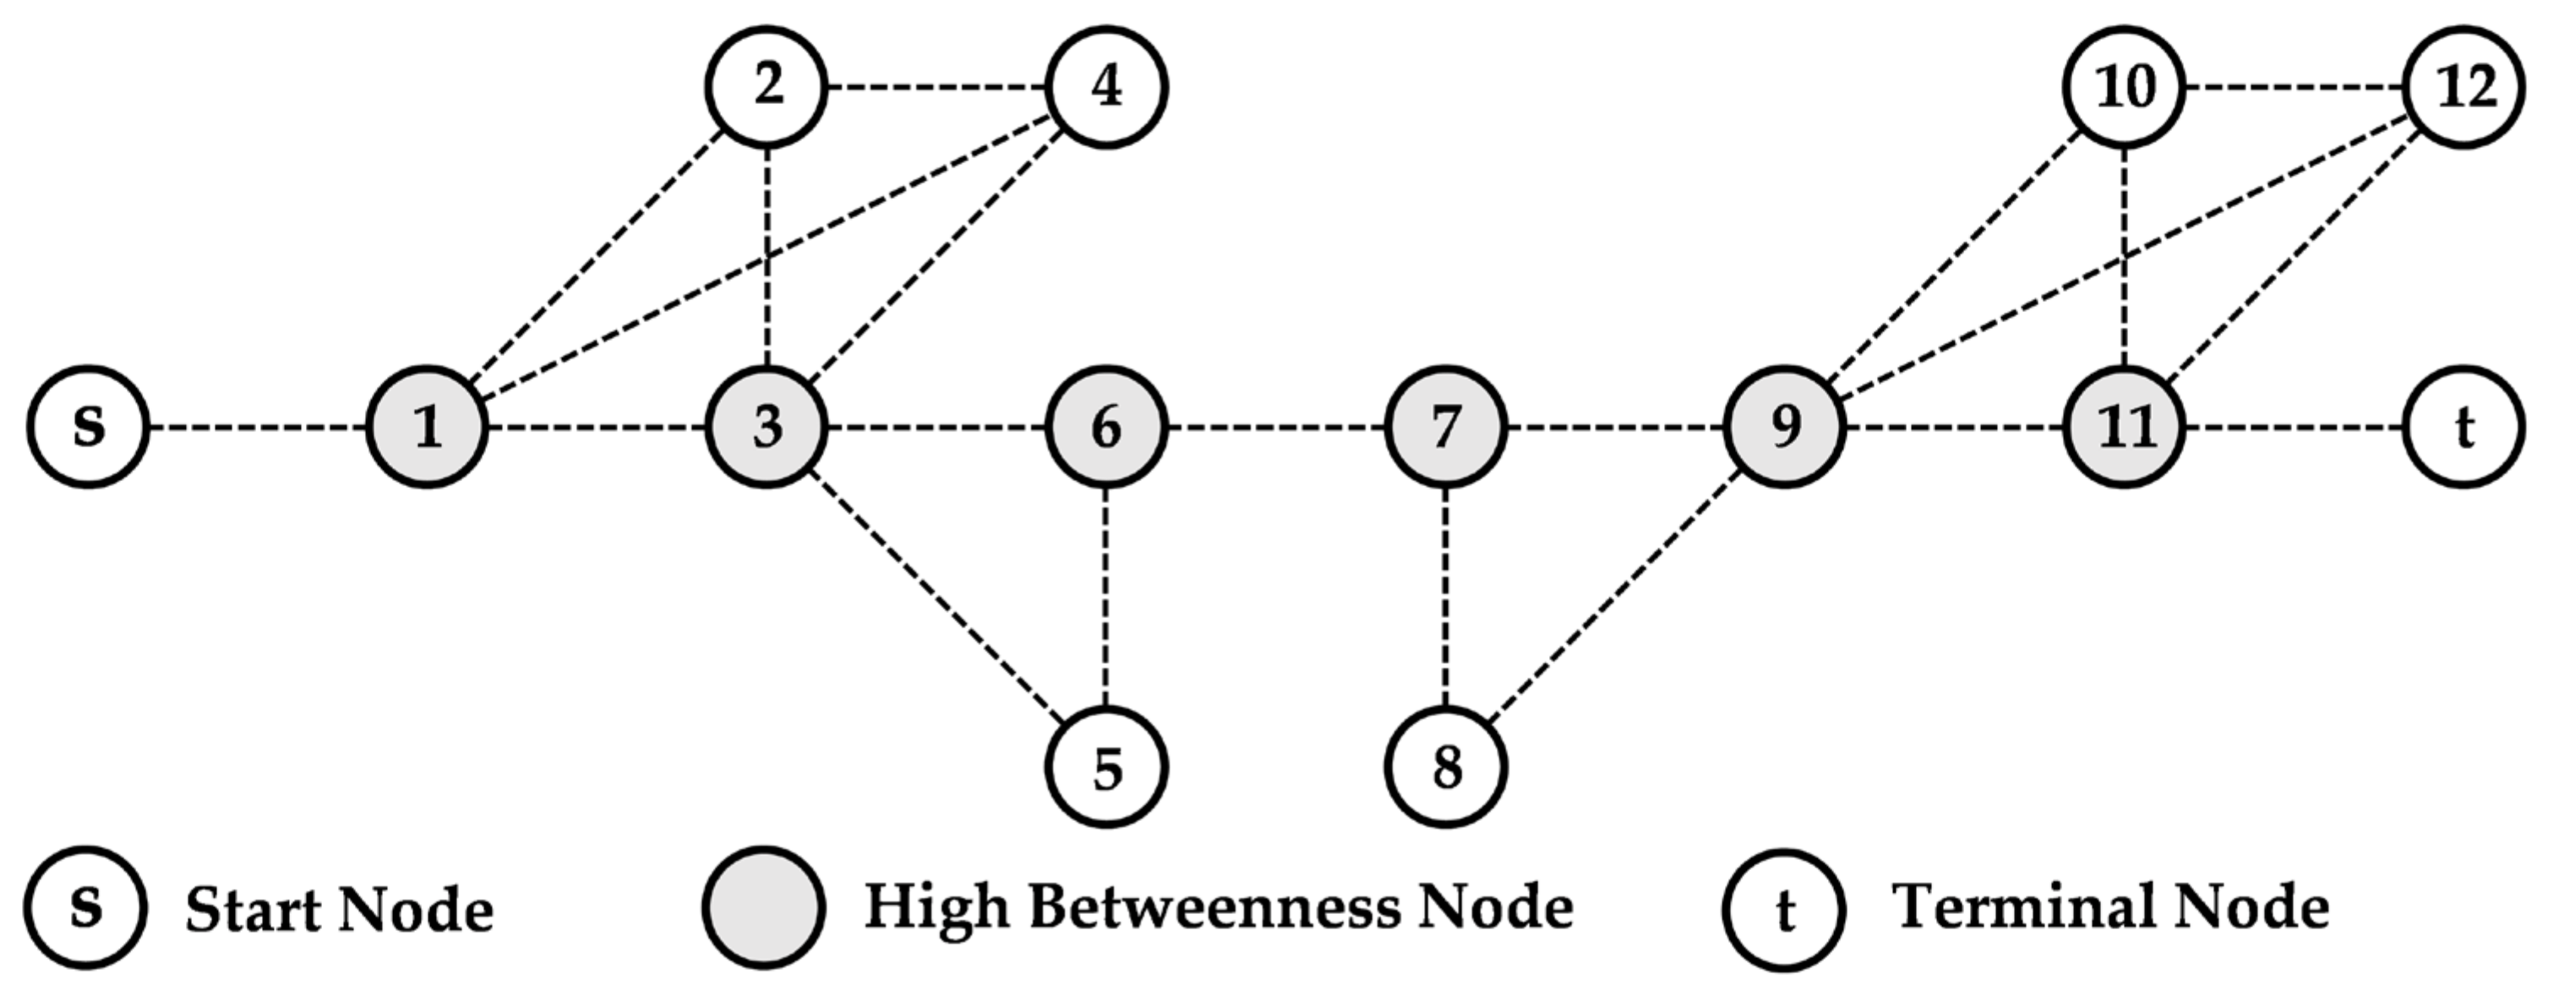
2.2.1. Basic Network

Most of the urban metro stations are located underground, and there are elevation differences between different metro stations. Compared with the traditional simplification method, this paper made the subway network a complex network with three-dimensional properties. Figure 4 shows a simplified schematic diagram of the urban metro.
The stations were abstracted as nodes in a simplified metro network, and the tunnels between stations were treated as edges. Since stations have many entrances and exits and ventilation systems, highly exposed nodes are usually the first places where floodwater intrudes. Due to the differential elevations of the stations, flood water at the inundated nodes flows through the edges to the nodes with lower topography. Thus, the subway network could be modeled as a directed and weighted network, which reflects the topological characteristics of the metro system and dynamically shows the spatial–temporal process of flooding. The metro network was represented as a weighted and directed graph G = (N, E), where N is the set of nodes of G, and E is the set of edges [62].

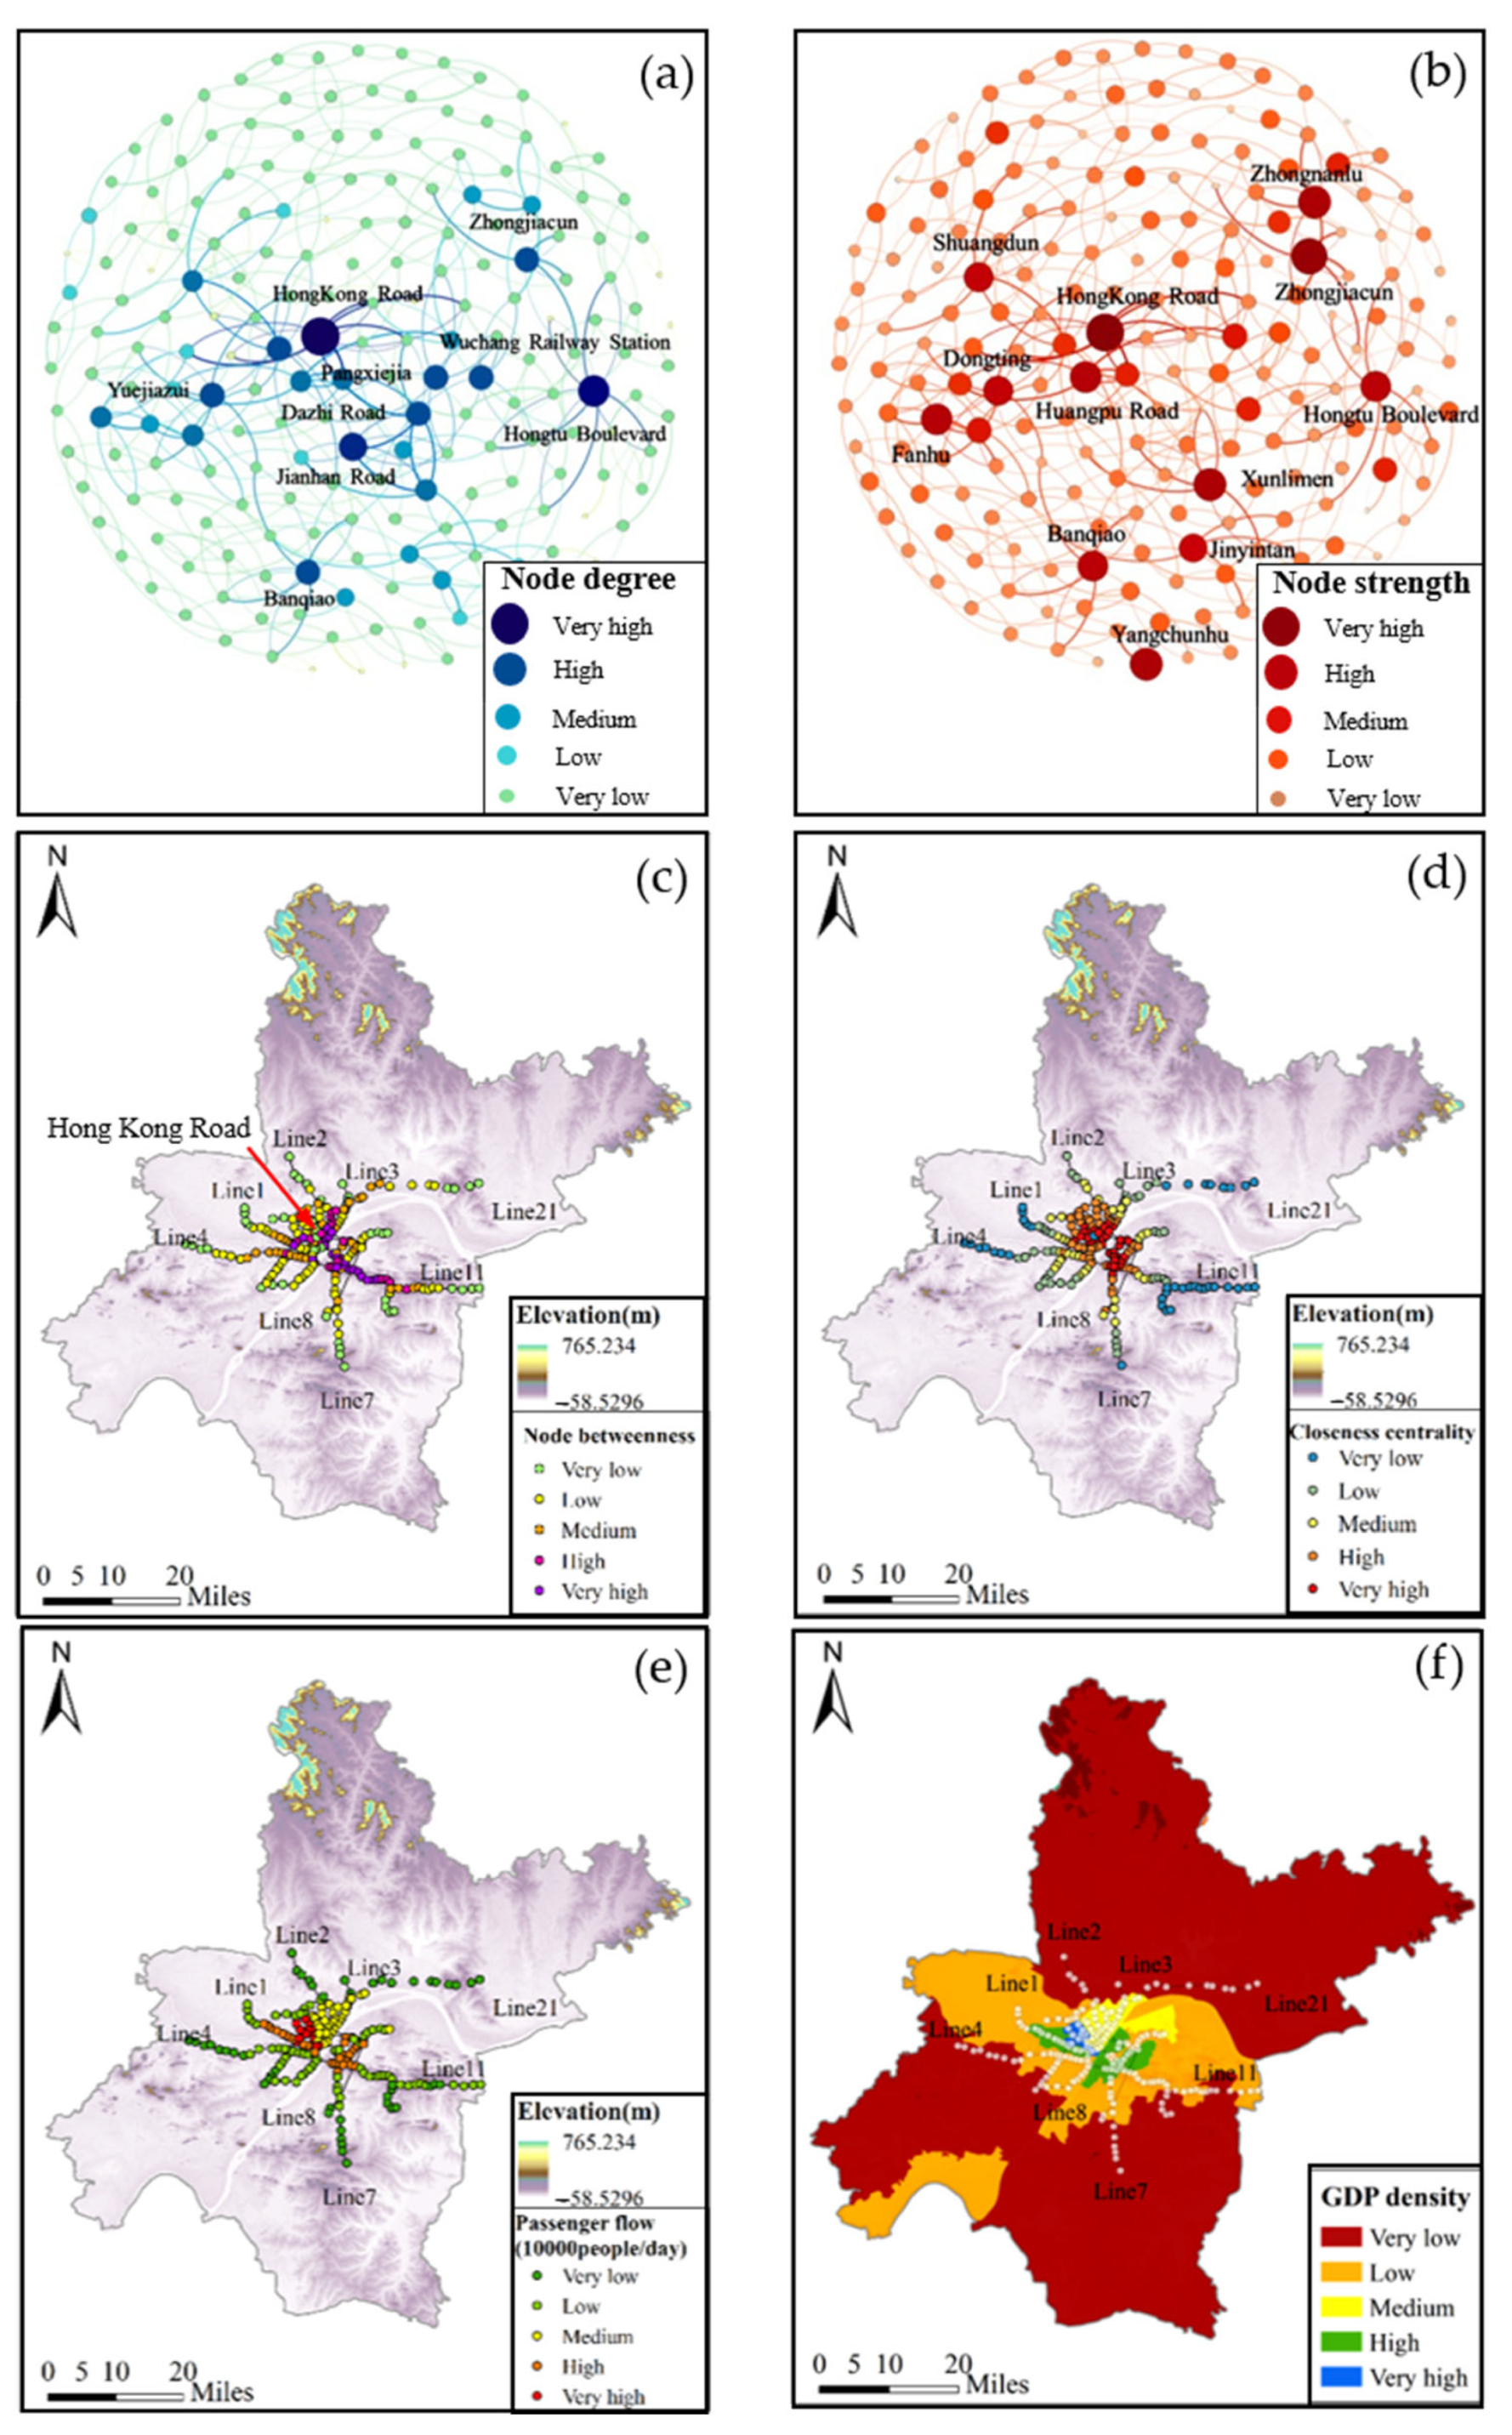
2.2.2. Node Characteristics

The network in this paper assigned specific characteristics related to flooding. The characteristics of nodes such as node degree, node strength, node betweenness, closeness centrality, passenger flow, and GDP density were further sub-defined.
  • Node Degree
Node degree indicates the number of neighboring nodes that are directly connected to the node. There are two connection directions between nodes, such as ij(out) or ji(in), as shown in Figure 5a. The node-out degree d i o represents the number of nodes that flood flows from node i to other nodes, and the node-in degree d i i is described by the number of nodes where the flood flows into node i. The parameter δ i j , whose values were all assigned as 1, denotes the flood flow between node i and node j. The inflow was marked as δ i j i and the outflow was specified as δ i j o . The node degree d i is the sum of node input degree and node output degree. The calculation formula is as follows:
d i i = j E δ i j i ,
d i o = j E δ i j o ,
d i = d i i + d i o ,
2.
Node Strength
The node strength indicates the capacity of the node to tolerate or transmit flood water. The greater the node strength, the higher the flood risk to the node. In a weighted network, node strength is defined as the sum of the weights of all the edges connected with node i. The terrain difference between nodes determines the weight of edges. A metro node can receive flood water from a higher node or propagate it to a lower node. The corresponding relationship between terrain difference and edge weight is shown in the following table. The maximum height variation between Wuhan metro stations is 29.6 m. To quantify the relative levels of risk between stations, we categorized the height variation into five levels and assigned different weights to each level depend on the flood flow direction as shown in Table 1. δ i j is a constant, 1, indicating that node i and node j are directly connected. N is the number of network nodes and ω i j is the weight of edges between nodes i and j. Similarly, the node strength could also be described as Equation (4) and Figure 5b.
D i = j i N δ i j ω i j ,
3.
Node Betweenness
Node betweenness, C i , represents the ability of the node to diffuse flood, as shown in Equation (5) below. In the formula, σ s t i denotes the number of paths from point s to point t through node i, and σ s t is the number of paths from point s to point t. Node betweenness as the initial parameter is crucial in node importance evaluation which reflects the function of flood diffusion as shown in Figure 6.
C i = s v t E σ s t i σ s t ,
4.
Closeness Centrality
When the nodes at the edge of the network and the center of the network have the same node strength, it is necessary to consider the impact of these nodes on the operation efficiency of the entire metro network. Close centrality shows the average shortest distance from this node to all other nodes, which reflects the degree of proximity between these nodes. The smaller the average shortest distance of a node is, the greater the closeness centrality of this point is. If there is no path reachable between node i and node j, then d i j is defined as infinite, and its reciprocal is 0. The calculation formula is as follows:
C i = 1 d i = 1 j = i d i j ,
5.
Passenger Flow
Passenger flow is an index to measure the number of passengers, which is recorded as P i [13,18,24]. In this paper, the average annual passenger flow was used to separate passenger flow into five different levels, from low to high. The higher the passenger flow, the higher the corresponding importance.
6.
GDP Density
The GDP density of nodes directly shows its social function and economic significance [19,20]. In this paper, GIS was used to overlay the annual GDP and location characteristics of the study area, and the GDP density of different metro stations was recorded as M i .

2.2.3. Node Toughness Strength

The toughness strength of a node we define as the vulnerability of the node to a hazard. Node toughness strength reflects the resilience of nodes exposed to flood events. It is inversely related to each of the above factors, and there is a cumulative effect between the factors. Node toughness strength reflects the resilience of nodes exposed to flood damage. In this paper, we defined the node toughness strength as Equation (7). The six node characteristics and node strength have an inverse growth relationship.
x i = 1 ξ 1 d i + ξ 2 D i + ξ 3 B i + ξ 4 C i + ξ 5 P i + ξ 6 M i ,
In the formula, ξ 1 , ξ 2 , ξ 3 , ξ 4 , ξ 5 , and ξ 6 were node degree coupling coefficient, node strength coupling coefficient, node betweenness coupling coefficient, closeness centrality coupling coefficient, passenger flow coupling coefficient, and GDP density coupling coefficient, respectively.

2.3. Flood Hazard Simulation

The breakdown of the metro network occurs when there is continuous heavy rainfall. Excess rainfall is driven by gravity to the surface and flows to lower terrain. The gathered floodwater initially flows into the metro station entrances in low-lying areas, thereby causing the spread of floodwater within the metro network.

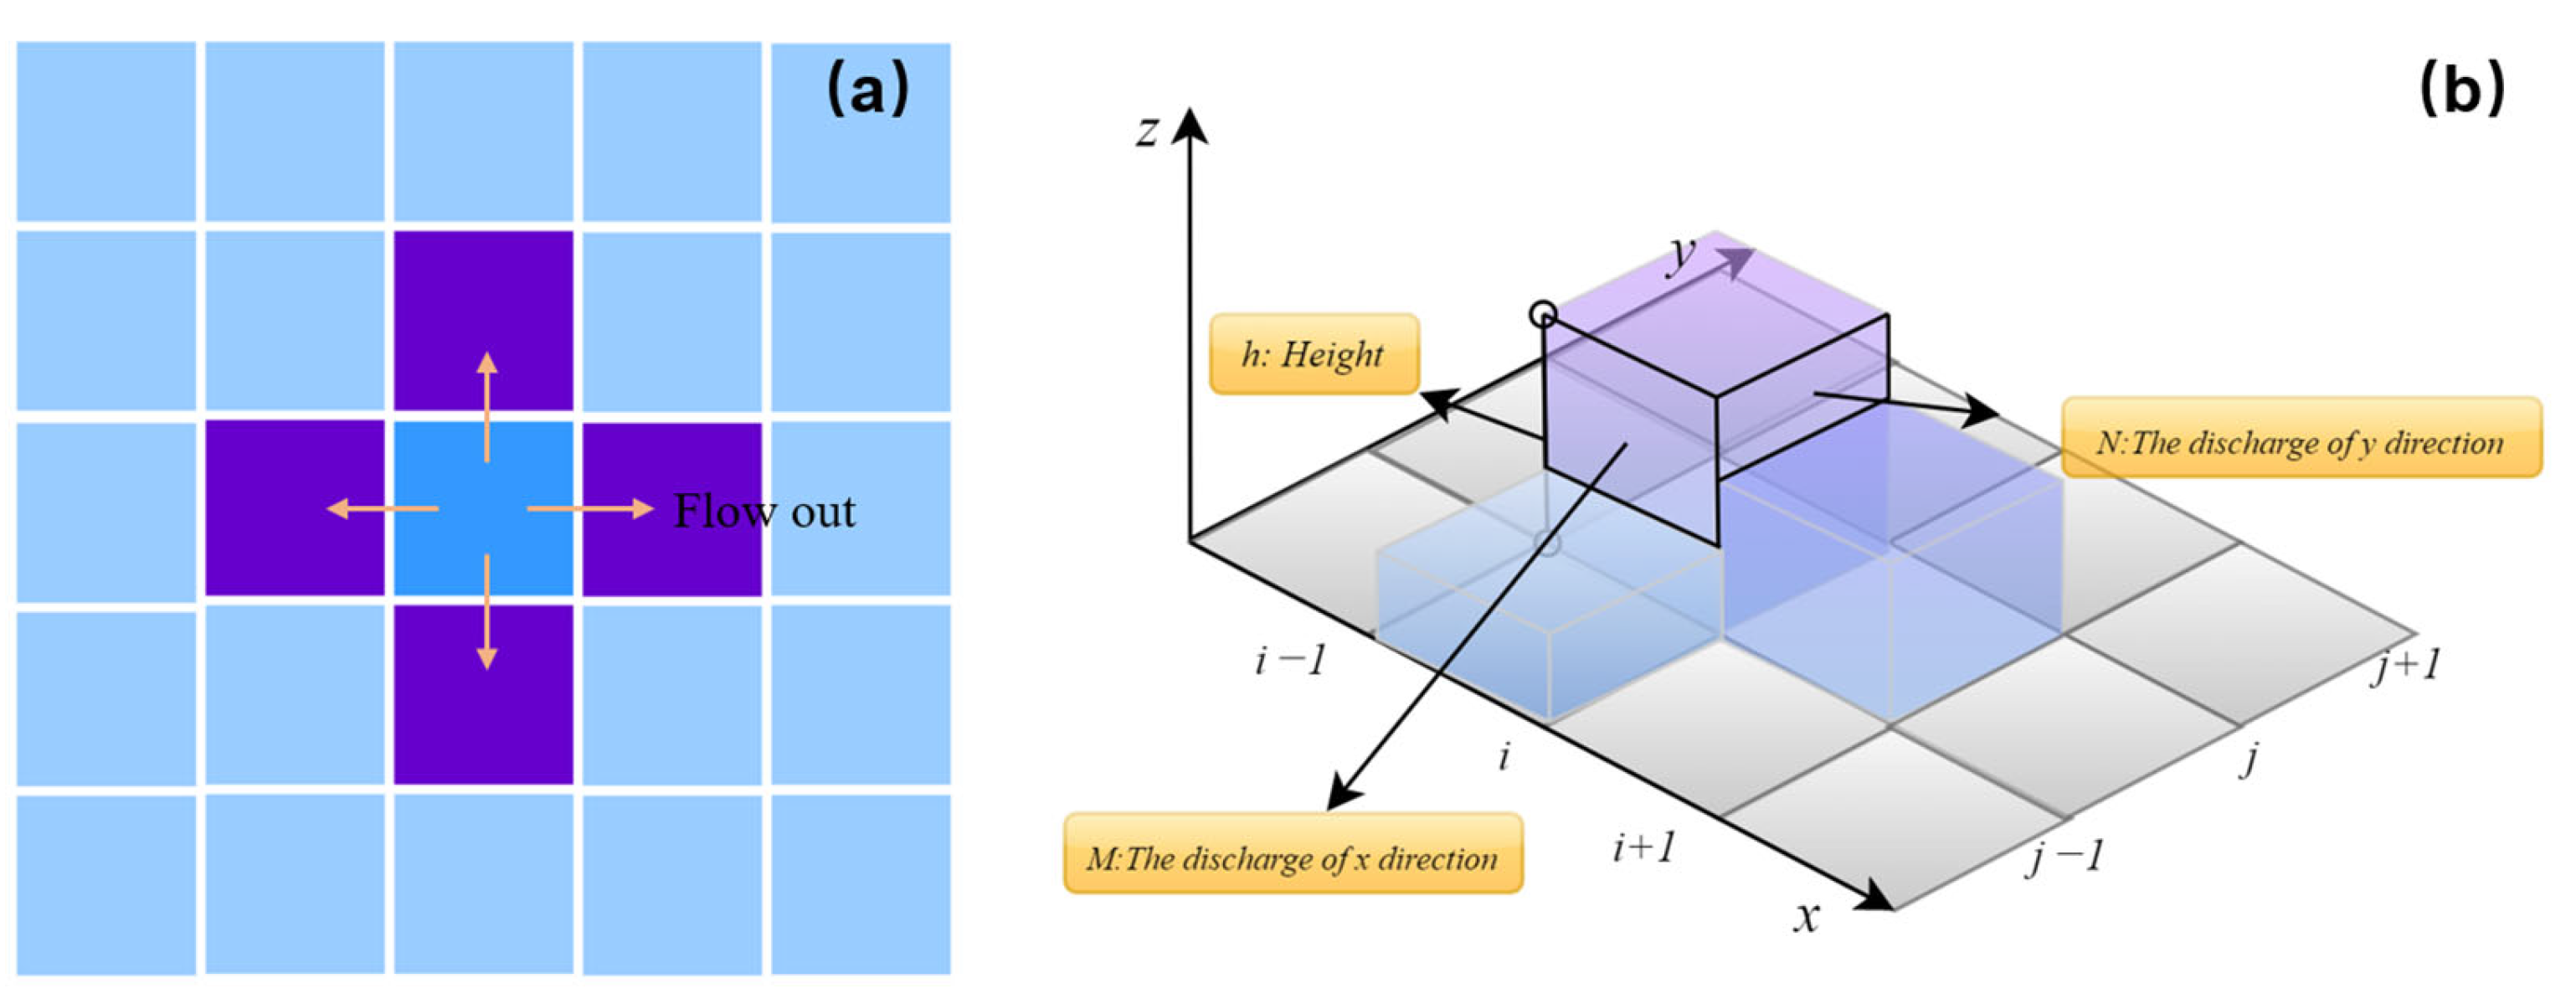
2.3.1. Surface Flooding Simulation: Identification of Flood-Prone Metro Nodes

The breakdown of the metro network starts at the nodes that were first flooded. Initially, we identified the nodes in the metro network that are susceptible to inundation through submersion simulations. By setting different flood return periods and carrying out simulations based on the grid hydrodynamic model, we could specify the inundated metro nodes based on the simulation outcomes. If the inundation depth of the area exceeds the height of the water barrier in front of the subway exit (0.6–1 m), the subway station is considered to be inundated. Considering the accumulation of massive water around the subway, the conventional emergency measure is to use sandbags for the interception; the height of sandbags is estimated to be about 1 m according to past practical experience, so the height of the water barrier is defined as 1 m in this paper.
  • Inundation simulation
In this paper, a grid hydrodynamics-based cellular automata model was used to simulate the rainfall flooding process [41]. The two-dimensional shallow water equations were discretized and applied as a transformation rule to the cellular automata model. A cellular automaton was composed of cellular space, a cellular state, a neighborhood, and a transformation rule. A two-dimensional cell space was chosen, and a von Neuman-type cell was used for the neighborhood, as shown in Figure 7a. The state of each cell in the cellular automaton model at the next moment (water level, flow rate) was determined by the previous moment’s state (water level, flow rate) of that cell and its neighboring cells. The most critical part of the cellular automaton was the definition of the transformation rules. Therefore, to accurately describe the flood evolution process, the two-dimensional shallow water equations were discretized. The evolutionary relationship between water level and flow was controlled by the de Saint-Venant system of equations (see Equations (8)–(10))
h t + M x + N y = 0 ,
M t + u M x + v M y + g h Z x + g n 2 u u 2 + v 2 h 3 = 0 ,
N t + u N x + v N y + g h Z y + g n 2 v u 2 + v 2 h 3 = 0 ,
Equation (8) is the continuous equation, and Equations (9) and (10) are the momentum equations. Figure 7b shows the cellular space difference in three dimensions, where h is the water depth, the distance of the water surface from the river bottom; Z is the water level, the elevation of the free water surface relative to the base of the gauge; M and N are the discharge in the x and y directions; u and v denote the average flow velocity in the x and y directions, respectively; n is the Manning roughness; t is the time; and g is the gravity acceleration.
The first term of the momentum equation reflects local acceleration, the second term reflects convective acceleration, and the first and second terms are inertial. Due to the flat terrain of the simulated floodplain area, the symbol of g h Z x varies with the fluctuation of the flood. Referring to the simplified method of diffusion waves, we can say M t + g n 2 u u 2 + v 2 h 3 g h Z x u M x + v M y . The convection term is a nonlinear term, which will cause the oscillation of the calculation results when solving Equations (9) and (10). However, it has less impact on the calculation. This article omits this item. Simplified shallow water equations in the x and y directions could be obtained, as shown Equations (11)–(13).
M i , j k + 1 = M i , j k g Δ t h i , j k + h i + 1 , j k Z i + 1 , j k Z i , j k 2 Δ x g n i , j 2 u i , j k Δ t u i , j k 2 + v i , j k 2 h i , j k + h i + 1 , j k / 2 3 ,
N i , j k + 1 = N i , j k g Δ t h i , j k + h i , j + 1 k Z i , j + 1 k Z i , j k 2 Δ y g n i , j 2 v i , j k Δ t u i , j k 2 + v i , j k 2 h i , j k + h i , j + 1 k / 2 3 ,
h i , j k + 1 = h i , j k Δ t M i + 1 , j k M i , j k Δ x Δ t N i , j + 1 k N i , j k Δ y ,
where k is the number of cell iterations, and Δ t is the time step. The size of the grid is defined by Δ x and Δ y . The position of the cell is defined by i and j. The water level value of the unit is initialized, as well as the initial water velocity of u i , j 0 = v i , j 0 . The cellular space difference diagram is shown in Figure 7b.
Since the explicit difference is usually unstable, the time step and distance step need to be limited, as shown in Equation (14), where c is the wave speed, generally taken as g H .
Δ t Δ x c ,
2.
Rain design
Rain intensity is determined using the recommended formula for the study area, the form of expression of which is shown in Equations (15) and (16) [63].
i = 9.686 1 + 0.887 l g P t + 11.23 0.658 ,
q = 1614 1 + 0.887 l g P t + 11.23 0.658 ,
In Equations (15) and (16):
i —Design rainstorm intensity (mm/min);
P —Rainfall return period (a);
t —Duration of rainfall (min);
q —Design rainstorm intensity [L/(s·hm2)].
Short-term rainfall is determined using Chicago rain type; through the above Equations (15) and (16) transformation, Equations (17) and (18) can be obtained as follows. The duration of rainfall is 3 h. The rainfall process line is shown in Figure 8.
I 1 = a t 1 r + b n + 1 1 n t 1 r + b ,
I 2 = a t 2 1 r + b n + 1 1 n t 2 1 r + b ,
In Equations (17) and (18), I 1 is the pre-peak rainfall intensity (mm/min), I 2 is the post-peak rainfall intensity (mm/min), t 1 is the pre-peak rainfall duration (min), t 2 is the post-peak rainfall duration (min), r is the rain peak coefficient, n = 0.658 , a = 9.686 1 + 0.887 l g P , and b = 11.23 .

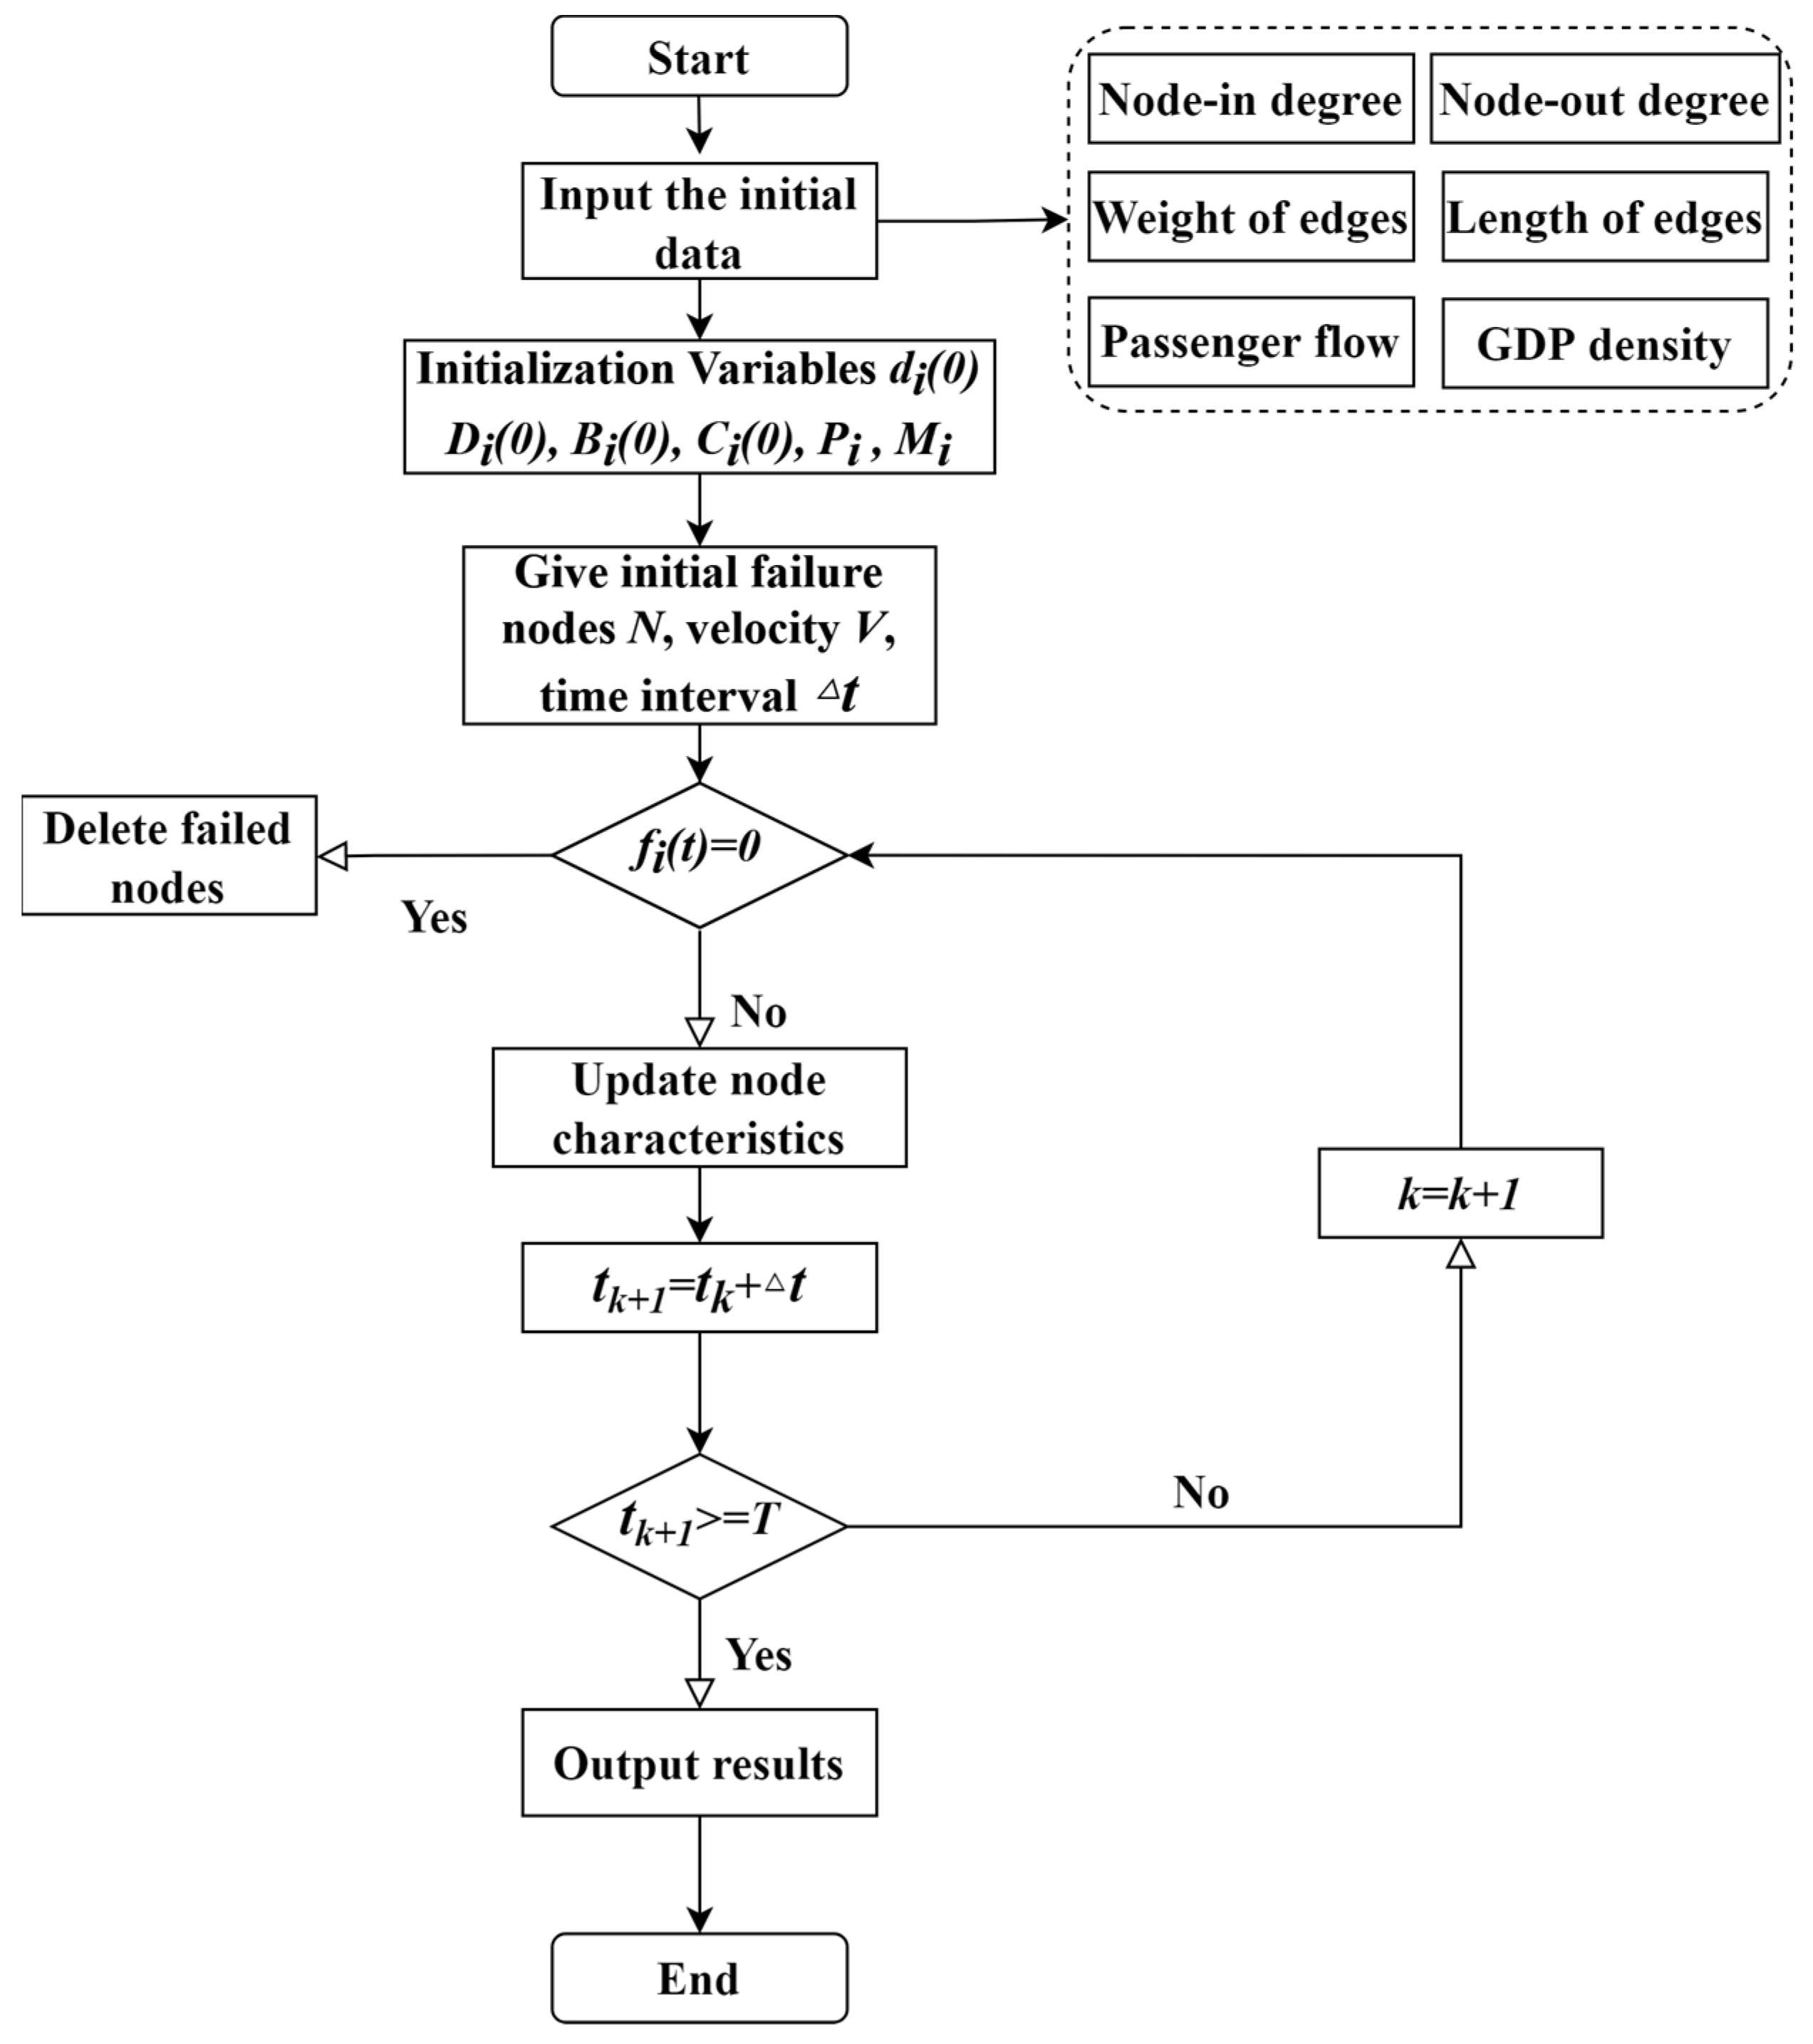
2.3.2. Inundation Sequence Simulation of Stations: Dynamic Node Breakdown Algorithm

The metro network in the flood scenario is a directed and weighted network. Flood will spread along the tunnel to low terrain. Flood diffusion is a dynamic process varying with time, so this paper discretizes the time and space variables. f i t is used to define whether the node is invalid.
At the moment t 0 when the inundation depth within 300 m around the metro station is greater than the limit h 0 , the station is considered to be flooded, namely f i t 0 = 0 . For the node state at any time, f i t is used to define whether the node is invalid, as shown in Equation (19).
f i t = 0 , i n v a l i d 1 , v a l i d ,
Therefore, as long as the breakdown time of the first node is known, the breakdown nodes at different times and the characteristics of good nodes could be obtained by the dynamic node breakdown algorithm.
Figure 9 shows the flow chart of metro flood propagation. The specific calculation steps are as follows:
Step 1: Initialization parameters. Input node-in degrees, node-out degrees, edge lengths, edge weights, node passenger flow, and GDP density to form six n × n initial matrices.
Step 2: Calculation of flood diffusion length based on flood velocity and interval time.
Step 3: The characteristics matrix of each node is calculated.
Step 4: Based on the set of breakdown node points at the previous moment, we determined the breakdown nodes at the next moment.
Step 5: Record the f i t of the breakdown node as 0 and clear it. Then, start searching for the breakdown node of the next moment.

2.4. Resilience Assessment Model of Metro Network

In this paper, the resilience of the metro network consists of two parts: its toughness strength and organization recovery capacity. The fuzzy best–worst method (FBWM) was used to obtain the weight of each assessment metric and determine the toughness strength of each node and the entire network. Organizational recovery was represented by the coverage of urban public emergency forces.

2.4.1. Toughness Strength Assessment Model for Metro Network

Calculation of node toughness strength index weights: FBWM
Before carrying out a comprehensive assessment based on FBWM, we first used a simple fuzzy theory, a methodology to describe and process system uncertainty [17]. The point of fuzzy set theory, which was adopted in this study, is that the degree of membership for an element is usually within a specific interval [0, 1]. Any value within the interval indicates that the component has a certain degree of membership, or, in other words, it has a part belonging to the fuzzy set. The triangular fuzzy number is determined by ( L , U , M ) and satisfies 0 L M U 1 . L ,   M , and U denote the lower bounds, the most likely value, and the upper bounds, respectively, as shown in Figure 10. The membership function of triangular fuzzy number (TFN) A ˜ is as follows:
μ A ˜ A = 0 , A L   o r A U A L M L , L A M U A U M , M A U ,
The operational laws of TFNs A ˜ = L 1 , M 1 , U 1 and B ˜ = L 2 , M 2 , U 2 were as follows [57].
A ˜ ± B ˜ = L 1 ± L 2 , M 1 ± M 2 , U 1 ± U 2 , A ˜ × B ˜ = L 1 L 2 , M 1 M 2 , U 1 U 2 , A ˜ ÷ B ˜ = L 1 U 2 , M 1 M 2 , U 1 L 2 ,
Defuzzification was used to convert the fuzzy set into an accurate value as the output to carry out the subsequent work. The graded mean integration representation (GMIR) of fuzzy triangular numbers can be expressed below.
R A ˜ = L + 4 M + U 6 .
This section aims to obtain the importance of nodes by calculating index weights. FBWM (fuzzy best–worst method), proposed by Guo S in 2017, is a method to get the weight of each indicator by comparing the importance of other indicators with the best indicators and the worst indicators [57]. Using FBWM to calculate the weights of the indices is a critical step in assessing the overall network resilience.
In this paper, the importance of each indicator was compared with each other according to its contribution to flood risk. The relative importance of the indicators was transformed into fuzzy triangular numbers based on Table 2.
The specific steps of FBWM are as follows.
Step 1: Determine the best and worst indicators. In this step, the importance of each indicator is compared. The best indicator B and the worst indicator W are decided.
Step 2: Compare the importance of other evaluation indicators with the best indicator B and the worst indicator W and record them as a B W , as shown in Figure 11.
Step 3: Determine the optimal fuzzy weight value ( w ˜ B , w ˜ W , w ˜ j ) of the best indicator, the worst indicator, and each other indicator, of which, w ˜ B = L B w , M B w , U B w , w ˜ W = L W w , M W w , U W w , w ˜ j = L j w , M j w , U j w . In the previous step, the importance a B W of each indicator compared with the best indicator B and the worst indicator W is obtained. To obtain the optimal fuzzy weight, we needed to minimize the maximum value of w ˜ B w ˜ W a ˜ B W . Therefore, an optimization model was developed to solve this problem.
m i n   m a x j w ˜ B w ˜ W a ˜ B W
s . t . j = 1 n R w ˜ j = 1 L j w M j w U j w     L j w 0 j = 1 ,   2 ,   ,   n ,
Bringing m a x j w ˜ B w ˜ W a ˜ B W = ξ ˜ into the above equation, the nonlinear constrained optimization problem was transformed as follows.
min ξ ˜ s . t . w ˜ B w ˜ W a ˜ B W ξ j = 1 n R w ˜ j = 1 L j w M j w U j w L j w 0 j = 1 ,   2 ,   ,   n ,
In the above Equation, ξ ˜ = L ξ , M ξ , U ξ , and L ξ M ξ U ξ . The optimal target value is ξ ˜ = K , K , K , K L ξ .
  m i n   ξ ˜ s . t . L B w , M B w , U B w L W w , M W w , U W w L B W w , M B W w , U B W w ξ j = 1 n R w ˜ j = 1 L j w M j w U j w L j w 0 j = 1 ,   2 ,   ,   n ,
According to the rule of triangular fuzzy number, Equation (26) could be calculated to obtain the optimal fuzzy weight values of the best, worst, and other indicators, respectively.
Step 4: The fuzzy weights w ˜ B , w ˜ W can be refined using GMIR, as shown in Equations (27) and (28).
w B = L B w + 4 M B w + U B w 6 ,
w W = L W w + 4 M W w + U W w 6 .
Toughness Strength of Metro Network
The toughness strength of the network consists of the node toughness strength. The network toughness strength slowly decreases during the period when the metro network is disrupted. Thus, the network toughness strength at a certain point in time is defined by Equation (29).
X t = 2 x i x i f × 1 + t T 143.3963 ,
In the formula, X t denotes the toughness strength of the metro network at moment t. x i is the toughness strength of node i. x i f is the toughness strength of the flooded node at moment t. T represents the time taken for the entire metro network to fail.

2.4.2. Organization Recovery Capacity of Metro Network

Urban departments must respond to the incident sites as soon as possible once sud-den metro flooding and emergency events happen. From the perspective of urban public safety, the response of emergency departments can also indicate the resilience of the metro network. We defined this resilience as organization recovery capacity. To evaluate the organization recovery capacity of the metro network, we used the emergency response coverage of police and fire departments as a criterion. In this paper, the accessibility of submerged paths around the subway station was temporarily disregarded when conducting the shortest route analysis, and potential traffic jams were not taken into account as well. Since the rescue time is approximately inversely proportional to the straight-line distance, only the influence of direct distance on the rescue time is considered in this paper for an approximate estimation. GIS buffer analysis was carried out to determine the scope of emergency response services within the adequate time. We used the GIS-based shortest path method, the shortest distance between two points. The emergency response speed was set to be 30 km/h by taking the positions of the above two types of public service institutions as the starting point, combined with the influence of urban regional driving speed and rainstorms. We set the reachable area of public emergency services within the specified rescue time as a buffer zone to determine its coverage and organization recovery capacity.

3. Results and Discussion

3.1. Data Source

The research data used in this paper contain eight components listed below. The origins of the data are shown in Table 3.
The overall size of Wuhan is 8569.15 square kilometers. The remote sensing data contains both urban buildings and water bodies. Short-time rainfall data and DEM data for Wuhan were taken for the 3 h flood simulation of the grid hydrodynamic model. Metro passenger flow and GDP density were the statistical data used to determine the importance of the nodes. The height difference of metro stations and the distance between metro stations were utilized for the metro node network breakdown simulations.

3.2. Flood Hazard Analysis of Metro Network

3.2.1. Flooded Node Breakdown Analysis

The first breakdown nodes are the flood-prone metro stations. The identification of flood-prone nodes is the first step of metro flood resilience management. This paper used the grid hydrodynamic model to simulate the 100-year rainfall in Wuhan city and obtain the inundation depth map of 300 m near nine metro lines, as shown in Figure 12. Through the simulation, we divided the water depth into five grades. When the water depth of the area within 300 m around the metro station was between 1 and 3 m, we assumed that the nodes were exposed to flood risk, and these nodes were considered flood-prone points. Technically, we utilized the buffer zone analysis tool in GIS to get the zone within 300 m of the subway station. The inundation-prone stations were identified by comparing whether the inundation area and the buffer zone overlapped.
By surficial hydrodynamic simulation, Dazhi Road Station of Metro Line 1, Fanhu Station of Metro Line 2, Linjiaohu Station and Yunfei Road Station of Metro Line 3, Renhe Road Station of Metro Line 4, Miaosu Road Station of Metro Line 6, Qushuilou Station of Metro Line 7, Tongji Hospital Station, and Yangluo Development Zone Station of Metro Line 11 are flood-prone stations. These points were input into the dynamic breakdown node algorithm as initial breakdown points.

3.2.2. Node Dynamic Breakdown Process

In this paper, the breakdown process of Wuhan metro nodes in a 100-year flood situation is implemented by MATLAB. There are 200 nodes and 431 edges in the Wuhan Metro network. It takes 146.3 min from the initial inundation of the flood-prone sites to the time when all nodes in the network become flooded. The inundation sequence is shown in Figure 13a.
Figure 13b shows the proportion of breakdown nodes varies with time. At around 20 min, the number of breakdown nodes increased rapidly. Hong Kong Road and Hongtu Boulevard stations, which had the lowest toughness strength, were flooded within 20 min. Additionally, the breakdown rate kept rising, reaching a maximum slope of 0.048 at 40 min. After 40 min, the rate of breakdown nodes gradually decreased. The rate of decline in the number of flooded nodes in the metro network continued to increase over 40 min. Therefore, with limited resources and time, resiliency recovery measures within 40 min could maximize efficiency for preventing more nodes from flooding. Additionally, the higher the efficiency was, the less the economic damage and the sooner passengers would be rescued from the flood.
When T was 0, the toughness strength of the initial breakdown nodes in the metro network was 0. When the flood started to spread to other metro nodes, T was the 283rd second. The duration of the period from 0 to 283 s was relatively short, but it provided valuable time for the emergency to prepare relief supplies and rush to the disaster site.
When T was 20 min, the flooded nodes were distributed in the area around the initial breakdown node. The percentage of breakdown nodes reached 22.5%, and the node breakdown rate was 0.039. During this time, flooding spread rapidly to the surrounding areas and the average toughness of the metro nodes was decreasing.
When T was 40 min, the proportion of breakdown nodes in the metro network rose to 51%. Only 40 min had passed since the initial nodes were flooded, but the number of breakdown nodes had exceeded half of the metro network nodes.
When T was 60 min, the percentage of breakdown nodes in the metro network was already as high as 73%. The lowest toughness strength among the remaining nodes was the Baotong Temple station. This indicates that all key nodes of high importance but low toughness strength would be inundated about 1 h after the floodwater flows into the metro.

3.3. Resilience Assessment of Metro Network

3.3.1. Evaluation of Node Toughness Strength Weights

To calculate the node toughness strength, we first need to acquire the relative weight magnitude of each indicator as Equation (7). We proposed to measure the relative importance of nodes from five categories, the ability to receive floods, the ability to transmit floods, the risk of human casualties, the risk of economic loss, and the significance of the location, and assign an initial weighting ratio to each category. Nodes located in the urban center and suburbs are distinct in economic status and social attributes, and transfer stations bear more responsibility for passenger commuting than other ordinary nodes. If the nodes with high toughness strength are flooded, the loss of the whole network is even heavier. Similarly, prioritizing the critical nodes during rescue will improve rescue efficiency and save resources. The relative importance of each indicator was determined by calculating the contribution of each indicator to the five catalogs. The greater the contribution of the indicator to these five capabilities, the lower the toughness strength of the node. The evaluation outcomes of the relative importance of the six indicators are shown in Table 4. In the table, B j denotes the best indicator.
According to the evaluation index system of node toughness strength, a fuzzy comparison of the advantages and disadvantages of six indexes was carried out. The best index is node degree, and the worst index is closeness centrality. Then, the comparison levels are transformed into fuzzy triangular numbers. Taking the sum of index weights of 1 as a constraint, we established the target program expression according to the above Equations (24)–(26).
The weight of each index is composed of an upper limit value, median value, and lower limit value, which means that the indicator weight is not an exact value but in an interval. To facilitate the calculation, we had to defuzzified the weights. The GMIR approach was adopted to translate the fuzzy weights into exact values. The relative importance of the six indicators is shown in Table 5.

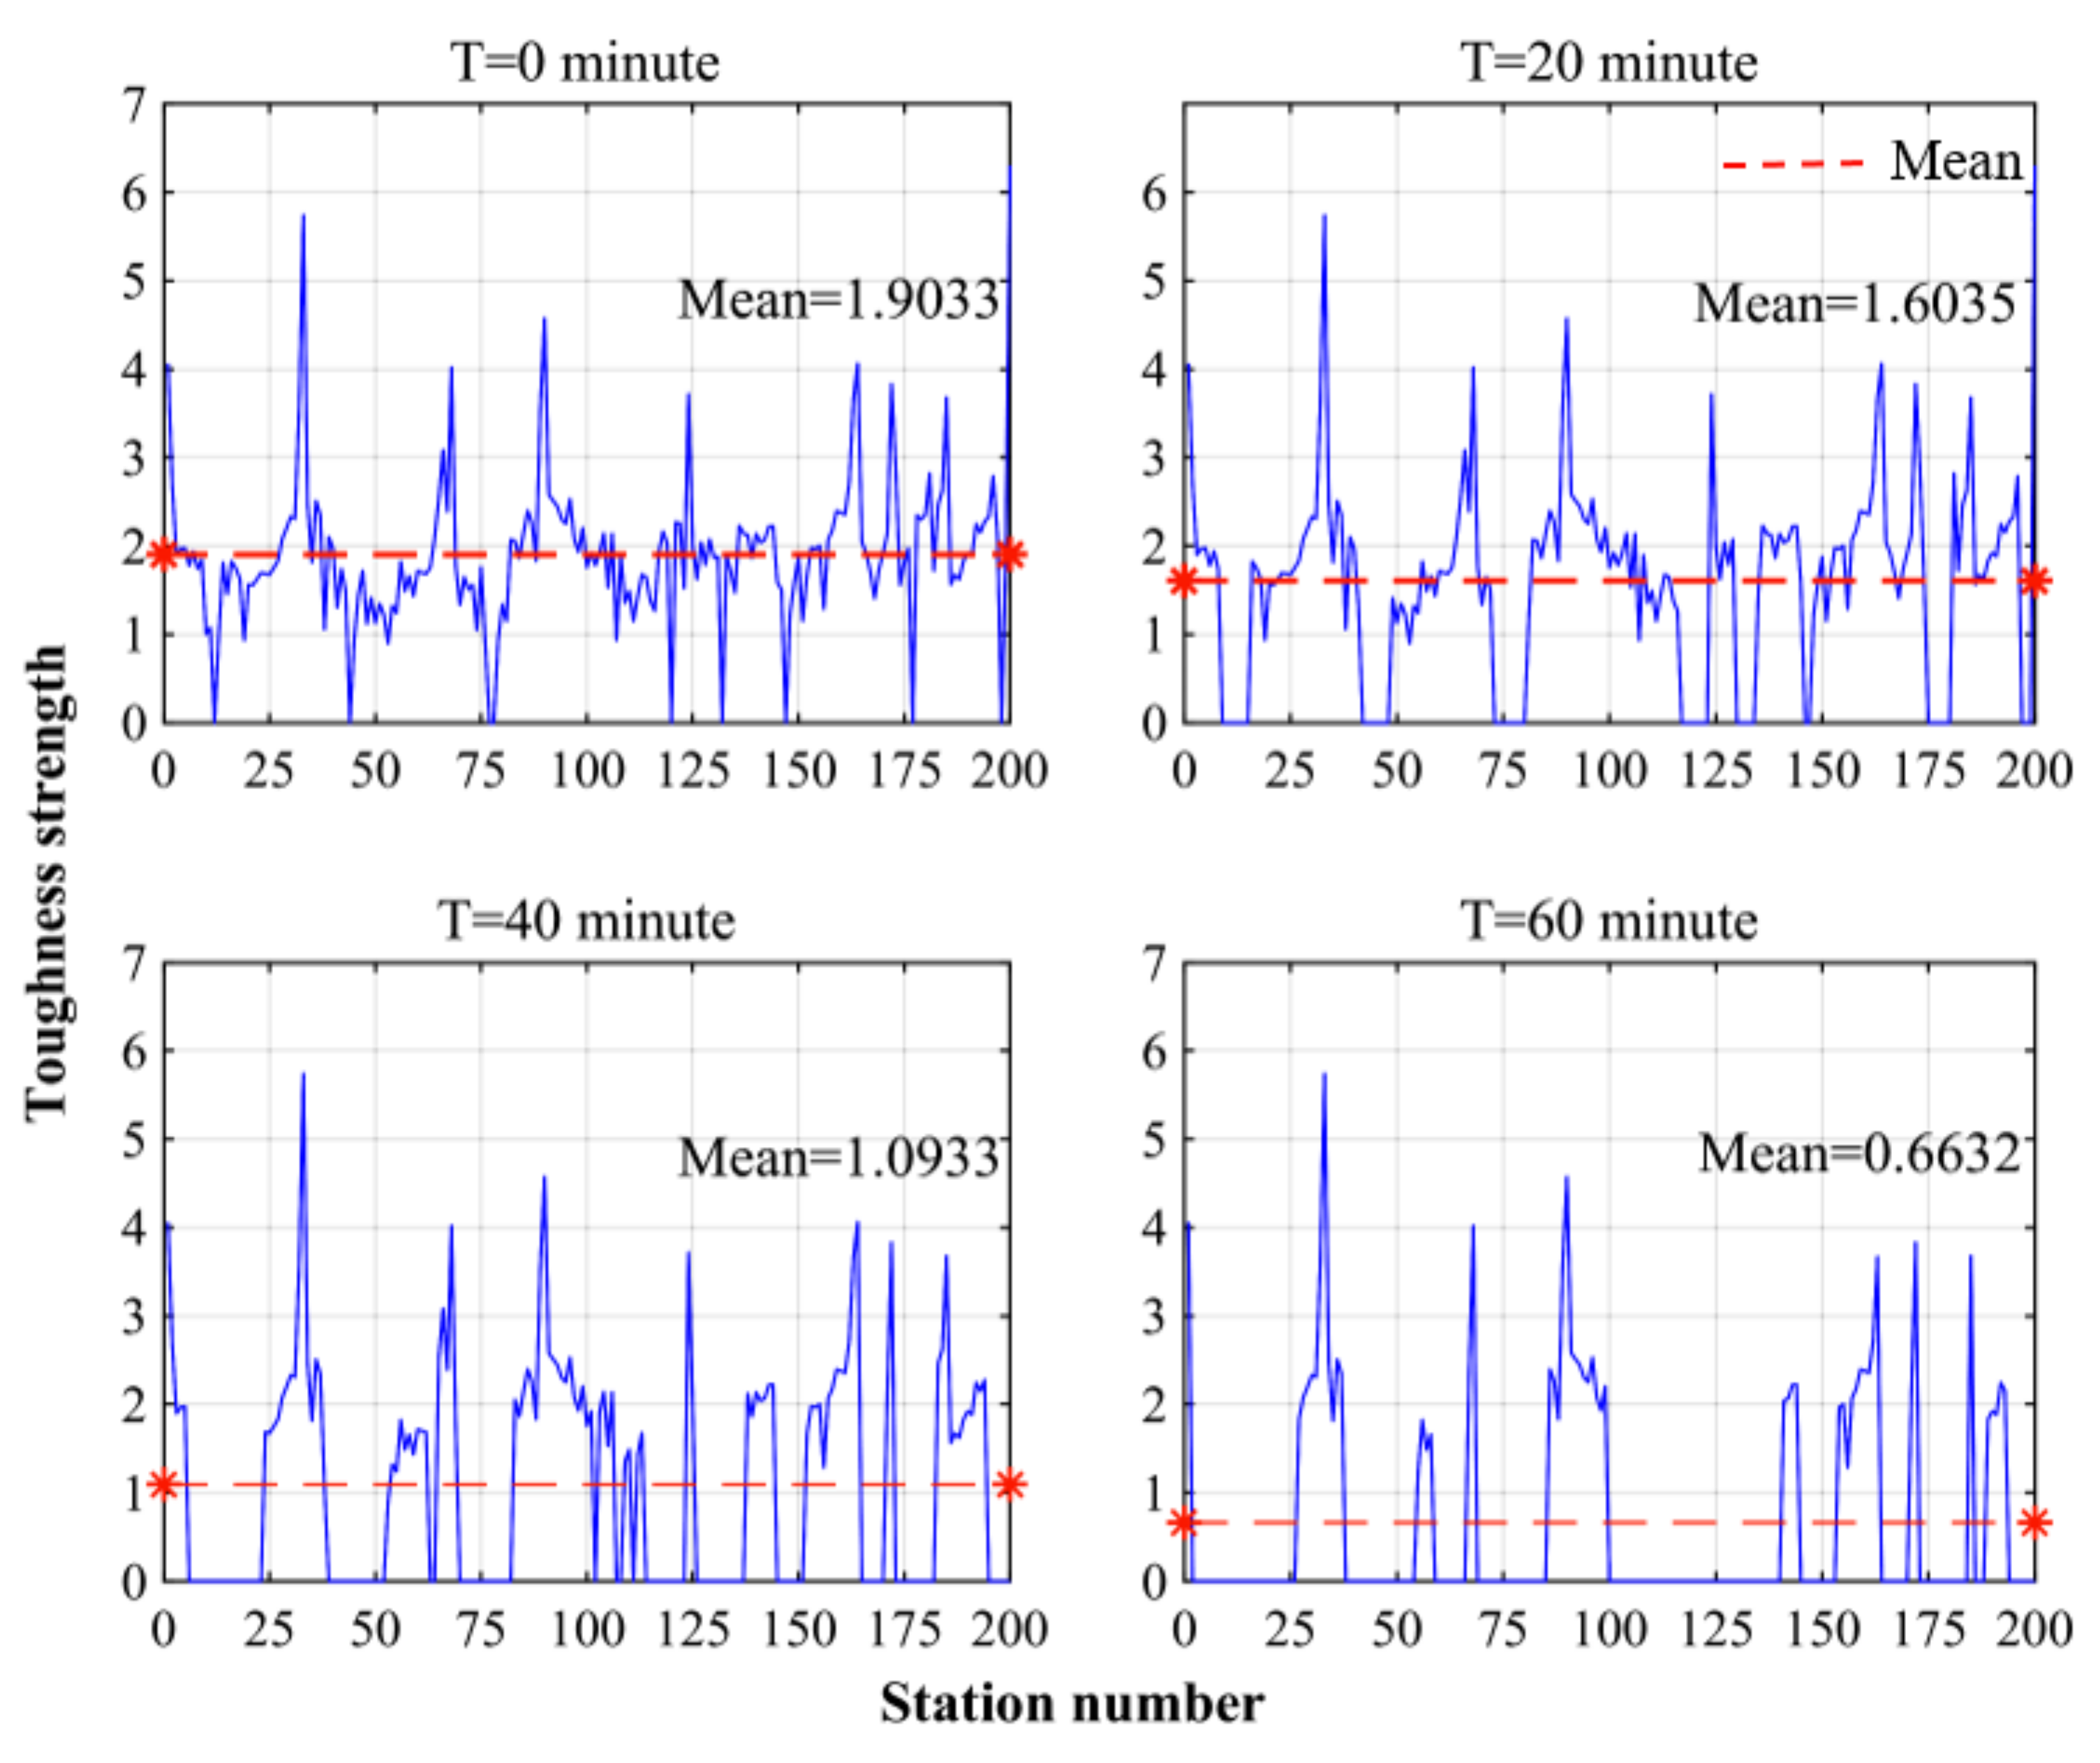
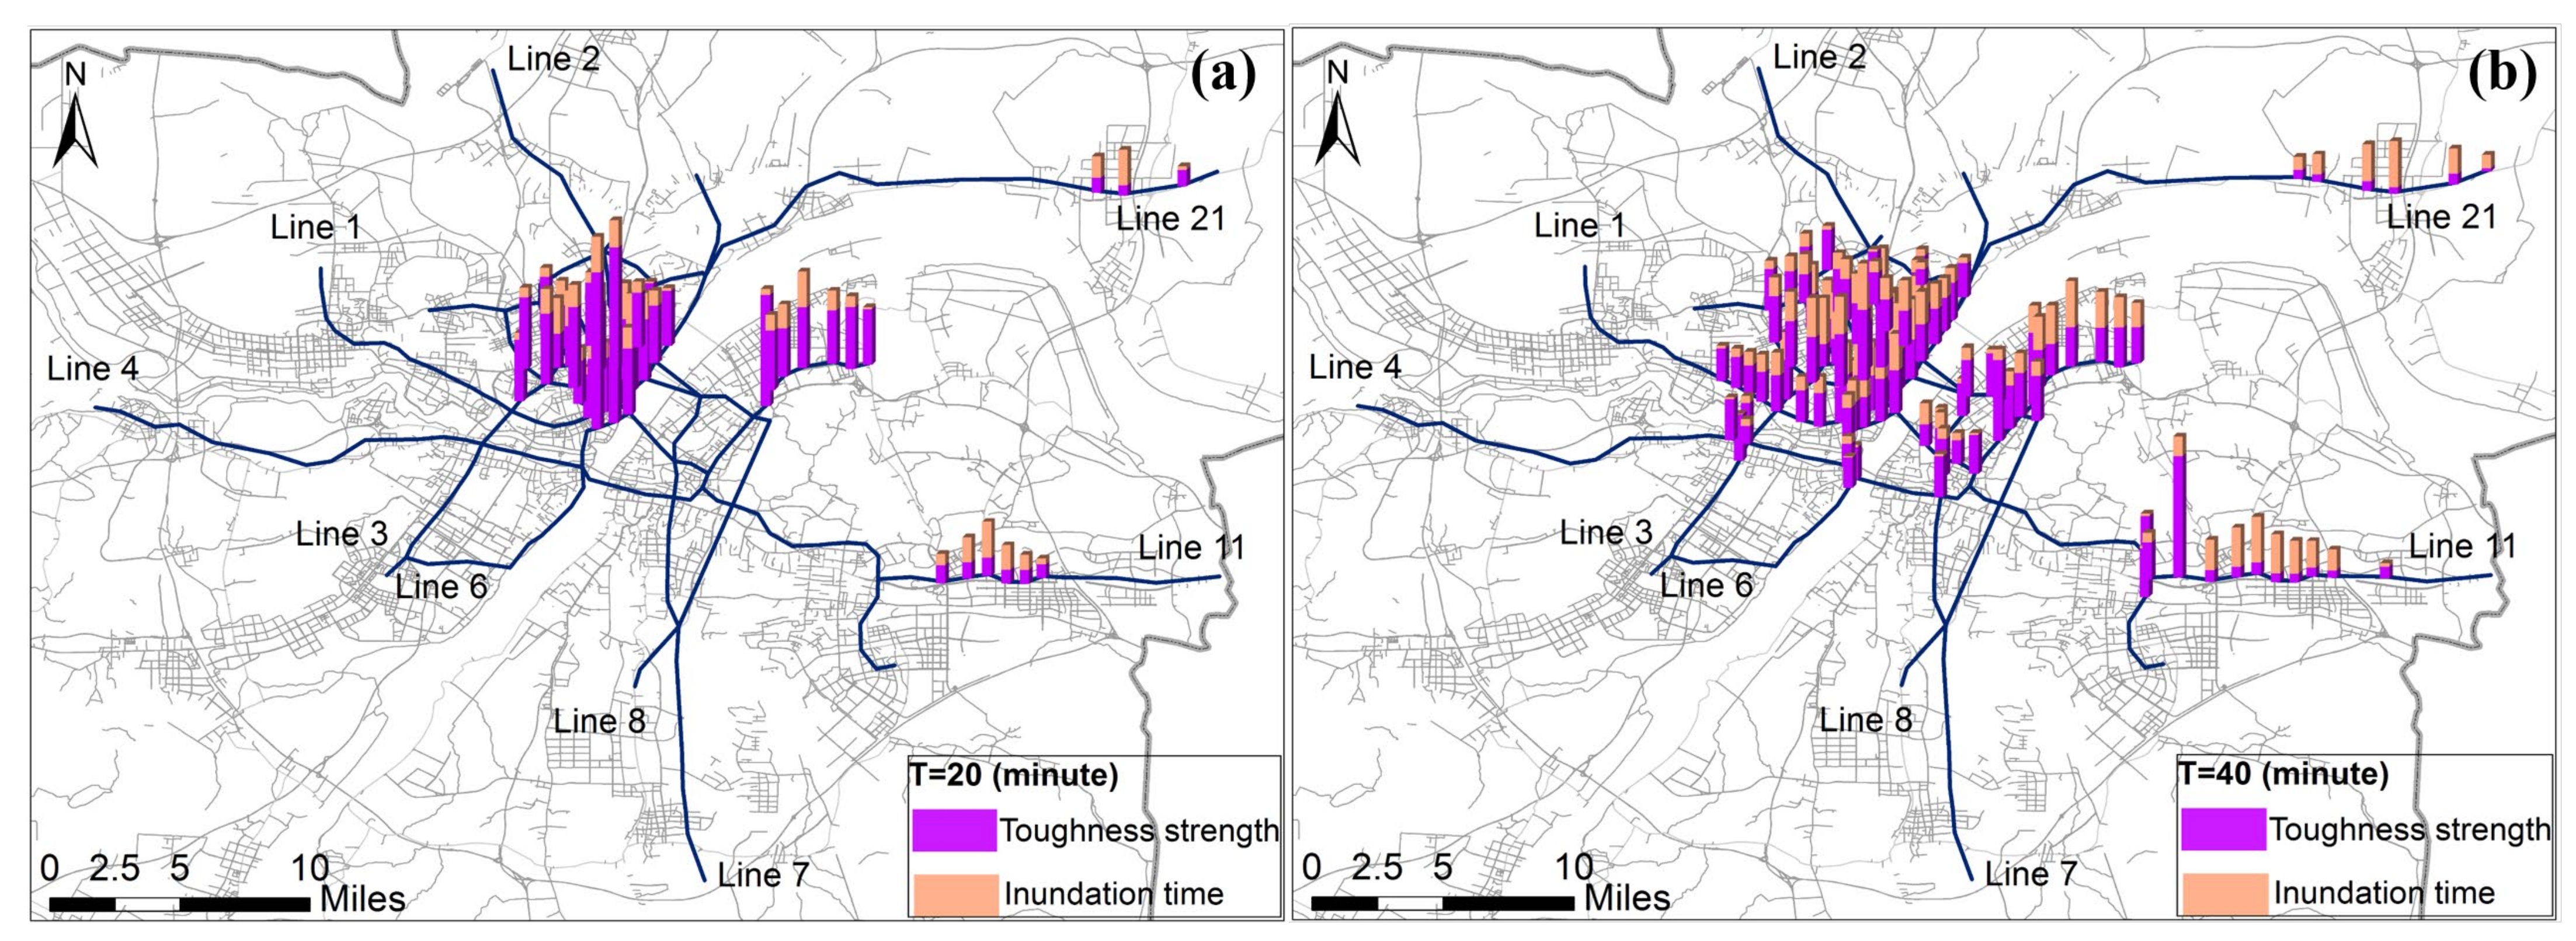
3.3.2. Node Toughness Strength Analysis

By calculating the data in Section 3.2, this paper obtained the node degree, node strength, node betweenness, closeness centrality, passenger flow, and GDP density of each node in the metro network, as shown in the figures below.
Figure 14a,b show that Hong Kong Road (junction of subway line 3, line 6, and line 7) has the greatest node degree and node strength, for it has the largest number of connected nodes. In Figure 14c, most metro nodes on Line 2 are at a high level of node betweenness, followed by interchange nodes connecting multiple lines. As shown in Figure 14d, the common denominator of nodes with high closeness centrality is the geographic location as the center of the network. The reason is that these nodes located at the central part of the network have a short average distance from other nodes. Similarly, in Figure 14e,f, passenger traffic and GDP density vary with geographic location. Then, the toughness strength of the nodes could be obtained by multiplying the node characteristics of each node with the corresponding weight.
As can be seen in Figure 15, the average node toughness strength of the network was 1.9033 at the time of 0 min, after removing the nine nodes that had flooded. At 20 min, the average nodal toughness strength was 1.6035. During these 20 min, the nodes that flooded were those around the initial flooded node, and the common characteristic of these nodes was that they had a low toughness strength. This indicates that nodes with low toughness strength fail before nodes with high toughness strength. The average node toughness strength was 1.0933 at 40 min and 0.6632 at 60 min. During this period, the average node toughness strength decreased at an accelerated rate. The reason was that the nodes with high toughness strength are failing with time. The correspondence between metro station names and numbers is shown in Appendix A.

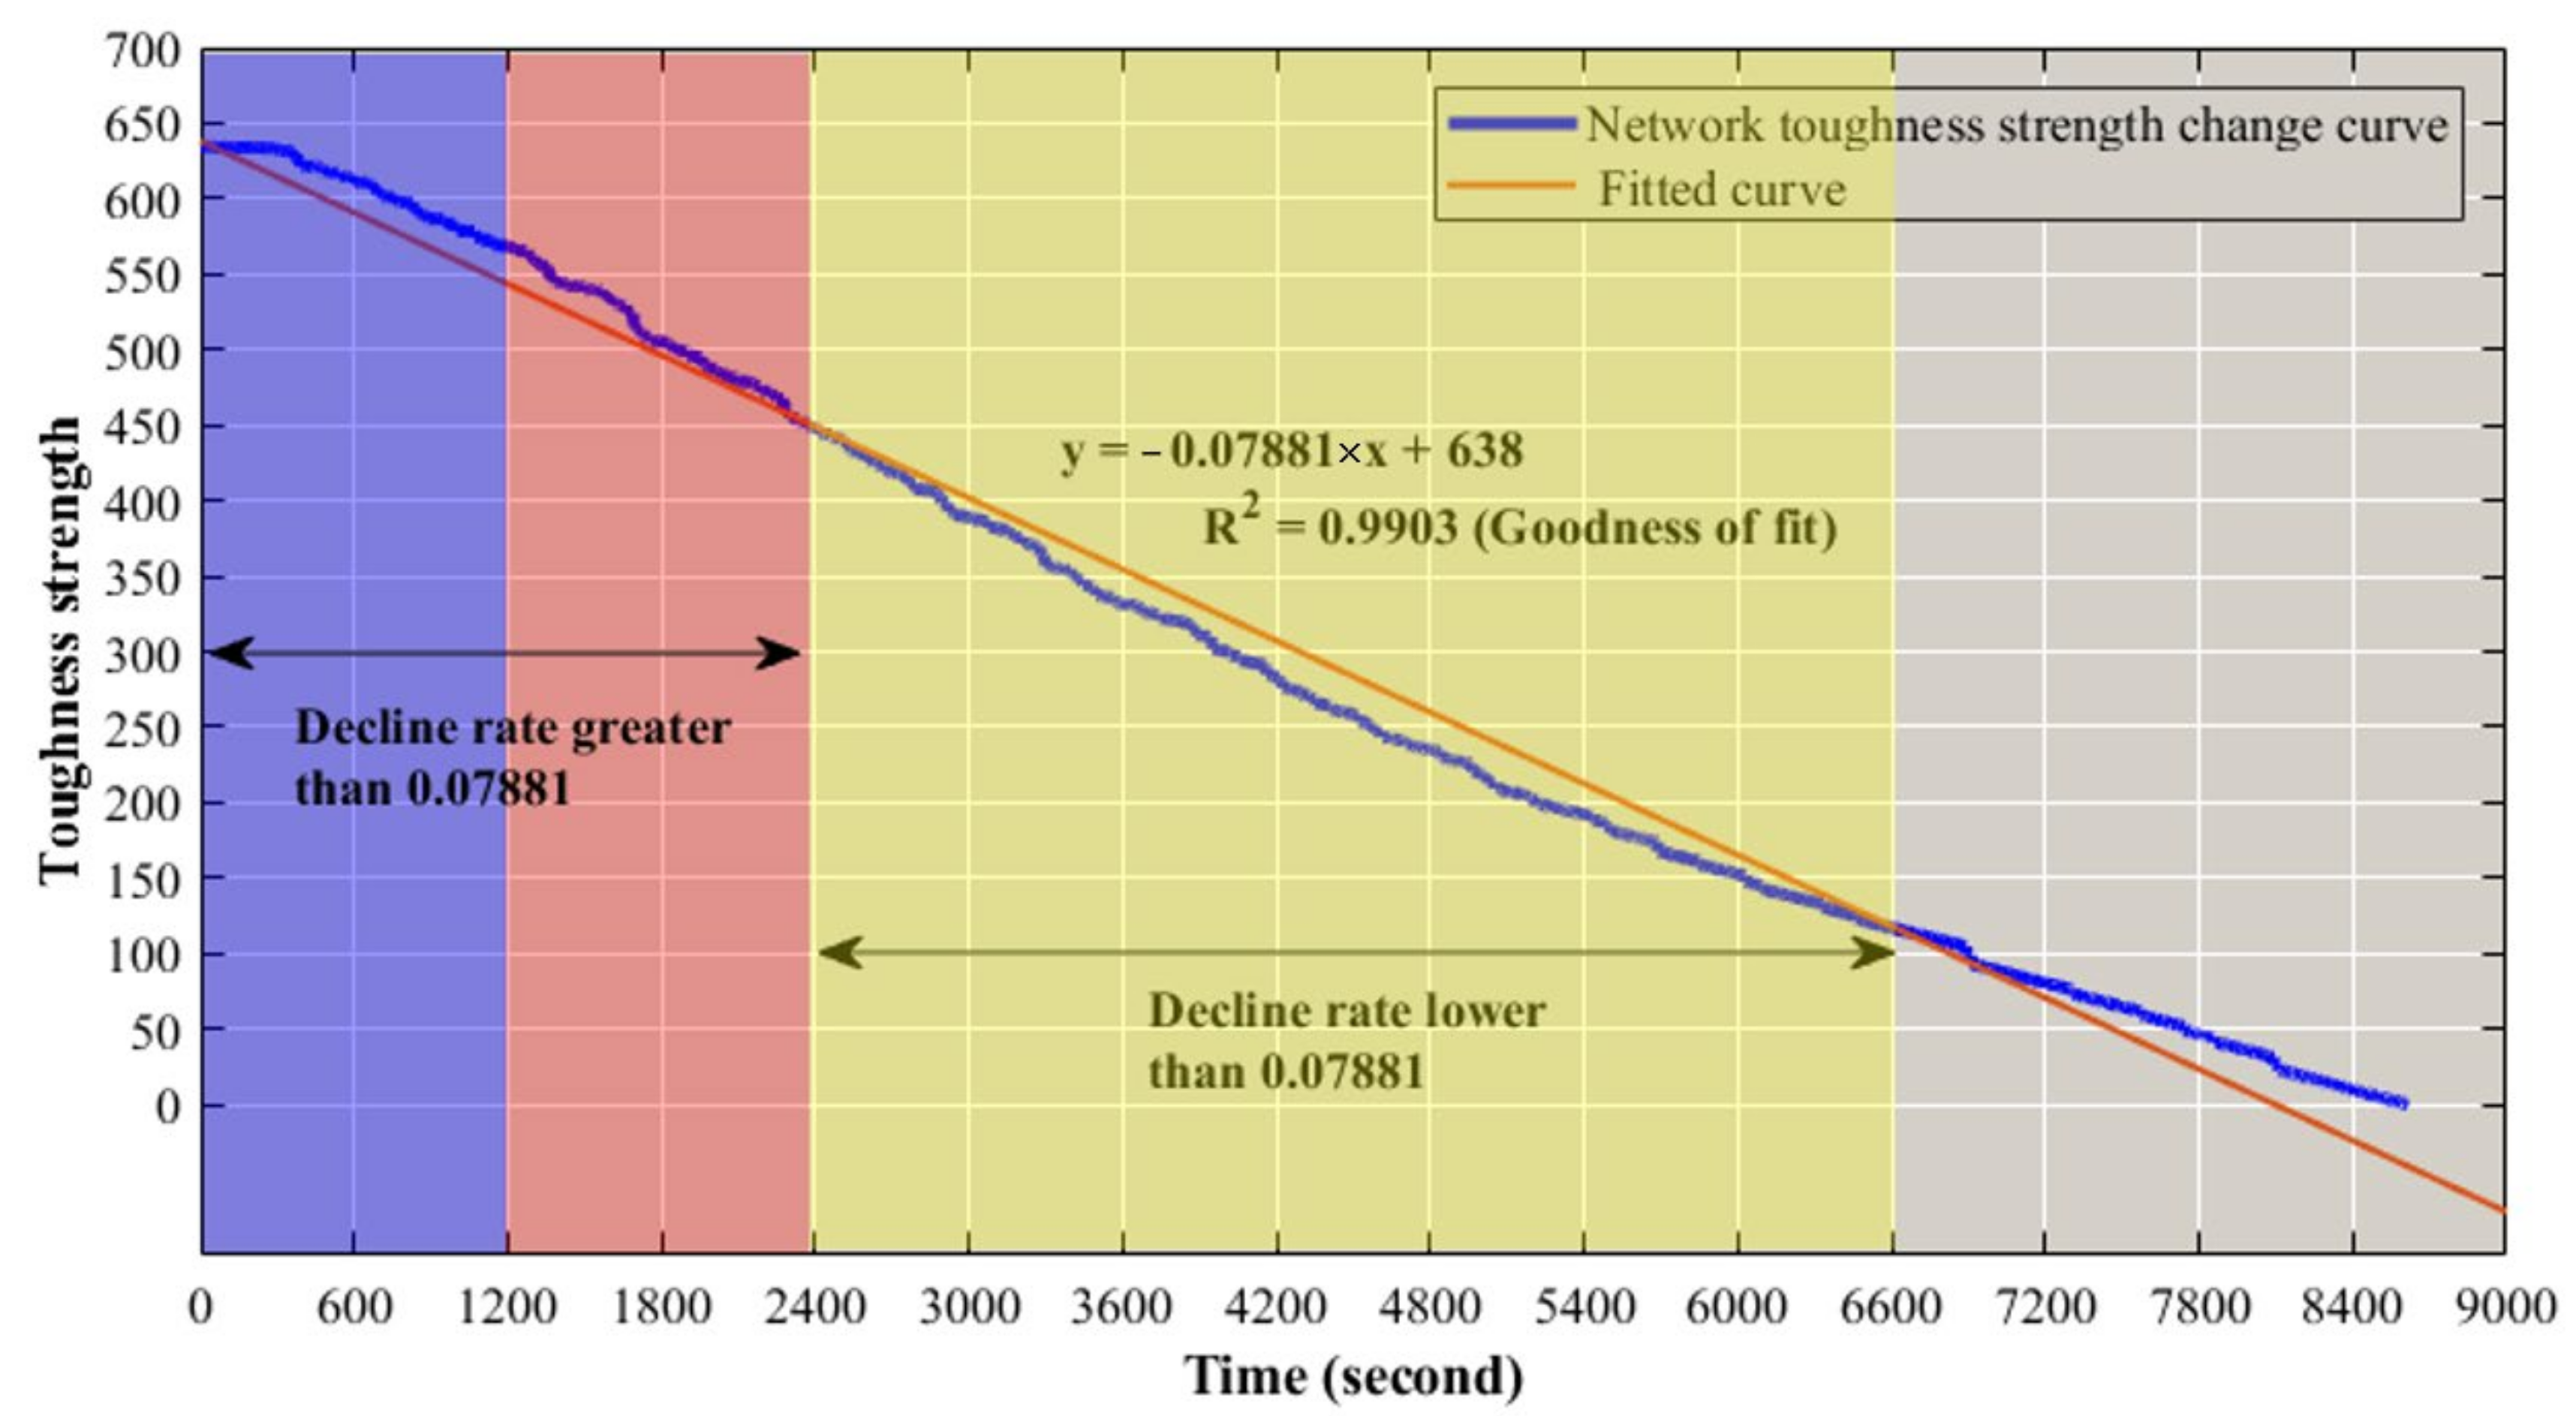
3.3.3. Toughness Strength Analysis of Network

The average node toughness strength reflects the relationship between the number of nodes and the node toughness strength, but the effect of inundation time is not considered. For the whole metro network, the longer the nodes were flooded, the lower the toughness strength of the network could be. Therefore, when calculating the network toughness strength, we considered the inundation time as a factor affecting the network toughness strength. The two metrics of node inundation time and toughness strength for 20 and 40 min were visualized by GIS, as shown in Figure 16. It can be seen from the figure that the nodes with lower toughness strength were flooded for a longer time.
Figure 17 shows the variation of the network toughness strength curve. We fitted it using a linear function to better describe the downward trend of the network. The decreasing trend of the network toughness strength was higher than the absolute value of the slope of the fitted curve within 40 min. Despite the low toughness strength of the nodes that flooded during this time, the proximity between the nodes resulted in a high number of flooded nodes. The decreasing trend of network toughness strength was also higher than the absolute value of the slope of the fitted curve after the metro was flooded for 1 h and 50 min. The number of flooded nodes is low during this time, but the flooded nodes possess a high toughness strength. This also accounted for the higher absolute value of the slope.

3.3.4. Organization Recovery Capacity Evaluation

The decreasing trend of network toughness strength was greater in 40 min than in the other times. We could reasonably assume that a rescue within forty minutes has the highest efficiency. According to the optimal rescue time, emergency response within 40 min after the metro flooded is considered effective. We used the emergency response coverage of the police and fire departments as a criterion for the organizational resilience of the metro network. This paper took 20 min and 40 min as examples to carry out GIS buffer analysis to determine the scope of emergency response service. The 20 min and 40 min emergency coverage of police offices and fire stations were visualized through GIS, as shown in Figure 18 and Figure 19.
Figure 18 shows the rescue range of police offices at 20 min and 40 min. When T is 20 min, the coverage rate of the police station to the breakdown nodes reaches 89.29%, and six metro stations were not covered. However, only three of the flooded nodes were not covered by the emergency services within 40 min, and the coverage rate reached 97.58%.
Figure 19 shows the rescue range of the fire stations at 20 min and 40 min. When T is 20 min, the coverage rate of the fire stations to the breakdown nodes is 89.29%. When T is 40 min, the coverage rate of the fire station reaches 94.64%. It could be seen from the figure that when T is 20 min, three metro stations are not covered. When T is 40 min, the three previously inundation nodes are still not covered, but the coverage rate reaches 94.64%.
It can be seen from Figure 18 and Figure 19 that the organization recovery capacity of the metro network increases gradually with time by evaluating the rescue range of the two emergency departments. However, the network toughness strength is decreasing at the same moment. To maximize the resilience of the entire metro network, an emergency response within 40 min is of the highest significance. The reason is that in the event of a flooding attack on the metro network, the emergency response within 40 min can cover more than 90% of the flooded metro stations.

3.4. Resilience Enhancement Discussion of Metro Network

  • Improve node toughness strength
Low-lying spots are prone to water accumulation, but conveniently neglected is that local low-lying sites are more susceptible to the effects of flooding, even though they are located on relatively high terrain overall. The existence of elevation differences between nodes is also a fundamental reason for the susceptibility of nodes to flooding when performing subsurface flood simulations. The lowest points of the subway stations should be as consistent as possible. Excessive height differences may lead to the rapid spread of flooding.
The six node characteristics are inversely proportional to the toughness strength of the nodes. The greater the number of nodes connected to the node, the more central the location, and the higher the GDP density and traffic flow, which will lead to a lower toughness strength and vulnerability of the node. These six characteristics should be balanced in order to reduce the gap between the toughness strengths of nodes throughout the network. However, this is difficult in actual practice. The location of the node determines the GDP density and traffic flow and inevitably connects multiple nodes due to having a high location advantage.
2.
Determine the priority of rescue and evacuation nodes
Before the metro is flooded, as in the Zhengzhou metro incident, rainfall must have exceeded the local flood warning line. After crossing the warning line, the emergency department has to arrange the deployment of materials, equipment and rescue teams, also called “preparation time”. If this period is not considered, relief efforts will miss the golden rescue time and face severe casualties and economic losses. However, even if the emergency department has preparation time, rescue time is still not enough since many metro nodes have been flooded, and the remaining nodes are being flooded. Thus, a reasonable and efficient rescue strategy is still a problem that we need to focus on due to limited resources and time. The rescue of flooded nodes has been considered in this paper, but the evacuation of non-flooded nodes has not been studied. Additionally, the evacuation of unflooded nodes has an improvement on the organizational recovery capacity of the metro network. Meanwhile, the prioritization of rescue and evacuation is also an important tool to enhance the resilience of the metro network in the face of limited resources.
The longer the flooding inundates the metro, the greater the threat to the lives of trapped passengers. In the case of limited rescue resources, the rescue force should prioritize the nodes that have been flooded for a long time. Additionally, the metro node’s six characteristics reflect the combined significance of network topology characteristics, passenger flow, and economic density. To rescue efficiently, the characteristics of the nodes should be considered when implementing the rescue. The breakdown of the metro network at 20 min and 40 min is a critical time for implementing rescue.
The passenger flow in mega-city metros reaches 10,000 people every day. As floodwaters spread rapidly and irreversibly when they flow into the subway, crowd evacuation needs to be implemented urgently at the subway nodes without flooding. Consideration should be paid to the toughness strength of nodes and the characteristics of neighboring nodes while deciding on the priority evacuation nodes, as shown in Figure 20. Nodes with low toughness strength are less able to resist flooding, so the crowd at these nodes should be evacuated first.

4. Conclusions

In the context of global warming and accelerated urbanization, pluvial flood seriously threatens the safe operation of the urban metro. This paper proposed an urban metro node inundation risk evaluation approach based on a simplified dynamic metro complex network, grid shallow water dynamics model, and FBWM risk evaluation method. Wuhan Metro was selected as the study site to estimate the flood risk and emergency response capability during the 100-year flood return period. The conclusions are summarized as follows:
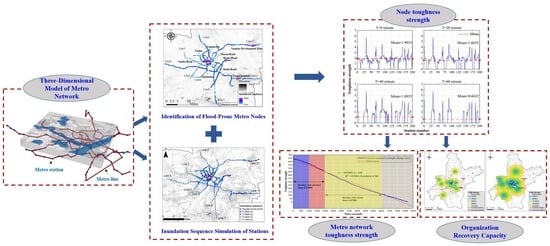
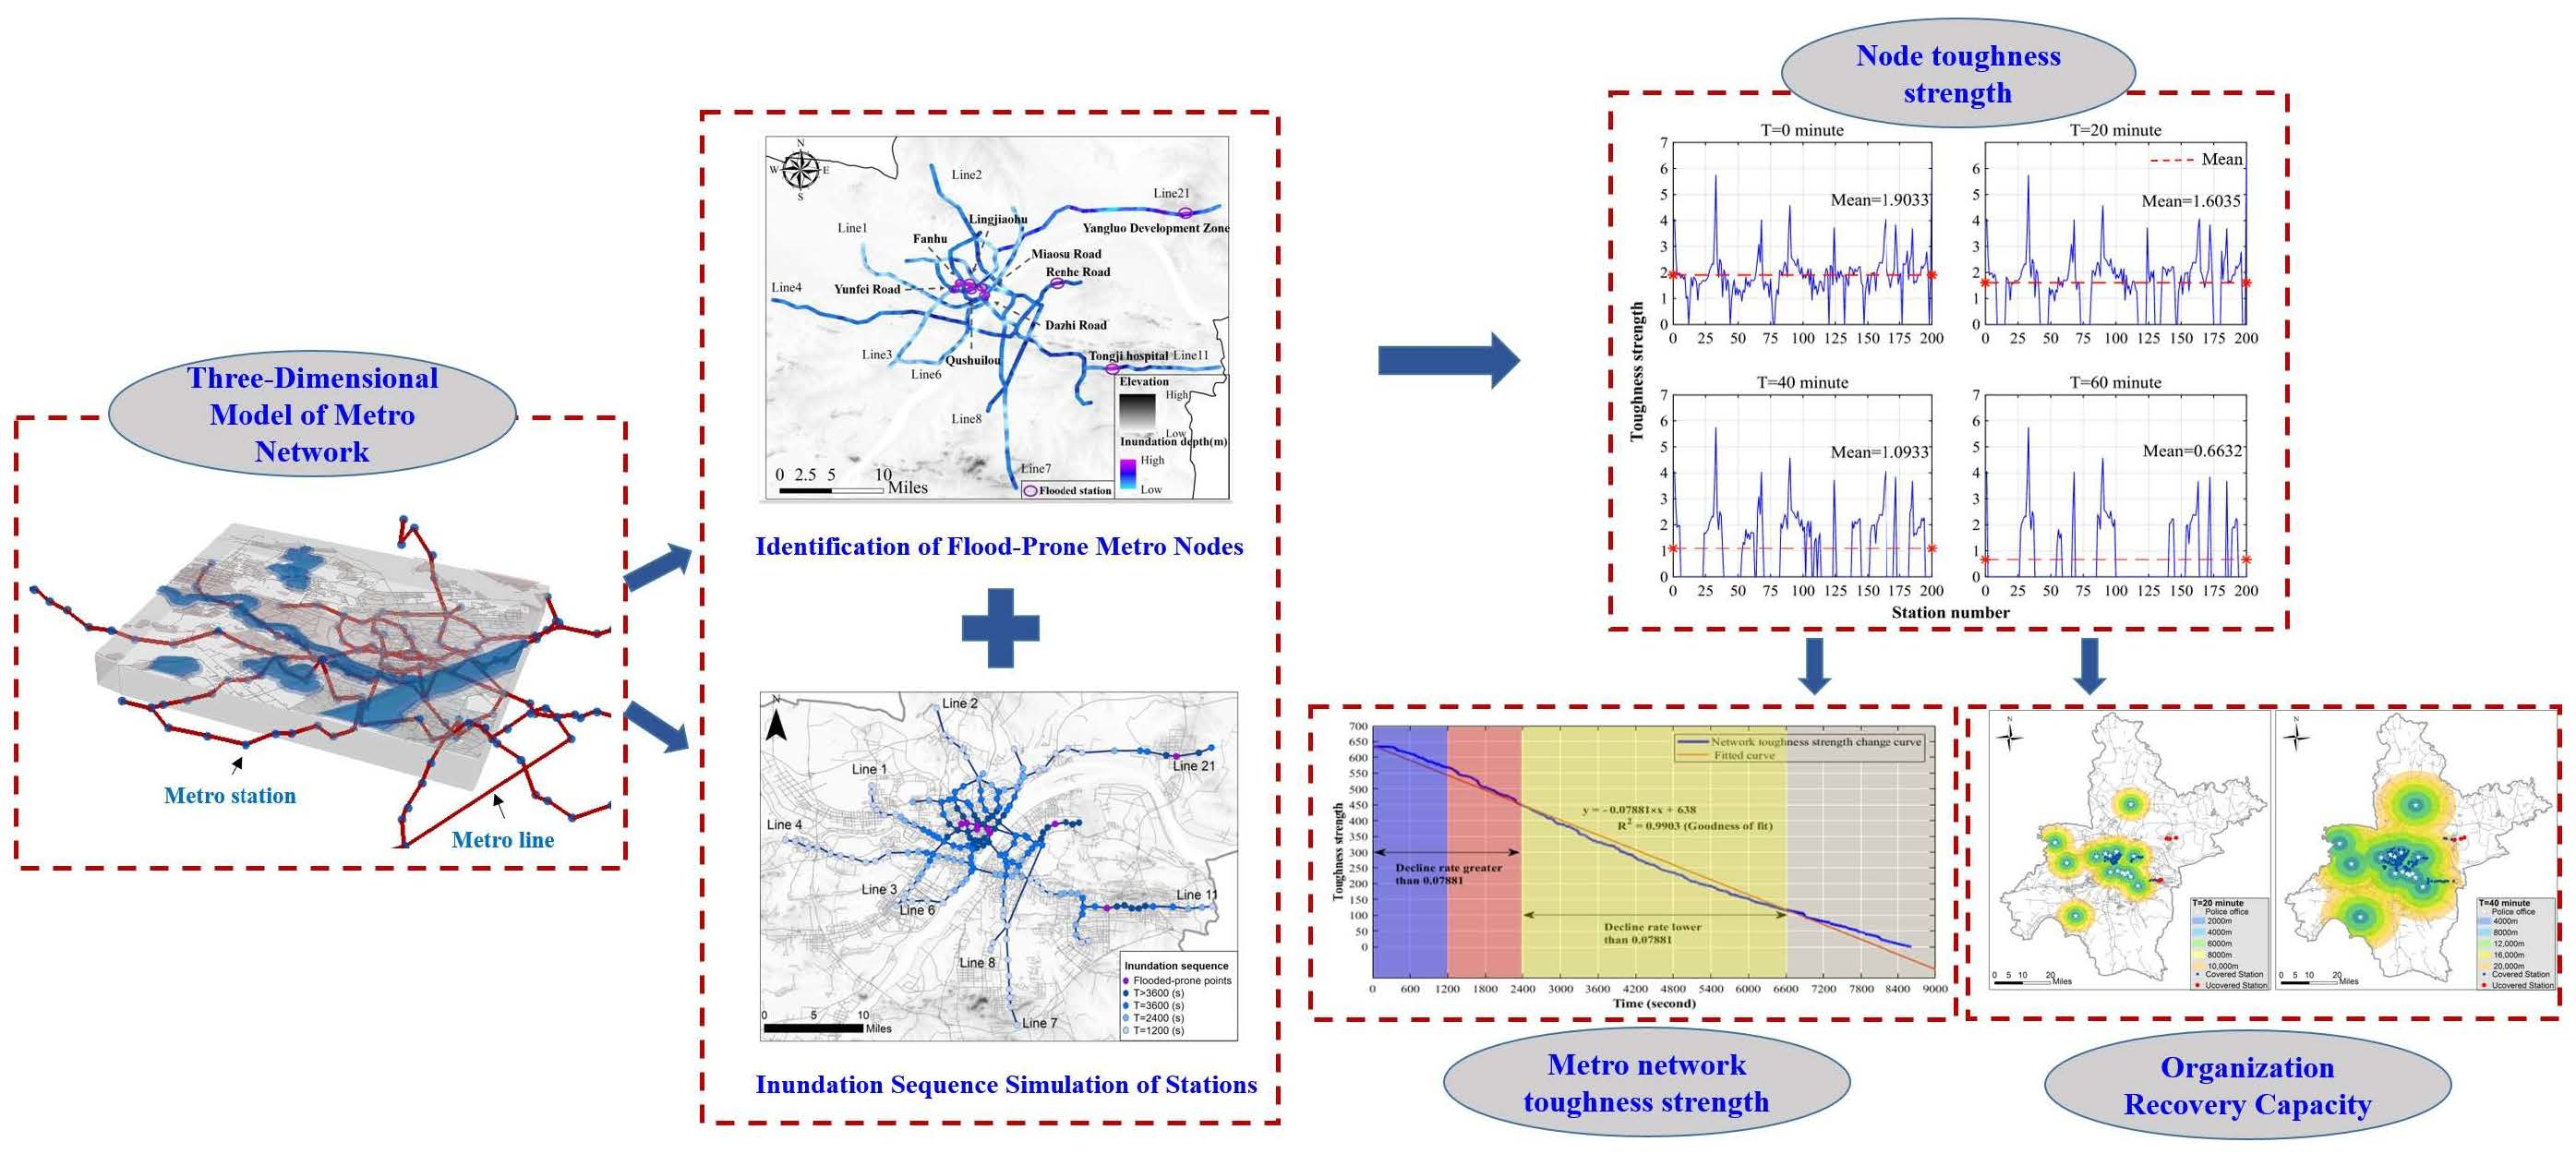
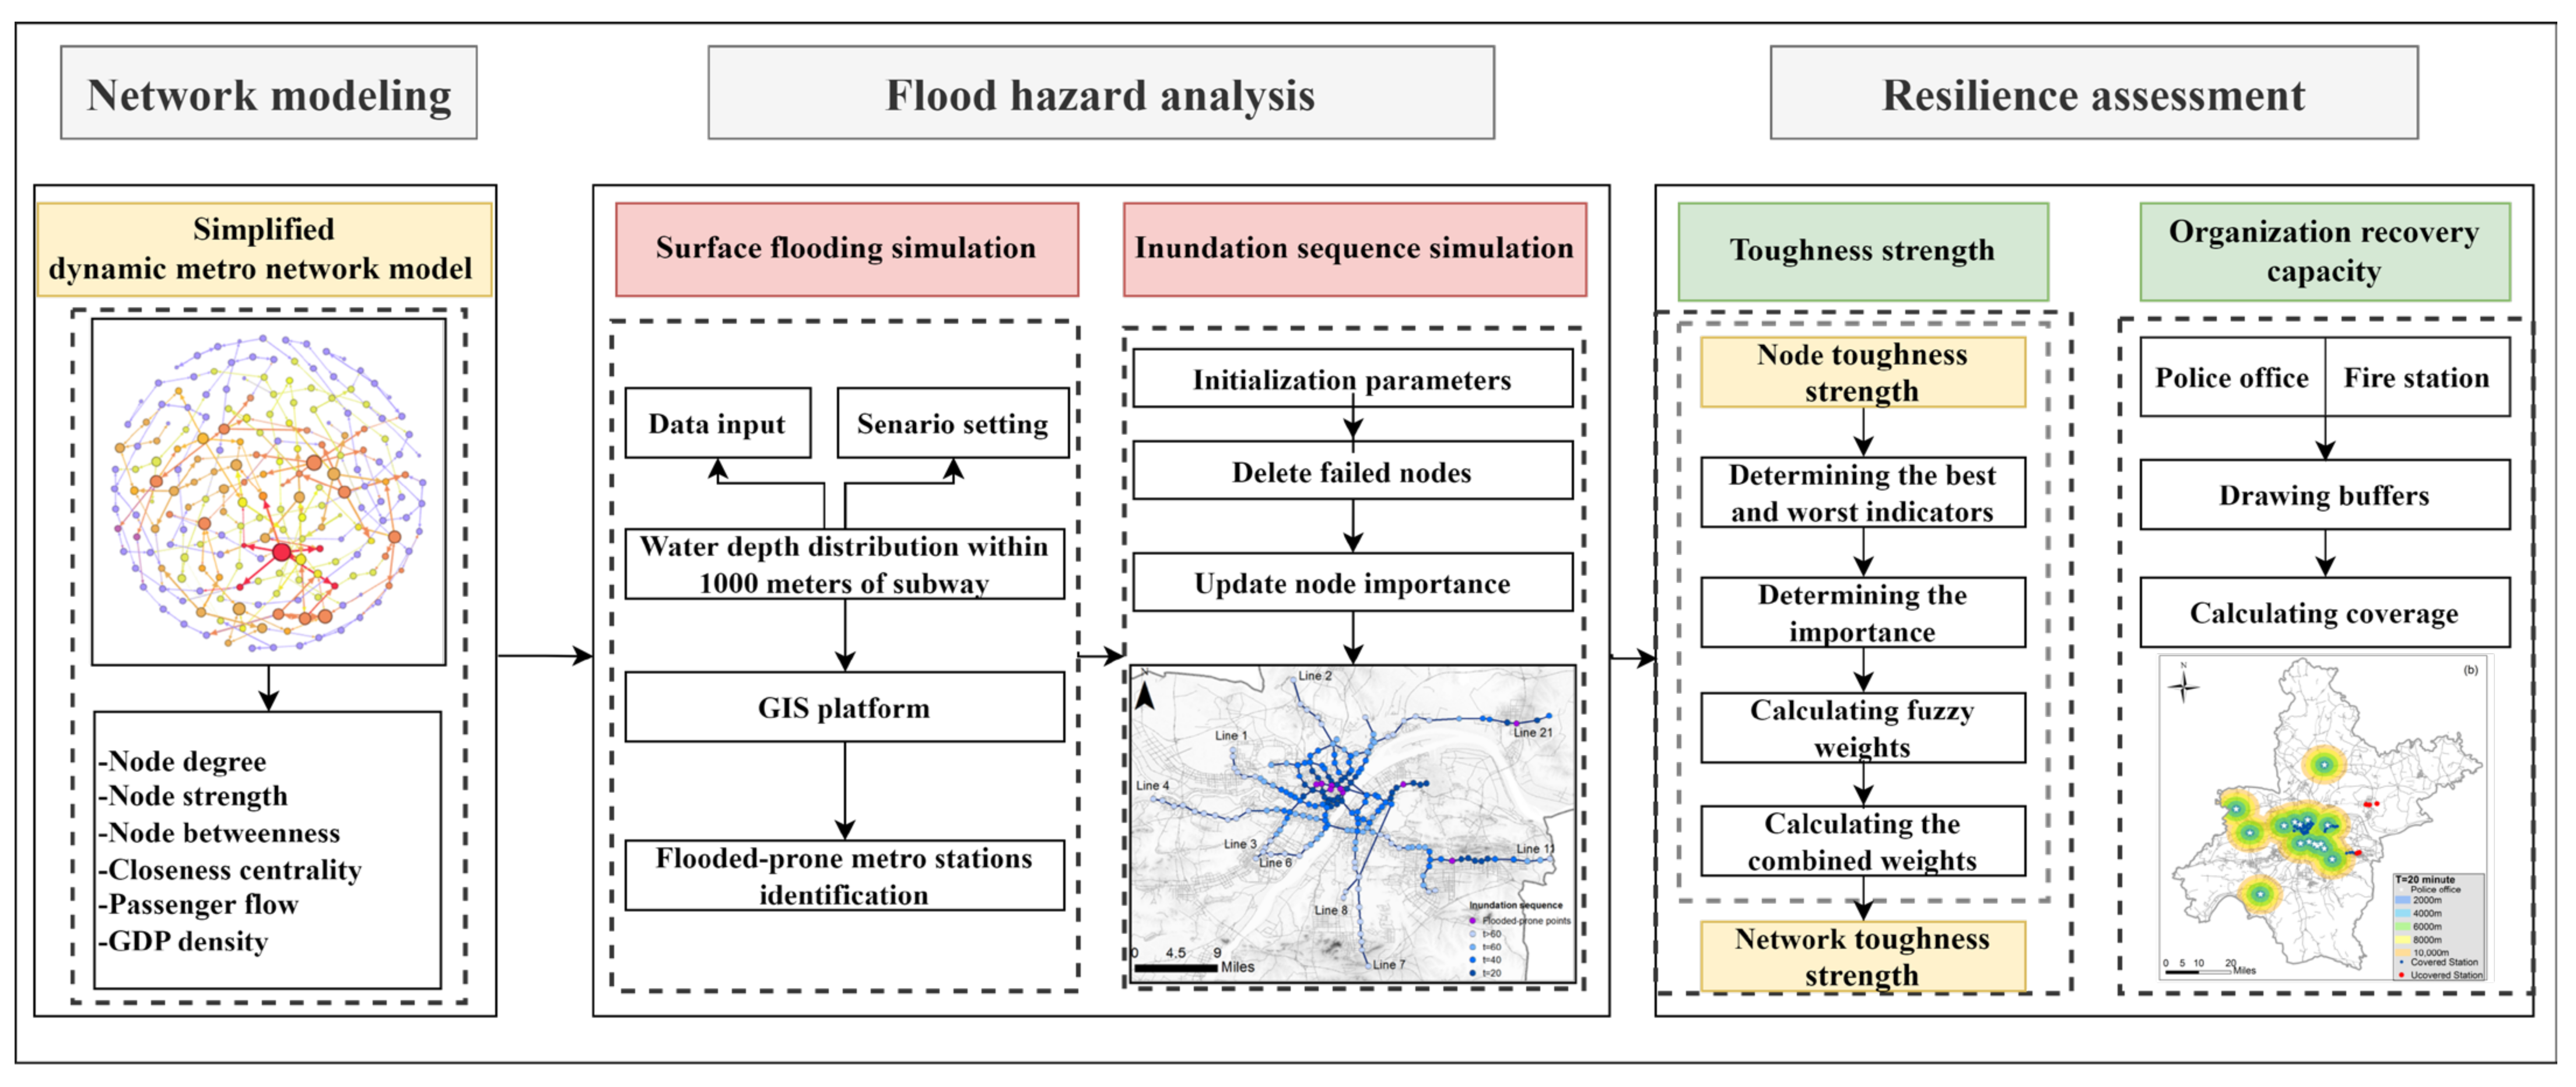
  • The article establishes a simplified three-dimensional model of a complex metro network by topological methods while considering the slope directions between stations. The simplified dynamic network of metro nodes combines the topological characteristics of the metro system with the features of flood evolution. This paper presents research on urban metro flood risk from regional metro network resilience.
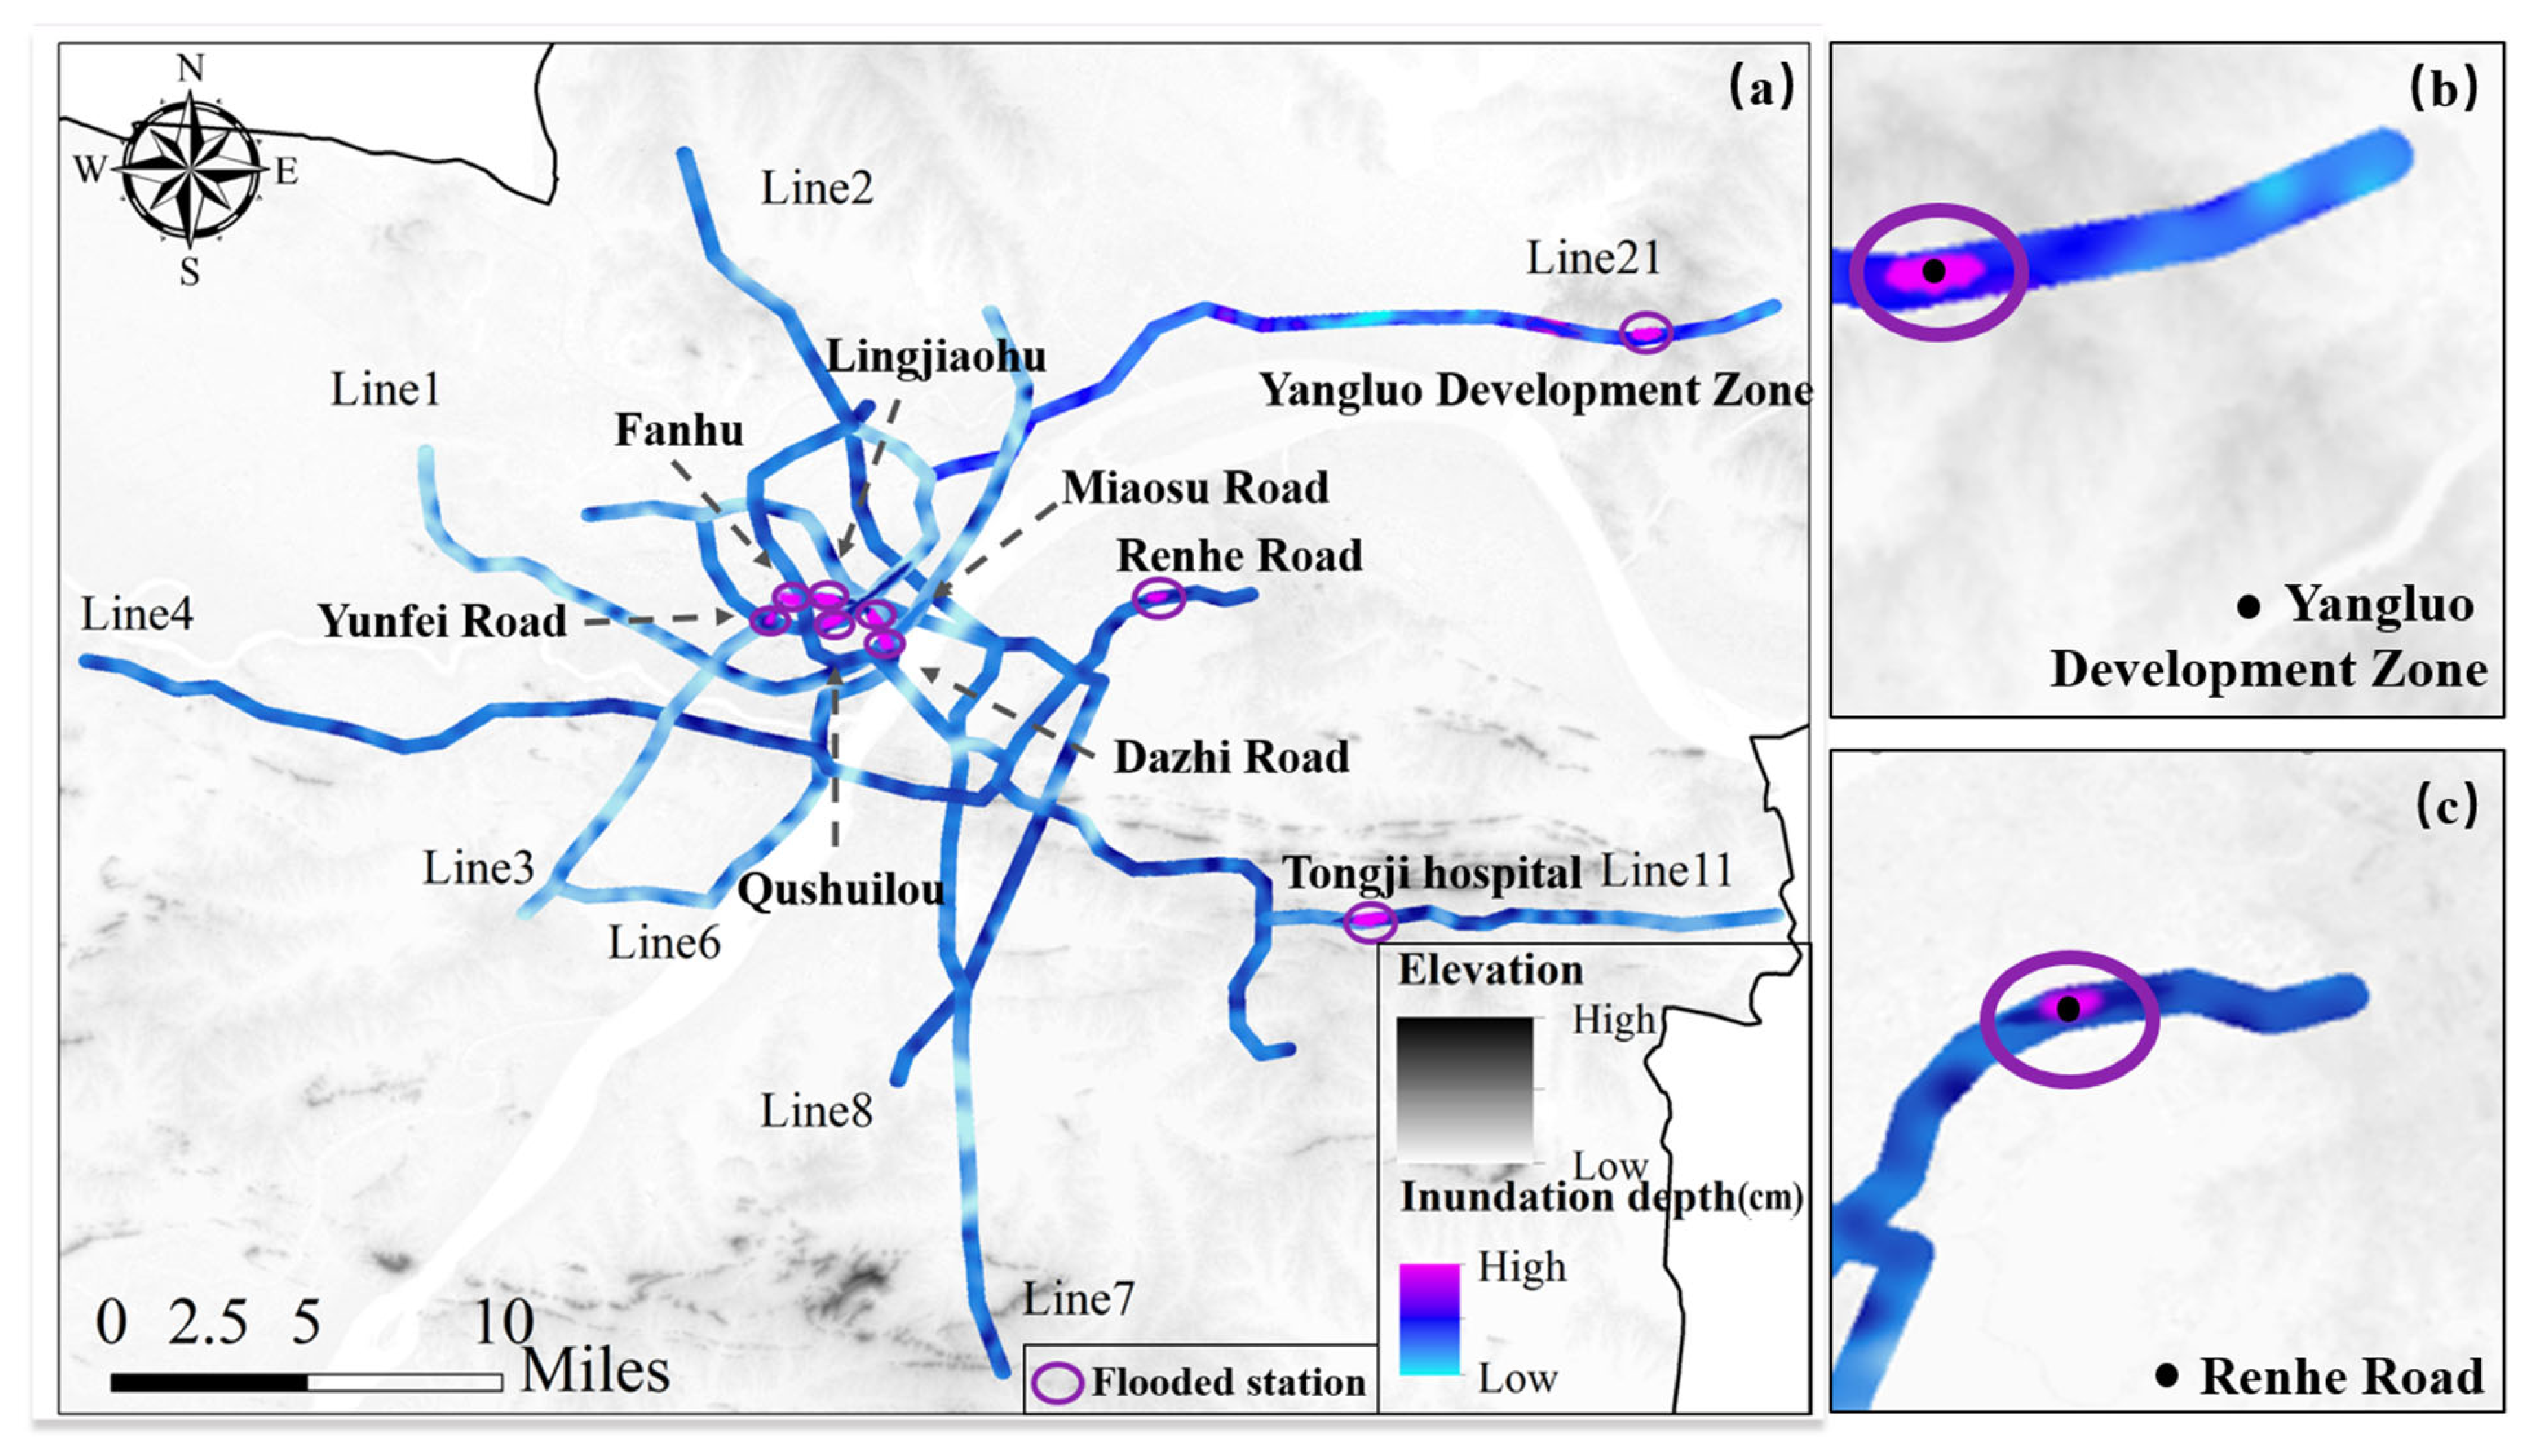
  • The grid hydrodynamic is modeled to fully utilize high-precision DEM data for inundation prediction without preprocessing and meshing, significantly reducing processing time. This alternative model provides comparable results to conventional software for regional maximum flood extent, depth, and inundation duration. The grid hydrodynamic model perfectly identified the surface flood-prone points in this paper.
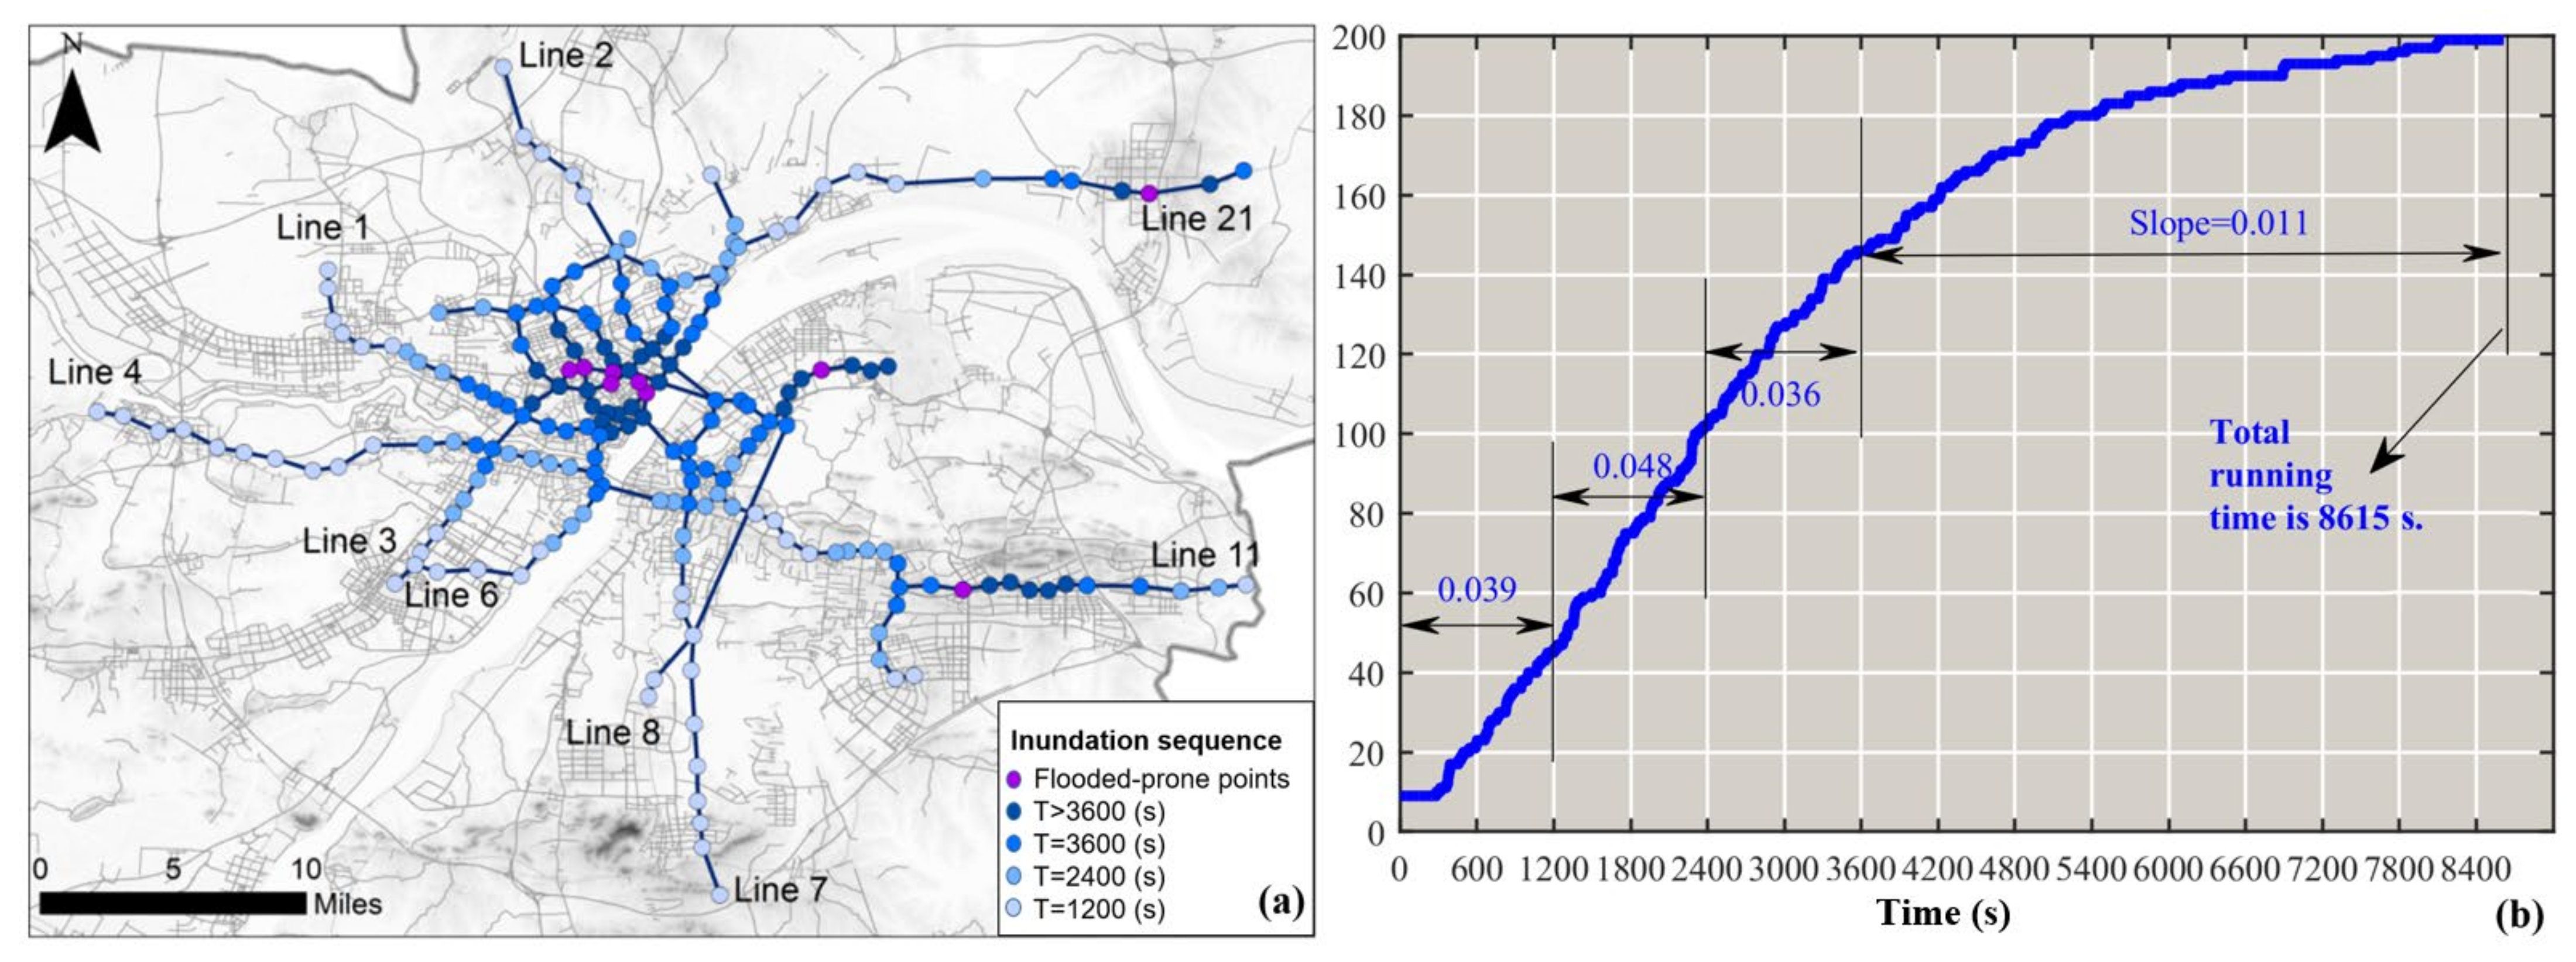
  • The dynamic node breakdown algorithm was developed to obtain the subsurface flooding node sequence by inputting the node adjacency matrix and the distance between nodes. The principle of the algorithm is easy to understand. The calculation results are accurate and conform to the law of flood dispersion. The dynamic node breakdown algorithm finally obtains the whole metro network flooded process and the change of node toughness strength.
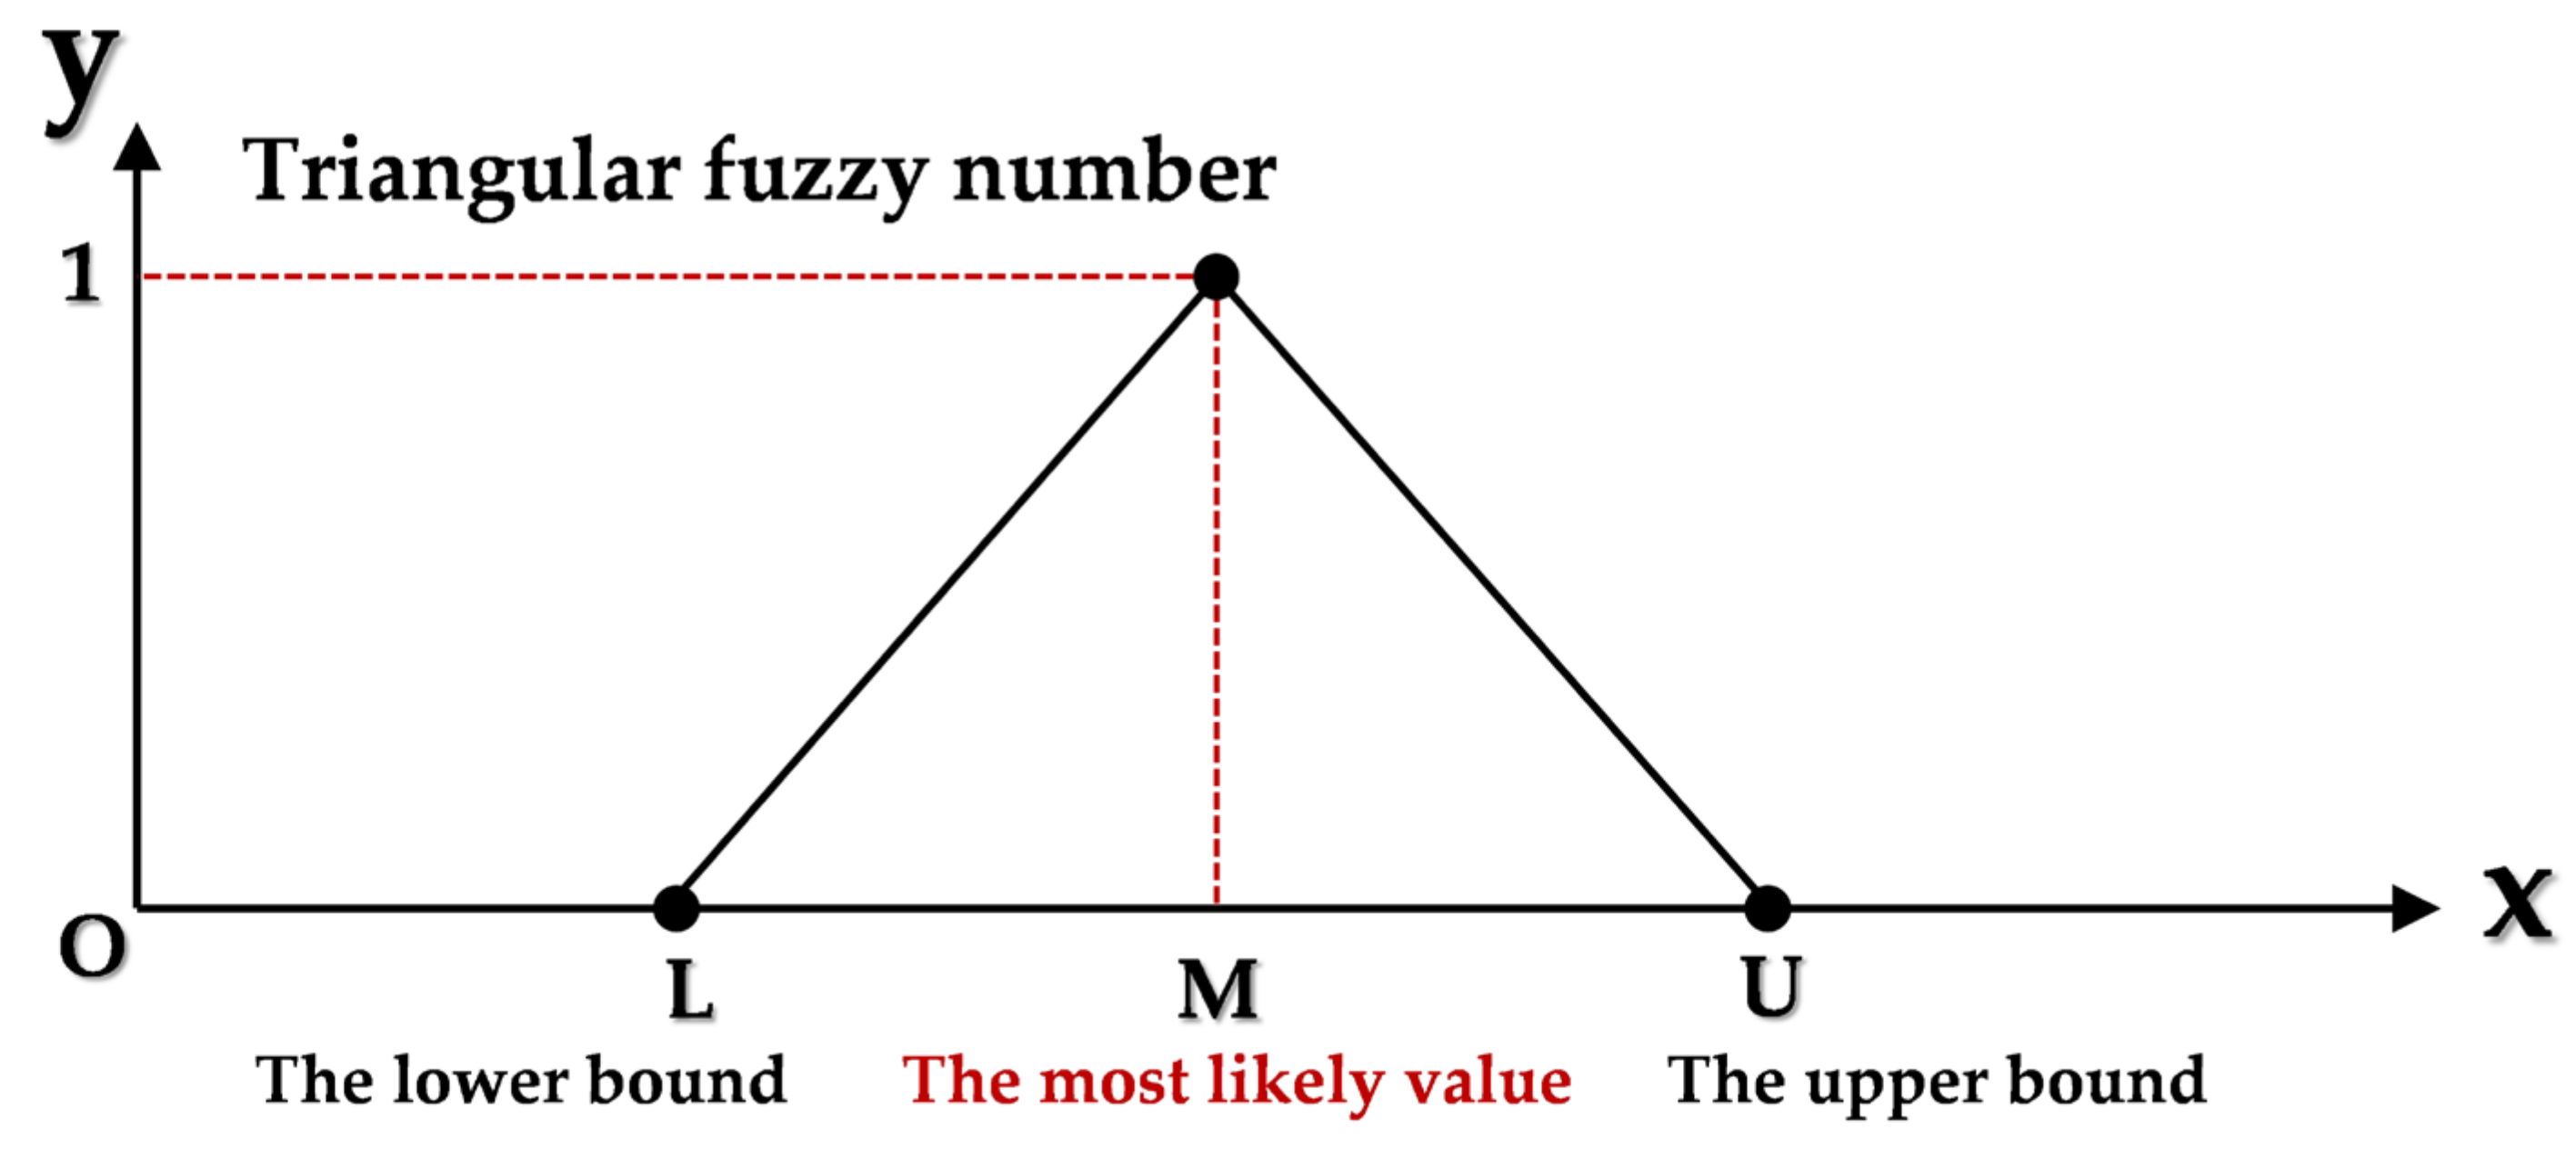
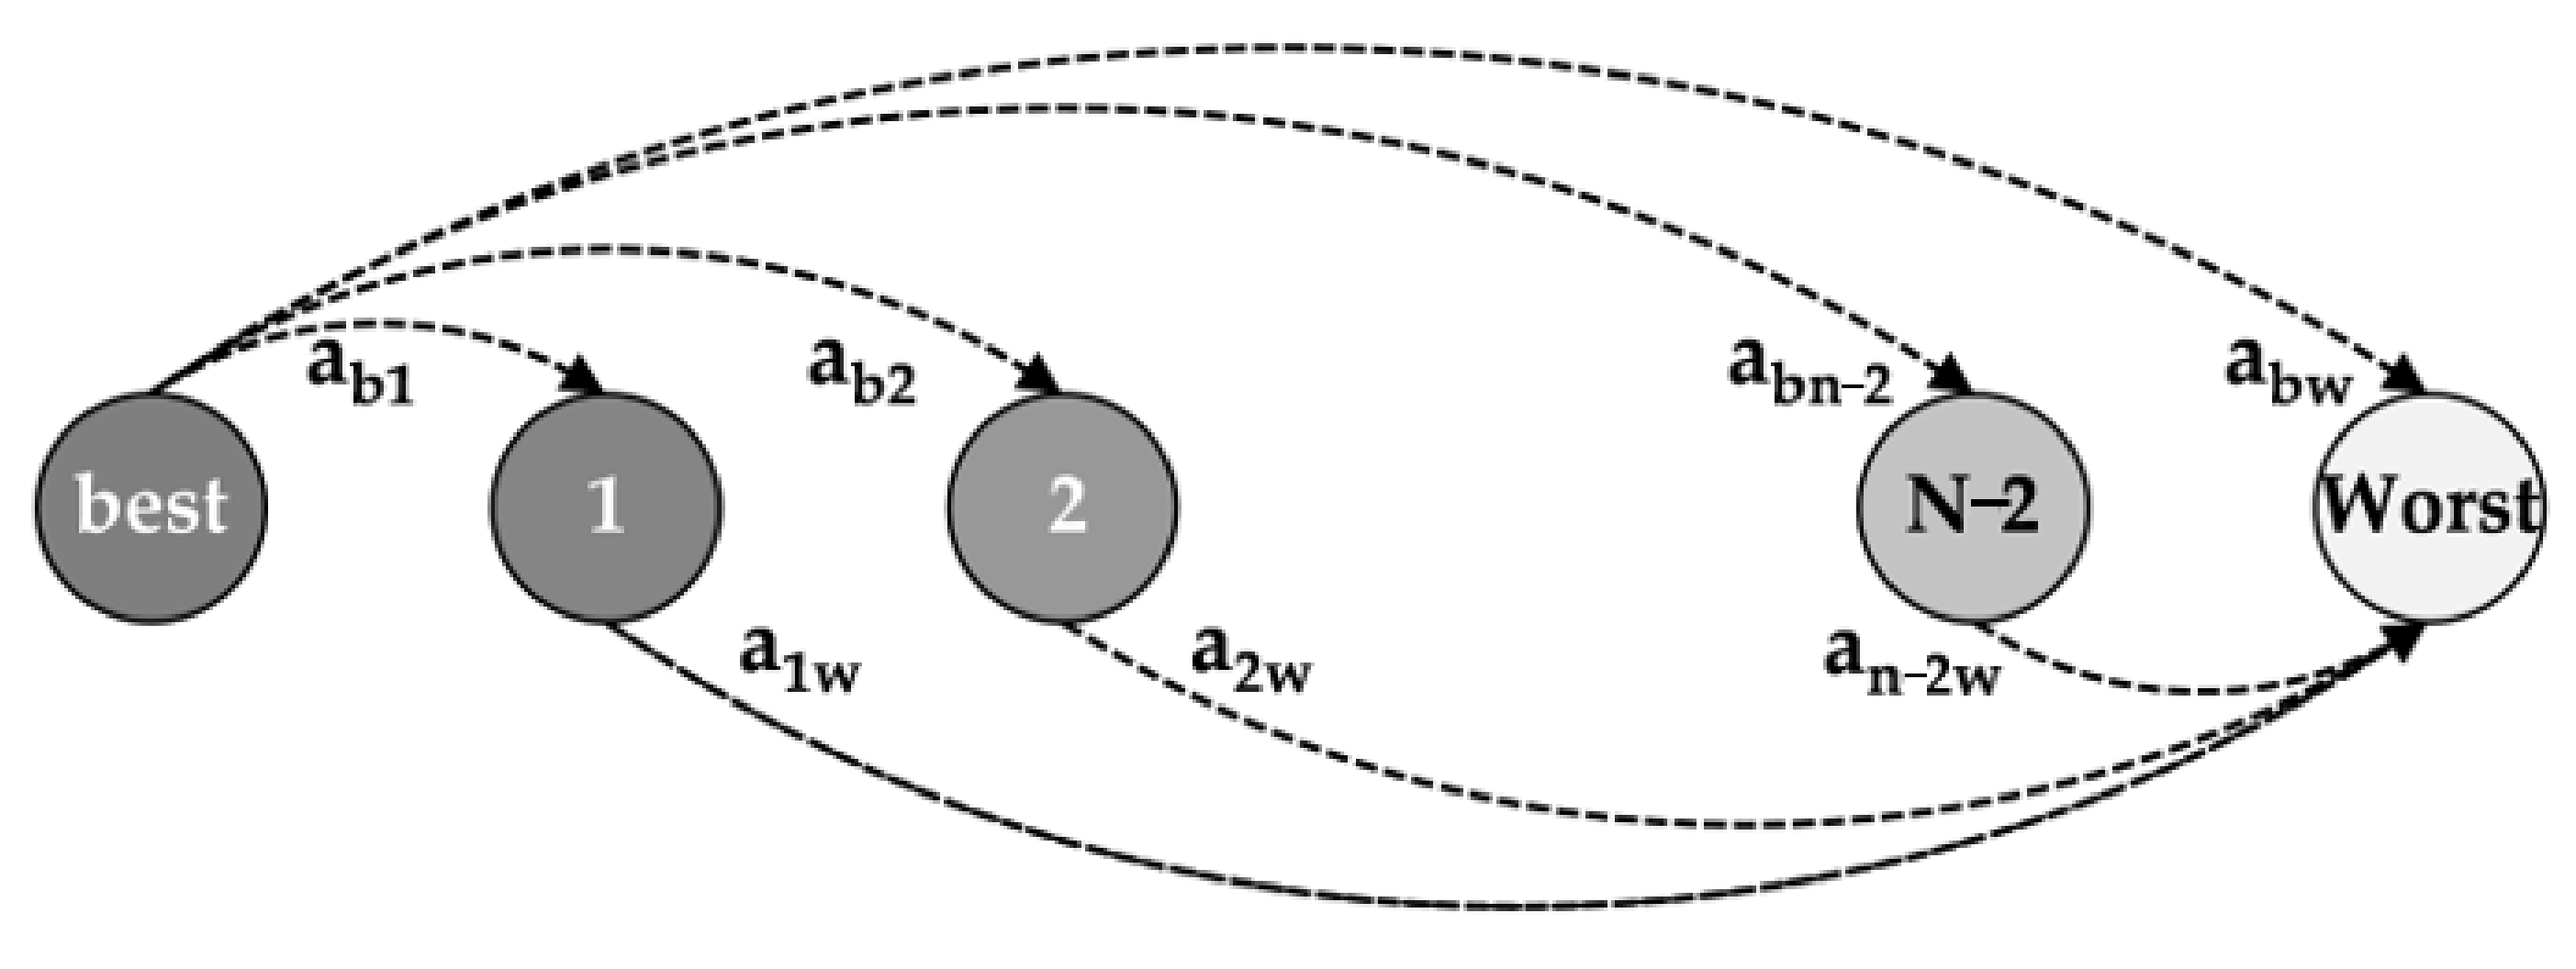
  • The node toughness strength was estimated by combining the natural and social attributes of the nodes through the FBWM method. As a newer multi-criteria decision-making method, FBWM optimizes the minimum error by nonlinear programming equations and preserves the fuzzy information using fuzzy triangular numbers.
  • Based on the above conclusions, the resilience of the Wuhan metro network was assessed. The rate of decline in the toughness strength of the metro network is higher than 0.079 and is maximum within the first 40 min. Organization recovery capacity during this period could reach 94.64%, achieving the rescue of most flooded nodes. In response to the evaluated resilience results, this paper proposes a resilience enhancement proposal based on improving the node toughness strength and determining the priority of rescue and evacuation nodes.
There are still some inadequacies in this paper. Some indicators were calculated with approximate estimation methods, not relying on accurate and realistic data. For instance, the calculation of road accessibility, considering the limitation of this paper, has not considered road connectivity and inundation of flooding as well as potential congestion caused by traffic, which needs to be enhanced in future studies.

Author Contributions

Conceptualization, H.S. and H.J.; methodology, H.S. and M.L.; software, H.S., X.R. and M.L; validation, M.L. and X.R.; formal analysis, H.S. and M.L.; investigation, H.S., M.L. and W.S.; resources, M.L., X.R. and W.S.; data curation, H.S. and M.L.; writing—original draft preparation, H.S. and M.L.; writing—review and editing, H.S. and M.L.; visualization, H.S. and M.L.; supervision, H.S. and M.L.; project administration, H.S.; funding acquisition, H.S. and H.J. All authors have read and agreed to the published version of the manuscript.

Funding

This research was funded by the National Natural Science Foundation of China, grant numbers 41906185, 52071307, U1901602, and the Key R & D projects of Shandong Province, grant numbers 2020CXGC010702.

Data Availability Statement

The data presented in this study will be available in April 2022 here: Remote-sensing data: http://eds.ceode.ac.cn/nuds/freedataquery (accessed on 15 December 2021). DEM data: http://www.gscloud.cn (accessed on 20 November 2021). Metro passenger flow in Wuhan: https://iwuhan.org/webapps/WuhanMetroFlowDetail/ (accessed on accessed on 12 January 2022). GDP density: http://tjj.hubei.gov.cn/tjsj/ (accessed on 15 December 2021). The number of metro stations: https://www.wuhanrt.com/public_forward.aspx (accessed on 20 December 2021). Distance between metro stations: https://www.wuhanrt.com/public_forward.aspx (accessed on 7 November 2021).

Acknowledgments

We sincerely thank anonymous reviewers for their careful work and thoughtful suggestions, which significantly improve this article. At the same time, we also thank the editors for all their kind work and consideration on the publication of our paper.

Conflicts of Interest

The authors declare no conflict of interest.

Appendix A

Correspondence between the serial numbers and names of subway stations. https://pan.baidu.com/s/161Pk8INHBZRRIIuSmeU1JQ?pwd=em9d, accessed on 10 May 2022.

References

  1. Hapuarachchi, H.A.P.; Wang, Q.J.; Pagano, T.C. A review of advances in flash flood forecasting. Hydrol. Process. 2011, 25, 2771–2784. [Google Scholar] [CrossRef]
  2. Petit-Boix, A.; Sevigné-Itoiz, E.; Rojas-Gutierrez, L.A.; Barbassa, A.P.; Josa, A.; Rieradevall, J.; Gabarrell, X. Floods and consequential life cycle assessment: Integrating flood damage into the environmental assessment of stormwater Best Management Practices. J. Clean. Prod. 2017, 162, 601–608. [Google Scholar] [CrossRef] [Green Version]
  3. Global Assessment Report 2019. Geneva, Switzerland. Available online: https://www.undrr.org/publication/global-assessment-report-disaster-risk-reduction-2019 (accessed on 2 October 2021).
  4. Miller, J.D.; Hutchins, M. The impacts of urbanization and climate change on urban flooding and urban water quality: A review of the evidence concerning the United Kingdom. J. Hydrol. Reg. Stud. 2017, 12, 345–362. [Google Scholar] [CrossRef] [Green Version]
  5. Chan, F.K.S.; Griffiths, J.A.; Higgitt, D.; Xu, S.; Zhu, F.; Tang, Y.; Xu, Y.; Thorne, C.R. “Sponge City” in China—A breakthrough of planning and flood risk management in the urban context. Land Use Policy 2018, 76, 772–778. [Google Scholar] [CrossRef]
  6. Hallegatte, S.; Green, C.; Nicholls, R.J.; Corfee-Morlot, J. Future flood losses in major coastal cities. Nat. Clim. Chang. 2013, 3, 802–806. [Google Scholar] [CrossRef]
  7. Zhou, Q.; Mikkelsen, P.S.; Halsnæs, K.; Arnbjerg-Nielsen, K. Framework for economic pluvial flood risk assessment considering climate change effects and adaptation benefits. J. Hydrol. 2012, 414, 539–549. [Google Scholar] [CrossRef]
  8. U.N. World Urbanization Prospects: The 2018 Revision. 2018. Available online: https://www.un.org/development/desa/publications/2018-revision-of-world-urbanization-prospects.html (accessed on 10 October 2021).
  9. Pour, S.H.; Abd Wahab, A.K.; Shahid, S.; Asaduzzaman, M.; Dewan, A. Low impact development techniques to mitigate the impacts of climate-change-induced urban floods: Current trends, issues and challenges. Sustain. Cities Soc. 2020, 62, 102373. [Google Scholar] [CrossRef]
  10. Li, L.Y.; Uyttenhove, P.; Vaneetvelde, V. Planning green infrastructure to mitigate urban surface water flooding risk—A methodology to identify priority areas applied in the city of Ghent. Landsc. Urban Plan. 2020, 194, 103703. [Google Scholar] [CrossRef]
  11. Nguyen, T.T.; Ngo, H.H.; Guo, W.S.; Wang, X.C.C.; Ren, N.Q.; Li, G.B.; Ding, J.; Liang, H. Implementation of a specific urban water management—Sponge City. Sci. Total Environ. 2019, 652, 147–162. [Google Scholar] [CrossRef]
  12. UITP. World Metro Figures 2018. 2018. Available online: https://cms.uitp.org/wp/wp-content/uploads/2020/06/Statistics-Brief-World-metro-figures-2018V3_WEB.pdf (accessed on 11 October 2021).
  13. Lyu, H.; Zhou, W.; Shen, S.; Zhou, A. Inundation risk assessment of metro system using AHP and TFN-AHP in Shenzhen. Sustain. Cities Soc. 2020, 56, 102103. [Google Scholar] [CrossRef]
  14. Forero-Ortiz, E.; Martínez-Gomariz, E.; Cañas Porcuna, M. A review of flood impact assessment approaches for underground infrastructures in urban areas: A focus on transport systems. Hydrol. Sci. J. 2020, 65, 1943–1955. [Google Scholar] [CrossRef]
  15. Alfieri, L.; Feyen, L.; Dottori, F.; Bianchi, A. Ensemble flood risk assessment in Europe under high end climate scenarios. Glob. Environ. Chang. 2015, 35, 199–212. [Google Scholar] [CrossRef]
  16. Jongman, B.; Hochrainer-Stigler, S.; Feyen, L.; Aerts, J.C.; Mechler, R.; Botzen, W.J.; Bouwer, L.M.; Pflug, G.; Rojas, R.; Ward, P.J. Increasing stress on disaster-risk finance due to large floods. Nat. Clim. Chang. 2014, 4, 264–268. [Google Scholar] [CrossRef]
  17. Aerts, J.C.; Botzen, W.J.; Clarke, K.C.; Cutter, S.L.; Hall, J.W.; Merz, B.; Michel-Kerjan, E.; Mysiak, J.; Surminski, S.; Kunreuther, H. Integrating human behaviour dynamics into flood disaster risk assessment. Nat. Clim. Chang. 2018, 8, 193–199. [Google Scholar] [CrossRef] [Green Version]
  18. Lyu, H.M.; Shen, S.L.; Zhou, A.N.; Yang, J. Risk assessment of mega-city infrastructures related to land subsidence using improved trapezoidal FAHP. Sci. Total Environ. 2020, 717, 135310. [Google Scholar] [CrossRef]
  19. Lyu, H.; Sun, W.; Shen, S.; Arulrajah, A. Flood risk assessment in metro systems of mega-cities using a GIS-based modeling approach. Sci. Total Environ. 2018, 626, 1012–1025. [Google Scholar] [CrossRef]
  20. Wang, G.; Liu, Y.; Hu, Z.; Zhang, G.; Liu, J.; Lyu, Y.; Gu, Y.; Huang, X.; Zhang, Q.; Liu, L. Flood Risk Assessment of Subway Systems in Metropolitan Areas under Land Subsidence Scenario: A Case Study of Beijing. Remote Sens. 2021, 13, 637. [Google Scholar] [CrossRef]
  21. Yin, J.; Yu, D.P.; Yin, Z.; Liu, M.; He, Q. Evaluating the impact and risk of pluvial flash flood on intra-urban road network: A case study in the city center of Shanghai, China. J. Hydrol. 2016, 537, 138–145. [Google Scholar] [CrossRef] [Green Version]
  22. Suarez, P.; Anderson, W.; Mahal, V.; Lakshmanan, T.R. Impacts of flooding and climate change on urban transportation: A systemwide performance assessment of the Boston Metro Area. Transp. Res. Part D Transp. Environ. 2005, 10, 231–244. [Google Scholar] [CrossRef]
  23. Von Ferber, C.; Holovatch, T.; Holovatch, Y.; Palchykov, V. Public transport networks: Empirical analysis and modeling. Eur. Phys. J. B 2009, 68, 261–275. [Google Scholar] [CrossRef] [Green Version]
  24. Derrible, S.; Kennedy, C. The complexity and robustness of metro networks. Phys. A 2010, 389, 3678–3691. [Google Scholar] [CrossRef]
  25. Zhang, D.; Du, F.; Huang, H.; Zhang, F.; Ayyub, B.M.; Beer, M. Resiliency assessment of urban rail transit networks: Shanghai metro as an example. Saf. Sci. 2018, 106, 230–243. [Google Scholar] [CrossRef]
  26. Zhang, J.; Wang, Z.; Wang, S.; Shao, W.; Zhao, X.; Liu, W. Vulnerability assessments of weighted urban rail transit networks with integrated coupled map lattices. Reliab. Eng. Syst. Saf. 2021, 214, 107707. [Google Scholar] [CrossRef]
  27. Wu, X.T.; Dong, H.R.; Tse, C.K.; Ho, I.W.H.; Lau, F.C.M. Analysis of metro network performance from a complex network perspective. Phys. A 2018, 492, 553–563. [Google Scholar] [CrossRef]
  28. Gao, B.; Qin, Y.; Xiao, X.; Zhu, L. K-means Clustering Analysis of Key Nodes and Edges in Beijing Subway Network. J. Transp. Syst. Eng. Inf. Technol. 2014, 14, 207–213. [Google Scholar]
  29. Yao, L.; Sun, L.; Wang, W.; Xia, X. Connection Facility Layout Model of Subway Stations. Adv. Mech. Eng. 2015, 7, 457508. [Google Scholar] [CrossRef]
  30. Kurant, M.; Thiran, P. Extraction and analysis of traffic and topologies of transportation networks. Phys. Rev. E 2006, 74, 036114. [Google Scholar] [CrossRef] [Green Version]
  31. Yinghua, S.; Yuzhi, L.; Feizhou, H.; Yiyun, M. Vulnerability of Two-layer Traffic Network of Bus and Subway under Waterlogging Condition Based on Complex Network Theory. Saf. Environ. Eng. 2021, 28, 114–120. [Google Scholar]
  32. Zou, Q.; Zhou, J.; Zhou, C.; Song, L.; Guo, J. Comprehensive flood risk assessment based on set pair analysis-variable fuzzy sets model and fuzzy AHP. Stoch. Environ. Res. Risk Assess. 2013, 27, 525–546. [Google Scholar] [CrossRef]
  33. Gai, L.; Nunes, J.P.; Baartman, J.E.M.; Zhang, H.; Wang, F.; de Roo, A.; Ritsema, C.J.; Geissen, V. Assessing the impact of human interventions on floods and low flows in the Wei River Basin in China using the LISFLOOD model. Sci. Total Environ. 2019, 653, 1077–1094. [Google Scholar] [CrossRef]
  34. Anderson, M.; Kavvas, M.; Mierzwa, M. Developing probabilistic representations of climatic influences on hydrological response using a coupled hydrological-atmospheric model. Hydrolog. Sci. J. 2003, 48, 693–708. [Google Scholar] [CrossRef] [Green Version]
  35. Dottori, F.; Martina, M.L.V.; Figueiredo, R. A methodology for flood susceptibility and vulnerability analysis in complex flood scenarios. J. Flood Risk Manag. 2018, 11, S632–S645. [Google Scholar] [CrossRef]
  36. MIKE 21-2D Modelling of Coast and Sea. Available online: https://www.mikepoweredbydhi.com/areas-of-application/coast-and-sea (accessed on 18 October 2021).
  37. Evaluation of Inundation Models. Available online: https://xueshu.baidu.com/usercenter/paper/show?paperid=1b23e91716eed7b35c353be76309e5ae&site=xueshu_se (accessed on 21 October 2021).
  38. Benchmarking of 2D Hydraulic Modelling Packages. Available online: https://www.researchgate.net/publication/257343214_Benchmarking_of_2D_Hydraulic_Modelling_Packages (accessed on 21 October 2021).
  39. Teng, J.; Jakeman, A.J.; Vaze, J.; Croke, B.F.W.; Dutta, D.; Kim, S. Flood inundation modelling: A review of methods, recent advances and uncertainty analysis. Environ. Modell. Softw. 2017, 90, 201–216. [Google Scholar] [CrossRef]
  40. Wilson, M.; Bates, P.; Alsdorf, D.; Forsberg, B.; Horritt, M.; Melack, J.; Frappart, F.; Famiglietti, J. Modeling large-scale inundation of Amazonian seasonally flooded wetlands. Geophys. Res. Lett. 2007, 34, L15404. [Google Scholar]
  41. Zheng, Y.Z.; Sun, H. An Integrated Approach for the Simulation Modeling and Risk Assessment of Coastal Flooding. Water 2020, 12, 2076. [Google Scholar] [CrossRef]
  42. Ishigaki, T.; Toda, K.; Inoue, K. Hydraulic model tests of inundation in urban area with underground space. In Proceedings of the 30th IAHR Congress, Thessaloniki, Greece, 24–29 August 2003; pp. 487–493. [Google Scholar]
  43. Toda, K.; Kawaike, K.; Yoneyama, N.; Fukakusa, S.; Yamamoto, D. Underground Inundation Analysis by Integrated Urban Flood Model. In Advances in Water Resources and Hydraulic Engineering; Zhang, C.K., Tang, H.W., Eds.; Springer: Nanjing, China, 2009; Volume 1–6, pp. 166–171. [Google Scholar]
  44. Yoneyama, N.; Toda, K.; Aihata, S.; Yamamoto, D. Numerical Analysis for Evacuation Possibility from Small Underground Space in Urban Flood. In Advances in Water Resources and Hydraulic Engineering; Zhang, C.K., Tang, H.W., Eds.; Springer: Nanjing, China, 2009; Volume 1–6, pp. 107–112. [Google Scholar]
  45. Wu, J.S.; Li, N.; Liu, W.Y.; Zhou, S.L. Numerical modeling of flooding current flow over the underground complex staircases with a GPU-based SPH method. J. Saf. Environ. 2019, 19, 774–779. [Google Scholar]
  46. Forero-Ortiz, E.; Martinez-Gomariz, E.; Porcuna, M.C.; Locatelli, L.; Russo, B. Flood Risk Assessment in an Underground Railway System under the Impact of Climate Change—A Case Study of the Barcelona Metro. Sustainability 2020, 12, 5291. [Google Scholar] [CrossRef]
  47. Shao, W. Critical rainfall intensity for safe evacuation from underground spaces with flood prevention measures. J. Zhejiang Univ-Sci. A 2010, 11, 668–676. [Google Scholar] [CrossRef]
  48. Wu, J.S.; Shengdi, X.; Hui, Z. A review of experimental and numerical simulation studies on flooding in urban underground spaces. China Saf. Sci. J. 2016, 26, 1–6. [Google Scholar]
  49. Wu, J.; Fang, W.; Hu, Z.; Hong, B. Application of Bayesian Approach to Dynamic Assessment of Flood in Urban Underground Spaces. Water 2018, 10, 1112. [Google Scholar] [CrossRef] [Green Version]
  50. Son, A.; Kim, B.; Han, K. A Simple and Robust Method for Simultaneous Consideration of Overland and Underground Space in Urban Flood Modeling. Water 2016, 8, 494. [Google Scholar] [CrossRef] [Green Version]
  51. Han, Y.; Shin, E.T.; Eum, T.S.; Song, C.G. Inundation Risk Assessment of Underground Space Using Consequence-Probability Matrix. Appl. Sci. 2019, 9, 1196. [Google Scholar] [CrossRef] [Green Version]
  52. Kazakis, N.; Kougias, I.; Patsialis, T. Assessment of flood hazard areas at a regional scale using an index-based approach and Analytical Hierarchy Process: Application in Rhodope-Evros region, Greece. Sci. Total Environ. 2015, 538, 555–563. [Google Scholar] [CrossRef]
  53. Lyu, H.; Shen, S.; Zhou, A.; Zhou, W. Flood risk assessment of metro systems in a subsiding environment using the interval FAHP-FCA approach. Sustain. Cities Soc. 2019, 50, 101682. [Google Scholar] [CrossRef]
  54. Xu, H.; Ma, C.; Lian, J.; Xu, K.; Chaima, E. Urban flooding risk assessment based on an integrated k-means cluster algorithm and improved entropy weight method in the region of Haikou, China. J. Hydrol. 2018, 563, 975–986. [Google Scholar] [CrossRef]
  55. Yang, W.; Xu, K.; Lian, J.; Ma, C.; Bin, L. Integrated flood vulnerability assessment approach based on TOPSIS and Shannon entropy methods. Ecol. Indic. 2018, 89, 269–280. [Google Scholar] [CrossRef]
  56. Zhao, Y.; Gong, Z.; Wang, W.; Luo, K. The comprehensive risk evaluation on rainstorm and flood disaster losses in China mainland from 2004 to 2009: Based on the triangular gray correlation theory. Nat. Hazards. 2014, 71, 1001–1016. [Google Scholar] [CrossRef]
  57. Guo, S.; Zhao, H. Fuzzy best-worst multi-criteria decision-making method and its applications. Knowl.-Based Syst. 2017, 121, 23–31. [Google Scholar] [CrossRef]
  58. Rezaei, J. Best-worst multi-criteria decision-making method. Omega 2015, 53, 49–57. [Google Scholar] [CrossRef]
  59. Kourgialas, N.N.; Karatzas, G.P. A national scale flood hazard mapping methodology: The case of Greece—Protection and adaptation policy approaches. Sci. Total Environ. 2017, 601, 441–452. [Google Scholar] [CrossRef]
  60. Tehrany, M.S.; Pradhan, B.; Mansor, S.; Ahmad, N. Flood susceptibility assessment using GIS-based support vector machine model with different kernel types. Catena 2015, 125, 91–101. [Google Scholar] [CrossRef]
  61. Wang, Z.; Lai, C.; Chen, X.; Yang, B.; Zhao, S.; Bai, X. Flood hazard risk assessment model based on random forest. J. Hydrol. 2015, 527, 1130–1141. [Google Scholar] [CrossRef]
  62. Du, Z.; Tang, J.; Qi, Y.; Wang, Y.; Han, C.; Yang, Y. Identifying critical nodes in metro network considering topological potential: A case study in Shenzhen City-China. Phys. A 2020, 539, 122926. [Google Scholar] [CrossRef]
  63. Wuhan Local Standards DB4201/T 641 2020. Wuhan, China. Available online: https://max.book118.com/html/2021/0123/7116125135003045.shtm (accessed on 6 February 2022).
Figure 1. The metro stations were flooded. (a) Shenzhoulu station of Guangzhou metro line 21 on 30 July 2021. (b) Station of metro line 5 flooded during heavy rainfall on 18 July 2021, in Zhengzhou. (c) The New York metro station was attacked on 2 September 2021.
Remotesensing 14 03451 g001
Figure 2. The framework of methodology.
Remotesensing 14 03451 g002
Figure 3. Climate and location information for Wuhan. (a) Administrative region of Wuhan with the metro system. (b) Temperature of Wuhan. (c) Rainfall. (d) Rainfall days.
Remotesensing 14 03451 g003
Figure 4. Urban metro diagram. (a) Remote sensing image of the Wuhan city. (b) Two-dimensional map of urban metro. (c) Three-dimensional map of urban metro.
Remotesensing 14 03451 g004
Figure 5. (a) Node degree graph. (b) Node strength graph.
Remotesensing 14 03451 g005
Figure 6. Node betweenness graph.
Remotesensing 14 03451 g006
Figure 7. (a) Von Neumann-type neighborhood. (b). Cellular space difference diagram.
Remotesensing 14 03451 g007
Figure 8. Rainfall Process Line.
Remotesensing 14 03451 g008
Figure 9. Flow chart of dynamic node breakdown algorithm.
Remotesensing 14 03451 g009
Figure 10. Schematic diagram of each parameter in TFNs.
Remotesensing 14 03451 g010
Figure 11. Importance comparison between indicators.
Remotesensing 14 03451 g011
Figure 12. The prediction and identification of flood-prone stations. (a) Submerged water depth of the metro network. (b) Enlarged view of the flooded Yangluo Development Zone station. (c) Enlarged view of the flooded Renhe Road station.
Remotesensing 14 03451 g012
Figure 13. (a) Inundation sequence and (b) proportion of breakdown nodes over time.
Remotesensing 14 03451 g013
Figure 14. Node Characteristics. (a) Node degree. (b) Node strength. (c) Node betweenness. (d) Closeness centrality. (e) Passenger flow. (f) GDP density.
Remotesensing 14 03451 g014
Figure 15. Nodal toughness strength variation curve.
Remotesensing 14 03451 g015
Figure 16. Diagram of inundation time and toughness strength of nodes at T = 20 min (a) and T = 40 min (b).
Remotesensing 14 03451 g016
Figure 17. Network toughness strength curve.
Remotesensing 14 03451 g017
Figure 18. Emergency response zone at T = 20 min (a) and T = 40 min (b).
Remotesensing 14 03451 g018
Figure 19. Emergency response zone at T = 20 min (a) and T = 40 min (b).
Remotesensing 14 03451 g019
Figure 20. Evacuation nodes at T = 20 min (a) and T = 40 min (b).
Remotesensing 14 03451 g020
Table 1. Relationship between elevation and edge weight.
Difference of Terrain (m)Weights from Low to High Terrain NodesWeights from High to Low Terrain Nodes
0–60.50.6
6–120.40.7
12–180.30.8
18–240.20.9
24–300.11
Table 2. Transformation rules of Linguistic variables [57].
Linguistic TermsMembership Function
(L,M,N)
Equally important (EI)(1,1,1)
Weakly important (WI)(2/3,1,3/2)
Fairly important (FI)(3/2,2,5/2)
Very important (VI)(5/2,3,7/2)
Absolutely important (AI)(7/2,4,9/2)
Table 3. Data sources of the research in this article.
DataSource
Remote-sensing datahttp://eds.ceode.ac.cn/nuds/freedataquery (accessed on 15 December 2021)
DEM (30 m × 30 m)http://www.gscloud.cn (accessed on 20 November 2021)
Design Formula of Rainstorm IntensityWuhan local standards DB4201/T 641 2020 (accessed on 6 December 2021)
Metro passenger flow in Wuhanhttps://iwuhan.org/webapps/WuhanMetroFlowDetail/ (accessed on 12 January 2022)
GDP densityhttp://tjj.hubei.gov.cn/tjsj/ (accessed on 15 December 2021)
Number of metro stationshttps://www.wuhanrt.com/public_forward.aspx (accessed on 15 December 2021)
Distance between metro stationshttps://www.wuhanrt.com/public_forward.aspx (accessed on 7 November 2021)
Elevation within the metro network.https://www.wuhanrt.com/public_forward.aspx (accessed on 7 January 2022)
Fieldwork estimation(Estimated from subway floors)
Table 4. The evaluation outcomes of the relative importance of the six indicators.
Indicators\CategoryThe Ability to Receive Flood (25%)The Ability to Transmit Flood (25%)The Risk of Casualties (20%)The Risk of Economic Loss (20%)The Importance of Location (10%)Best Indicators/Bj
Node degree25%25%---EI
Node strength-25%---FI
Node betweenness20%20%-- WI
Closeness centrality----10%AI
Passenger flow--20%--VI
GDP density---20%-VI
Table 5. The relative importance coefficient of the indication.
IndicatorsFuzzy WeightComprehensive Weight
Node degree(0.3046, 0.3088, 0.3489)0.3148
Node strength(0.1420, 0.1420, 0.1829)0.1488
Node betweenness(0.2382, 0.2382, 0.3152)0.2510
Closeness centrality(0.0830, 0.0834, 0.0951)0.0853
Passenger flow(0.0919, 0.1051, 0.1130)0.1042
GDP density(0.0919, 0.1051, 0.1130)0.1042
Publisher’s Note: MDPI stays neutral with regard to jurisdictional claims in published maps and institutional affiliations.

