Technical Note

A Novel Approach for the Global Detection and Nowcasting of Deep Convection and Thunderstorms

Deutscher Wetterdienst, Frankfurter Str. 135, 63067 Offenbach, Germany
*
Author to whom correspondence should be addressed.
Remote Sens. 2022, 14(14), 3372; https://doi.org/10.3390/rs14143372
Submission received: 31 May 2022 / Revised: 22 June 2022 / Accepted: 26 June 2022 / Published: 13 July 2022
(This article belongs to the Topic Advances in Environmental Remote Sensing)

Abstract

:
Thunderstorms are among the most common and most dangerous meteorological hazards in the world. They cause lightning and can lead to strong wind gusts, squall lines, hail and heavy precipitation combined with flooding, and therefore pose a threat to health and life, can cause enormous property damage and also endanger flight safety. Monitoring and forecast of thunderstorms are, therefore, important topics. In this work, a novel method for the detection and forecast of thunderstorms and strong convection is presented. The detection is based on the global GLD360 lightning data in combination with satellite information from the satellite series Meteosat, HIMAWARI and GOES, covering the complete geostationary ring. Three severity levels are defined depending on the occurrence of lightning and the brightness temperature difference of the water vapour channels and the infrared window channel (∼10.8 μ m). The detection of thunderstorms and strong convection is the basis for the nowcasting up to 2 h, which is performed with the optical flow method TV-L1. This method provides the needed atmospheric motion vectors for the extrapolation of the thunderstorm movement. Both, the validation results as well as the feedback of the customers show the great value of the new NowCastSat-Aviation (NCS-A) method. For example, the Critical Success Index (CSI) is, with 0.64, still quite high for the 60 min forecast of severe thunderstorms. The method is operated 24/7 by the German Weather Service (DWD), and is used to provide thunderstorm information to aviation customers and the central weather forecast unit of DWD.

1. Introduction

Thunderstorms are among the most common and most dangerous meteorological hazards in the world. They are often associated with heavy rainfall, hail, wind gusts, squall lines and violent lightning. Phenomena that pose a threat to life, health, infrastructure and the environment. Thunderstorms are also referred to as Cumulonimbus clouds (Cbs) in meteorology. Any cloud that produces lightning is, by definition, a Cb.
While aircraft are well protected against direct lightning strokes as a result of the phenomena known as Faraday cage, turbulences and icing pose serious risks to aircraft and passengers. Therefore, for a safe transport, the location and expected severity of Cbs must be known. Aircraft are equipped with a board radar. However, these radars have only a short range, a limited viewing angle and the coverage is additionally hampered by “shadowing” by Cbs or optical thick clouds. Thus, relying only on the board radar could result in misleading judgement about the size and position of the Cbs and Cb clusters and cannot be exclusively used for the decision of the optimal and safest route in areas with Cbs. It is mainly suitable for spontaneous short-term evasive manoeuvres. Thus, gridded data of Cb information with a large geographical coverage are needed for forecast horizons from 0 to 3 h. The availability of such information in the cockpit improves the early Cb reconnaissance and, thus, the early selection of the safest flight routes—see Figure 1 for illustration.
Thunderstorm detection and nowcasting are also offered by operators of lightning detection networks—see [1,2,3,4,5,6]. However, these services are commercial and do not use satellite information for the estimation of severity levels and atmospheric motion vectors and are, therefore, based on a reduced set of information. The Nowcasting Satellite Application facility (NWC-SAF) [7] focuses on the development of software for satellite-based estimation of thunderstorms. However, the detection of Cbs based only on satellites is associated with a relatively high Flse Alarm Ratio (FAR) [8], which calls for the additional use of lightning data for Cb detection. Cbs are defined by the occurrence of lightning. Hence, using lightning data enables the detection of Cbs with a Probability of Detection (POD) about 100% and a FAR about 0%. It is obvious that this is a optimal basis for the nowcasting as it starts with the best possible POD and FAR values. Further, the NWC-SAF software is technically cumbersome and not optimised for a 24/7 operation at DWD. As a result of the request of key aviation customers the complete geostationary ring is covered by NCS-A, a feature not provided by NWC-SAF (Version 2018). Finally, for many nowcasting applications a dense vector field is needed, e.g., [9]. DWD had quite good experience with modern Computer Vision techniques, e.g., [10,11]. They can be easily adapted to the different application fields as they provide a dense vector field based on a multi-scale approach. The parameters can be optimised for the respective application. Optical flow is used at DWD for turbulence [12], solar surface irradiance [9] and precipitation/radar nowcasting [13,14]. Thus, DWD wanted to use the established optical flow methods also for Cb nowcasting—an option not available within the NWC-SAF software. This motivates the development and operational implementation of a novel Cb nowcasting approach, referred to as NowCastSat-Aviation (NCS-A) version 1.0. NCS-A (Global Scan Service) is an operational 24/7 product from Deutscher Wetterdienst. NCS-A provides near real-time detection and predictions of convective cells across the global domain using the highest temporal and spatial resolution available from geostationary weather satellites. These includes METEOSAT, the European METEOrological SATellite [15], GOES, the US Geostationary Operational Environmental Satellite [16] and HIMAWARI [17], which means sunflower in English. The satellite information is combined with the global GLD360 lightning data from VAISALA [2,3,4,5]—see Section 2 for details. The novel aspects are the combination of modern Computer Vision methods with global lightning data, satellite information and numerical weather prediction data as well as the resulting definition of severity levels, which are described in more detail in the following paragraph. DWD also develops and 24/7 operates another Cb nowcasting system, which is called NowCastMIX-Aviation (NCM-A)—see James et al. [14]. NCM-A employs a multitude of data such as ground-based radar information, high-resolution lightning and model data. During the processing, the different information is combined by a fuzzy-logic technique to derive an optimal analysis of thunderstorm severity. However, due to the utilised sensors, the domain of NCM-A is limited and it cannot be applied to intercontinental long-haul flights. However, the viewing geometries of ground-based radar and satellites used by NCM-A and NCS-A, respectively, provide distinct insight into the characteristics of thunderstorms which complement each other. Therefore, using both nowcasting systems in combination, where possible, such as at air-traffic control centres, provides useful additional weather information for the air traffic controler [18]. Another global Cb nowcasting product is based on Convective Diagnosis Oceanic (CDO) algorithm. It is used to detect the area of storms that are most hazardous for aviation by a combination of geostationary satellite-based data and ground-based lightning data. A simple fuzzy-logic approach is used to combine the information from different input fields. The CDO input fields are the cloud top height, the Global Convective Diagnosis [19], the Overshooting Tops Detection algorithm [20] and the EarthNetworks global, ground-based lightning detection network. However, it is a commercial product, and central methods are not published in peer-reviewed journals or published at all. Furthermore, modern optical flow methods are to the knowledge of the authors not applied for the nowcasting. Therefore, the authors felt that the time was ripe to develop a new method using new techniques and approaches such as optical flow. The development was driven by a tight feedback loop with the users. In the process, some aspects of the CDO algorithm, e.g., the use of discretised severity levels, were adopted.

2. Materials and Methods: The Cb Detection and Nowcasting Method

In this section, the method for the detection and nowcasting of thunderstorms are described in more detail. For Cbs, three levels of severity are defined, which are discussed first. Then, the nowcasting method is described. The cloud top height of thunderstorms is of interest for the user as well. Thus, the method to derive CTH is discussed after that. The last issue covers the aspect of research to operations. The 24/7 implementation of the method as a basis for the end-user evaluation is documented here.

2.1. Detection and Definition of Severity Levels

The brightness temperature of the water vapour channels are used [8] for the satellite-based detection of Cbs. This concept is an adaptation of Schmetz et al. [21]. For the definition of the severity level the InfraRed (IR) window channel, (∼10.8 μ m) is used in addition. However, Cb detection based only on satellite data is associated with a relatively high FAR with sub-optimal POD [8]. In order to increase POD and reduce FAR, in particular for severe warnings, lightning data from VAISALA are used in addition [2,3,4,5,6]. The GLD360 data cover the globe and are based on Broadband VLF Radio Reception [22]. The use of receivers in the very low-frequency range (VLF; 3–30 kHz) enables the detection of radio pulses associated with lightning discharges over large distances (several thousand kilometers) [4,5]. The VLF frequency range enables an efficient routing of the signal through the ionosphere.
The severity of a thunderstorm provides important information for planning protective measures and was, therefore, an important user requirement. The definition of the severity levels are described in more detail below.

2.1.1. Light Convection

Light convection is defined as a region with neutral to in-stable layering of the atmosphere for satellite pixels with a brightness temperature difference of the water vapour channels ( B T 6.2 B T 7.3 ) larger than −1. The regions with potential for thunderstorms are identified from numerical weather prediction model ICON [23] and are defined by a convective KO index of less than 2 [8]. Optically thick cold clouds can evolve into a thunderstorm and might be associated with strong convection. Thus, these clouds are also attributed to the light intensity level even when there is no lightning. Hence, the occurrence of lightning is not a precondition for the light convection level. The composition of the light convection is illustrated in Figure 2. The colour green is assigned to light convection.

2.1.2. Moderate Convection

Furthermore, for moderate convection, the occurrence of lightning is not required. For this level, however, the clouds must be colder and thus closer to or in the tropopause. The brightness temperature of the water vapour channels and the IR window channel are used to define this level. If the differences exceed a specific threshold then deep convection is assumed to occur. The thresholds are defined as greater than 0.7 for the difference in the water water channels ( W V 063 W V 073 > 0.7 ) and greater than 2 for the BT difference of the water vapour channel and the window channel ( W V 062 I R 10.8 > 2 ). The latter condition can be used to identify overshooting tops, which are an indicator for strong updrafts associated with significant convection [20]. As for the light convection the NWP (KO) filter is used for this level. However, the likelihood for thunderstorms for OTs is quite high; hence, the NWP filtering is less important for this level than for the light level [8]. The colour yellow is assigned to moderate convection.

2.1.3. Severe Convection

The severity level for convection is defined as severe if lightning occurs, hence, the severe level is usually surrounded by the light or moderate level. The occurrence for lightning is a pre-requisite for the definition of severe convection within NCS-A. All lightning measurements occurring 15 min before the end of the latest satellite scan are taken into account and form the highest convection level “severe”. The warning colour red is used for this level. It should be noted that the detection efficiency of the lightning measurements can vary somewhat and is particularly lower over large and remote ocean areas such as the South Pacific due to the lack of measurement sensors.

2.2. Cloud Top Height—CTH
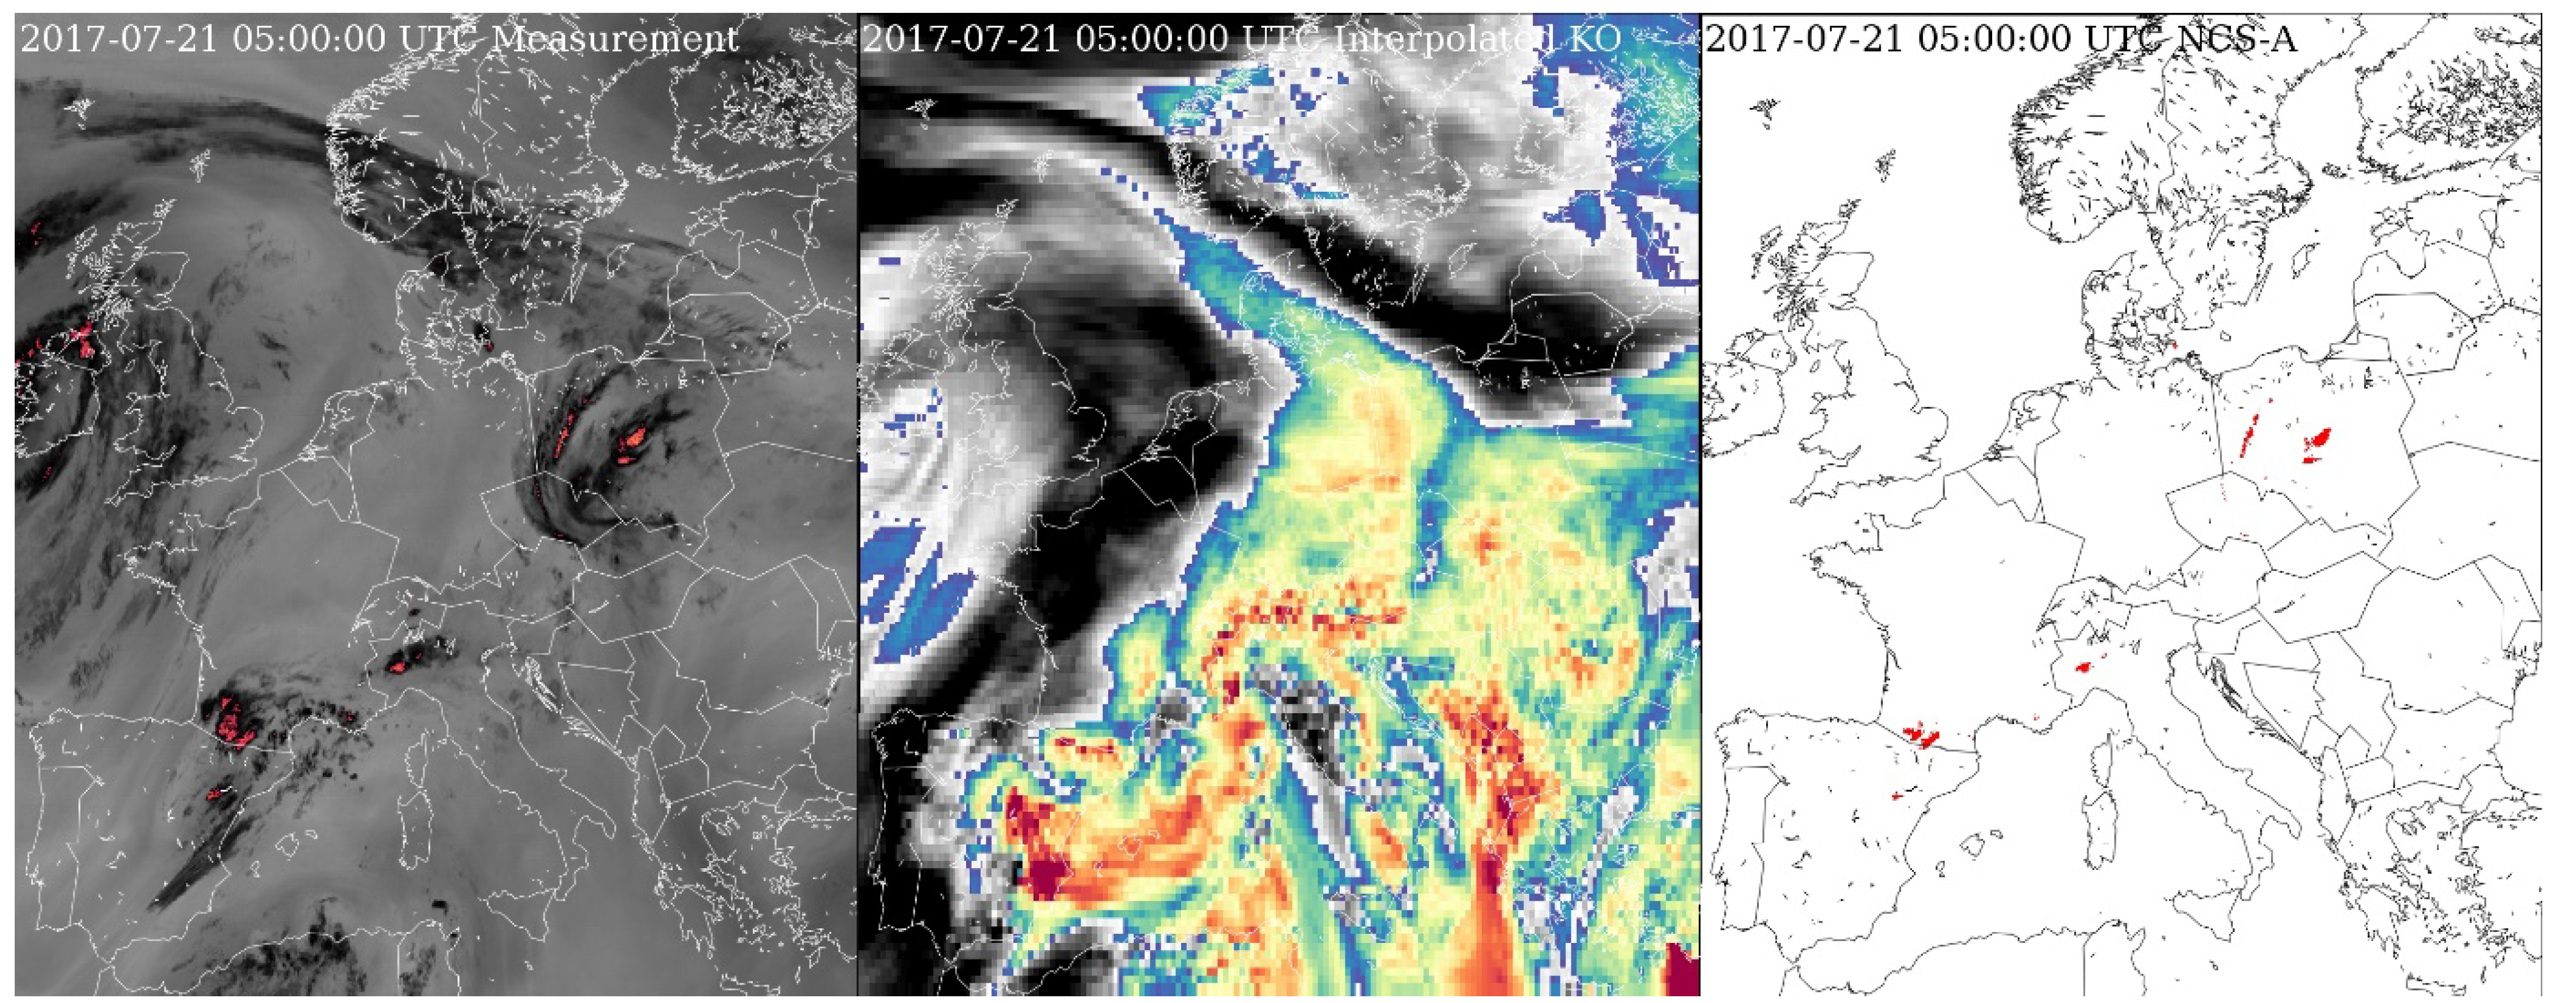
The BT observed by the satellite corresponds to the temperature of the cloud top for optically thick clouds in the IR channel, since a black body can be assumed here [8]. As a consequence, Equation (1) is used to estimate the cloud top height
C T H = ( B T T t r o p o ) / L R + H t r o p o
Here, B T is the brightness temperature of the IR window channel (∼10.8 μ m), T t r o p o is the temperature of the tropopause and H t r o p o is the height of the tropopause from the numerical weather prediction model ICON [23]. L R is the lapse rate and is set to 8 K/km.
This value represents a minor change from the value reported by Griffin et al. [24], which was determined by the expert knowledge of the DWD weather forecasters. Thus, the BT from IR channel at the top of the clouds is related to the cloud top height (flight level). The above mentioned “black body” assumption is not valid for semitransparent clouds and another method has to be applied. The respective method is referred to as water vapour H2O- intercept method applicable for upper-level semitransparent clouds [12].

2.3. Nowcasting

The nowcasting is performed with the optical flow method TV-L1 [10], which is provided as part of OpenCV [25,26]. The method allows the calculation of atmospheric motion vectors (AMVs) from two subsequent satellite images of the water vapour channels (ca. 6.2 μ m) from the different geostationary satellites. The Cb image is then extrapolated in time based on the estimated atmospheric flow. Development and dissipation of cells is not captured by the method. The Cbs are only advected in time based on the AMVs. This limitation is an inherit feature and hold for all atmospheric motion vector methods. The TV-L1 parameters have been optimised for the nowcasting of Cbs—see Table 1. Forecast are calculated every 15 min and cover lead times up to to 2 h after the latest satellite scan. The temporal and spatial resolutions are 15 min and 0.1 degree (ca. 10 km) for satellite data and 1500 m for lightning.

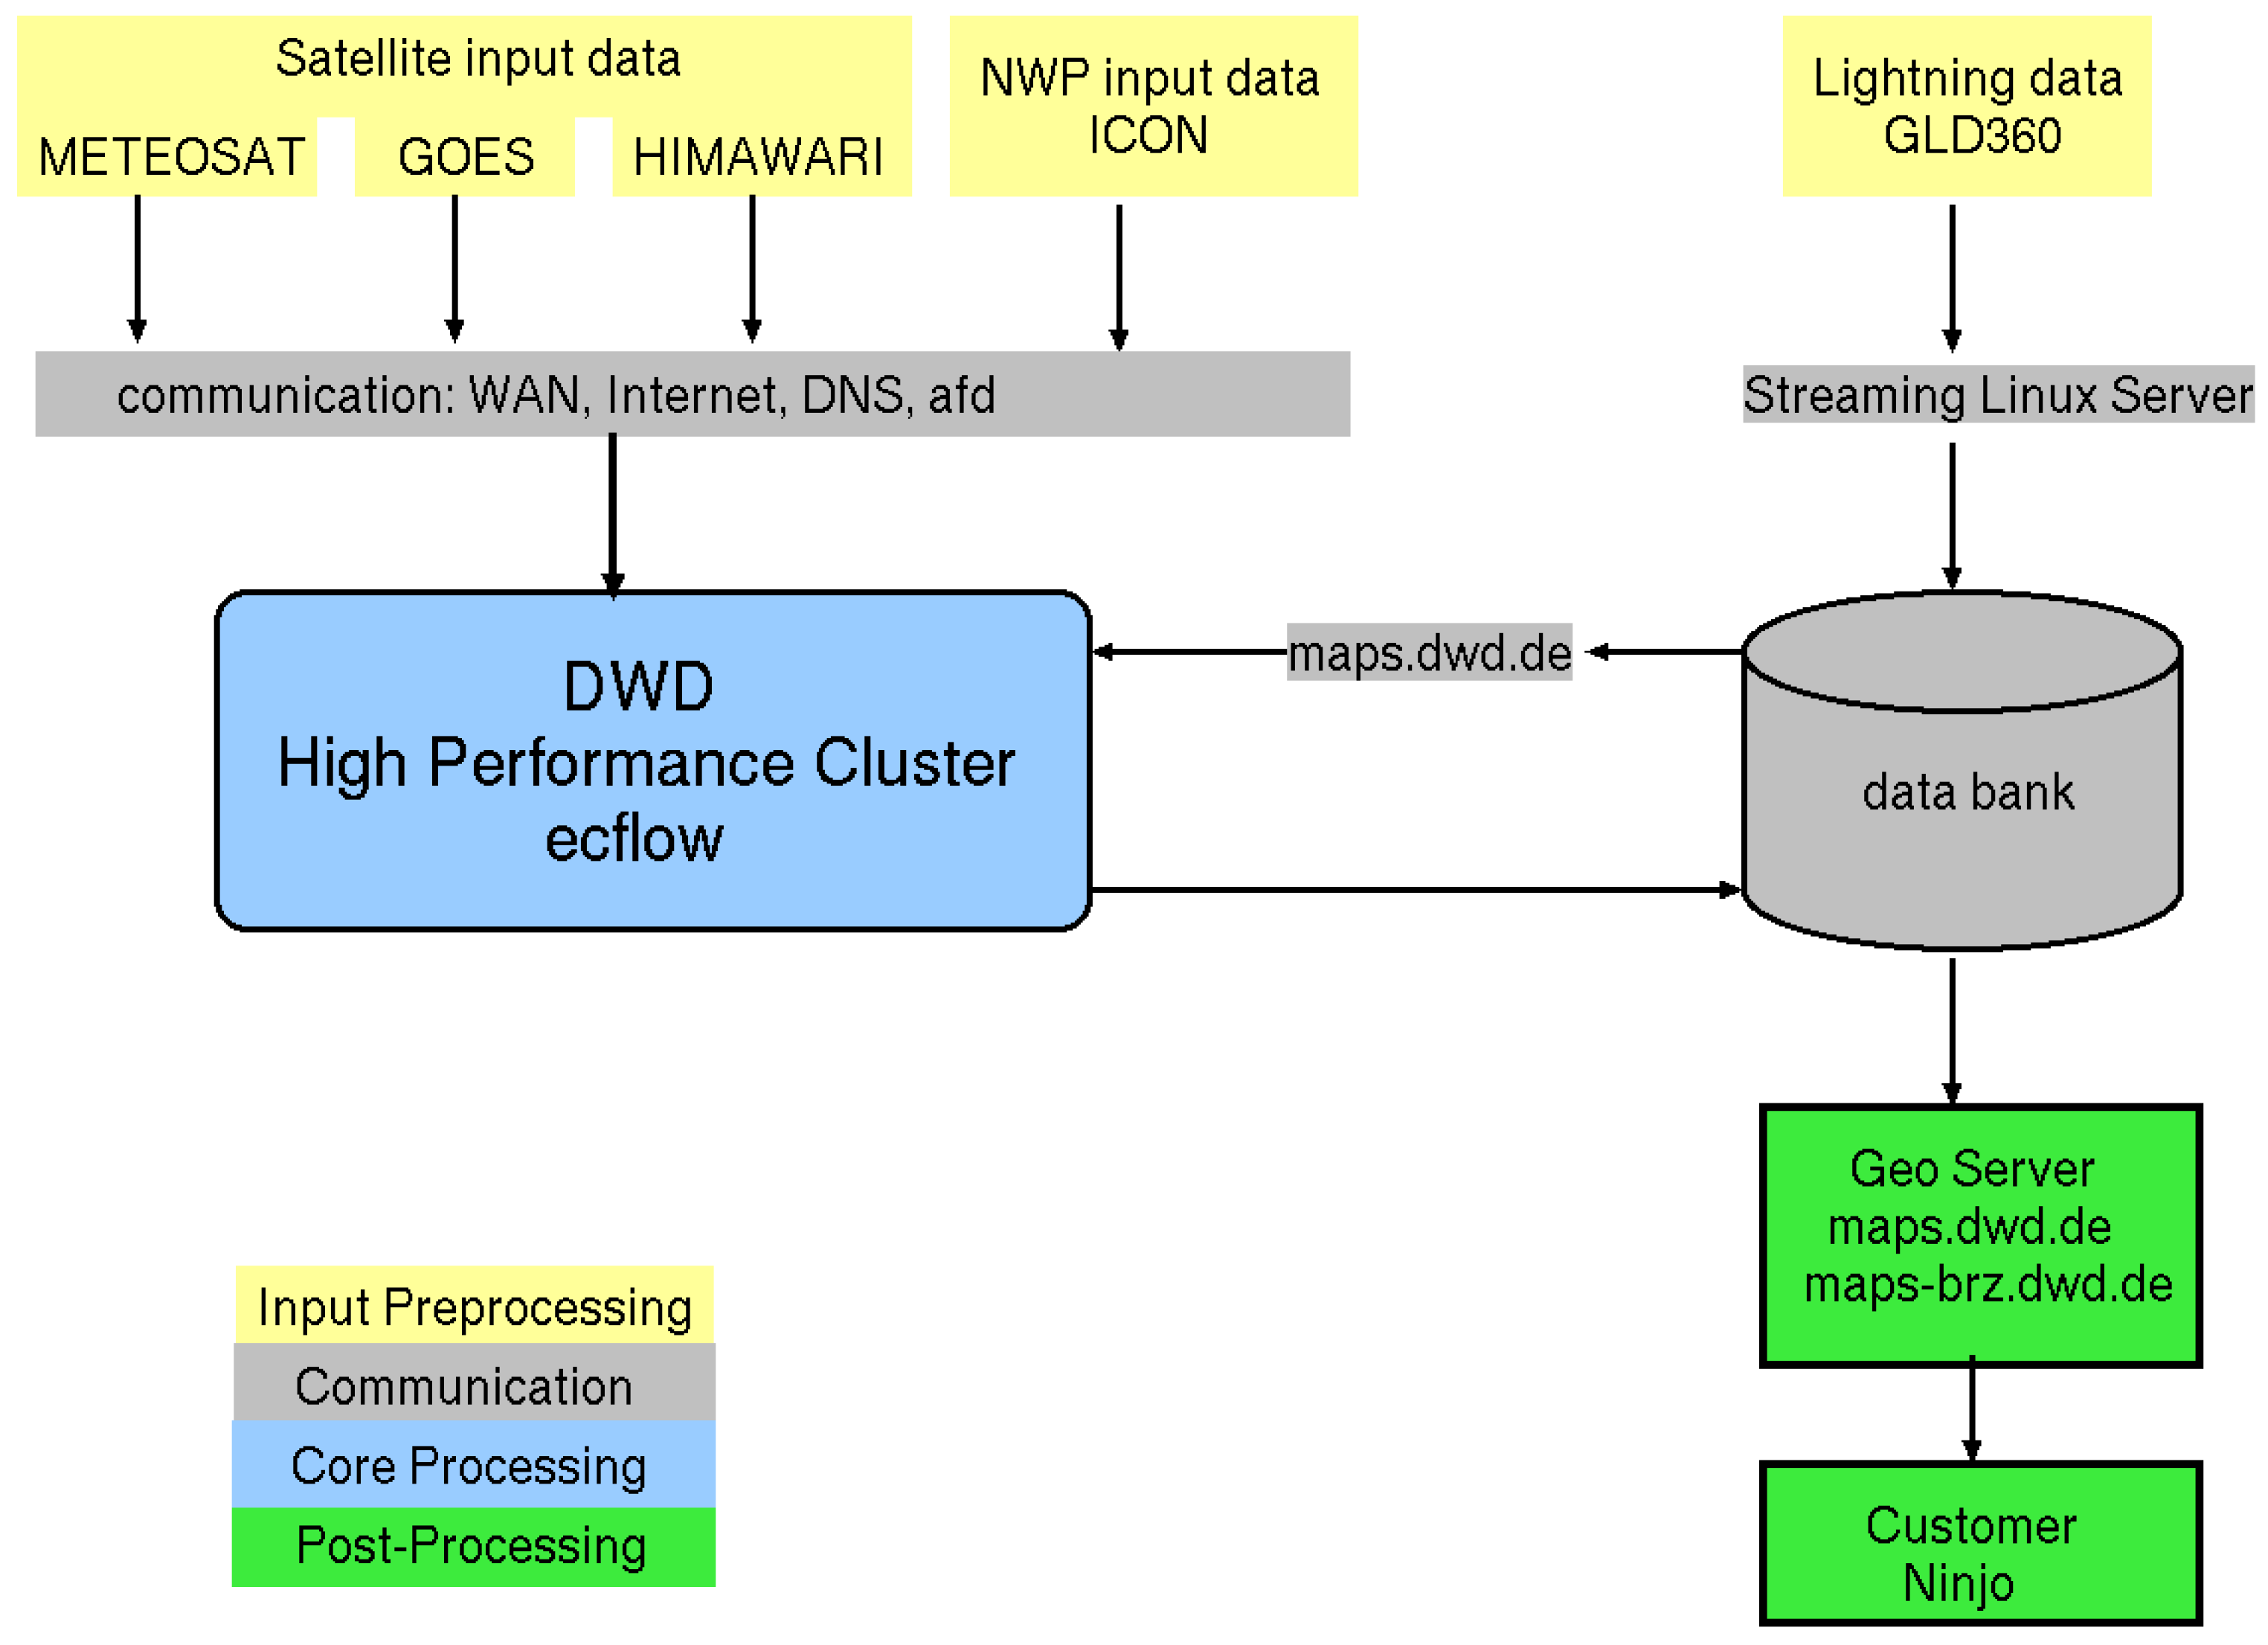
2.4. 24/7 Implementation and Operation at DWD

2.4.1. Geotools

The processing of the satellite, lightning and NWP data is performed with a software package developed at DWD referred to as Geotools. The Geotools package is written in Python using Pytroll (https://pytroll.github.io/, accessed on 12 May 2022) for reading the satellite data and conducting basic image processing. Furthermore, Geotools are designed to merge the information from the various satellite sources and to apply the optical flow for the nowcasting, the geolocation and the polygonisation of the data. The latter is needed in order to reduce the necessary bandwidth for the transmission of the thunderstorm information to the flight desks. The software is optimised for speed in order to enable the processing of the complete geostationary ring and is also used for the polygonisation of the netcdf raster data.

2.4.2. 24/7 Processing

NowCastSat-Aviation NCS-A is hosted and operated 24/7 at DWD’s High Performance Computer (HPC). For the 24/7 operation, Geotools are controlled by a shell script that processes the input and output data and calls the algorithms. EcFlow is used for the operational 24/7 call and monitoring of the job. EcFlow is a workflow package which has been developed to run a large number of programs in a controlled environment, providing restart and monitoring capabilities (via web page or email). It is used at DWD to run all operational suites on the HPC. EcFlow is developed and maintained by the European Center for Medium-Range Weather Forecasts (ECMWF)—see https://confluence.ecmwf.int/display/ECFLOW (accessed on 12 May 2022) for further details. The 24/7 processing uses multiple interfaces to the various data sources, the database, and the distribution systems that provide the resulting output data to external users. Figure 3 illustrates the end-to-end processing of NCS-A.
The Cb products are produced as raster data retrieval in cf conform netcdf Format. However, the data transfer rate to the cockpits of aeroplanes is limited. Thus, the raster data are polygonised to reduce the amount of data transferred to the cockpit. The Cb nowcasting product can be also visualised at DWD’s meteorological workstation NinJo [27] and is, therefore, available to the routine forecasters. Figure 4 shows the visualisation of the NCS-A Cb severity product as displayed with DWD’s geoweb service and the meteorological workstations.

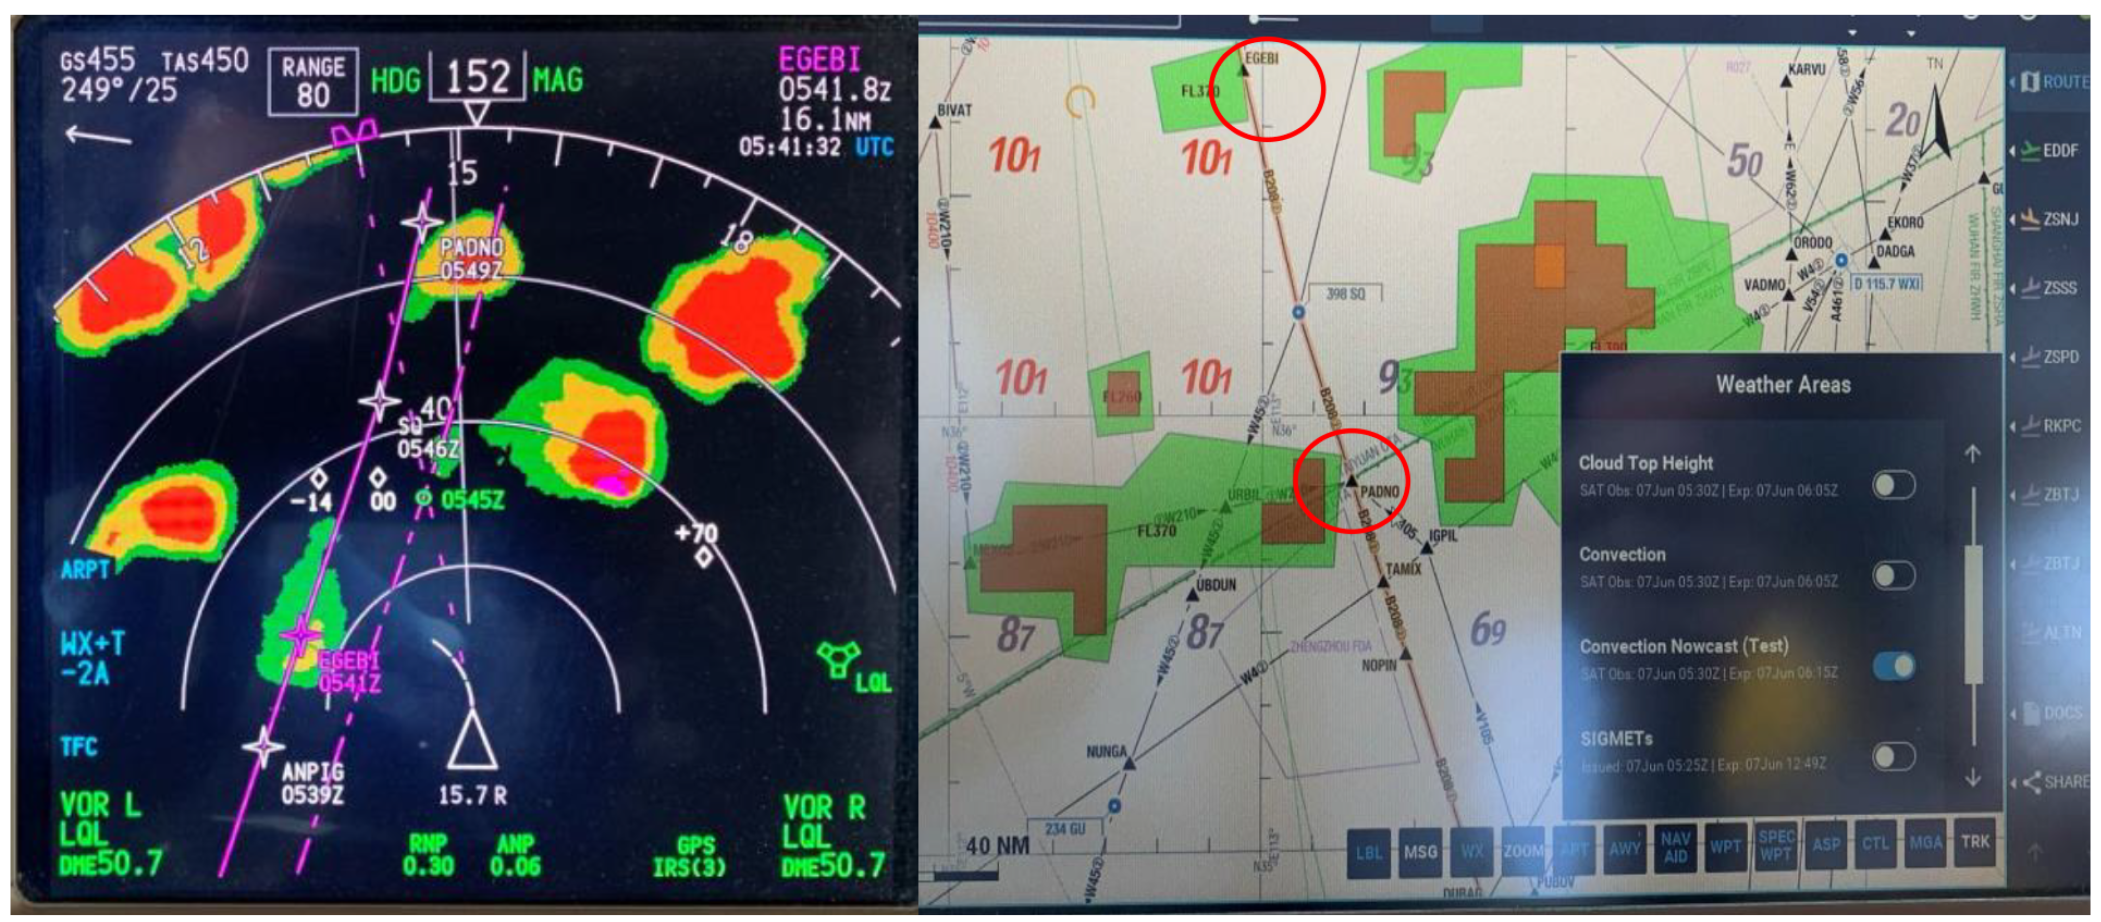
2.5. Cockpit Implementation
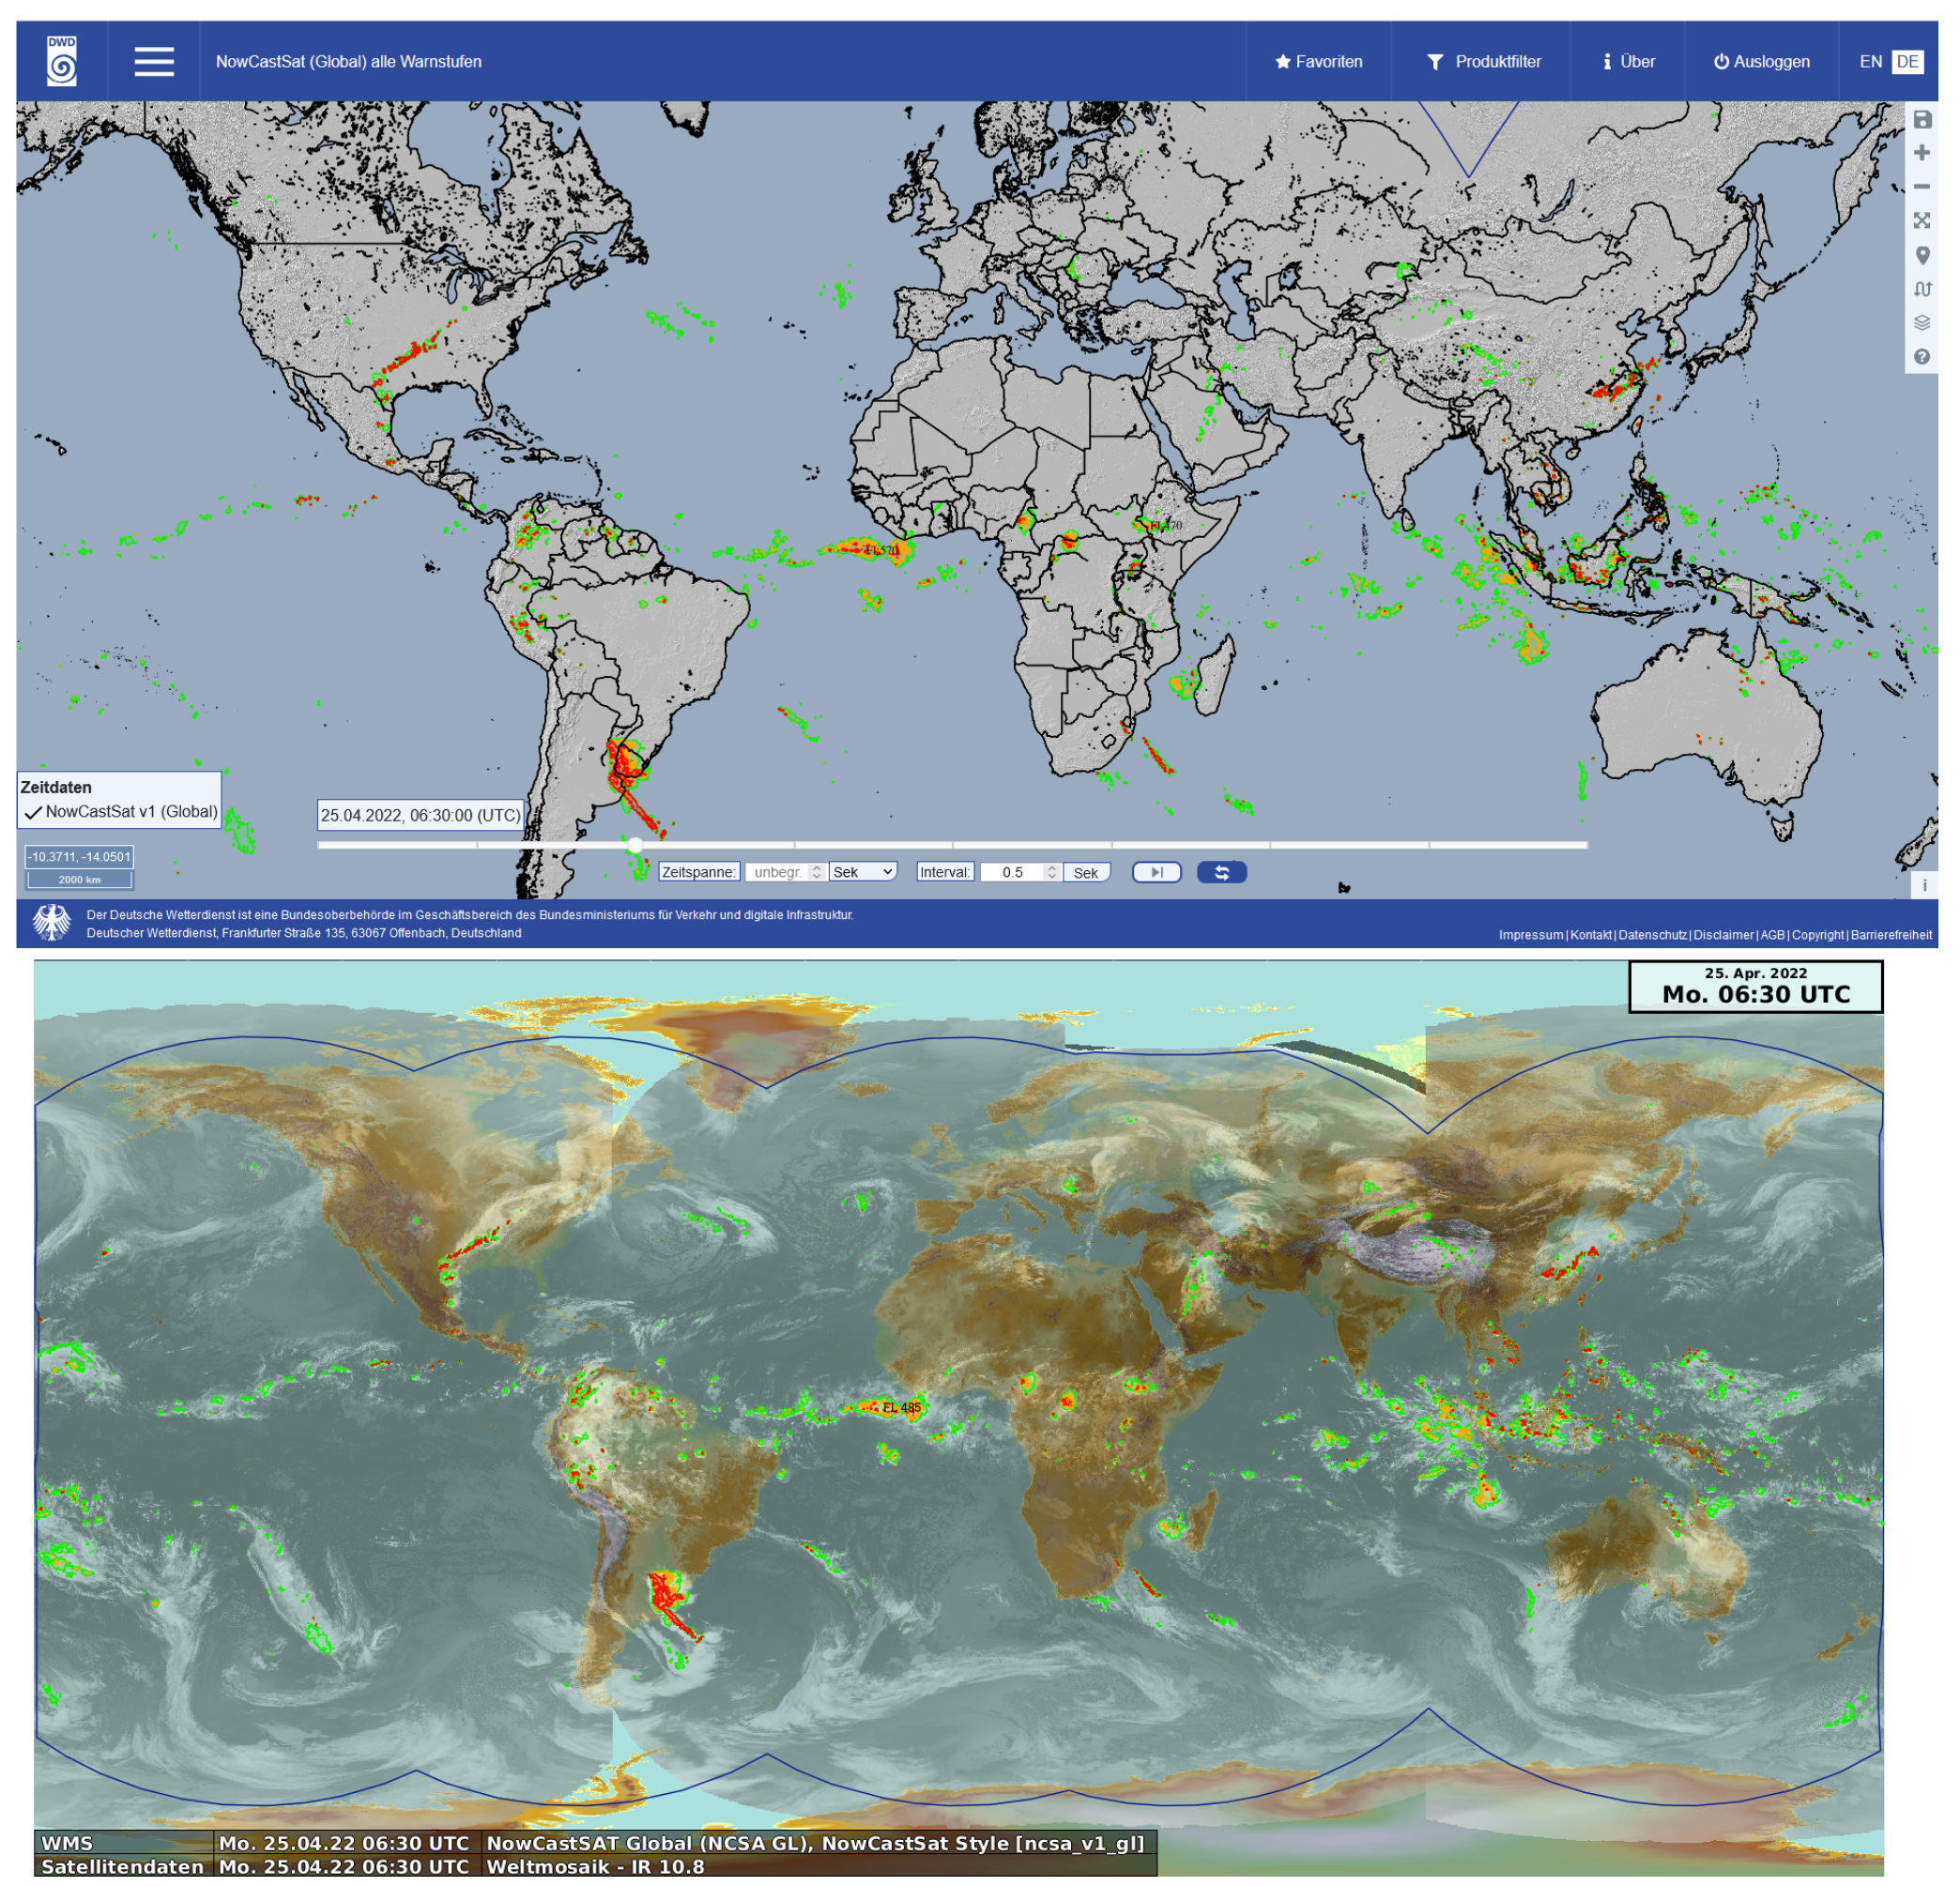
For effective use of the data for route planning, the data are visualised in the cockpit with the aid of a tablet computer (Electronic Flight Bag EFB). Several customers have implemented the NCS-A data for visualisation in their specific visualisation tool. Figure 5 provides an overview about the existing implementations. The examples are eWAS from SITA (https://www.sita.aero/, accessed on 12 May 2022) and eRM as well as mPILOT from Lufthansa Systems (LHSys) (https://www.lhsystems.de/, accessed on 12 May 2022).

3. Results

3.1. Validation of the Operational Nowcasting

Different methods and skill scores are available and applied for evaluation of forecasts. Therefore, the selection and decision of the method and skill scores should be quided by users of the respective forecast product. DWD is therefore in regular contact with aviation customers, e.g., pilots evaluating the products. The near-real-time Cb product reaches the pilot 15 to 20 min after the end of the satellite scan and is interpreted as a quasi-current convection analysis. The focus of the pilots is usually on the forecast periods of 30–60 min. Consequently, special consideration is given to this time interval.
Well established skill scores are used for the statistical analysis of the forecasts up to 2 h. In detail, the probability of detection (POD), the false alarm ratio (FAR) and the critical success index (CSI) [8,14,28]. These skill scores are based on 2 × 2 contingency tables [29] and are determined for the detection and nowcasting of the light and severe convection level of NCS-A compared to the measured lightning. Because the predictions are used in the form of polygons, verification on the basis of objects or pixels would be possible. Both methodological approaches have advantages [28]. Validation based on objects is not optimal to consider the severity or size of the Cbs for the evaluation of the scores. That is why the pixel- and object-based approaches are combined. Lightning can also occur outside the coldest cloud top because of the inclination of the discharge. In addition, horizontal displacement is also possible when the upper, coldest part of the cloud is blown away by strong winds. Finally parallax effects lead to a displacement between NCS-A polygons relative to the lightning events. To account for these spatial uncertainties, a distance of 0.3 degree between nowcasting (ncsa-light-polygon, ncsa-severe-polygon) and lightning measurements are accepted and counted as intersect. This distance of 0.3 degrees considers also the recommendation of the American Air Safety Authority FAA, according to which aircraft should maintain 20 miles lateral distance to Cbs. For each time step (00, 30, 60, 90, 120 min) it is analysed whether the NCS-A “light” and “severe” polygons intersect within the 0.3 degree search radius with a lightning polygon, which is formed from the discharges of the last 15 min of the respective time step. The NCS-A polygon is counted as correctly detected if there is an intersect, otherwise it is classed as a false detection.
In order to consider the size of the polygons, the pixels are counted in a second step. However, disadvantages of the pixel-based method are to be anticipated. Lightning cells and satellite objects cannot be expected to have the same size.
The months of August and September 2021 were used for the validation. Because an update of the NCS-A nowcasting takes place every 15 min, 5650 runs were verified against the lightning measurements for each investigated severity level. The validation is done for the light and subsequently for severe convection:

3.1.1. Light Convection

The resulting skill scores are presented in Figure 6 for the investigated forecast steps. The skill scores show the good performance of the method in particular up to 1 h forecast time. The scores correspond to comparable studies (e.g., best of James et al. [14], POD 0.75 FAR 0.32). The high POD at time step 0 is explained by the fact that due to the morphological filter for the polygons strong convection, i.e., lightning, are usually surrounded by green polygons (the polygons for light convection). Hence, allmost all lightning events are captured by the polygons for light convection for the time step 0. The optimum for POD, a value of 1, is not reached because of slight differences in the synchronisation of satellite scans and lightning data in combination with the polygonisation procedure. The FAR is relatively high for the time step zero. However, it has to be considered that lightning is not a must for the definition of the light convection and that satellite based detection of convection is limited by several handicaps, e.g., misclassification of stratiform cold clouds as Cb [8]. Further, not every cold convective cloud has permanent discharges at all times of the day. Nevertheless, respective convective systems pose still a danger to aviation, e.g., induced by the presence of downdrafts, heavy precipitation or hail, (clear air) turbulence and icing conditions.
The POD, CSI and FAR values for the 1 h forecast are still good in comparison to the values for the analysis, demonstrating the good performance of the nowcasting method. This is also reflected in the comparison with the best values of James et al. [14] (POD 0.46 FAR 0.53). However, as mentioned in Müller et al. [8] comparison with values from the literature have to be interpreted carefully and can only provide a first hint. The optical flow method applied for the nowcasting does not account for decay or development of cells after the analysis time. Thus, the scores degrade with forecast lead time. Furthermore, uncertainties in the estimated optical flow (the velocity vectors) contribute to this degradation. Up to a time step of 90 min, the prediction performance can be considered sufficient and usable for operational applications. For general reliable nowcasting of more than 120 min improvements are necessary—see Section 4.

3.1.2. Severe Convection

Severe convection was validated analogously to light convection, but here the polygons of the severe convection were validated against the lightning measurements. The resulting skill scores are presented in Figure 7 for the investigated forecast steps. The definition of the severe level requires lightning for the detection of Cbs, hence the POD is about 100% and FAR about 0% at the time step 0, also referred to as analysis. These are much better starting values for the nowcasting (the extrapolation with optical flow) than for the light level. Thus, the nowcasting performs much better for the severe level. The POD, CSI and FAR values for the 1 h forecast are still very good. The CSI is with 0.64 significantly above the critical value of 0.5. This demonstrates the good performance of the nowcasting method. The optical flow method applied for the nowcasting does not account for decay of cells or development of cells after the analysis time. This is independent on the severity level and is a serious source for the degradation of the scores with forecast lead time. Up to a time step of 90 min, the prediction performance can be considered sufficient and usable for operational applications. For general reliable nowcasting of more than 120 min improvements are necessary—see Section 4.

3.2. User Evaluation

In addition to the validation study, which provides objective statistical values, the product was also evaluated by forecasters for specific cases. Forecaster of several European weather services have tested the convection product over Europe in summer 2021 within the annual testbed of the European Severe Storm Laboratory [30]: They summarised that “NowCastSAT’s ability to detect the future location of cells was rated on a scale of 1 (bad in all cases) to 5 (spot-on). On average, it was rated 3.6 with grades ranging from 3 (good in about half of the cases) to 4 (good in most cases) and performance was best up to a forecast range of 60 min”. Pilots (of the airlines Lufthansa and SWISS) came to similarly positive assessments in the form of evaluation reports during various trials in the last 1–2 years. Overall, these evaluations in combination with the validation results demonstrated the quality and usability of the novel NCS-A approach.

4. Discussion

The fact that the occurrence of lightning is not a pre-requisite for light and moderate convection level is also due to the reduced detection efficiency over oceans and rural areas with poor sensor coverage. Here, convection indicated by brightness temperature differences might show convection where lightning is not detected by the network.
Optical flow allows only advection of cells, decay or development of new cells are not captured. For example, cells developing after the satellite scan can not be detected by the method. Further all cells are extrapolated up to 2 h, but some cells might already decay before 2 h. DWD is currently developing a respective seamless prediction of convection based on the presented nowcasting approach and the NWP model ICON to overcome these limitations.
The ICOsahedral Nonhydrostatic D2 [23,31] is a nonhydrostatic model that enables improved forecasts of hazardous weather conditions with high-level moisture convection (super and multi-cell thunderstorms, squall lines, mesoscale convective complexes) due to improved physics in combination with its fine mesh size. The first validation results indicates the ability of the model to forecast Cbs with higher skill scores for lead times up to several hours. This would be ground breaking and a good basis for a seamless prediction of Cbs up to 8 h. The domain of ICON-D2 covers Germany and bordering countries with a spatial resolution of 2.2 km.
A first prototype based on simple blending is planned for the summer season 2022. For this, the data fusion will be performed with a simple blending. However, for an improved data fusion, the ANAKLIM++ method is envisioned in analogy to Urbich et al. [32]. First steps with ANAKLIM++ are planned for summer 2022. The novel seamless prediction product will be presented and discussed in detail in a forthcoming paper.
Another way to improve NCS-A is to use artificial intelligence. In Brodehl et al. [33], for example, strong indications are given that deep learning could improve satellite-based Cb nowcasting.

5. Conclusions

The novel NowCastSat-Aviation product was extensively validated and evaluated. The validation compiles an objective analysis based on the skill scores POD, FAR and CSI for 2 months. In addition, an evaluation was performed by external forecasters and pilots, which provide an important feedback concerning the practical usability. Overall, the results demonstrate that the product is quite useful for aviation and general weather forecasts up to 60–90 min forecasts. For example, the CSI for the severe level is, with 0.64, still quite high for the 60 min forecast. It should be emphasised that the product is available on the geostationary ring, i. H. the entire globe is covered in the range of ±75 degrees north and south. This feature sets it apart from regional convection products and enables the use for global aviation applications, thereby meeting the requirements of key customers. The use of the global lightning data GLD360 of VAISALA improve the quality of the product significantly. Furthermore, together with the satellite information, they are a key to a reasonable definition of severity levels. Finally, the use of open source software from the Pytroll and OpenCV libraries is of great benefit to the flexibility of the method and its maintenance and allows to overcome significant technical drawbacks associated with the NWC-SAF software. Currently, the formation or decay of cells is not considered in the nowcasting of NCS-A. This weakness could be addressed by intelligent combination with lightning prediction from NWP or by using deep learning.

Author Contributions

A.B. carried out the operational implementation and is responsible for the further development of monitoring and 24–7 operation of the process. He performed the evaluation of the method and contributed to the development of the method. S.H. has played a major role in the development of NCS-A. Among other things, he developed the Geotools and optimised the optical flow for Cbs. R.M. contributed to the development of the method and wrote large parts of the paper. M.J. supervised the project. All authors contributed to the writing of the manuscript. All authors have read and agreed to the published version of the manuscript.

Funding

This research received no external funding.

Data Availability Statement

The data are available for customers after signing of corresponding contracts.

Acknowledgments

The authors would like to thank the following people for their valuable feedback and suggestions that improved NCS-A: L. Lewe, W. Greiner, O. Matz and A. Ritter from Lufthansa Airlines, M. Gerber and J. Vetsch from SWISS Airlines, A. Medlhammer and A. Erhegyi from Lufthansa Systems GmbH. V. Santos and A. Laj from SITA, W. Rumler from PACE Aerospace and M. Schneider from Eurocontrol MUAC.

Conflicts of Interest

The authors declare no conflict of interest.

Sample Availability

Samples of the compounds are available from the authors.

Abbreviations

The following abbreviations are used in this manuscript:
CbComulinmbus Cloud, Thunderstorm
CSICritical Success Index
CTHCloud top Height
DWDDeutscher Wetterdienst
FARFalse Alarm Ratio
GLDGlobale Lightning Detection
GOESGeostationary Operational Environmental Satellite
hhour(s)
HIMAWARISunslower
MDPIMultidisciplinary Digital Publishing Institute
METEOSATMETEOrological SATellite
minminute(s)
MSGMeteosat Second Generation
NCS-ANowcast Satellite Aviation
PODProbability Of Detection
TV-L1Total Variation L1 norm
LDLinear dichroism

References

  1. Betz, H.; Schmidt, K.; Oettinger, W.; Montag, B. Cell-tracking with lightning data from LINET. Adv. Geosci. 2008, 17, 55–61. [Google Scholar] [CrossRef] [Green Version]
  2. Pohjola, H.; Mäkelä, A. The comparison of GLD360 and EUCLID lightning location systems in Europe. Atmos. Res. 2013, 123, 117–128. [Google Scholar] [CrossRef]
  3. VAISALA. VAISALA GLD360 Global Dataset—Understanding the GLD360 Dataset; Vaisala Corporation, Head Office: Helsinki, Finland, 2022. [Google Scholar]
  4. Said, R.K.; Cohen, M.B.; Inan, U.S. Highly intense lightning over the oceans: Estimated peak currents from global GLD360 observations. J. Geophys. Res. Atmos. 2013, 118, 6905–6915. [Google Scholar] [CrossRef] [Green Version]
  5. Said, R.; Murphy, M. GLD360 Upgrade: Performance Analysis and Applications. In Proceedings of the 24th International Lightning Detection Conference and 6th International Lightning Meteorology Conference, San Diego, CA, USA, 18–21 April 2016. [Google Scholar]
  6. Pessi, A.T.; Businger, S.; Cummins, K.L.; Demetriades, N.W.S.; Murphy, M.; Pifer, B. Development of a Long-Range Lightning Detection Network for the Pacific: Construction, Calibration, and Performance. J. Atmos. Ocean. Technol. 2009, 26, 145–166. [Google Scholar] [CrossRef] [Green Version]
  7. Autones, F. Algorithm Theoretical Basis Document for Rapid Development Thunderstorms; Technical Report; NWC-SAF: Madrid, Spain, 2013. [Google Scholar]
  8. Müller, R.; Haussler, S.; Jerg, M. The Role of NWP Filter for the Satellite Based Detection of Cumulonimbus Clouds. Remote Sens. 2018, 10, 386. [Google Scholar] [CrossRef] [Green Version]
  9. Urbich, I.; Benidx, J.; Müller, R. A Novel Approach for the Short-Term Forecast of the Effective Cloud Albedo. Remote Sens. 2018, 10, 955. [Google Scholar] [CrossRef] [Green Version]
  10. Zach, C.; Pock, T.; Bischof, H. A duality based approach for realtime TV-L1 optical flow. In Proceedings of the Joint Pattern Recognition Symposium, Heidelberg, Germany, 12–14 September 2007; pp. 214–223. [Google Scholar]
  11. Sánchez, J.P.; Meinhardt-Llopis, E.; Facciolo, G. TV-L1 optical flow estimation. Image Process. Online 2013, 3, 137–150. [Google Scholar] [CrossRef] [Green Version]
  12. Barleben, A.; Haussler, S.; Müller, R.; Jerg, M. A Novel Approach for Satellite-Based Turbulence Nowcasting for Aviation. Remote Sens. 2020, 12, 2255. [Google Scholar] [CrossRef]
  13. Ayzel, G.; Heistermann, M.; Winterrath, T. Optical flow models as an open benchmark for radar-based precipitation nowcasting (rainymotion v0.1). Geosci. Model Dev. 2019, 12, 1387–1402. [Google Scholar] [CrossRef] [Green Version]
  14. James, P.; Reichert, B.; Heizenreder, D. NowCastMIX: Automatic Integrated Warnings for Severe Convection on Nowcasting Time Scales at the German Weather Service, Weather and Forecasting. Weather. Forecast. 2018, 33, 1413–1433. [Google Scholar] [CrossRef]
  15. Schmetz, J.; Pili, P.; Tjemkes, S.; Just, D.; Kerkmann, J.; Rota, S.; Ratier, A. An introduction to Meteosat Second Generation (MSG). Bull. Am. Met. Soc. 2002, 83, 977–992. [Google Scholar] [CrossRef]
  16. GOES. GOES-R Series Data Book; CDRL PM-14, National Aeronautics and Space Administration; GOES-R Series Program Office Goddard Space Flight Center: Greenbelt, MD, USA, 2019. [Google Scholar]
  17. Himawari. Himawari-89—Himawari Standard Data User’s Guide; Version 1.3; Japan Meteorological Agency: Tokyo, Japan, 2017. [Google Scholar]
  18. Schneider, M.; Maastricht Upper Area Control Centre (MUAC), Maastricht Airport, The Netherlands; Barleben, A.; DWD, Offenbach, Germany. User Feedback Loop with M. Schneider from MUAC Starting April 2019 and Finalized 31 March 2022. Personal communication, 2022. [Google Scholar]
  19. Mosher, F. Detection of deep convection around the globe. In Proceedings of the 10th Conference on Aviation, Range and Aerospace Meteorology, Portland, OR, USA, 13–16 May 2002; American Meteorological Society: Boston, MA, USA, 2002; pp. 289–292. [Google Scholar]
  20. Bedka, K.; Brunner, J.; Dworak, R.; Feltz, W.; Otkin, J.; Greenwald, T. Objective satellite-based detection of overshooting tops using infrared window channel brightness temperature gradients. Appl. Meteorol. Climatol. 2010, 49, 181–202. [Google Scholar] [CrossRef]
  21. Schmetz, J.; Tjemkes, A.; Gube, M.; van der Berg, L. Monitoring deep convection and convective overshooting with Meteosat. Adv. Space Res. 1997, 19, 433–441. [Google Scholar] [CrossRef]
  22. Cohen, M.B.; Inan, U.S.; Paschal, E.W. Sensitive Broadband ELF/VLF Radio Reception With the AWESOME Instrument. IEEE Trans. Geosci. Remote Sens. 2010, 48, 3–17. [Google Scholar] [CrossRef]
  23. Zängl, G.; Reinert, D.; Rípodas, P.; Baldauf, M. The ICON (ICOsahedral Non-hydrostatic) modelling framework of DWD and MPI-M: Description of the non-hydrostatic dynamical core. Q. J. R. Meteorol. Soc. 2015, 141, 563–579. [Google Scholar] [CrossRef]
  24. Griffin, S.M.; Bedka, K.M.; Velden, C.S. A Method for Calculating the Height of Overshooting Convective Cloud Tops Using Satellite-Based IR Imager and CloudSat Cloud Profiling Radar Observations. J. Appl. Meteorol. Climatol. 2016, 55, 479–491. [Google Scholar] [CrossRef]
  25. OpenCV. OpenCV Homepage. OpenCV Is an Open-Source, Computer-Vision Library for Extracting and Processing Meaningful Data from Images. Available online: http://opencv.org/ (accessed on 11 April 2022).
  26. Bradski, G. The OpenCV Library. Dr. Dobb’s J. Softw. Tools 2000, 120, 122–125. [Google Scholar]
  27. Joe, P.; Koppert, H.J.; Heizenreder, D.; Erbshaeusser, B.; Raatz, W.; Reichert, B.; Rohn, M. Severe weather forecasting tools in the NinJo workstation. In Proceedings of the World Weather Research Program Symposium on Nowcasting and Very Short Range Forecasting, Toulouse, France, 5–9 September 2005. [Google Scholar]
  28. Zinner, T.; Forster, C.; de Coning, E.; Betz, H.D. Validation of the Meteosat storm detection and nowcasting system Cb-TRAM with lightning network data—Europe and South Africa. Atmos. Meas. Tech. 2013, 6, 1567–1583. [Google Scholar] [CrossRef] [Green Version]
  29. Wilks, D.S. Statistical Methods in the Atmospheric Sciences; International Geophysics Series; Elsevier: Amsterdam, The Netherlands, 2006; Volume 91. [Google Scholar]
  30. Gatzen, C.; Pucik, T.; Groenemeijer, P. Report on the Evaluation of DWD Nowcast and Warning Products at the ESSL Testbed 2021; DWD internal 3053581 19-KAP; Technical Report DWD internal 3053581 19-KAP; European Severe Storms Laboratory: Wessling, Germany, 2021. [Google Scholar]
  31. Reinert, D.; Prill, F.; Frank, H.; Denhard, M.; Baldauf, M.; Schraff, C.; Gebhardt, C.; Marsigli, C.; Zängl, G. DWD Database Reference for the Global and Regional ICON and ICON-EPS Forecasting System; Technical Report Version 2.1.7; DWD: Offenbach, Germany, 2021. [Google Scholar]
  32. Urbich, I.; Bendix, J.; Müller, R. Development of a Seamless Forecast for Solar Radiation Using ANAKLIM++. Remote Sens. 2020, 12, 3672. [Google Scholar] [CrossRef]
  33. Brodehl, S.; Müller, R.; Schömer, E.; Spichtinger, P.; Wand, M. End-to-End Prediction of Lightning Events from Geostationary Satellite Images. Preprints 2022. [Google Scholar] [CrossRef]
Figure 1. (Left hand): Photograph of the on-board radar display of a Lufthansa flight with heading 152 degree near way-point EGEBI (China) towards waypoint PADNO. The NCS-A information (right hand) provided in the EFB tablet computer in the cockpit supports situational awareness, e.g., that the passage of the southeast way-point PADNO could be possible and that there is likely no strong convection behind it (in the South, the lower part of the map).
Remotesensing 14 03372 g001
Figure 2. Illustration of the process for the definition of the light convection. The satellite data with BT larger than −1 (left hand) is folded with the NWP filter (middle) in order to derive the final product for light convection (right hand).
Remotesensing 14 03372 g002
Figure 3. Illustration of the NCS-A end-to-end processing at DWD.
Remotesensing 14 03372 g003
Figure 4. (Top): Visualisation of the NowCastSat-Aviation product in DWD’s WebGIS Briefing System protoype. NCS-A covers the complete geostationary ring. The blue line indicates the satellite coverage. Light convection is shown in green, moderate in orange and severe in red. (Bottom): Visualisation of the NowCastSat-Aviation product in DWD’s NinJo meteorological workstation. Both images show the convective situation on 25 April 2022 6:30 UTC. Note the tropical cyclone “Jasmine” in the Indian Ocean and a large mesoscale convective system (MCS) in the La Plata Basin, as well as other significant convective systems in the Altantic and Indo-Pacific. Both client systems are connected to DWD’s Geoserver where the data are available per Web Mapping and Web Feature Service (WMS/WFS)—see Figure 3.
Remotesensing 14 03372 g004
Figure 5. Technical implementation of NCS-A in various visualisation systems. (Top left): For forecasters in DWD workstation NinJo with observed satellite and lightning data underlayed. For pilots in different EFBs: (top right): eWAS/SITA, (bottom left): eRM/LHSys, (bottom right): mPILOT/LHSys. A mesoscale convective system is shown with severe convection (cloud top height in flight level 540) over Kenya on 14 February 2022 12 UTC.
Remotesensing 14 03372 g005
Figure 6. Skill Scores for light severity level of NCS-Av1GL as a function of lead time for analysis (timestep 0) and nowcasting after 30, 60, 90, 120 min against lightning measurement with an offset of 0.3 degree.
Remotesensing 14 03372 g006
Figure 7. Skill Scores for severe severity level of NCS-Av1GL as a function of lead time for analysis (timestep 0) and nowcasting after 30, 60, 90, 120 min against lightning measurement with an offset of 0.3 degree.
Remotesensing 14 03372 g007
Table 1. The NCS-A parameter settings used for TV-L1.
ParameterValueParameterValueParameterValue
Tau0.15Lambda0.05Theta0.3
Epsilon0.005Outer Iterations20Inner Iterations20
Gamma0Scales N5Scale Step0.5
Warps10Median Filtering1--
Publisher’s Note: MDPI stays neutral with regard to jurisdictional claims in published maps and institutional affiliations.

