
Validation of NASA SMAP Satellite Soil Moisture Products over the Desert of Kuwait

 ,
,  ,
,  , and
, and
Abstract
:1. Introduction
2. Methodology
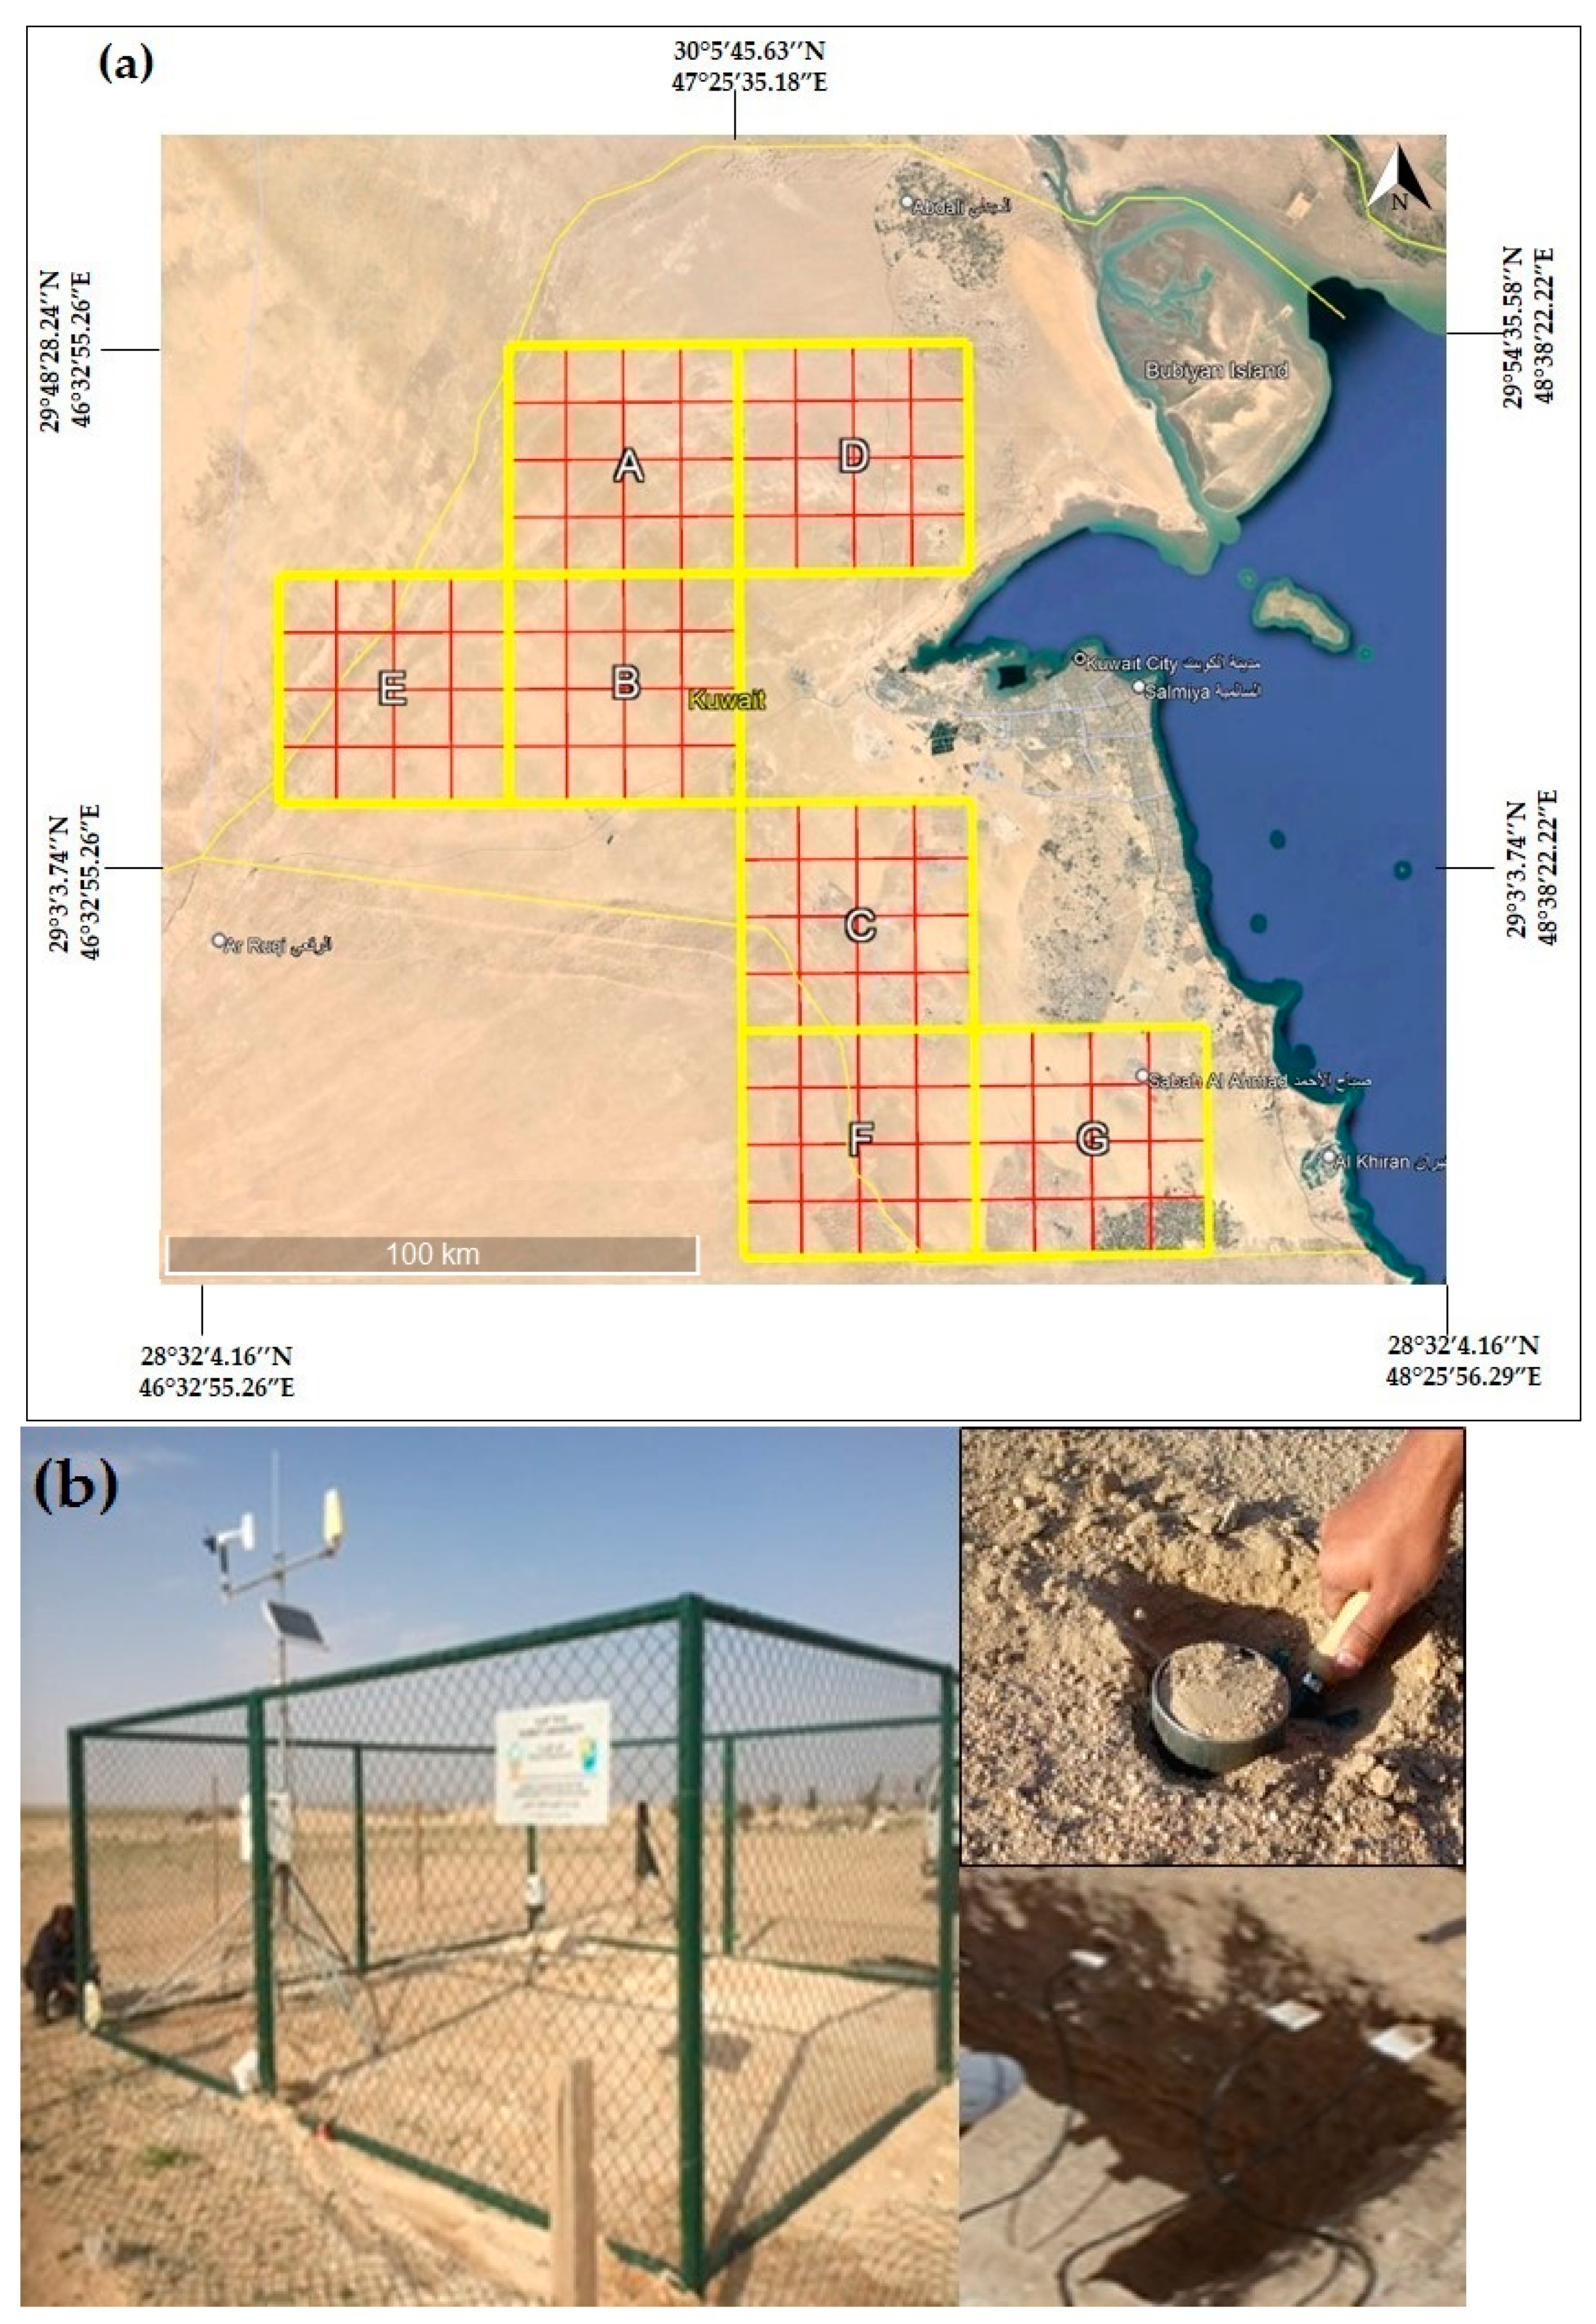
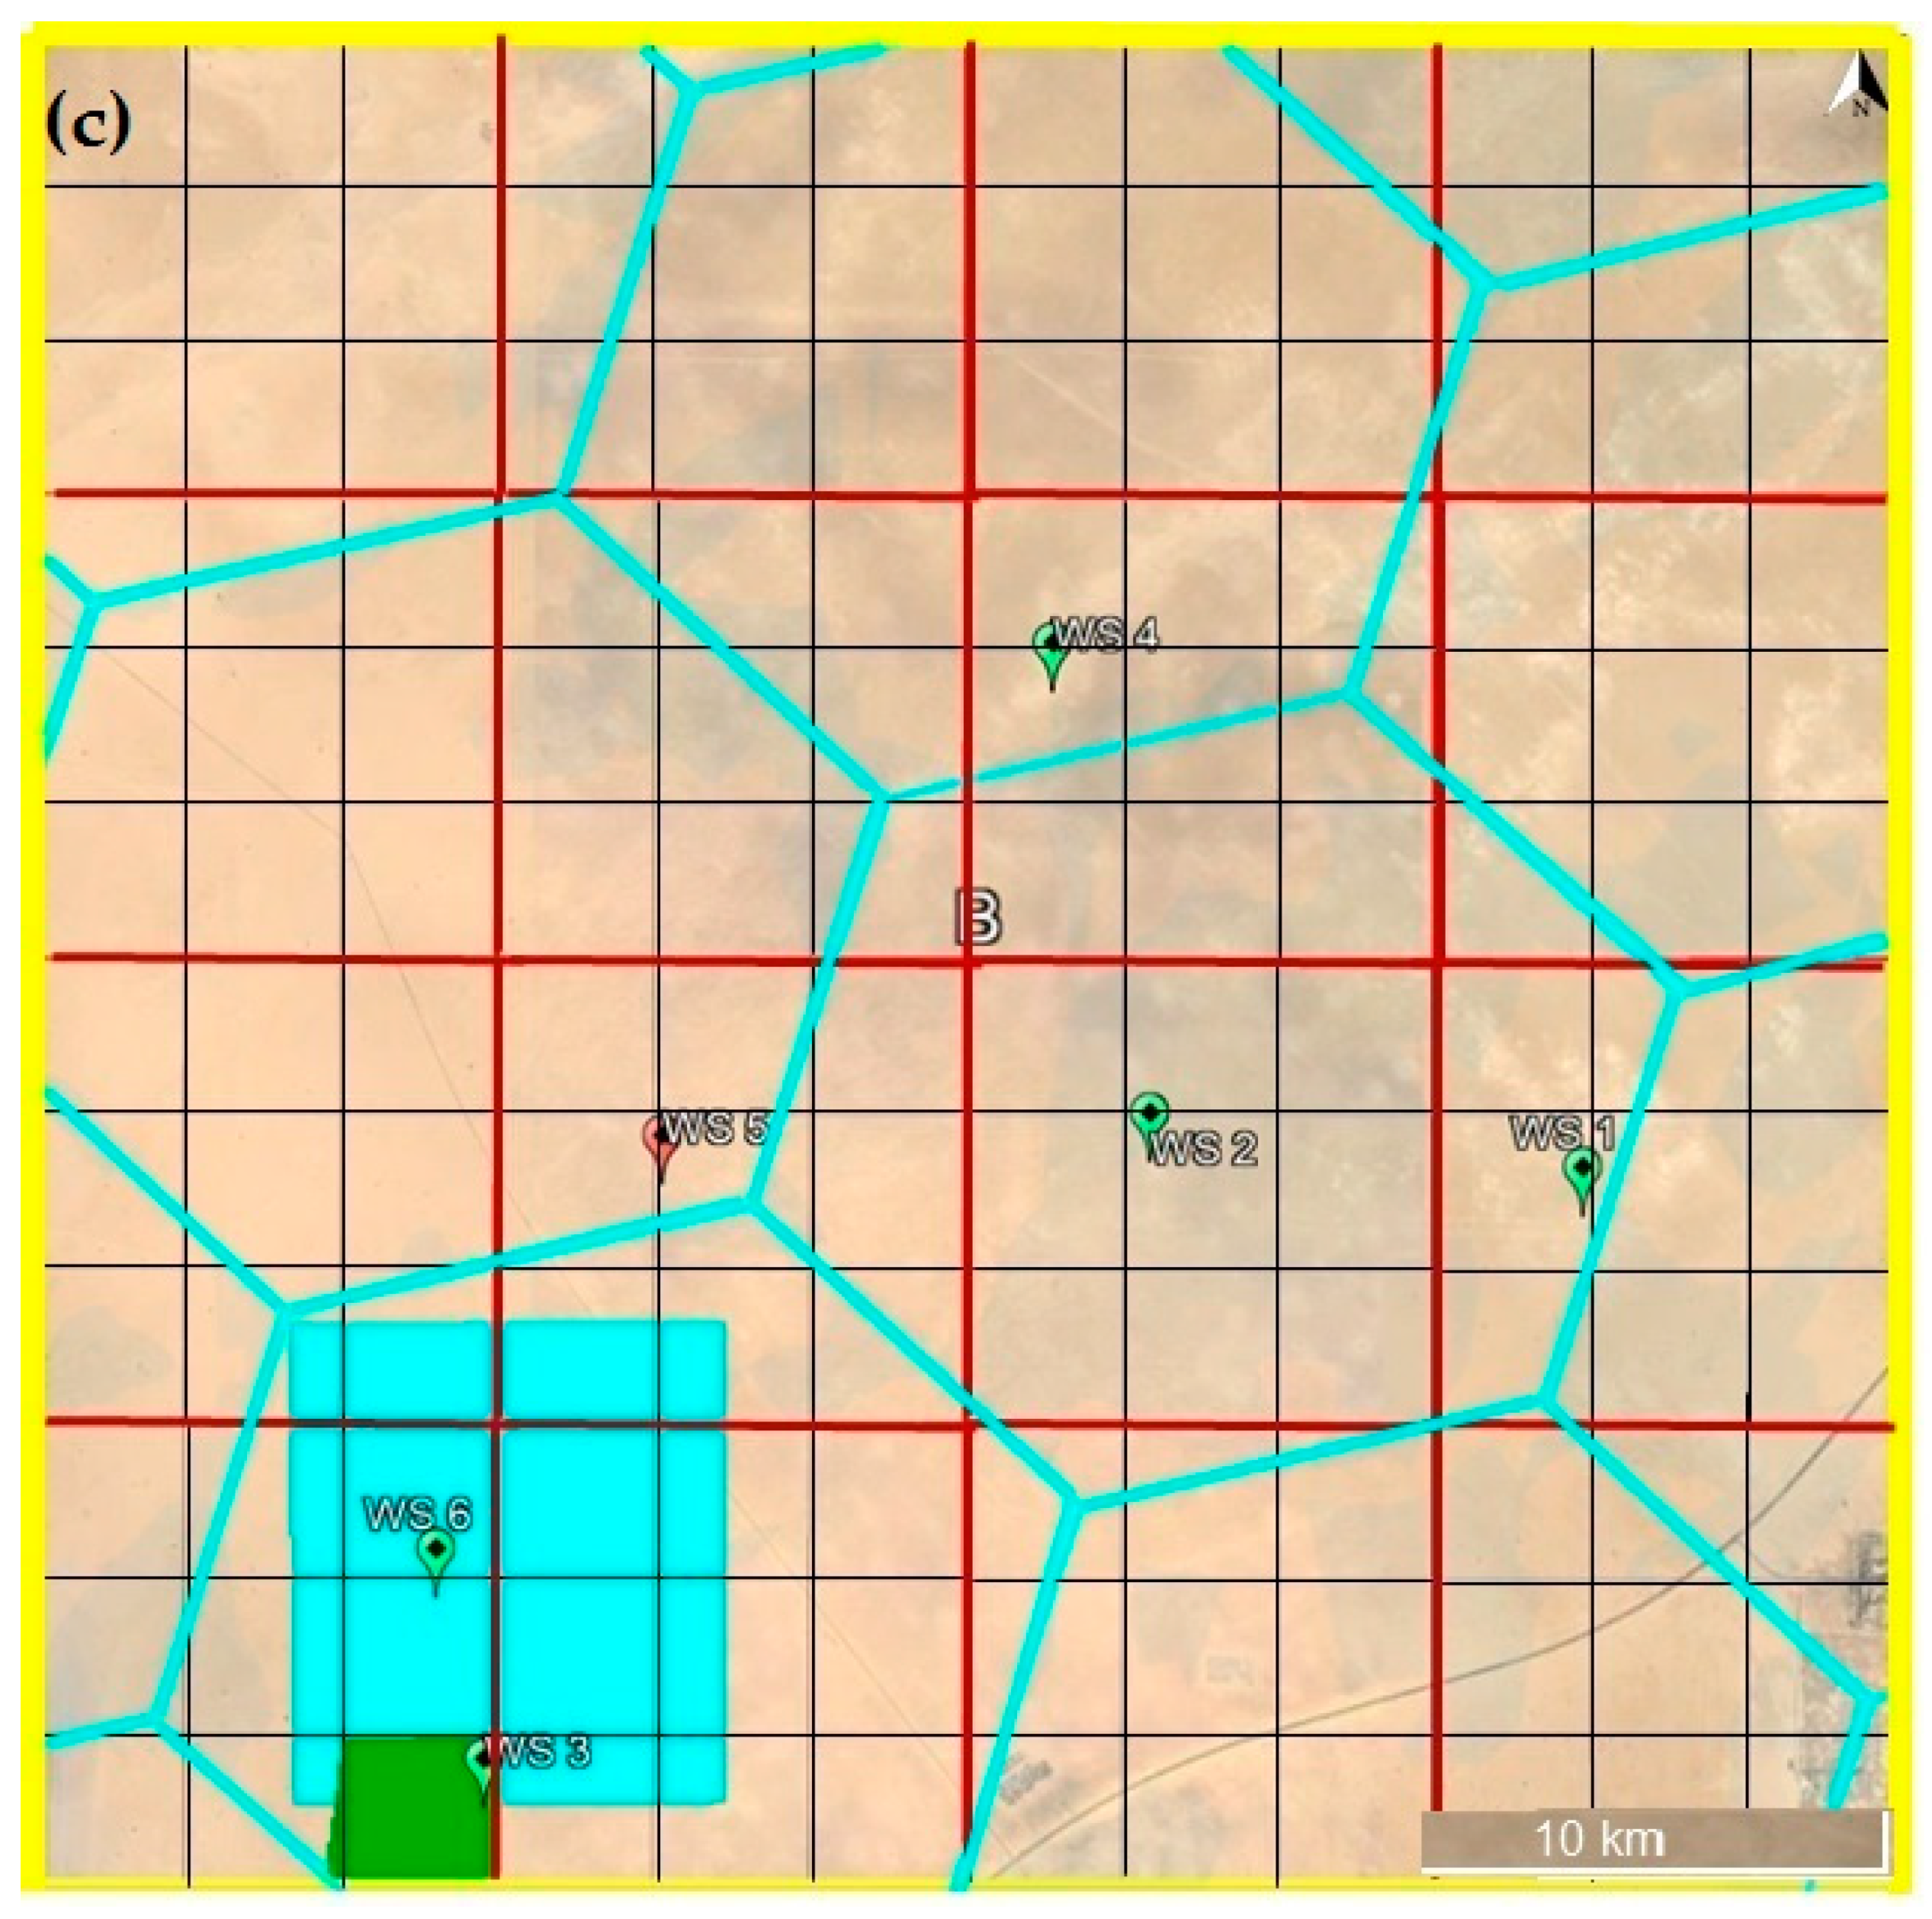
2.1. Study Area
2.2. Datasets
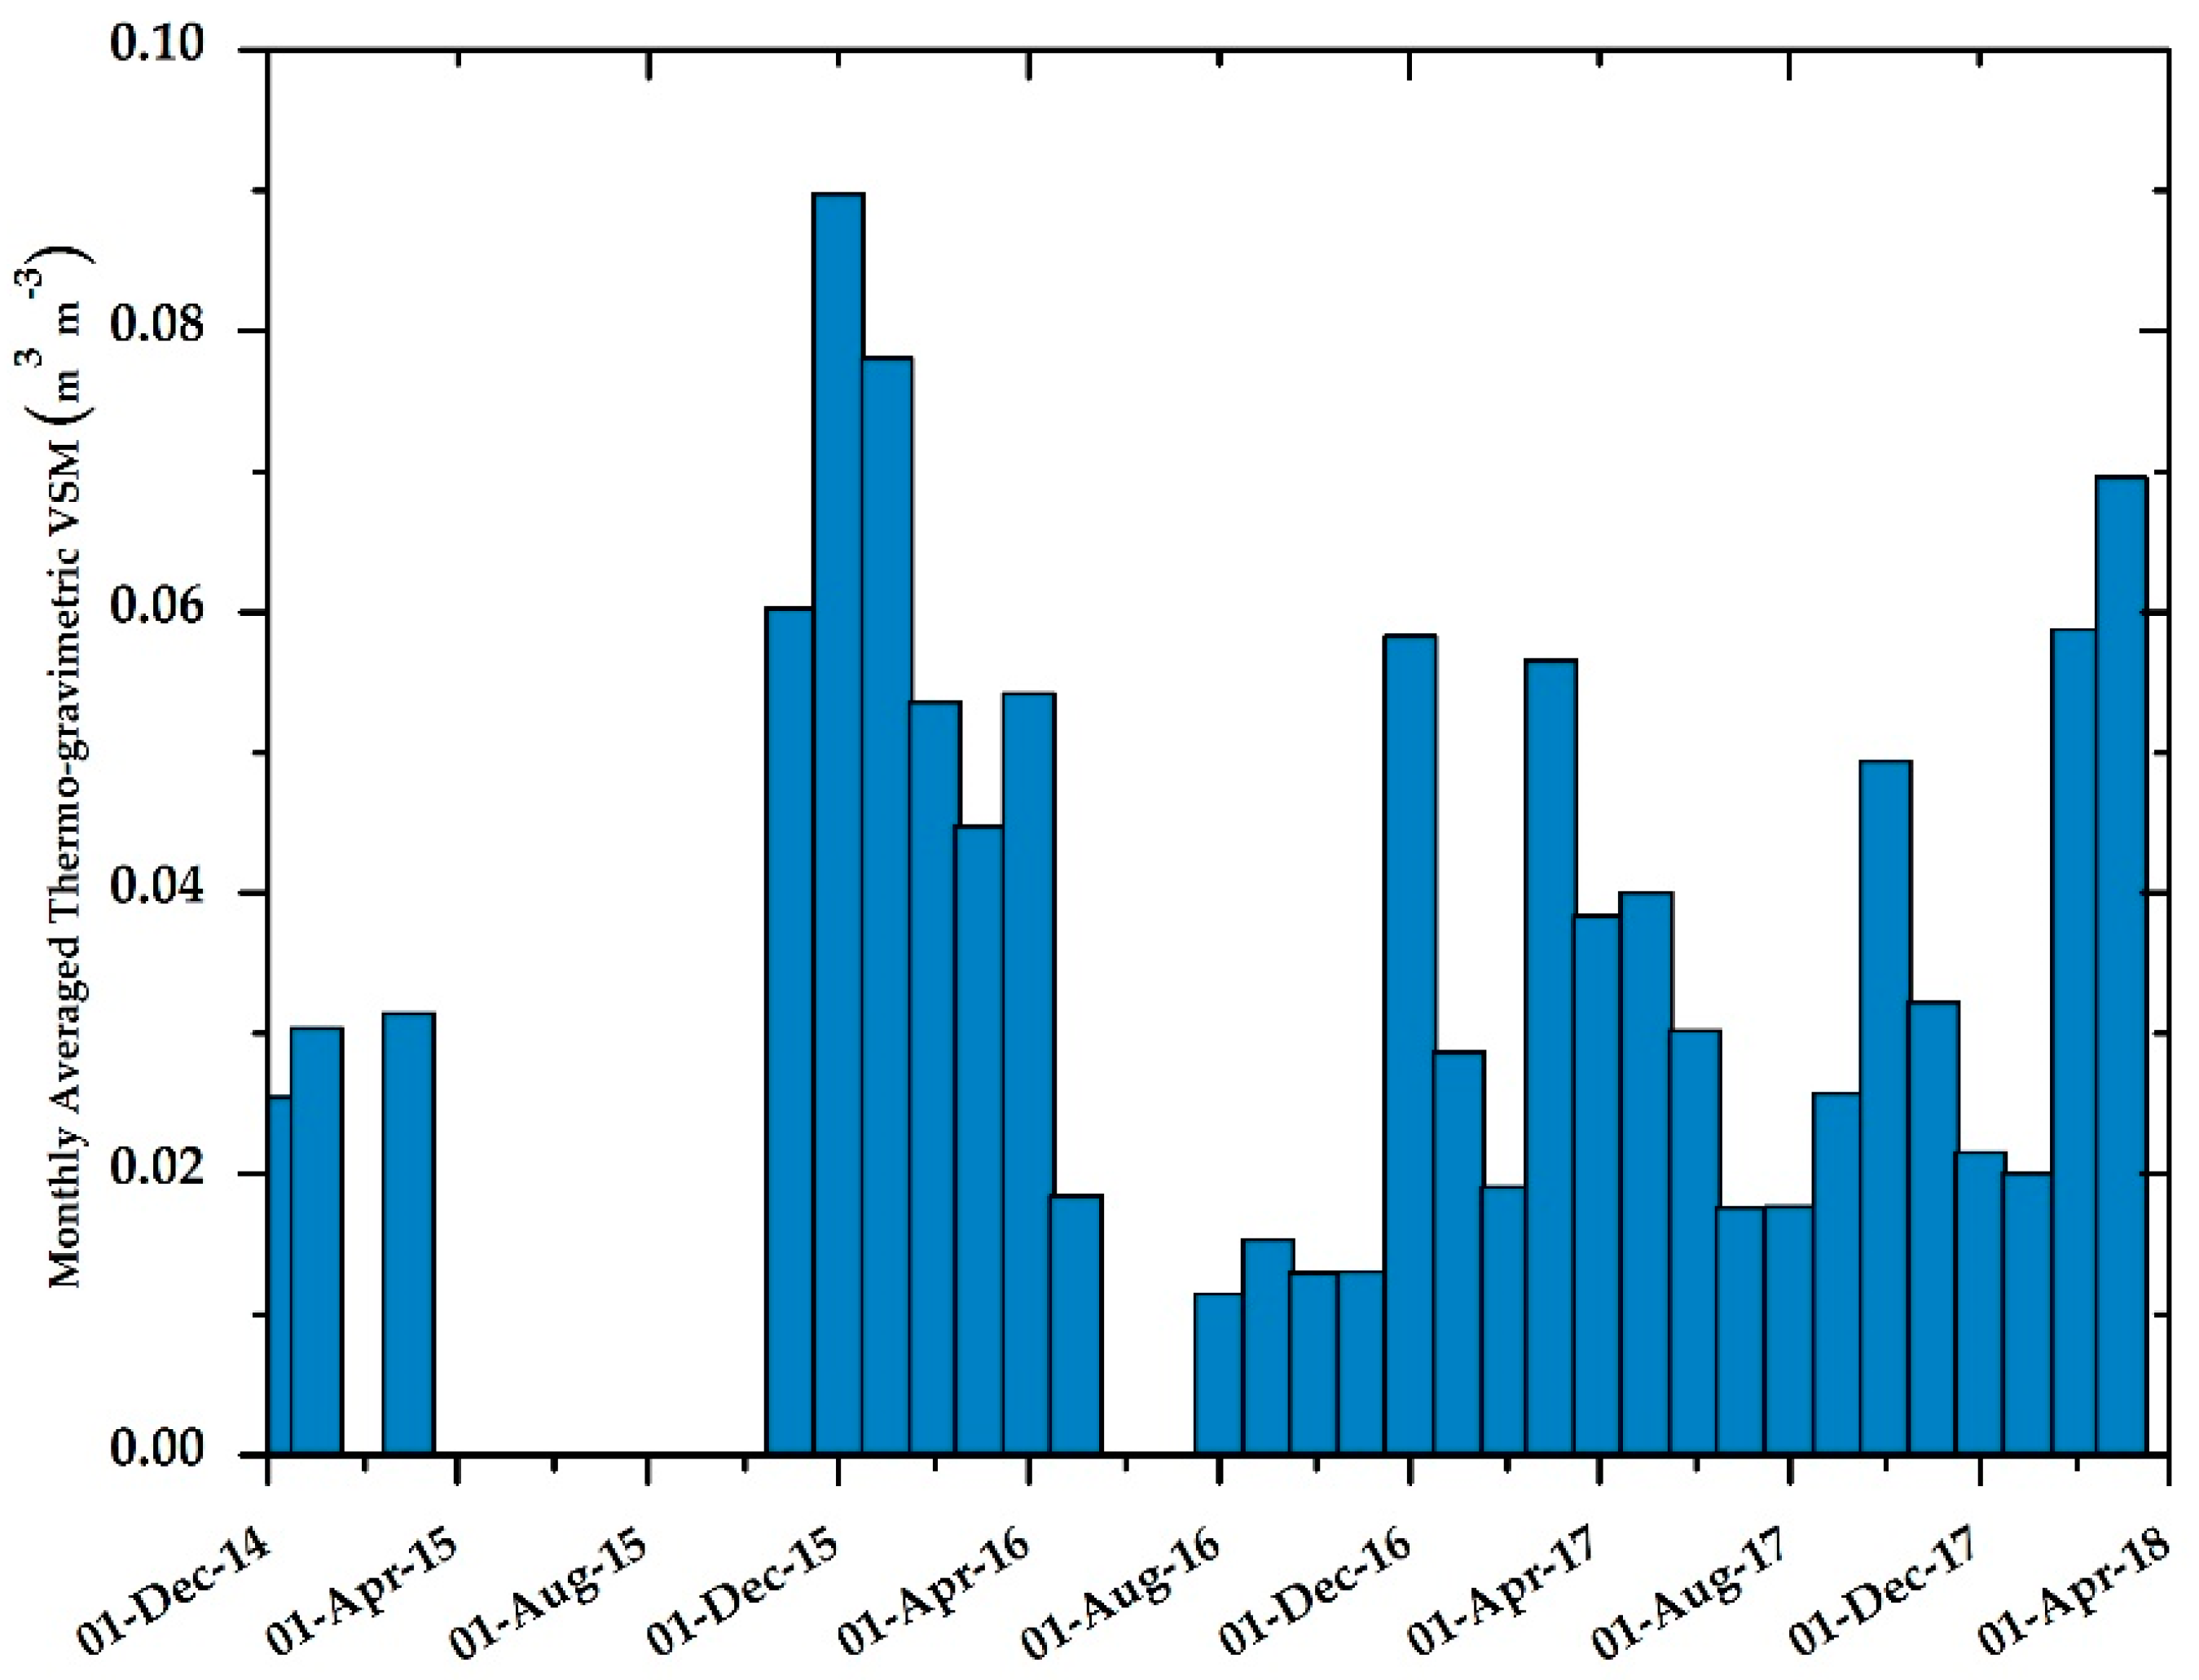
2.2.1. Thermogravimetric Dataset
2.2.2. Permanent Ground Station Dataset
2.2.3. SMAP Dataset
2.2.4. SMOS Dataset
2.2.5. Radio Frequency Contamination and Filtration
2.3. Soil Moisture Data Analysis Techniques
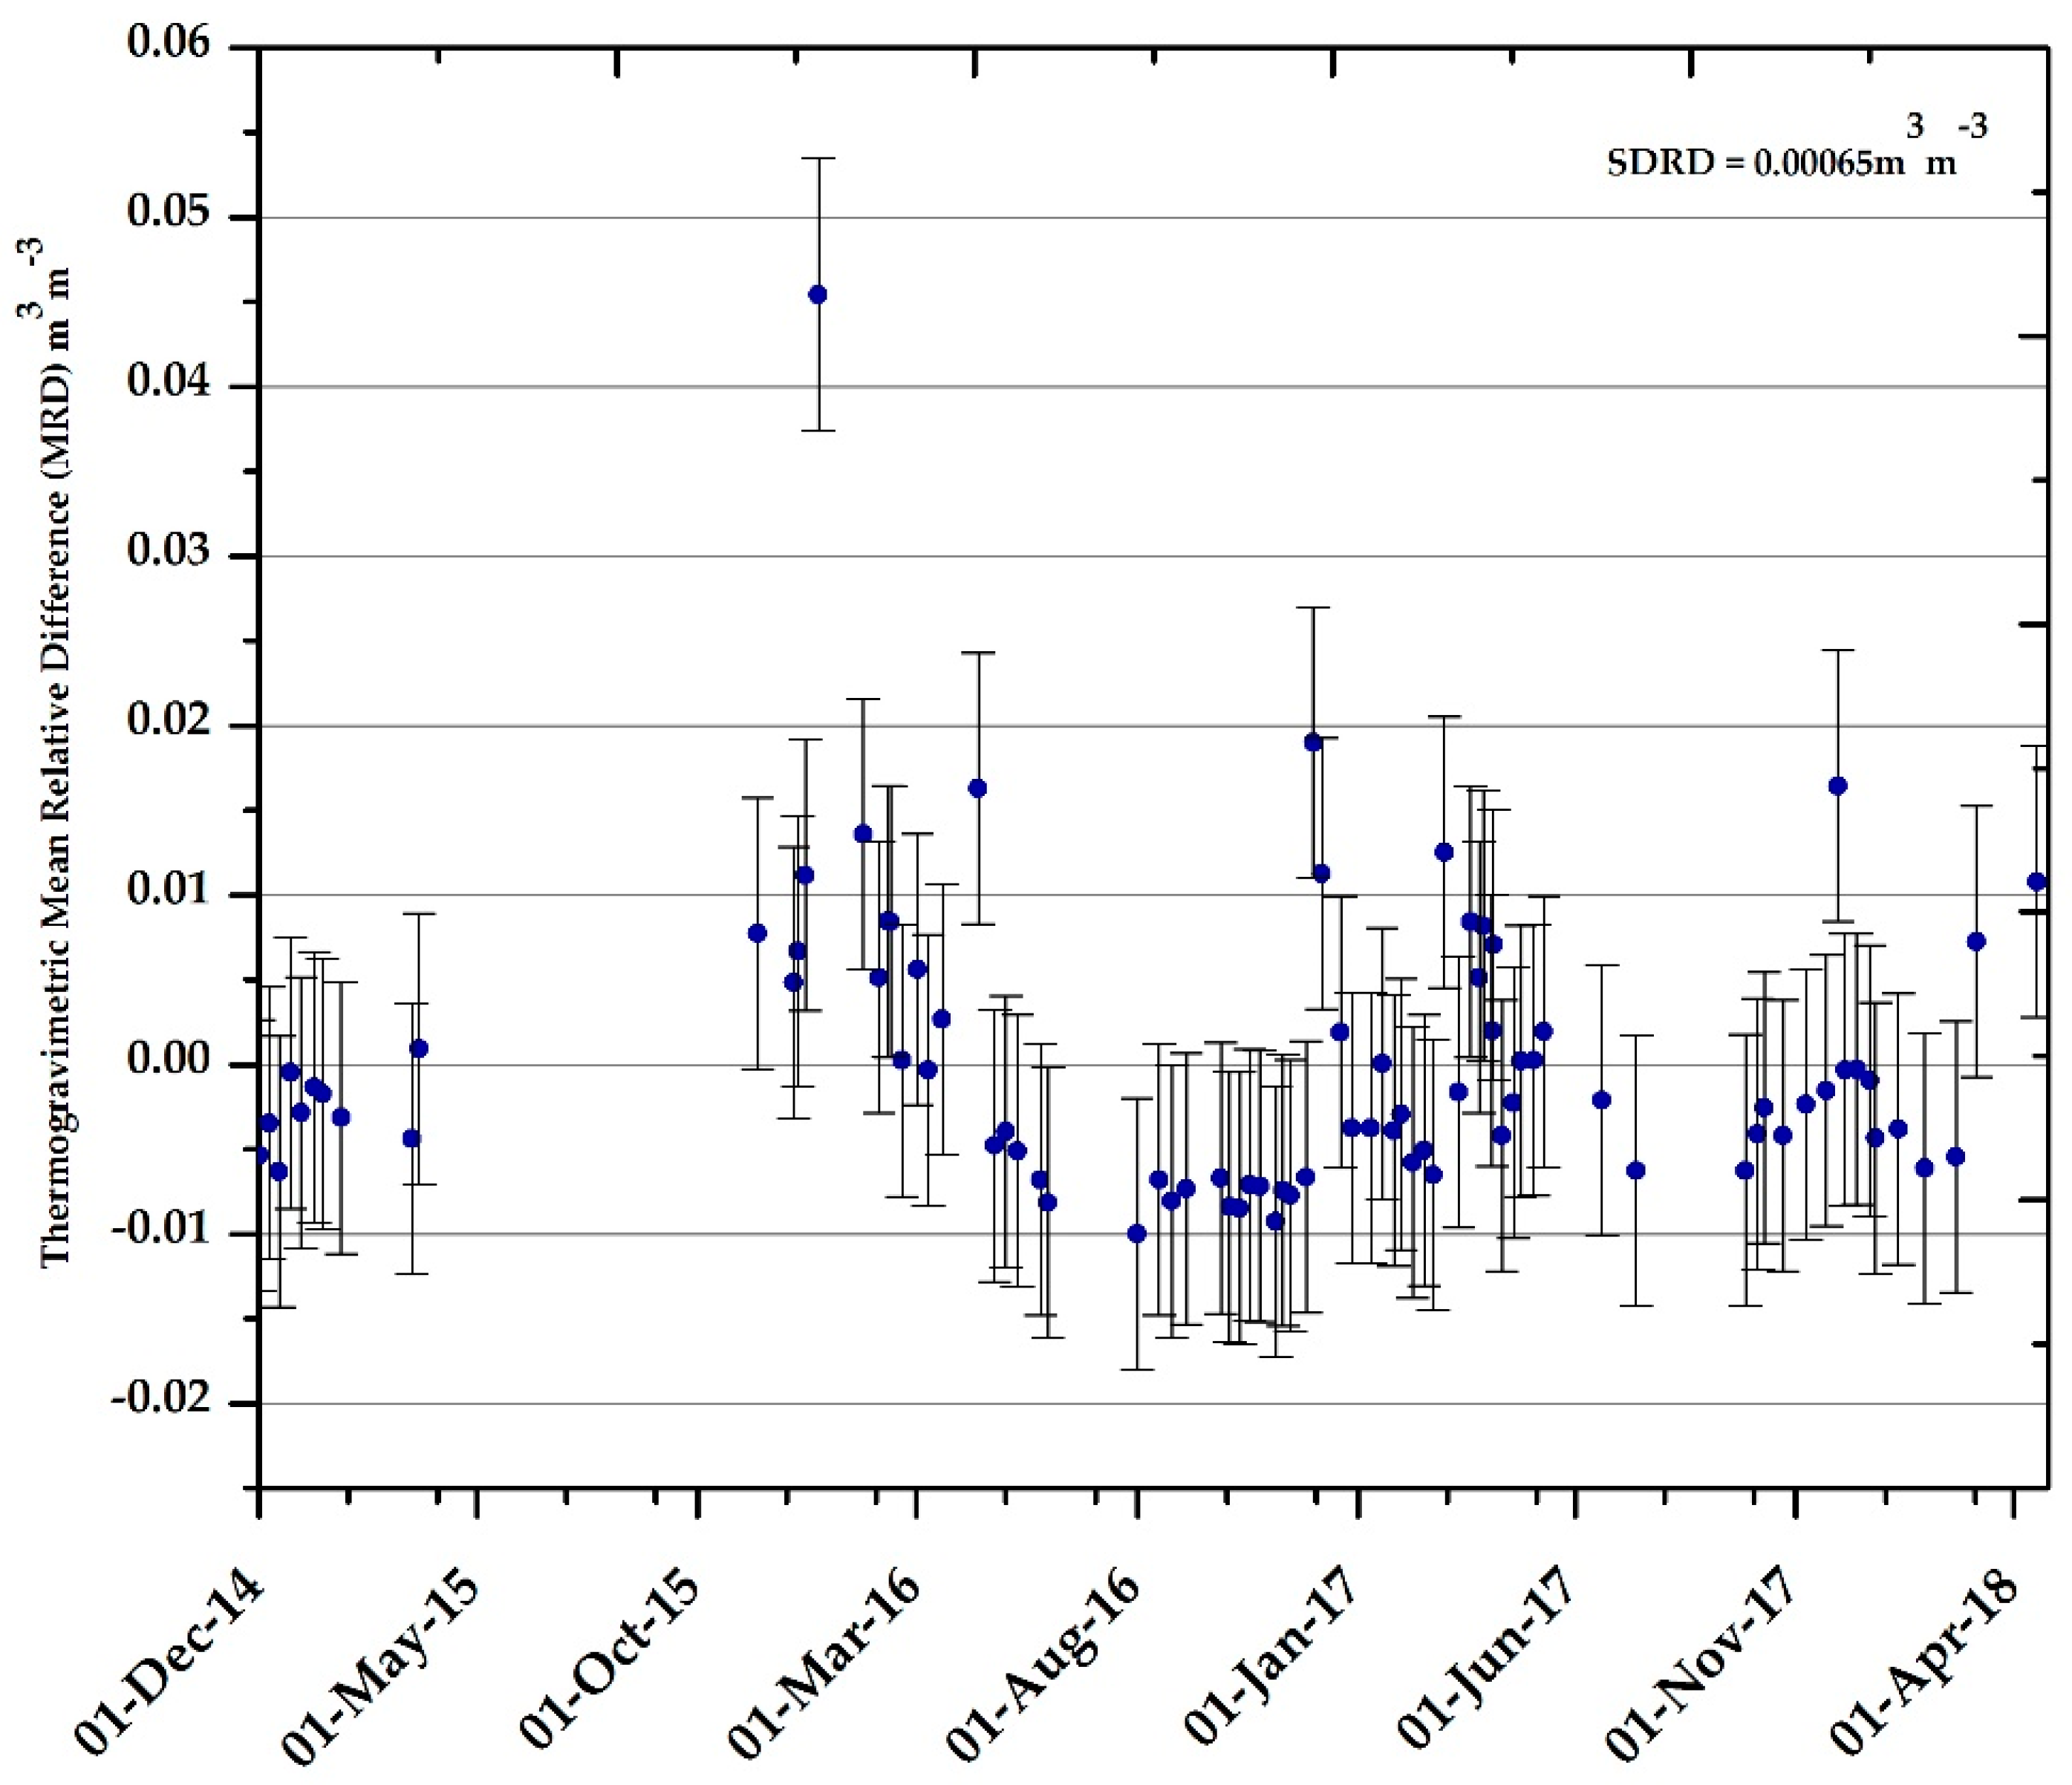
2.3.1. Thermogravimetric and Ground Station SM Data Analysis
2.3.2. Soil Moisture Sampling Density Analysis
2.3.3. Satellite Soil Moisture Data Product Analysis
3. Results
3.1. Temporal Stability of Test Site
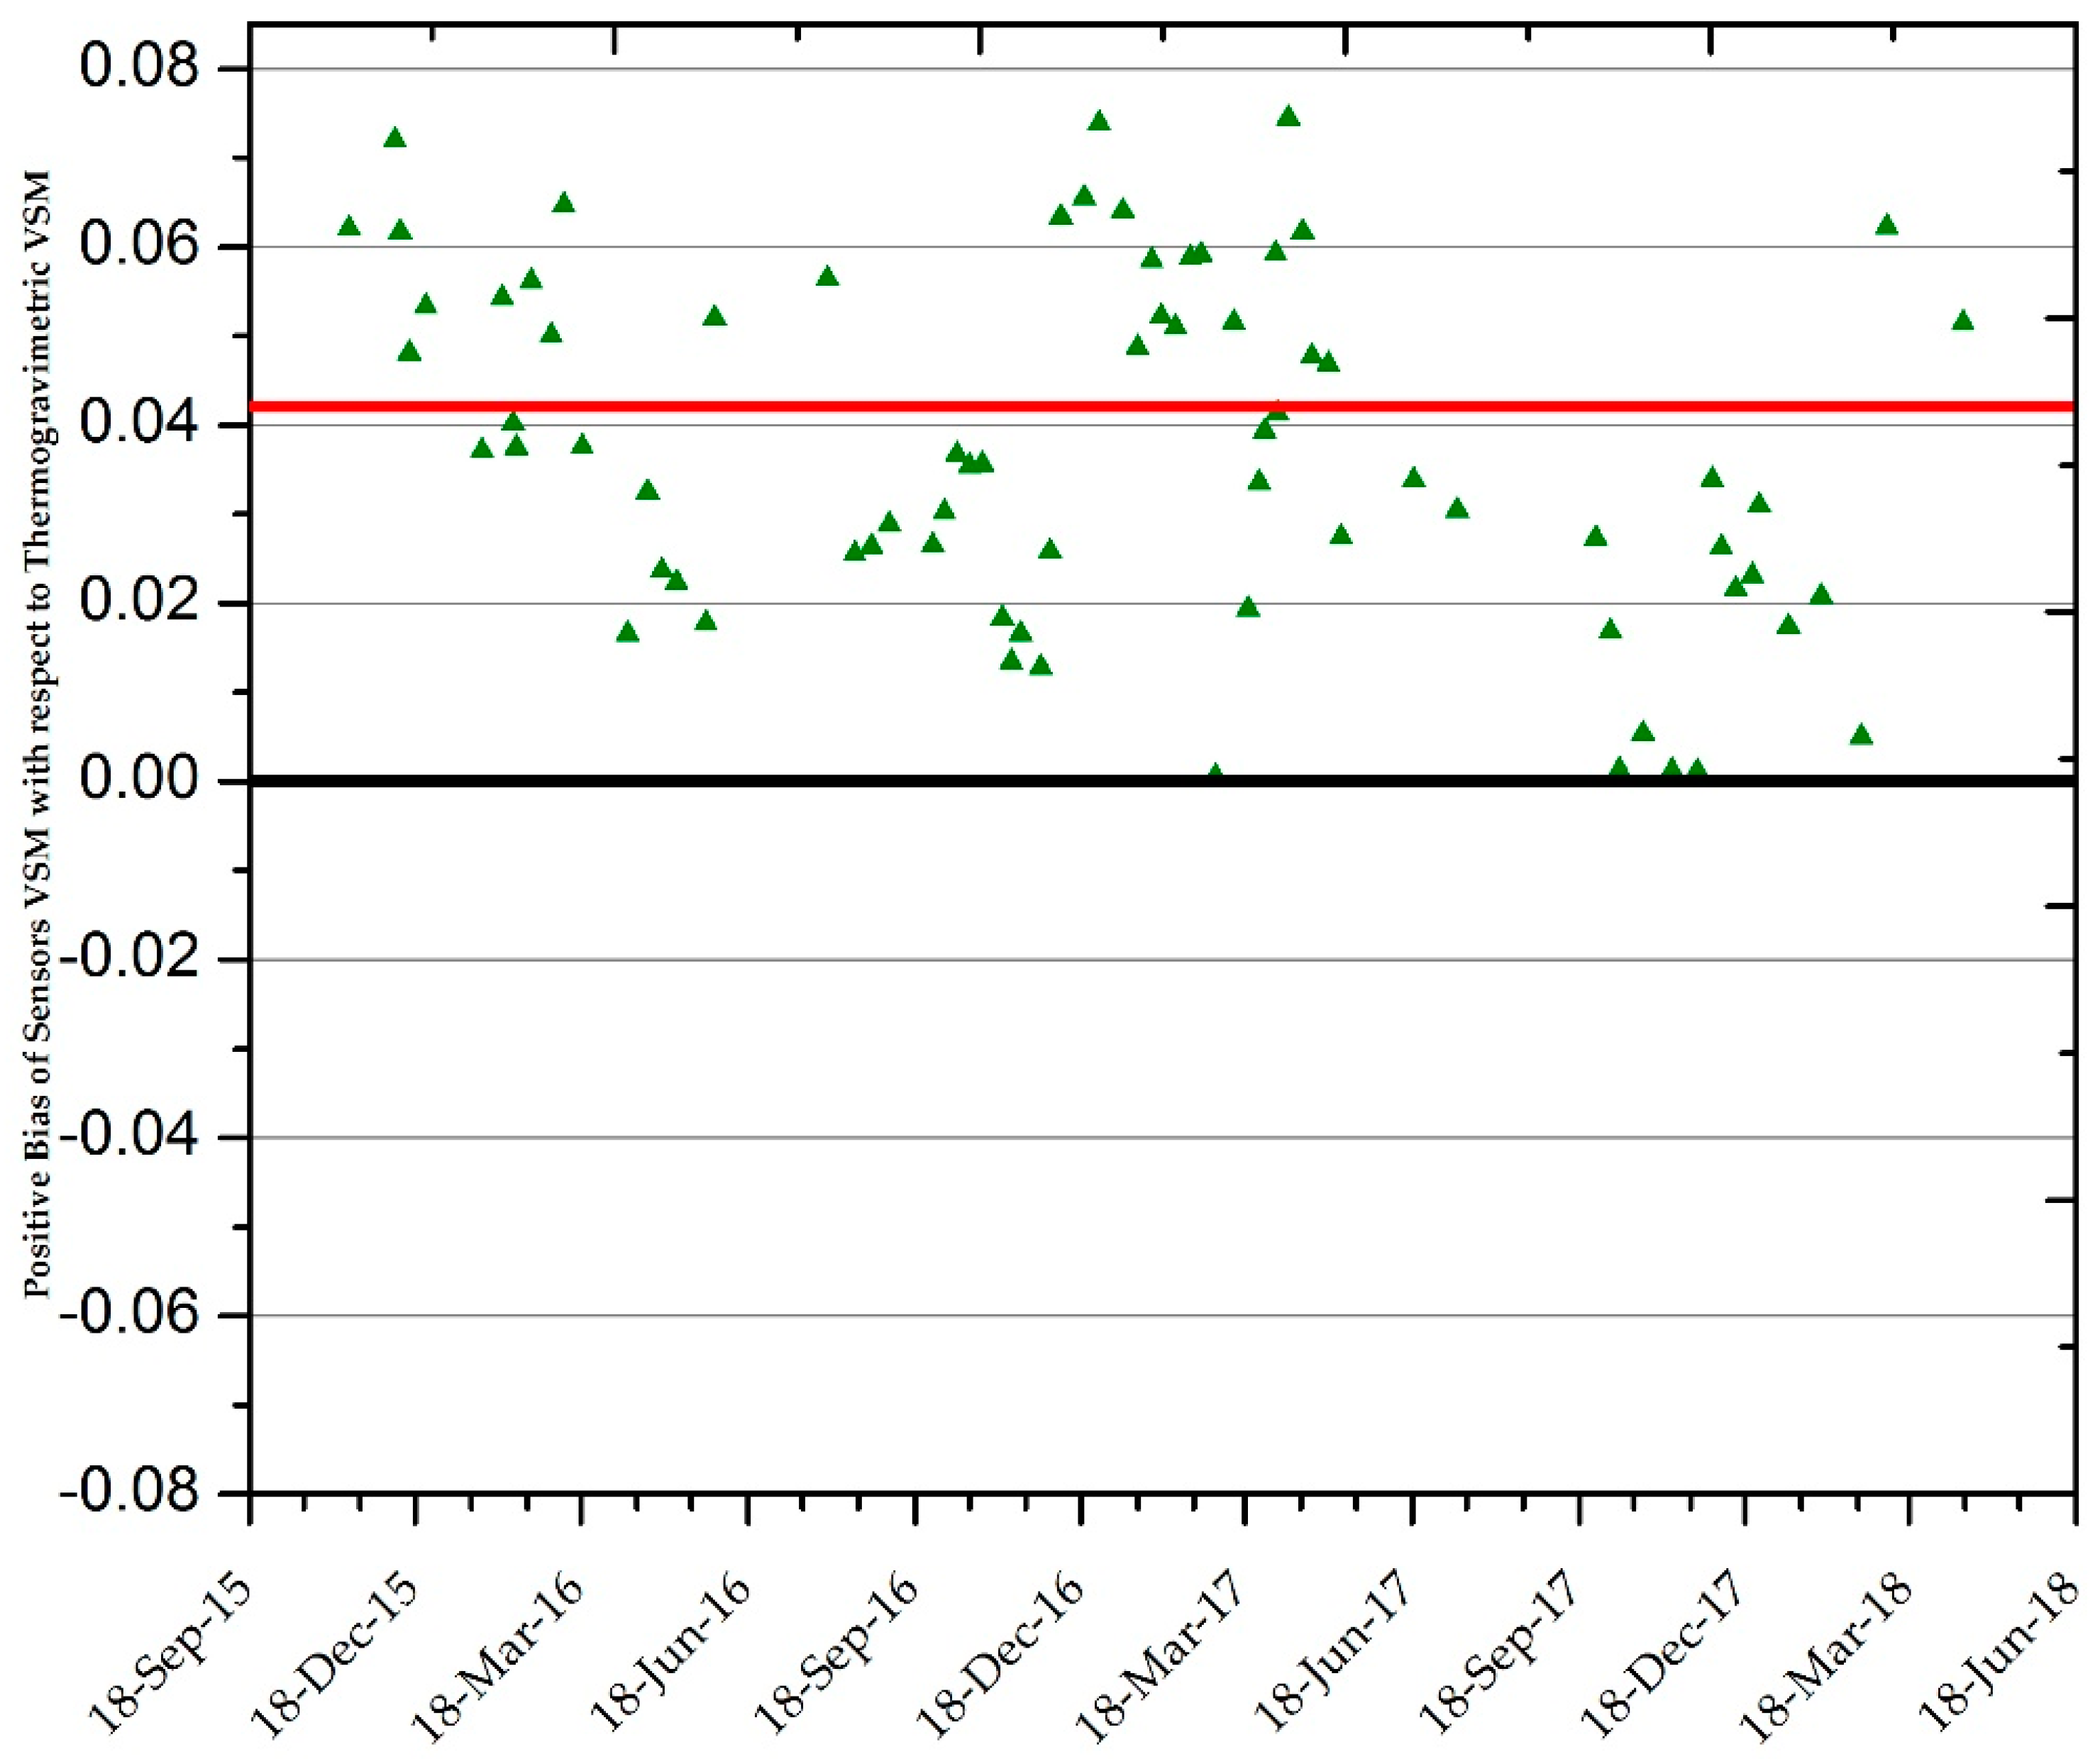
3.2. Calibration of Ground Station Sensors
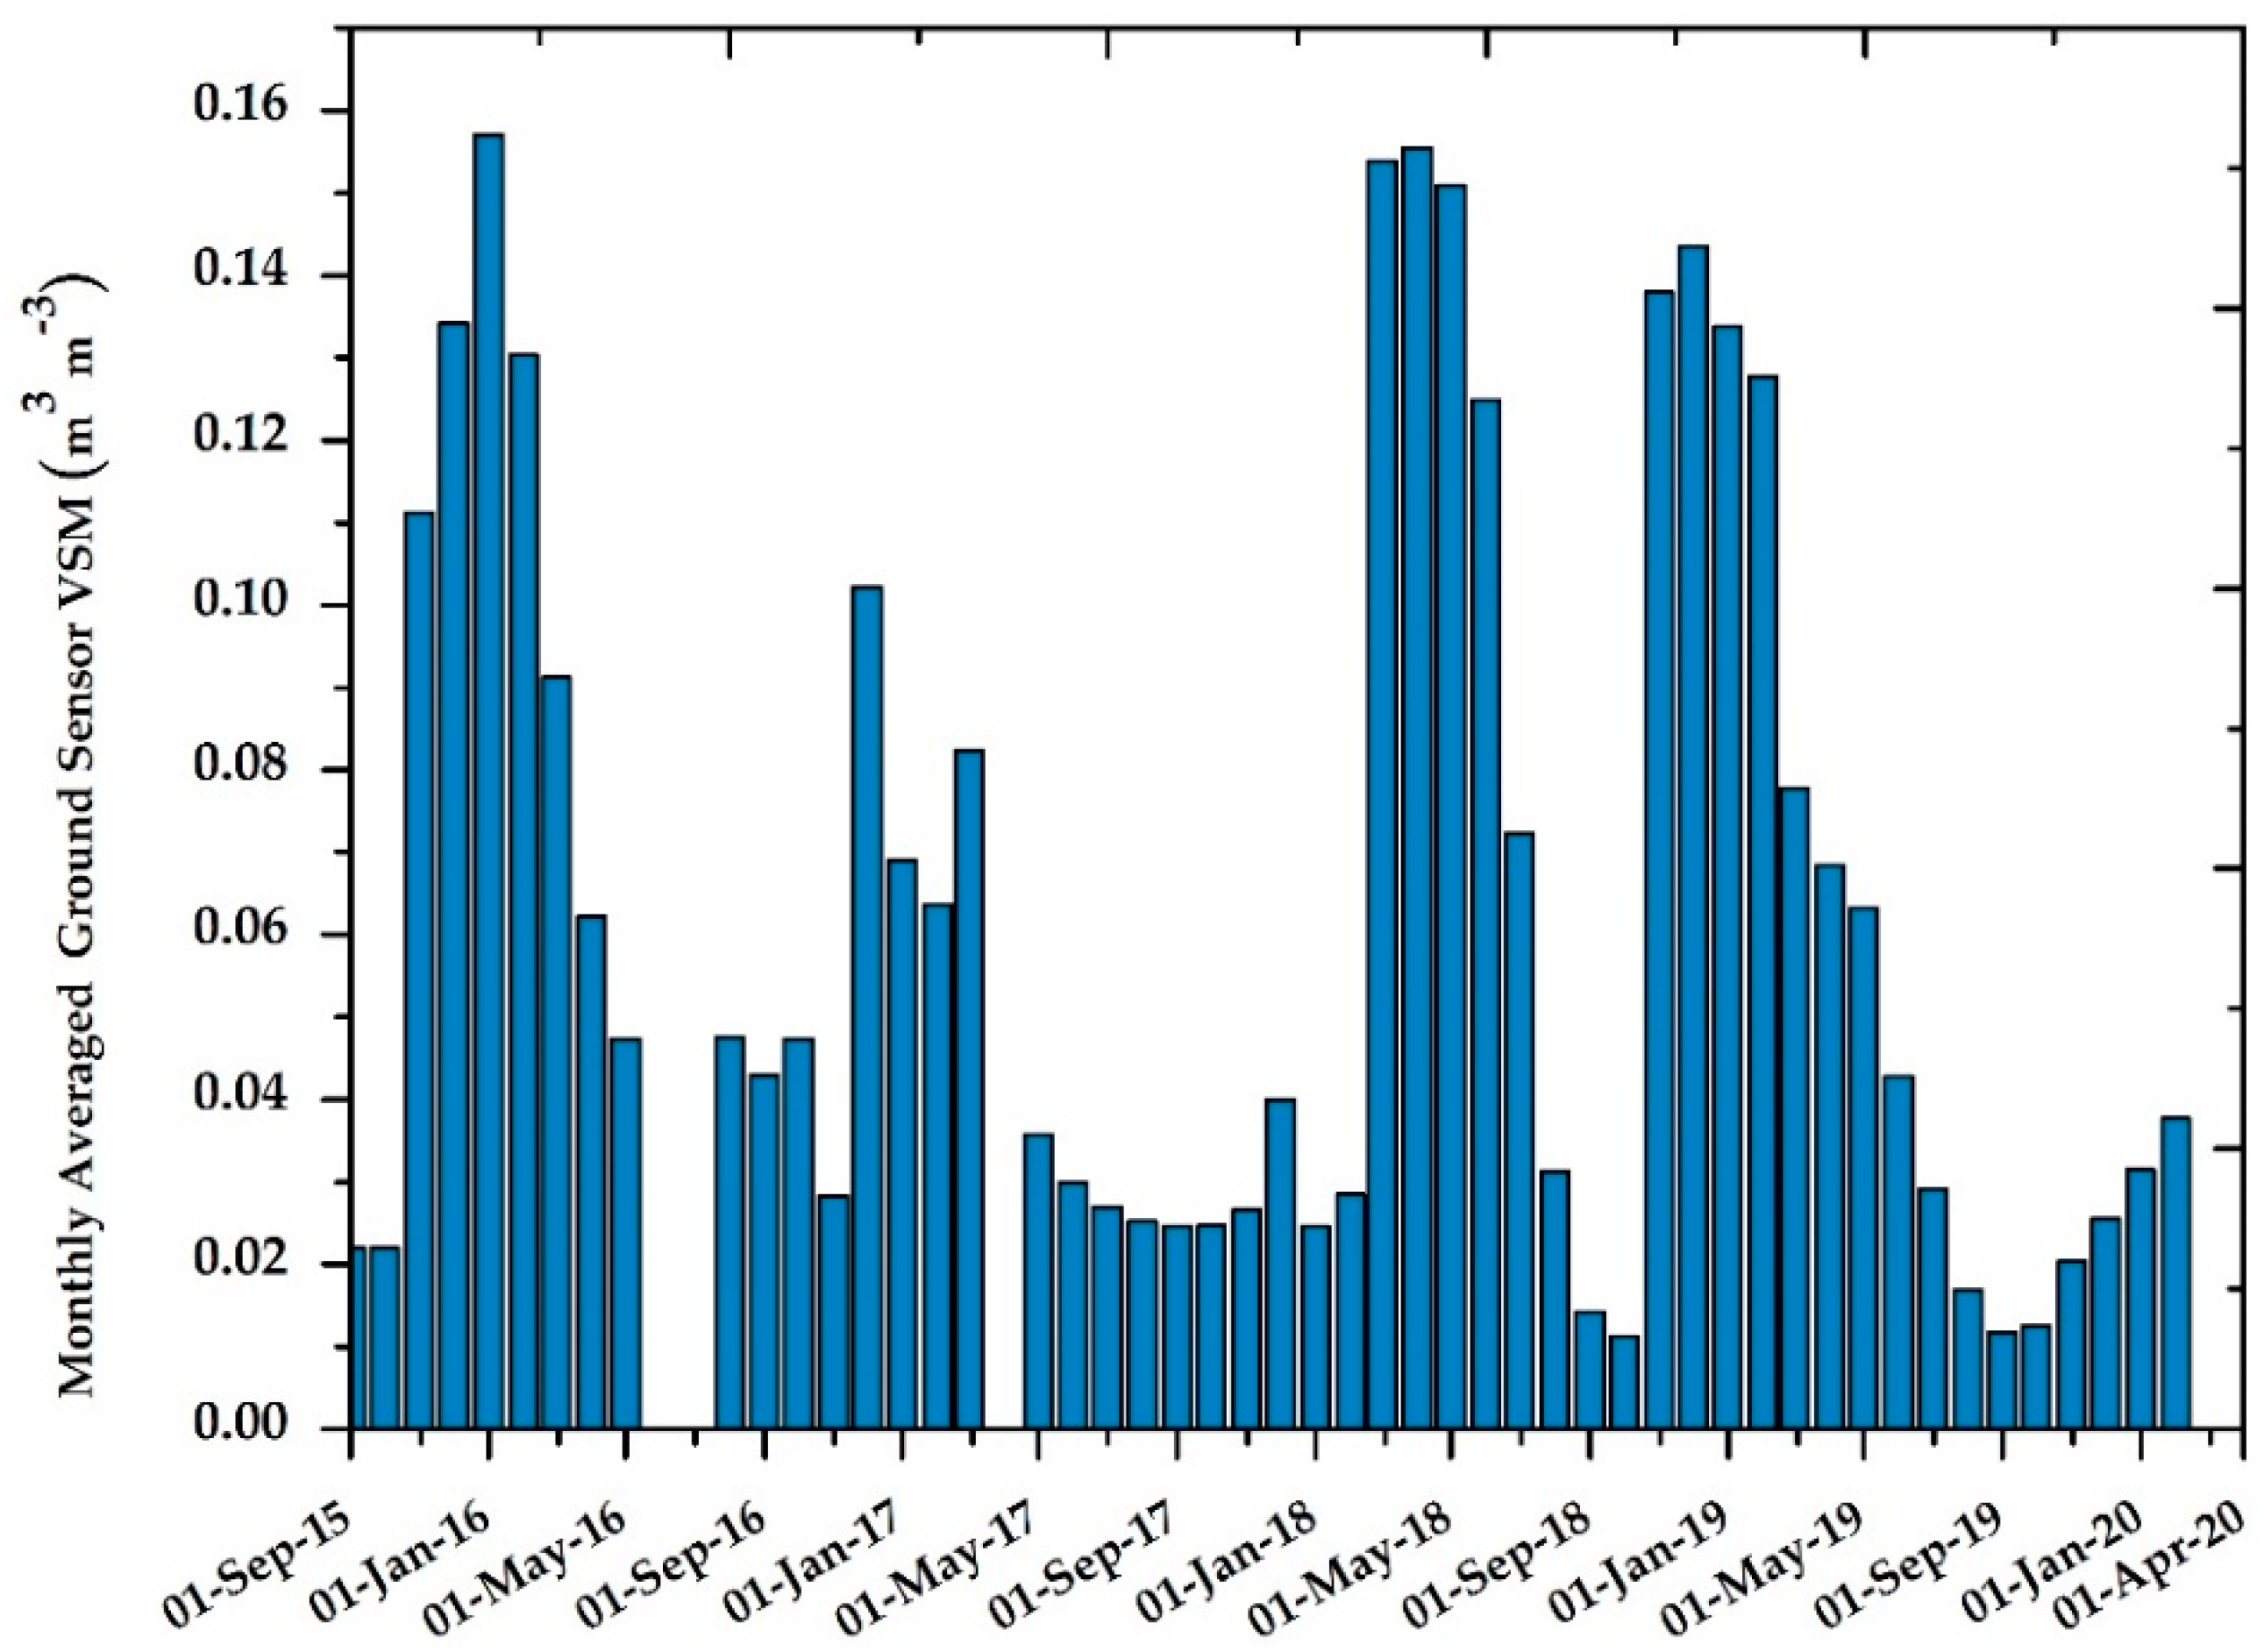
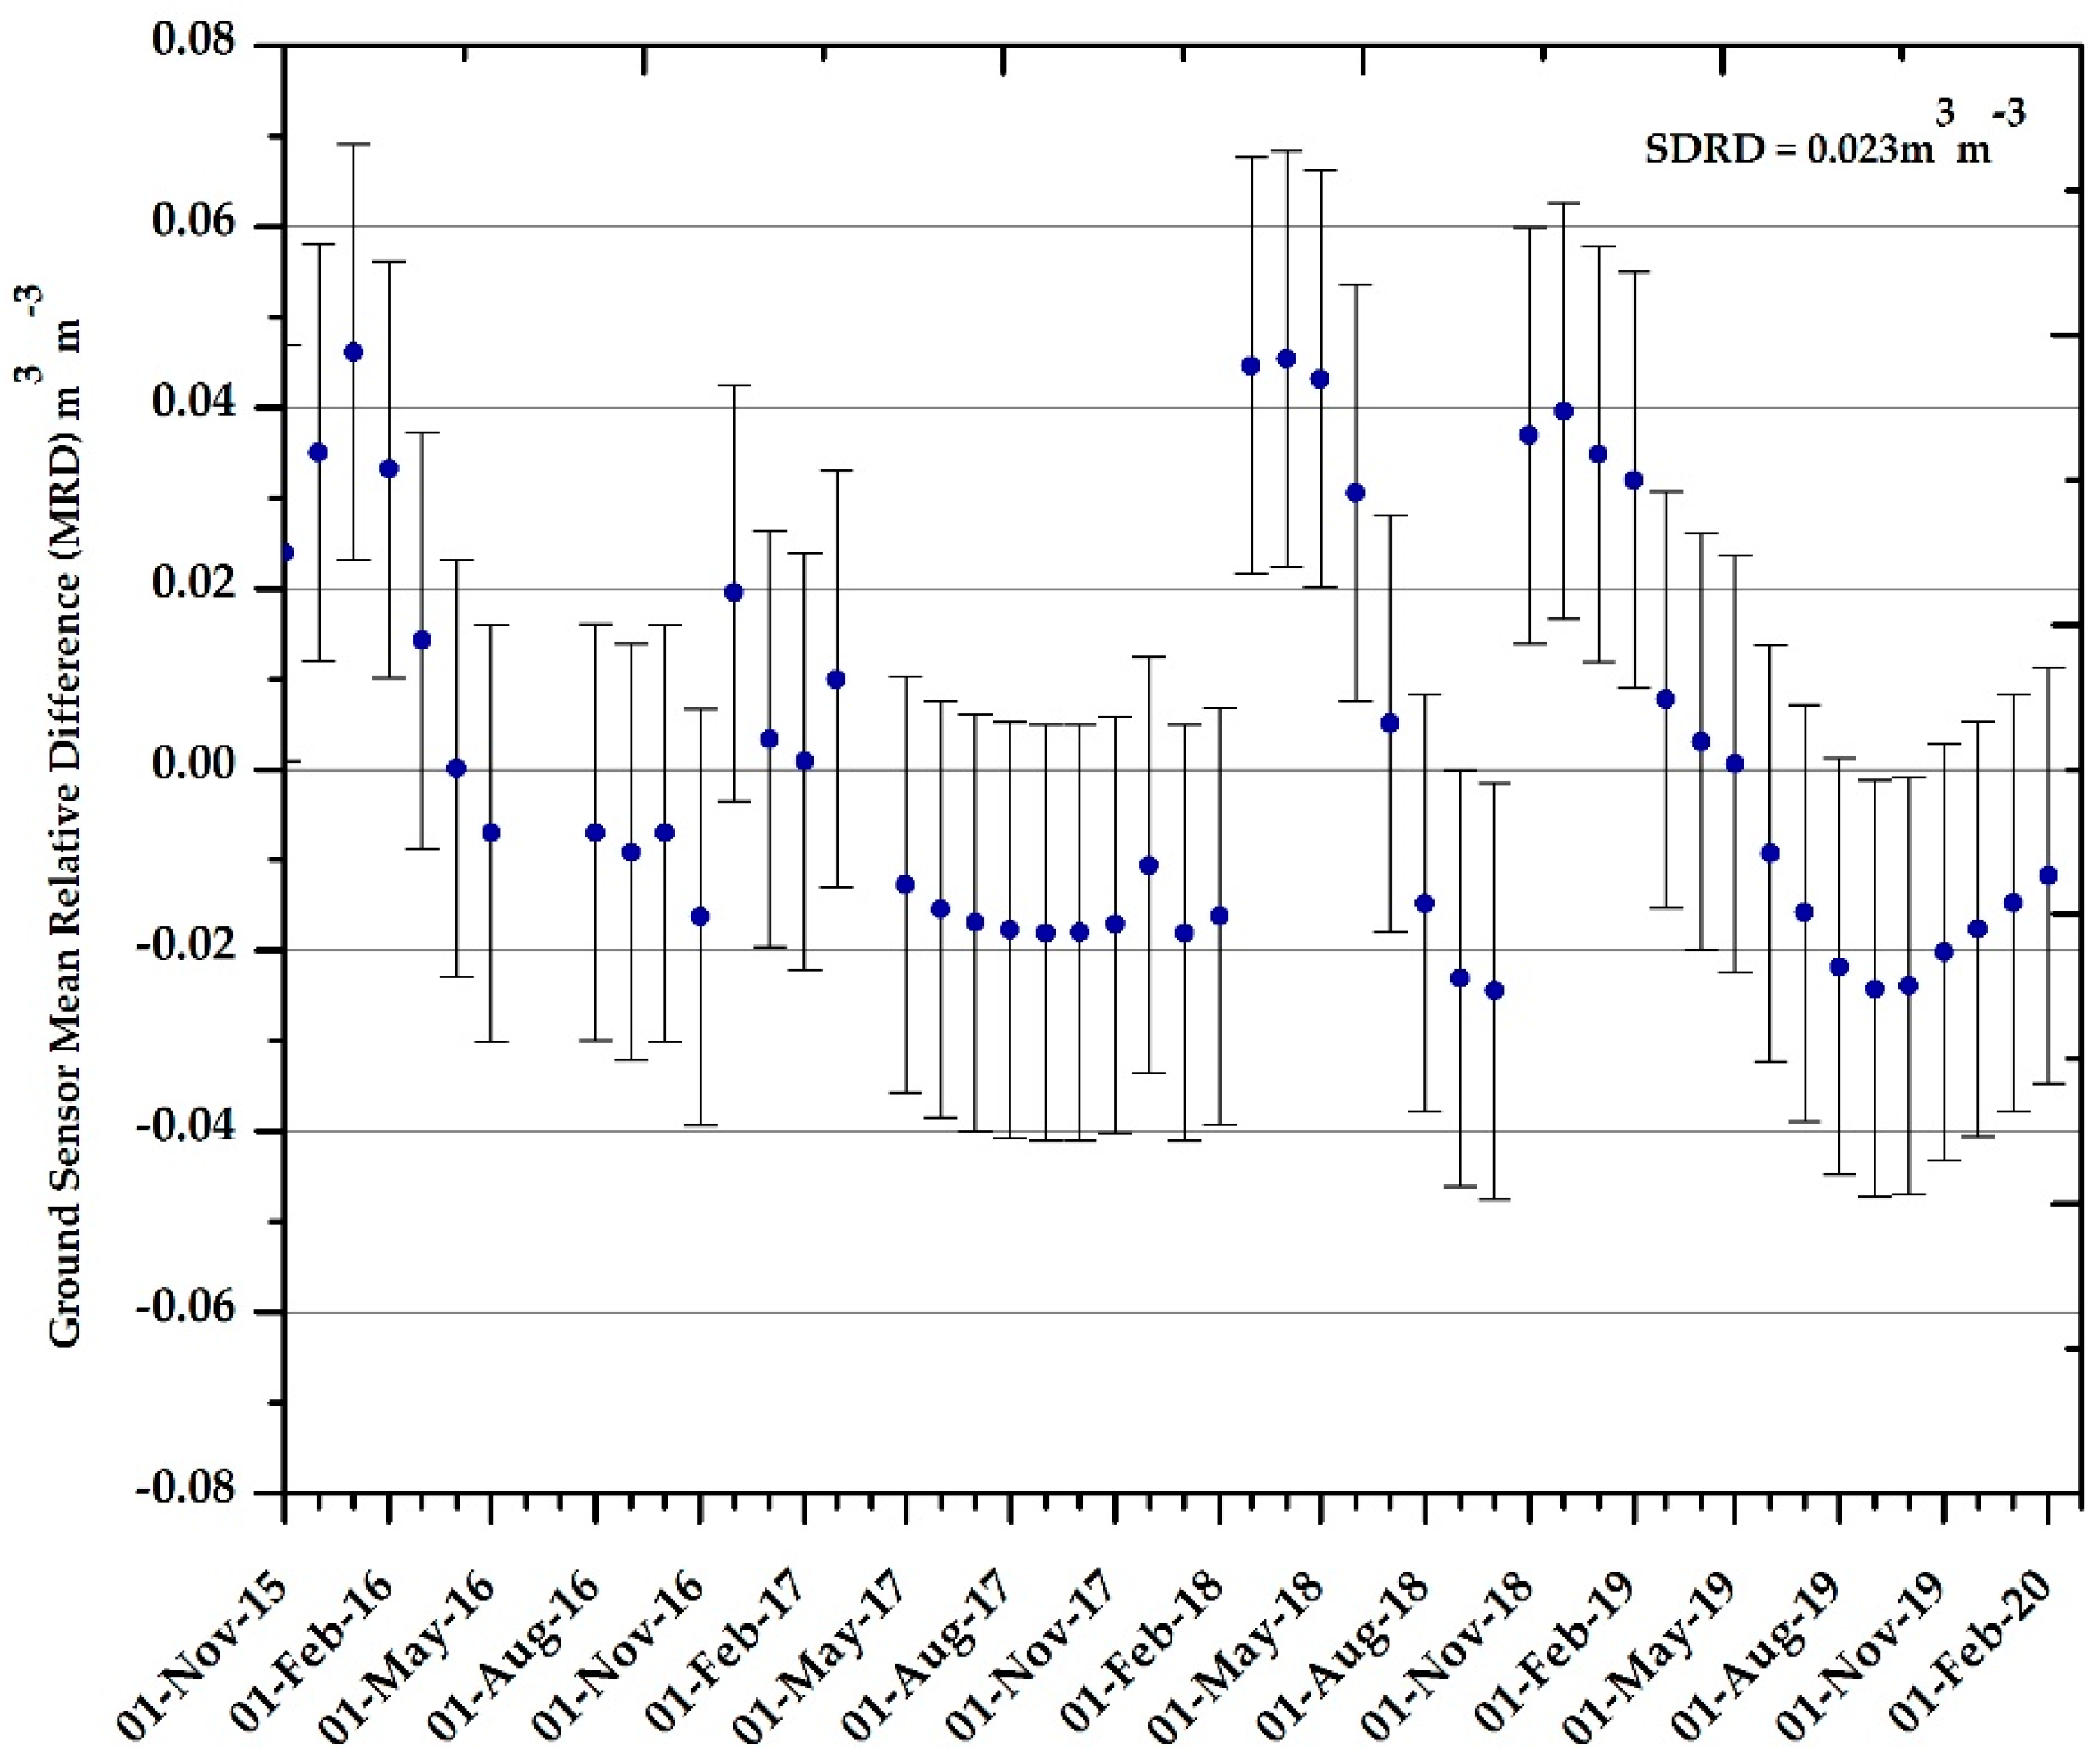
3.3. Analysis of the Temporal Variability of Soil Moisture from Ground Stations
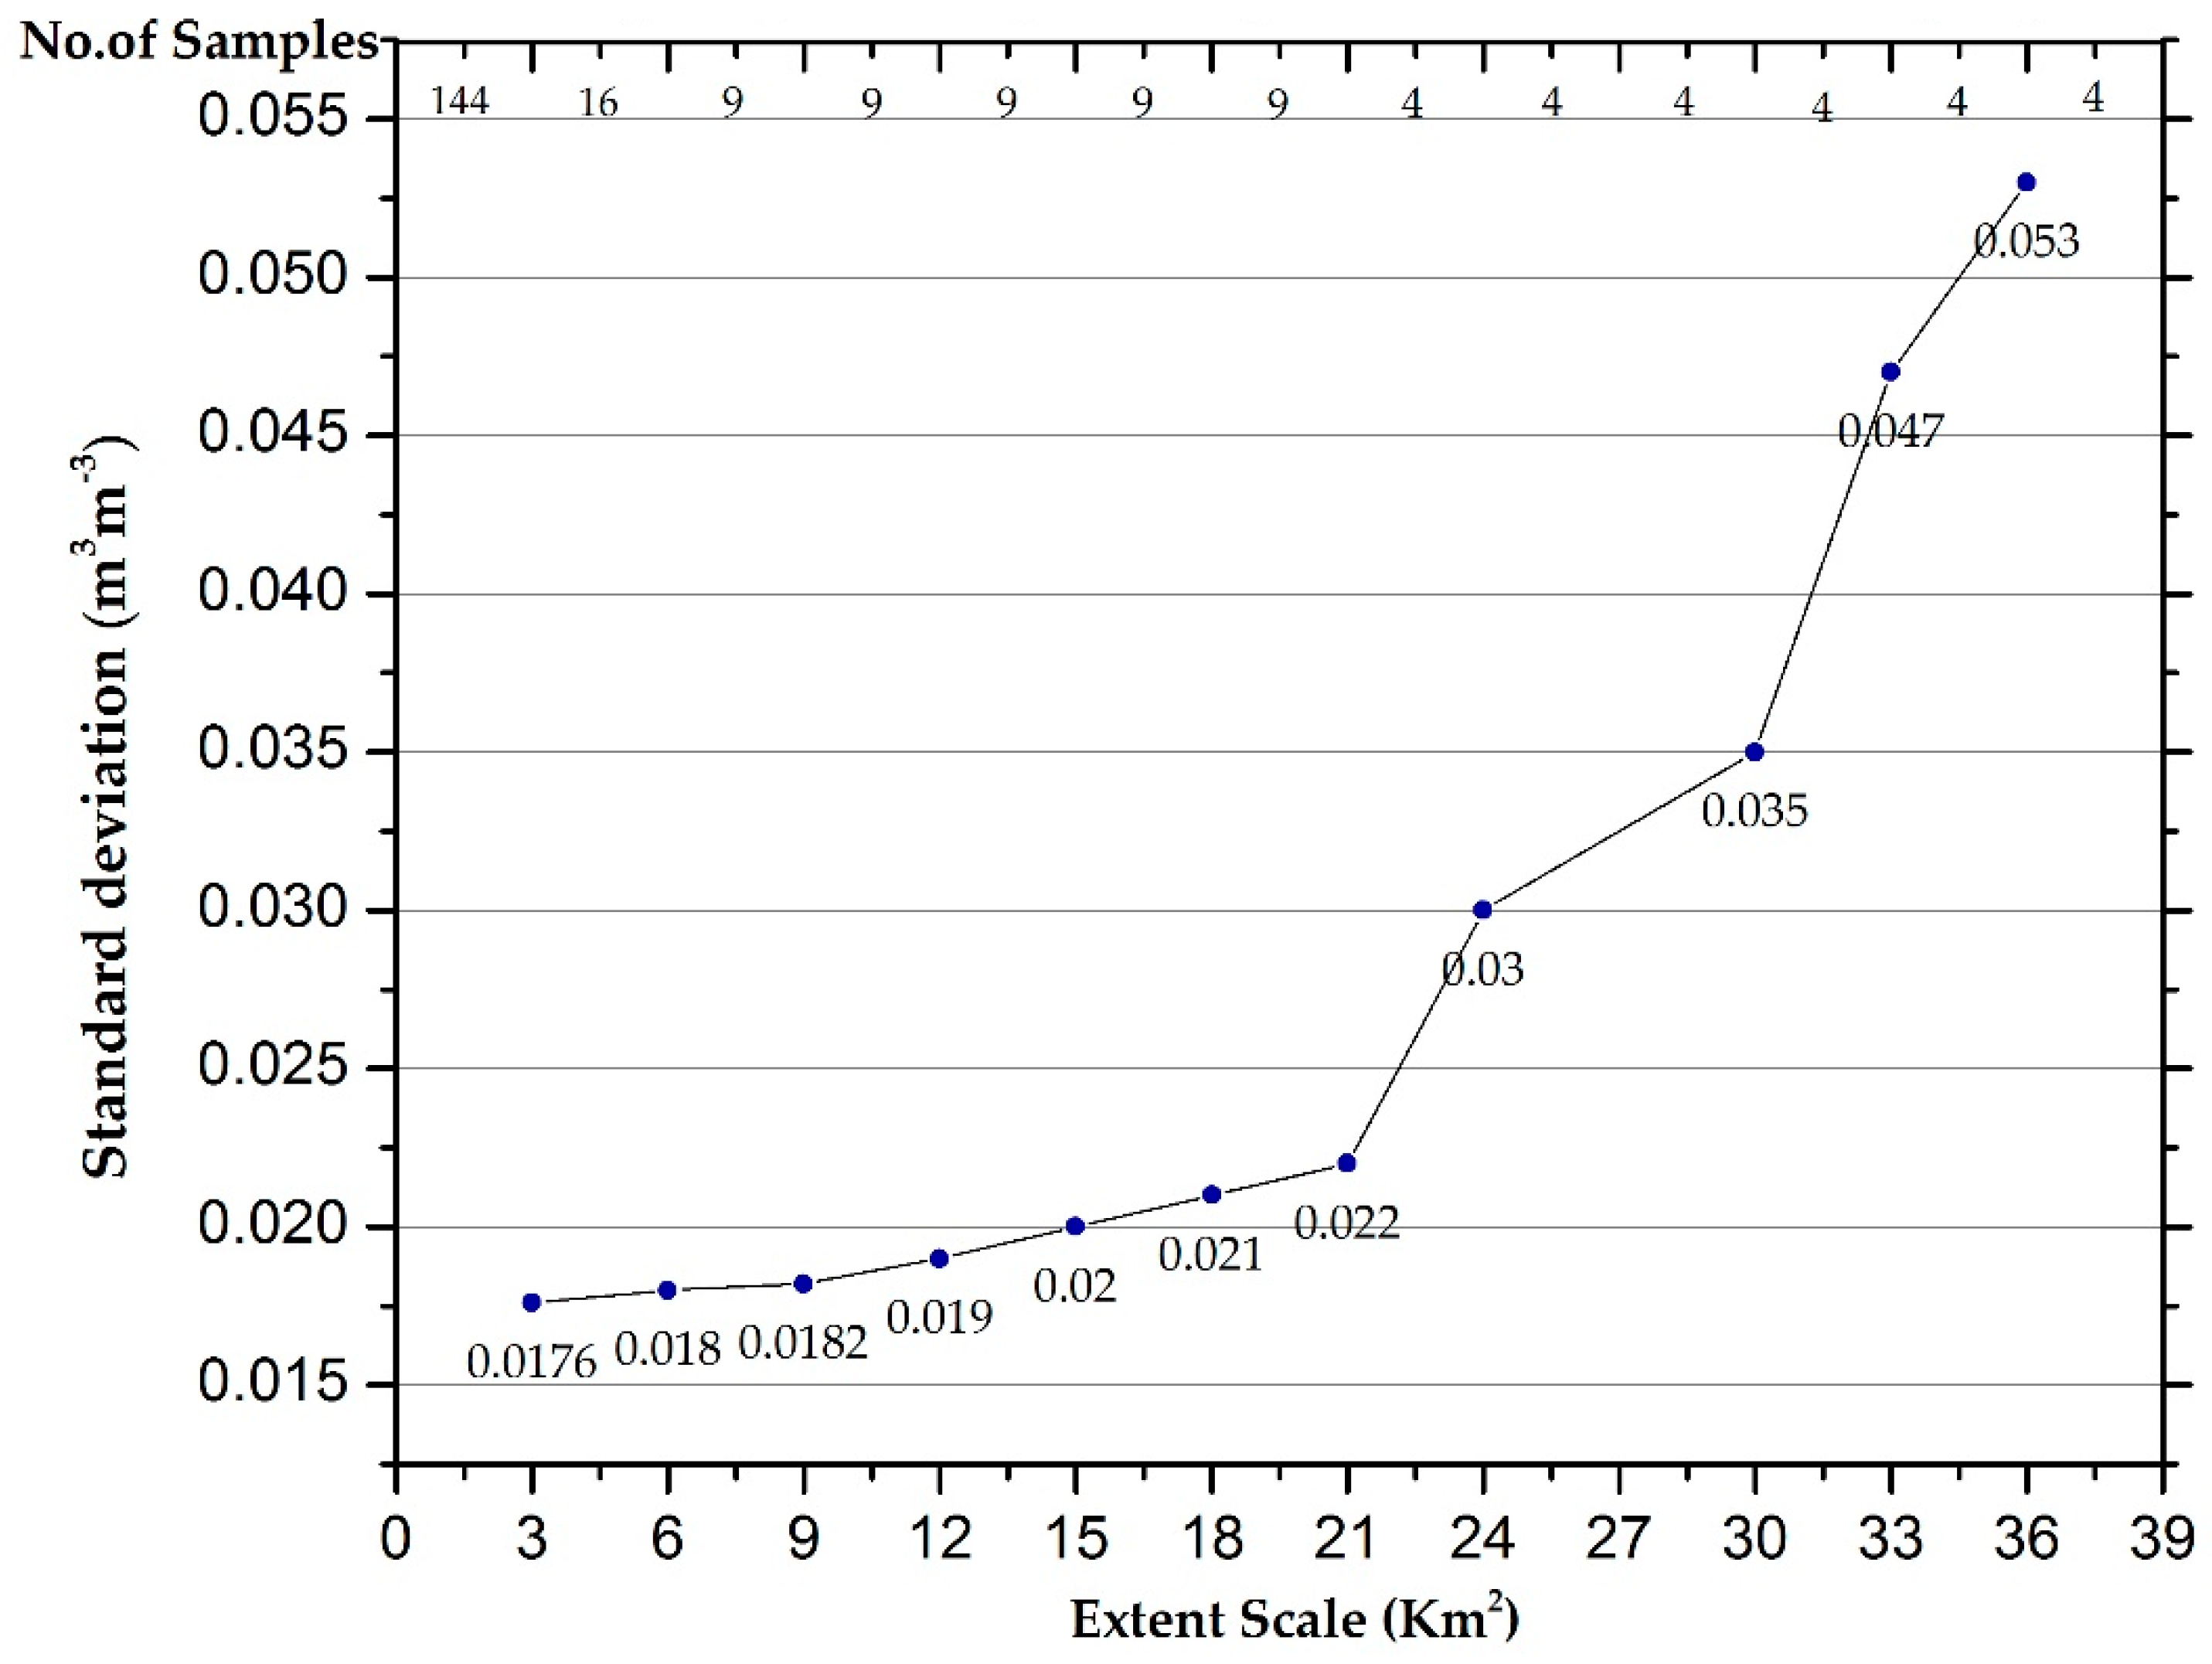
3.4. Sampling Density Inference
3.5. Assessment of Satellite Soil Moisture Retrievals
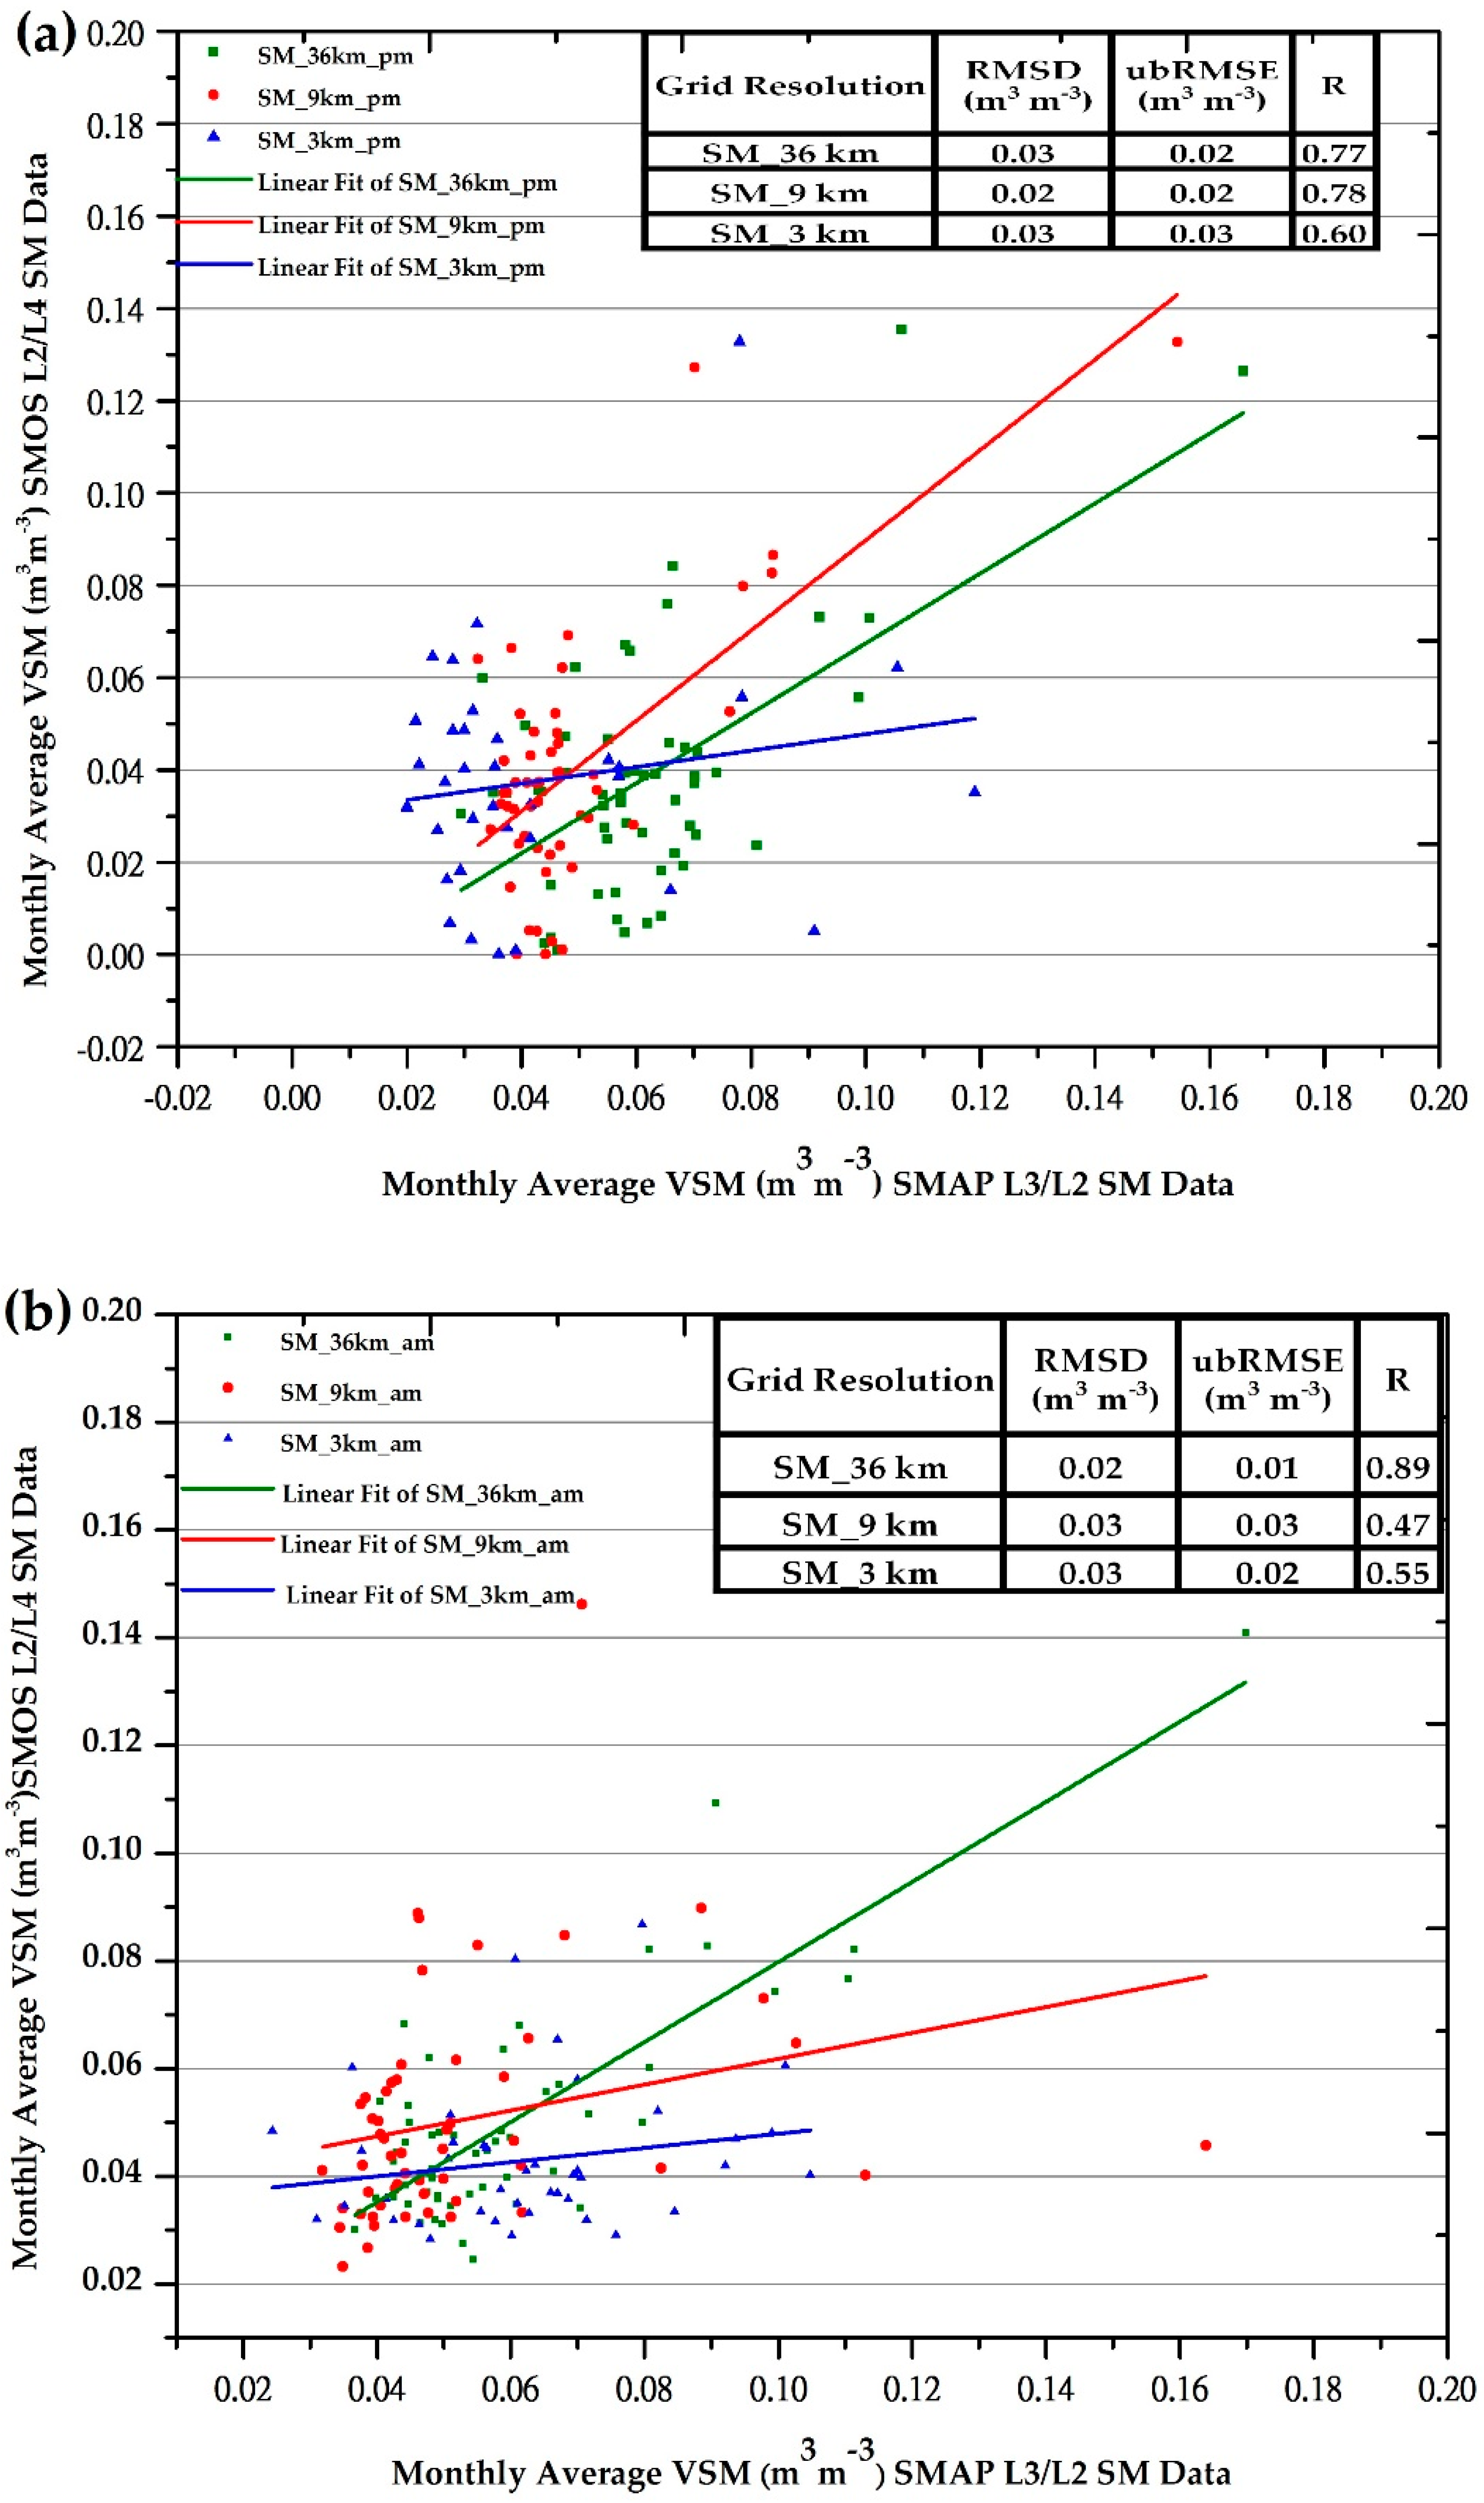
3.5.1. Intercomparison of SMAP and SMOS VSM Products
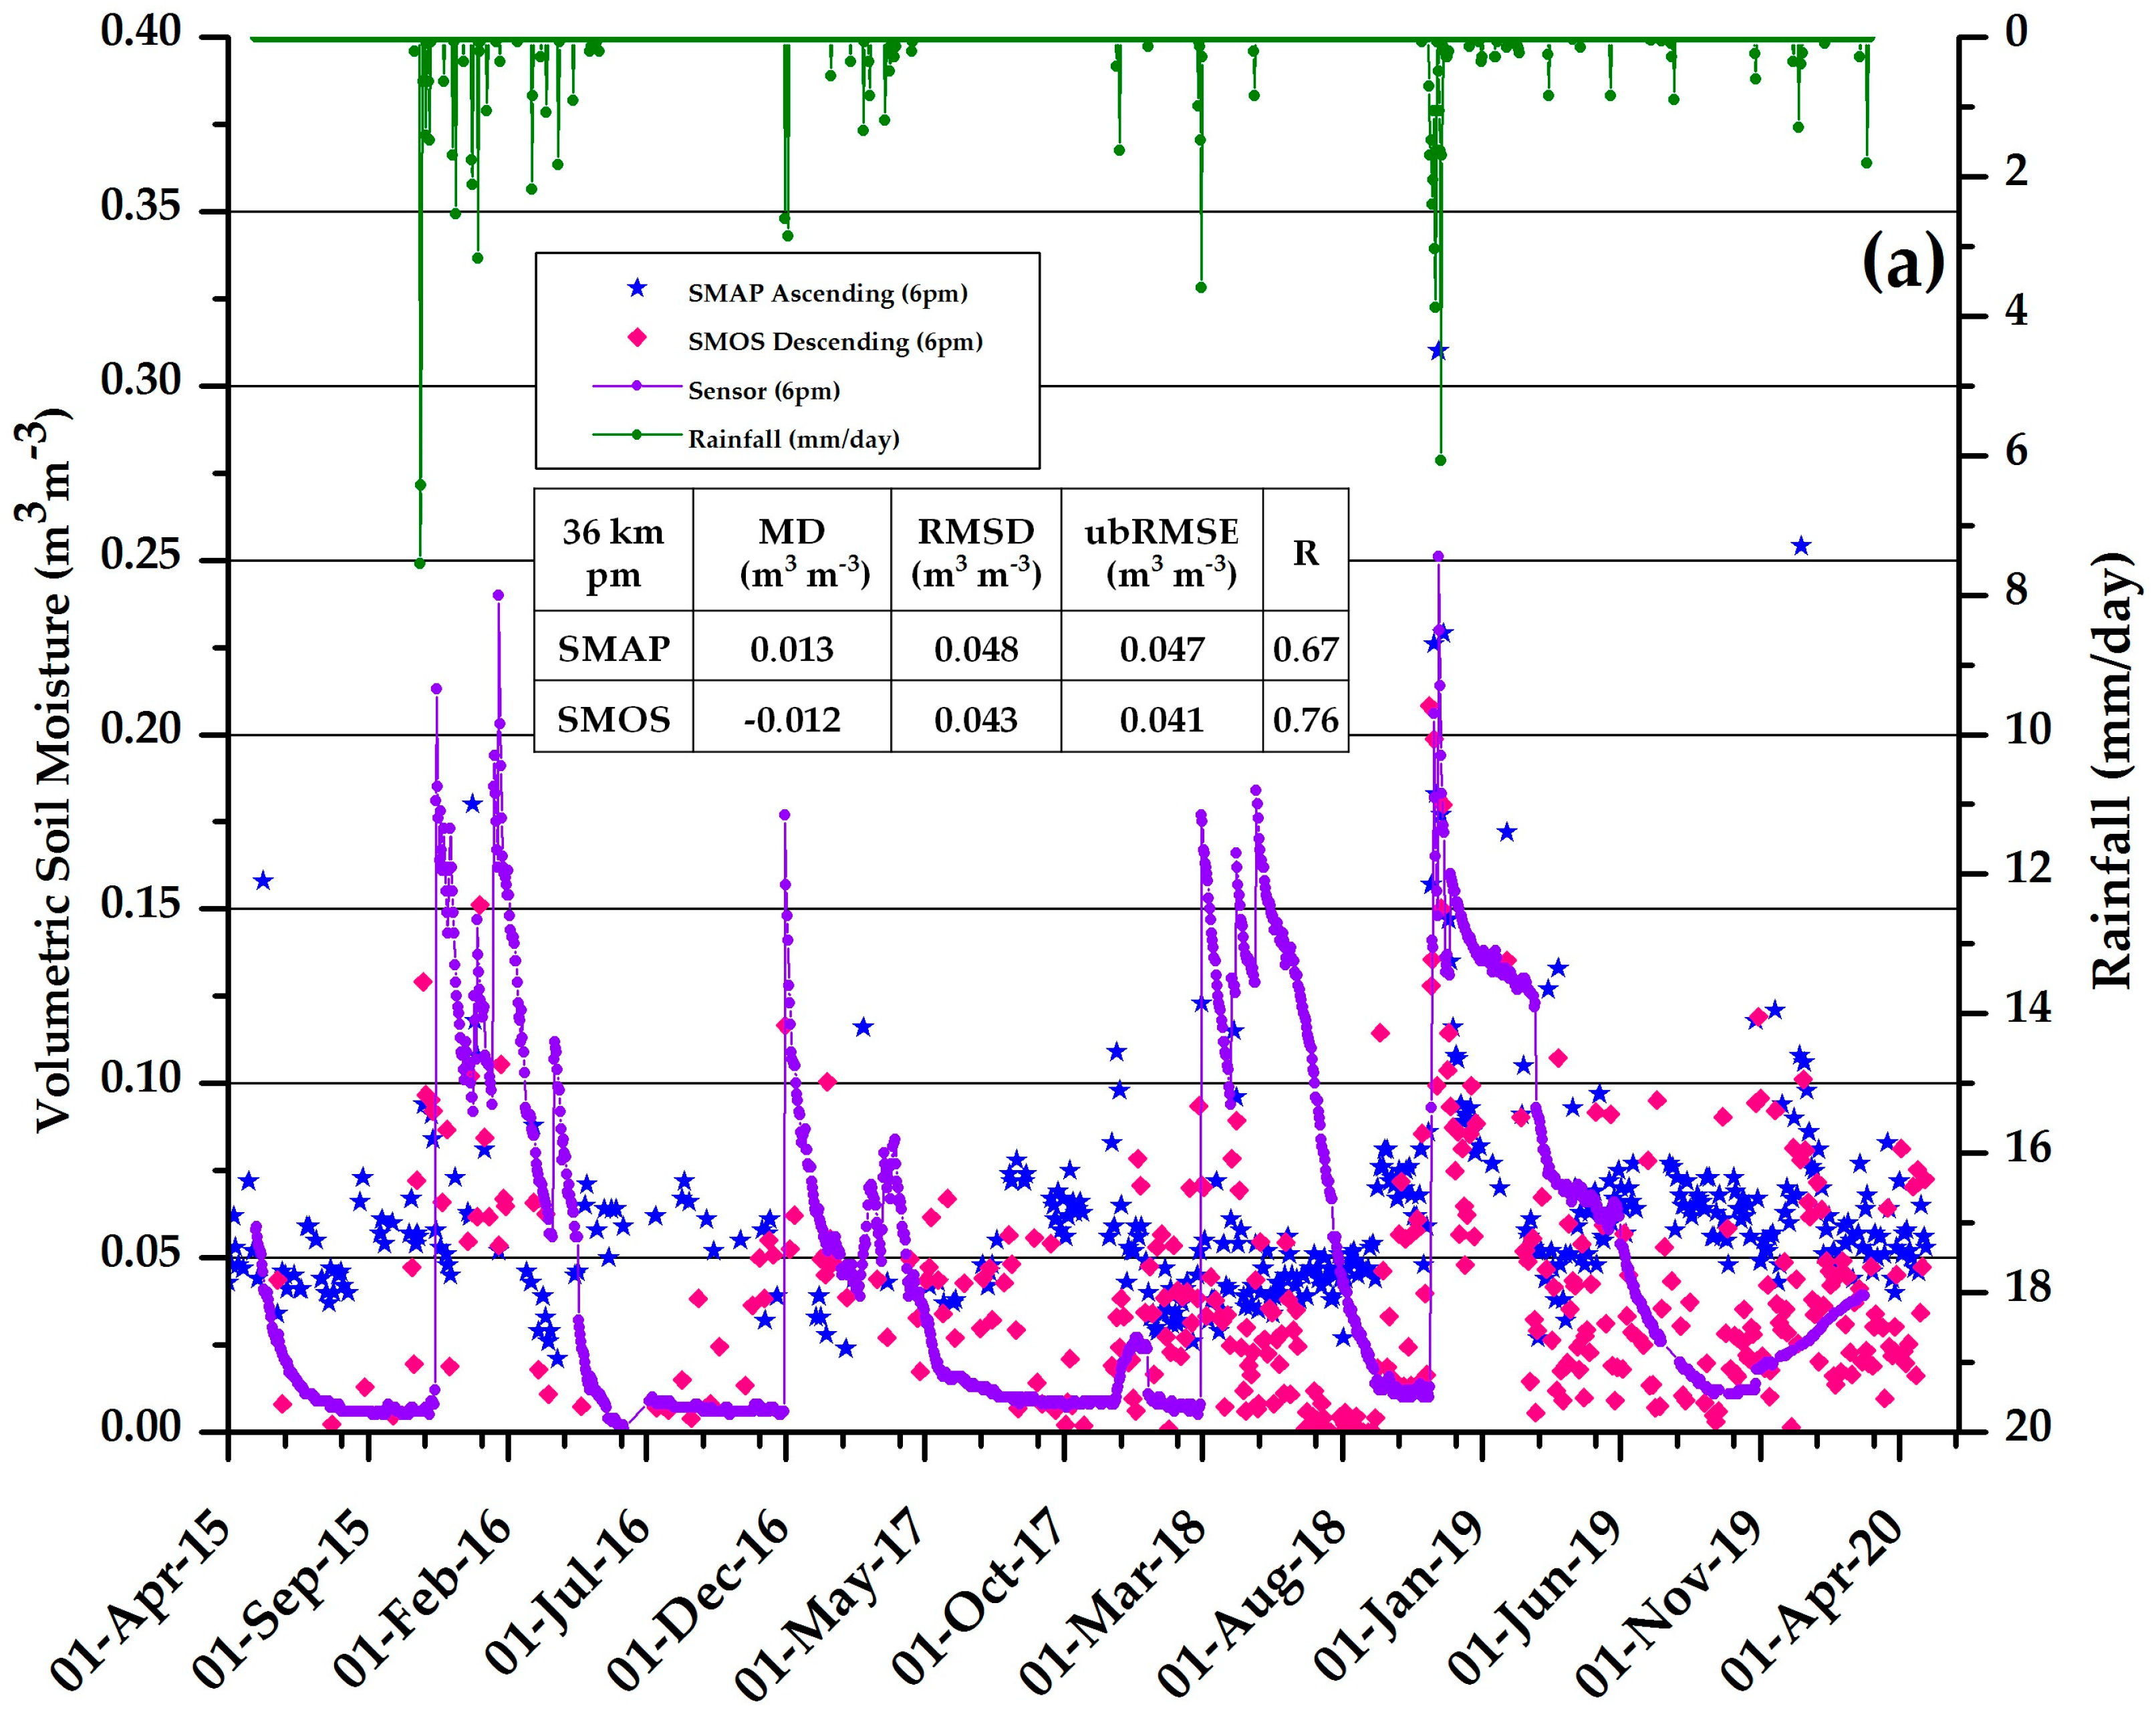
3.5.2. Validation of Satellite SM Products from the 6 pm Pass
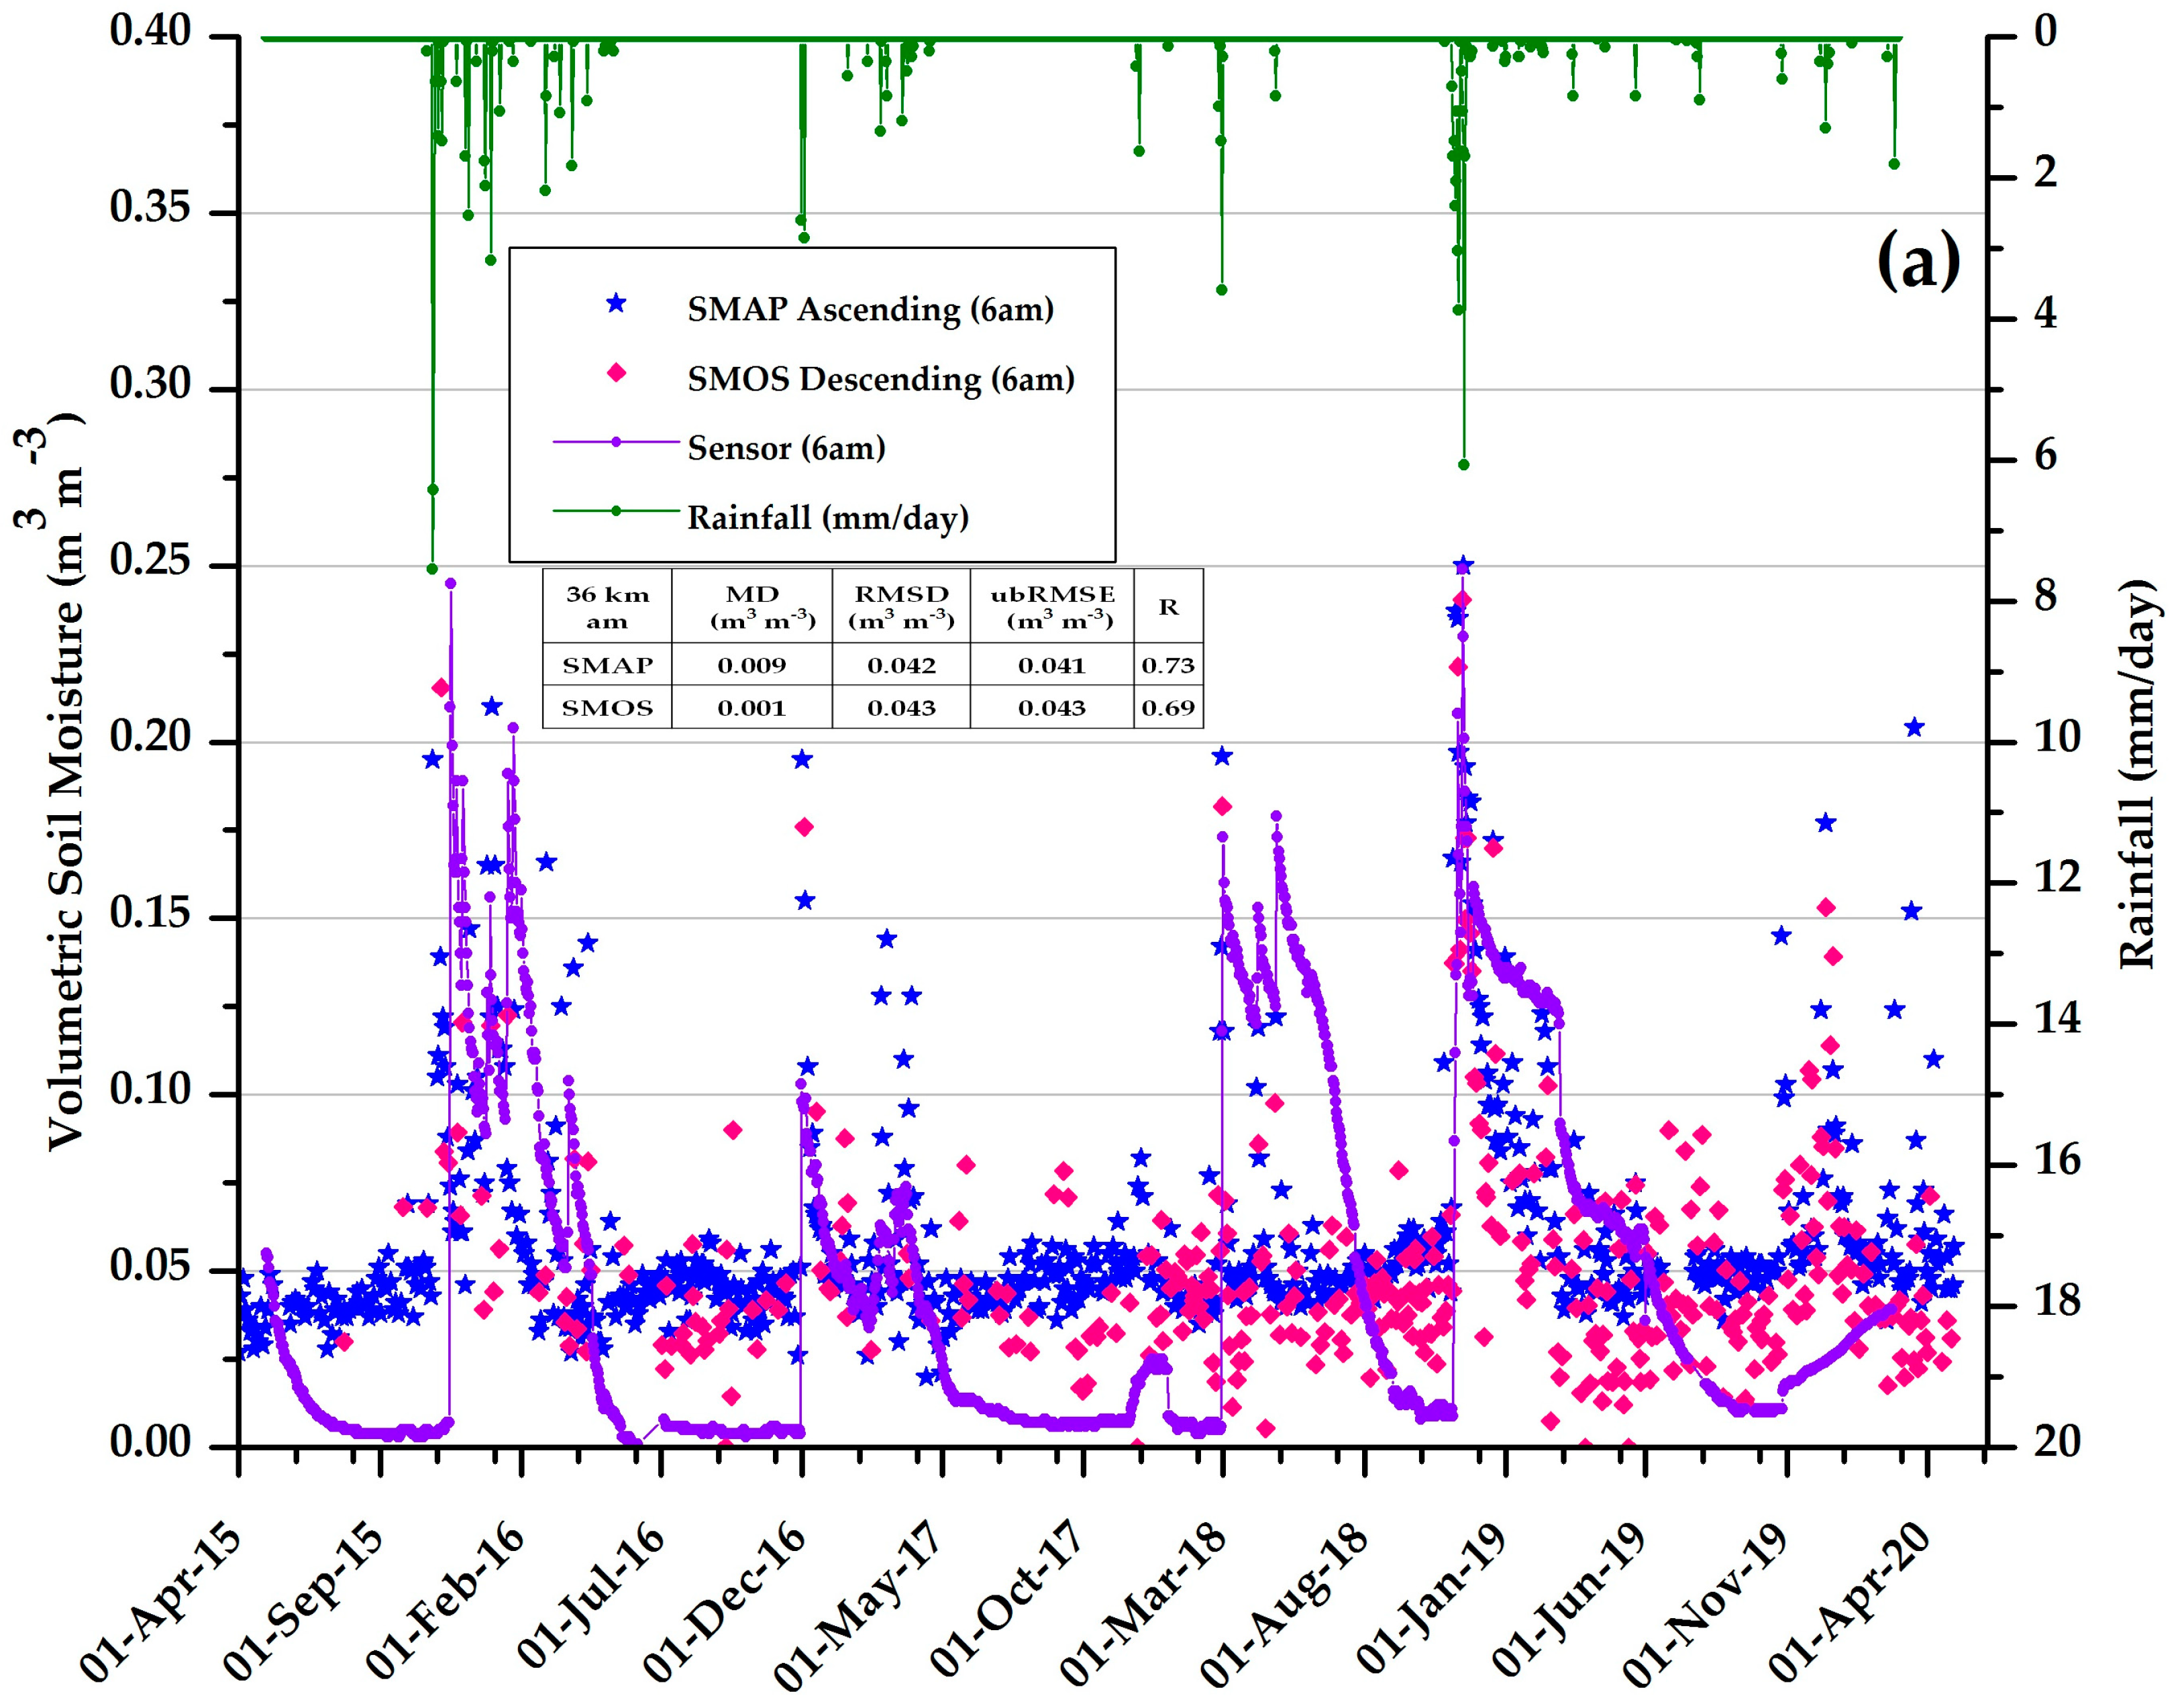
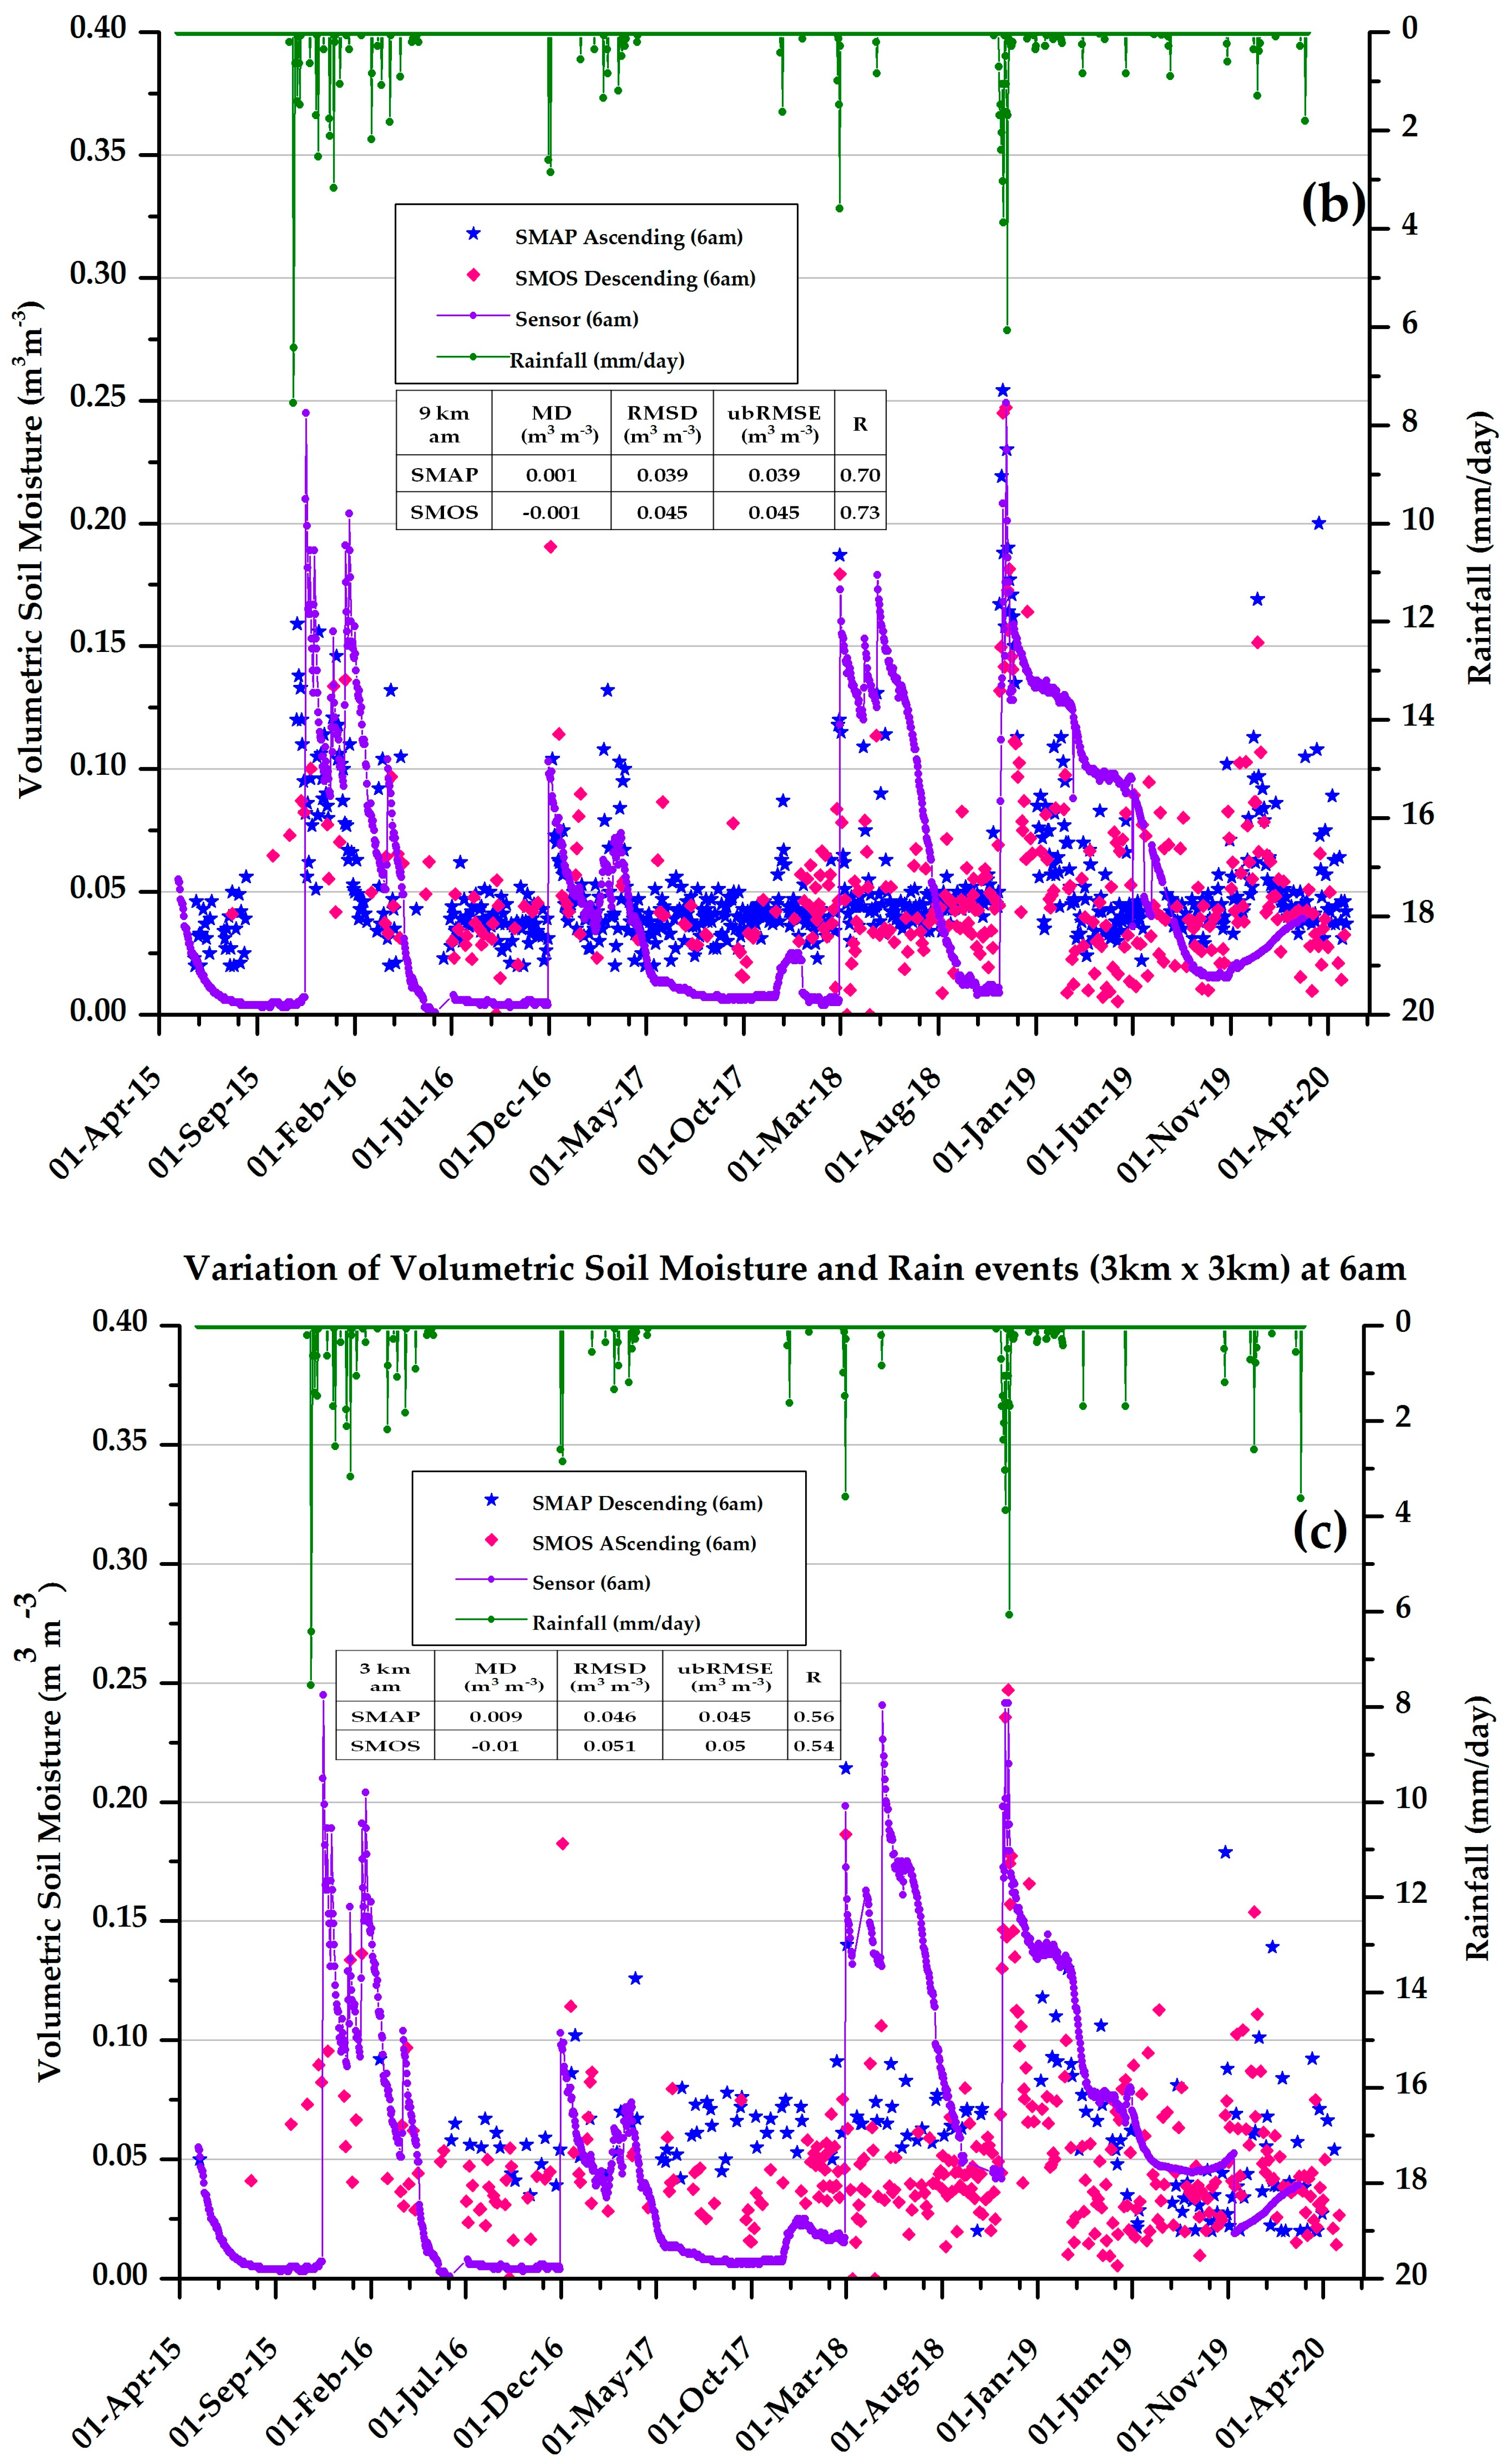
3.5.3. Validation of Satellite SM Products from the 6 am Pass
4. Discussions
5. Conclusions
Author Contributions
Funding
Data Availability Statement
Acknowledgments
Conflicts of Interest
References
- Vivoni, E.R.; Rinehart, A.J.; Mendez-Barroso, L.A.; Aragón, C.A.; Bisht, G.; Cardenas, M.B.; Engle, E.; Forman, B.A.; Frisbee, M.; Gutiérrez-Jurado, H.A.; et al. Vegetation controls on soil moisture distribution in the Valles Caldera, New Mexico, during the North American monsoon. Ecohydrology 2008, 1, 225–238. [Google Scholar] [CrossRef]
- Li, X.R.; Ma, F.Y.; Xiao, H.L.; Wang, X.P.; Kim, K.C. Long-term effects of revegetation on soil water content of sand dunes in arid region of Northern China. J. Arid Environ. 2004, 57, 1–16. [Google Scholar] [CrossRef]
- Southgate, R.; Masters, P.; Seely, M. Precipitation and biomass changes in the Namib Desert dune ecosystem. J. Arid Environ. 1996, 33, 267–280. [Google Scholar] [CrossRef]
- Pielkel, R.A.; Avissar, R. Influence of landscape structure on local and regional climate. Landsc. Ecol. 1990, 4, 133–155. [Google Scholar] [CrossRef]
- Pielke, R.A.; Dalu, G.A.; Snook, J.S.; Lee, T.J.; Kittel, T.G.F. Nonlinear Influence of Mesoscale Land Use on Weather and Climate. J. Clim. 1991, 4, 1053–1069. [Google Scholar] [CrossRef] [Green Version]
- Korres, W.; Reichenau, T.; Schneider, K. Patterns and scaling properties of surface soil moisture in an agricultural landscape: An ecohydrological modeling study. J. Hydrol. 2013, 498, 89–102. [Google Scholar] [CrossRef] [Green Version]
- Schoonover, J.E.; Crim, J.F. An Introduction to Soil Concepts and the Role of Soils in Watershed Management. J. Contemp. Water Res. Educ. 2015, 154, 21–47. [Google Scholar] [CrossRef]
- Fares, A.; Temimi, M.; Morgan, K.; Kelleners, T.J. In-Situ and Remote Soil Moisture Sensing Technologies for Vadose Zone Hydrology. Vadose Zone J. 2013, 12, 1–3. [Google Scholar] [CrossRef] [Green Version]
- Temimi, M.; Lakhankar, T.; Zhan, X.; Cosh, M.H.; Krakauer, N.; Fares, A.; Kelly, V.; Khanbilvardi, R.; Kumassi, L. Soil Moisture Retrieval Using Ground-Based L-Band Passive Microwave Observations in Northeastern USA. Vadose Zone J. 2014, 13, 1–10. [Google Scholar] [CrossRef]
- Collow, T.W.; Robock, A.; Basara, J.; Illston, B.G. Evaluation of SMOS retrievals of soil moisture over the central United States with currently available in situ observations. J. Geophys. Res. Earth Surf. 2012, 117, D09113. [Google Scholar] [CrossRef] [Green Version]
- Dorigo, W.A.; Wagner, W.; Hohensinn, R.; Hahn, S.; Paulik, C.; Xaver, A.; Gruber, A.; Drusch, M.; Mecklenburg, S.; van Oevelen, P.; et al. The International Soil Moisture Network: A data hosting facility for global in situ soil moisture measurements. Hydrol. Earth Syst. Sci. 2011, 15, 1675–1698. [Google Scholar] [CrossRef] [Green Version]
- Brocca, L.; Hasenauer, S.; Lacava, T.; Melone, F.; Moramarco, T.; Wagner, W.; Dorigo, W.; Matgen, P.; Martínez-Fernández, J.; Llorens, P.; et al. Soil moisture estimation through ASCAT and AMSR-E sensors: An intercomparison and validation study across Europe. Remote Sens. Environ. 2011, 115, 3390–3408. [Google Scholar] [CrossRef]
- Notarnicola, C.; Caporaso, L.; Di Giuseppe, F.; Temimi, M.; Ventura, B.; Zebisch, M. Inferring soil moisture varia-bility in the Mediterrean Sea area using infrared and passive microwave observations. Can. J. Remote Sens. 2012, 38, 46–59. [Google Scholar] [CrossRef]
- World Meteorological Organization (WMO). Systematic Observation Requirements for Satellite–Based Products for Climate; 154 Document; WMO: Geneva, Switzerland, 2011. [Google Scholar]
- Lakhankar, T. Estimation of Soil Moisture Using Microwave Remote Sensing Data. Ph.D. Thesis, City University of New York, New York, NY, USA, 2006. [Google Scholar]
- Dorigo, W.; de Jeu, R.; Chung, D.; Parinussa, R.; Liu, Y.; Wagner, W.; Fernández-Prieto, D. Evaluating global trends (1988-2010) in harmonized multi-satellite surface soil moisture. Geophys. Res. Lett. 2012, 39, L18405. [Google Scholar] [CrossRef] [Green Version]
- Wen, J.; Jackson, T.J.; Bindlish, R.; Hsu, A.Y.; Su, Z.B. Retrieval of Soil Moisture and Vegetation Water Content Using SSM/I Data over a Corn and Soybean Region. J. Hydrometeorol. 2005, 6, 854–863. [Google Scholar] [CrossRef] [Green Version]
- Njoku, E.G.; Entekhabi, D. Passive microwave remote sensing of soil moisture. J. Hydrol. 1996, 184, 101–129. [Google Scholar] [CrossRef]
- Das, K.; Paul, P.K. Present status of soil moisture estimation by microwave remote sensing. Cogent Geosci. 2015, 1, 1. [Google Scholar] [CrossRef]
- Chaouch, N.; Leconte, R.; Magagi, R.; Temimi, M.; Khanbilvardi, R. Multi-Stage Inversion Method to Retrieve Soil Moisture from Passive Microwave Measurements over the Mackenzie River Basin. Vadose Zone J. 2013, 12, 1–12. [Google Scholar] [CrossRef]
- Blinn, J.C., III; Quade, J.G. Microwave properties of geological materials: Studies of penetration depth and moisture effects. In NASA. Manned Spacecraft Center 4th Annual Earth Resources Program Review; NASA Jet Propulsion Laboratory: Pasadena, CA, USA, 1972; Volume 2. [Google Scholar]
- Schmugge, T.J.; Gloersen, P.; Wilheit, T.; Geiger, F. Remote sensing of soil moisture with microwave radiometers. J. Geophys. Res. Earth Surf. 1974, 79, 317–323. [Google Scholar] [CrossRef] [Green Version]
- Ulaby, F.T.; Moore, R.K.; Fung, A.K. Microwave Remote Sensing Active and Passive. Rader Remote Sensing and Surface Scattering and Emission Theory; Addison-Wesley: Reading, MA, USA, 1982; pp. 848–902. [Google Scholar]
- Fang, B.; Lakshmi, V. Soil moisture at watershed scale: Remote sensing techniques. J. Hydrol. 2014, 516, 258–272. [Google Scholar] [CrossRef]
- Jackson, T.J. Soil moisture estimation using special satellite microwave/imager satellite data over a grassland region. Water Resour. Res. 1997, 33, 1475–1484. [Google Scholar] [CrossRef]
- Al Jassar, H.K.; Rao, K.S.; Sabbah, I. A model for the retrieval and monitoring of soil moisture over desert area of Kuwait. Int. J. Remote Sens. 2006, 27, 329–348. [Google Scholar] [CrossRef]
- Al-Jassar, H.K.; Rao, K.S. Monitoring of soil moisture over the Kuwait desert using remote sensing techniques. Int. J. Remote Sens. 2010, 31, 4373–4385. [Google Scholar] [CrossRef]
- Al Jassar, H.K.; Rao, K.S. Assessment of soil moisture through field measurements and AMSR-E Remote sensing data Analysis over Kuwait Desert. Kuwait J. Sci. 2015, 42, 250–260. [Google Scholar]
- Jackson, T.; Colliander, A.; Kimball, J.; Reichle, R.; Crow, W.; Entekhabi, D.; Neill, P. Science Data Calibration and Validation Plan. SMAP Mission; NASA Jet Propulsion Laboratory: Pasadena, CA, USA, 2012. [Google Scholar]
- Colliander, A.; Jackson, T.J.; Bindlish, R.; Chan, S.; Das, N.; Kim, S.B.; Cosh, M.H.; Dunbar, R.S.; Dang, L.; Pashaian, L.; et al. Validation of SMAP surface soil moisture products with core validation sites. Remote Sens. Environ. 2017, 191, 215–231. [Google Scholar] [CrossRef]
- Colliander, A.; Jackson, T.J.; Chan, S.K.; O’Neill, P.; Bindlish, R.; Cosh, M.H.; Caldwell, T.; Walker, J.P.; Berg, A.; McNairn, H.; et al. An assessment of the differences between spatial resolution and grid size for the SMAP enhanced soil moisture product over homogeneous sites. Remote Sens. Environ. 2018, 207, 65–70. [Google Scholar] [CrossRef]
- Colliander, A.; Cosh, M.H.; Misra, S.; Jackson, T.J.; Crow, W.T.; Chan, S.; Bindlish, R.; Chae, C.; Collins, C.H.; Yueh, S.H. Validation and scaling of soil moisture in a semi-arid environment: SMAP validation experiment 2015 (SMA-PVEX15). Remote Sens. Environ. 2017, 196, 101–112. [Google Scholar] [CrossRef]
- Colliander, A.; Jackson, T.; McNairn, H.; Chazanoff, S.; Dinardo, S.; Latham, B.; O’Dwyer, I.; Chun, W.; Yueh, S.; Njoku, E. Comparison of Airborne Passive and Active L-Band System (PALS) Brightness Temperature Measurements to SMOS Observations During the SMAP Validation Experiment 2012 (SMAPVEX12). IEEE Geosci. Remote Sens. Lett. 2014, 12, 801–805. [Google Scholar] [CrossRef]
- Chan, S.K.; Bindlish, R.; O’Neill, P.E.; Njoku, E.; Jackson, T.; Colliander, A.; Chen, F.; Burgin, M.; Dunbar, S.; Piepmeier, J.; et al. Assessment of the SMAP Passive Soil Moisture Product. IEEE Trans. Geosci. Remote Sens. 2016, 54, 4994–5007. [Google Scholar] [CrossRef]
- Yee, M.S.; Walker, J.P.; Monerris, A.; Rüdiger, C.; Jackson, T.J. On the identification of representative in situ soil moisture monitoring stations for the validation of SMAP soil moisture products in Australia. J. Hydrol. 2016, 537, 367–381. [Google Scholar] [CrossRef]
- Pan, M.; Cai, X.; Chaney, N.W.; Entekhabi, D.; Wood, E.F. An initial assessment of SMAP soil moisture retrievals using high-resolution model simulations and in situ observations. Geophys. Res. Lett. 2016, 43, 9662–9668. [Google Scholar] [CrossRef] [Green Version]
- Chan, S.; Bindlish, R.; O’Neill, P.; Jackson, T.; Chaubell, J.; Piepmeier, J.; Dunbar, S.; Colliander, A.; Chen, F.; Entekhabi, D.; et al. Development and validation of the SMAP enhanced passive soil moisture product. In Proceedings of the 2017 IEEE International Geoscience and Remote Sensing Symposium (IGARSS), Fort Worth, TX, USA, 23–28 July 2017; pp. 2539–2542. [Google Scholar]
- Jackson, T.J.; Bindlish, R.; Cosh, M.H.; Zhao, T.; Starks, P.J.; Bosch, D.D.; Seyfried, M.; Moran, M.S.; Goodrich, D.C.; Kerr, Y.H.; et al. Validation of Soil Moisture and Ocean Salinity (SMOS) Soil Moisture Over Watershed Networks in the U.S. IEEE Trans. Geosci. Remote Sens. 2012, 50, 1530–1543. [Google Scholar] [CrossRef] [Green Version]
- Sanchez, N.; Martinez-Fernandez, J.; Scaini, A.; Perez-Gutierrez, C. Validation of the SMOS L2 Soil Moisture Data in the REMEDHUS Network (Spain). IEEE Trans. Geosci. Remote Sens. 2012, 50, 1602–1611. [Google Scholar] [CrossRef]
- Kerr, Y.H.; Waldteufel, P.; Wigneron, J.P.; Martinuzzi, J.; Font, J.; Berger, M. Soil moisture retrieval from space: The Soil Moisture and Ocean Salinity (SMOS) mission. IEEE Trans. Geosci. Remote Sens. 2001, 39, 1729–1735. [Google Scholar] [CrossRef]
- Crow, W.T.; Berg, A.A.; Cosh, M.H.; Loew, A.; Mohanty, B.P.; Panciera, R.; de Rosnay, P.; Ryu, D.; Walker, J.P. Upscaling sparse ground-based soil moisture observations for the validation of coarse-resolution satellite soil moisture products. Rev. Geophys. 2012, 50, RG2002. [Google Scholar] [CrossRef] [Green Version]
- Jackson, T.J.; Cosh, M.H.; Bindlish, R.; Starks, P.J.; Bosch, D.D.; Seyfried, M.; Goodrich, D.C.; Moran, M.S.; Du, J.Y. Validation of Advanced Microwave Scanning Radiometer Soil Moisture Products. IEEE Trans. Geosci. Remote Sens. 2010, 48, 4256–4272. [Google Scholar] [CrossRef]
- Dente, L.; Vekerdy, Z.; Wen, J.; Su, Z. Maqu network for validation of satellite-derived soil moisture products. Int. J. Appl. Earth Obs. Geoinf. 2012, 17, 55–65. [Google Scholar] [CrossRef]
- AlJassar, H.K.; Temimi, M.; Entekhabi, D.; Petrov, P.; AlSarraf, H.; Kokkalis, P.; Roshni, N. Forward Simulation of Multi-Frequency Microwave Brightness Temperature over Desert Soils in Kuwait and Comparison with Satellite Observations. Remote Sens. 2019, 11, 1647. [Google Scholar] [CrossRef] [Green Version]
- Halwagy, R.; Halwagy, M. Ecological studies on the desert of Kuwait. II. The vegetation. J. Univ. Kuwait (Sci.) 1974, 1, 87–95. [Google Scholar]
- Omar, S.A.S.; Shahid, S.A. Reconnaissance Soil Survey for the State of Kuwait. In Developments in Soil Classification, Land Use Planning and Policy Implications; Springer: Dordrecht, The Netherlands, 2013; pp. 85–107. [Google Scholar] [CrossRef]
- Zribi, M.; Gorrab, A.; Baghdadi, N.; Lili-Chabaane, Z.; Mougenot, B. Influence of Radar Frequency on the Relationship Between Bare Surface Soil Moisture Vertical Profile and Radar Backscatter. IEEE Geosci. Remote Sens. Lett. 2013, 11, 848–852. [Google Scholar] [CrossRef] [Green Version]
- Colliander, A.; Reichle, R.H.; Crow, W.T.; Cosh, M.H.; Chen, F.; Chan, S.; Das, N.N.; Bindlish, R.; Chaubell, J.; Kim, S.; et al. Validation of soil moisture data products from the NASA SMAP mission. IEEE J. Sel. Top. Appl. Earth Obs. Remote Sens. 2021, 15, 364–392. [Google Scholar] [CrossRef]
- O’Neill, P.; Chan, S.; Colliander, A.; Dunbar, S.; Njoku, E.; Bindlish, R.; Chen, F.; Jackson, T.; Burgin, M.; Piepmeier, J.; et al. Evaluation of the validated Soil Moisture product from the SMAP radiometer. In Proceedings of the 2016 IEEE International Geoscience and Remote Sensing Symposium (IGARSS), Beijing, China, 10–15 July 2016; pp. 125–128. [Google Scholar]
- Kim, S.-B.; van Zyl, J.; Dunbar, S.; Njoku, E.; Johnson, J.; Moghaddam, M.; Shi, J.; Tsang, L. SMAP L2 Radar Half-Orbit 3 km EASE-Grid Soil Moisture, Version 3; NASA National Snow and Ice Data Center Distributed Active Archive Center: Boulder, CO, USA, 2016. [Google Scholar] [CrossRef]
- O’Neill, P.; Chan, S.; Bindlish, R.; Chaubell, M.; Colliander, A.; Chen, F.; Dunbar, S.; Jackson, T.; Peng, J.; Cosh, M.; et al. Soil Moisture Active Passive (SMAP) Project: Calibration and Validation for the L2/3_SM_P Version 7 and L2/3_SM_P_E Version 4 Data Products; Technical Report JPL D-56297; Jet Propulsion Laboratory: Pasadena, CA, USA, 2020. [Google Scholar]
- Chan, S.; Dunbar, S. SMAP L3 Passive Soil Moisture Product Specification Document; Jet Propulsion Laboratory: Pasadena, CA, USA, 2018. [Google Scholar]
- Available online: https://nsidc.org/data/smap (accessed on 25 May 2022).
- ONeill, P.E.; Chan, S.; Njoku, E.G.; Jackson, T.; Bindlish, R.; Chaubell, J. SMAP L3 Radiometer Global Daily 36 km EASE-Grid Soil Moisture, Version 7; NASA National Snow and Ice Data Center DAAC: Boulder, CO, USA, 2020. [Google Scholar]
- Entekhabi, D.; Das, N.; Njoku, E.; Johnson, J.; Shi, J. SMAP L3 Radar/Radiometer Global Daily 9 km EASE-Grid Soil Moisture, Version 3; NASA National Snow and Ice Data Center DAAC: Boulder, CO, USA, 2016. [Google Scholar] [CrossRef]
- Das, N.; Entekhabi, D.; Dunbar, R.S.; Kim, S.; Yueh, S.; Colliander, A.; O’Neill, P.E.; Jackson, T.; Jagdhuber, T.; Chen, F.; et al. SMAP/Sentinel-1 L2 Radiometer/Radar 30-Second Scene 3 km EASE-Grid Soil Moisture, Version 2; NASA National Snow and Ice Data Center DAAC: Boulder, CO, USA, 2018. [Google Scholar]
- Merlin, O.; Al Bitar, A.; Walker, J.P.; Kerr, Y. A sequential model for disaggregating near-surface soil moisture observations using multi-resolution thermal sensors. Remote Sens. Environ. 2009, 113, 2275–2284. [Google Scholar] [CrossRef] [Green Version]
- Merlin, O.; Al Bitar, A.; Walker, J.P.; Kerr, Y. An improved algorithm for disaggregating microwave-derived soil moisture based on red, near-infrared and thermal-infrared data. Remote Sens. Environ. 2010, 114, 2305–2316. [Google Scholar] [CrossRef] [Green Version]
- Merlin, O.; Chehbouni, A.G.; Boulet, G.; Kerr, Y. Assimilation of the disaggregated microwave soil moisture into hydrological modeling using coarse resolution meteorological data: A study case based on the Monsoon 90 data. J. Hydrometeorol. 2006, 7, 1308–1322. [Google Scholar] [CrossRef]
- Merlin, O.; Duchemin, B.; Hagolle, O.; Jacob, F.; Coudert, B.; Chehbouni, G.; Dedieu, G.; Garatuza, J.; Kerr, Y. Dis-aggregation of MODIS surface temperature over an agricultural area using a time series of Formosat-2 images. Remote Sens. Environ. 2010, 114, 2500–2512. [Google Scholar] [CrossRef] [Green Version]
- Merlin, O.; Escorihuela, M.J.; Mayoral, M.A.; Hagolle, O.; Al Bitar, A.; Kerr, Y. Self-calibrated evaporation-based disaggregation of SMOS soil moisture: An evaluation study at 3 km and 100 m resolution in Catalunya, Spain. Remote Sens. Environ. 2012, 130, 25–38. [Google Scholar] [CrossRef] [Green Version]
- Merlin, O.; Rudiger, C.; Al Bitar, A.; Richaume, P.; Walker, J.P.; Kerr, Y.H. Disaggregation of SMOS Soil Moisture in Southeastern Australia. IEEE Trans. Geosci. Remote Sens. 2012, 50, 1556–1571. [Google Scholar] [CrossRef] [Green Version]
- Merlin, O.; Rüdiger, C.; Richaume, P.; Al Bitar, A.; Mialon, A.; Walker, J.; Kerr, Y. Disaggregation as a top-down approach for evaluating 40 km resolution SMOS data using point-scale measurements: Application to AACES-1. In Proceedings Volume 7824, Remote Sensing for Agriculture, Ecosystems, and Hydrology XII; SPIE: Bellingham, WA, USA, 2010; p. 78240I. [Google Scholar] [CrossRef]
- Available online: https://www.catds.fr/Products (accessed on 25 May 2022).
- National Research Council. Handbook of Frequency Allocations and Spectrum Protection for Scientific Uses; The National Academies Press: Washington, DC, USA, 2007. [Google Scholar] [CrossRef]
- Aksoy, M.; Johnson, J.T. A Comparative Analysis of Low-Level Radio Frequency Interference in SMOS and Aquarius Microwave Radiometer Measurements. IEEE Trans. Geosci. Remote Sens. 2013, 51, 4983–4992. [Google Scholar] [CrossRef]
- Aksoy, M.; Johnson, J.T. A study of SMOS RFI over North America. IEEE Geosci. Remote Sens. Lett. 2012, 10, 515–519. [Google Scholar] [CrossRef]
- Peng, J.; Misra, S.; Chan, S.; Chaubell, J.; Bindlish, R.; Bringer, A.; Colliander, A.; de Amici, G.; Dinnat, E.P.; Hudson, D.; et al. SMAP Radiometer Brightness Temperature Calibration for the L1B_TB, L1C_TB (Version 5), and L1C_TB_E (Version 3) Data Products; Jet Propulsion Laboratory: Pasadena, CA, USA, 2020. [Google Scholar]
- Chaubell, J.; Chan, S.; Dunbar, R.S.; Peng, J.; Yueh, S. SMAP Enhanced L1C Radioameter Half-Orbit 9 km EASE-Grid Brightness Temperatures, Version 3; [Indicate Subset Used]; NASA National Snow and Ice Data Center Distributed Active Archive Center: Boulder, CO, USA, 2020. [Google Scholar] [CrossRef]
- SMOS Level 2 and Auxiliary Data Products Specifications—SO-TN-IDR-GS-0006. Available online: https://earth.esa.int/eogateway/documents/20142/0/SMOS-L2-Aux-Data-Product-Specification.pdf (accessed on 25 May 2022).
- Chen, Y.-J. Letter to the Editor on “Rank Stability or Temporal Stability”. Soil Sci. Soc. Am. J. 2006, 70, 306. [Google Scholar] [CrossRef]
- Vachaud, G.; De Silans, A.P.; Balabanis, P.; Vauclin, M. Temporal Stability of Spatially Measured Soil Water Probability Density Function. Soil Sci. Soc. Am. J. 1985, 49, 822–828. [Google Scholar] [CrossRef]
- Entekhabi, D.; Yueh, S.; O’Neill, P.E.; Kellogg, K.H.; Allen, A.; Bindlish, R.; Brown, M.; Chan, S.; Colliander, A.; Crow, W.T.; et al. SMAP Handbook–Soil Moisture Active Passive: Mapping Soil Moisture and Freeze/Thaw from Space; Jet Propulsion Laboratory: Pasadena, CA, USA, 2014. [Google Scholar]
- Available online: https://earth.esa.int/web/eoportal/satellite (accessed on 15 August 2021).
- Chen, Y.; Yang, K.; Qin, J.; Cui, Q.; Lu, H.; La, Z.; Han, M.; Tang, W. Evaluation of SMAP, SMOS, and AMSR2 soil moisture retrievals against observations from two networks on the Tibetan Plateau. J. Geophys. Res. Atmos. 2017, 122, 5780–5792. [Google Scholar] [CrossRef]
- Ye, N.; Walker, J.; Guerschman, J.; Ryu, D.; Gurney, R. Standing water effect on soil moisture retrieval from L-band passive microwave observations. Remote Sens. Environ. 2015, 169, 232–242. [Google Scholar] [CrossRef]
- Temimi, M.; Fonseca, R.; Nelli, N.; Weston, M.; Thota, M.; Valappil, V.; Branch, O.; Wizemann, H.-D.; Kondapalli, N.K.; Wehbe, Y.; et al. Assessing the Impact of Changes in Land Surface Conditions on WRF Predictions in Arid Regions. J. Hydrometeorol. 2020, 21, 2829–2853. [Google Scholar] [CrossRef]
- Cosh, M.H.; Jackson, T.J.; Starks, P.; Bosch, D.; Collins, C.H.; Seyfried, M.; Prueger, J.; Livingston, S.; Bindlish, R. Strategies for validating satellite soil moisture products using in situ networks: Lessons from the USDA-ARS watersheds. In Proceedings of the 2017 IEEE International Geoscience and Remote Sensing Symposium (IGARSS), Fort Worth, TX, USA, 23–28 July 2017; pp. 2015–2018. [Google Scholar] [CrossRef] [Green Version]
- Coopersmith, E.J.; Cosh, M.H.; Bell, J.E.; Kelly, V.; Hall, M.; Palecki, M.A.; Temimi, M. Deploying temporary net-works for upscaling of sparse network stations. Int. J. Appl. Earth Obs. Geoinf. 2016, 52, 433–444. [Google Scholar]
- Cui, C.; Xu, J.; Zeng, J.; Chen, K.-S.; Bai, X.; Lu, H.; Chen, Q.; Zhao, T. Soil Moisture Mapping from Satellites: An Intercomparison of SMAP, SMOS, FY3B, AMSR2, and ESA CCI over Two Dense Network Regions at Different Spatial Scales. Remote Sens. 2018, 10, 33. [Google Scholar] [CrossRef] [Green Version]


| Metric | Symbol | Definition | Range | Perfect Score |
|---|---|---|---|---|
| Mean Relative Difference | MRD | [−∞, +∞] | 0 | |
| Standard Deviation of Relative Difference | SDRD | [−∞, +∞] | 0 | |
| Absolute Mean Bias | AMB | [−∞, +∞] | 0 | |
| Standard Deviation | SD | [−∞, +∞] | 0 | |
| Mean Difference | MD | [−∞, +∞] | 0 | |
| Root Mean Square Error | RMSE | [0, +∞] | 0 | |
| Unbiased Root Mean Square Difference | ubRMSD | [0, +∞] | 0 | |
| Correlation Coefficient | R | [−1, 1] | 1 |
Publisher’s Note: MDPI stays neutral with regard to jurisdictional claims in published maps and institutional affiliations. |
© 2022 by the authors. Licensee MDPI, Basel, Switzerland. This article is an open access article distributed under the terms and conditions of the Creative Commons Attribution (CC BY) license (https://creativecommons.org/licenses/by/4.0/).
Share and Cite
AlJassar, H.; Temimi, M.; Abdelkader, M.; Petrov, P.; Kokkalis, P.; AlSarraf, H.; Roshni, N.; Hendi, H.A. Validation of NASA SMAP Satellite Soil Moisture Products over the Desert of Kuwait. Remote Sens. 2022, 14, 3328. https://doi.org/10.3390/rs14143328
AlJassar H, Temimi M, Abdelkader M, Petrov P, Kokkalis P, AlSarraf H, Roshni N, Hendi HA. Validation of NASA SMAP Satellite Soil Moisture Products over the Desert of Kuwait. Remote Sensing. 2022; 14(14):3328. https://doi.org/10.3390/rs14143328
Chicago/Turabian StyleAlJassar, Hala, Marouane Temimi, Mohamed Abdelkader, Peter Petrov, Panagiotis Kokkalis, Hussain AlSarraf, Nair Roshni, and Hamad Al Hendi. 2022. "Validation of NASA SMAP Satellite Soil Moisture Products over the Desert of Kuwait" Remote Sensing 14, no. 14: 3328. https://doi.org/10.3390/rs14143328