Article

A Lightweight Network Based on One-Level Feature for Ship Detection in SAR Images

1
Aerospace Information Research Institute, Chinese Academy of Sciences, Beijing 100190, China
2
School of Electronic, Electrical and Communication Engineering, University of Chinese Academy of Sciences, Beijing 101408, China
*
Author to whom correspondence should be addressed.
Remote Sens. 2022, 14(14), 3321; https://doi.org/10.3390/rs14143321
Submission received: 3 June 2022 / Revised: 3 July 2022 / Accepted: 7 July 2022 / Published: 10 July 2022
(This article belongs to the Special Issue Remote Sensing in Intelligent Maritime Research)

Abstract

:
Recently, deep learning has greatly promoted the development of detection methods for ship targets in synthetic aperture radar (SAR) images. However, existing detection networks are mostly based on large-scale models and high-cost computations, which require high-performance computing equipment to realize real-time processing and limit their hardware transplantation to onboard platforms. To address this problem, a lightweight ship detection network via YOLOX-s is proposed in this paper. Firstly, we remove the computationally heavy pyramidal structure and build a streamlined network based on a one-level feature for higher detection efficiency. Secondly, to expand the limited receptive field and enhance the semantic information of a single-feature map, a residual asymmetric dilated convolution (RADC) block is proposed. Through four branches with different dilation rates, the RADC block can help the detector to capture various ships in complex backgrounds. Finally, to tackle the imbalance problem between ships of different scales in the training stage, we put forward a balanced label assignment strategy called center-based uniform matching. To verify the effectiveness of the proposed method, we conduct extensive experiments on the SAR Ship Detection Dataset (SSDD) and High-Resolution SAR Images Dataset (HRSID). The results show that our method can achieve comparable performance to general detection networks with much less computational cost.

Graphical Abstract

1. Introduction

Synthetic aperture radar (SAR) is an active microwave earth observation system that can stably provide high-resolution images in all weather conditions at any time of day. With the rapid development of SAR technology, the quantity and diversity (i.e., different resolutions, scenarios, imaging platforms, etc.) of SAR images are improving year by year, which promotes the research of SAR image interpretation algorithms [1,2,3,4]. Among the interpretation tasks of SAR images, ship detection is a fundamental task in marine monitoring and national defense. However, due to the complex background and resource-constrained onboard environments, real-time ship detection with high-resolution SAR images is still a challenging task.
Traditional ship detection methods are mainly based on prior knowledge, such as statistical models and hand-crafted features. One of the most representative methods is the constant false alarm rate (CFAR) [5] detection algorithm, which models the background clutter using statistical distribution and computes an adaptive threshold to determine whether a pixel belongs to the target region. To deal with different sea conditions, researchers have designed many novel CFAR detectors by adopting different statistical models to fit complex sea clutter and designing new sliding window structures to estimate model parameters. However, the scattering-based CFAR heavily relies on sea conditions and cannot deal with multitarget situations and nonhomogeneous backgrounds. To solve this problem, other features are also utilized to detect ships, such as extended fractal features [6], scale-invariant feature transform (SIFT) [7], reflection symmetry properties [8], and saliency information [9]. The performance of these methods mainly depends on manually designed features and is not stable when ships are of various shapes or under different backgrounds. Moreover, sea–land segmentation is always required to decrease false alarms in inshore areas, which increases the complexity of the detection algorithm.
Object detection in optical images is one of the major tasks in computer vision and great breakthroughs have been made in recent years. Benefitting from their automatic learning ability and powerful feature extracting ability, convolutional neural networks (CNNs) can precisely locate targets in the image. According to the development process of CNN-based detectors, they can be roughly grouped into three categories: two-stage methods [10,11,12], one-stage anchor-based methods [13,14,15,16,17,18], and one-stage anchor-free methods [19,20,21]. In the recently presented YOLOX [22], the YOLO network is integrated with an anchor-free mechanism and SimOTA label matching strategy, which achieves state-of-the-art performance.
The breakthrough in computer vision also promotes the rapid development of SAR image processing. Attracted by their simplicity and high accuracy, many scholars tried to introduce these CNN-based detectors to SAR image interpretation tasks [2,23,24,25,26,
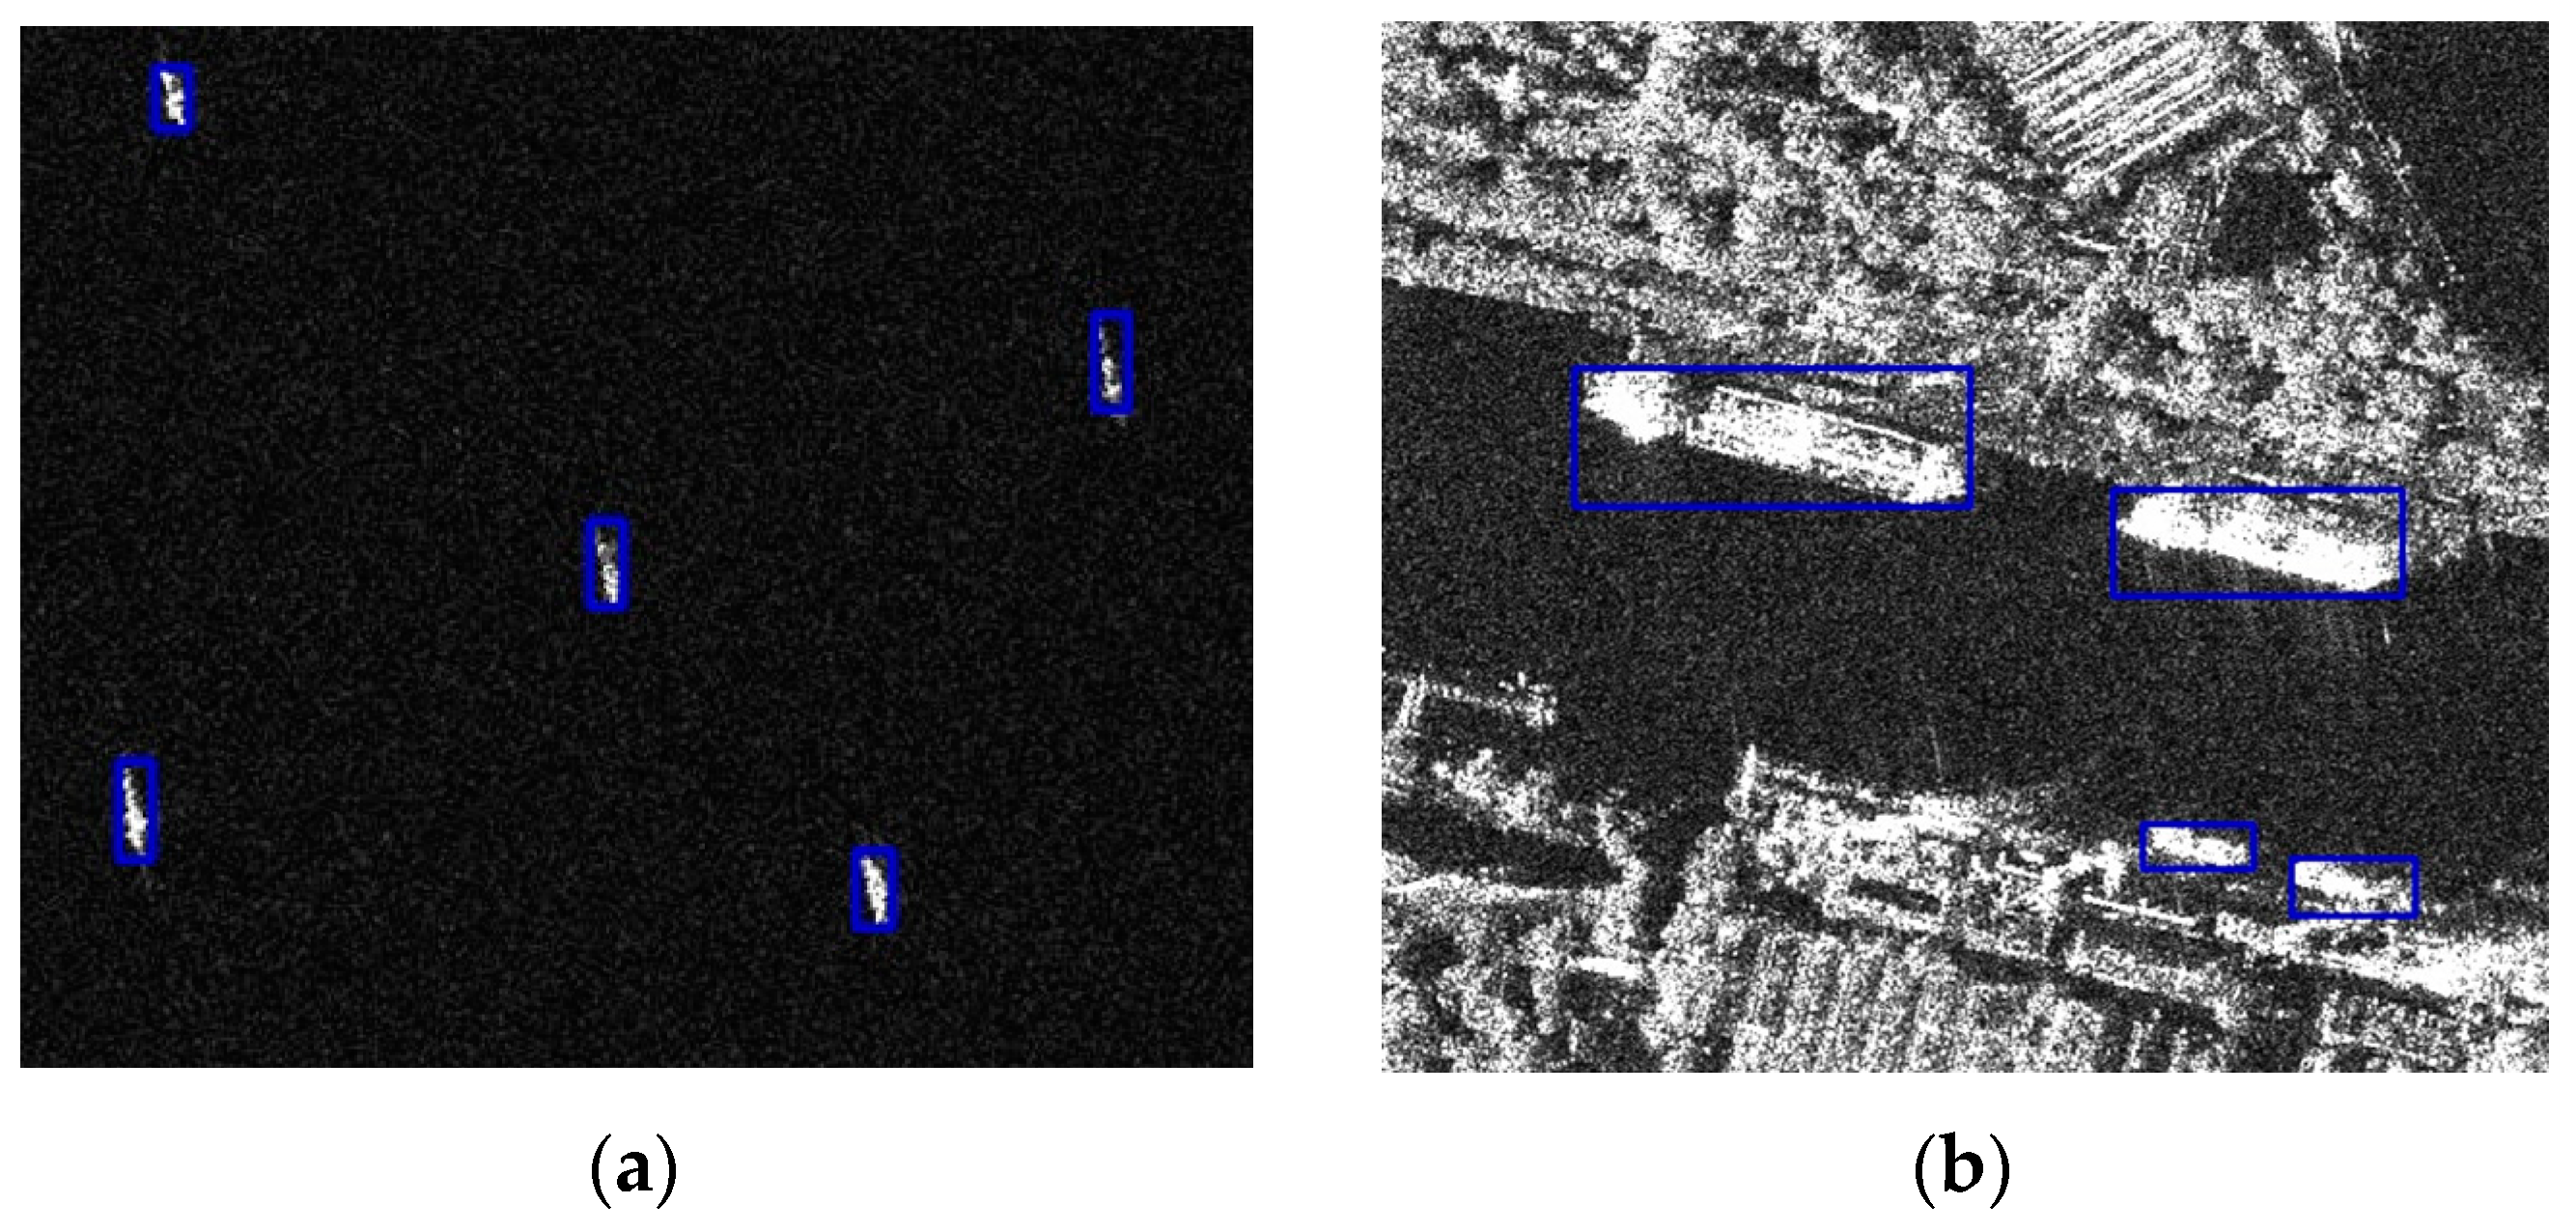
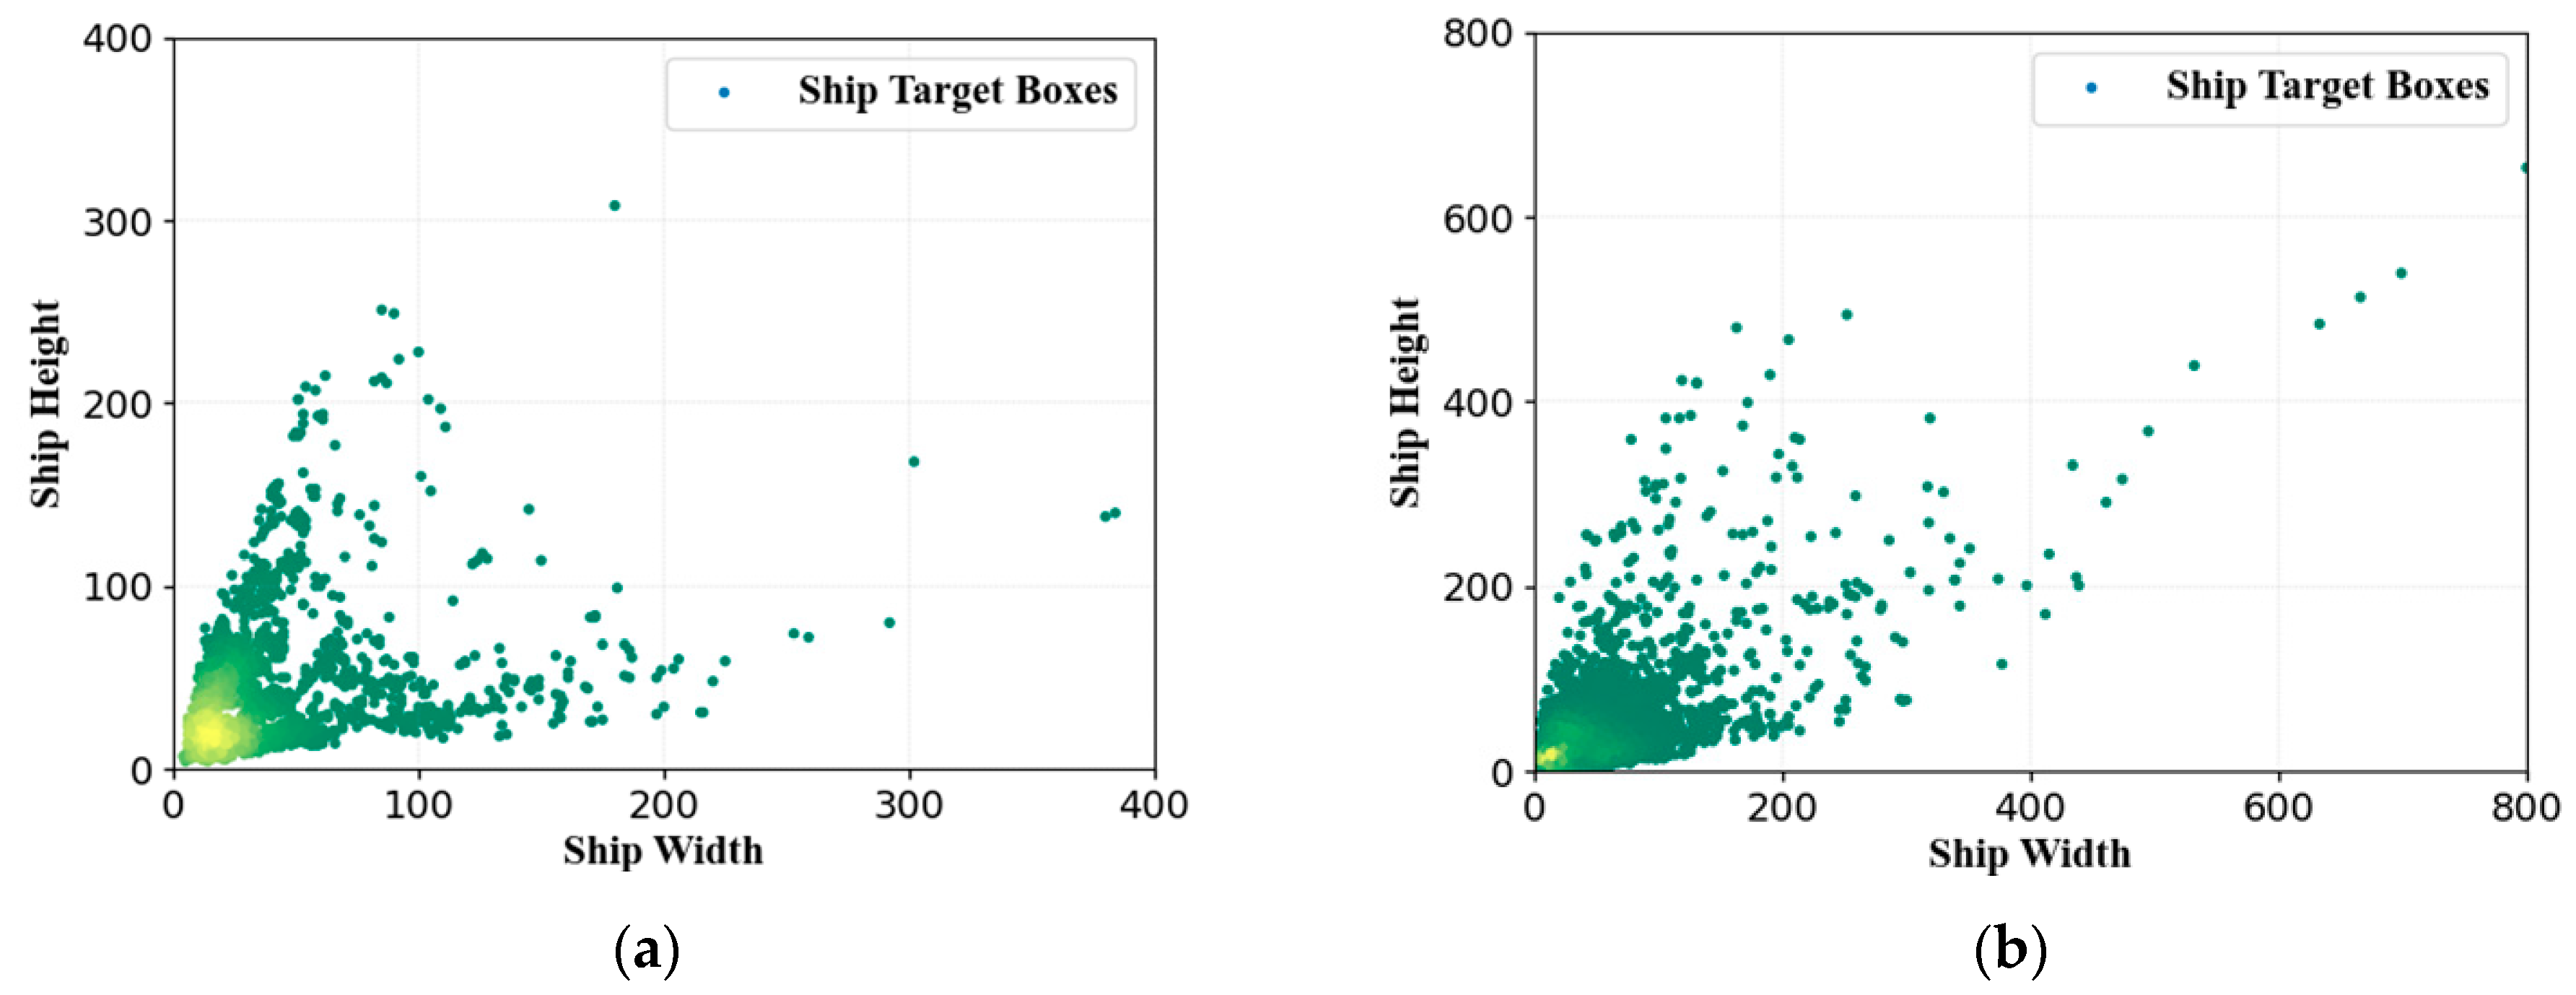
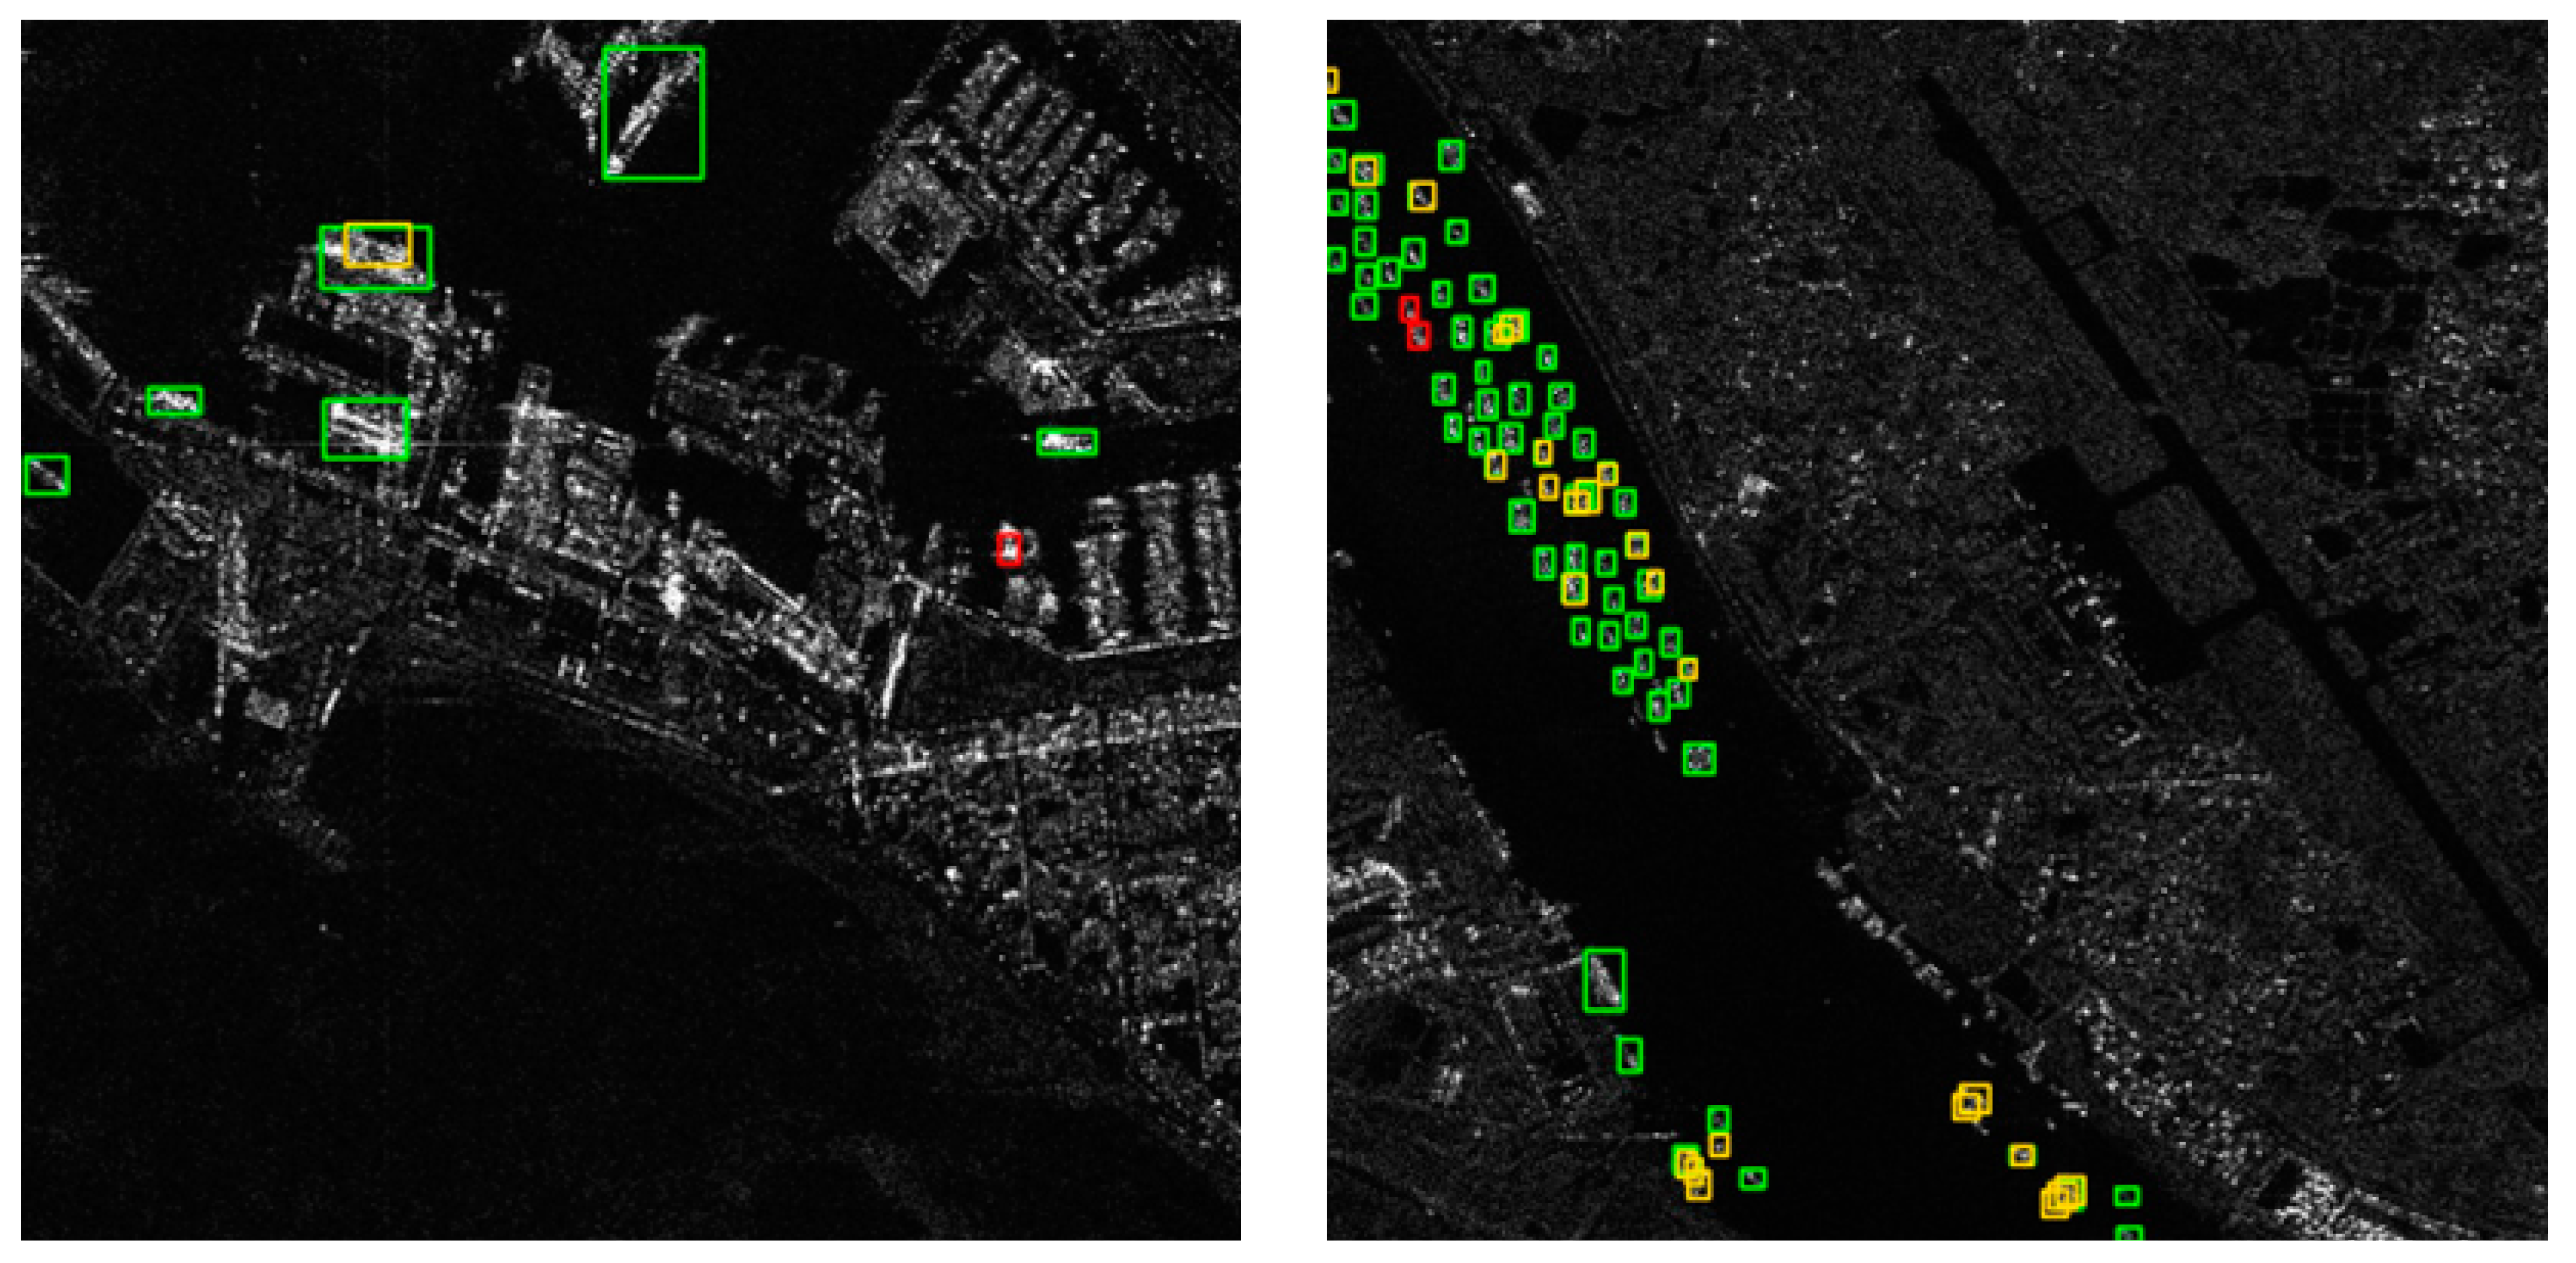
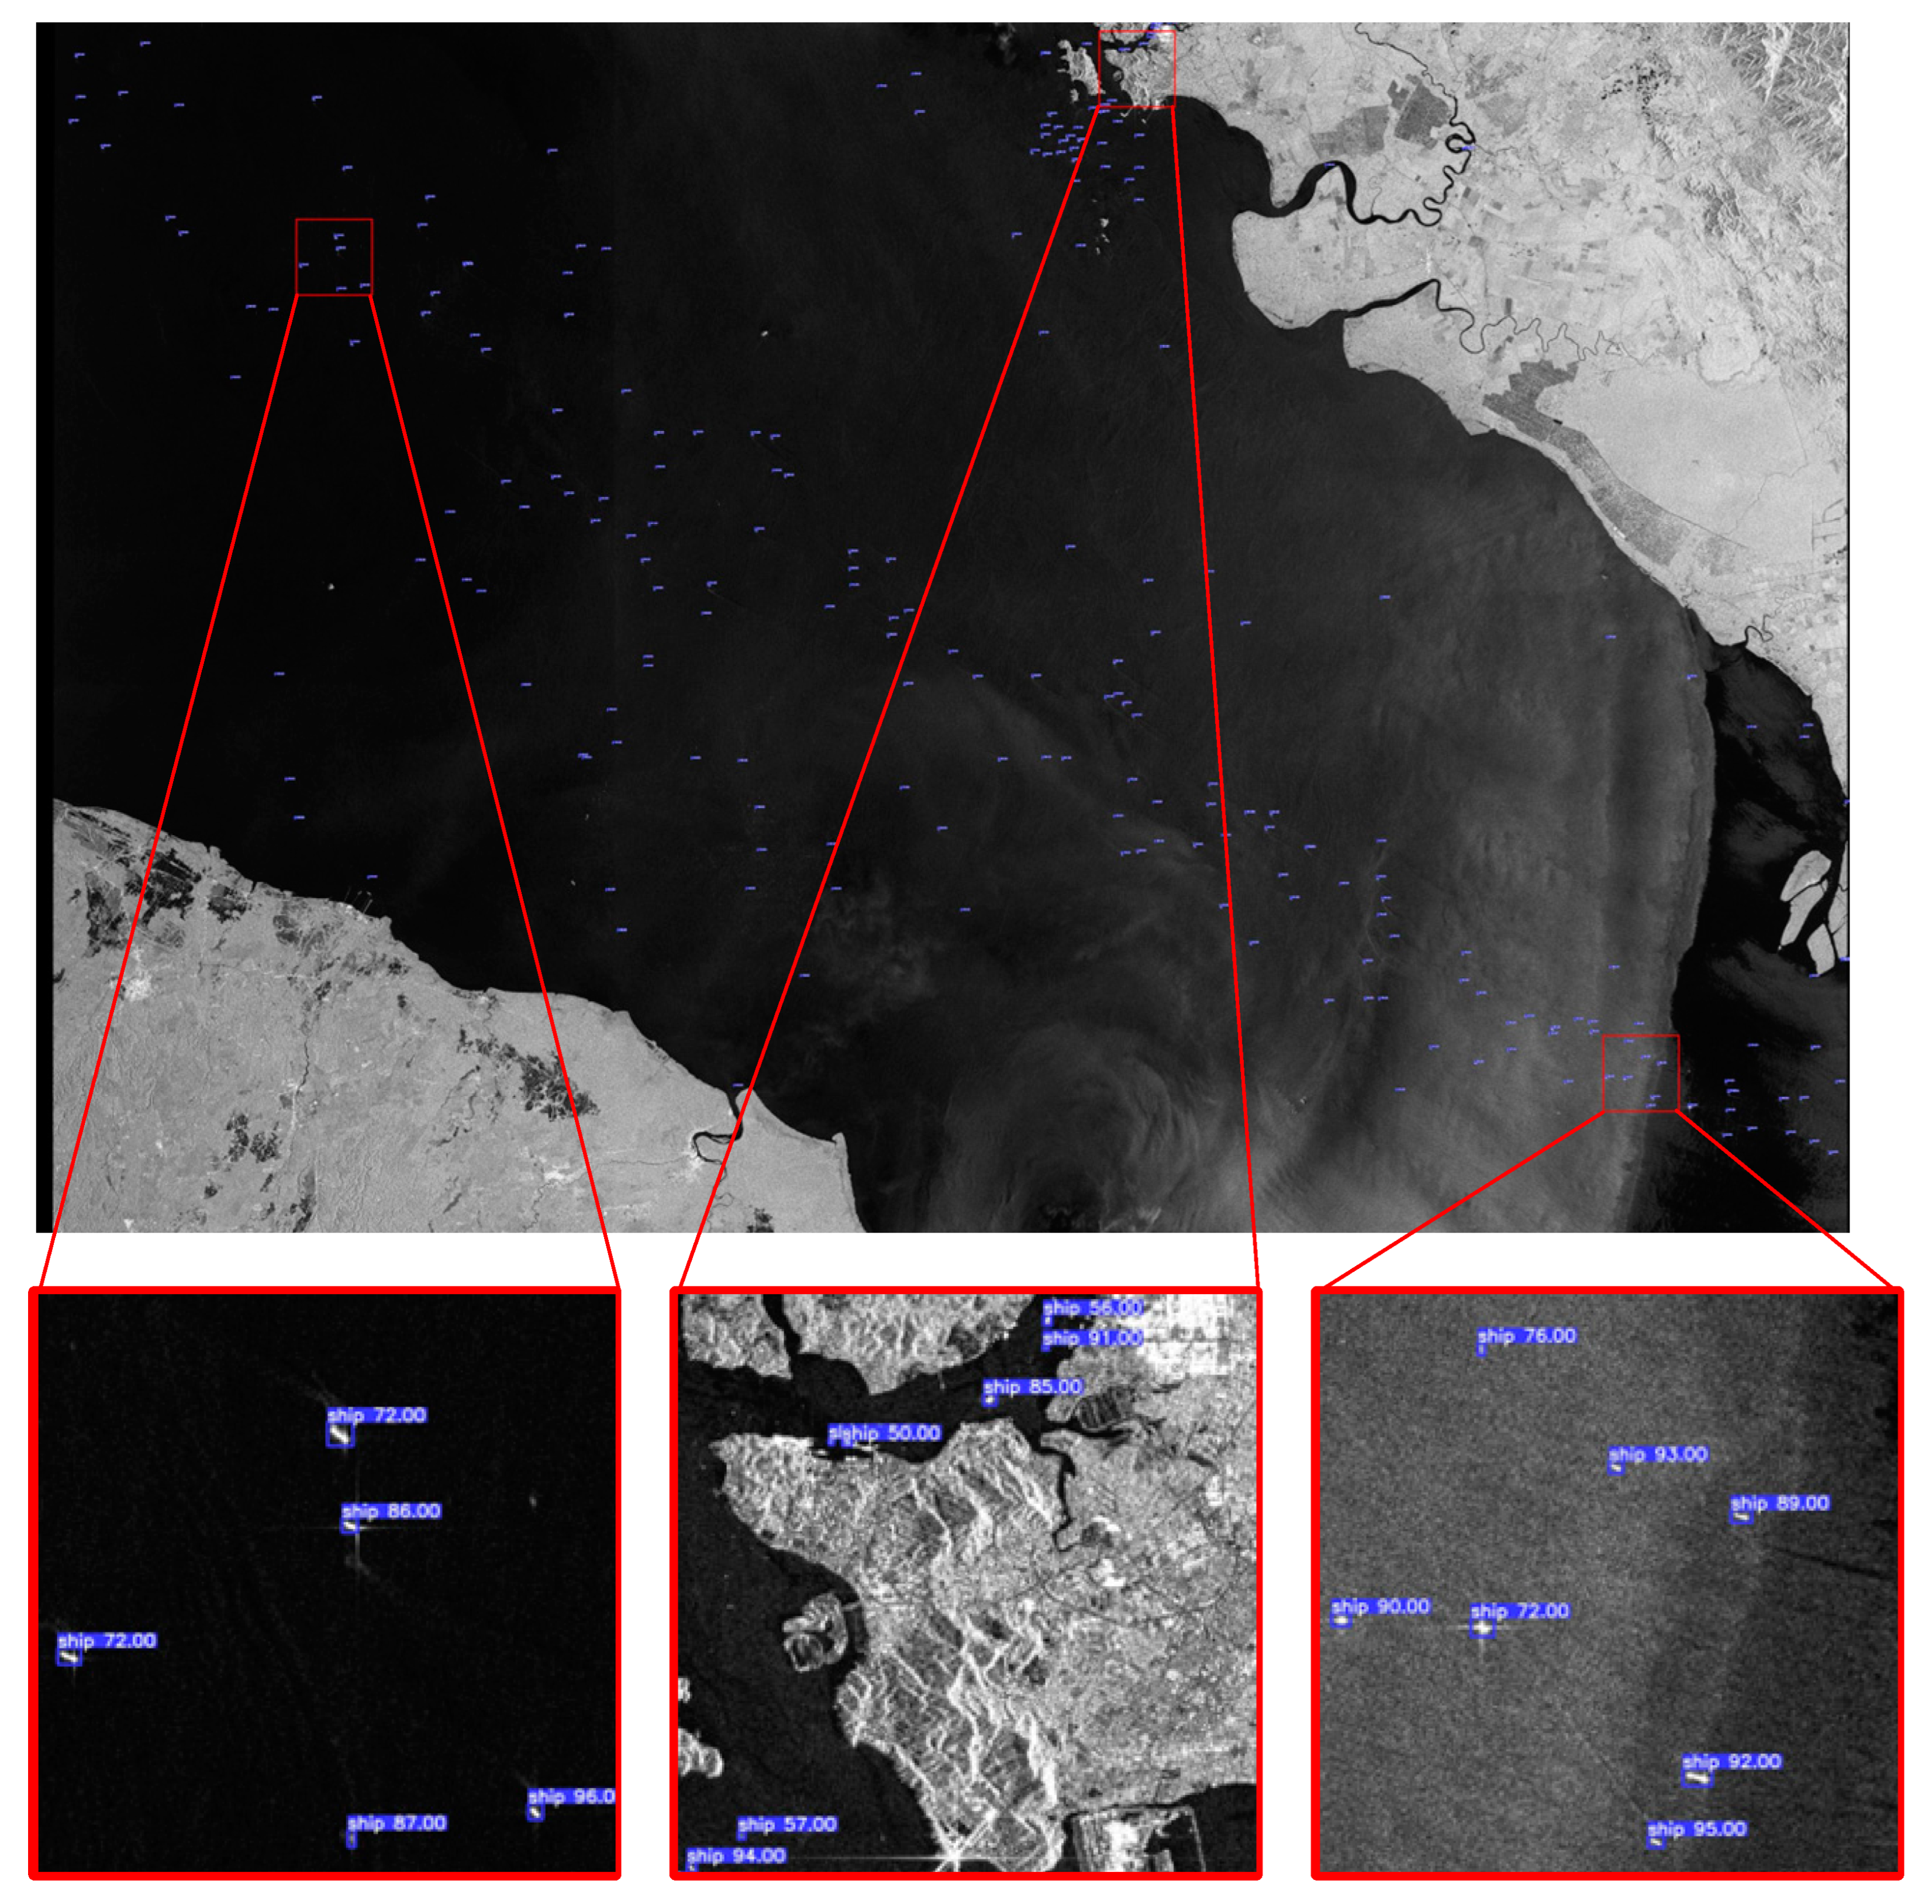
27]. However, certain problems remain to be solved for ship detection in SAR images. First, due to the active imaging mechanism of SAR, there inevitably exists coherent speckle noise, which is far from the noise in optical images and leads to a more complex background. Besides, despite the various image resolutions and ship sizes, most ships are small compared to the large-scene background, as shown in Figure 1a. Small ships take up only a few pixels in the image, making them more likely to be missed by the network. To address these problems, scholars have proposed many novel models to improve ship detection accuracy. Kang et al. [28] combined three feature layers for region generation and proposed a contextual CNN detector. Jiao et al. [29] densely connected all feature maps from top down to achieve multiscale and multiscene SAR ship detection. To detect multiscale ships with different directions, Zhao et al. [30] designed an attention-receptive pyramid network. Fu et al. [31] proposed level-based attention to better fuse features across different pyramidal levels. Zhang et al. [32] integrated four unique FPNs to constitute the Quad-FPN and significantly boosted ship detection performance. Gao et al. [33] replaced the path aggregation network (PANet) [34] in YOLOv4 [16] with the scale-equalizing pyramid convolution (SEPC) [35] to better extract semantic characteristics of different scales. Among these methods, inserted modules, e.g., the attention mechanism, and a new feature fusion approach are common solutions to complex backgrounds and small target scales. However, the model parameter and computational complexity are also increased due to extra structures, causing a decline in detection speed.
In practical maritime surveillance, the timeliness of detection results is important in addition to accuracy. Since data transmitting between satellite and ground station could be time-consuming, it is of crucial importance to realize real-time on-satellite ship detection. However, the weight and volume of the processing system are limited due to the finite load of the satellite, leading to constrained computation resources. Therefore, lightness and efficiency of the detection model are critical to algorithm deployment and achieving real-time detection. For neural network-based detectors, the network architecture which decides how features are propagated and represented is of vital importance to the efficiency of detection algorithms. In consideration of this, some researchers have put forward novel lightweight models to improve detection speed. Zhang et al. [37] proved that SAR ship detection is relatively easier than optical target detection by proposing “ShipDeNet-20”, which combines feature fusion, feature enhance and scale share feature pyramid modules to build a lightweight and precise model. To realize low-equipment-required real-time ship detection, Jiang et al. [38] constructed an end-to-end detection network based on YOLOv4, achieving a smaller model size and higher detection speed. Feng et al. [39] redesigned the backbone of YOLOX and proposed position-enhanced attention to improve the accuracy and speed of SAR ship detection from a more balanced perspective.
Moreover, general detection networks designed for optical images become redundant when they are directly applied to SAR ship detection. Compared to optical images, SAR images have a relatively low resolution as well as a low signal-to-noise ratio, which means the amplitude information of SAR images is not as incomprehensible as that of optical targets for CNN. Hence, there is room for the simplification of ship detection networks. For instance, the feature pyramid structure is widely adopted in recently developed detection networks [22,40,41] to achieve multiscale detection. As shown in 
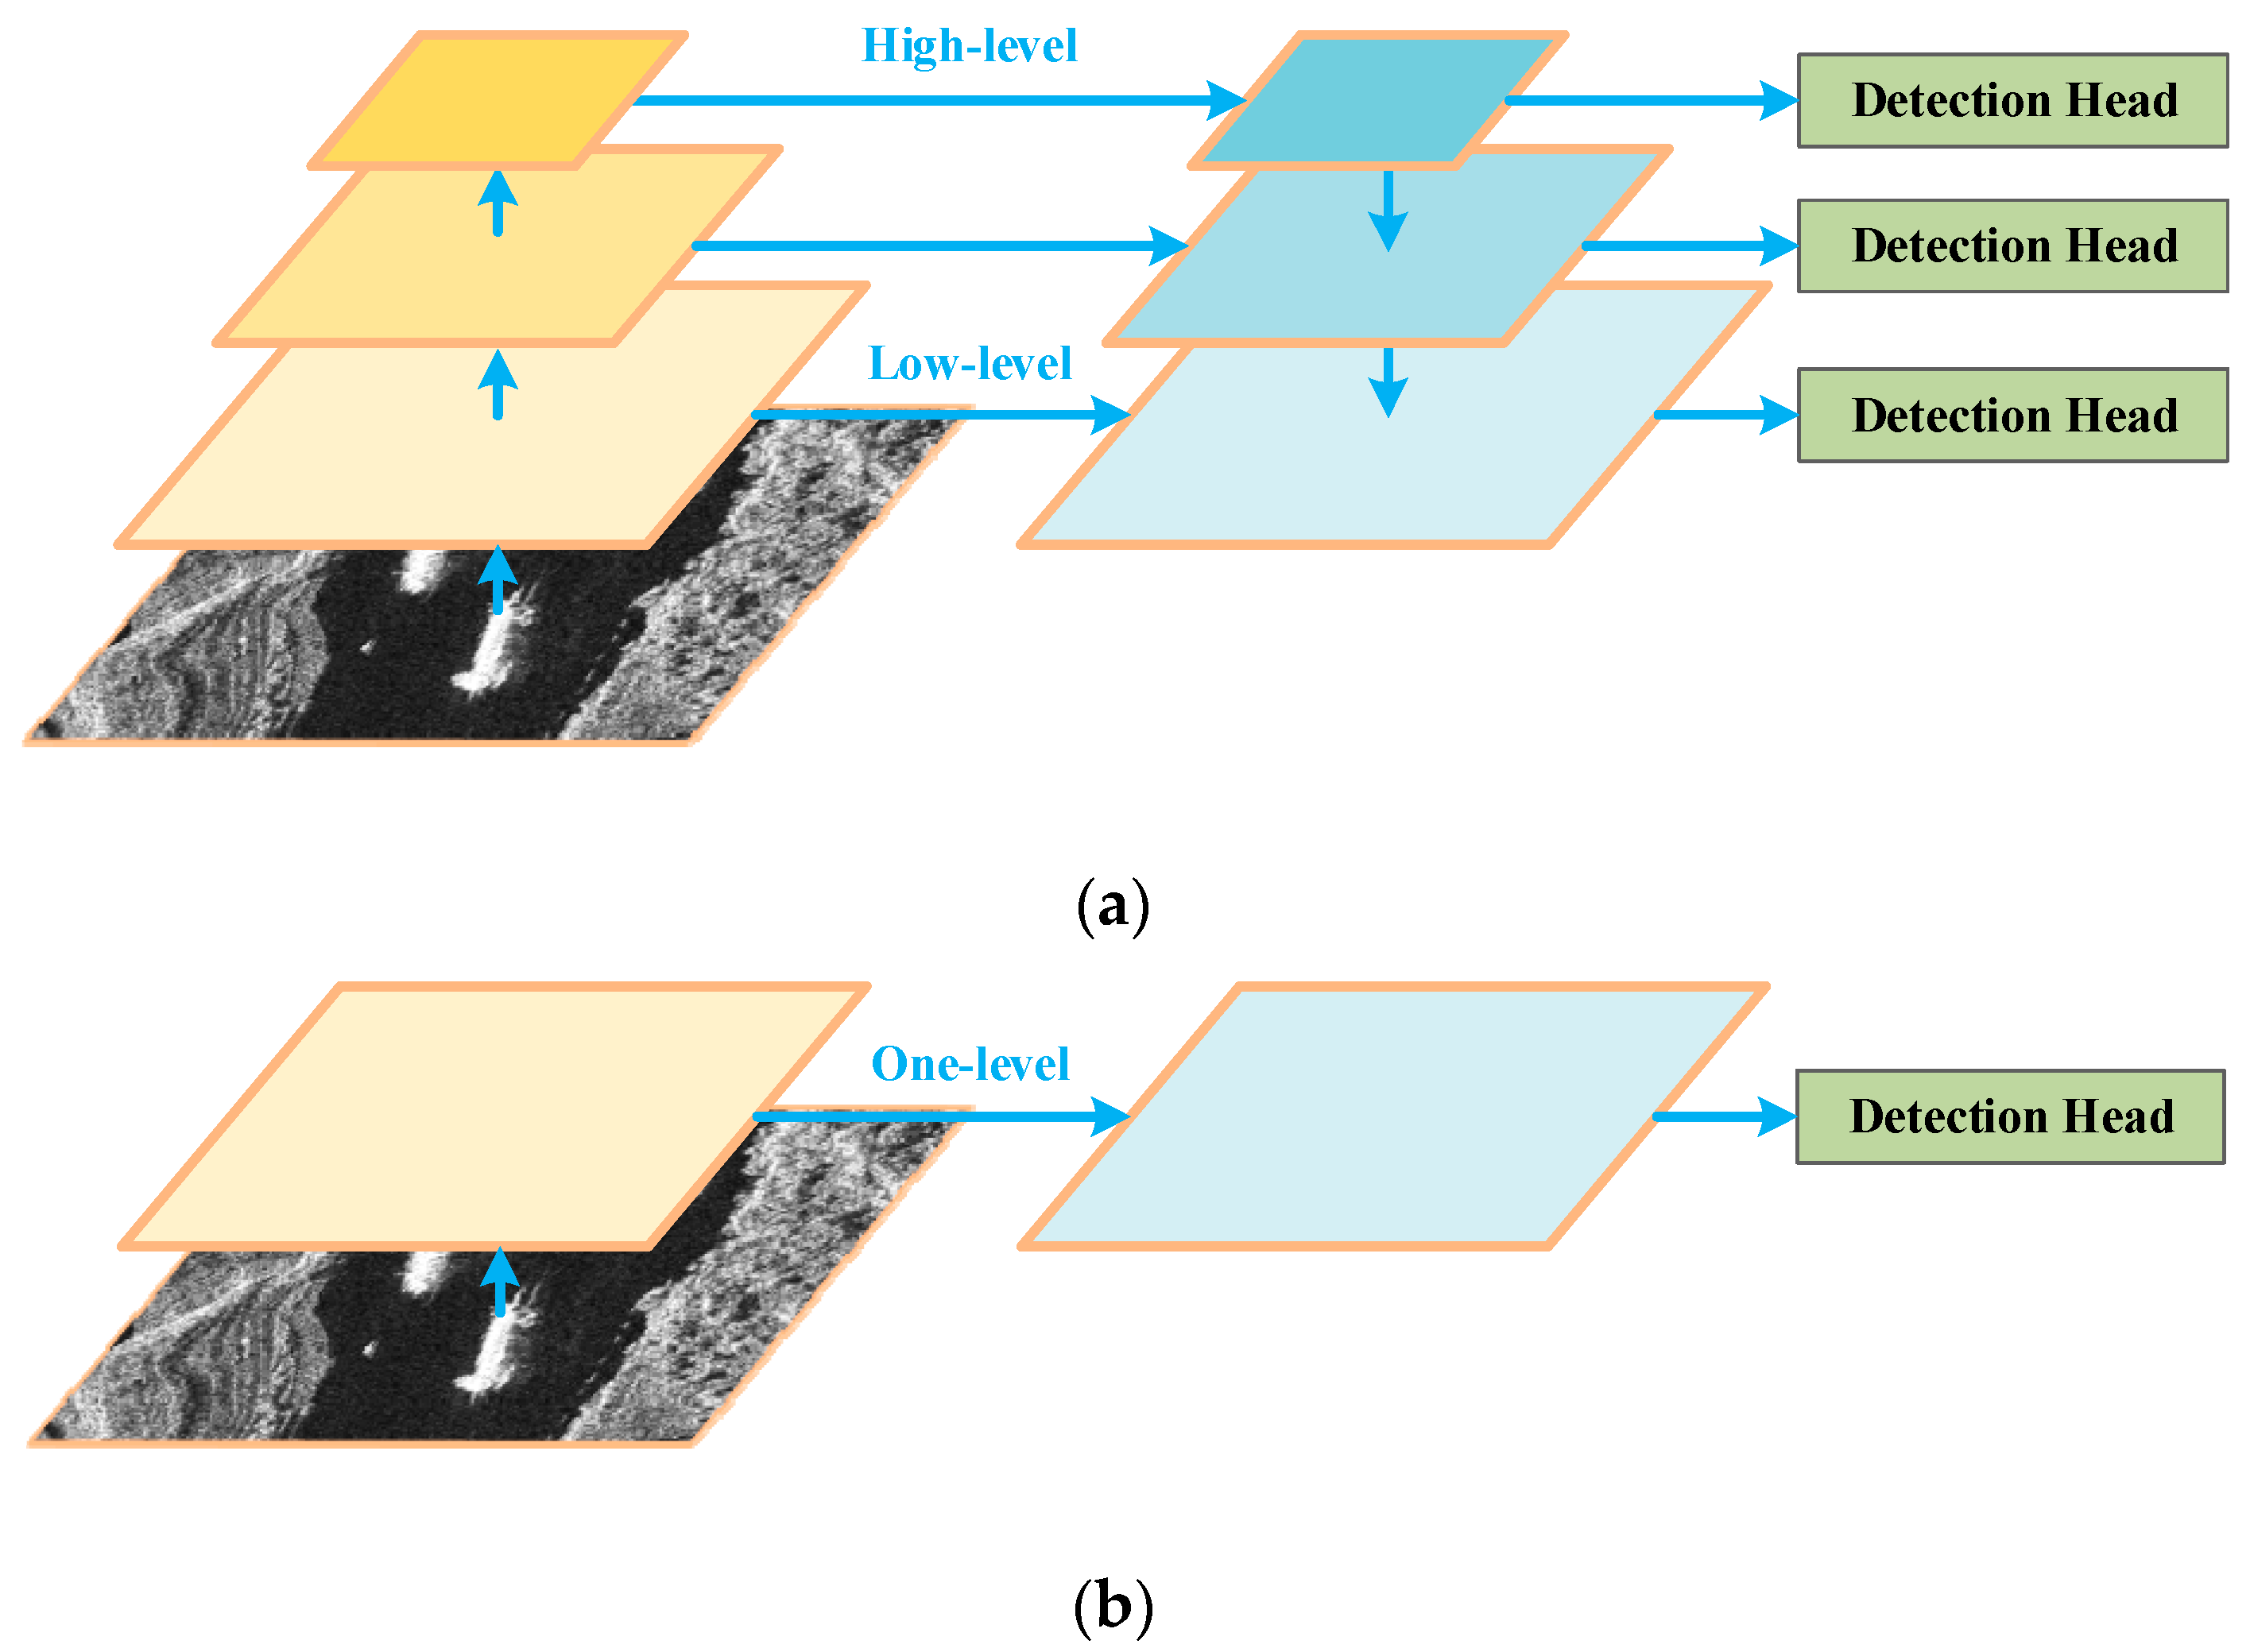
Figure 2a, the key idea of such pyramidal structures is to combine semantically weak but spatially strong low-level feature maps with spatially coarse but semantically strong high-level feature maps to create a feature pyramid that has strong semantical information at all scales. In optical images with complex contexts, the target scale distribution is more even; therefore, the feature pyramid is essential for balancing targets of different scales. It can utilize multiple feature maps to split the optimization process of the complex detection problem into multiple subproblems according to object scales, thus improving detection efficiency. However, the situation is different for SAR ship detection. There are two main reasons. First, although the size of the ship target varies by ship type and imaging resolution, most ships are small and cover a few pixels in SAR images. Because the downsampling operation in CNNs loses detail information and is affected by speckle noise and background interference, these small ships tend to be more easily overlooked in high-level features. Intuitively, it is questionable whether a ship with a length and width of no more than 20 pixels retains valid target information after 32× downsampling. As a result, the fusion between high-level features and low-level features could be of little help to the latter. Second, compared to optical images containing multiple color channels, single-channel SAR images have a relatively low texture level. Therefore, the semantic information of SAR ship targets is not as complex as that of optical image targets, leading to a relative reduction in the required network depth [36]. The semantic level in low-level features could be discriminative enough to distinguish between ships and interference, making the localization information in low-level features more important than the semantic information from high-level features. Therefore, feature pyramids are inefficient for SAR ship detection due to their equal focus on high-level features and low-level features. In summary, although the feature pyramid can deal with multiscale target problems, it is not efficient enough for fast ship detection.
Based on the analysis above, a lightweight SAR ship detection method using a one-level feature is proposed. On account of the state-of-the-art performance, we chose the small version of YOLOX, i.e., YOLOX-s, as our baseline and further simplified the network structure. Different from current detection methods, the proposed network replaced the computationally heavy feature pyramid structure with neat convolution blocks and detect objects based on the one-level feature. It can be seen from Figure 2b that the proposed network has a shallower depth and more simple structure, showing greater portability. Detailed contributions of this paper are summarized as follows:
(1)
Inspired by the idea of utilizing a one-level feature in YOLOF [42], the feature representation ability of one-level feature maps for ship detection in SAR images is verified and a novel ship detector is proposed. Different from mainstream ship detection methods, the proposed method offers an alternative option to complex pyramidal structures by detecting ships using a one-level feature, which is valid and efficient.
(2)
In order to expand the receptive field and enrich semantic information of the one-level feature map, a residual asymmetric dilated convolution (RADC) block is proposed. By stacking convolutional blocks with four different dilated branches, ships with various shapes can be captured by the network efficiently.
(3)
Since the proposed network detects objects on a single scale, large targets take up more pixels whereas small targets are easily ignored when calculating losses. To deal with this imbalance problem, center-based uniform matching, which assigns labels based on their center locations, is employed during the training stage.
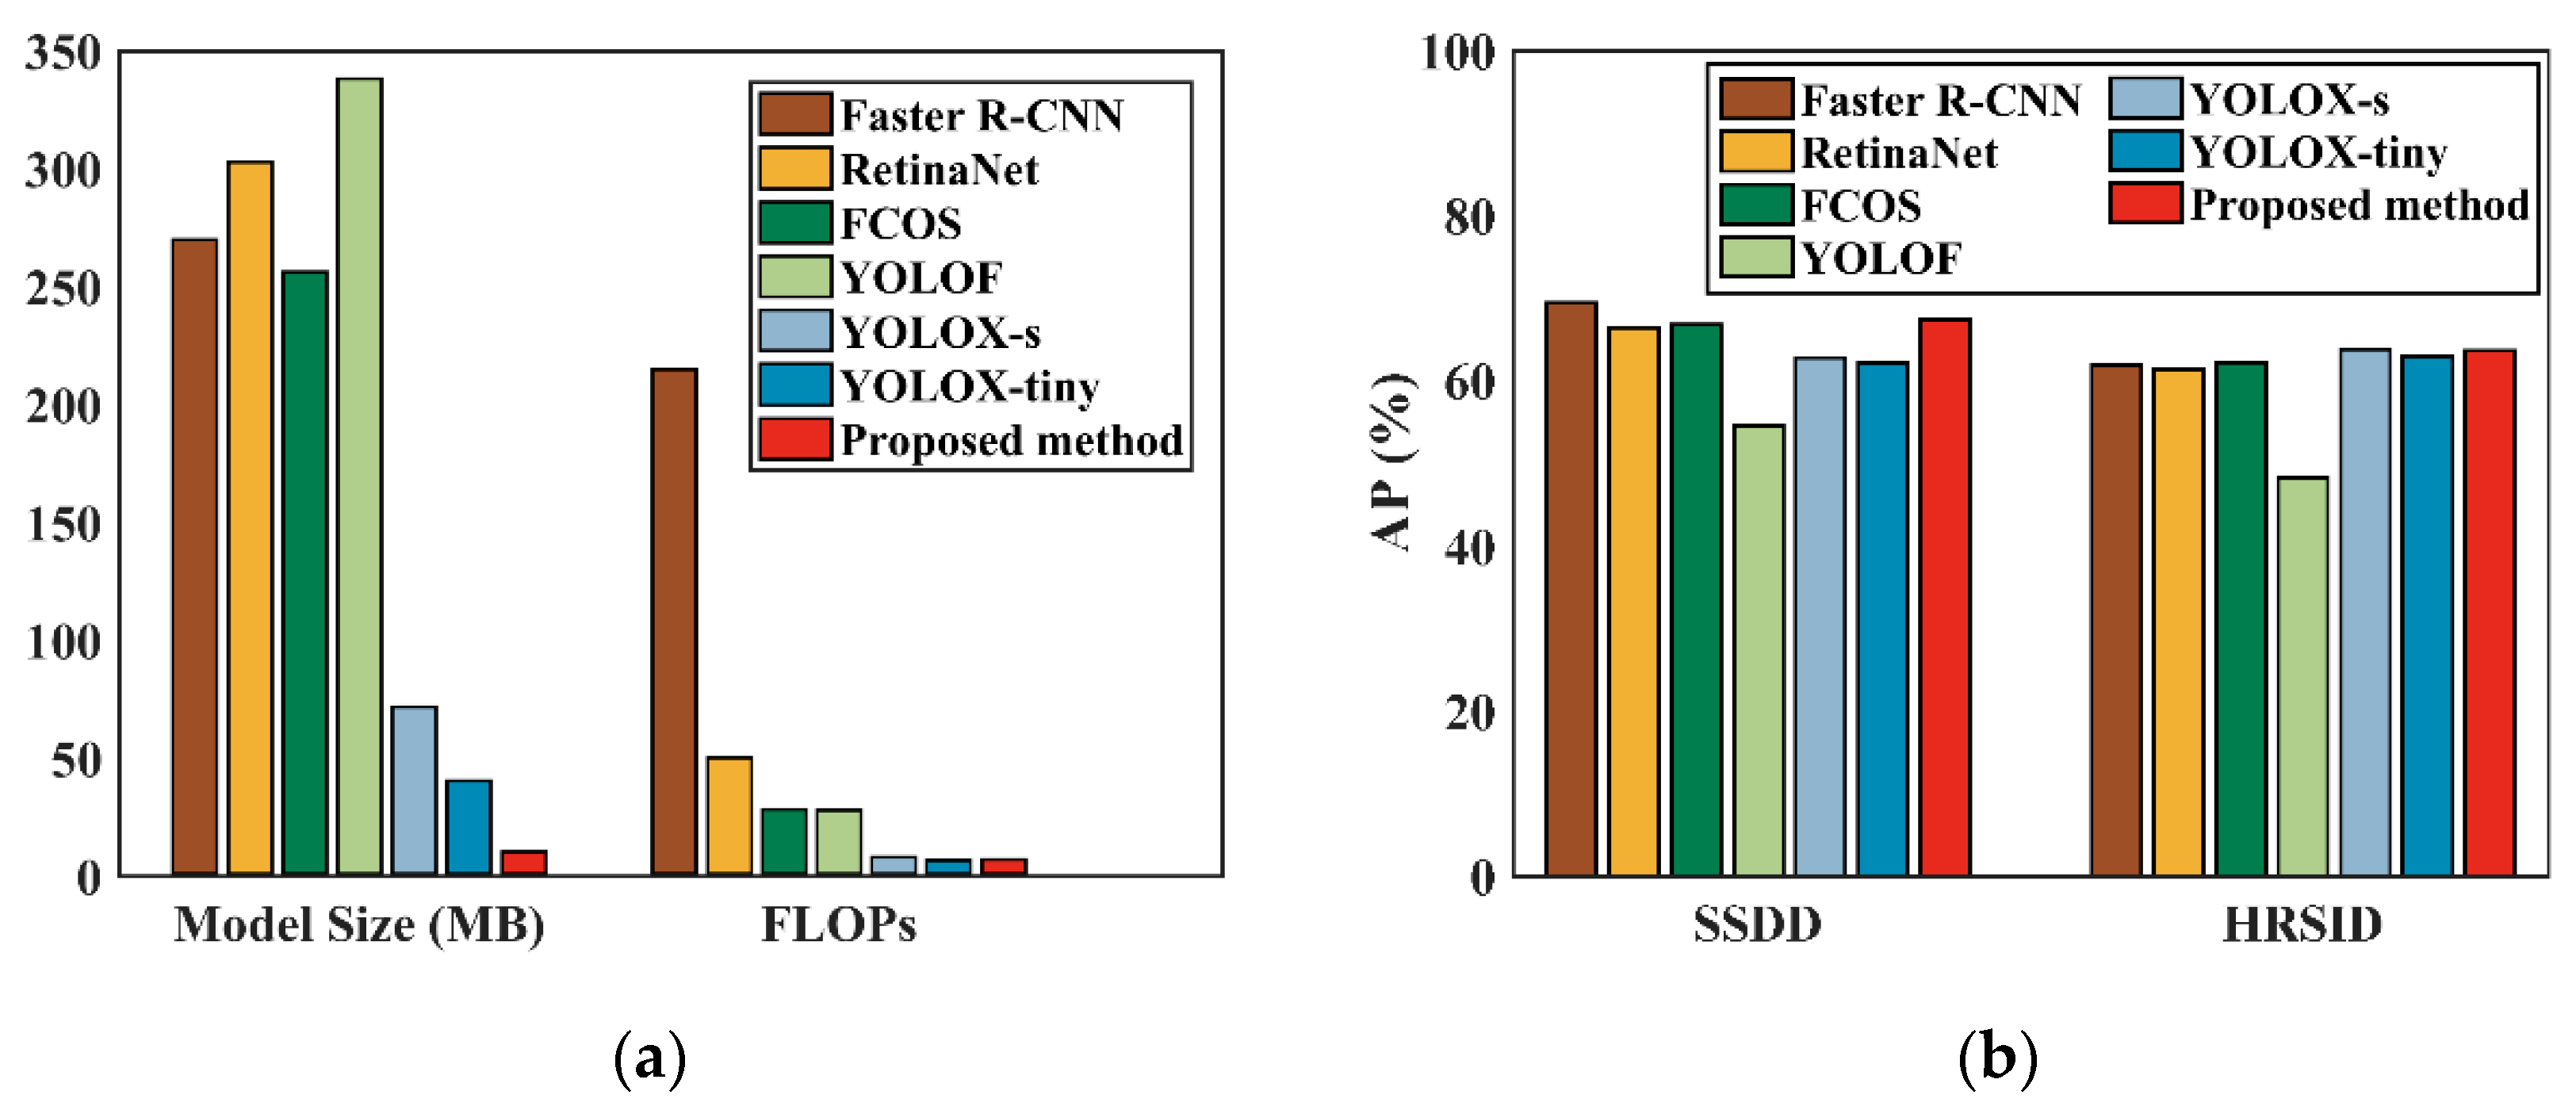
To validate the effectiveness and robustness of the proposed method, extensive experiments on the SAR Ship Detection Dataset (SSDD) [36] and High-Resolution SAR Images Dataset (HRSID) [43] were conducted. The results show that the proposed method achieves comparative performance with baseline while requiring fewer model parameters and less computational cost, proving its high efficiency and reliability.
The rest of the paper is arranged as follows. In Section 2, the overall structure and detailed improvements of the proposed method are described. Section 3 provides the experiment results as well as corresponding analysis. Then, the experiment results are discussed and problems are analyzed in Section 4. Lastly, the conclusion is drawn in Section 5.

2. Materials and Methods

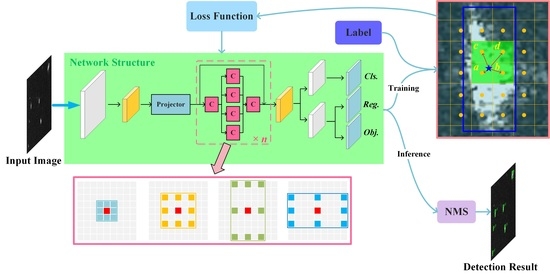
The proposed method can be mainly divided into four parts: a baseline network using a backbone for feature extraction, a neck constructed by a projector and stacking RADC modules, a decoupled head for final detection, and a label assignment strategy for model training. First of all, the overall framework, as well as the backbone of the proposed network, is described. Next, the structure of the proposed RADC block is illustrated. After that, the structure of the decoupled detection head is described. Then, drawbacks of traditional label assignment strategies on a single detection head are analyzed and center-based uniform matching is presented in detail. Finally, details of the output mapping and loss function calculation are given.

2.1. Overall Scheme of the Proposed Network

In recently developed one-stage detection networks, the most commonly used structure is the combination of backbone, neck, and head [16]. Backbones, such as VGG [44], ResNet [45] and DenseNet [46], are the key part for feature extracting. Following YOLOX, the Cross-Stage Partial Darknet (CSPDarknet) [47] was adopted to construct our backbone. During the forward propagation process, the image is gradually subsampled through convolution layers with stride 2, and higher feature maps are obtained. The feature map after l times of downsampling is denoted as C l W / s l × H / s l × c in in this paper, where W × H is the size of the input image, cin is the channel number, and s l = 2 l is the corresponding downsampling rate of Cl. In order to validate the effectiveness of the one-level feature map for ship detection, we only adopted one feature map from the backbone, as shown in 
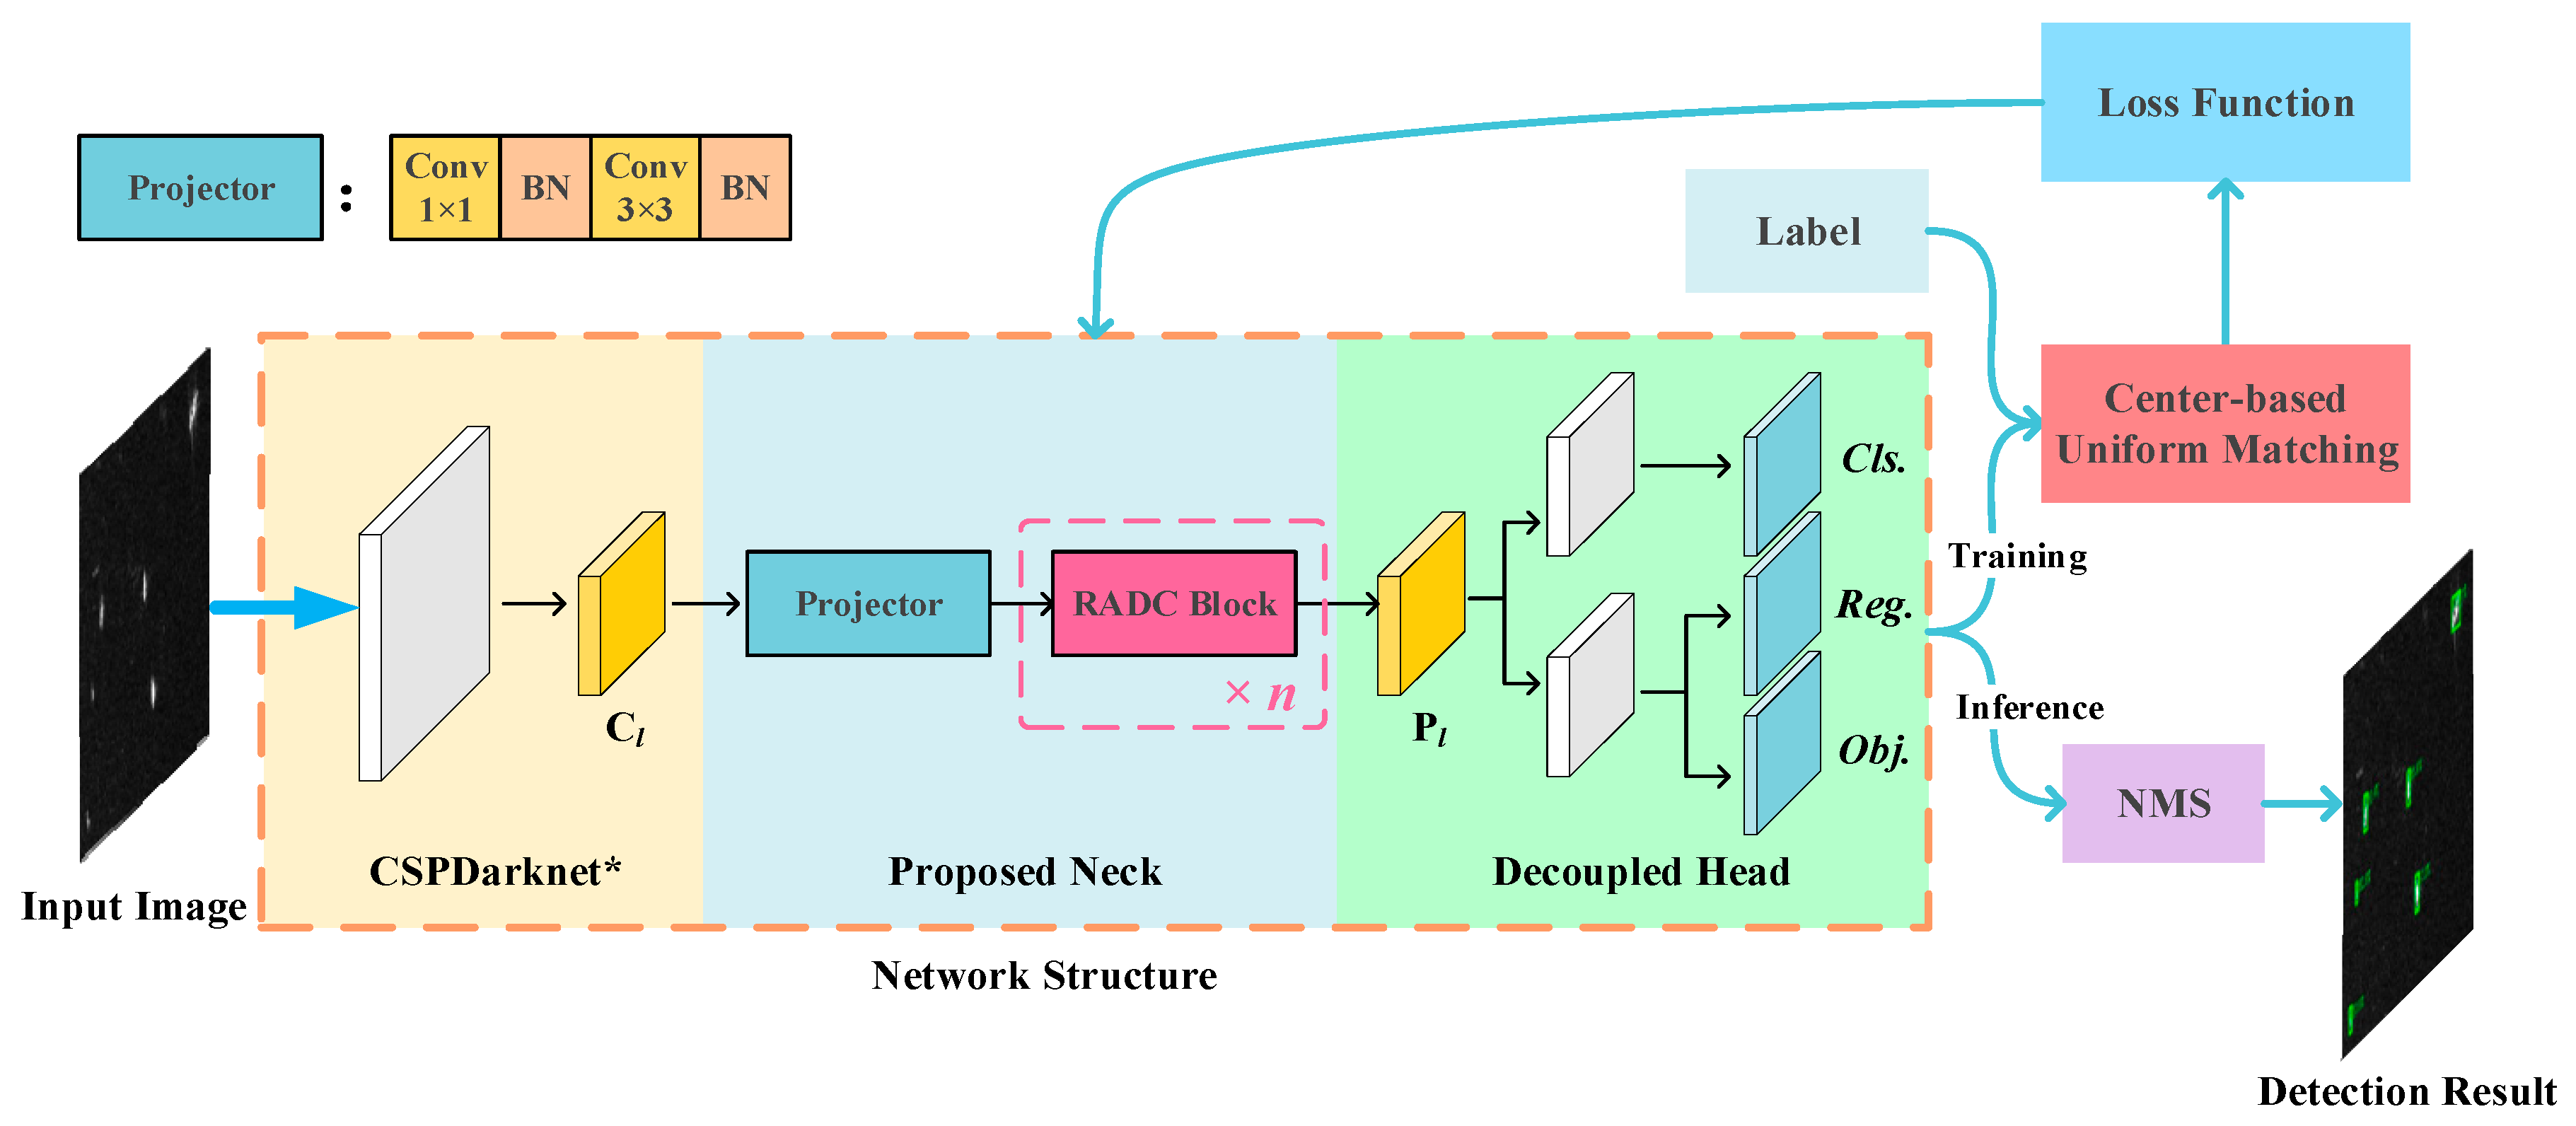
Figure 3. Different from multilevel feature maps that require sequential resampling and fusion, the only feature map is enhanced by a streamlined neck. First, the feature map is adjusted by a projector which consists of a 1 × 1 convolution layer and a 3 × 3 convolution layer, where both convolutions are followed by a batch normalization (BN) operation. Additionally, the channel number of the feature map is changed to cout. Then, the feature map is enhanced by n consecutive RADC blocks. With multiple asymmetric dilation convolution branches, an RADC block can expand the receptive field and can efficiently discover strip-shaped ship targets. The processed feature Pl is transferred into detection output by a decoupled head. Finally, to generate the final detection results, non-maximum suppression (NMS) is used to remove repetitive predictions.
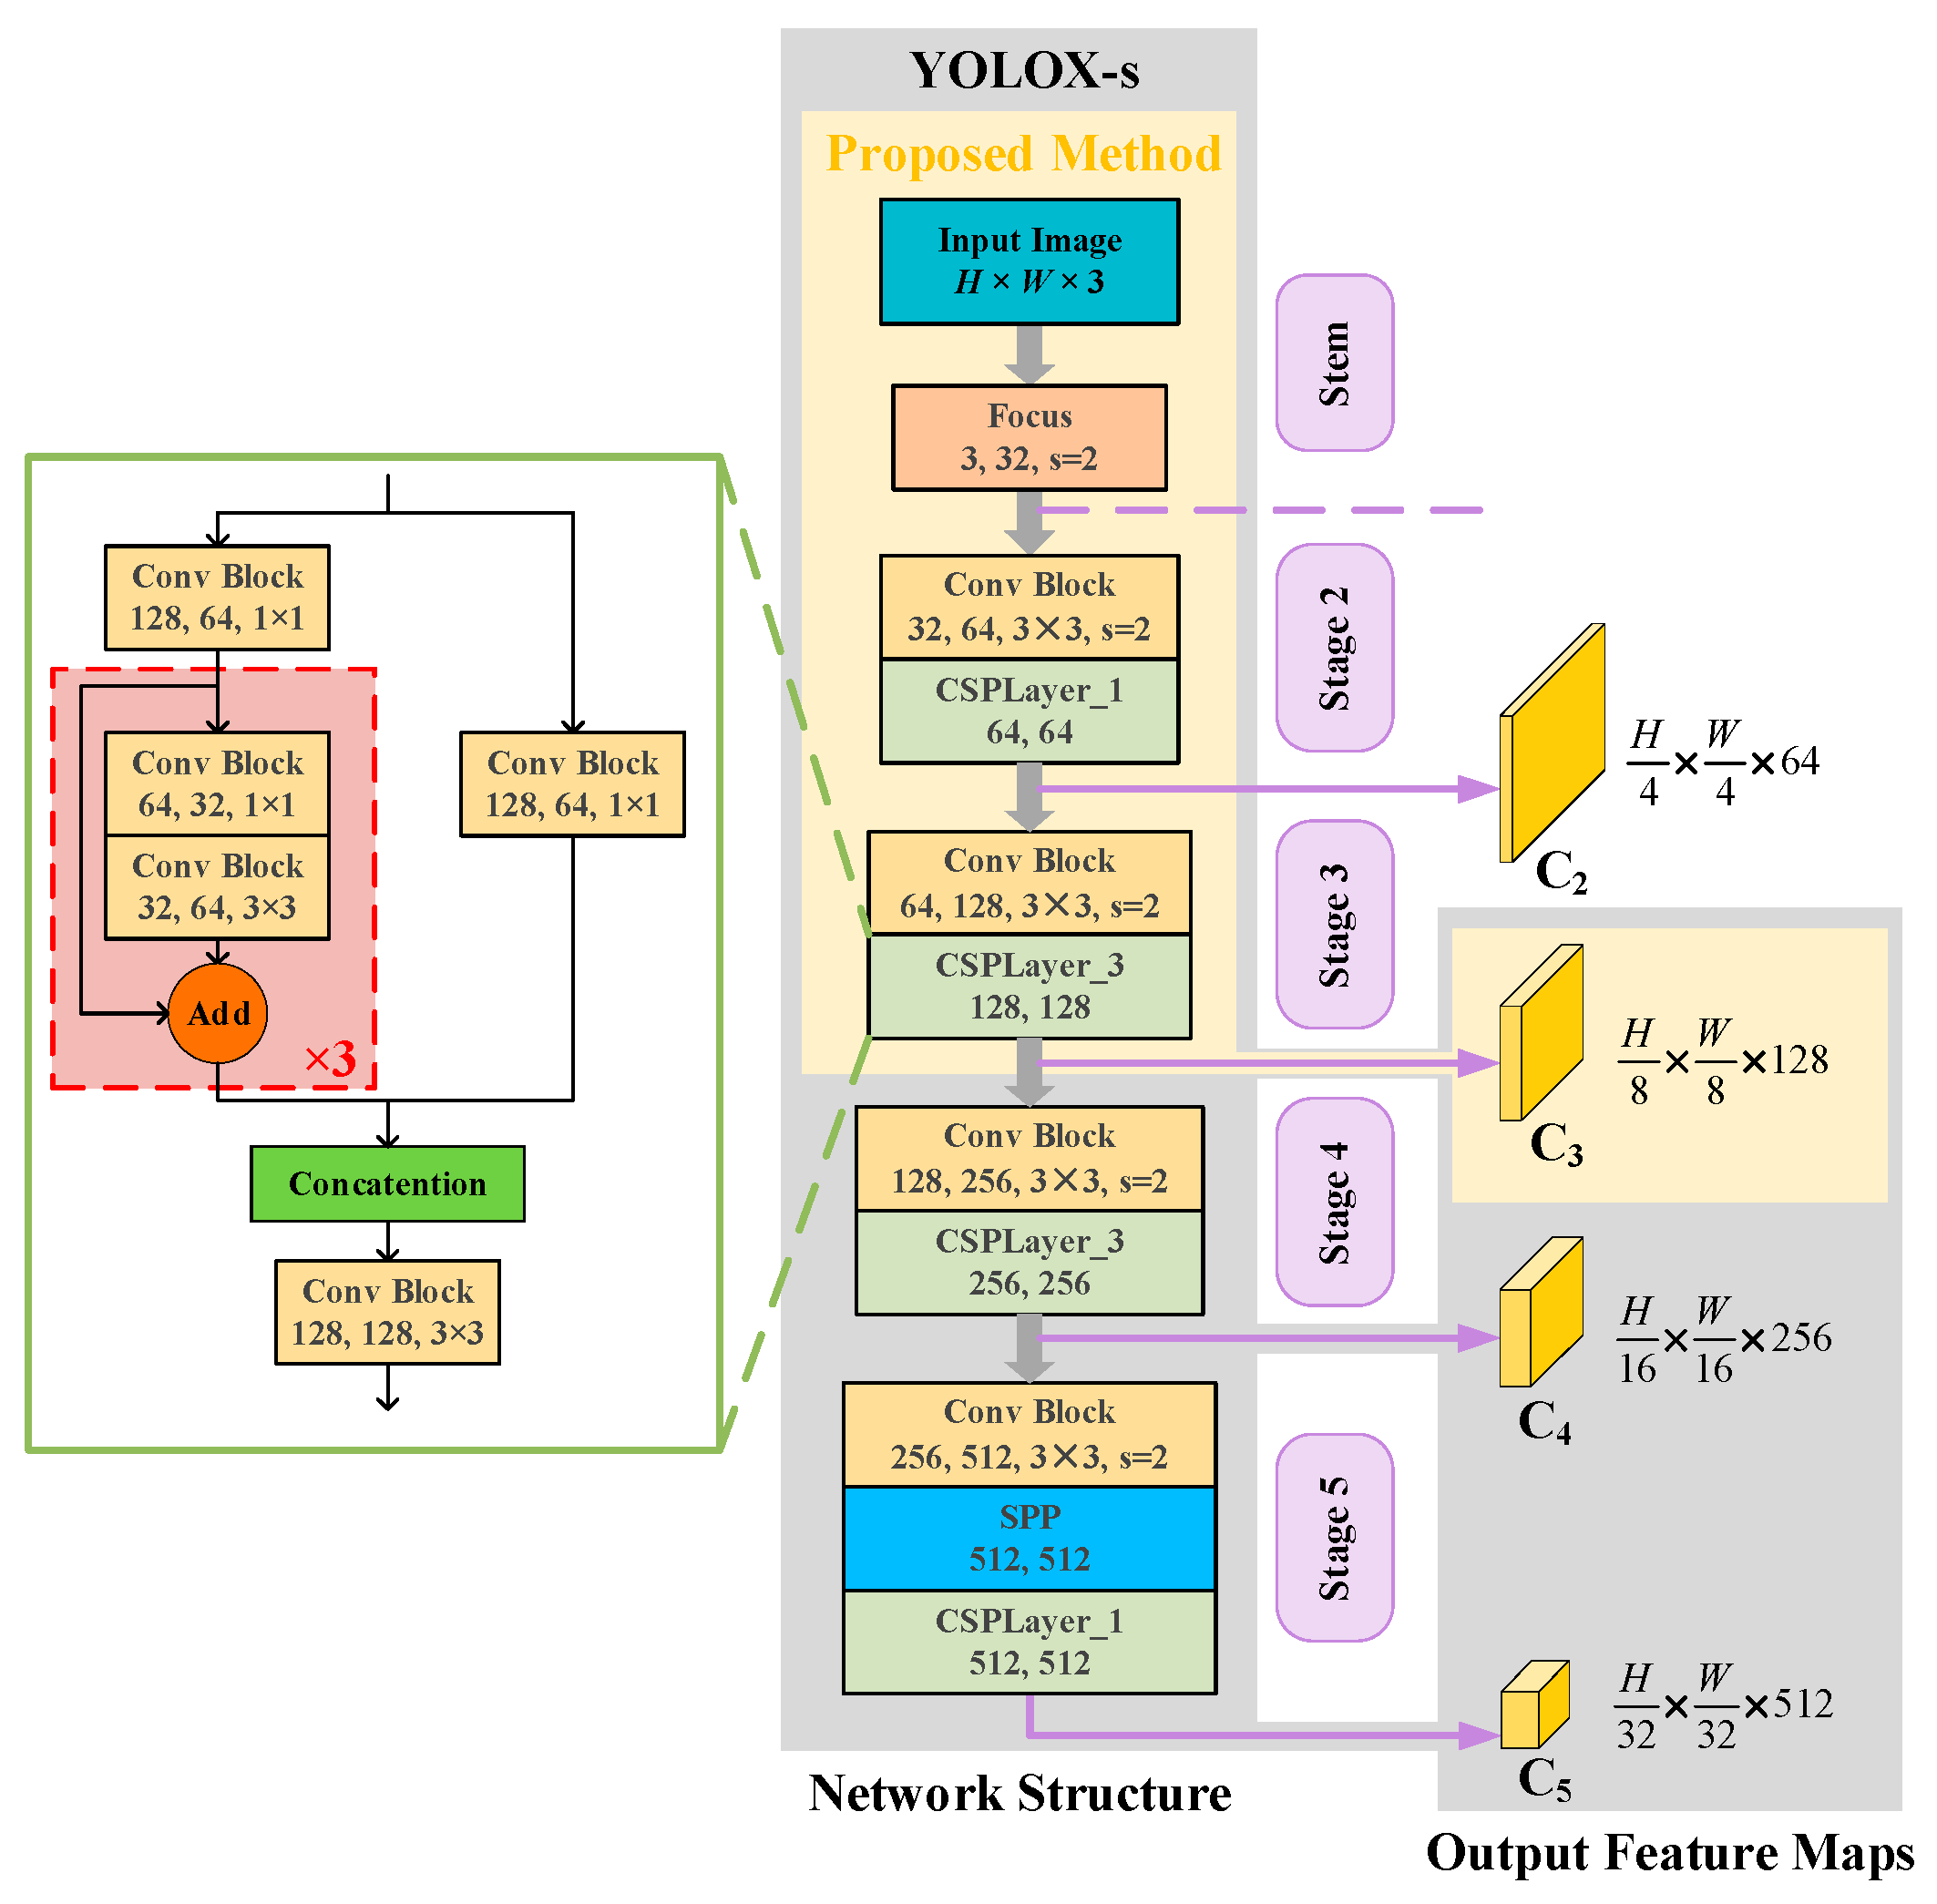
The structure of CSPDarknet, as well as the backbone of the proposed method, is shown in Figure 4. As a note, Conv Block denotes a convolutional layer followed by a BN layer and a SiLU activation function. When the image is input into CSPDarknet, several feature maps with different downsampling rates are generated at specific stages, which are the input of the neck part. For mainstream detection networks, C3, C4, and C5 are utilized to realize feature fusion across different scales, which is also the case of YOLOX-s. To verify the effectiveness of one-level features, an appropriate feature level associated with target characteristics is crucial. On account of the small size of ship targets and the influence of coherent noise, shallow feature maps with higher resolution tend to retain more efficient characteristics of small ship targets than deep feature maps. In view of this, some researchers additionally added a shallower level C2 into their feature pyramid [48,49] to build an effective ship detector, which demonstrates the importance of shallow feature maps in SAR ship detection. Therefore, we set l = 3 and chose C3 as the only output of the backbone.

2.2. Residual Asymmetric Dilated Convolution Block

As the network goes deeper, high-level feature maps with large receptive fields contain stronger semantic information and are suitable for detecting large ships, whereas semantically weak but spatially strong low-level feature maps with small receptive fields are favorable to the detection of small ship targets. Thus, in addition to the fusion and enhancement of features, the other important role of multiscale detection is that the network has multiple receptive fields to detect targets of all scales. However, when it comes to the single-feature map situation, the receptive field of the output map is a constant, greatly limiting the network’s generalization ability. On one hand, if the scale of a ship target is much larger than this receptive field, it would be difficult for the network to fully extract target features and, thus, becomes problematic to detect. On the other hand, a ship that is significantly smaller than the receptive field can be easily ignored by the network, making it hard to be located precisely. To detect ships with different scales within a single-feature map, we were inspired by SC-EADNet [50] and proposed the RADC block to expand the receptive field of the one-level feature and improve the network’s ability to detect ship targets of various scales.
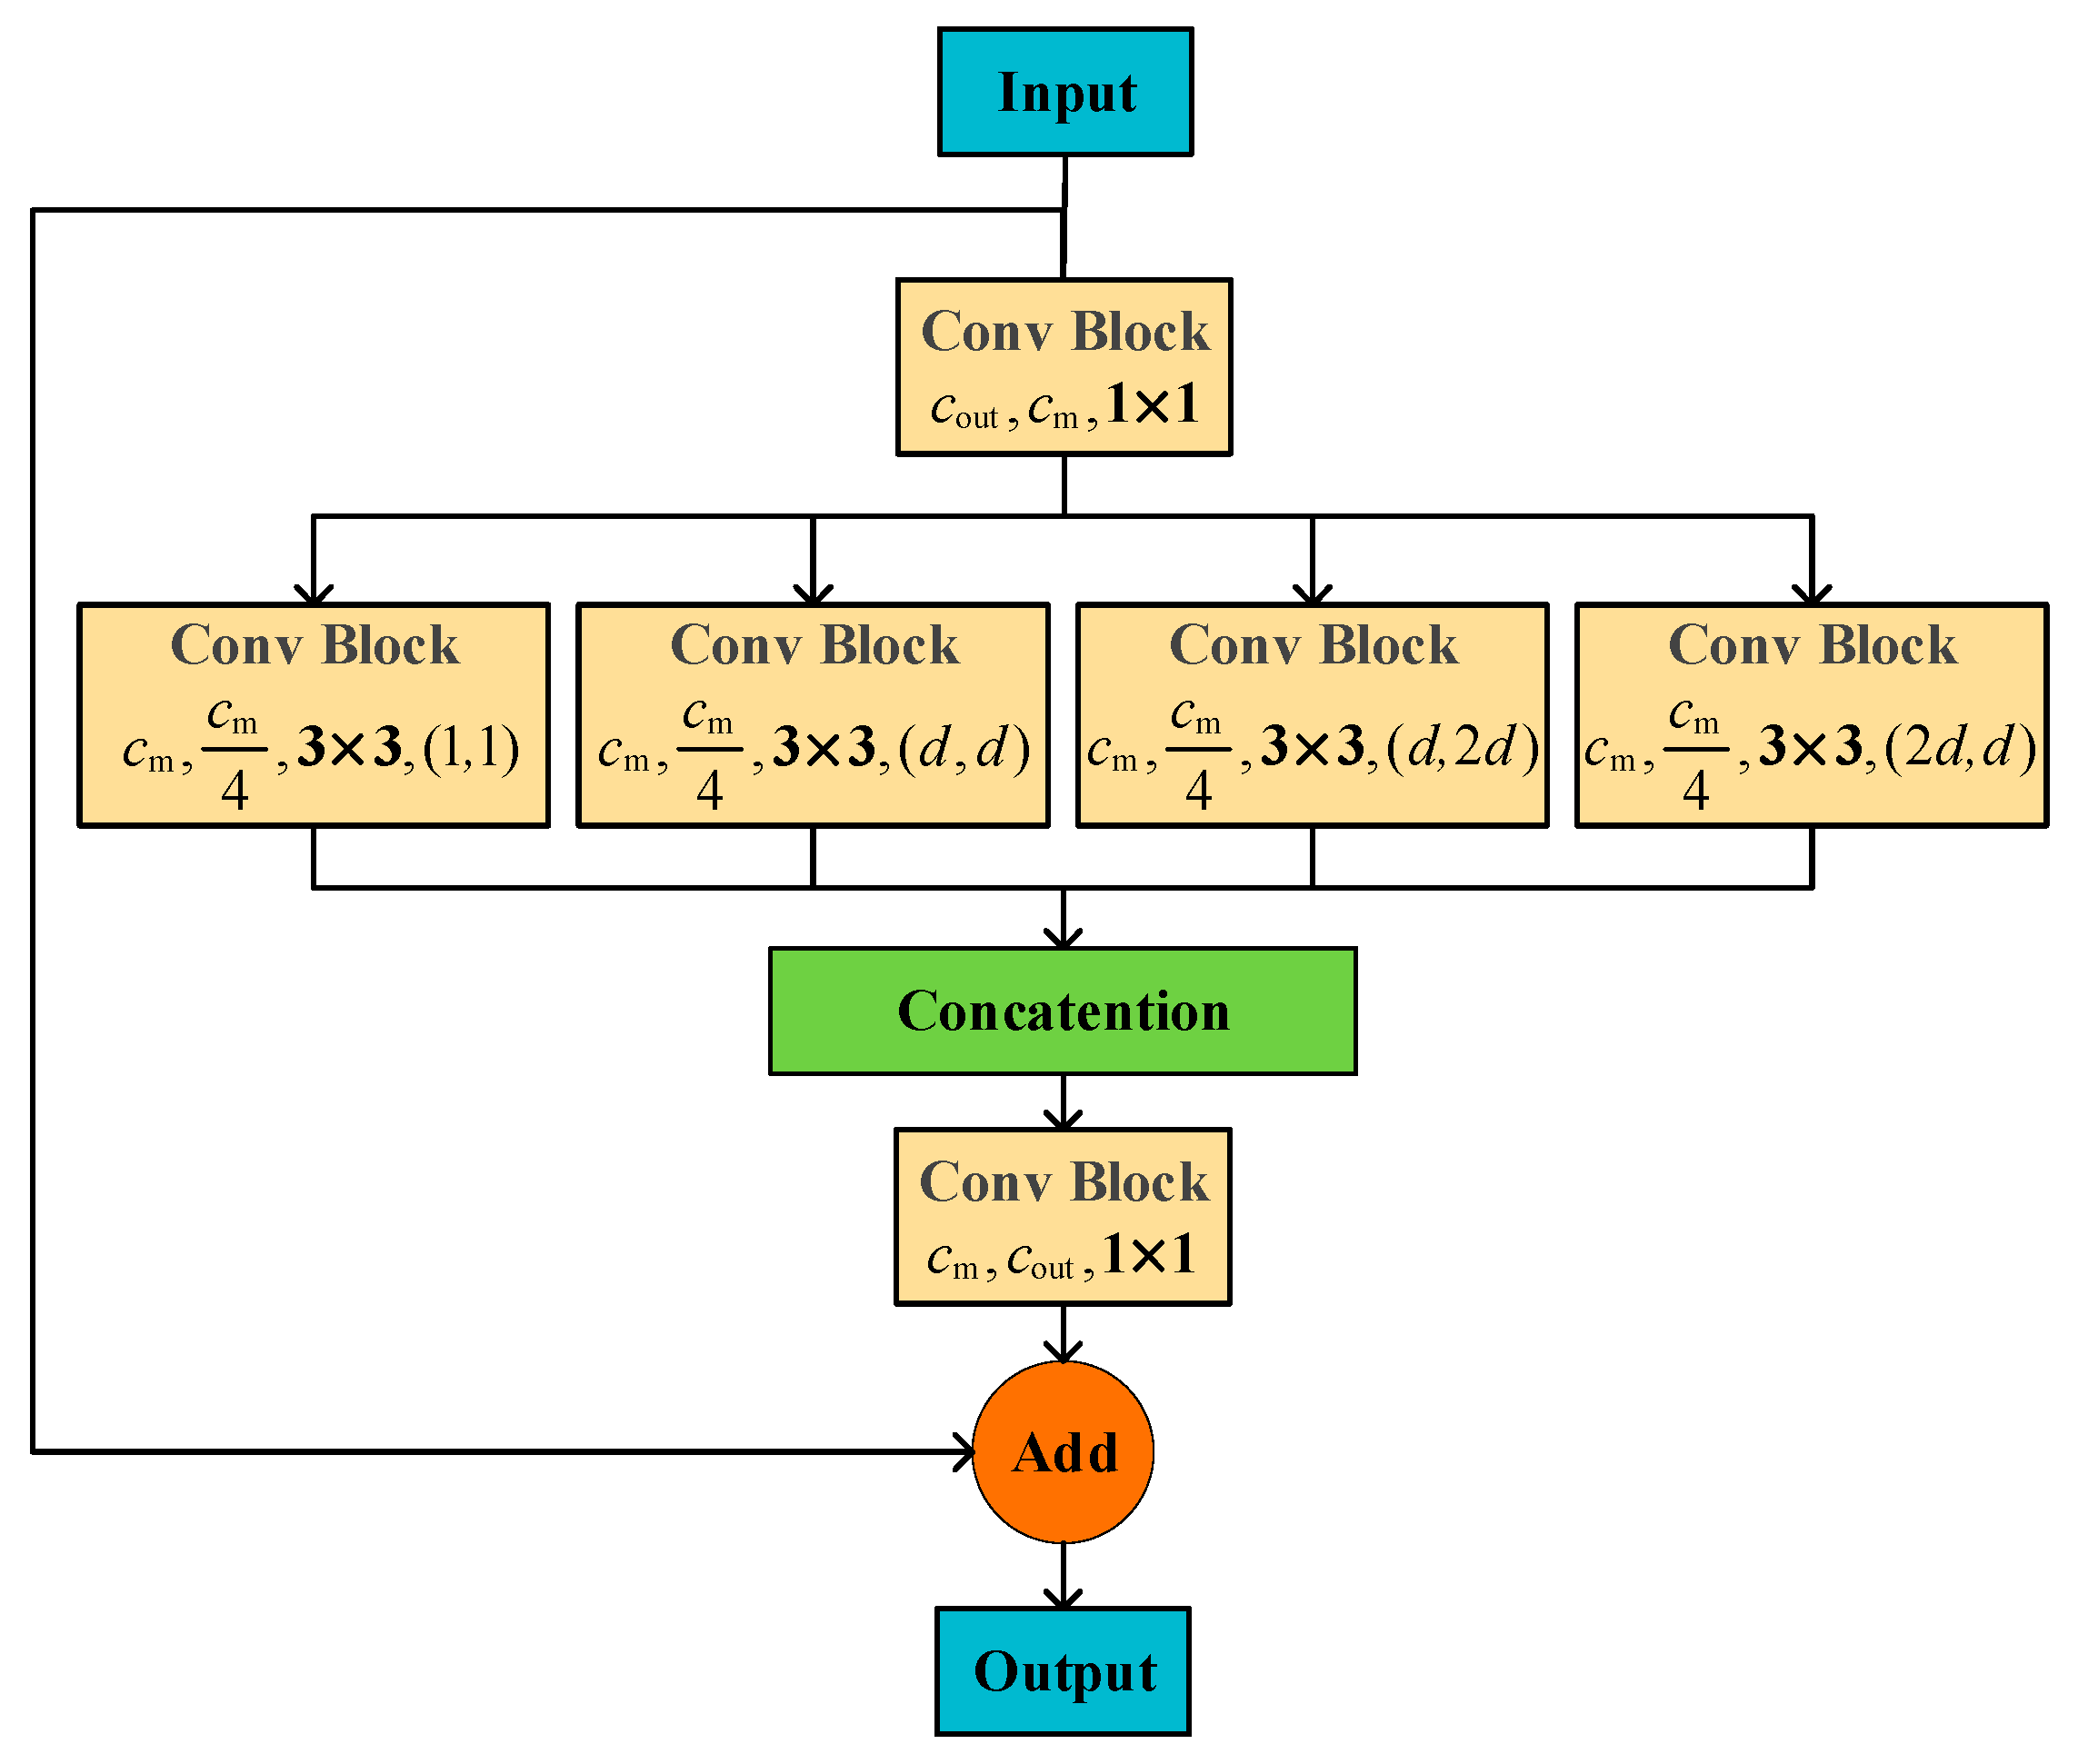
As shown in Figure 5, four branches with different asymmetric dilation rates were used to enrich the receptive field of the one-level feature map. The input and output of the RADC block are of the same size, including both feature map scale and channel number. When the feature map with cout channels is fed into the RADC block, the processing schedule can be divided into four steps. First, to reduce computational complexity, the channel number of the feature map is reduced to cm by a convolution block with kernel size 1 × 1. Second, the compressed feature map is parallelly processed by four dilated convolution blocks with kernel size 3 × 3. Since dilated convolution can effectively enlarge receptive fields, the covered scale range of the feature map is also expanded. The output channel number of each branch is a quarter of cm as there are four branches. Then, the four outputs are concatenated and followed by a 1 × 1 convolution to restore the channel number to cout. Finally, we add the input feature to the processed feature by adding a residual connection, resulting in an output feature map with multiple receptive fields.
The dilation rates of these four branches are set as (1, 1), (d, d), (2 × d, d), and (d, 2 × d), respectively. The parameter d is a predefined base dilation rate that indicates the receptive field level of the RADC block, which is set as 2 in our method. Generally speaking, a larger d can greatly increase the receptive field. However, the 3 × 3 convolution may damage feature extraction if the dilation rate is too large, as those pixels far from the center are less likely to locate at the same target. To enhance the receptive field effectively, we stack identical RADC blocks to expand the receptive field gradually.
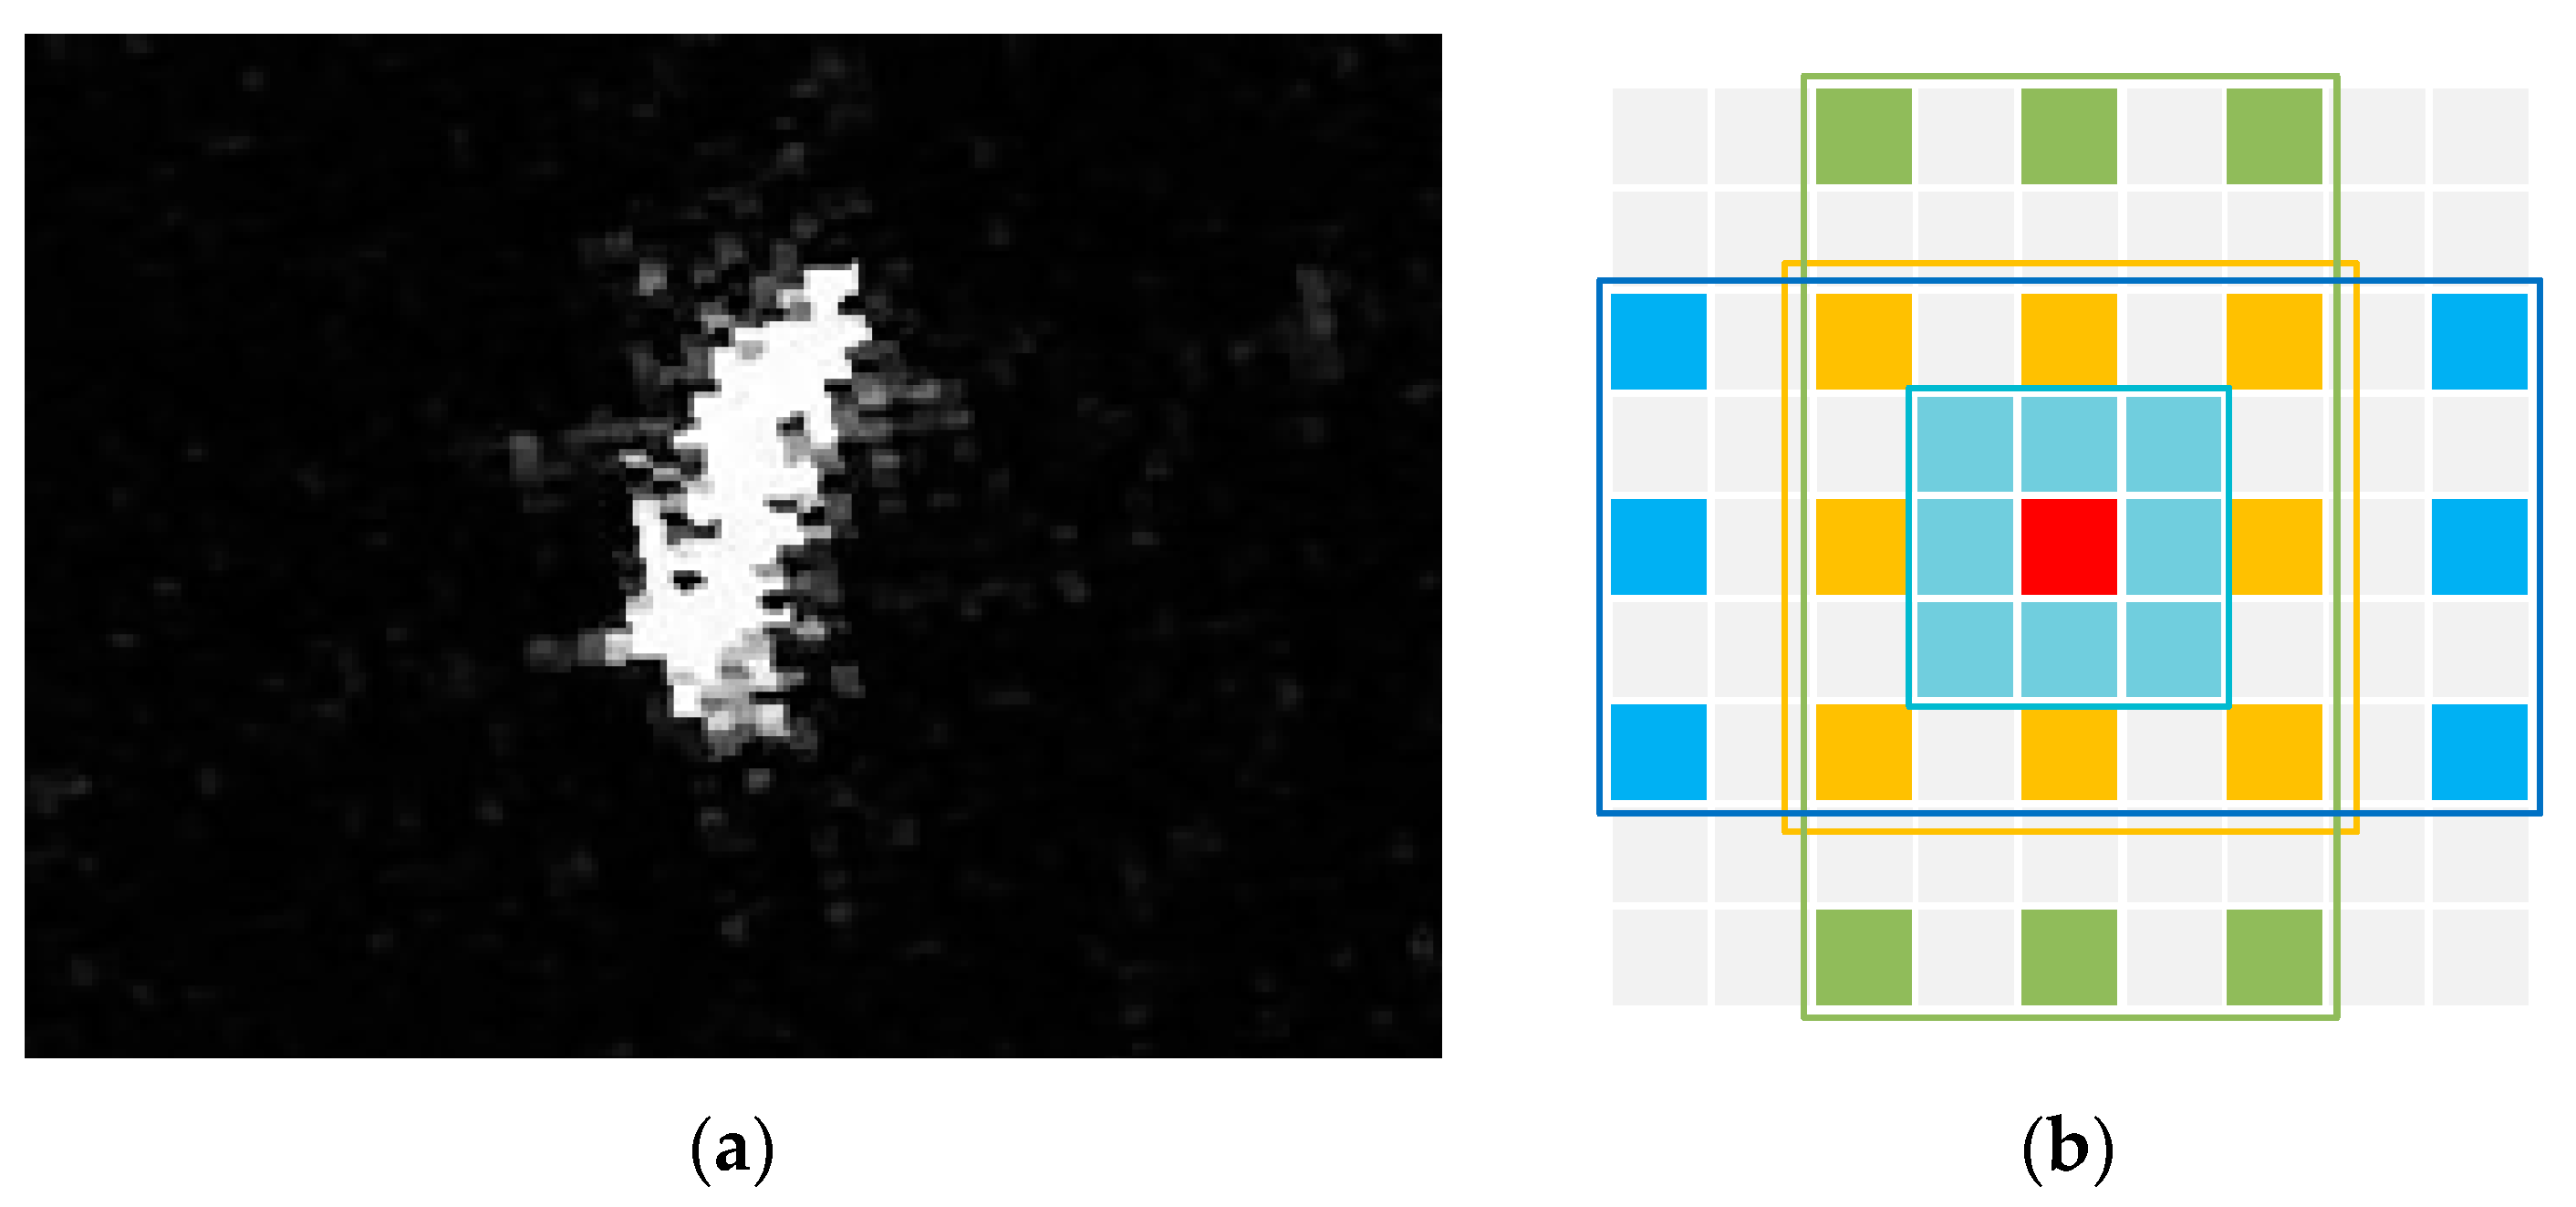
There are several benefits of applying the RADC block as a basic component in the neck part. (1) Dilated convolutions are used to enlarge the receptive field of the one-level feature map, which contributes to the detection of large-scale ship targets. Meanwhile, the residual connection can effectively preserve original information, generating a feature map with multiple receptive fields covering all object scales. (2) Considering the slender shape and arbitrary orientation of ship targets in SAR images, as shown in Figure 6a, standard square dilation is not suitable for the convolution kernel to capture ship target features. Thus, there are two branches whose dilation rates are asymmetric in the RADC block, i.e., one horizontally longer and the other vertically longer. The receptive field of the RADC block is demonstrated in Figure 6b, where it can be seen that ships with various shapes can be covered properly, contributing to the feature extraction of large targets. (3) Due to four parallel dilated convolution branches, the low-level feature from the backbone is refined and semantically reinforced with more context information while only a little computational burden is increased. By stacking RADC blocks, the receptive field and semantic level of Cl can be gradually enhanced.

2.3. Decoupled Head

To make the proposed network simple and streamlined, we dealt with the feature map within the single scale and used only one detection head, which produces one output map O W / s l × H / s l × ( 5 + c ) , where 
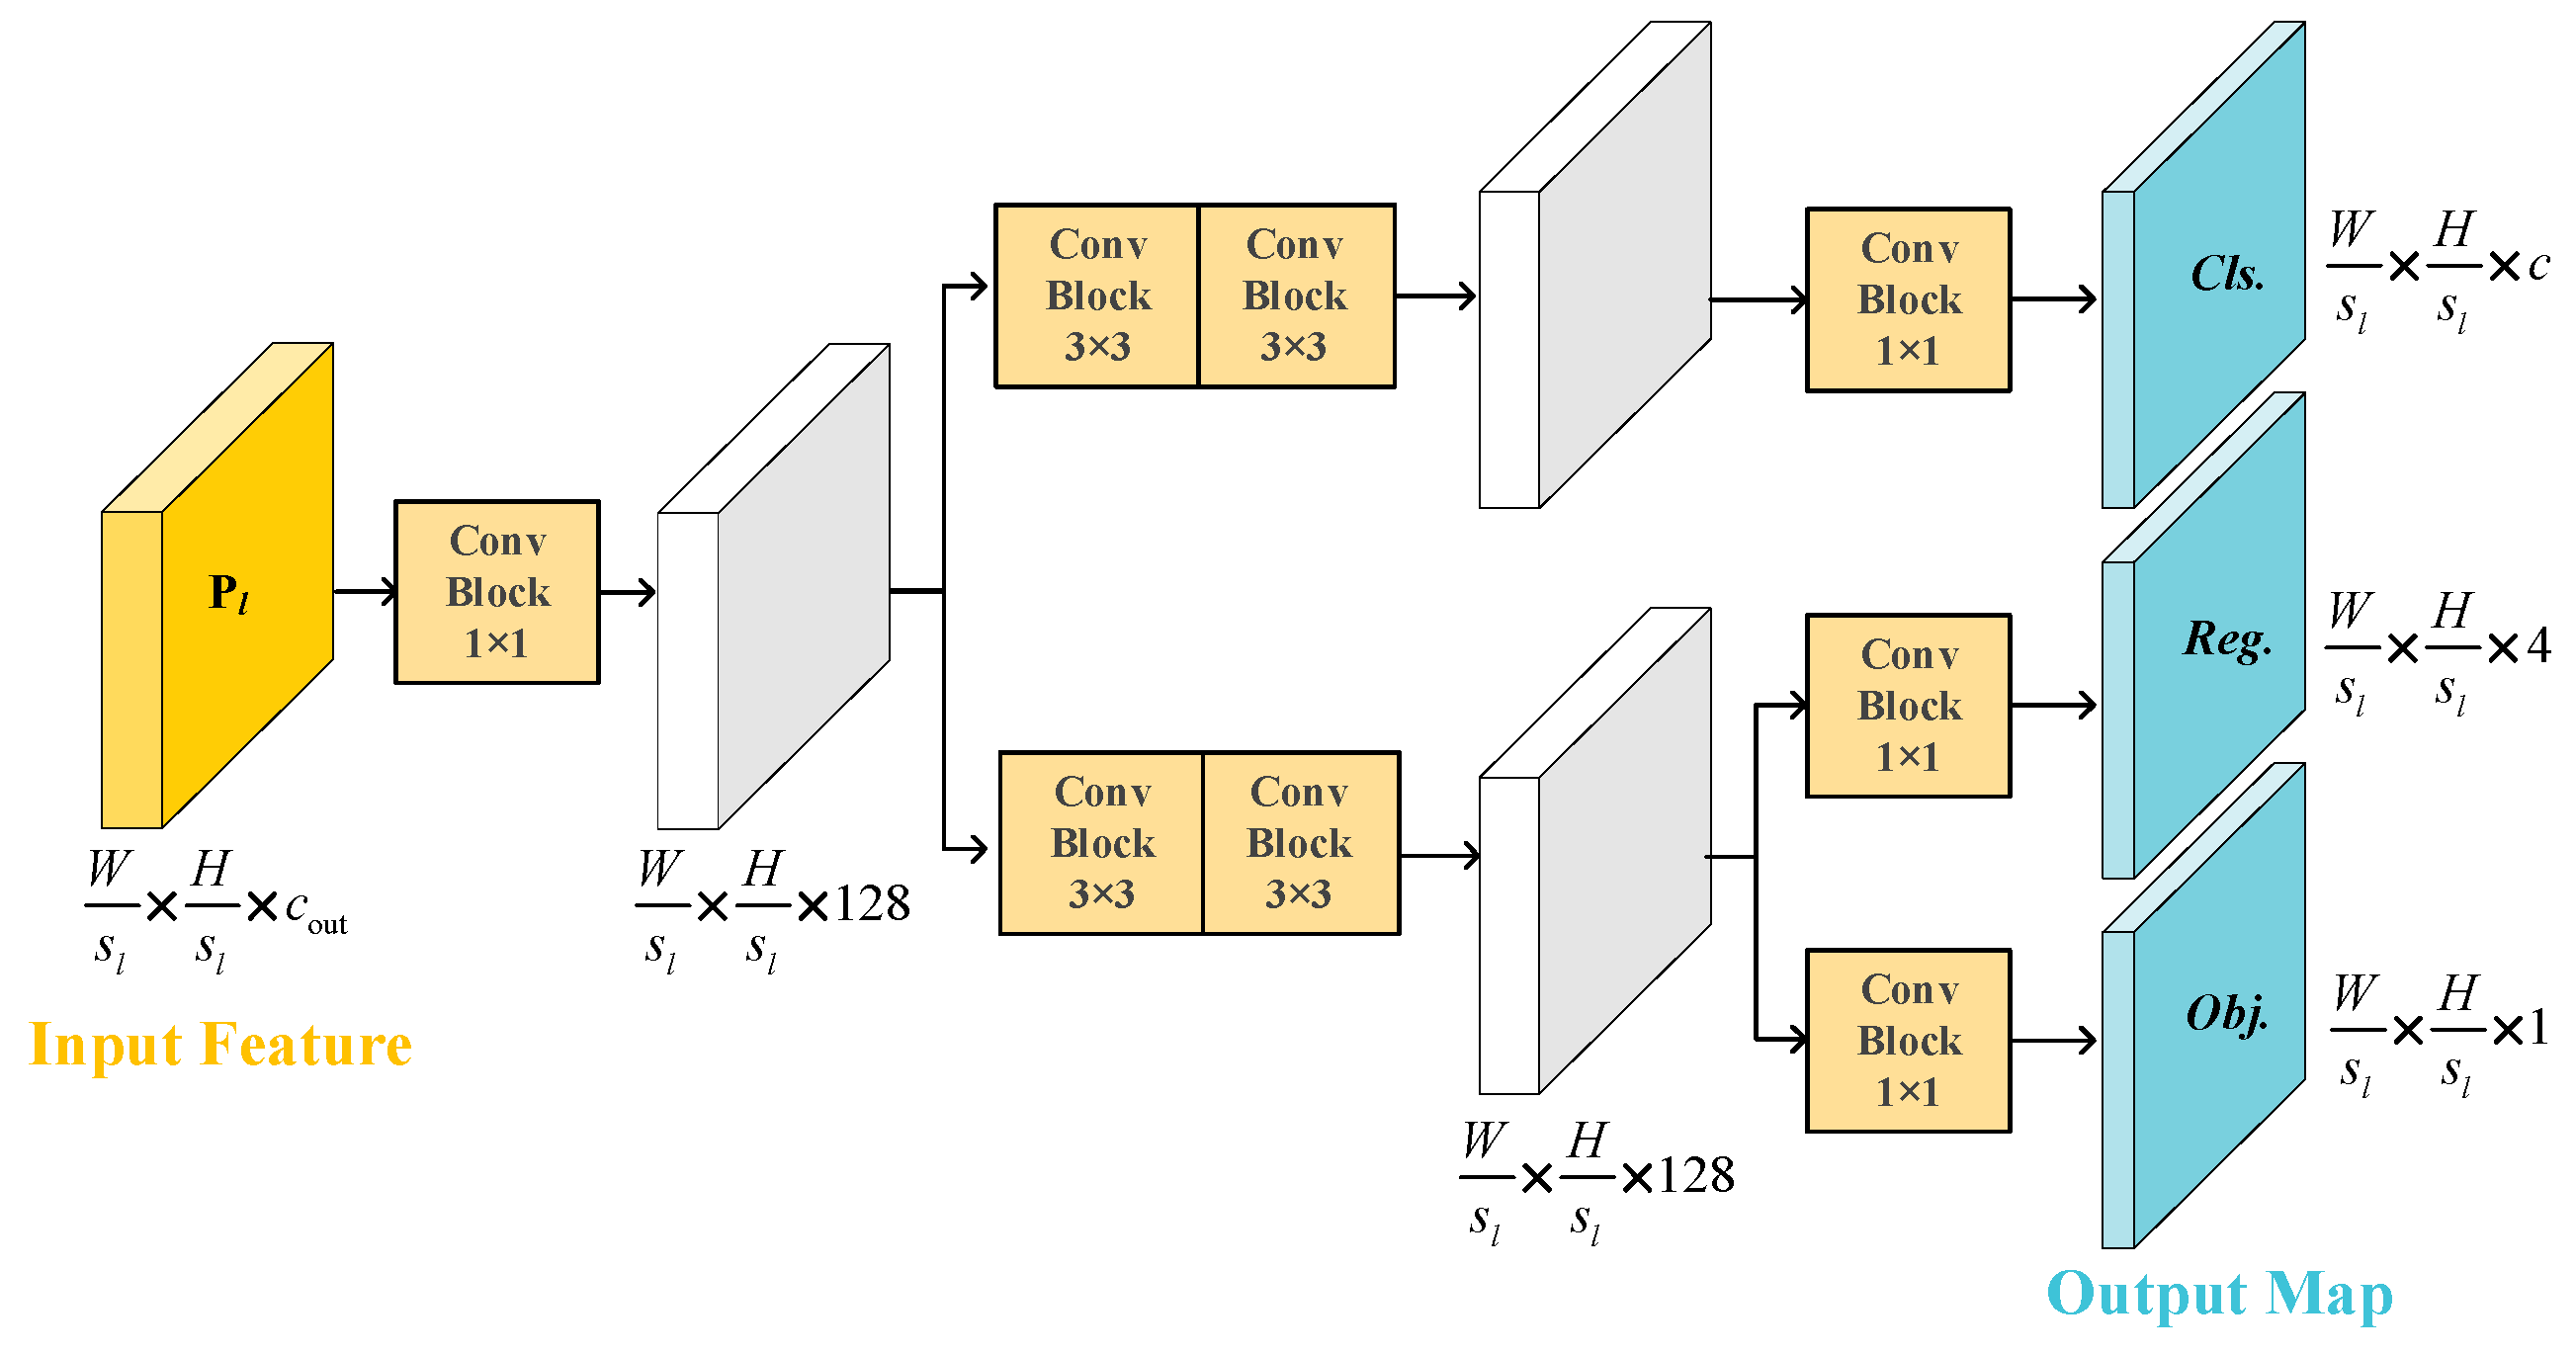
c is the number of target categories. The structure of the decoupled head is shown in Figure 7. The output of the RADC blocks, Pl, is sent into the detection head for final detection. The channel number of Pl is first changed to 128 through a 1 × 1 convolution block. After that, the feature map is divided into two branches with two convolution blocks, one for classification and the other for regression. The regression branch is further separated to predict the coordinate and quality of the predicted box, i.e., the coordinate branch and IoU (intersection over union) branch. At the end of each branch, a 1 × 1 convolution is performed to compress the channel dimension and form the output map.

2.4. Center-Based Uniform Matching

For CNN-based object detectors, dense prior settings (e.g., preset anchor boxes and grid points) are essential to cover as many potential targets as possible. Most of these prior settings are redundant and invalid for the final detection result. During the training process, the label assignment strategy determines which predictions are positive samples and which predictions are negative samples and is of great importance for the optimization of the network. To ensure the effectiveness of loss function, a good assignment strategy should consider the measurement of the similarity between label and prediction and have a universal rule to separate positive and negative samples. The IoU threshold was widely adopted as the assignment criterion and, since the arrival of anchor-free detectors, a lot of strategies that are based on the location of labels and predictions were presented [20,21]. To make the label assigning procedure more adaptive, scholars are also trying to design dynamic strategies to improve detection performance [51,52].
As for YOLOX, SimOTA can assign a different number of positive predictions with each ground truth based on their matching similarity, where higher similarity corresponds to more assignments. Such a dynamic mechanism is sensitive to the suitability of predictions for labels and can adaptively adjust positive samples. For multiscale situations in which targets at different scales are assigned with predictions at different scales, SimOTA is good at dividing positives and negatives. However, it cannot balance targets at different scales when all predictions are on the same scale. Larger targets tend to have a higher IoU with predictions and obtain more assignments, whereas small targets are easily neglected. Moreover, in the end stage of network training, too many positive samples are assigned, e.g., 6–8, for each target. The network might be misled by low-quality predictions, leading to a risk of a high false alarm rate.
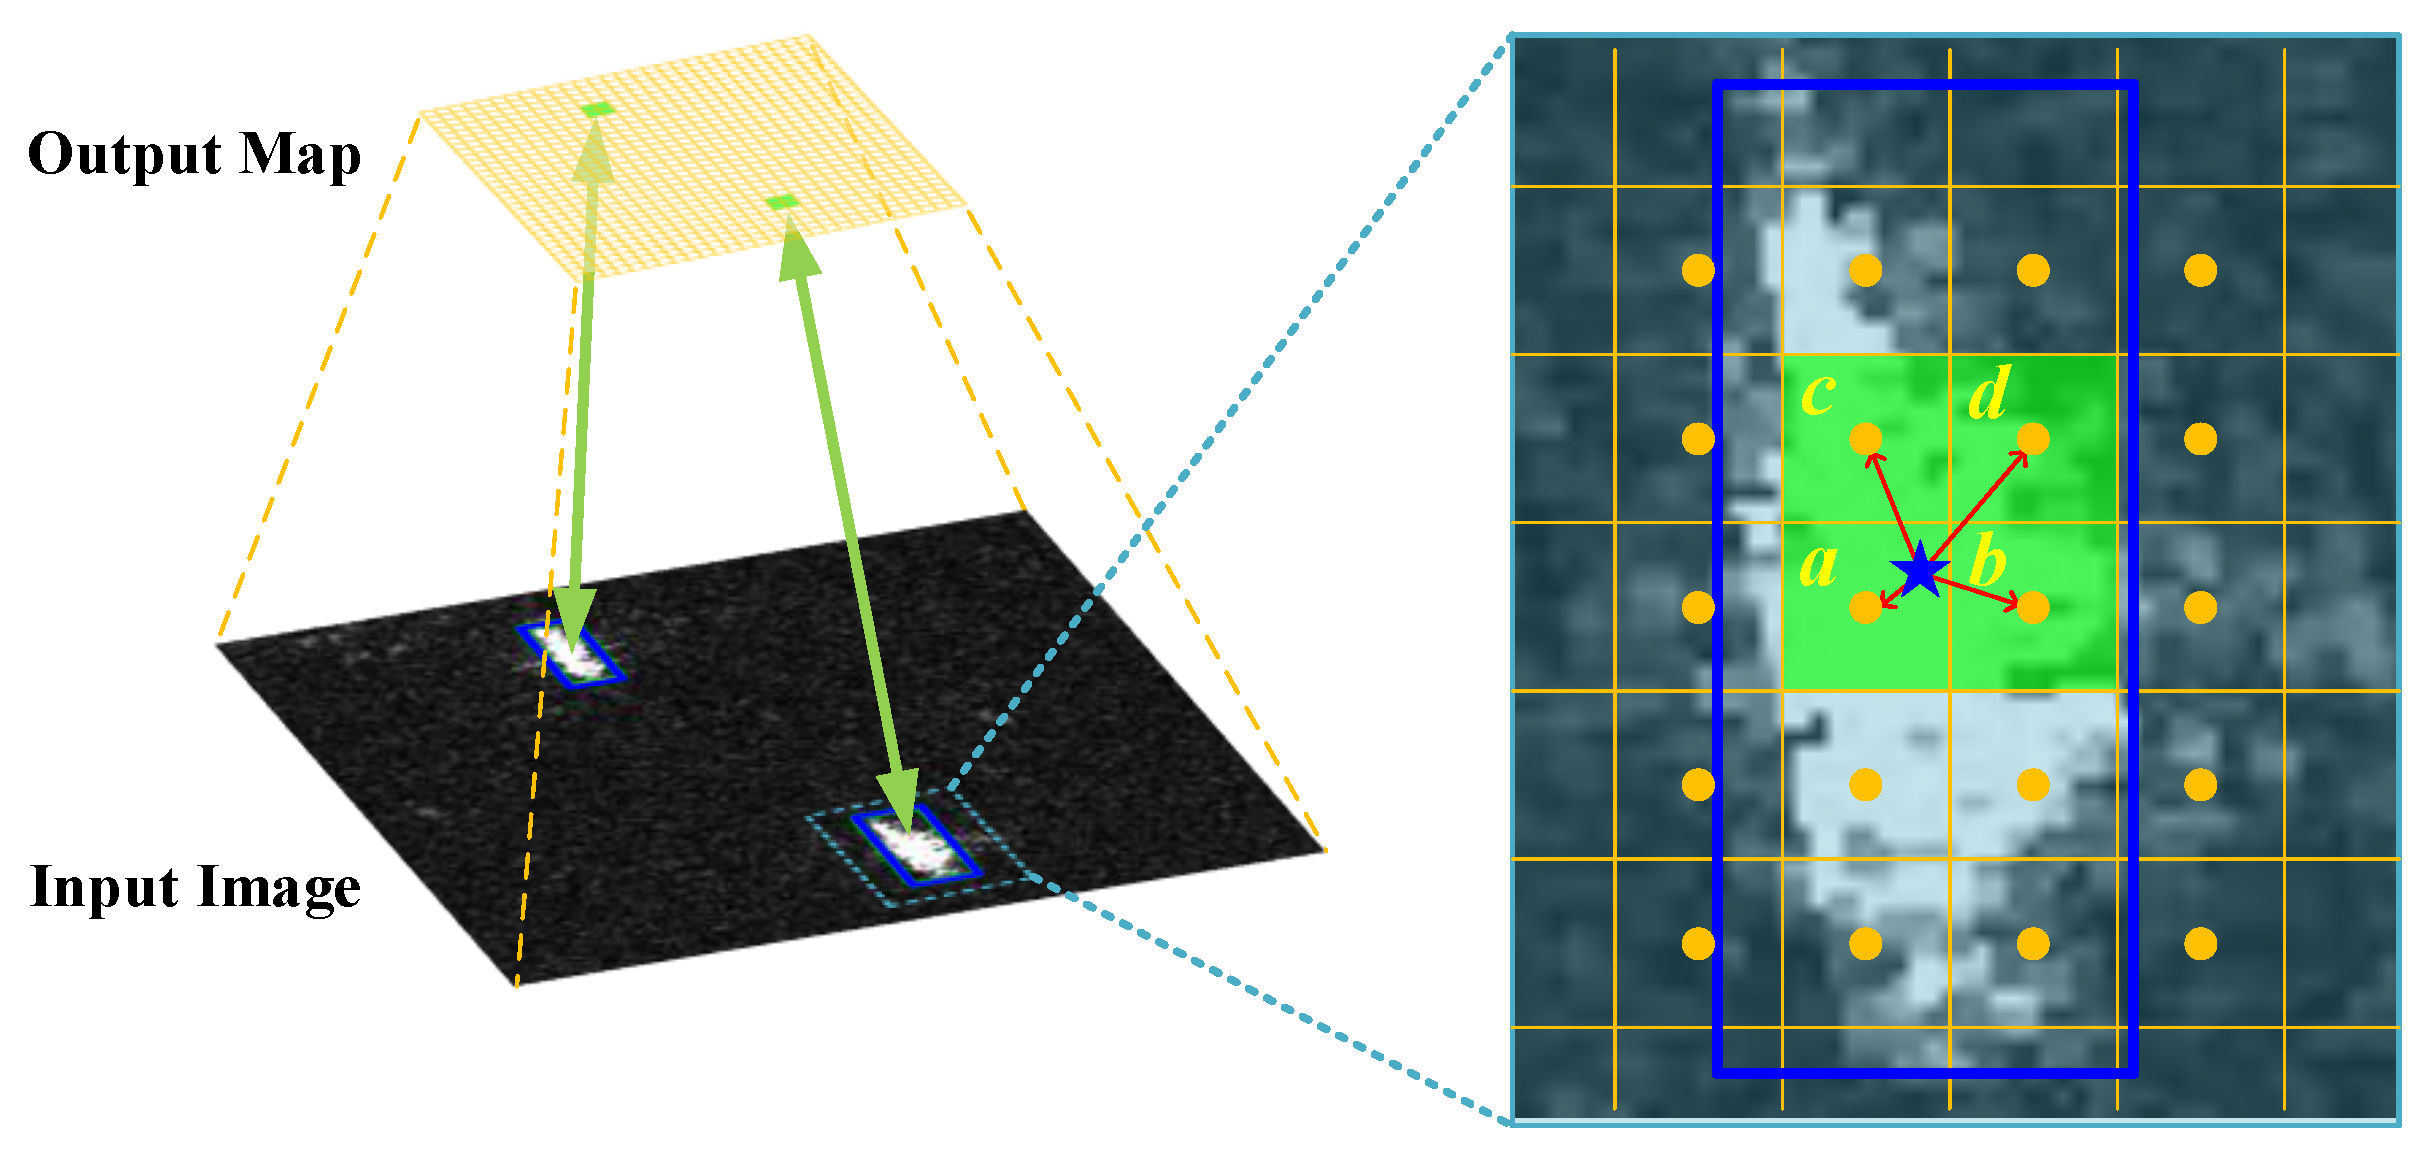
To deal with the problem of scale imbalance and low-quality matching, a plain matching strategy, namely, center-based uniform matching, is proposed in this paper. As the only output map is subsampled, every location of the output corresponds to a grid in the input image and represents the predicted result around the grid. Considering that CNN extracts the feature in a local manner, closer pixels in the output map are more representative of the target. Thus, according to the center location of the ground truth box, a fixed number of grids around the center point are selected as positive samples. The matching of the ground truth gn and the grid that corresponds to pixel (i, j) in the output map can be summarized as follows:
p i j , n * = { 1 , 0 , ( i , j ) N k ( g n ) o t h e r w i s e
where N k ( g n ) represents the region of the k nearest grids around the center point of target gn and k is a constant designed manually. The case of k = 4 is shown in Figure 8, where four nearest grids are selected as positive samples. It can be seen that the assigned positive pixels are distributed in the central region of the target, and the target can be properly covered by their receptive field. Additionally, if a pixel lies in the positive neighbor of multiple targets, it would be assigned to the target with the largest IoU.
The hyperparameter k represents the number of positive samples for every target and determines the overall assignment level. When k = 1, the center grid is assigned to the target, which is similar to CenterNet [20]. Generally speaking, more positives can improve training efficiency while generating more low-quality predictions. Therefore, considering the small size of ship targets, we set k = 4.
Center-based uniform matching assigns an equal number of positive samples to each ground truth regardless of their scale, which solves the imbalance problem of positive samples for a one-level feature map situation. Different from the uniform matching in [41], the proposed method measures the distances between grids and labels with central locations and avoids the hyperparameter design required by the anchor mechanism. Since the location of all target boxes is determined, assigned positives and the optimization objective are invariable during the training process, which is more stable and prevents low-quality predictions caused by too many positive assignments.

2.5. Output Mapping and Loss Function

The proposed network is an anchor-free detector. It directly outputs the detection result and every pixel in the output map produces one predicted box. Concretely, for a pixel point located at position (i, j) (where i = 0, 1, 2, …, W/sl − 1 and j = 0, 1, 2, …, H/sl − 1) in the output map, its dimension (i.e., channel number of the output map) is 4 + 1 + c, corresponding to four output coordinates t i j o = ( x i j o , y i j o , w i j o , h i j o ) , the predicted confidence p i j , and classification result of this prediction c i j . Additionally, the coordinate of the predicted bounding box t i j p can be obtained by decoding the output coordinates through:
x i j p = ( x i j o + i ) × s l y i j p = ( y i j o + j ) × s l w i j p = w i j o × s l h i j p = h i j o × s l
where ( x i j p , y i j p ) is the center point coordinate of the predicted box and ( w i j p , h i j p ) is the corresponding width and height.
While training the network, the predicted boxes are first divided into positive targets and negative backgrounds using the proposed center-based uniform matching strategy. Then, for an image with N ship targets, the total loss function L can be calculated by:
L = 1 N pos n = 1 N i = 0 W / s l 1 j = 0 H / s l 1 { L o b j ( p i j , p i j , n * ) + p i j , n * L c l s ( c i j , c n ) + α p i j , n * L r e g ( t i j p , t n ) }
where Npos is the number of positive assignments, α is a weighting parameter set as 5.0, cn and tn represent the category and bounding box of the n-th target, respectively, and p i j , n * is an indicator that equals to 1 when the prediction on (i, j) is assigned to the n-th target; otherwise, it is 0. The classification loss Lcls and objectiveness loss Lobj adopt binary cross entropy with sigmoid normalization, and bounding box regression loss Lreg adopts IoU loss.

3. Results

3.1. Data Sets

Experiments on the SSDD and HRSID were conducted to verify the effectiveness of the proposed method. As the first open dataset for SAR ship detection, the SSDD is composed of 1160 images with 2456 ship targets. It contains samples with different resolutions, sizes, and sea conditions, providing abundant diversity to build a reliable detection model. Following the official scheme [42], 928 images were used for model training, and the rest of the 232 images were used for testing. Considering the distribution of image size, these images were resized to 352 × 512 before being sent into the model. Additionally, a larger dataset called the HRSID was adopted to validate the generalization ability of our method, which comprises 5604 cropped SAR images and 16,951 ships. They were divided into a training set with 3642 images and a test set with 1962 images. the HRSID has an image size of 800 × 800, displaying the characteristics of large detection scenes. In Figure 9, the ship size distribution of both datasets is given. It can be seen that both datasets are composed mainly of small ship targets.

3.2. Implementation Details

The experiments were conducted in the PyTorch 1.7.1, CUDA 11.0 framework based on a single NVIDIA Quadro P6000 GPU and the Ubuntu 20.04 system. The network was trained from scratch by the stochastic gradient descent (SGD) algorithm for 120 epochs with 0.9 momentum and 0.0005 weight decay. The learning rate followed a linear warmup and cosine decay schedule, with a maximum of 1 × 10⁻⁴ at the 5th epoch and a minimum of 5 × 10⁻⁶ after 100 epochs. Additionally, the batch sizes for SSDD and HRSID were set as 64 and 16, respectively. To make a fair comparison with other detectors, we canceled the mosaic and mixup enhancement strategy in YOLOX, and only employed random flip and crop as data augmentation for all models.

3.3. Evaluation Metrics

In order to evaluate the detection performance of different methods, we followed the evaluation criteria of MS COCO [53] and used AP, AP50, AP75, APS, APM, and APL as evaluation metrics. By calculating the area under the precision-recall curve, the average precision (AP) achieved a more comprehensive representation of the detection performance. In addition to AP, the precision rate (P), recall rate (R), and F1-score were used to indicate the performance of whole scene images. These metrics are defined as follows:
P = TP TP + FP
R = TP TP + FN
F 1 = 2 × P × R P + R
AP = 0 1 P ( R ) d R
where TP, FP, and FN represent the number of true positives, false positives, and false negatives, respectively. The mostly used AP50 was based on an IoU threshold of 0.5. Correspondingly, AP75 was based on a higher IoU threshold of 0.75. Additionally, AP was calculated across the IoU thresholds from 0.5 to 0.95 with an interval of 0.05. APS, APM, and APL represented AP for objects of small, medium, and large scales, respectively. In addition, floating-point operations (FLOPs) and the number of model parameters were adopted to measure the complexity of the model.

3.4. Model Analysis

In order to verify the effectiveness of a ship detector with a one-level feature map and analyze the effect of each proposed component, we conducted a series of experiments. They were conducted on the SSDD with the same training setting to make a fair comparison.

3.4.1. Feature Level Selection

In YOLOF [41], C5, the spatially smallest feature map with the largest receptive field, was adopted to construct a SiSo (single-in-single-out) encoder because it contains sufficient context information for optical image targets. However, the most suitable feature level for ship targets in SAR images might change because of different target characteristics. To study the influence of different feature maps and find the best feature layer for ship detection, we trained the network with different one-level features, i.e., C2, C3, C4, and C5. It is worth noting that when a shallow feature map is adopted, the depth of the backbone needs to be reconsidered as those layers after the selected feature are not involved in the forward propagation anymore. In consideration of this, those redundant layers were removed for the simplicity of the network. All networks simply adopted one projector followed by a decoupled head and were trained with the SimOTA matching strategy.
The results are given in Table 1. It can be seen that the detection performance is sensitive to the adopted one-level feature. From C5 to C3, APS and the overall performance show an increasing trend whereas APL decreases, which proves that the scale range matched to the receptive field is of great importance to detection performance. Low-level features with small receptive fields are more suitable for small targets whereas high-level features with large receptive fields are fit for large targets. Surprisingly, the detection results of the one-level feature for scale-matched targets, e.g., APL of C5 and APS for C3, are a little better than the baseline. This result reveals that the feature representation ability of the one-level feature is sufficient for specific ship targets and the role the feature pyramid plays is to make a balance between different scales. When the lowest feature C2 is adopted, the performance is decreased compared to C3, which demonstrates that the context information of C2 is not strong enough to distinguish small ships from backgrounds since its receptive field is too small.
Meanwhile, the model parameter number and computational complexity for most one-level situations are greatly reduced. This reduction mainly comes from two aspects. First, the original neck, i.e., PAFPN, with a complicated pyramidal structure is replaced with a simple projector. Second, the backbone is truncated as deep layers are not necessary anymore. The only exception, i.e., FLOPs of C2, is because the feature map size is too large. Additionally, it can be seen that as the feature level becomes shallower, there is a decrease in model size for the reason that the shallow part of the backbone has a smaller channel number. In consideration of the performance on small targets, we chose C3 as the default feature of the proposed method.

3.4.2. Ablation Study of the Proposed Method

Though C3 achieves comparable AP to the baseline, it has an extremely poor performance in detecting large targets due to the limited scale range. We added RADC blocks and center-based uniform matching to C3 to deal with the problems brought by adopting the one-level feature. As shown in Table 2, the detection accuracy of all scales is improved after adding RADC blocks. Particularly, APM is increased by 7.85% and APL is increased by 23.56%, proving the effectiveness of the RADC block to expand the receptive field and enrich context information of the feature. Furthermore, when center-based uniform matching is applied, the overall precision AP gains is an improvement of 2.62% with no extra computational cost. Additionally, it can be seen that this improvement mainly comes from the increase in APS and APM. On the contrary, the performance for large targets is decreased, which is because the center-based uniform matching treats all targets equally regardless of their scales and the network is more focused on small targets than before. From an overall perspective, the proposed method achieves better performance compared to YOLOX-s while less computation is needed, revealing the effectiveness and high-efficiency of ship detection using a one-level feature map.
Some visualized results are shown in Figure 10. The confidence threshold is set as 0.5 and the IoU threshold for NMS is set as 0.65. As a note, green, red, and yellow rectangles represent truth positives, false alarms, and missed ship targets, respectively. As shown in Figure 10b, YOLOX-s has a poor detection rate on small ship targets. In the first three rows of Figure 10, there are a lot of small ships missed by YOLOX, including in both inshore and offshore areas. When one-level feature C3 is adopted to focus on small ships, the number of missed small ships in offshore areas is reduced. Furthermore, it can be seen that by adding RADC blocks and training with center-based uniform matching, the proposed method captured those inshore ships in the third row, which indicates that the proposed method is qualified to detect small ships in various backgrounds. Though C3 discovers more small ships, its ability to deal with large targets and complex inshore areas is significantly reduced, which can be proven by the results in the last two rows of Figure 10. Meanwhile, the proposed method can precisely locate large ships compared to C3, which benefits from the increased receptive field brought by the RADC blocks. Specially, the missed target in the last row shows that the proposed method is not capable of discovering targets of extreme shapes. This deficiency is unsurprising given that we abandoned the multiscale structure in pursuit of detection efficiency.

3.4.3. Ablation Study of RADC Block

In the RADC block, residual connection and symmetric dilated convolution are designed to expand the receptive field while maintaining the information of small targets. To verify the effectiveness of these two components, we canceled the residual structure and used standard dilated convolution to replace the four branches. The results in Table 3 show that the residual connection which preserves original information is essential to the detection of small targets. Additionally, the multibranch design with asymmetric dilated convolutions can effectively improve detection performance of large targets, which means large ship targets with various shapes are properly covered by the four branches.

3.5. Parameter Analysis

3.5.1. Number of Stacked RADC Blocks

As the stacking of RADC blocks is the key to how our neck is constructed, the number of stacked blocks is important to the receptive field and feature representation of the output map. The results in Table 4 show that with the increase in stacked blocks, AP is gradually increased, which manifests the effectiveness of the RADC block to improve feature representation of the network. Though more blocks can boost the accuracy even further, we added four RADC blocks by default to keep the network lightweight and fast.

3.5.2. Positive Samples of Center-Based Uniform Matching

The number of assigned positive samples for every ground truth has a great impact on the calculation of loss function and further network optimization. Intuitively, in one-stage detectors with dense priors, more positive assignments can bring benefits to the training process. On this account, we have conducted experiments with different positive samples for each target. As shown in Table 5, the performance of center-based uniform matching is quite robust with different k values, except for the k = 1 situation in which target information is not learned efficiently. The best result is achieved with four positive assignments for each target, indicating that four pixels on the final output map can attain the best representation for most ship targets. Additionally, the performance begins to decline when more positive samples are assigned. This is because these samples are far from the ship center and hold inadequate information for target locating.

3.6. Extended Experiments on HRSID

In order to verify the generalization ability of the proposed method, we conducted the same experiments on the HRSID. The results are shown in Table 6. After removing the feature pyramid structure, the one-level feature C3 achieves a decreased accuracy compared to the baseline, which is the same as the results of the SSDD. By adding the proposed components, AP and AP50 of C3 are increased by 2.25% and 2.36%, respectively. It is worth noting that the target scale of the HRSID is distributed in a wider range, which can be proven by Figure 9b, and there are a lot of ships with extremely small or large sizes, which increases the difficulty of target detection. As a result, the proposed method achieves slightly lower overall accuracy compared to the baseline, whereas the model size and computational cost are both reduced substantially.
Figure 11 shows some detection results of the proposed method on the HRSID. It can be seen that small ships in both inshore and offshore areas can be properly detected, proving the effective feature learning of the proposed network to capture ship targets. Additionally, the few false alarms are all within the water area, which indicates the superiority of CNNs for automatically distinguishing land interference without sea–land segmentation. At the same time, the second row of Figure 11 demonstrates that ships adjacent to each other are easily missed by the proposed method. This phenomenon is related to the postprocessing operation and can be further solved with soft-NMS [54].

3.7. Comparison with Other CNN Detectors

The proposed method was compared with several representative detection networks, including Faster R-CNN [12], RetinaNet [18], FCOS [21], and the tiny version of YOLOX [22]. Furthermore, the original YOLOF [41] which adopts a one-level feature C5 was also performed on SAR ship datasets for comparison. Except for YOLOX, all other networks adopted ResNet-50 [45] as backbone. To make a fair comparison, we conducted experiments using the same input image size and data augmentation methods. The results are given in Table 7, where for every column the best value is bolded and the second-best value is underlined.
According to the results, the model size of the proposed method is 10.3 MB, which is much smaller than that of other detectors and is conducive to the deployment of the detection algorithm in resource-constrained platforms. Compared with other anchor-free detectors, the model size of the proposed lightweight model is 4.0% of FCOS, 14.3% of YOLO-s, and 25.4% of YOLOX-tiny. Additionally, the inference speed of the proposed method is also qualified for real-time ship detection. At the same time, the proposed method achieves the highest AP50 on the SSDD and the second-best AP on the HRSID, which proves the adequacy of the one-level feature for ship detection in SAR images. With the proposed RADC block and center-based uniform matching, single-scale detection can achieve competitive accuracy. Specially, it can be noticed that the performance of YOLOF on SAR ship detection is not as satisfying as that on natural object detection. This difference mainly results from different target scales of natural targets and ship targets.

3.8. Detection Results of Large-Scale Image

In order to further evaluate the effectiveness of the proposed method on large-scene SAR images, an additional dataset, namely, the large-scale SAR ship detection dataset-v1.0 (LS-SSDD-v1.0) [55] was used, in which a large-scale image (i.e., 16,000 × 24,000 pixels) was tested by the proposed method. The large image was cropped into image chips of 800 × 800 pixels with no overlap before being sent into the network, and a confidence threshold of 0.2 was used for detection results, which are given in Table 8 and Figure 12. It can be drawn from Table 8 that, compared with YOLOX-s, the proposed method can detect more ships with fewer false alarms. At the same time, the shorter inference time can be proof of its high detection efficiency. In the visualized result of Figure 12, most ships with both offshore and inshore backgrounds can be detected properly, indicating the stability of the proposed method in large-scene images.

4. Discussion

Based on the small scale of SAR ship targets and relatively weak texture level of SAR images, we design a lightweight detection network by removing the low-efficiency high-level features. Therefore, the detection accuracy of our one-level feature-based method is related to the target scale distribution of the dataset. In our experiments, we first verified the influence of adopting features of different levels on the SSDD and found that a shallow layer C3 performs well in locating small ships. On this basis, we added the proposed RADC blocks and center-based uniform matching to C3 and boosted the performance significantly. Furthermore, when trained with a larger dataset, the HRSID, the proposed method can also achieve comparable accuracy with the baseline while having a much smaller model size. The comparison results with other CNN-based detectors are visualized in Figure 13. It can be seen that the proposed method has a low model complexity and a high detection speed. From an overall perspective, the proposed method achieves comparable performance to other CNN-based detectors with computational cost, which proves the significant superiority of our method.
By building a lightweight detector within a single scale, we proved the validity of the one-level feature for detecting ships in SAR images. Nevertheless, there are still some problems to be solved. First, the proposed method is not capable of detecting ships with extreme shapes, which means the robustness of the proposed method still needs to be improved. Second, from the detection results in Figure 11, it can be seen that the detection ability of our method for adjacent ships is limited. In addition, the adopted target representation, i.e., bounding box, is not the most appropriate form for oriented ship targets and more precise forms can be used for better ship representation. These problems are to be solved in our future work.

5. Conclusions

In this paper, we proposed a lightweight network using a one-level feature to achieve high-efficiency ship detection in SAR images. We replaced the feature pyramid structure with a streamlined neck and designed RADC blocks to detect ships of various scales. With RADC blocks, both the limited receptive field and weak semantic level of the one-level feature can be improved effectively. Furthermore, to deal with the imbalance problem between different scales in the training stage, we proposed center-based uniform matching, which assigns a fixed number of positive samples to each target. Experiments on the SSDD and HRSID showed that the proposed components can effectively improve the performance of the one-level feature. Compared with mainstream CNN-based detectors, the proposed method is fast and accurate. Additionally, the detection results on a large-scene image also prove the effectiveness of the proposed method.

Author Contributions

Conceptualization, W.Y.; methodology, W.Y. and Z.W.; software, W.Y.; validation, W.Y. and J.L.; formal analysis, W.Y.; investigation, Z.W., Y.L. and W.Y.; data curation, W.Y.; writing—original draft preparation, W.Y. and Z.W.; writing—review and editing, Z.W. and J.L.; visualization, W.Y. and J.L.; supervision, Y.L.; funding acquisition, Y.L. and Z.Y. All authors have read and agreed to the published version of the manuscript.

Funding

This work was supported in part by the National Natural Science Foundation of China (61971026).

Data Availability Statement

No new data were created or analyzed in this study. Data sharing is not applicable to this article.

Acknowledgments

The authors would like to thank the authors of the SSDD, HRSID, and LS-SSDD-v1.0 for providing high-quality target annotation and dataset building.

Conflicts of Interest

The authors declare no conflict of interest.

References

  1. Chen, L.; Weng, T.; Xing, J.; Pan, Z.; Yuan, Z.; Xing, X.; Zhang, P. A New Deep Learning Network for Automatic Bridge Detection from SAR Images Based on Balanced and Attention Mechanism. Remote Sens. 2020, 12, 441. [Google Scholar] [CrossRef]
  2. Li, J.; Qu, C.; Shao, J. Ship Detection in SAR Images Based on an Improved Faster R-CNN. In Proceedings of the SAR in Big Data Era: Models, Methods and Applications (BIGSARDATA), Beijing, China, 13–14 November 2017; pp. 1–6. [Google Scholar]
  3. Sun, Y.; Lei, L.; Guan, D.; Li, X.; Kuang, G. SAR Image Change Detection Based on Nonlocal Low-Rank Model and Two-Level Clustering. IEEE J. Sel. Top. Appl. Earth Obs. Remote Sens. 2020, 13, 293–306. [Google Scholar] [CrossRef]
  4. Jiang, X.; He, Y.; Gang, L.; Liu, Y.; Zhang, X.-P. Building Damage Detection via Superpixel-Based Belief Fusion. IEEE Sens. J. 2020, 20, 2008–2022. [Google Scholar] [CrossRef]
  5. Novak, L.M.; Halversen, S.D.; Owirka, G.J.; Hiett, M. Effects of Polarization and Resolution on SAR ATR. IEEE Trans. Aerosp. Electron. Syst. 1997, 33, 102–116. [Google Scholar] [CrossRef]
  6. Kaplan, L.M. Improved SAR Target Detection via Extended Fractal Features. IEEE Trans. Aerosp. Electron. Syst. 2001, 37, 436–451. [Google Scholar] [CrossRef]
  7. Dellinger, F.; Delon, J.; Gousseau, Y.; Michel, J.; Tupin, F. SAR-SIFT: A SIFT-like Algorithm for SAR Images. IEEE Trans. Geosci. Remote Sens. 2015, 53, 453–466. [Google Scholar] [CrossRef] [Green Version]
  8. Nunziata, F.; Migliaccio, M.; Brown, C.E. Reflection Symmetry for Polarimetric Observation of Man-Made Metallic Targets at Sea. IEEE J. Ocean. Eng. 2012, 37, 384–394. [Google Scholar] [CrossRef]
  9. Zhai, L.; Li, Y.; Su, Y. Inshore Ship Detection via Saliency and Context Information in High-Resolution SAR Images. IEEE Geosci. Remote Sens. Lett. 2016, 13, 1870–1874. [Google Scholar] [CrossRef]
  10. Girshick, R.; Donahue, J.; Darrell, T.; Malik, J. Rich Feature Hierarchies for Accurate Object Detection and Semantic Segmentation. In Proceedings of the IEEE Conference on Computer Vision and Pattern Recognition (CVPR), Columbus, OH, USA, 23–28 June 2014; pp. 580–587. [Google Scholar]
  11. Girshick, R. Fast R-CNN. In Proceedings of the IEEE International Conference on Computer Vision (ICCV), Santiago, Chile, 7–13 December 2015; pp. 1440–1448. [Google Scholar]
  12. Ren, S.; He, K.; Girshick, R.; Sun, J. Faster R-CNN: Towards Real-Time Object Detection with Region Proposal Networks. IEEE Trans. Pattern Anal. Mach. Intell. 2017, 39, 1137–1149. [Google Scholar] [CrossRef] [Green Version]
  13. Redmon, J.; Divvala, S.; Girshick, R.; Farhadi, A. You Only Look Once: Unified, Real-Time Object Detection. In Proceedings of the IEEE Conference on Computer Vision and Pattern Recognition (CVPR), Las Vegas, NV, USA, 27–30 June 2016; pp. 779–788. [Google Scholar]
  14. Redmon, J.; Farhadi, A. YOLO9000: Better, Faster, Stronger. In Proceedings of the IEEE Conference on Computer Vision and Pattern Recognition (CVPR), Honolulu, HI, USA, 21–26 July 2017; pp. 6517–6525. [Google Scholar]
  15. Redmon, J.; Farhadi, A. YOLOv3: An Incremental Improvement. arXiv 2018, arXiv:1804.02767. [Google Scholar]
  16. Bochkovskiy, A.; Wang, C.-Y.; Liao, H.-Y.M. YOLOv4: Optimal Speed and Accuracy of Object Detection. arXiv 2020, arXiv:2004.10934. [Google Scholar]
  17. Liu, W.; Anguelov, D.; Erhan, D.; Szegedy, C.; Reed, S.; Fu, C.-Y.; Berg, A.C. SSD: Single Shot MultiBox Detector. In Proceedings of the European Conference on Computer Vision (ECCV), Amsterdam, The Netherlands, 8–16 October 2016; pp. 21–37. [Google Scholar]
  18. Lin, T.-Y.; Goyal, P.; Girshick, R.; He, K.; Dollár, P. Focal Loss for Dense Object Detection. In Proceedings of the IEEE International Conference on Computer Vision (ICCV), Venice, Italy, 22–29 October 2017; pp. 2999–3007. [Google Scholar]
  19. Law, H.; Deng, J. CornerNet: Detecting Objects as Paired Keypoints. In Proceedings of the European Conference on Computer Vision (ECCV), Munich, Germany, 8–14 September 2018; pp. 734–750. [Google Scholar]
  20. Zhou, X.; Wang, D.; Krähenbühl, P. Objects as Points. arXiv 2019, arXiv:1904.07850. [Google Scholar]
  21. Tian, Z.; Shen, C.; Chen, H.; He, T. FCOS: Fully Convolutional One-Stage Object Detection. In Proceedings of the IEEE International Conference on Computer Vision (ICCV), Seoul, Korea, 27 October–2 November 2019; pp. 9626–9635. [Google Scholar]
  22. Ge, Z.; Liu, S.; Wang, F.; Li, Z.; Sun, J. YOLOX: Exceeding YOLO Series in 2021. arXiv 2021, arXiv:2107.08430. [Google Scholar]
  23. Chen, L.; Weng, T.; Xing, J.; Li, Z.; Yuan, Z.; Pan, Z.; Tan, S.; Luo, R. Employing Deep Learning for Automatic River Bridge Detection from SAR Images Based on Adaptively Effective Feature Fusion. Int. J. Appl. Earth Obs. Geoinf. 2021, 102, 102425. [Google Scholar] [CrossRef]
  24. Liu, L.; Chen, G.; Pan, Z.; Lei, B.; An, Q. Inshore Ship Detection in Sar Images Based on Deep Neural Networks. In Proceedings of the IEEE International Geoscience and Remote Sensing Symposium, Valencia, Spain, 22–27 July 2018; pp. 25–28. [Google Scholar]
  25. An, Q.; Pan, Z.; Liu, L.; You, H. DRBox-v2: An Improved Detector with Rotatable Boxes for Target Detection in SAR Images. IEEE Trans. Geosci. Remote Sens. 2019, 57, 8333–8349. [Google Scholar] [CrossRef]
  26. Lu, J.; Li, T.; Ma, J.; Li, Z.; Jia, H. SAR: Single-Stage Anchor-Free Rotating Object Detection. IEEE Access 2020, 8, 205902–205912. [Google Scholar] [CrossRef]
  27. Luo, R.; Chen, L.; Xing, J.; Yuan, Z.; Tan, S.; Cai, X.; Wang, J. A Fast Aircraft Detection Method for Sar Images Based on Efficient Bidirectional Path Aggregated Attention Network. Remote Sens. 2021, 13, 2940. [Google Scholar] [CrossRef]
  28. Kang, M.; Ji, K.; Leng, X.; Lin, Z. Contextual Region-Based Convolutional Neural Network with Multilayer Fusion for SAR Ship Detection. Remote Sens. 2017, 9, 860. [Google Scholar] [CrossRef] [Green Version]
  29. Jiao, J.; Zhang, Y.; Sun, H.; Yang, X.; Gao, X.; Hong, W.; Fu, K.; Sun, X. A Densely Connected End-to-End Neural Network for Multiscale and Multiscene SAR Ship Detection. IEEE Access 2018, 6, 20881–20892. [Google Scholar] [CrossRef]
  30. Zhao, Y.; Zhao, L.; Xiong, B.; Kuang, G. Attention Receptive Pyramid Network for Ship Detection in SAR Images. IEEE J. Sel. Top. Appl. Earth Obs. Remote Sens. 2020, 13, 2738–2756. [Google Scholar] [CrossRef]
  31. Fu, J.; Sun, X.; Wang, Z.; Fu, K. An Anchor-Free Method Based on Feature Balancing and Refinement Network for Multiscale Ship Detection in SAR Images. IEEE Trans. Geosci. Remote Sens. 2021, 59, 1331–1344. [Google Scholar] [CrossRef]
  32. Zhang, T.; Zhang, X.; Ke, X. Quad-FPN: A Novel Quad Feature Pyramid Network for SAR Ship Detection. Remote Sens. 2021, 13, 2771. [Google Scholar] [CrossRef]
  33. Gao, S.; Liu, J.M.; Miao, Y.H.; He, Z.J. A High-Effective Implementation of Ship Detector for SAR Images. IEEE Geosci. Remote Sens. Lett. 2022, 19, 4019005. [Google Scholar] [CrossRef]
  34. Liu, S.; Qi, L.; Qin, H.; Shi, J.; Jia, J. Path Aggregation Network for Instance Segmentation. In Proceedings of the IEEE/CVF Conference on Computer Vision and Pattern Recognition (CVPR), Salt Lake City, UT, USA, 18–23 June 2018; pp. 8759–8768. [Google Scholar]
  35. Wang, X.; Zhang, S.; Yu, Z.; Feng, L.; Zhang, W. Scale-Equalizing Pyramid Convolution for Object Detection. In Proceedings of the IEEE/CVF Conference on Computer Vision and Pattern Recognition (CVPR), Seattle, WA, USA, 13–19 June 2020; pp. 13359–13368. [Google Scholar]
  36. Zhang, T.; Zhang, X.; Li, J.; Xu, X.; Wang, B.; Zhan, X.; Xu, Y.; Ke, X.; Zeng, T.; Su, H.; et al. SAR Ship Detection Dataset (SSDD): Official Release and Comprehensive Data Analysis. Remote Sens. 2021, 13, 3690. [Google Scholar] [CrossRef]
  37. Zhang, T.; Zhang, X. ShipDeNet-20: An Only 20 Convolution Layers and <1-MB Lightweight SAR Ship Detector. IEEE Geosci. Remote Sens. Lett. 2021, 18, 1234–1238. [Google Scholar] [CrossRef]
  38. Jiang, J.; Fu, X.; Qin, R.; Wang, X.; Ma, Z. High-Speed Lightweight Ship Detection Algorithm Based on YOLO-V4 for Three-Channels RGB SAR Image. Remote Sens. 2021, 13, 1909. [Google Scholar] [CrossRef]
  39. Feng, Y.; Chen, J.; Huang, Z.; Wan, H.; Xia, R.; Wu, B. A Lightweight Position-Enhanced Anchor-Free Algorithm for SAR Ship Detection. Remote Sens. 2022, 14, 1908. [Google Scholar] [CrossRef]
  40. Pang, J.; Chen, K.; Shi, J.; Feng, H.; Ouyang, W.; Lin, D. Libra R-CNN: Towards Balanced Learning for Object Detection. In Proceedings of the IEEE/CVF Conference on Computer Vision and Pattern Recognition (CVPR), Long Beach, CA, USA, 15–20 June 2019; pp. 821–830. [Google Scholar]
  41. Tan, M.; Pang, R.; Le, Q.V. EfficientDet: Scalable and Efficient Object Detection. In Proceedings of the IEEE/CVF Conference on Computer Vision and Pattern Recognition (CVPR), Seattle, WA, USA, 13–19 June 2020; pp. 10778–10787. [Google Scholar]
  42. Chen, Q.; Wang, Y.; Yang, T.; Zhang, X.; Cheng, J.; Sun, J. You Only Look One-Level Feature. In Proceedings of the IEEE/CVF Conference on Computer Vision and Pattern Recognition (CVPR), Nashville, TN, USA, 20–25 June 2021; pp. 13039–13048. [Google Scholar]
  43. Wei, S.; Zeng, X.; Qu, Q.; Wang, M.; Su, H.; Shi, J. HRSID: A High-Resolution SAR Images Dataset for Ship Detection and Instance Segmentation. IEEE Access 2020, 8, 120234–120254. [Google Scholar] [CrossRef]
  44. Simonyan, K.; Zisserman, A. Very Deep Convolutional Networks for Large-Scale Image Recognition. arXiv 2014, arXiv:1409.1556. [Google Scholar]
  45. He, K.; Zhang, X.; Ren, S.; Sun, J. Deep Residual Learning for Image Recognition. In Proceedings of the IEEE Conference on Computer Vision and Pattern Recognition (CVPR), Las Vegas, NV, USA, 27–30 June 2016; pp. 770–778. [Google Scholar]
  46. Huang, G.; Liu, Z.; van der Maaten, L.; Weinberger, K.Q. Densely Connected Convolutional Networks. In Proceedings of the IEEE Conference on Computer Vision and Pattern Recognition (CVPR), Honolulu, HI, USA, 21–26 July 2017; pp. 4700–4708. [Google Scholar]
  47. Wang, C.Y.; Mark Liao, H.Y.; Wu, Y.H.; Chen, P.Y.; Hsieh, J.W.; Yeh, I.H. CSPNet: A New Backbone That Can Enhance Learning Capability of CNN. In Proceedings of the IEEE/CVF Conference on Computer Vision and Pattern Recognition Workshops (CVPRW), Seattle, WA, USA, 14–19 June 2020; pp. 1571–1580. [Google Scholar]
  48. Pan, Z.; Yang, R.; Zhang, Z. MSR2N: Multi-Stage Rotational Region Based Network for Arbitrary-Oriented Ship Detection in SAR Images. Sensors 2020, 20, 2340. [Google Scholar] [CrossRef] [Green Version]
  49. Cui, Z.; Li, Q.; Cao, Z.; Liu, N. Dense Attention Pyramid Networks for Multi-Scale Ship Detection in SAR Images. IEEE Trans. Geosci. Remote Sens. 2019, 57, 8983–8997. [Google Scholar] [CrossRef]
  50. Zhu, M.; Fan, J.; Yang, Q.; Chen, T. SC-EADNet: A Self-Supervised Contrastive Efficient Asymmetric Dilated Network for Hyperspectral Image Classification. IEEE Trans. Geosci. Remote Sens. 2022, 60, 5519517. [Google Scholar] [CrossRef]
  51. Zhang, S.; Chi, C.; Yao, Y.; Lei, Z.; Li, S.Z. Bridging the Gap between Anchor-Based and Anchor-Free Detection via Adaptive Training Sample Selection. In Proceedings of the IEEE/CVF Conference on Computer Vision and Pattern Recognition (CVPR), Seattle, WA, USA, 13–19 June 2020; pp. 9759–9768. [Google Scholar]
  52. Kim, K.; Lee, H.S. Probabilistic Anchor Assignment with IoU Prediction for Object Detection. In Proceedings of the European Conference on Computer Vision (ECCV), Glasgow, UK, 23–28 August 2020; pp. 355–371. [Google Scholar]
  53. Lin, T.-Y.; Maire, M.; Belongie, S.; Hays, J.; Perona, P.; Ramanan, D.; Zitnick, C.L.; Doll’ar, P. Microsoft COCO: Common Objects in Context. In Proceedings of the European Conference on Computer Vision (ECCV), Zurich, Switzerland, 6–12 September 2014; pp. 740–755. [Google Scholar]
  54. Chen, Y.; Duan, T.; Wang, C.; Zhang, Y.; Huang, M. End-to-End Ship Detection in SAR Images for Complex Scenes Based on Deep CNNs. J. Sens. 2021, 2021, 8893182. [Google Scholar] [CrossRef]
  55. Zhang, T.; Zhang, X.; Ke, X.; Zhan, X.; Shi, J.; Wei, S.; Pan, D.; Li, J.; Su, H.; Zhou, Y.; et al. LS-SSDD-v1.0: A Deep Learning Dataset Dedicated to Small Ship Detection from Large-Scale Sentinel-1 SAR Images. Remote Sens. 2020, 12, 2997. [Google Scholar] [CrossRef]
Figure 1. Examples of SAR ship targets in [36]. Blue rectangles represent the bounding box of ship targets. (a) Small ships in offshore areas. (b) Ships in complex inshore backgrounds.
Remotesensing 14 03321 g001
Figure 2. Difference of feature pyramid network and the proposed network; (a) feature pyramid network, (b) the proposed network.
Remotesensing 14 03321 g002
Figure 3. The overall framework of the proposed method. In this figure, “CSPDarknet*” represents the backbone CSPDarknet that is truncated from a middle stage.
Remotesensing 14 03321 g003
Figure 4. Structure of the CSPDarknet.
Remotesensing 14 03321 g004
Figure 5. The detailed structure of residual asymmetric dilated convolution block.
Remotesensing 14 03321 g005
Figure 6. (a) Ship target in SAR image. (b) An illustration of the receptive field of RADC block.
Remotesensing 14 03321 g006
Figure 7. Structure of the decoupled detection head.
Remotesensing 14 03321 g007
Figure 8. An illustration of center-based uniform matching. The orange point and blue star represent grid center and target center, respectively. Additionally, green squares are the assigned positive grids.
Remotesensing 14 03321 g008
Figure 9. Visualized distribution of ship sizes. In this figure, yellow region denotes a high density of ship distribution. (a) Ship size distribution of SSDD. (b) Ship size distribution of HRSID.
Remotesensing 14 03321 g009
Figure 10. Effect of the proposed method. (a) Ground truth. (b) Detection results of YOLOX-s. (c) Detection results of C3. (d) Detection results of the proposed method.
Remotesensing 14 03321 g010
Figure 11. Detection visualization results of the proposed method on HRSID.
Remotesensing 14 03321 g011aRemotesensing 14 03321 g011b
Figure 12. Detection visualization results of the proposed method in a large-scene SAR image.
Remotesensing 14 03321 g012
Figure 13. Visualization of the comparison results with other CNN-based models. (a) Comparison results of model complexity. (b) Comparison results of AP.
Remotesensing 14 03321 g013
Table 1. Detection performance of methods adopting feature maps at different levels.
Feature LevelStrideParam (M)FLOPs (G)AP (%)AP50 (%)AP75 (%)APS (%)APM (%)APL (%)
C3, C4, C58, 16, 328.9411.7262.8692.5275.6264.4062.2837.68
C5325.035.1150.3280.6157.1748.8859.0438.19
C4161.984.8760.9490.1972.6661.3563.6221.43
C381.046.8162.2791.9074.3464.4958.068.13
C240.8118.3956.0387.6166.6661.0336.377.30
Table 2. Effect of RADC block and center-based uniform matching strategy.
MethodParam (M)FLOPs (G)AP (%)AP50 (%)AP75 (%)APS (%)APM (%)APL (%)
C31.046.8162.2791.9074.3464.4958.068.13
+RADC Blocks1.268.0264.8593.6577.7165.8665.9131.69
+Center-based Uniform Matching1.268.0267.4795.5081.6867.4869.2627.31
Table 3. Effect of residual connection and asymmetric dilation in RADC block.
Residual ConnectionAsymmetric DilationAP (%)APS (%)APM (%)APL(%)
62.9763.6865.3720.02
63.2063.9365.2726.12
64.7665.9365.4020.58
64.8565.8665.9131.69
Table 4. Results of varying the number of RADC blocks.
nParam (M)FLOPs (G)AP (%)
01.046.8162.27
21.157.4264.52
41.268.0264.85
61.378.6365.13
81.479.2365.50
Table 5. Results of varying the number of positive assignments for each target.
kAP (%)AP50 (%)
164.7394.28
267.0495.30
367.3595.29
467.4795.50
567.1395.16
Table 6. Detection performance on HRSID.
MethodParam (M)FLOPs (G)AP (%)AP50 (%)
YOLOX-s8.9441.6263.8888.40
C31.0424.1961.4186.03
C3 + RADC blocks1.2628.4963.1987.43
the proposed method1.2628.4963.6688.39
Table 7. Comparison results with other CNN-based models.
MethodModel Size (MB)Inference Time *
(ms/Image)
SSDDHRSID
AP(%)AP50(%)AP(%)AP50(%)
Faster R-CNN270.0215.069.5194.6961.9488.23
RetinaNet303.050.466.4594.6061.4786.97
FCOS256.228.566.8394.3262.2488.40
YOLOF338.128.254.6082.7148.3171.35
YOLOX-s71.98.262.8692.5263.8888.40
YOLOX-tiny40.66.962.1692.4062.9788.11
the proposed method10.37.167.4795.5063.6688.39
* Inference time is measured on HRSID with an input size of (800, 800).
Table 8. Detection results of the large-scene image.
MethodTPFPFNPRF1Time (s)
YOLOX-s20232710.86320.73990.796817.77
the proposed method21128620.88280.77290.824213.54
Publisher’s Note: MDPI stays neutral with regard to jurisdictional claims in published maps and institutional affiliations.

