Review

UAV-Based Forest Health Monitoring: A Systematic Review

1
Bavarian State Institute of Forestry, Hans Carl-von-Carlowitz-Platz 1, 85354 Freising, Germany
2
Chair of Forest Growth and Dendroecology, Faculty of Environment and Natural Resources, University of Freiburg, Tennenbacher Str. 4, 79106 Freiburg, Germany
3
Faculty of Forestry, University of Applied Sciences Weihenstephan-Triesdorf, 85354 Freising, Germany
4
Department of Geoinformatics—Z_GIS, University of Salzburg, Schillerstr. 30, 5020 Salzburg, Austria
5
Department of Forest and Wood Science, Stellenbosch University, Private Bag X1, Matieland 7602, South Africa
*
Author to whom correspondence should be addressed.
Remote Sens. 2022, 14(13), 3205; https://doi.org/10.3390/rs14133205
Submission received: 7 June 2022 / Revised: 28 June 2022 / Accepted: 2 July 2022 / Published: 4 July 2022
(This article belongs to the Section Forest Remote Sensing)

Abstract

:
In recent years, technological advances have led to the increasing use of unmanned aerial vehicles (UAVs) for forestry applications. One emerging field for drone application is forest health monitoring (FHM). Common approaches for FHM involve small-scale resource-extensive fieldwork combined with traditional remote sensing platforms. However, the highly dynamic nature of forests requires timely and repetitive data acquisition, often at very high spatial resolution, where conventional remote sensing techniques reach the limits of feasibility. UAVs have shown that they can meet the demands of flexible operation and high spatial resolution. This is also reflected in a rapidly growing number of publications using drones to study forest health. Only a few reviews exist which do not cover the whole research history of UAV-based FHM. Since a comprehensive review is becoming critical to identify research gaps, trends, and drawbacks, we offer a systematic analysis of 99 papers covering the last ten years of research related to UAV-based monitoring of forests threatened by biotic and abiotic stressors. Advances in drone technology are being rapidly adopted and put into practice, further improving the economical use of UAVs. Despite the many advantages of UAVs, such as their flexibility, relatively low costs, and the possibility to fly below cloud cover, we also identified some shortcomings: (1) multitemporal and long-term monitoring of forests is clearly underrepresented; (2) the rare use of hyperspectral and LiDAR sensors must drastically increase; (3) complementary data from other RS sources are not sufficiently being exploited; (4) a lack of standardized workflows poses a problem to ensure data uniformity; (5) complex machine learning algorithms and workflows obscure interpretability and hinders widespread adoption; (6) the data pipeline from acquisition to final analysis often relies on commercial software at the expense of open-source tools.

1. Introduction

Extensive ground surveys serve as a valuable pool for indicators of tree and forest health. Since these are extremely labor and cost intensive, their implementation is limited to the plot level. To obtain information at regional scales, individual plots must be aggregated. Detailed information at this intermediate level is often missing but is needed to extend monitoring to larger areas using remote sensing (RS) techniques [1,2]. A gap has formed between in situ ground observations and traditional RS platforms. This review analyzes the literature related to the emerging field of UAV-based forest health monitoring (FHM) to evaluate its suitability to fill this gap.

1.1. UAV Remote Sensing: An Emerging Tool in Forest Health Monitoring

To assess the severity and the spatial extent of the consequences of tree stress, FHM is necessary. Timely knowledge of forest health decline might enable forest management to mitigate or reduce the damage to the forest (e.g., pest treatment, fire prevention) as well as to the ecosystem services attached to it (e.g., timber production, drinking water purification) [3,4].
Long-term in situ monitoring of forest health has been carried out already for several decades at local, regional, and global scales in which standardized forest health indicators have been included [5]. In the process, typically ground-truth information is collected by trained forestry staff that indicates an external state of health or damage. A common procedure is the estimation of the loss of needles and leaves, which is recorded in 5% intervals based on site-specific example trees [6,7]. The ICP Forest program is a European collaboration of 42 participating countries and provides a standardized framework for the assessment and monitoring of forests in Europe and beyond [8]. They act on two different intensity levels, namely, level-1 monitoring, which includes 5714 inventory plots (as of 2020) based on a systematic grid throughout Europe to assess temporal variations of the forest condition, and the level-2 monitoring, which investigates 623 plots (as of 2018) to identify cross-correlations between environmental factors and the responses of forests in selected ecosystems [9]. For a detailed overview of other national and international in situ FHM programs, please refer to [5].
A high degree of uncertainty is to be expected of in situ ground surveys as the quality depends on the experience and the subjective individual perception of the observers. Given that these are logistically complex, time-consuming, cost and labor-intensive ground surveys, only feasible at the plot-scale [10], it is not surprising that remote sensing (RS) has established itself as a part of FHM and its research and has made major contributions to this application field [5,11,12,13,14]. RS enables the acquisition of forest health indicators based on spectral or structural features derived from sensor data in an objective, quantitative, and repetitive manner at multiple spatial scales [12].
Unmanned aerial vehicles (UAVs), sometimes referred to as drones or unmanned aircraft (UA), are remotely piloted carrier platforms and are increasingly being used as RS tools in various forestry applications [15,16]. The terms unmanned aircraft system (UAS) and, less frequently, remotely piloted aircraft system (RPAS), considering the UAV as part of an entire operating system, including the equipment needed to control it remotely, have been widely adopted [17]. Important to note is that the Department of National Defence and Canadian Armed Forces (DND/CAF) has exchanged the term “unmanned air vehicle” to “uncrewed air vehicle” to ensure a gender neutral terminology [18]. Other nations should consider a similar approach. Following this example, we have adopted the terms “crewed” and “uncrewed” in the remainder of this review.
Satellite-based RS still dominates forest health research. The most frequently used data are publicly accessible imagery such as Landsat, MODIS, and Sentinel [19]. The large area coverage makes satellites valuable tools at multiple scales. Nevertheless, both the temporal and spatial resolution of satellite RS for monitoring forest ecosystems are sometimes insufficient and reach the limits of feasibility [20]. This is particularly the case when biotic or abiotic factors trigger responses that lead to rapidly changing processes in forests and thus detrimentally affect forest health [21,22]. In such cases, up-to-date and regularly acquired information becomes a key requirement [23]. Besides timeliness, a very high spatial resolution is also critical in sustainable forest management [24].
In theory, crewed aircraft can meet these requirements. In practice, though, safety issues, logistical limitations and very high costs make them viable only for relatively large areas [25]. It is precisely in this niche in forestry where drones are increasingly used and are therefore seen less as a competitor than as a complementary technology to existing traditional Earth observation platforms [26]. While inferior to satellites and crewed RS platforms in terms of area coverage, they are unrivaled in spatial resolution, cost-efficiency, flexibility, and frequent revisit times, provided the area of interest is relatively small in size [27]. Common area coverage ranges from one hectare to several square kilometers in a single flight. The exact area coverage depends on the UAV type, propulsion technology (electricity/fuel), camera type, and other circumstances, such as rugged terrain (mountainous regions) or accessibility. A comparison of crewed aircraft and UAVs distributed by spatial resolution, costs per m2 and area coverage can be seen in Figure 1. In addition, the regulations of UAV operation of the respective country need to be considered, which can limit the maximum allowed flight height above ground level and thus also may influence the possible area coverage.

1.2. UAV Types and Sensors for Forest Health Monitoring

UAVs can generally be controlled manually and perform predetermined flight missions autonomously. For a general UAV workflow for data acquisition see Figure 2.
The platforms themselves come in various sizes (small, mini, and micro) and shapes, with maximum take-off weights (MTOW) most likely below 30 kg [28] due to legal requirements that make operation above the MTOW complicated and cumbersome [29]. Flight times vary depending on weather conditions, payload, battery power or engine fuel, and UAV type and vary from a few minutes to several hours [30]. With typical ranges not greater than 10 km [17], the legally possible capacity can usually be exhausted, as flying beyond the visual line of sight (BVLOS) is not permitted in many countries. Fixed-wing, rotary-wing, and hybrid solutions represent the major platform types that have prevailed for recent forestry applications [16]. The former has the shape of an ordinary airplane with rigid wings and benefits from its aerodynamic shape to optimize cruise efficiency. This allows it to maximize flight duration and, thus, larger areas can be covered [31]. The main drawback is that fixed-wing models require large and flat take-off and landing locations without higher obstacles [32], which can pose problems, especially in forested terrain. Moreover, operators must consider that this platform type needs a constant forward motion with a minimum speed to get sufficient air buoyancy. This could lead to motion blur, which adversely affects image quality [33].
Rotary-wing drones are most frequently embodied by multirotor models propelled by four, six, or up to eight rotors [17]. Single-rotor models (helicopters) are still being used in a few cases [34]. Multirotor UAVs are capable of vertical take-off and landing (VTOL) are much more maneuverable and responsive, allowing operators to launch even in locations with constrained space. They are easier to handle and are generally more versatile in their applications [35]. The ability to fly slowly around objects or hover in place opens up additional applications such as data capturing for fine three-dimensional modeling where detailed multiview side images are necessary [15,36,37]. However, all of this comes at the expense of higher energy consumption [38]. Hence, only small areas are feasible with a multirotor drone compared to its fixed-wing equivalent. Even if more expensive, hybrid VTOL fixed-wing solutions alleviate the problem of the need for large take-off and landing areas [30], which makes them particularly interesting for forestry applications. These platforms combine rigid wings and multiple rotors that enable VTOL operation and typically transition from hover to cruise mode and back at safe altitudes. Once in the cruise mode, these UAV types benefit from the same advantages as ordinary fixed-wing models. Figure 3 shows UAV types commonly used in the forestry sector.
Technological innovations and developments have led to the increased use of UAV-RS. Contributing factors include (1) cheap, light, and miniaturized off-the-shelve UAVs and payloads [27], (2) the development of sophisticated image-matching algorithms such as semi-global matching (SGM) [39], which have paved the way for faster and more robust structure from motion (SfM)-based photogrammetry software [40], and (3) continued increases in computer capacity that made image matching feasible [41]. The emergence of SfM has enabled practitioners to produce their own georeferenced data products by using simple digital cameras [42]. In combination with UAVs, they become a powerful RS tool as a scale-appropriate application. In drone-based FHM, SfM photogrammetry provides 2D spectral data of tree crowns and corresponding 3D information that help to quantify biochemical leave compositions and structural attributes to draw conclusions about the tree’s health status [21].
Typical payloads are mainly represented by optical sensors [43]. They range from consumer-grade RGB cameras to professional multispectral, hyperspectral, and thermal cameras, which all belong to the category of passive sensors. Less frequent but by no means less important, active sensors such as light detection and ranging (LiDAR) are also being applied. Figure 4 shows examples of typical sensors for UAV application for FHM.
RGB cameras capture visible light approximately within the 400–700 nm band of the electromagnetic spectrum. Depending on the sensor and focal length, subdecimeter spatial resolutions can be achieved even from relatively high altitudes above ground when attached to drones [44]. It is common practice in RS to separate color channels to work with the individual bandwidths [45], for example, using different types of filters [46]. This allows the mathematical combination of color channels to derive band ratios that improve feature detection and provide foresters with valuable information [27]. Regarding vegetation analysis, additional bandwidths that reach beyond the visible light, such as near-infrared (NIR), are increasingly favored due to their higher sensitivity to plant pigmentation (e.g., chlorophyll and carotenoid content). Multispectral sensors consist of several separated bands (e.g., blue, green, red, red edge, NIR), usually covering the 400–1000 nm band of the electromagnetic spectrum. This allows the calculation of advanced vegetation indices that contribute to stress analysis and the evaluation of forest health [26]. Hyperspectral sensors can take the analysis of vegetation properties to a whole new level. They can cover similar spectra as multispectral sensors but significantly differ in band numbers and widths. Some consist of hundreds of narrow bands representing the electromagnetic spectrum in a much more detailed manner [47]. Thermal imaging sensors perceive emitted radiance typically between 7500 and 13,500 nm. Assuming an accurate calibration, pixel values can reliably be converted into temperature [25]. Due to technical limitations of optical sensors, the number of narrow bands of multispectral and hyperspectral cameras is coming at the expense of a lower spatial resolution [48,49]. To overcome this problem, pansharpening has become a widely used technique in RS with a variety of different pansharpening algorithms [48,49,50]. In the process, multispectral or hyperspectral imagery is merged with higher spatial resolution panchromatic imagery while preserving the multispectral/hyperspectral sensors’ spectral information and the geometrical detail of the panchromatic imagery [51,52,53]. Today, UAV-based imagery is also used to enhance the spatial resolution of satellite imagery [54,55]. Manufacturers that build specialized cameras for drones even started to supplement their multispectral cameras with panchromatic bands to enhance the spatial resolution using pansharpening techniques [56].
The group of active sensors includes, e.g., LiDAR systems. LiDAR detectors send active laser pulses in the NIR spectrum to scan the environment. The signals are backscattered by the objects (e.g., canopy and/or ground), and part of the transmitted energy returns to the sensor. The elapsed time between transmission and reception is recorded and combined with positional information, resulting in detailed point clouds containing intensity and elevation measurements [32]. Important forest health indicators such as tree crown density, pattern distribution, or structural changes over time can be derived from LiDAR-based point clouds and indicate defoliation [57,58,59] or changes in crown architecture [60]. Besides FHM, these sensors are used in various other forestry applications using drones. The 3D reconstruction of trees using RGB imagery [15] or LiDAR-based solutions [61] allow estimations of inventory parameters such as diameter measurements [62] and tree heights [63] and tree species [64], which in turn enable above-ground biomass calculations [65,66]. Furthermore, other structural information such as forest canopy gaps can be retrieved [67]. Instead, multispectral and hyperspectral sensors’ broad spectral resolution is rather used for complex vegetation properties such as chlorophyll content [47] or tree species recognition [68,69], but they are also useful tools for applications similar to those mentioned for RGB cameras. Thermal sensors are often used for wildlife [70] and forest fire [71,72] detection.

1.3. The Importance of Forest Health

According to the United Nations (UN), more than 80% of all land mammals, birds, insects, and plants inhabit forests. It is estimated that about one-third of humanity directly depends on forests and their products [73]. Forests provide essential ecosystem services and ecological functions, e.g., to meet social needs such as recreation, education, and conservation, as a source of fuel and wood, for water purification, for erosion control, and climate regulation through carbon storage [23,74,75]. Besides anthropogenic pressures from timber harvesting, land use, and pollution, forests are also exposed to an array of abiotic (extreme temperatures, droughts, fire, storms, snow, and ice) and biotic (e.g., pests and diseases) stressors. Moreover, some of these stress agents are likely to interact and are further exacerbated by ongoing climate change [76]. Seidl et al. [77] concluded that warmer and drier climate leads to a favorable environment for fire, droughts, and insects, whereas warmer and wetter conditions foster storms and pathogens. As healthy forests are more robust and resilient to disturbances, it is critical to maintain and bolster their key functions [1,11].
The term forest health cannot be defined unambiguously, as it reflects values from social, economic and ecological considerations [78]. Lausch et al. [11] provide an overview of a range of definitions of forest health. Within the scope of this review, forest health is defined as the absence or presence of symptoms caused by biotic and/or abiotic stressors at the individual tree scale. Hence, the severity of tree damage is measured by quantitatively collected crown features attributable to biotic and/or abiotic stress agents. Regardless of the causative factor, trees may show different internal and/or external symptoms. They are caused by stress-induced physiological and morphological responses of trees as a process of acclimation to environmental changes in an attempt to compensate for the loss of productivity [79]. These phenomena can be observed spectrally and structurally at different levels. In the early stages of stress, indistinct (previsual) changes in pigmentation composition of leaves (e.g., chlorophyll and carotenoid) are caused by a change of activity of biochemical processes. For example, less activity in photosynthesis may occur [80]. These subtle symptoms are typically not visible to the human eye [81]. In advanced stages, prolonged exposure to stress can cause irreversible damage, including discoloration, wilting, defoliation, and eventually lead to the tree’s death (see, e.g., [82,83,84]).

1.4. Objectives, Limitations, and Review Structure

This review is intended to provide a comprehensive overview of the application of drones as an emerging tool for FHM over the past decade (2012–2021). It represents a selection and systematic analysis of the peer-reviewed literature related to the UAV-based detection of biotic and abiotic stressors, including tree mortality, and reveals early efforts towards UAV-based FHM. The goal is to uncover trends, research gaps, recent advances, technical challenges, and synergies to other applications or RS platforms. This review is intended to facilitate, for example, the design of experiments or acquisition strategies and the selection of appropriate measurement tools to detect specific stressors. Relevant literature is listed in a structured manner so that problems or shortcomings that have already been encountered can be addressed directly. Note that papers regarding the extensive topic of UAV-based forest fire detection were explicitly limited to the use of drones to assess forest health (damage and burn severity) following postfire events. This review is addressed to researchers, forest managers, and practitioners who are key drivers in advancing UAV-based forest health research and serves as a resource of ten years of relevant science to support their ambitions.
The organization in the remainder of this paper is as follows: Section 2 documents the creation of the literature dataset, its filtering, and categorization according to technical information and the causative agents of tree stress. In Section 3, results of the analyses are presented. In Section 4, the results are discussed, and technical issues addressed by the authors of the literature dataset are compiled. In Section 5, the main outcomes are finally summarized, and a conclusion is drawn.

2. Materials and Methods

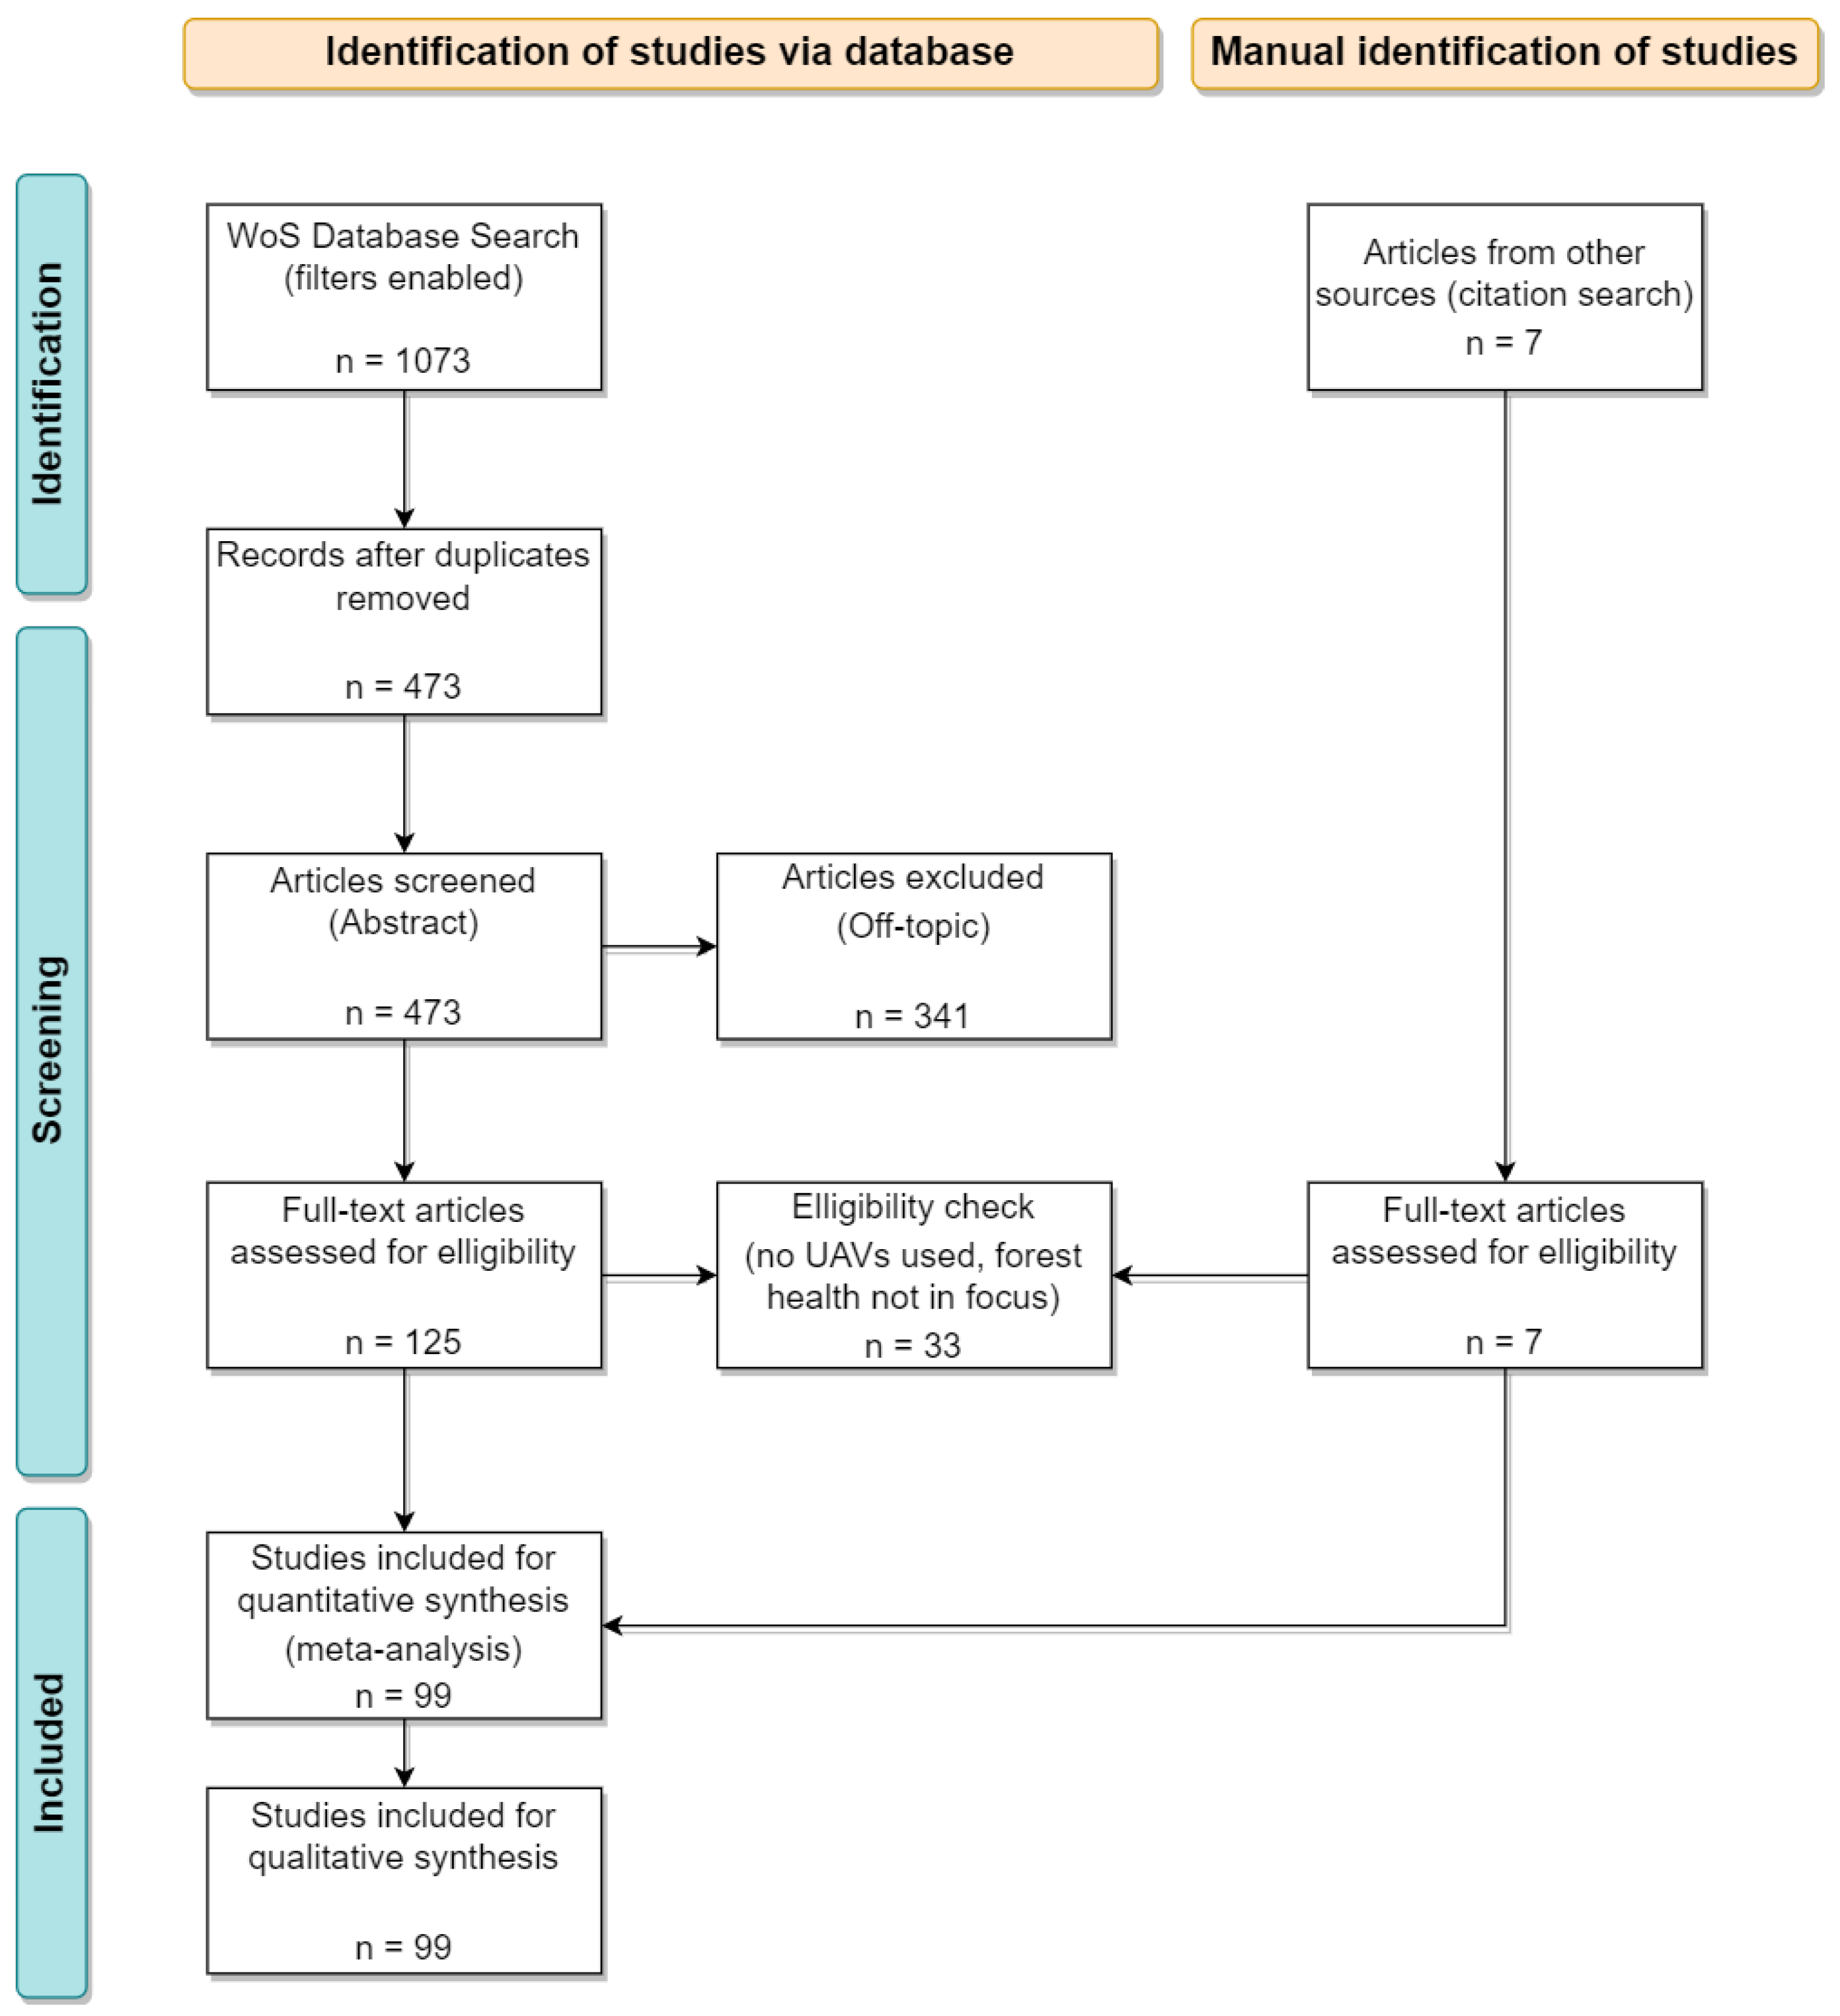
2.1. Literature Search, Filtering, and Information Extraction

This subsection documents the dataset creation and the criteria the articles must meet to be included. The Web of Science (WoS) search engine was used to filter the appropriate literature to create a literature database. In order to narrow down the search, the criteria were chosen to be a combination of relevant terms or abbreviations describing the uncrewed carrier platforms, generic terms representing the field of forest science as well as keywords frequently being used in the specific application area of forest health RS. The search scope was further extended by the search operator “*” that can be attached to the keywords to retrieve other related words with variant zero and multiple characters (e.g., the keyword “disease*” includes diseased, diseases, etc.). Consequently, the combination of keywords covered [“uav”, “uas”, “rpas” OR “drone”] AND [“forest”] AND [“stress”, “disease”, “pest”, “health”, “defoliation”, “dead”, “disturbance”, “infest”, “infect”, “insect”, “pathogen”, “damage”, “drought”, “abiotic”, “decline”, “severity” OR “mortality”]. The main search was limited to the period from January 2010 to December 2021 to see if there had been any earlier publications. However, the earliest publication found that met the selected criteria was from 2012. The search descriptors were entered in a common “Topic Search” to reduce the searchable fields to title, abstract, and keywords. Additionally, WoS-internal filters were activated to extract articles, proceedings papers, and book chapters in the English language only. The bibliographic dataset filtered as described was imported as a text file for further processing. Based on the unique WoS-ID, duplicates were removed using a Python script. By reading the titles and, where not explicitly clear, the abstracts, obviously off-topic papers were manually discarded. The remaining literature was downloaded and read in full. During the research, seven additional scientific papers were added that were not listed in the WoS directory or were not included in the keyword entry but were found to be relevant by the authors. A total of 99 research papers were finally considered relevant to the review’s topic. The full list including all authors can be found in Appendix A. Data handling, statistics of extracted information and results visualization was done via Python. A flowchart of the approach of the database search can be seen in Figure 5.

2.2. Dataset Structuring

This subsection describes the approach to structure the extracted information from the gathered literature. Once all papers had been read, an information extraction was performed in a two-step procedure. In the initial step, an overview table was created to list general information about authors, title, journal, publishing year, citation count, and a short summary of the content. The purpose of the table was to provide the authors of this review with an overview of the entire literature dataset and a first rudimentary summary of the content of the articles to ease a topic-specific assignment. Additionally, the overview table was used to sort the articles in descending order by year of publication to facilitate a systematic analysis and a more detailed information extraction. In a second and more extensive step, technical and strategic details on UAV and sensor type, flight parameters and revisit times, radiometric and geometric calibration techniques, data products, and data analysis methods were retrieved from the research papers. A particular focus was placed on information related to UAV-mounted sensors, complementary data from other sources, and machine learning algorithms for image detection and classification. Moreover, a comprehensive set of details on nontechnical information regarding forest health, tree species, and stressors described in the papers were extracted. This information was then separated into two main subjects:
  • Technical and Strategic Information
    Technical details and strategic approaches common to all papers were subdivided into data acquisition, data processing, complementary data, and data analysis techniques with a focus on machine learning algorithms for image classification.
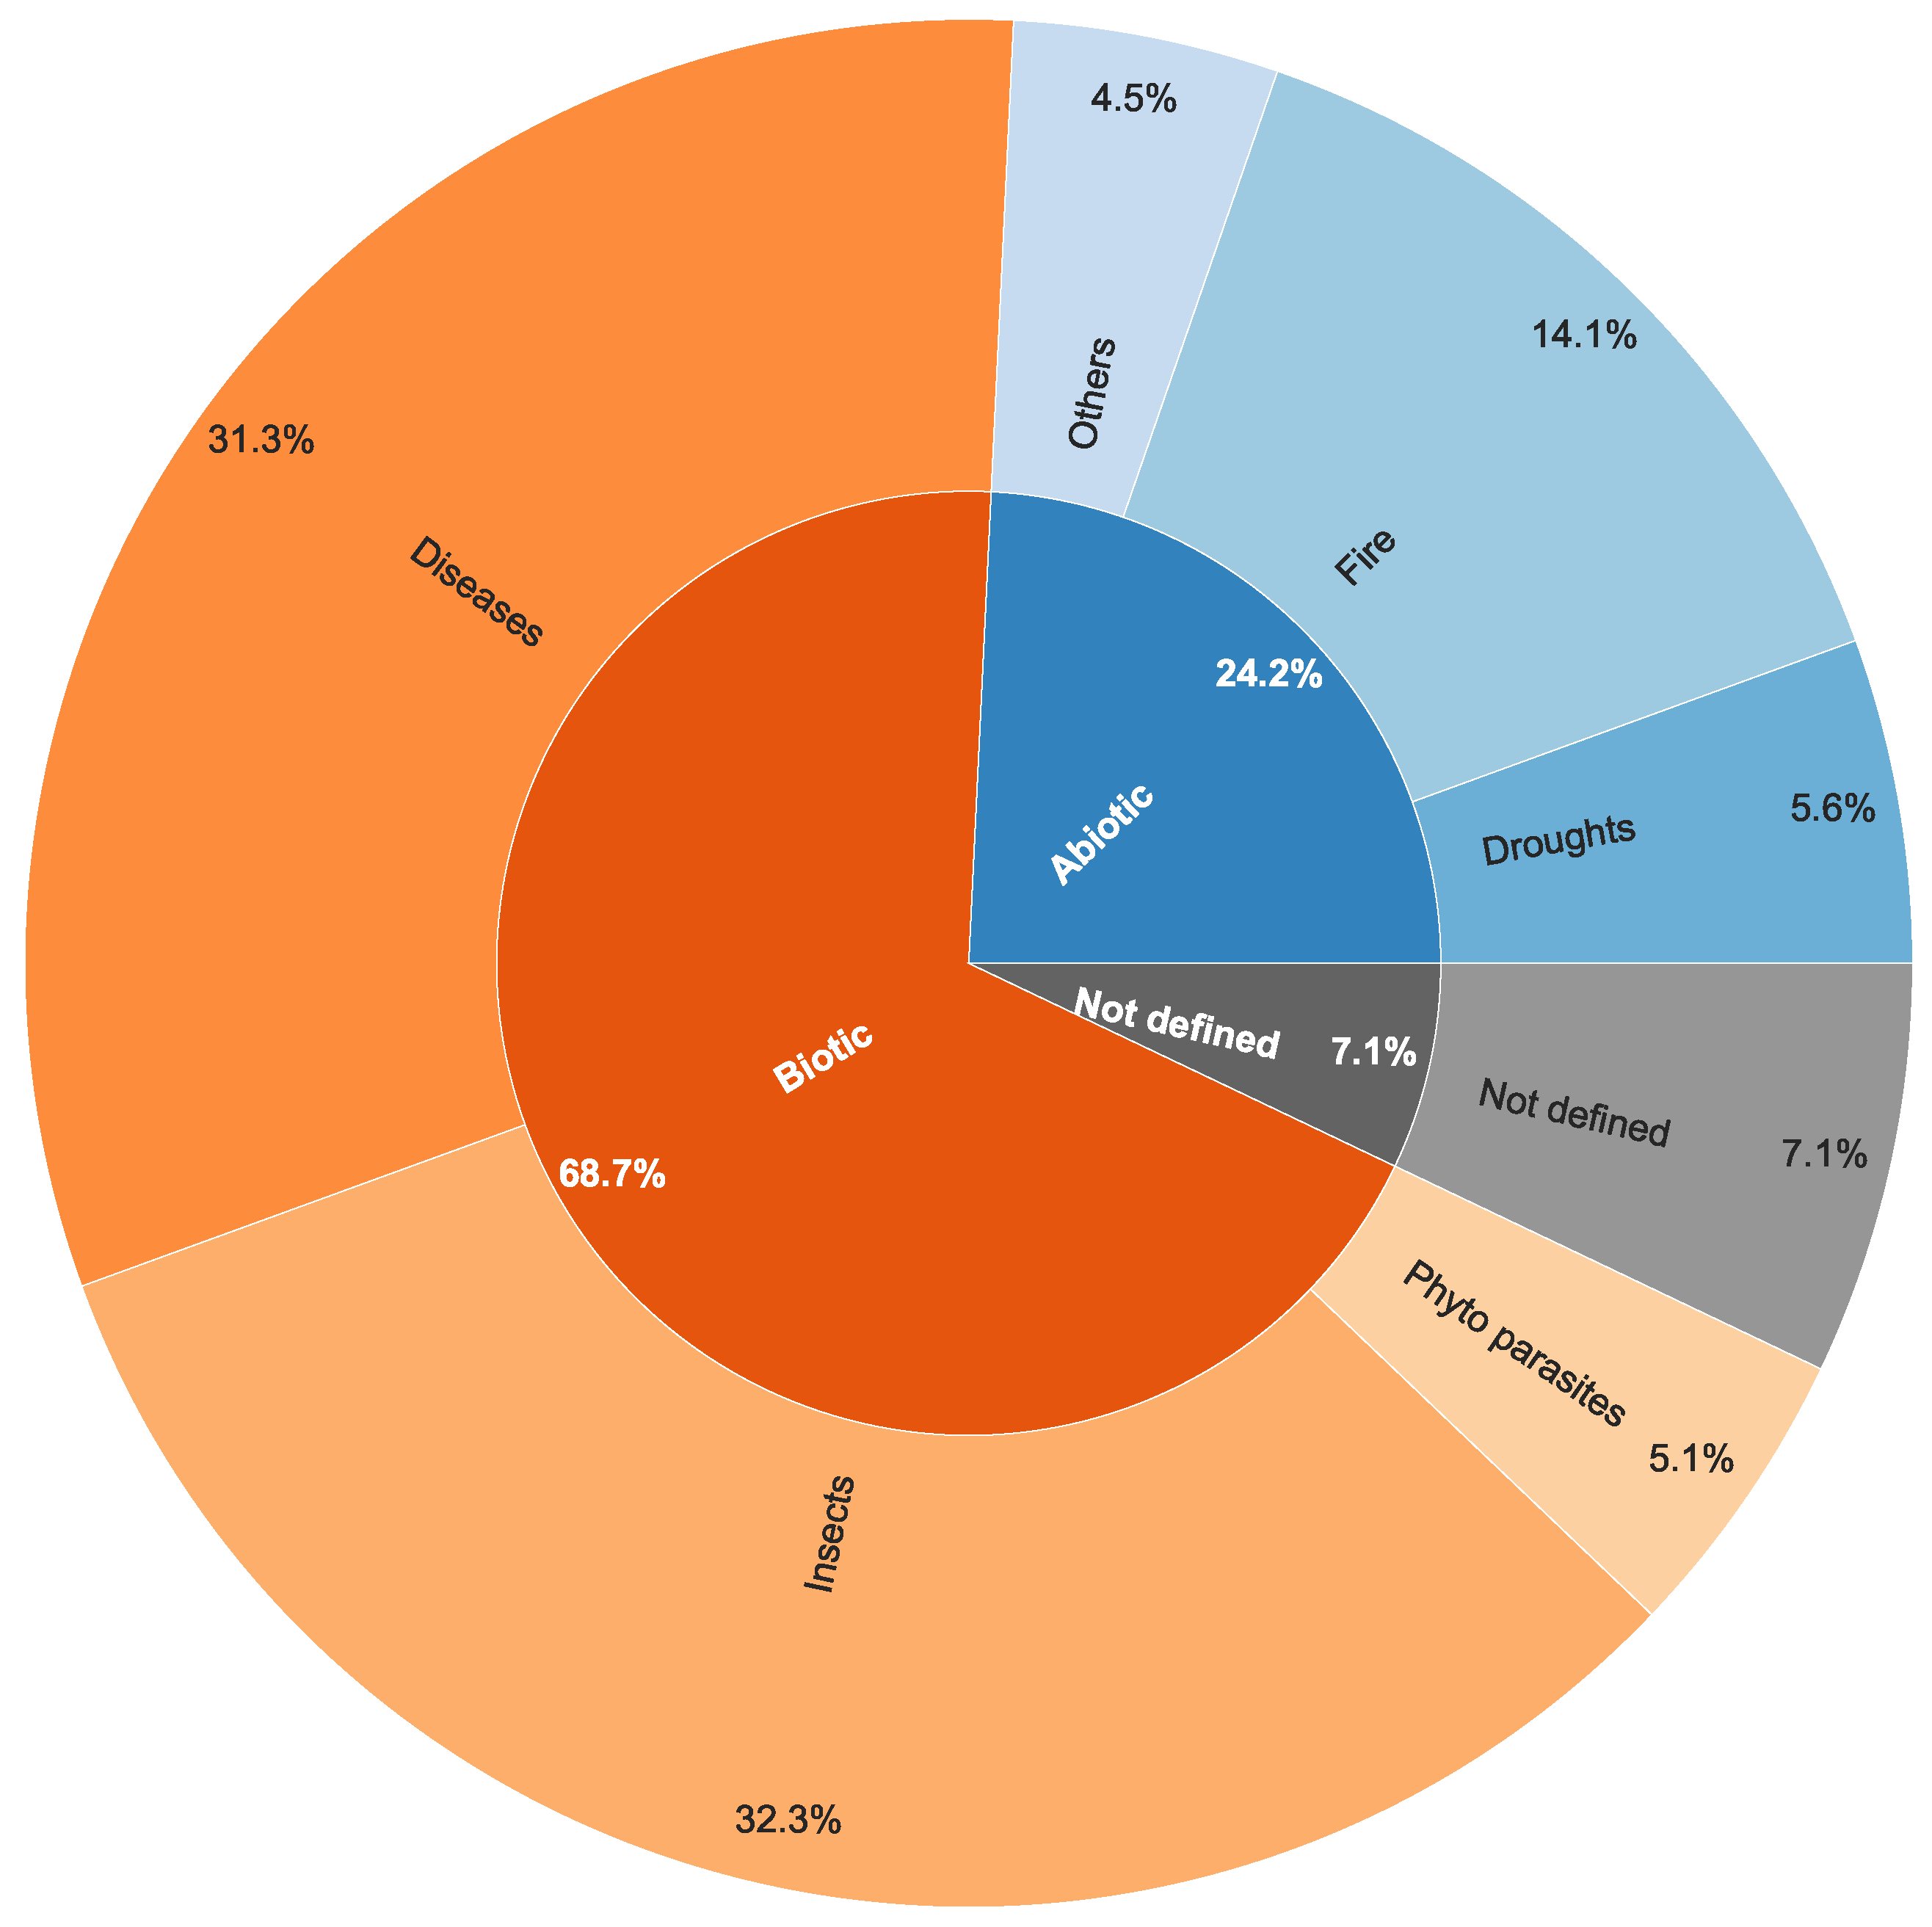
  • Investigated Tree Species and Biotic and Abiotic Stressors
    Information on investigated tree species and biotic and abiotic stress agents were summarized. Based on these details, the peer-reviewed papers were categorized into three main topics: (1) biotic stressors, (2) abiotic stressors, and (3) unknown/stress in general. Details on biotic stressors were further split into insects, diseases, and phytoparasites for clarity. Abiotic stressors were organized together due to the limited data. If the causal target stressors were unknown or not specified, they were grouped as unknown/stress in general. Papers in which the authors identified multiple stressors were listed in their respective categories or subcategories for completeness.

3. Results

This section describes the analysis of the previous information extraction from all collected works. Details regarding technical and strategic information on drone data collection, data processing, complementary data from other RS platforms, and data analysis techniques are documented. Biotic and abiotic stressors are then examined, and the tree species that are primarily affected are discussed.
Even though the literature search included publications from 2010, the first paper relevant to the subject of UAV-based FHM was published in 2012 [85]. A trend analysis of the peer-reviewed papers on UAV-based FHM can be seen in Figure 6. The most significant increase in articles occurred between 2017 and 2018, from 5 to 18 publications, respectively. Since then, the number of papers has been at a higher level with a continuing upward trend, peaking in 2021 with a total of 24 publications.

3.1. Technical and Strategic Information Extraction

3.1.1. Data Acquisition: UAV Types, Sensors, Flight Planning, and Monitoring Strategies

Mainly multirotor systems were used as carrier platforms (77 papers). Some researchers (18 papers) used fixed-wing UAVs. In two studies, both multirotor and fixed-wing systems were applied, with the latter to achieve a more extensive area coverage [86,87]. A detailed comparison of the different platform characteristics was not considered. In one study, a single-rotor helicopter was applied [34].
A trend analysis of sensors attached to UAVs in the reviewed papers can be seen in Figure 7. In five studies, RGB cameras were modified with a filter to cover the NIR range of the electromagnetic spectrum [88,89,90,91,92]. For simplicity, such cameras were considered multispectral sensors. The more commonly used passive sensor combinations RGB and multispectral and RGB and hyperspectral were separately grouped. The latter also involved papers where the combination consisted of other additionally used cameras. All other passive sensor combinations were grouped into sensor combination (passive). Papers in which active and passive sensors were utilized were grouped into sensor combination (active and passive). The most commonly used sensors included RGB and multispectral cameras, which accounted for 90% of the whole dataset and were often used in combination or less frequently combined with other passive and active sensors. Along with the surge in publications, the number of sensors used of course also increased rapidly in 2018. However, the variety of sensors and their combination was clearly growing as well. Hyperspectral cameras have been applied more frequently since 2018, and LiDAR sensors since 2019. Nevertheless, RGB and multispectral cameras have dominated the use cases since 2017. The least represented sensors were thermal and gas sensors, with the latter only recently being used in a single study [93]. In about one-third of the studies, multiple sensors usage was described, and most often, the sensors were attached simultaneously to the same UAV. One study stood out, in which four cameras were mounted on the platform, including two oblique RGB, one multispectral (including thermal), and one hyperspectral camera [94]. In all but two studies [93,95], passive sensors were used.
Information about flight parameters, acquisition time, and weather conditions during the flight campaigns, if available, were also analyzed. It showed that, on average, relatively high image overlaps (80% front and 70% side overlap) were applied and a flight altitude of about 120–160 m was usually planned. The mean ground sampling distance (GSD) of RGB, multispectral, and hyperspectral sensors over the entire dataset was about 4 cm, 10 cm, and 25 cm, respectively. Weather conditions during data acquisition were mostly described as sunny, with low winds flown within one to two hours around the solar zenith. Some authors presented a calibration workflow under varying illumination conditions and pointed out problems during image processing with changing weather characteristics [92,94,96].
In 24 studies, multitemporal data with varying revisit frequencies were obtained. Repetitive UAV surveys of the same area were designed to collect time series as a database for change analysis. Hence, the scientists analyzed spectral and structural changes over time to assess mechanical crown damage [97,98], fire damage based on pre- and postfire data [99,100,101], phenological differences [89], and different stages of stress-induced symptoms evident in the tree canopy [92,94,102,103,104,105,106,107,108,109,110,111,112]. The primary period of FHM typically lay within the growing season. In some cases, data acquisition was carried out not only during the summer (leaf-on) but also in the winter (leaf-off) season to optimize the detection of the evergreen mistletoe (Viscum album) [113]. Others used the opportunity to get a clear view of the ground, enabling the creation of an improved photogrammetric digital terrain model (DTM) [114]. Only in six papers was the collection of UAV data over a period of more than a year described [97,98,105,106,108,115]. The longest and most comprehensive time series covered five years of monthly drone flights to study the influence of heavy rain events on tree fall and branch fall rates [97].

3.1.2. Data Processing: Data Products, Radiometric/Spectral Calibration, and Georeferencing

In most of the reviewed papers, researchers generated RS products from systematically acquired drone imagery and less frequently from UAV-based LiDAR metrics. The products included SfM-based or LiDAR-derived point clouds, which in turn served as the basis for digital surface models (DSMs), digital terrain models (DTMs), as well as canopy height models (CHMs), the latter representing tree heights by subtracting the DSM from the DTM. The orthomosaic is by far the most widely used product when deploying imaging sensors, particularly in spectral analysis for assessing the health of trees. In some cases, spectral data were enriched with structural information derived from point clouds, DSMs or CHMs based on either LiDAR [116,117,118] or image data [96,102,119,120], further improving classification results. In a few papers, the raw drone images were directly analyzed without further processing [44,108,121,122,123,124,125,126]. To create photogrammetric products, the researchers predominantly implemented commercial SfM software such as Agisoft Metashape (Agisoft LLC, St. Petersburg, Russia) and Pix4D (Pix4D S.A., Lausanne, Switzerland). SfM is able to create a point cloud with true 3D information for the points from multiple overlapping images, similar to that one obtained from LiDAR. According to Iglhaut et al. [21], there are three critical stages of SfM:
  • Feature detection and matching of the corresponding key points in overlapping imagery;
  • Performing bundle adjustments to estimate intrinsic (e.g., focal length and lens distortion) and extrinsic (pose) parameters of the camera to compute a sparse 3D point cloud;
  • Multiview stereo matching to generate a dense point cloud of the scene. Through interpolation of the point cloud, rasterized spectral (orthomosaic) and structural data (DSM, DTM) can be generated for cell-wise statistical analysis.
To ensure radiometry uniformity across pixels and time, radiometric calibration needs to be performed prior to the SfM process [26]. This is recommended to compensate for changing illumination conditions and to generate consistent orthomosaics to maintain comparability [127,128]. In about 45% of the reviewed papers, a radiometric calibration process was described exclusively if multispectral, hyperspectral, or thermal cameras were used. The researchers mainly took reference images of single or multiple reflectance targets in the field, with known or directly measured reflectance values across the spectrum of light, typically using the empirical line method (ELM) for calibration during image postprocessing. Occasionally, the target information was enhanced with irradiance values taken from light sensors attached to the UAV [22,94,109,120,123,129,130,131,132], which were sometimes also used as the only calibration source [87,99,110,133]. In another study, the total incoming irradiance was simulated using data from a sun photometer [85]. Klouček et al. [92] implemented flat field corrections due to absent calibration measurements. Some researchers employed additional calibration strategies as illumination conditions changed during ongoing UAV flights. These included histogram matching [123] and radiometric block adjustment [34,94,134]. Moreover, the bidirectional reflectance distribution function (BRDF) was modeled to account for disturbances caused by the object reflectance anisotropy [134,135]. In contrast, thermal cameras were calibrated against a thermally controlled flat plate blackbody radiation source under laboratory conditions [136,137]. Intracrown illumination variability was treated with shadow removal techniques to reduce adverse effects on further spectral analysis. To separate shaded from sunlit pixels, histogram thresholding [138], index thresholding [129], and fractional selection of the brightest pixels within the crowns were performed [94,96,134,135]. Lin et al. [116] proposed an interesting approach to extract the shadow distribution of tree crowns in a three-dimensional manner based on a LiDAR point cloud and a 3D radiative transfer model.
During the SfM process, the data can be georeferenced based on positional information of the aircraft or reference targets. In fact, in more than 43% of the reviewed papers, the deployment of ground control points (GCPs) was described to georeference the UAV-based data products accurately. It is important to note that since 2019, there has been an emerging trend towards direct georeferencing using differential GNSS (D-GNSS) modules onboard UAVs. That enables a direct or postprocessed positional correction using real-time kinematic (RTK) or postprocessed kinematic (PPK) solutions. Two papers from 2019 [99,139], two from 2020 [94,140], and five from 2021 [100,112,130,141,142] substantiate this recent trend. Furthermore, other reference sources were used for geometric correction. Liu et al. [140], for example, used another UAV model equipped with a D-GNSS to create highly accurate RGB orthomosaics, which in turn were used for the coregistration of the hyperspectral orthomosaics taken with the other drone, while Otsu et al. [143] georeferenced their UAV data based on Landsat imagery.

3.1.3. Complementary Data: Fieldwork and Traditional Remote Sensing Platforms

In more than 75% of the reviewed papers, terrestrial field data collection, usually for ground truth purposes, was documented. Mainly topic-specific observations were described regarding the health status of trees. Notably, the presence of specific stressors and the severity of their impact were evaluated. The crown is most commonly the primary indicator to estimate tree condition. Visible symptoms such as discoloration, wilting, defoliation, and mechanical damage were registered, in some cases also the occurrence of lianas [144,145]. Other commonly surveyed data were basic inventory metrics (tree height, DBH, crown diameter and shape), tree species, tree locations, and GCPs. At the stem level, less pronounced symptoms confirmed the suspected stressors. They were also used to assess early stages (e.g., “green attack”) of affected trees that cannot clearly be identified by observing the tree crown. For example, trees were examined for signs of early bark beetle infestations (resin flow, entrance holes, and boring dust) [90,120,130] and in doubtful instances also by removing the bark to expose potential egg galleries in the phloem [96].
Moreover, needle or leaf samples were taken to identify the presence of nematodes [106,142,146], to quantify pigments under laboratory conditions [85,105], and to assess their water content and spectral properties [123,136]. Soil sampling was conducted to determine possible origins of nutritional deficiencies [109] and to measure the field capacity [147]. Ground-based photographs were taken to calculate canopy cover [148], for the documentation of weather conditions [137], and for an improved categorization of pest infestation [44,118,142,146], disease [122], and fire [149] severity classes. Smigaj et al. [136] collected data from intratrunk water flow, canopy temperature, soil moisture, and incident and reflected light using an array of sensors. Other measurements were undertaken to derive ring widths [150], stomatal conductance [147], the presence of root rot [94], as well as gas exchange and fluorescence at the leaf level [105].
In 19 articles, data products from other RS platforms were incorporated to enrich the data pool. The researchers mostly relied on optical satellite data and aircraft-based LiDAR. Regarding satellite imagery, open-source data from Landsat and Sentinel were favored, but commercial providers such as QuickBird, SPOT6, and RapidEye were also used. For brevity, only a few articles were referenced, and the differences in synergies between UAV data and other RS sources were summarized. In some of the articles, the interpretation results of UAV-based data and from other RS platforms were solely used for the comparative analysis. Regarding satellites, Pádua et al. [151] investigated the complementary use of Sentinel-2 and drone imagery for postfire monitoring, while Dash et al. [104] incorporated RapidEye imagery to detect physiological plant stress. RS products from aircraft and drones were used to compare SfM-derived elevation information [152] and to evaluate their feasibility for FHM in vast boreal forests [96].
Beyond comparison, Viedma et al. [95] crossed Sentinel-2-based fire severity rates with UAV-based LiDAR point clouds to improve tree-level interpretation using structural information to additionally distinguish between canopy, midstory, and ground fires. In other studies, UAV-based data were used to calibrate models to exploit the added value of multiscale approaches further. Landsat data were calibrated with drone imagery to detect physiological plant stress [143] and to evaluate fire severity [149]. Campbell et al. [153] combined UAV-based RGB imagery with airborne laser scanning (ALS) data to calibrate Landsat imagery and scale up local estimates of tree mortality to larger areas. In one study, imagery from satellite and UAV were combined to densify a time series to monitor mangroves damaged during a winter freeze event [98]. Data fusion was also applied to normalize SfM-based DSMs using elevation models from ALS [89,134,137,152,154]. It is important to note that more elaborate data fusion techniques such as pansharpening were not found to be used in the literature dataset.

3.1.4. Data Analysis: Image Segmentation and Machine Learning Techniques for Image Classification

In about 44% of the reviewed articles, specific algorithms were implemented for automatic tree detection and image segmentation before classification tasks. The researchers utilized commercial software such as eCognition Developer (Trimble Geospatial, Westminster, CO, USA), MATLAB (MathWorks, Natick, MA, USA), and ENVI (Harris Geospatial Solutions, Boulder, CO, USA), as well as open-source solutions, namely R (using the lidR, itcSegment, rLiDAR and ForestTools packages), Orfeo toolbox, and Python (using the scikit-image package) for these tasks. Tree detection algorithms were mostly represented by local maxima filtering and less frequently by image binarization. Region growing and watershed segmentation were generally used for crown segmentation. The algorithms were applied to CHMs and point clouds based on LiDAR and SfM (or fused products), as well as orthophotos. Some papers provided a comparative analysis of different segmentation algorithms [22,95,155]. Minařík et al. [120] tested several segmentation techniques on different photogrammetric data products, while Lin et al. [116] compared the applicability of hyperspectral imagery and LiDAR point clouds for image segmentation.
Importantly, species recognition (17 papers) was sometimes part of the analysis or even the focus of the research [34,89]. Abdollahnejad and Panagiotidis [102], for example, tested classification results related to tree health with and without consideration of species differentiation.
In more than half of the articles (50), machine learning techniques were applied to classify individual tree health. In most of the other papers, a regression analysis was performed. In only three articles, researchers implemented physically based radiative transfer models [85,116,117]. In the remainder of this section, only machine learning practices for classification are discussed in detail. Nonparametric approaches represented the most used techniques with decision trees and the related classifier random forest (RF), as well as support vector machine (SVM), and k-nearest neighbors (k-NN). Instead, parametric approaches were represented by the maximum likelihood classifier (MLC) and logistic regression models. Interestingly, researchers have increasingly used deep learning architectures based on artificial neural networks (ANNs), mainly represented by convolutional neural networks (CNNs), since 2018, even more often than the popular RF classifier (see Figure 8). Other architectures related to ANNs were multilayer perceptrons [99] and autoencoders [144]. A comparison between different machine learning classifiers was also carried out [119,130,138,142,144,156,157]. The most comprehensive comparative analysis was performed by Wu et al. [111]. They tested nine traditional machine learning classifiers and four deep learning models against each other.

3.2. Tree Species and Stress Agents

The authors devoted most of their attention to conifers (70%), which were most often subject to biotic and abiotic stress factors. In particular, several pine species, Norway spruce (Picea abies), and different fir species were investigated. Broad-leaved trees were particularly represented by oak [88,107,123,158] and eucalyptus [100,101,108,133,159] trees. Mangroves [98,139] and (sub)tropical [91,97,144,160,161] forest ecosystems were also examined. Biotic stressors clearly were the main concern with almost 70% documented throughout the entire dataset. Particularly insects (33.3%) and diseases (31.3%) were mainly investigated by the researchers. In comparison, abiotic agents accounted for 24.2% of stressors (Figure 9).

3.2.1. Biotic Stressors

(a)
Pests
The insect species researchers dealt with belonged predominantly to the order of Coleoptera (72%), led by various bark beetle species (Ips typographus L., Ips acuminatus, Ips sexdentatus, Pityogenes chalcographus, Polygraphus proximus Blandford, Dendroctonus Brevicomis and Dendroctonus mexicanus Hopkins) followed by the pine shoot beetle (Tomicus piniperda), the eucalyptus longhorned borer (Phoracantha semipunctata), and the oak splendor beetle (Agrilus biguttatus). The order of Lepidoptera, represented by the pine processionary moth (Thaumetopoea pityocampa and T. wilkinsoni) and the Chinese pine caterpillar (Dendrolimus tabulaeformis), formed the other major threats by pests to coniferous forests. Other insect species belonged to the order of Hemiptera (Magicicada) and Hymenoptera (Oriental chestnut gall wasp).
Among the most relevant, the authors selected a few works, which are briefly described in the following. Näsi et al. [134] presented the earliest publication using UAV-based hyperspectral imagery to investigate bark beetle infestation (Ips typographus) at tree level. A machine learning algorithm was used to divide trees into three classes: healthy, infested, and dead. The best intraclass separability was reached using three different vegetation indices. Klouček et al. [92] acquired multispectral time series to retrospectively detect early stage (“green attack”) bark beetle infestations in a spruce forest. They yielded increasing overall accuracies (OA) of 78–96% with advancing tree decay over time. Instead, Cessna et al. [96] investigated the added benefit of SfM-based point clouds to put multispectral information into a structural context for the improved early detection of bark beetle attacks with comparable accuracies (OA = 78%, kappa = 0.64). Koontz et al. [22] conducted drone flights collecting RGB and multispectral imagery at 32 sites to link large-scale environmental gradients to local forest structure and composition to investigate tree mortality patterns. The research was initiated by an unprecedented mortality event during a prolonged drought in Pinus ponderosa populations. Previously weakened trees had been additionally infested by bark beetles (Dendroctonus breviscomis), further intensifying mortality rates. The trees were classified as live/dead and host/nonhost with accuracies of 96.4% and 71.8%, respectively. It was found that greater tree density, proportion, the dimension of P. ponderosa trees, and, more importantly, a climatic water deficit (CWD) resulted in a higher tree mortality. Interestingly, they also demonstrated CWD/host-size interactions and concluded that larger trees were preferably attacked, especially in hotter and drier sites.
A very different approach was described by Schaeffer et al. [110]. They manually sampled bark-beetle-damaged trees in UAV-based orthomosaics to determine threshold rules for training classifiers based on cellular automata. A single study was devoted to the localization of bark beetle occurrences using a semiconductor gas sensor attached to a UAV to detect monoterpenes that could indicate an early stage of infestation [93]. Alpha pinene could be detected as an artificial source in the field. However, environmental factors and technical barriers compromised verification under natural conditions. Hence, a proof of principle above forest stands with trees in an early infestation stage has yet to be established. Zhang et al. [162] investigated defoliation caused by Dendrolimus tabulaeformis Tsai using hyperspectral imagery. They tested different dimensionality reduction algorithms and established a piecewise partial least-squares regression model reaching a high damage assessment accuracy at tree level of 95.23%. Lin et al. [117] proposed a three-dimensional radiative transfer model to assess damage levels caused by the pine shoot beetle (PSB, Tomicus spp.). Due to the vertical heterogeneity of forest trees, one-dimensional radiative transfer models are not sufficiently qualified. For this reason, they acquired UAV-based LiDAR data and in situ measurements to reconstruct three-dimensional damaged forest scenes. The reflectance of the forest scenes was then simulated by a radiative transfer model and validated using both Sentinel-2 and UAV-based hyperspectral imagery with overall good performances. They concluded that 3D models had great potential to accurately estimate PSB damage for forests. All papers regarding pests have been collected in Appendix A Table A1.
(b)
Diseases
Here, researchers dealt with forest diseases caused by a range of pathogens. In half of the articles (16 papers), the pine wilt disease (PWD) caused by nematodes was the focus of the research. Fungi represented the second major source of tree infection. In this context, the researchers investigated the fungal pathogens Dothistroma septosporum [136,137], Armillaria ostoyae [90], Chrysomyxa rhododendri [122], Austropuccinia psidii [163], Raffaelea quercus-mongolicae [107], Hymenoscyphus pseudoalbidus [164], and Heterobasidion annosum [94]. Other investigated pathogen effects were caused by bacteria (Ralstonia sp.) [159] and oomycetes represented by Phytophthora cinnamomi [109,115] and Phytophthora alni [89,119]. Acute oak decline was also reported [123,158], which is likely to be caused by an interactive bacterial pathobiome [165].
Regarding the most interesting articles, Dash et al. [103] simulated a disease outbreak by treating selected trees of a pine plantation with herbicide. The area was monitored several weeks before and after the treatment using a multispectral camera attached to a UAV. Simultaneously, ground surveys were conducted. The timing of the pine trees’ first stress response that was detected based on discolored needles correlated with the field assessments. The normalized difference vegetation index (NDVI) proved to be the most sensitive vegetation index to physiological changes in leaf pigments. However, the best results (k = 0.694) were obtained using a combination of a three-variable model (including NDVI) implemented in an RF classifier. Building on the first study, the authors compared the same drone data with RapidEye satellite imagery [104]. They found that the NDVI was the most sensitive to discoloration in their UAV data. In contrast, in the RapidEye imagery the normalized difference red edge (NDRE) was more sensitive for the same purpose. The study highlighted the utility of vegetation indices such as NDVI in combination with RF classifiers to detect tree stress for both UAV as well as RapidEye satellite data. Overall, the UAV data were more sensitive (R2 = 0.84) to fine-scale instances of physiological stress than the satellite data (R2 = 0.73).
Ganthaler et al. [122] investigated the needle bladder rust disease of the Norway spruce caused by the fungus Chrysomyxa rhododendri. They obtained oblique and nadir aerial RGB images of tree canopies using a drone. They automatically detected diseased and healthy needles by thresholding saturation, brightness, and hue and identified strong correlations between manually counted needle samples (R2 = 0.88–0.98). Yu et al. [118] used UAV-based hyperspectral imagery and LiDAR data for the early detection of the pine wilt disease. Utilizing an RF classifier, they found the highest accuracy by fusing both sensors to distinguish five stages of infection severity (OA: 73.96%, kappa: 0.66). Xia et al. [44] instead used unprocessed UAV-based RGB imagery and showed that deep learning approaches represented by several CNN models were superior to the more traditional RF classifier for detecting the pine wilt disease. All papers on diseases have been collected in Appendix A Table A2.
(c)
Phytoparasites
Other causal agents for biotic stress found in the literature dataset were the hemiparasitic mistletoe species Amyema miquelli [108] and Viscum album [113], as well as lianas [144,145,166], the latter sometimes referred to as structural parasites competing for light and below-ground resources [167,168]. Maes et al. [108] measured the tree canopy temperature of mistletoe-infected and noninfected eucalyptus trees (Eucalyptus fibrosa and Eucalyptus moluccana) as well as the box mistletoe (Amyema miquelii) foliage temperature, using a thermal camera attached to their drone. They found that mistletoe canopy temperature was up to two degrees lower than the infected host tree canopy temperature, which they concluded may be caused by higher transpiration rates of mistletoe. When incoming radiation peaked, these temperature differences were most pronounced. In the same conditions, they also reported that infested trees had higher canopy temperatures than noninfested trees, suggesting lower transpiration rates of host trees caused by the hemiparasite. Miraki et al. [113] focused on the automatic detection of host trees with mistletoe (Viscum album) infection, mostly in Persian ironwood (Parrotia persica), using an RGB camera. As this mistletoe is an evergreen species, the authors took advantage of this characteristic and collected UAV data in foliated and defoliated tree conditions. They successfully detected infected and noninfected trees applying an RF classifier with various vegetation indices within the visible spectrum. The best results were reached by combining both leaf-off and leaf-on datasets with 87% and 76% overall accuracy using manually and automatically delineated tree crowns, respectively. All papers related to phytoparasites have been collected in Appendix A Table A3.

3.2.2. Abiotic

In the related literature of abiotic stressors, the researchers were primarily concerned with forest fires, particularly the assessment of postfire damage and tree recovery, as well as drought-induced tree stress. Other studies dealt with extreme temperatures [98], inundation stress caused by tidal activity [139], and the physical impairment of trees due to precipitation of snow [169] or heavy rainfall [97]. Among the most important papers, we chose the works of Hernández-Clemente et al. [85], D’Odorico et al. [105], and Campbell et al [153]. To the best of our knowledge, the earliest publication addressing physiological variations of pine trees with drones applicable for FHM dates from 2012. Hernández-Clemente et al. [85] validated a physically based radiative transfer model for complex structures parameterized with detailed field measurements using drone-based multispectral imagery. They found that traditional vegetation indices were strongly influenced by structural variations when compared at the leaf and canopy level. Furthermore, they introduced a new vegetation index ( R 530 nm / R 570 nm ) that was significantly related to the carotenoid content at both leaf R2 > 0.72; p < 0.001) and crown levels (R2 > 0.71; p < 0.001), and which proved to be the most robust against structural effects compared to other indices tested. The high-resolution images enabled varying carotenoid content to be mapped at the tree scale to draw conclusions about the physiological state of pine trees exposed to arid conditions.
In the work of D’Odorico et al. [105], another vegetation index sensitive to carotenoid content was investigated using a modified multispectral camera attached to a UAV. They examined a long-term precipitation manipulation experiment established in 2003 by irrigating selected plots in a mature Pinus sylvestris forest. After 11 years, irrigation was stopped for approximately one-third of the irrigated areas. This resulted in a comparison of irrigated, irrigation-stopped, and untreated (control) plots. From 2019, 17 years after the area was set up, they collected drone-based multispectral data in three flights per year (spring, summer, and autumn) over two consecutive growing seasons. With this setup, the authors detected drought-induced tree stress and their post-drought recovery based on the photochemical reflectance index (PRI; Gamon et al. [170]). The control plots measured up to ten times lower PRI values, indicating higher stress levels than the irrigated plots. Moreover, they found positive legacy effects on sites where they had stopped irrigation five years before the first drone flights launched compared to the control sites which were never irrigated.
Campbell et al. [153] introduced a multisensor (RGB, LiDAR, and multispectral) and multiscale (UAV, crewed aircraft, and satellite) monitoring approach for mapping tree mortality in a piñon–juniper woodland in a model calibration framework. Based on historical evidence, the authors considered drought the most likely catalyst for the tree die-off. They combined high-resolution UAV-based RGB imagery for the interpretation of tree mortality at individual tree-scale (live, partially dead, and dead trees), airborne LiDAR data for individual crown segmentation, and determination of relative canopy mortality rates, as well as Landsat imagery to allow the extrapolation of mortality estimates to a broader spatial scale. All papers regarding abiotic stressors have been collected in Appendix A Table A4.

3.2.3. Stress in General or Unknown Cause

In a few papers, the authors did not specify the causative agent and investigated tree vitality in general. For instance, Khokthong et al. [148] assessed drone-derived canopy cover and evaluated its correlation with the mortality rates of palm trees, while Campos-Vargas et al. [156] tested a range of traditional and advanced machine learning algorithms to separate live from dead trees as well as forest gaps. Although focusing on biodiversity, Saarinen et al. [34] also explored the adequacy of UAV-based hyperspectral imagery to evaluate the health status of trees. They found that a vegetation index using a red-edge band of 742 nm and an NIR band of 900 nm was particularly appropriate for this task. All papers in which the cause of tree stress was not defined have been collected in Appendix A Table A5.

4. Discussion

In this section, the results are discussed in detail and technical advances but also research gaps and trends are addressed following the order presented in Section 3.
The trend results regarding the increase of UAV-based FHM related literature trails approximately one to two years behind the exponential trend of UAV-based forestry applications in general [171], which might explain the underrepresentation of FHM compared to other disciplines in the related literature [16,172]. However, this also shows that this topic is establishing as an individual application with rapid growth to be expected in the following years.

4.1. Data Acquisition

Regarding data acquisition, technological advances in hardware and software enable standardized approaches for flight planning and automated drone operations. This ensures that preplanned flight parameters are met to fulfill the requirements according to resolution, area coverage, lighting conditions, and possible SfM workflows [173], assuming photogrammetric products are desired. For other applications, a systematic and precise aerial coverage is most often requested. Due to their maneuverability and comparative ease of operation, and the ability of VTOL, most researchers turned to multirotor UAV models. Since most study areas were manageable in terms of size and only representative forest stands were selected, maneuverability and flexible operation seem more critical than extensive area coverage. In contrast, fixed-wing aircraft were used if an extended area coverage was required. The less frequent use of fixed-wing models could be due to the higher costs, higher planning effort, and complicated deployment. Surprisingly, hybrid VTOL fixed-wing models were used in none of the studies. These would significantly mitigate the disadvantages of fixed-wing UAVs, especially during take-off and landing, and do not require large open spaces. Once the UAV is manually maneuvered above the tree tops in the multirotor mode, all the advantages of fixed-wing aircraft come into play by transitioning into the cruising mode at safe heights. Considerably higher costs probably contribute to the fact that this type of UAV model does not yet serve a broader range of customers. Nevertheless, we believe that these models will play a more prominent role, especially in the forestry sector, to cover larger scale areas.
In most of the articles, the use of RGB cameras or their combination with other sensors was reported. When comparing different imaging sensors, the dominant presence of RGB cameras was not surprising. These are often the first choice due to their availability, customizability, high resolution, and low costs, providing good SfM results. The relatively high proportion of multispectral sensors compared to other forestry applications [172] also shows that the scientific community is particularly interested in detailed spectral analyses when it comes to FHM. Additional bands in the near-infrared spectrum allow for improved vegetation analyses. The growing share of hyperspectral cameras, despite their higher costs and processing complexity, underlines this assumption. Indeed, broad RGB and multispectral bands may inevitably average fine spectral components, which could still be discriminated by the multitude of narrow bands provided by hyperspectral sensors [47]. Increasingly affordable and miniaturized of-the-shelf multispectral cameras are supposedly a reason for the rapid spread. Multispectral camera and SfM software providers even work in collaboration on common workflows to simplify data import, and subsequent workload, including spectral calibration [174]. This trend facilitates an entry into UAV-based spectral imaging and will further boost the adoption of highly specialized cameras for FHM. Hyperspectral camera providers will likely emulate this strategy in the future. Multispectral cameras designed specifically for the forestry sector, representing only the most important bands and bandwidths, would also be conceivable. Most multispectral sensors currently available have been developed primarily for the agricultural sector.
Besides spectral details, structural information was primarily derived from photogrammetric products, but the use of more sophisticated LiDAR sensors is increasing. Quantifying spectral and structural characteristics of trees with UAV-RS allows the discrimination between different health classes of trees or tree species if differences in certain characteristics (e.g., biochemical, physiological, or geometric features) can be detected [12]. Drone data of a single date depict only the momentary condition of trees and thus allow only for limited conclusions to be drawn. Therefore, conducting aerial surveys with high-frequency revisit times and preferably over a longer time horizon is a significant advantage of UAVs. When spectral and structural RS information reaches its limits in distinguishing between healthy and dead trees or even different stages of diseased trees, seasonal changes in tree characteristics such as photosynthetic activity, physiological and geometric attributes, and changes in biomass could help [11]. Health progressions and deterioration or recovery can only be analyzed reliably with time series based on repeated data acquisition. Although the high temporal resolution possible with drones is emphasized, there is only limited literature available that make advantage of this feature. In just 24 papers were multitemporal data acquired, and only 6% of data were collected over a period longer than one year. This obviously underexploited potential should be addressed more intensively in future works related to FHM, where research on plant dynamics is highly relevant. Particularly given the structural complexity of trees, long-term monitoring and high-frequency revisit times could reveal valuable additional information and potentially overcome technical and analytical limitations.
The prerequisite enabling photogrammetric processing using SfM software is a sufficient image overlap. Due to the complex structure of forests, a relatively high image overlap is recommended [15,21,173] and was adopted by the majority of the reviewed papers. Appropriate flight configurations can optimize the produced data volume. It is crucial to balance the amount of imagery but still achieve efficient image overlap to avoid drawbacks due to long processing times but simultaneously not compromise data quality [175]. The researchers barely addressed the issue of excessive data storage within the literature dataset. Only in one paper was redundant drone imagery filtered in real time to reduce processing efforts [124]. The same applies to the flight altitude, which is rarely experimented with. Seifert et al. [15], for example, showed that low flight altitudes could be beneficial for SfM-based forest reconstructions, especially in combination with high image overlaps. Whereas in Young et al. [176], this effect was not observed, and higher flight altitudes even led to improved tree maps. Recommended flight times and weather conditions were also reflected. Even though overcast skies allow for a uniform illumination due to diffuse lighting, the lowest possible atmospheric influences are conducive to spectral studies [21]. Therefore, clear skies were preferred throughout the literature dataset. Even though some cameras are bundled with on-board irradiance sensors, changing illumination during the data acquisition still poses a great challenge to calibration algorithms. Hence, fluctuating light conditions can have a major impact on data quality and therefore need to be studied more intensively. In general, flight parameters should be given more attention in future research as they have a direct influence on data quality.
Drone flights are subject to legal requirements, and the regulatory framework provided by each country has a major impact on data acquisition and flight parameterization. For example, European Union member states’ maximum allowed flight height is limited to 120 m above ground level. Moreover, the UAV needs to be within the visual line of sight (VLOS) [177]. Thus, the coverage of larger areas strictly depends on local rules. Flights above the maximum allowed height and beyond the visual line of sight (BVLOS) usually require exemptions, which the respective air safety authorities must approve. UAV forestry applications may also be affected by flight restrictions over national parks and conservation areas or in the vicinity of energy and traffic infrastructure and might, on top of that, be subject to privacy laws [178]. These rules are essential to guarantee safe and legal drone operations while protecting the public interest. Since UAVs used in a civil context are relatively new, the respective legislation frameworks might be changing dynamically. The legal framework for drone operation should be further developed considering the operational use of drones, safety issues, and the protection of public and environmental interests, which requires thorough communication between stakeholders and policymakers.

4.2. Data Processing

Programmable processing workflows implemented in photogrammetry software allow for a fully automated SfM data creation. From the raw images to the final products, the entire process chain can be fully controlled, automated, and adapted to individual requirements. However, almost all reviewed studies heavily relied on commercial SfM software to create data products. This could pose a financial barrier and, considering the political situation, also a legal barrier to stakeholders, and it might impede research and technology transfer. For an overview of open-source SfM tools and algorithms, we refer to [179,180].
Spectral information is of pivotal importance in FHM and probably the most significant indicator for forest health in RS data [11]. Hence, orthomosaics from multiple spectral layers are the focus of research in this application field. Most studies produced orthophotos that were georeferenced and homogeneous, but much information that can be derived from perspective imagery (e.g., lateral tree views) are eliminated during the photogrammetric process. Thus, if one does not need a point cloud or orthophotos because one already knows the structure, not using SfM can also have great advantages as in some of the papers demonstrated. Too few of the studies focused on the raw imagery, which also have great potential for detecting tree damage.
Geometric tree data are used mainly for preliminary tree detection and crown segmentation and sometimes to improve interpretation results. The authors of the analyzed literature predominantly relied on SfM-based and less commonly on LiDAR-based point clouds. Photogrammetric point clouds are limited to the canopy surface in dense forests representing the visible surface with even higher point densities and details than LiDAR [21]. Problems in processing the data are mainly due to the high structural complexity of the tree crowns, which is often accompanied by wind-induced motions of leaves and branches. Especially with an insufficient image overlap, this can lead to image-matching problems. LiDAR-based point clouds often have the advantage of enabling the reconstruction of internal tree structures and the ground surface [181]. When directly comparing LiDAR and SfM-based point clouds to derive forest inventory metrics, LiDAR is often superior to detect subcanopy information [182]. However, this statement is only valid if the LiDAR system has a sufficient resolution (points per m2), able to represent the vertical structure of the tree as well as the ground. Nevertheless, SfM provides a cost-efficient alternative, making it a competitive and appropriate tool if laser technology is unavailable [21,183,184]. It would be conceivable to have one-time or infrequent LiDAR drone surveys kept up to date by regular SfM-based surveys [181]. Some of the authors pointed out that 3D geometric information can lead to better classification accuracies and improved interpretations of tree health. As stressors may act on different spatiotemporal scales, symptoms may first occur at the crown’s lower or inner parts [155], making them hard to detect in images from the bird’s view. The increasing use of LiDAR sensors in this application field suggests a trend in an appropriate direction that uncovers detailed 3D structures of trees. LiDAR should be more extensively incorporated into future research, especially with imaging sensors.
A critical step of the SfM processing chain is the radiometric and spectral calibration of the images. Radiant energy is received by the senor’s pixels and saved as a digital number (DN). Usually, the goal of radiometric and spectral calibration is to convert DNs into reflectance values. In some of the reviewed papers, researchers pointed out problems with calibration techniques during overcast skies or varying weather conditions. This reveals that calibration is still a key issue and thus diminishes the opportunity to fly below the cloud cover, if a detailed spectral analysis is desired [101,185]. Recent developments and efforts by providers of photogrammetry software (e.g., Agisoft and Pix4D) already enable the integration of reference reflectance targets, and irradiance measurements show that this problem has been recognized and is being worked on. However, there is no consensus on standardized calibration workflows for fluctuating lighting conditions to create consistent reflectance maps [186]. We refer to Aasen et al. [26] for more information on this topic, including state-of-the-art radiometric and spectral calibration techniques. The introduction of multispectral active sensors, such as multispectral LiDAR for UAVs, might be a game-changer in this regard in the future, since it overcomes both the problem of the geometric reconstruction as well as the spectral calibrations due to inconsistent lighting conditions [187,188].
The potential of direct georeferencing concerning UAV-RS was already pointed out at an early stage of UAV development [189]. Today, with RTK/PPK-ready UAVs, an essential step towards operational UAV-RS has been achieved [190,191]. Distributing and recording GCPs is time-consuming, costly, and usually not feasible in hard-to-access forestry areas. In dense forests, the accuracy of handheld differential GNSS (D-GNSS) devices also suffers due to signal interference from high vegetation [192]. On top of that, the GCPs are often poorly detectable in aerial imagery due to a lack of sufficient open space. The association of GCPs during photogrammetric processing can also only be automated to a limited extent and requires user interaction which further impairs the automation of the process chain. The distribution of a few GCPs for reasons of validation is recommended.
An important argument for using UAVs for FHM is that drone operators are also data providers and have complete control over the data processing workflows. This is a viable advantage over traditional RS platforms as there is no dependency on third-party data providers. In fact, this could bolster an open-source mindset and promote an open-data policy framework for the UAV-RS community.

4.3. Complementary Data Use

The high proportion of recorded fieldwork indicates how much importance is attributed to ground truth information for FHM. In many cases, field data were used for result validation. External symptoms detected from aerial imagery only cannot confirm most stressors. Field surveys will continue to play a central role in better understanding the complexity and interactions among multiple stressors on forest health. UAVs are instead seen as a complementary tool. A monitoring system that combines in situ terrestrial information based on expert knowledge and RS data should be aspired to [1]. Drone surveys can help to simplify and sometimes even substitute for specific tasks in the field, but a general replacement of ground surveys for FHM by drones is still far from conceivable. RS cannot sense specific forest health indicators, such as underground measurements, that necessitate terrestrial efforts.
According to Emilien et al. [193], the complementary use of satellite and UAV data can be divided into four categories with increasing synergies, respectively: (1) data comparison, (2) multiscale explanation, (3) model calibration, and (4) data fusion. Especially the latter two strategies, which are considered to have strong synergies, have been barely used in the reviewed articles and should be explored more closely to exploit the additional benefits for FHM. Sophisticated data fusion techniques such as pansharpening to merge complementary satellite and UAV images are generally underrepresented in UAV-related research [193] and were not sufficiently exploited within the literature dataset. Entire satellite archives such as Landsat data were made publicly accessible [194] and thus serve as a potential complementary data pool. Other Earth observation programs, such as the Sentinel space missions of the European Space Agency (ESA), have been designed from the outset with an open-data policy in mind. Combined with freely available cutting-edge processing tools for RS imagery [195], this opens new possibilities for forest-health-related science. These principles should be endeavored by the UAV-RS community. Future efforts should utilize products from different RS platforms to scale drone data to larger areas and improve interpretations, as some authors demonstrate. Standardization of UAV data and data structures fosters interoperability and should be pursued to facilitate data fusion to develop robust multisource and multisensor RS systems.

4.4. Data Analysis

Approximately 20 years ago, the ever-increasing spatial resolution provided by modern spaceborne imaging sensors had led to the questioning of purely pixel-based approaches for geospatial image analysis [196]. This has prompted a demand for research beyond pixels. Image segmentation is a crucial step of object-based image analysis (OBIA) and decisively determines the quality of the subsequent feature extraction and classification [197]. Using segmentation algorithms, researchers attempt to group pixels into meaningful image objects based on homogeneity criteria [198]. This was also reflected in our literature dataset. To a large extent, the researchers implemented automatic tree detection and crown segmentation algorithms. Typically, these algorithms were used on CHMs or the original point cloud. Minařík et al. [120] indicated that the point density derived from SfM was more critical for the segmentation success than the algorithm used and should be well above 10 to 20 points per square meter. More complex forest structures with intertwined tree crowns may require LiDAR-based point clouds [199].
Automatic processes are essential to handle large amounts of data efficiently. The same applies to classification tasks. Machine learning has shown great potential for automated image recognition and classifying healthy and decaying trees. Many of the authors used RF classifiers either pixel-wise or on preliminary segmentation outcomes for the OBIA classification as it provides robust results. An emerging trend shows that RF is gradually being superseded by modern deep learning architectures such as CNNs. The main advantage of these techniques are the very high classification accuracies and the fact that those algorithms do not need any subjective and laborious feature engineering. However, the main drawback of CNNs is the enormous amount of sample data and processing resources necessary. Moreover, the complexity of deep neural networks reduces the interpretability of the input features to the degree that they become meaningless abstractions that can hardly be linked to real-world features [200]. In contrast, conventional machine learning classifiers such as RF operate resources efficiently [201], requiring only a fraction of sample data. Complex machine learning architectures and workflows hinder widespread adoption beyond the scientific community, requiring a more intensive knowledge transfer. Simple, robust, and competitive approaches for high-resolution drone imagery are urgently demanded [119].

4.5. Tree Species and Stressors

As expected, mainly conifers were researched, which is in line with the findings of [16]. The conifers were mostly impaired by biotic and abiotic stressors. They often represent fast-growing tree species and economically important assets that have been used for decades in plantations to optimize yields. Due to a reduced branch growth in dense monocultures, easy-to-process timber for large lumber mills can be produced for the mass market. High host densities also favor mass insect reproduction and the spread of diseases [22,202].
Therefore, it is not surprising that pests and diseases account for almost two-thirds of the literature dataset. Some authors addressed important cross-correlations of multiple stressors that may exacerbate the detrimental effects on forest health, and that are yet not sufficiently understood. With an advancing climate change, alterations of disturbance frequencies and intensities are to be expected in the future [203,204]. Early stress detection may lead to a better understanding and monitoring of forest health and improve prevention measures by identifying appropriate forest management strategies. Late physiological effects result in progressive changes in pigmentation and, finally, defoliation, which often represents irreversible damage to the status of trees [105]. Future research should intensify investigations on previsual symptoms at early stages of stress to evaluate tree recovery opportunities and develop strategies to prevent further decline. Moreover, efforts should be made to integrate essential prerequisites such as crown segmentation and species identification into the work process and include them in the evaluation of forest health. For this to succeed, it will be necessary to optimize the spectral and temporal resolution possible with UAVs and apply additional active sensors to acquire state-of-the-art 3D information.

5. Conclusions

Drones for FHM are getting increasingly popular as they have proven to serve as a cost-efficient and reliable RS tool for stress detection at the tree scale. This is also reflected in an ever-growing number of related literature works. In this review, we compiled and analyzed a comprehensive dataset of 99 papers regarding UAV-based FHM published over the last decade. To limit the scope of the research, we focused on publications dedicated to tree stress induced by biotic and abiotic agents. The increasing number of articles show that UAV-based FHM is in the process of becoming a mature forestry application field.
UAVs, associated technologies, and sensors are becoming cheaper, easier to handle, and more advanced. Technological advances are rapidly adopted and pave the way for an operational UAV-supported forest monitoring system and boost further adoption among stakeholders. Onboard D-GNSS modules, for example, can drastically reduce or even replace the time-consuming distribution of GCPs. The number of multispectral cameras used in the field is relatively high compared to other forestry disciplines. This indicates the broader acceptance of specialized sensors and reveals that a greater technical effort is being expended for the sake of analytical precision. SfM processing has been established as a solid approach and delivers reliable data products providing insights into spectral and structural tree characteristics. Drone monitoring of tree vigor and plant dynamics has shown to be effective and robust, as the authors vividly demonstrated in their research. Nevertheless, we also identified a few drawbacks and research gaps that need to be overcome in further study:
(1)
The use of hyperspectral cameras and LiDAR sensors must increase to exploit modern sensors’ spectral and structural potential. Both sensor types are underrepresented but provide the most promising added value for FHM, in particular if used in combination. Optimized multispectral sensors for FHM need to be developed, which offer the most informative spectral bands tailored to the requirements of the analysis of forests. The miniaturization of multispectral LiDAR must be advanced for UAV applications.
(2)
The flexible use of drones enables recordings with short revisit intervals and thus provides a high possible temporal resolution. Despite these advantageous attributes of UAVs, multitemporal and long-term monitoring is not sufficiently performed yet. The dynamic nature of forest ecosystems requires timely and repeated data collection to capture forest health degradation and recovery.
(3)
A greater emphasis should be placed on early stress detection (previsual stage) to improve forest management strategies and to be able to respond to impending damage promptly.
(4)
Currently, a fast advance of operationalization of UAV-based FHM is mainly hampered by technical and regulatory issues. A lack of standardized radiometric and spectral calibration workflows persists and affects consistent data processing. This also involves the flexible use of drones, as flight operation is limited to stable atmospheric conditions when a detailed spectral analysis is intended. Regulatory frameworks need to be optimized in mutual consideration of stakeholders and public interests to keep drone projects operable and safe. Exemption permits should be made possible at a reasonable additional expense to achieve greater area coverage (e.g., through flights above the maximum allowed altitude or BVLOS flights) and should not pose a barrier to innovation.
(5)
Researchers should intensely focus on integrating traditional RS data from satellites and aircraft to enable larger-scale forest monitoring. It has been shown that there is a significant weakness in interoperability that needs to be addressed in future work to exploit complementary data with strong synergies (e.g., data fusion). Future research should focus on multisensor and multisource monitoring strategies and tackle interoperability issues by establishing standardized data infrastructures.
(6)
Researchers rely on commercial software across the whole data pipeline, from data acquisition to the final analysis. This dependency comes at the expense of more flexible open-source solutions and can adversely affect knowledge and technology transfer among stakeholders.
In view of further decreasing costs of drone technology, hybrid VTOL fixed-wing platforms are conceivable for future FHM. These would allow an easier handling in spatially limited locations while flying more efficiently to cover larger areas. Larger combustion-engine-powered UAVs might close the gap between UAV and aerial surveys in the near future, according to costs and revisit times. Equipped with onboard D-GNSS technology, this could promote a further spread of fixed-wing models and thus provide a better cost-benefit ratio per hectare. With modern laser technology and thermal and hyperspectral cameras attached to the UAV, the spectral and structural range would be optimally exhausted for a more holistic UAV-based FHM approach.

Author Contributions

Conceptualization, S.E., J.D., H.-J.K., E.E., D.T. and T.S.; methodology, S.E.; software, S.E.; formal analysis, S.E.; investigation, S.E.; data curation, S.E.; writing—original draft preparation, S.E.; writing—review and editing, S.E., J.D., J.F., A.S., E.E., H.-J.K., D.T. and T.S.; visualization, S.E.; supervision, D.T. and T.S.; project administration, H.-J.K.; funding acquisition, H.-J.K. All authors have read and agreed to the published version of the manuscript.

Funding

This research is based on funding from a project grant provided by the Bavarian State Ministry for Food, Agriculture, and Forestry (E058).

Data Availability Statement

The data that support the findings of this study are available from the corresponding author, S.E., upon reasonable request.

Acknowledgments

The authors thank all anonymous reviewers that provided valuable comments.

Conflicts of Interest

The authors declare no conflict of interest.

Abbreviations

The following abbreviations are used in this manuscript:
ALSairborne laser scanning
ANNartificial neural network
BVLOSbeyond visual line of sight
CHMcanopy height model
CNNconvolutional neural network
D-GNSSdifferential global navigation satellite system
DBHdiameter at breast height
DSMdigital surface model
DTMdigital terrain model
ESAEuropean Space Agency
EUEuropean Union
k-NNk-nearest neighbor
FHMforest health monitoring
GCPground control point
GNSSglobal navigation satellite system
LiDARlight detection and ranging
MLCmaximum likelihood classifier
MTOMmaximum take-off mass
NDVInormalized difference vegetation index
NDREnormalized difference red-edge index
NIRnear-infrared
nmnanometer
OBIAobject-based image analysis
OAoverall accuracy
PPKpostprocessed kinematic
PRIphotochemical reflectance index
RFrandom forest
RGBred green blue
RSremote sensing
RTKreal-time kinematic
SfMstructure from motion
SVMsupport vector machine
UASunmanned/uncrewed aircraft system
UAV-RSunmanned/uncrewed aerial vehicle remote sensing
UNUnited Nations
UAVunmanned/uncrewed aerial vehicle
VLOSvisual line of sight
VOCvolatile organic compound
VTOLvertical take-off and landing

Appendix A

Table A1. Pests: reviewed articles regarding insects as the cause of tree stress.
AuthorsStudy Area (Country)UAV TypeSensorGeometric CorrectionTree Species AffectedStressor
Lehmann et al. [88]GermanyMultirotorMultispectralGCPsCommon oak (Quercus robur)Oak splendor beetle (Agrilus biguttatus)
Näsi et al. [134]FinlandMultirotorHyperspectral, RGBCoregistrationNorway spruce
(Picea abies)
European spruce bark beetle (Ips typographus L.)
Minarik and Langhammer [205]Czech RepublicMultirotorMultispectralGCPsNorway spruce (Picea abies)European spruce bark beetle (Ips typographus L.)
Cardil et al. [206]SpainMultirotorRGBGCPsPinePine processionary moth (Thaumetopoea pityocampa)
Klein Hentz and Strager [114]United StatesMultirotorRGBGCPsNot specifiedMagicicada
Näsi et al. [135]FinlandMultirotorHyperspectral, RGBCoregistrationNorway spruce (Picea abies)European spruce bark beetle (Ips typographus L.)
Otsu et al. [143]SpainMultirotorRGBCoregistrationPine (Pinus sylvestris, P. nigra)Pine processionary moth (Thaumetopoea pityocampa)
Röder et al. [152]GermanyMultirotorRGBGCPsNorway spruce (Picea abies)European spruce bark beetle (Ips typographus L.)
Stoyanova et al. [207]BulgariaMultirotorRGB, multispectral-Norway spruce (Picea abies), Scots pine (Pinus sylvestris)Bark beetle (Ips typographus, I. acuminatus, I. sexdentatus)
Zhang et al. [162]ChinaMultirotorHyperspectral, RGBCoregistrationChinese pine (Pinus tabulaeformis)Chinese pine caterpillar (Dendrolimus tabulaeformis)
Cardil et al. [129]SpainMultirotorRGB, multispectral-Scots pine (Pinus sylvestris)Pine processionary moth (Thaumetopoea pityocampa)
Dimitrov et al. [131]BulgariaFixed-WingMultispectral-Norway spruce (Picea abies), silver fir (Abies alba)European spruce bark beetle (Ips typographus L.)
Klouček et al. [92]Czech RepublicMultirotorRGB, multispectralGCPsNorway spruce (Picea abies)European spruce bark beetle (Ips typographus L.)
Lin et al. [116]ChinaNot specifiedHyperspectral, LiDARGCPsYunnan Pine (Pinus yunnanensis)Pine shoot beetle (Tomicus spp.)
Otsu et al. [138]SpainNot specifiedRGB, multispectralGCPsPine (Pinus sylvestris, P. nigra)Pine processionary moth (Thaumetopoea pityocampa)
Akıncı and Göktoǧan [125]TurkeyMultirotorRGB-Turkish pine (Pinus brutia)Pine processionary moth (Thaumetopoea pityocampa, T. wilkinsoni)
Safonova et al. [208]RussiaMultirotorRGB-Siberian fir (Abies sibirica)Four-eyed fir bark beetle (Polygraphus proximus)
Abdollahnejad and Panagiotidis [102]Czech RepublicMultirotorMultispectral-Norway spruce (Picea abies), Scots pine (Pinus sylvestris)European spruce bark beetle (Ips typographus L.)
Duarte et al. [133]PortugalFixed-WingMultispectralGCPsEucalyptus (Eucalyptus globulus)Eucalyptus longhorned borers (Phoracantha semipunctata, P. recurva)
Liu et al. [140]ChinaMultirotorHyperspectralDirect georeferencing (RTK/PPK), coregistrationYunnan pine (Pinus yunnanensis)Pine shoot beetle (Tomicus spp.)
Minařík et al. [120]Czech RepublicMultirotorMultispectralGCPsNorway spruce (Picea abies), Scots pine (Pinus sylvestris)European spruce bark beetle (Ips typographus L.)
Barmpoutis et al. [209]GreeceMultirotorRGB-Pine (Pinus brutia, P. halepensis, P. pinea)Pine shoot beetle (Tomicus piniperda)
Zhang et al. [210]ChinaMultirotorRGB, hyperspectralCoregistrationChinese pine (Pinus tabulaeformis)Chinese pine caterpillar (Dendrolimus tabulaeformis)
Cessna et al. [96]United StatesMultirotorRGB, multispectralGCPsNorway spruce (Picea abies)Four-eyed spruce beetle (Dendroctonus rufipennis)
Lin et al. [117]ChinaNot specifiedHyperspectral, LiDARGCPsYunnan Pine (Pinus yunnanensis)Pine shoot beetle (Tomicus spp.)
Minařík et al. [130]Czech RepublicMultirotorMultispectralDirect georeferencing (RTK/PPK)Norway spruce (Picea abies)European spruce bark beetle (Ips typographus L.)
Nguyen et al. [155]JapanMultirotorRGB-Fir (Abies mariesii)Tortrix moth (Epinotia piceae), bark beetle (Polygraphus proximus)
Paczkowski et al. [93]GermanyMultirotorGas sensor-Norway spruce (Picea abies)Bark beetle (Ips typographus, Pityogenes chalcographus)
Safonova et al. [87]BulgariaMultirotor, Fixed-WingRGB, multispectral-Norway spruce (Picea abies)European spruce bark beetle (Ips typographus L.)
Schaeffer et al. [110]MexicoMultirotorRGB, multispectral-Piñon pine (Pinus cembroides)Bark beetle (Dendroctonus mexicanus)
Koontz et al. [22]United StatesMultirotorRGB, multispectralGCPsPonderosa pine (Pinus ponderosa)Western pine beetle (Dendroctonus brevicomis)
Pádua et al. [115]PortugalFixed-WingMultispectralGCPsSweet chestnut (Castanea sativa)Oriental chestnut gall wasp (Dryocosmus kuriphilus), chestnut ink disease (Phytophthora cinnamomi), chestnut blight (Cryphonectria parasitica)
Kampen et al. [164]AustriaMultirotorMultispectral-Norway spruce (Picea abies), European ash (Fraxinus excel-sior)European spruce bark beetle (Ips typographus L.), ash dieback disease (Hymenoscyphus pseudoalbidus)
Honkavaara et al. [94]FinlandMultirotor 2 × RGB, multispectral, thermal, hyperspectralDirect georeferencing (RTK/PPK), GCPsNorway spruce (Picea abies)European spruce bark beetle (Ips typographus L.), root and butt rot (Heterobasidion annosum)
Table A2. Diseases: reviewed articles on diseases as the cause of tree stress.
AuthorsStudy Area (Country)UAV TypeSensorGeometric CorrectionTree Species affectedStressor
Park and Kim [211]South KoreaFixed-WingRGB-PinePine wilt disease (Bursaphelenchus xylophilus)
Smigaj et al. [136]United KingdomFixed-WingThermal, multispectralCoregistrationPine (Pinus sylvestris, P. contorta)Red band needle blight (Dothistroma septosporum)
Michez et al. [89]BelgiumFixed-WingRGB, multispectralGCPs, coregistrationBlack alder (Alnus glutinosa)Phytophthora alni
Dash et al. [103]New ZealandMultirotorMultispectralGCPsMonterey pine (Pinus radiata)Herbicide
Brovkina et al. [90]Czech RepublicMultirotorRGB, multispectralGCPsNorway spruce (Picea abies)Honey fungus (Armillaria ostoyae)
Dash et al. [104]New ZealandMultirotorMultispectralGCPsMonterey pine (Pinus radiata)Herbicide
Ganthaler et al. [122]AustriaMultirotorRGB-Norway spruce (Picea abies)Needle bladder rust disease (Chrysomyxa rhododendri)
Gerard et al. [123]United KingdomMultirotorHyperspectral-Common oak (Quercus robur)Acute oak decline (AOD)
Sandino et al. [163]AustraliaMultirotorHyperspectralGCPsPaperbark tea tree (Melaleuca quinquenervia)Myrtle rust (Austropuccinia psidii)
Dell et al. [159]IndonesiaMultirotorRGBGCPsEucalyptus (Eucalyptus pellita)Bacterial wilt (Ralstonia sp.)
Jung and Park [212]South KoreaFixed-WingRGB, multispectral-PinePine wilt disease (Bursaphelenchus xylophilus)
Lee et al. [107]South KoreaMultirotorRGB-Oak (Quercus mongolica, Q. serrata, Q. dentate)Oak wilt (Raffaelea quercus-mongolicae)
Navarro et al. [158]PortugalFixed-WingMultispectralGCPsCork oak (Quercus suber)Cork oak decline
Smigaj et al. [137]United KingdomMultirotorThermalCoregistrationScots pine (Pinus sylvestris)Red band needle blight (Dothistroma septosporum)
Deng et al. [213]ChinaFixed-WingRGB-Chinese red pine (Pinus massoniana)Pine wilt disease (Bursaphelenchus xylophilus)
Iordache et al. [214]PortugalMultirotorRGB, multispectral, hyperspectralDirect georeferencing (RTK/PPK), GCPsMaritime pine (Pinus pinaster)Pine wilt disease (Bursaphelenchus xylophilus)
Syifa et al. [157]South KoreaMultirotorRGB-Pine (Pinus densiflora, P. thunbergii)Pine wilt disease (Bursaphelenchus xylophilus)
Hoshikawa and Yamamoto [215]JapanMultirotorRGB, multispectral-Japanese black pine (Pinus thunbergii)Pine wilt disease (Bursaphelenchus xylophilus)
Tao et al. [216]ChinaMultirotorRGB-Chinese red pine (Pinus massoniana)Pine wilt disease (Bursaphelenchus xylophilus)
Guerra-Hernández et al. [119]PortugalFixed-WingRGB, multispectralGCPsBlack alder (Alnus glutinosa)Phytophthora alni
Li et al. [124]ChinaMultirotorRGB-Chinese pine (Pinus tabulaeformis)Pine wilt disease (Bursaphelenchus xylophilus)
Qin et al. [141]ChinaMultirotorMultispectralDirect georeferencing (RTK/PPK)Chinese red pine (Pinus massoniana)Pine wilt disease (Bursaphelenchus xylophilus)
Sun et al. [217]ChinaMultirotorRGB-Chinese red pine (Pinus massoniana)Pine wilt disease (Bursaphelenchus xylophilus)
Wu et al. [111]ChinaMulirotorRGB-Chinese pine (Pinus tabulaeformis)Pine wilt disease (Bursaphelenchus xylophilus)
Xia et al. [44]ChinaFixed-WingRGB-Pine (Pinus thunbergii, P. densiflora)Pine wilt disease (Bursaphelenchus xylophilus)
Yu et al. [112]ChinaMultirotorRGB, Hyperspectral, LiDARGCPsKorean pine (Pinus koraiensis)Pine wilt disease (Bursaphelenchus xylophilus)
Yu et al. [118]ChinaMultirotorMultispectral, RGBDirect georeferencing (RTK/PPK)Chinese red pine (Pinus massoniana)Pine wilt disease (Bursaphelenchus xylophilus)
Yu et al. [142]ChinaMultirotorHyperspectral, LiDARGCPsChinese red pine (Pinus massoniana)Pine wilt disease (Bursaphelenchus xylophilus)
Yu et al. [146]ChinaMultirotorHyperspectralGCPsChinese pine (Pinus tabulaeformis)Pine wilt disease (Bursaphelenchus xylophilus)
Pádua et al. [109]PortugalMultirotorRGB, multispectralGCPsSweet chestnut (Castanea sativa)Chestnut ink disease (Phytophthora cinnamomi), chestnut blight (Cryphonectria parasitica), nutritional deficiencies
Pádua et al. [115]PortugalFixed-WingMultispectralGCPsSweet chestnut (Castanea sativa)Chestnut ink disease (Phytophthora cinnamomi), chestnut blight (Cryphonectria parasitica), Oriental chestnut gall wasp (Dryocosmus kuriphilus)
Kampen et al. [164]AustriaMultirotorMultispectral-Norway spruce (Picea abies), European ash (Fraxinus excelsior)Ash dieback disease (Hymenoscyphus pseudoalbidus), European spruce bark beetle (Ips typographus L.)
Honkavaara et al. [94]FinlandMultirotor 2 × RGB, multispectral, thermal, hyperspectralDirect georeferencing (RTK/PPK), GCPsNorway spruce (Picea abies)Root and butt rot (Heterobasidion annosum), European spruce bark beetle (Ips typographus L.)
Table A3. Phytoparasites: reviewed articles regarding phytoparasites as a cause of tree stress.
AuthorsStudy Area (Country)UAV TypeSensorGeometric CorrectionTree Species AffectedStressor
Li et al. [144]Costa RicaMultirotorMultispectralGCPsTropical dry forestLianas
Maes et al. [108]AustraliaMultirotorRGB, thermalGCPsEucalyptus (Eucalyptus fibrosa, E. moluccana)Box mistletoe (Amyema miquelii)
Waite et al. [145]MalaysiaMultirotorRGB-Tropical forestLiana
Yuan et al. [166]Costa RicaMultirotorMultispectral, thermalGCPsNeotropical dry forestLiana
Miraki et al. [113]IranMultirotorRGBGCPsPersian ironwood (Parrotia persica)Common mistletoe (Viscum album)
Table A4. Abiotic stressors: reviewed articles regarding abiotic agents of tree stress.
AuthorsStudy Area (Country)UAV TypeSensorGeometric CorrectionTree Species AffectedStressor
Hernández-Clemente et al. [85]SpainFixed-WingMultispectral-Scots pine (Pinus sylvestris)Drought
Fraser et al. [149]CanadaMultirotorRGB-Jack pine (Pinus banksiana), spruce (Picea glauca, P. mariana)Fire
Ludovisi et al. [147]ItalyMultirotorThermalGCPsBlack poplar (Populus nigra)Drought
McKenna et al. [101]AustraliaFixed-WingRGBGCPsEucalypt forestFire
Buras et al. [150]GermanyMultirotorMultispectral-Scots pine (Pinus sylvestris)Drought
Nagai et al. [169]JapanMultirotorRGB-Japanese cedar (Cryptomeria japonica)Heavy snow
Rossi et al. [91]ArgentinaFixed-WingMultispectralDirect georeferencing (GNSS)Subtropical forestFire
Arkin et al. [154]CanadaMultirotorRGBGCPsDouglas-fir (Pseudotsuga menziesii), white spruce (Picea engelmannii × Picea glauca), lodgepole pine (Pinus contorta)Fire
Carvajal-Ramírez et al. [99]SpainMultirotorRGB, multispectralDirect georeferencing (RTK/PPK), GCPsMediterranean forestFire
Padua et al. [86]PortugalMultirotor, Fixed-WingRGB, mulispectral-Maritime pine (Pinus pinaster)Fire
Rossi and Becker [161]ArgentinaFixed-WingRGB-Subtropical forestFire
Shin et al. [218]South KoreaMultirotorMultispectral-Korean red pine (Pinus densiflora)Fire
Zhu et al. [139]ChinaMultirotorRGB, LiDARDirect georeferencing (RTK/PPK)Mangrove (Kandelia obovate, Avicennia marina, Aegiceras corniculatum)Inundation stress
Campbell et al. [153]United StatesMultirotorRGBGCPsPiñon woodlandDrought
Pádua et al. [151]PortugalFixed-WingRGB, multispectral-Maritime pine (Pinus pinaster)Fire
Talucci et al. [132]RussiaMultirotorRGB, multispectralGCPsCajander larch forest (Larix cajanderi)Fire
Tran et al. [219]South KoreaMultirotorRGB-Not specifiedFire
Viedma et al. [95]SpainNot specifiedLiDARDirect georeferencing (RTK/PPK)Aleppo pine (Pinus halepensis)Fire
Araujo et al. [97]PanamaNot specifiedRGB-Tropical forestExtreme rainfall
Cohen et al. [98]United StatesMultirotorRGBGCPsBlack mangrove (Avicennia germinans)Winter freeze
D’Odorico et al. [105]SwitzerlandMultirotorMultispectral (modified to sense PRI)GCPsScots pine (Pinus sylvestris)Drought
Hillman et al. [100]AustraliaMultirotorRGB, LiDARDirect georeferencing (RTK/PPK), GCPs, CoregistrationEucalyptus (Eucalyptus obliqua, E. globulus)Fire
Woo et al. [220]South KoreaMultirotorMultispectral-Korean red pine (Pinus densiflora), Japanese larch (Larix kaempferi)Fire
Pádua et al. [109]PortugalMultirotorRGB, multispectralGCPsSweet chestnut (Castanea sativa)Nutritional deficiencies, chestnut ink disease (Phytophthora cinnamomi), chestnut blight (Cryphonectria parasitica)
Koontz et al. [22]United StatesMultirotorRGB, multispectralGCPsPonderosa pine (Pinus ponderosa)Drought, Western pine beetle (Dendroctonus brevicomis)
Table A5. Stressor not defined/unknown: reviewed articles in which no stressor was defined.
AuthorsStudy Area (Country)UAV TypeSensorGeometric CorrectionTree Species AffectedStressor
Yuan and Hu [126]China-RGB-Not specifiedNot specified/unknown
Saarinen et al. [34]FinlandSingle-rotor helicopterRGB, hyperspectralGCPsNorway spruce (Picea abies), Scots pine (Pinus sylvestris), downy birch (Betula pendula and B. pubescens)Not specified/unknown
Barmpoutis et al. [121]GreeceMultirotorRGB-FirNot specified/unknown
Khokthong et al. [148]IndonesiaMultirotorRGBGCPsOil palm (Elaeis guineensis)Not specified/unknown
Abdalla et al. [160]IndonesiaMultirotorRGB-AcaciaNot specified/unknown
Campos-Vargas et al. [156]Costa RicaMultirotorMultispectralGCPsTropical dry forestNot specified/unknown
Gallardo-Salazar and Pompa-García [221]MexicoMultirotorMultispectral-Arizona pine (Pinus arizonica)Not specified/unknown

References

  1. Trumbore, S.; Brando, P.; Hartmann, H. Forest health and global change. Science 2015, 349, 814–818. [Google Scholar] [CrossRef] [PubMed] [Green Version]
  2. Kotze, J.D.; Beukes, H.B.; Seifert, T. Essential environmental variables to include in a stratified sampling design for a national-level invasive alien tree survey. iForest 2019, 12, 418–426. [Google Scholar] [CrossRef] [Green Version]
  3. Smith, D.; Smith, I.; Collett, N.; Elms, S. Forest health surveillance in Victoria. Aust. For. 2008, 71, 188–195. [Google Scholar] [CrossRef]
  4. Gauthier, S.; Bernier, P.; Kuuluvainen, T.; Shvidenko, A.Z.; Schepaschenko, D.G. Boreal forest health and global change. Science 2015, 349, 819–822. [Google Scholar] [CrossRef]
  5. Lausch, A.; Borg, E.; Bumberger, J.; Dietrich, P.; Heurich, M.; Huth, A.; Jung, A.; Klenke, R.; Knapp, S.; Mollenhauer, H.; et al. Understanding Forest Health with Remote Sensing, Part III: Requirements for a Scalable Multi-Source Forest Health Monitoring Network Based on Data Science Approaches. Remote Sens. 2018, 10, 1120. [Google Scholar] [CrossRef] [Green Version]
  6. Forest Condition Monitoring (Level-I-Network). Available online: https://www.thuenen.de/de/wo/arbeitsbereiche/bodenschutz-und-waldzustand/waldzustandserhebung/ (accessed on 24 December 2021).
  7. Potter, K.M.; Conkling, B.L. Forest Health Monitoring: National Status, Trends, and Analysis 2020; Technical Report SRS-261; U.S. Department of Agriculture, Forest Service, Southern Research Station: Asheville, NC, USA, 2021. [CrossRef]
  8. Welcome to ICP Forests: A Programme Aiming at a Comprehensive Compilation of Information on the Condition of Forests in Europe and Beyond. Available online: http://icp-forests.net/ (accessed on 10 March 2022).
  9. Michel, A.; Kirchner, T.; Prescher, A.K.; Schwärzel, K. Forest Condition in Europe: The 2021 Assessment; Technical Report under the UNECE Convention on Long-Range Transboundary Air Pollution (Air Convention), ICP Forests; Thünen Institute: Eberswalde, Germany, 2021. [Google Scholar] [CrossRef]
  10. Zimudzi, E.; Sanders, I.; Rollings, N.; Omlin, C.W. Remote sensing of mangroves using unmanned aerial vehicles: Current state and future directions. J. Spat. Sci. 2021, 66, 195–212. [Google Scholar] [CrossRef]
  11. Lausch, A.; Erasmi, S.; King, D.; Magdon, P.; Heurich, M. Understanding Forest Health with Remote Sensing -Part I—A Review of Spectral Traits, Processes and Remote-Sensing Characteristics. Remote Sens. 2016, 8, 1029. [Google Scholar] [CrossRef] [Green Version]
  12. Lausch, A.; Erasmi, S.; King, D.; Magdon, P.; Heurich, M. Understanding Forest Health with Remote Sensing-Part II—A Review of Approaches and Data Models. Remote Sens. 2017, 9, 129. [Google Scholar] [CrossRef] [Green Version]
  13. Pause, M.; Schweitzer, C.; Rosenthal, M.; Keuck, V.; Bumberger, J.; Dietrich, P.; Heurich, M.; Jung, A.; Lausch, A. In Situ/Remote Sensing Integration to Assess Forest Health—A Review. Remote Sens. 2016, 8, 471. [Google Scholar] [CrossRef] [Green Version]
  14. Wulder, M.A.; White, J.C.; Bentz, B.; Alvarez, M.F.; Coops, N.C. Estimating the probability of mountain pine beetle red-attack damage. Remote Sens. Environ. 2006, 101, 150–166. [Google Scholar] [CrossRef]
  15. Seifert, E.; Seifert, S.; Vogt, H.; Drew, D.; van Aardt, J.; Kunneke, A.; Seifert, T. Influence of Drone Altitude, Image Overlap, and Optical Sensor Resolution on Multi-View Reconstruction of Forest Images. Remote Sens. 2019, 11, 1252. [Google Scholar] [CrossRef] [Green Version]
  16. Dainelli, R.; Toscano, P.; Di Gennaro, S.F.; Matese, A. Recent Advances in Unmanned Aerial Vehicles Forest Remote Sensing—A Systematic Review. Part II: Research Applications. Forests 2021, 12, 397. [Google Scholar] [CrossRef]
  17. Colomina, I.; Molina, P. Unmanned aerial systems for photogrammetry and remote sensing: A review. ISPRS J. Photogramm. Remote Sens. 2014, 92, 79–97. [Google Scholar] [CrossRef] [Green Version]
  18. From Unmanned to Uncrewed: Moving Away from Gender-Based Terminology. Available online: https://www.canada.ca/en/department-national-defence/maple-leaf/defence/2021/05/unmanned-to-uncrewed-moving-away-from-gender-based-terminology.html (accessed on 11 May 2022).
  19. Torres, P.; Rodes-Blanco, M.; Viana-Soto, A.; Nieto, H.; García, M. The Role of Remote Sensing for the Assessment and Monitoring of Forest Health: A Systematic Evidence Synthesis. Forests 2021, 12, 1134. [Google Scholar] [CrossRef]
  20. Guimarães, N.; Pádua, L.; Marques, P.; Silva, N.; Peres, E.; Sousa, J.J. Forestry Remote Sensing from Unmanned Aerial Vehicles: A Review Focusing on the Data, Processing and Potentialities. Remote Sens. 2020, 12, 1046. [Google Scholar] [CrossRef] [Green Version]
  21. Iglhaut, J.; Cabo, C.; Puliti, S.; Piermattei, L.; O’Connor, J.; Rosette, J. Structure from Motion Photogrammetry in Forestry: A Review. Curr. For. Rep. 2019, 5, 155–168. [Google Scholar] [CrossRef] [Green Version]
  22. Koontz, M.J.; Latimer, A.M.; Mortenson, L.A.; Fettig, C.J.; North, M.P. Cross-scale interaction of host tree size and climatic water deficit governs bark beetle-induced tree mortality. Nat. Commun. 2021, 12, 129. [Google Scholar] [CrossRef]
  23. Gómez, C.; Alejandro, P.; Hermosilla, T.; Montes, F.; Pascual, C.; Ruiz, L.A.; Álvarez-Taboada, F.; Tanase, M.; Valbuena, R. Remote sensing for the Spanish forests in the 21st century: A review of advances, needs, and opportunities. For. Syst. 2019, 28, 1–33. [Google Scholar] [CrossRef]
  24. Torresan, C.; Berton, A.; Carotenuto, F.; Di Gennaro, S.F.; Gioli, B.; Matese, A.; Miglietta, F.; Vagnoli, C.; Zaldei, A.; Wallace, L. Forestry applications of UAVs in Europe: A review. Int. J. Remote Sens. 2017, 38, 2427–2447. [Google Scholar] [CrossRef]
  25. Manfreda, S.; McCabe, M.; Miller, P.; Lucas, R.; Pajuelo Madrigal, V.; Mallinis, G.; Ben Dor, E.; Helman, D.; Estes, L.; Ciraolo, G.; et al. On the Use of Unmanned Aerial Systems for Environmental Monitoring. Remote Sens. 2018, 10, 641. [Google Scholar] [CrossRef] [Green Version]
  26. Aasen, H.; Honkavaara, E.; Lucieer, A.; Zarco-Tejada, P. Quantitative Remote Sensing at Ultra-High Resolution with UAV Spectroscopy: A Review of Sensor Technology, Measurement Procedures, and Data Correction Workflows. Remote Sens. 2018, 10, 1091. [Google Scholar] [CrossRef] [Green Version]
  27. Pádua, L.; Vanko, J.; Hruška, J.; Adão, T.; Sousa, J.J.; Peres, E.; Morais, R. UAS, sensors, and data processing in agroforestry: A review towards practical applications. Int. J. Remote Sens. 2017, 38, 2349–2391. [Google Scholar] [CrossRef]
  28. Anderson, K.; Gaston, K.J. Lightweight unmanned aerial vehicles will revolutionize spatial ecology. Front. Ecol. Environ. 2013, 11, 138–146. [Google Scholar] [CrossRef] [Green Version]
  29. Cracknell, A.P. UAVs: Regulations and law enforcement. Int. J. Remote Sens. 2017, 38, 3054–3067. [Google Scholar] [CrossRef]
  30. Tmušić, G.; Manfreda, S.; Aasen, H.; James, M.R.; Gonçalves, G.; Ben-Dor, E.; Brook, A.; Polinova, M.; Arranz, J.J.; Mészáros, J.; et al. Current Practices in UAS-based Environmental Monitoring. Remote Sens. 2020, 12, 1001. [Google Scholar] [CrossRef] [Green Version]
  31. Nex, F.; Remondino, F. UAV for 3D mapping applications: A review. Appl. Geomat. 2014, 6, 1–15. [Google Scholar] [CrossRef]
  32. Hall, R.J.; Castilla, G.; White, J.C.; Cooke, B.J.; Skakun, R.S. Remote sensing of forest pest damage: A review and lessons learned from a Canadian perspective. Can. Entomol. 2016, 148, S296–S356. [Google Scholar] [CrossRef]
  33. Han, X.; Thomasson, J.A.; Bagnall, G.C.; Pugh, N.A.; Horne, D.W.; Rooney, W.L.; Jung, J.; Chang, A.; Malambo, L.; Popescu, S.C.; et al. Measurement and Calibration of Plant-Height from Fixed-Wing UAV Images. Sensors 2018, 18, 4092. [Google Scholar] [CrossRef] [Green Version]
  34. Saarinen, N.; Vastaranta, M.; Näsi, R.; Rosnell, T.; Hakala, T.; Honkavaara, E.; Wulder, M.; Luoma, V.; Tommaselli, A.; Imai, N.; et al. Assessing Biodiversity in Boreal Forests with UAV-Based Photogrammetric Point Clouds and Hyperspectral Imaging. Remote Sens. 2018, 10, 338. [Google Scholar] [CrossRef] [Green Version]
  35. Goodbody, T.R.; Coops, N.C.; Marshall, P.L.; Tompalski, P.; Crawford, P. Unmanned aerial systems for precision forest inventory purposes: A review and case study. For. Chron. 2017, 93, 71–81. [Google Scholar] [CrossRef] [Green Version]
  36. Gatziolis, D.; Lienard, J.F.; Vogs, A.; Strigul, N.S. 3D Tree Dimensionality Assessment Using Photogrammetry and Small Unmanned Aerial Vehicles. PLoS ONE 2015, 10, e0137765. [Google Scholar] [CrossRef] [PubMed] [Green Version]
  37. Xiang, T.Z.; Xia, G.S.; Zhang, L. Mini-Unmanned Aerial Vehicle-Based Remote Sensing: Techniques, applications, and prospects. IEEE Geosci. Remote Sens. Mag. 2019, 7, 29–63. [Google Scholar] [CrossRef] [Green Version]
  38. G. Poley, L.; J. McDermid, G. A Systematic Review of the Factors Influencing the Estimation of Vegetation Aboveground Biomass Using Unmanned Aerial Systems. Remote Sens. 2020, 12, 1052. [Google Scholar] [CrossRef] [Green Version]
  39. Hirschmüller, H. Stereo processing by semiglobal matching and mutual information. IEEE Trans. Pattern Anal. Mach. Intell. 2008, 30, 328–341. [Google Scholar] [CrossRef]
  40. Dall’Asta, E.; Roncella, R. A comparison of semiglobal and local dense matching algorithms for surface reconstruction. In Proceedings of the International Archives of the Photogrammetry, Remote Sensing and Spatial Information Sciences, Riva del Garda, Italy, 23–25 June 2014; Volume 45. [Google Scholar] [CrossRef] [Green Version]
  41. White, J.; Wulder, M.; Vastaranta, M.; Coops, N.; Pitt, D.; Woods, M. The Utility of Image-Based Point Clouds for Forest Inventory: A Comparison with Airborne Laser Scanning. Forests 2013, 4, 518–536. [Google Scholar] [CrossRef] [Green Version]
  42. Anderson, K.; Westoby, M.J.; James, M.R. Low-budget topographic surveying comes of age: Structure from motion photogrammetry in geography and the geosciences. Prog. Phys. Geogr. Earth Environ. 2019, 43, 163–173. [Google Scholar] [CrossRef]
  43. Salamí, E.; Barrado, C.; Pastor, E. UAV flight experiments applied to the remote sensing of vegetated areas. Remote Sens. 2014, 6, 11051–11081. [Google Scholar] [CrossRef] [Green Version]
  44. Xia, L.; Zhang, R.; Chen, L.; Li, L.; Yi, T.; Wen, Y.; Ding, C.; Xie, C. Evaluation of Deep Learning Segmentation Models for Detection of Pine Wilt Disease in Unmanned Aerial Vehicle Images. Remote Sens. 2021, 13, 3594. [Google Scholar] [CrossRef]
  45. Nebiker, S.; Annen, A.; Scherrer, M.; Oesch, D. A light-weight multispectral sensor for micro UAV—Opportunities for very high resolution airborne remote sensing. Int. Arch. Photogramm. Remote Sens. Spat. Inf. Sci. 2008, 37, 1193–1200. [Google Scholar]
  46. Nebiker, S.; Lack, N.; Abaecherli, M.; Laederach, S. Light-weight multispectral UAV sensors and their capabilities for predicting grain yield and detecting plant diseases. In Proceedings of the 23rd Congress of the International-Society-for-Photogrammetry-and-Remote-Sensing (ISPRS), Prague, Czech Republic, 12–19 July 2016; Copernicus GmbH: Göttingen, Germany, 2016; Volume 41, pp. 963–970. [Google Scholar] [CrossRef]
  47. Adão, T.; Hruška, J.; Pádua, L.; Bessa, J.; Peres, E.; Morais, R.; Sousa, J. Hyperspectral Imaging: A Review on UAV-Based Sensors, Data Processing and Applications for Agriculture and Forestry. Remote Sens. 2017, 9, 1110. [Google Scholar] [CrossRef] [Green Version]
  48. Loncan, L.; Almeida, L.B.; Bioucas-Dias, J.M.; Briottet, X.; Chanussot, J.; Dobigeon, N.; Fabre, S.; Liao, W.; Licciardi, G.A.; Simoes, M.; et al. Hyperspectral Pansharpening: A Review. IEEE Geosci. Remote Sens. Mag. 2015, 3, 27–46. [Google Scholar] [CrossRef] [Green Version]
  49. Meng, X.; Shen, H.; Li, H.; Zhang, L.; Fu, R. Review of the pansharpening methods for remote sensing images based on the idea of meta-analysis: Practical discussion and challenges. Inf. Fusion 2019, 46, 102–113. [Google Scholar] [CrossRef]
  50. Aiazzi, B.; Baronti, S.; Selva, M. Improving Component Substitution Pansharpening Through Multivariate Regression of MS + Pan Data. IEEE Trans. Geosci. Remote Sens. 2007, 45, 3230–3239. [Google Scholar] [CrossRef]
  51. Thomas, C.; Ranchin, T.; Wald, L.; Chanussot, J. Synthesis of Multispectral Images to High Spatial Resolution: A Critical Review of Fusion Methods Based on Remote Sensing Physics. IEEE Trans. Geosci. Remote Sens. 2008, 46, 1301–1312. [Google Scholar] [CrossRef] [Green Version]
  52. Amro, I.; Mateos, J.; Vega, M.; Molina, R.; Katsaggelos, A.K. A survey of classical methods and new trends in pansharpening of multispectral images. EURASIP J. Adv. Signal Process. 2011, 2011, 79. [Google Scholar] [CrossRef] [Green Version]
  53. Yokoya, N.; Grohnfeldt, C.; Chanussot, J. Hyperspectral and Multispectral Data Fusion: A comparative review of the recent literature. IEEE Geosci. Remote Sens. Mag. 2017, 5, 29–56. [Google Scholar] [CrossRef]
  54. Calleja, J.F.; Requejo Pagés, O.; Díaz-Álvarez, N.; Peón, J.; Gutiérrez, N.; Martín-Hernández, E.; Cebada Relea, A.; Rubio Melendi, D.; Fernández Álvarez, P. Detection of buried archaeological remains with the combined use of satellite multispectral data and UAV data. Int. J. Appl. Earth Obs. Geoinf. 2018, 73, 555–573. [Google Scholar] [CrossRef]
  55. Brook, A.; de Micco, V.; Battipaglia, G.; Erbaggio, A.; Ludeno, G.; Catapano, I.; Bonfante, A. A smart multiple spatial and temporal resolution system to support precision agriculture from satellite images: Proof of concept on Aglianico vineyard. Remote Sens. Environ. 2020, 240, 111679. [Google Scholar] [CrossRef]
  56. RedEdge-P: The New Standard for Data Quality and Repeatability. Available online: https://micasense.com/rededge-p/ (accessed on 1 May 2022).
  57. Huo, L.; Zhang, N.; Zhang, X.; Wu, Y. Tree defoliation classification based on point distribution features derived from single-scan terrestrial laser scanning data. Ecol. Indic. 2019, 103, 782–790. [Google Scholar] [CrossRef]
  58. Shendryk, I.; Broich, M.; Tulbure, M.G.; McGrath, A.; Keith, D.; Alexandrov, S.V. Mapping individual tree health using full-waveform airborne laser scans and imaging spectroscopy: A case study for a floodplain eucalypt forest. Remote Sens. Environ. 2016, 187, 202–217. [Google Scholar] [CrossRef]
  59. Solberg, S.; Næsset, E.; Hanssen, K.H.; Christiansen, E. Mapping defoliation during a severe insect attack on Scots pine using airborne laser scanning. Remote Sens. Environ. 2006, 102, 364–376. [Google Scholar] [CrossRef]
  60. Bohn Reckziegel, R.; Sheppard, J.P.; Kahle, H.P.; Larysch, E.; Spiecker, H.; Seifert, T.; Morhart, C. Virtual pruning of 3D trees as a tool for managing shading effects in agroforestry systems. Agrofor. Syst. 2022, 96, 89–104. [Google Scholar] [CrossRef]
  61. Wallace, L.; Lucieer, A.; Watson, C.; Turner, D. Development of a UAV-LiDAR System with Application to Forest Inventory. Remote Sens. 2012, 4, 1519–1543. [Google Scholar] [CrossRef] [Green Version]
  62. Kuželka, K.; Slavík, M.; Surový, P. Very High Density Point Clouds from UAV Laser Scanning for Automatic Tree Stem Detection and Direct Diameter Measurement. Remote Sens. 2020, 12, 1236. [Google Scholar] [CrossRef] [Green Version]
  63. Dempewolf, J.; Nagol, J.; Hein, S.; Thiel, C.; Zimmermann, R. Measurement of Within-Season Tree Height Growth in a Mixed Forest Stand Using UAV Imagery. Forests 2017, 8, 231. [Google Scholar] [CrossRef] [Green Version]
  64. Schiefer, F.; Kattenborn, T.; Frick, A.; Frey, J.; Schall, P.; Koch, B.; Schmidtlein, S. Mapping forest tree species in high resolution UAV-based RGB-imagery by means of convolutional neural networks. ISPRS J. Photogramm. Remote Sens. 2020, 170, 205–215. [Google Scholar] [CrossRef]
  65. Hyyppä, E.; Hyyppä, J.; Hakala, T.; Kukko, A.; Wulder, M.A.; White, J.C.; Pyörälä, J.; Yu, X.; Wang, Y.; Virtanen, J.P.; et al. Under-canopy UAV laser scanning for accurate forest field measurements. ISPRS J. Photogramm. Remote Sens. 2020, 164, 41–60. [Google Scholar] [CrossRef]
  66. Puliti, S.; Saarela, S.; Gobakken, T.; Ståhl, G.; Næsset, E. Combining UAV and Sentinel-2 auxiliary data for forest growing stock volume estimation through hierarchical model-based inference. Remote Sens. Environ. 2018, 204, 485–497. [Google Scholar] [CrossRef]
  67. Bagaram, M.B.; Giuliarelli, D.; Chirici, G.; Giannetti, F.; Barbati, A. UAV remote sensing for biodiversity monitoring: Are forest canopy gaps good covariates? Remote Sens. 2018, 10, 1397. [Google Scholar] [CrossRef]
  68. Sothe, C.; Dalponte, M.; de Almeida, C.M.; Schimalski, M.B.; Lima, C.L.; Liesenberg, V.; Miyoshi, G.T.; Tommaselli, A.M.G. Tree Species Classification in a Highly Diverse Subtropical Forest Integrating UAV-Based Photogrammetric Point Cloud and Hyperspectral Data. Remote Sens. 2019, 11, 1338. [Google Scholar] [CrossRef] [Green Version]
  69. Yaney-Keller, A.; Santidrián Tomillo, P.; Marshall, J.M.; Paladino, F.V. Using Unmanned Aerial Systems (UAS) to assay mangrove estuaries on the Pacific coast of Costa Rica. PLoS ONE 2019, 14, e0217310. [Google Scholar] [CrossRef] [PubMed]
  70. Witczuk, J.; Pagacz, S.; Zmarz, A.; Cypel, M. Exploring the feasibility of unmanned aerial vehicles and thermal imaging for ungulate surveys in forests - preliminary results. Int. J. Remote Sens. 2018, 39, 5504–5521. [Google Scholar] [CrossRef]
  71. Hendel, I.G.; Ross, G.M. Efficacy of Remote Sensing in Early Forest Fire Detection: A Thermal Sensor Comparison. Can. J. Remote Sens. 2020, 46, 414–428. [Google Scholar] [CrossRef]
  72. Yuan, C.; Zhang, Y.; Liu, Z. A survey on technologies for automatic forest fire monitoring, detection, and fighting using unmanned aerial vehicles and remote sensing techniques. Can. J. For. Res. 2015, 45, 783–792. [Google Scholar] [CrossRef]
  73. FAO and UNEP. The State of the World’s Forests 2020: Forests, Biodiversity and People; FAO and UNEP: Rome, Italy, 2020; p. 214. [Google Scholar] [CrossRef]
  74. Miura, S.; Amacher, M.; Hofer, T.; San-Miguel-Ayanz, J.; Ernawati; Thackway, R. Protective functions and ecosystem services of global forests in the past quarter-century. For. Ecol. Manag. 2015, 352, 35–46. [Google Scholar] [CrossRef] [Green Version]
  75. Mensah, S.; Veldtman, R.; Assogbadjo, A.E.; Ham, C.; Glèlè Kakaï, R.; Seifert, T. Ecosystem service importance and use vary with socio-environmental factors: A study from household-surveys in local communities of South Africa. Ecosyst. Serv. 2017, 23, 1–8. [Google Scholar] [CrossRef]
  76. Niinemets, Ü. Responses of forest trees to single and multiple environmental stresses from seedlings to mature plants: Past stress history, stress interactions, tolerance and acclimation. For. Ecol. Manag. 2010, 260, 1623–1639. [Google Scholar] [CrossRef]
  77. Seidl, R.; Thom, D.; Kautz, M.; Martin-Benito, D.; Peltoniemi, M.; Vacchiano, G.; Wild, J.; Ascoli, D.; Petr, M.; Honkaniemi, J. Forest disturbances under climate change. Nat. Clim. Chang. 2017, 7, 395–402. [Google Scholar] [CrossRef] [Green Version]
  78. Stone, C.; Mohammed, C. Application of Remote Sensing Technologies for Assessing Planted Forests Damaged by Insect Pests and Fungal Pathogens: A Review. Curr. For. Rep. 2017, 3, 75–92. [Google Scholar] [CrossRef]
  79. Lambers, H.; Oliveira, R.S. Introduction: History, Assumptions, and Approaches. In Plant Physiological Ecology, 3rd ed.; Springer International Publishing AG: Cham, Switzerland, 2019; pp. 1–10. [Google Scholar] [CrossRef]
  80. Eitel, J.U.; Vierling, L.A.; Litvak, M.E.; Long, D.S.; Schulthess, U.; Ager, A.A.; Krofcheck, D.J.; Stoscheck, L. Broadband, red-edge information from satellites improves early stress detection in a New Mexico conifer woodland. Remote Sens. Environ. 2011, 115, 3640–3646. [Google Scholar] [CrossRef]
  81. Hernández-Clemente, R.; Navarro-Cerrillo, R.M.; Suárez, L.; Morales, F.; Zarco-Tejada, P.J. Assessing structural effects on PRI for stress detection in conifer forests. Remote Sens. Environ. 2011, 115, 2360–2375. [Google Scholar] [CrossRef]
  82. Grulke, N.E.; Heath, R.L. Ozone effects on plants in natural ecosystems. Plant Biol. 2020, 22 (Suppl. 1), 12–37. [Google Scholar] [CrossRef] [PubMed]
  83. Schuldt, B.; Buras, A.; Arend, M.; Vitasse, Y.; Beierkuhnlein, C.; Damm, A.; Gharun, M.; Grams, T.E.; Hauck, M.; Hajek, P.; et al. A first assessment of the impact of the extreme 2018 summer drought on Central European forests. Basic Appl. Ecol. 2020, 45, 86–103. [Google Scholar] [CrossRef]
  84. Obladen, N.; Dechering, P.; Skiadaresis, G.; Tegel, W.; Keßler, J.; Höllerl, S.; Kaps, S.; Hertel, M.; Dulamsuren, C.; Seifert, T.; et al. Tree mortality of European beech and Norway spruce induced by 2018-2019 hot droughts in central Germany. Agric. For. Meteorol. 2021, 307, 108482. [Google Scholar] [CrossRef]
  85. Hernández-Clemente, R.; Navarro-Cerrillo, R.M.; Zarco-Tejada, P.J. Carotenoid content estimation in a heterogeneous conifer forest using narrow-band indices and PROSPECT+DART simulations. Remote Sens. Environ. 2012, 127, 298–315. [Google Scholar] [CrossRef]
  86. Padua, L.; Adao, T.; Guimaraes, N.; Sousa, A.; Peres, E.; Sousa, J.J. Post-fire Forestry Recovery Monitoring Using High-resolution Multispectral Imagery From Unmanned Aerial Vehicles. In Proceedings of the Conference on Geo-Information for Disaster Management (Gi4DM), Prague, Czech Republic, 3–6 September 2019; Copernicus GmbH: Göttingen, Germany, 2019; Volume XLII-3/W8, pp. 301–305. [Google Scholar] [CrossRef] [Green Version]
  87. Safonova, A.; Hamad, Y.; Dmitriev, E.; Georgiev, G.; Trenkin, V.; Georgieva, M.; Dimitrov, S.; Iliev, M. Individual Tree Crown Delineation for the Species Classification and Assessment of Vital Status of Forest Stands from UAV Images. Drones 2021, 5, 77. [Google Scholar] [CrossRef]
  88. Lehmann, J.; Nieberding, F.; Prinz, T.; Knoth, C. Analysis of Unmanned Aerial System-Based CIR Images in Forestry—A New Perspective to Monitor Pest Infestation Levels. Forests 2015, 6, 594–612. [Google Scholar] [CrossRef] [Green Version]
  89. Michez, A.; Piégay, H.; Lisein, J.; Claessens, H.; Lejeune, P. Classification of riparian forest species and health condition using multi-temporal and hyperspatial imagery from unmanned aerial system. Environ. Monit. Assess. 2016, 188, 146. [Google Scholar] [CrossRef] [Green Version]
  90. Brovkina, O.; Cienciala, E.; Surový, P.; Janata, P. Unmanned aerial vehicles (UAV) for assessment of qualitative classification of Norway spruce in temperate forest stands. Geo-Spat. Inf. Sci. 2018, 21, 12–20. [Google Scholar] [CrossRef] [Green Version]
  91. Rossi, F.; Fritz, A.; Becker, G. Combining Satellite and UAV Imagery to Delineate Forest Cover and Basal Area after Mixed-Severity Fires. Sustainability 2018, 10, 2227. [Google Scholar] [CrossRef] [Green Version]
  92. Klouček, T.; Komárek, J.; Surový, P.; Hrach, K.; Janata, P.; Vašíček, B. The Use of UAV Mounted Sensors for Precise Detection of Bark Beetle Infestation. Remote Sens. 2019, 11, 1561. [Google Scholar] [CrossRef] [Green Version]
  93. Paczkowski, S.; Datta, P.; Irion, H.; Paczkowska, M.; Habert, T.; Pelz, S.; Jaeger, D. Evaluation of Early Bark Beetle Infestation Localization by Drone-Based Monoterpene Detection. Forests 2021, 12, 228. [Google Scholar] [CrossRef]
  94. Honkavaara, E.; Näsi, R.; Oliveira, R.; Viljanen, N.; Suomalainen, J.; Khoramshahi, E.; Hakala, T.; Nevalainen, O.; Markelin, L.; Vuorinen, M.; et al. Using multitemporal hyper- and multispectral UAV imaging for detecting bark beetle infestation on Norway spruce. Int. Arch. Photogramm. Remote Sens. Spat. Inf. Sci. 2020, XLIII-B3-2020, 429–434. [Google Scholar] [CrossRef]
  95. Viedma, O.; Almeida, D.R.A.; Moreno, J.M. Postfire Tree Structure from High-Resolution LiDAR and RBR Sentinel 2A Fire Severity Metrics in a Pinus halepensis-Dominated Burned Stand. Remote Sens. 2020, 12, 3554. [Google Scholar] [CrossRef]
  96. Cessna, J.; Alonzo, M.G.; Foster, A.C.; Cook, B.D. Mapping Boreal Forest Spruce Beetle Health Status at the Individual Crown Scale Using Fused Spectral and Structural Data. Forests 2021, 12, 1145. [Google Scholar] [CrossRef]
  97. Araujo, R.F.; Grubinger, S.; Celes, C.H.S.; Negrón-Juárez, R.I.; Garcia, M.; Dandois, J.P.; Muller-Landau, H.C. Strong temporal variation in treefall and branchfall rates in a tropical forest is related to extreme rainfall: Results from 5 years of monthly drone data for a 50 ha plot. Biogeosciences 2021, 18, 6517–6531. [Google Scholar] [CrossRef]
  98. Cohen, M.C.; de Souza, A.V.; Liu, K.b.; Rodrigues, E.; Yao, Q.; Ryu, J.; Dietz, M.; Pessenda, L.C.; Rossetti, D. Effects of the 2017–2018 winter freeze on the northern limit of the American mangroves, Mississippi River delta plain. Geo-Spat. Inf. Sci. 2021, 394, 107968. [Google Scholar] [CrossRef]
  99. Carvajal-Ramírez, F.; Da Marques Silva, J.R.; Agüera-Vega, F.; Martínez-Carricondo, P.; Serrano, J.; Moral, F.J. Evaluation of Fire Severity Indices Based on Pre- and Post-Fire Multispectral Imagery Sensed from UAV. Remote Sens. 2019, 11, 993. [Google Scholar] [CrossRef] [Green Version]
  100. Hillman, S.; Hally, B.; Wallace, L.; Turner, D.; Lucieer, A.; Reinke, K.; Jones, S. High-Resolution Estimates of Fire Severity—An Evaluation of UAS Image and LiDAR Mapping Approaches on a Sedgeland Forest Boundary in Tasmania, Australia. Fire Ecol. 2021, 4, 14. [Google Scholar] [CrossRef]
  101. McKenna, P.; Erskine, P.D.; Lechner, A.M.; Phinn, S. Measuring fire severity using UAV imagery in semi-arid central Queensland, Australia. Int. J. Remote Sens. 2017, 38, 4244–4264. [Google Scholar] [CrossRef]
  102. Abdollahnejad, A.; Panagiotidis, D. Tree Species Classification and Health Status Assessment for a Mixed Broadleaf-Conifer Forest with UAS Multispectral Imaging. Remote Sens. 2020, 12, 3722. [Google Scholar] [CrossRef]
  103. Dash, J.P.; Watt, M.S.; Pearse, G.D.; Heaphy, M.; Dungey, H.S. Assessing very high resolution UAV imagery for monitoring forest health during a simulated disease outbreak. ISPRS J. Photogramm. Remote Sens. 2017, 131, 1–14. [Google Scholar] [CrossRef]
  104. Dash, J.; Pearse, G.; Watt, M. UAV Multispectral Imagery Can Complement Satellite Data for Monitoring Forest Health. Remote Sens. 2018, 10, 1216. [Google Scholar] [CrossRef] [Green Version]
  105. D’Odorico, P.; Schönbeck, L.; Vitali, V.; Meusburger, K.; Schaub, M.; Ginzler, C.; Zweifel, R.; Velasco, V.M.E.; Gisler, J.; Gessler, A.; et al. Drone-based physiological index reveals long-term acclimation and drought stress responses in trees. Plant Cell Environ. 2021, 44, 3552–3570. [Google Scholar] [CrossRef] [PubMed]
  106. Iordache, M.D.; Mantas, V.; Baltazar, E.; Lewyckyj, N.; Souverijns, N. Application of Random forest classification to detect the pine wilt disease from high resolution spectral images. In Proceedings of the IGARSS 2020—2020 IEEE International Geoscience and Remote Sensing Symposium, Waikoloa, HI, USA, 26 September–2 October 2020; Institute of Electrical and Electronics Engineers (IEEE): Piscataway, NJ, USA, 2020; pp. 4489–4492. [Google Scholar] [CrossRef]
  107. Lee, S.; Park, S.J.; Baek, G.; Kim, H.; Lee, C.W. Detection of damaged pine tree by the pine wilt disease using UAV Image. Korean J. Remote Sens. 2019, 35, 359–373. [Google Scholar]
  108. Maes, W.; Huete, A.; Avino, M.; Boer, M.; Dehaan, R.; Pendall, E.; Griebel, A.; Steppe, K. Can UAV-Based Infrared Thermography Be Used to Study Plant-Parasite Interactions between Mistletoe and Eucalypt Trees? Remote Sens. 2018, 10, 2062. [Google Scholar] [CrossRef] [Green Version]
  109. Pádua, L.; Marques, P.; Martins, L.; Sousa, A.; Peres, E.; Sousa, J.J. Monitoring of Chestnut Trees Using Machine Learning Techniques Applied to UAV-Based Multispectral Data. Remote Sens. 2020, 12, 3032. [Google Scholar] [CrossRef]
  110. Schaeffer, S.E.; Jiménez-Lizárraga, M.; Rodriguez-Sanchez, S.V.; Cuellar-Rodríguez, G.; Aguirre-Calderón, O.A.; Reyna-González, A.M.; Escobar, A. Detection of bark beetle infestation in drone imagery via thresholding cellular automata. J. Appl. Remote Sens. 2021, 15, 016518. [Google Scholar] [CrossRef]
  111. Wu, B.; Liang, A.; Zhang, H.; Zhu, T.; Zou, Z.; Yang, D.; Tang, W.; Li, J.; Su, J. Application of conventional UAV-based high-throughput object detection to the early diagnosis of pine wilt disease by deep learning. For. Ecol. Manag. 2021, 486, 118986. [Google Scholar] [CrossRef]
  112. Yu, R.; Luo, Y.; Li, H.; Yang, L.; Huang, H.; Yu, L.; Ren, L. Three-Dimensional Convolutional Neural Network Model for Early Detection of Pine Wilt Disease Using UAV-Based Hyperspectral Images. Remote Sens. 2021, 13, 4065. [Google Scholar] [CrossRef]
  113. Miraki, M.; Sohrabi, H.; Fatehi, P.; Kneubuehler, M. Detection of mistletoe infected trees using UAV high spatial resolution images. J. Plant Dis. Prot. 2021, 128, 1679–1689. [Google Scholar] [CrossRef]
  114. Klein Hentz, Â.M.; Strager, M.P. Cicada (Magicicada) Tree Damage Detection Based on UAV Spectral and 3D Data. Nat. Sci. 2018, 10, 31–44. [Google Scholar] [CrossRef] [Green Version]
  115. Pádua, L.; Hruška, J.; Bessa, J.; Adão, T.; Martins, L.; Gonçalves, J.; Peres, E.; Sousa, A.; Castro, J.; Sousa, J. Multi-Temporal Analysis of Forestry and Coastal Environments Using UASs. Remote Sens. 2018, 10, 24. [Google Scholar] [CrossRef] [Green Version]
  116. Lin, Q.; Huang, H.; Wang, J.; Huang, K.; Liu, Y. Detection of Pine Shoot Beetle (PSB) Stress on Pine Forests at Individual Tree Level using UAV-Based Hyperspectral Imagery and Lidar. Remote Sens. 2019, 11, 2540. [Google Scholar] [CrossRef] [Green Version]
  117. Lin, Q.; Huang, H.; Chen, L.; Wang, J.; Huang, K.; Liu, Y. Using the 3D model RAPID to invert the shoot dieback ratio of vertically heterogeneous Yunnan pine forests to detect beetle damage. Remote Sens. Environ. 2021, 260, 112475. [Google Scholar] [CrossRef]
  118. Yu, R.; Luo, Y.; Zhou, Q.; Zhang, X.; Wu, D.; Ren, L. A machine learning algorithm to detect pine wilt disease using UAV-based hyperspectral imagery and LiDAR data at the tree level. Int. J. Appl. Earth Obs. Geoinf. 2021, 101, 102363. [Google Scholar] [CrossRef]
  119. Guerra-Hernández, J.; Díaz-Varela, R.A.; Ávarez-González, J.G.; Rodríguez-González, P.M. Assessing a novel modelling approach with high resolution UAV imagery for monitoring health status in priority riparian forests. For. Ecosyst. 2021, 8, 61. [Google Scholar] [CrossRef]
  120. Minařík, R.; Langhammer, J.; Lendzioch, T. Automatic Tree Crown Extraction from UAS Multispectral Imagery for the Detection of Bark Beetle Disturbance in Mixed Forests. Remote Sens. 2020, 12, 4081. [Google Scholar] [CrossRef]
  121. Barmpoutis, P.; Stathaki, T.; Kamperidou, V. Monitoring of trees’ health condition using a uav equipped with low-cost digital camera. In Proceedings of the 44th IEEE International Conference on Acoustics, Speech and Signal Processing (ICASSP), Brighton, UK, 12–17 May 2019; Institute of Electrical and Electronics Engineers (IEEE): Piscataway, NJ, USA, 2019; pp. 8291–8295. [Google Scholar] [CrossRef]
  122. Ganthaler, A.; Losso, A.; Mayr, S. Using image analysis for quantitative assessment of needle bladder rust disease of Norway spruce. Plant Pathol. 2018, 67, 1122–1130. [Google Scholar] [CrossRef] [Green Version]
  123. Gerard, F.; George, C.; Iglhaut, J.; Broughton, R.; Chavana-Bryant, C.; White, K.; Schonrogge, K. Deriving hyper spectral reflectance spectra from uav data collected in changeable illumination conditions to assess vegetation condition. In Proceedings of the 38th IEEE International Geoscience and Remote Sensing Symposium (IGARSS), Valencia, Spain, 22–27 July 2018; Institute of Electrical and Electronics Engineers (IEEE): Piscataway, NJ, USA, 2018; pp. 8837–8840. [Google Scholar]
  124. Li, F.; Liu, Z.; Shen, W.; Wang, Y.; Wang, Y.; Ge, C.; Sun, F.; Lan, P. A Remote Sensing and Airborne Edge-Computing Based Detection System for Pine Wilt Disease. IEEE Access 2021, 9, 66346–66360. [Google Scholar] [CrossRef]
  125. Akıncı, Ş.; Göktoǧan, A. Detection and Mapping of Pine Processionary Moth Nests in UAV Imagery of Pine Forests Using Semantic Segmentation. In Proceedings of the Australasian Conference on Robotics and Automation (ACRA), Adelaide, Australia, 9–11 December 2019. [Google Scholar]
  126. Yuan, Y.; Hu, X. Random forest and objected-based classification for forest pest extraction from UAV aerial imagery. In Proceedings of the 23rd Congress of the International-Society-for-Photogrammetry-and-Remote-Sensing (ISPRS), Prague, Czech Republic, 12–19 July 2016; Copernicus GmbH: Göttingen, Germany, 2016; Volume 41, pp. 1093–1098. [Google Scholar] [CrossRef]
  127. Xu, K.; Gong, Y.; Fang, S.; Wang, K.; Lin, Z.; Wang, F. Radiometric calibration of UAV remote sensing image with spectral angle constraint. Remote Sens. 2019, 11, 1291. [Google Scholar] [CrossRef] [Green Version]
  128. Guo, Y.; Senthilnath, J.; Wu, W.; Zhang, X.; Zeng, Z.; Huang, H. Radiometric calibration for multispectral camera of different imaging conditions mounted on a UAV platform. Sustainability 2019, 11, 978. [Google Scholar] [CrossRef] [Green Version]
  129. Cardil, A.; Otsu, K.; Pla, M.; Silva, C.A.; Brotons, L. Quantifying pine processionary moth defoliation in a pine-oak mixed forest using unmanned aerial systems and multispectral imagery. PLoS ONE 2019, 14, e0213027. [Google Scholar] [CrossRef] [PubMed]
  130. Minařík, R.; Langhammer, J.; Lendzioch, T. Detection of Bark Beetle Disturbance at Tree Level Using UAS Multispectral Imagery and Deep Learning. Remote Sens. 2021, 13, 4768. [Google Scholar] [CrossRef]
  131. Dimitrov, S.; Georgiev, G.; Mirchev, P.; Georgieva, M.; Iliev, M.; Doychev, D.; Bencheva, S.; Zaemdzhikova, G.; Zaphirov, N. Integrated model of application of remote sensing and field investigations for sanitary status assessment of forest stands in two reserves in West Balkan Range, Bulgaria. In Proceedings of the 7th International Conference on Remote Sensing and Geoinformation of the Environment (RSCy), Cyprus Remote Sensing Soc, Paphos, Cyprus, 18–21 March 2019; SPIE-INT SOC Optical Engineering: Bellingham, WA, USA, 2019; Volume 11174. [Google Scholar] [CrossRef]
  132. Talucci, A.C.; Forbath, E.; Kropp, H.; Alexander, H.D.; DeMarco, J.; Paulson, A.K.; Zimov, N.S.; Zimov, S.; Loranty, M.M. Evaluating Post-Fire Vegetation Recovery in Cajander Larch Forests in Northeastern Siberia Using UAV Derived Vegetation Indices. Remote Sens. 2020, 12, 2970. [Google Scholar] [CrossRef]
  133. Duarte, A.; Acevedo-Muñoz, L.; Gonçalves, C.I.; Mota, L.; Sarmento, A.; Silva, M.; Fabres, S.; Borralho, N.; Valente, C. Detection of Longhorned Borer Attack and Assessment in Eucalyptus Plantations Using UAV Imagery. Remote Sens. 2020, 12, 3153. [Google Scholar] [CrossRef]
  134. Näsi, R.; Honkavaara, E.; Lyytikäinen-Saarenmaa, P.; Blomqvist, M.; Litkey, P.; Hakala, T.; Viljanen, N.; Kantola, T.; Tanhuanpää, T.; Holopainen, M. Using UAV-Based Photogrammetry and Hyperspectral Imaging for Mapping Bark Beetle Damage at Tree-Level. Remote Sens. 2015, 7, 15467–15493. [Google Scholar] [CrossRef] [Green Version]
  135. Näsi, R.; Honkavaara, E.; Blomqvist, M.; Lyytikäinen-Saarenmaa, P.; Hakala, T.; Viljanen, N.; Kantola, T.; Holopainen, M. Remote sensing of bark beetle damage in urban forests at individual tree level using a novel hyperspectral camera from UAV and aircraft. Urban For. Urban Green. 2018, 30, 72–83. [Google Scholar] [CrossRef]
  136. Smigaj, M.; Gaulton, R.; Barr, S.L.; Suarez, J.C. UAV-borne Thermal Imaging For Forest Health Monitoring: Detection Of Disease-Induced Canopy Temperature Increase. In Proceedings of the ISPRS Geospatial Week, La Grande Motte, France, 28 September–3 October 2015; Copernicus GmbH: Göttingen, Germany, 2015; Volume XL-3/W3, pp. 349–354. [Google Scholar] [CrossRef] [Green Version]
  137. Smigaj, M.; Gaulton, R.; Suárez, J.C.; Barr, S.L. Canopy temperature from an Unmanned Aerial Vehicle as an indicator of tree stress associated with red band needle blight severity. For. Ecol. Manag. 2019, 433, 699–708. [Google Scholar] [CrossRef]
  138. Otsu, K.; Pla, M.; Duane, A.; Cardil, A.; Brotons, L. Estimating the Threshold of Detection on Tree Crown Defoliation Using Vegetation Indices from UAS Multispectral Imagery. Drones 2019, 3, 80. [Google Scholar] [CrossRef] [Green Version]
  139. Zhu, X.; Hou, Y.; Weng, Q.; Chen, L. Integrating UAV optical imagery and LiDAR data for assessing the spatial relationship between mangrove and inundation across a subtropical estuarine wetland. ISPRS J. Photogramm. Remote Sens. 2019, 149, 146–156. [Google Scholar] [CrossRef]
  140. Liu, M.; Zhang, Z.; Liu, X.; Yao, J.; Du, T.; Ma, Y.; Shi, L. Discriminant Analysis of the Damage Degree Caused by Pine Shoot Beetle to Yunnan Pine Using UAV-Based Hyperspectral Images. Forests 2020, 11, 1258. [Google Scholar] [CrossRef]
  141. Qin, J.; Wang, B.; Wu, Y.; Lu, Q.; Zhu, H. Identifying Pine Wood Nematode Disease Using UAV Images and Deep Learning Algorithms. Remote Sens. 2021, 13, 162. [Google Scholar] [CrossRef]
  142. Yu, R.; Luo, Y.; Zhou, Q.; Zhang, X.; Wu, D.; Ren, L. Early detection of pine wilt disease using deep learning algorithms and UAV-based multispectral imagery. For. Ecol. Manag. 2021, 497, 119493. [Google Scholar] [CrossRef]
  143. Otsu, K.; Pla, M.; Vayreda, J.; Brotons, L. Calibrating the Severity of Forest Defoliation by Pine Processionary Moth with Landsat and UAV Imagery. Sensors 2018, 18, 3278. [Google Scholar] [CrossRef] [Green Version]
  144. Li, W.; Campos-Vargas, C.; Marzahn, P.; Sanchez-Azofeifa, A. On the estimation of tree mortality and liana infestation using a deep self-encoding network. Int. J. Appl. Earth Obs. Geoinf. 2018, 73, 1–13. [Google Scholar] [CrossRef]
  145. Waite, C.E.; Heijden, G.M.F.; Field, R.; Boyd, D.S. A view from above: Unmanned aerial vehicles ( UAV s) provide a new tool for assessing liana infestation in tropical forest canopies. J. Appl. Ecol. 2019, 56, 902–912. [Google Scholar] [CrossRef]
  146. Yu, R.; Ren, L.; Luo, Y. Early detection of pine wilt disease in Pinus tabuliformis in North China using a field portable spectrometer and UAV-based hyperspectral imagery. For. Ecosyst. 2021, 8, 44. [Google Scholar] [CrossRef]
  147. Ludovisi, R.; Tauro, F.; Salvati, R.; Khoury, S.; Mugnozza Scarascia, G.; Harfouche, A. UAV-Based Thermal Imaging for High-Throughput Field Phenotyping of Black Poplar Response to Drought. Front. Plant Sci. 2017, 8, 1681. [Google Scholar] [CrossRef]
  148. Khokthong, W.; Zemp, D.C.; Irawan, B.; Sundawati, L.; Kreft, H.; Hölscher, D. Drone-Based Assessment of Canopy Cover for Analyzing Tree Mortality in an Oil Palm Agroforest. Front. For. Glob. Chang. 2019, 2, 12. [Google Scholar] [CrossRef] [Green Version]
  149. Fraser, R.; van der Sluijs, J.; Hall, R. Calibrating Satellite-Based Indices of Burn Severity from UAV-Derived Metrics of a Burned Boreal Forest in NWT, Canada. Remote Sens. 2017, 9, 279. [Google Scholar] [CrossRef] [Green Version]
  150. Buras, A.; Schunk, C.; Zeiträg, C.; Herrmann, C.; Kaiser, L.; Lemme, H.; Straub, C.; Taeger, S.; Gößwein, S.; Klemmt, H.J.; et al. Are Scots pine forest edges particularly prone to drought-induced mortality? Environ. Res. Lett. 2018, 13, 025001. [Google Scholar] [CrossRef]
  151. Pádua, L.; Guimarães, N.; Adão, T.; Sousa, A.; Peres, E.; Sousa, J.J. Effectiveness of Sentinel-2 in Multi-Temporal Post-Fire Monitoring When Compared with UAV Imagery. ISPRS Int. J. Geo-Inf. 2020, 9, 225. [Google Scholar] [CrossRef] [Green Version]
  152. Röder, M.; Latifi, H.; Hill, S.; Wild, J.; Svoboda, M.; Brůna, J.; Macek, M.; Nováková, M.H.; Gülch, E.; Heurich, M. Application of optical unmanned aerial vehicle-based imagery for the inventory of natural regeneration and standing deadwood in post-disturbed spruce forests. Int. J. Remote Sens. 2018, 39, 5288–5309. [Google Scholar] [CrossRef]
  153. Campbell, M.J.; Dennison, P.E.; Tune, J.W.; Kannenberg, S.A.; Kerr, K.L.; Codding, B.F.; Anderegg, W.R. A multi-sensor, multi-scale approach to mapping tree mortality in woodland ecosystems. Remote Sens. Environ. 2020, 245, 111853. [Google Scholar] [CrossRef]
  154. Arkin, J.; Coops, N.C.; Hermosilla, T.; Daniels, L.D.; Plowright, A. Integrated fire severity–land cover mapping using very-high-spatial-resolution aerial imagery and point clouds. Int. J. Wildland Fire 2019, 28, 840. [Google Scholar] [CrossRef]
  155. Nguyen, H.T.; Lopez Caceres, M.L.; Moritake, K.; Kentsch, S.; Shu, H.; Diez, Y. Individual Sick Fir Tree (Abies mariesii) Identification in Insect Infested Forests by Means of UAV Images and Deep Learning. Remote Sens. 2021, 13, 260. [Google Scholar] [CrossRef]
  156. Campos-Vargas, C.; Sanchez-Azofeifa, A.; Laakso, K.; Marzahn, P. Unmanned Aerial System and Machine Learning Techniques Help to Detect Dead Woody Components in a Tropical Dry Forest. Forests 2020, 11, 827. [Google Scholar] [CrossRef]
  157. Syifa, M.; Park, S.j.; Lee, C.W. Detection of the Pine Wilt Disease Tree Candidates for Drone Remote Sensing Using Artificial Intelligence Techniques. Engineering 2020, 6, 919–926. [Google Scholar] [CrossRef]
  158. Navarro, A.; Catalao, J.; Calvao, J. Assessing the Use of Sentinel-2 Time Series Data for Monitoring Cork Oak Decline in Portugal. Remote Sens. 2019, 11, 2515. [Google Scholar] [CrossRef] [Green Version]
  159. Dell, M.; Stone, C.; Osborn, J.; Glen, M.; McCoull, C.; Rimbawanto, A.; Tjahyono, B.; Mohammed, C. Detection of necrotic foliage in a young Eucalyptus pellita plantation using unmanned aerial vehicle RGB photography—A demonstration of concept. Aust. For. 2019, 82, 79–88. [Google Scholar] [CrossRef] [Green Version]
  160. Abdalla, D.; Ramdan, H.; Dungani, R. Spectral Colour Characteristic’s (Red, Green, Blue) of Sick Acacia Mangium Stand. In Proceedings of the 2nd International Conference on Environment and Forest Conservation (ICEFC), Mindanao State University, Bogor, Indonesia, 1–3 October 2019; IOP Publishing: Bristol, UK, 2020; Volume 528, p. 012049. [Google Scholar] [CrossRef]
  161. Rossi, F.; Becker, G. Creating forest management units with Hot Spot Analysis (Getis-Ord Gi*) over a forest affected by mixed-severity fires. Aust. For. 2019, 82, 166–175. [Google Scholar] [CrossRef]
  162. Zhang, N.; Zhang, X.; Yang, G.; Zhu, C.; Huo, L.; Feng, H. Assessment of defoliation during the Dendrolimus tabulaeformis Tsai et Liu disaster outbreak using UAV-based hyperspectral images. Remote Sens. Environ. 2018, 217, 323–339. [Google Scholar] [CrossRef]
  163. Sandino, J.; Pegg, G.; Gonzalez, F.; Smith, G. Aerial Mapping of Forests Affected by Pathogens Using UAVs, Hyperspectral Sensors, and Artificial Intelligence. Sensors 2018, 18, 944. [Google Scholar] [CrossRef] [PubMed] [Green Version]
  164. Kampen, M.; Lederbauer, S.; Mund, J.P.; Immitzer, M. UAV-Based Multispectral Data for Tree Species Classification and Tree Vitality Analysis. In Proceedings of the Dreiländertagung der Deutschen Gesellschaft für Photogrammetrie, Fernerkundung und Geoinformation (DGPF), der OVG und der SGPF, Wien, Austria, 20–22 February 2019. [Google Scholar]
  165. Doonan, J.; Denman, S.; Pachebat, J.A.; McDonald, J.E. Genomic analysis of bacteria in the Acute Oak Decline pathobiome. Microb. Genom. 2019, 5, e000240. [Google Scholar] [CrossRef] [PubMed]
  166. Yuan, X.; Laakso, K.; Marzahn, P.; Sanchez-Azofeifa, G.A. Canopy Temperature Differences between Liana-Infested and Non-Liana Infested Areas in a Neotropical Dry Forest. Forests 2019, 10, 890. [Google Scholar] [CrossRef] [Green Version]
  167. Cox, C.J.; Edwards, W.; Campbell, M.J.; Laurance, W.F.; Laurance, S.G.W. Liana cover in the canopies of rainforest trees is not predicted by local ground–based measures. Austral Ecol. 2019, 44, 759–767. [Google Scholar] [CrossRef]
  168. Visser, M.D.; Muller-Landau, H.C.; Schnitzer, S.A.; Kroon, H.; Jongejans, E.; Wright, S.J. A host–parasite model explains variation in liana infestation among co–occurring tree species. J. Ecol. 2018, 106, 2435–2445. [Google Scholar] [CrossRef] [Green Version]
  169. Nagai, S.; Saitoh, T.M.; Kajiwara, K.; Yoshitake, S.; Honda, Y. Investigation of the potential of drone observations for detection of forest disturbance caused by heavy snow damage in a Japanese cedar (Cryptomeria japonica) forest. J. Agric. Meteorol. 2018, 74, 123–127. [Google Scholar] [CrossRef] [Green Version]
  170. Gamon, J.A.; Peñuelas, J.; Field, C.B. A narrow-waveband spectral index that tracks diurnal changes in photosynthetic efficiency. Remote Sens. Environ. 1992, 41, 35–44. [Google Scholar] [CrossRef]
  171. Raparelli, E.; Bajocco, S. A bibliometric analysis on the use of unmanned aerial vehicles in agricultural and forestry studies. Int. J. Remote Sens. 2019, 40, 9070–9083. [Google Scholar] [CrossRef]
  172. Dainelli, R.; Toscano, P.; Di Gennaro, S.F.; Matese, A. Recent Advances in Unmanned Aerial Vehicle Forest Remote Sensing—A Systematic Review. Part I: A General Framework. Forests 2021, 12, 327. [Google Scholar] [CrossRef]
  173. Frey, J.; Kovach, K.; Stemmler, S.; Koch, B. UAV Photogrammetry of Forests as a Vulnerable Process. A Sensitivity Analysis for a Structure from Motion RGB-Image Pipeline. Remote Sens. 2018, 10, 912. [Google Scholar] [CrossRef] [Green Version]
  174. MicaSense RedEdge MX Processing Workflow (Including Reflectance Calibration) in Agisoft Metashape Professional. Available online: https://agisoft.freshdesk.com/support/solutions/articles/31000148780-micasense-rededge-mx-processing-workflow-including-reflectance-calibration-in-agisoft-metashape-pro (accessed on 14 February 2022).
  175. Dandois, J.; Olano, M.; Ellis, E. Optimal Altitude, Overlap, and Weather Conditions for Computer Vision UAV Estimates of Forest Structure. Remote Sens. 2015, 7, 13895–13920. [Google Scholar] [CrossRef] [Green Version]
  176. Young, D.J.N.; Koontz, M.J.; Weeks, J. Optimizing aerial imagery collection and processing parameters for drone–based individual tree mapping in structurally complex conifer forests. Methods Ecol. Evol. 2022. [Google Scholar] [CrossRef]
  177. European Commission. Commission Implementing Regulation (EU) 2019/947 of 24 May 2019 on the Rules and Procedures for the Operation of Unmanned Aircraft: Regulation (EU) 2019/947; European Commission: Brussels, Belgium, 2019. [Google Scholar]
  178. Mohan, M.; Richardson, G.; Gopan, G.; Aghai, M.M.; Bajaj, S.; Galgamuwa, G.A.P.; Vastaranta, M.; Arachchige, P.S.P.; Amorós, L.; Corte, A.P.D.; et al. UAV-Supported Forest Regeneration: Current Trends, Challenges and Implications. Remote Sens. 2021, 13, 2596. [Google Scholar] [CrossRef]
  179. Knapitsch, A.; Park, J.; Zhou, Q.Y.; Koltun, V. Tanks and temples. ACM Trans. Graph. 2017, 36, 1–13. [Google Scholar] [CrossRef]
  180. Jiang, S.; Jiang, C.; Jiang, W. Efficient structure from motion for large-scale UAV images: A review and a comparison of SfM tools. ISPRS J. Photogramm. Remote Sens. 2020, 167, 230–251. [Google Scholar] [CrossRef]
  181. Goodbody, T.R.H.; Coops, N.C.; White, J.C. Digital Aerial Photogrammetry for Updating Area-Based Forest Inventories: A Review of Opportunities, Challenges, and Future Directions. Curr. For. Rep. 2019, 5, 55–75. [Google Scholar] [CrossRef] [Green Version]
  182. Wallace, L.; Lucieer, A.; Malenovský, Z.; Turner, D.; Vopěnka, P. Assessment of Forest Structure Using Two UAV Techniques: A Comparison of Airborne Laser Scanning and Structure from Motion (SfM) Point Clouds. Forests 2016, 7, 62. [Google Scholar] [CrossRef] [Green Version]
  183. Guerra-Hernández, J.; Cosenza, D.N.; Rodriguez, L.C.E.; Silva, M.; Tomé, M.; Díaz-Varela, R.A.; González-Ferreiro, E. Comparison of ALS- and UAV(SfM)-derived high-density point clouds for individual tree detection in Eucalyptus plantations. Int. J. Remote Sens. 2018, 39, 5211–5235. [Google Scholar] [CrossRef]
  184. Moe, K.; Owari, T.; Furuya, N.; Hiroshima, T. Comparing Individual Tree Height Information Derived from Field Surveys, LiDAR and UAV-DAP for High-Value Timber Species in Northern Japan. Forests 2020, 11, 223. [Google Scholar] [CrossRef] [Green Version]
  185. Guo, Y.; Chen, S.; Li, X.; Cunha, M.; Jayavelu, S.; Cammarano, D.; Fu, Y. Machine Learning-Based Approaches for Predicting SPAD Values of Maize Using Multi-Spectral Images. Remote Sens. 2022, 14, 1337. [Google Scholar] [CrossRef]
  186. Olsson, P.O.; Vivekar, A.; Adler, K.; Garcia Millan, V.E.; Koc, A.; Alamrani, M.; Eklundh, L. Radiometric Correction of Multispectral UAS Images: Evaluating the Accuracy of the Parrot Sequoia Camera and Sunshine Sensor. Remote Sens. 2021, 13, 577. [Google Scholar] [CrossRef]
  187. Morsy, S.; Shaker, A.; El-Rabbany, A. Multispectral LiDAR Data for Land Cover Classification of Urban Areas. Sensors 2017, 17, 958. [Google Scholar] [CrossRef] [Green Version]
  188. Huo, L.Z.; Silva, C.A.; Klauberg, C.; Mohan, M.; Zhao, L.J.; Tang, P.; Hudak, A.T. Supervised spatial classification of multispectral LiDAR data in urban areas. PLoS ONE 2018, 13, e0206185. [Google Scholar] [CrossRef]
  189. Grenzdörffer, G.J.; Engel, A.; Teichert, B. The photogrammetric potential of low-cost UAVs in forestry and agriculture. Int. Arch. Photogramm. Remote Sens. Spat. Inf. Sci. 2008, 31, 1207–1214. [Google Scholar]
  190. Przybilla, H.J.; Bäumker, M.; Luhmann, T.; Hastedt, H.; Eilers, M. Interaction Between Direct Georeferencing, Control Point Configuration Furthermore, Camera Self-Calibration For RTK-based UAV Photogrammetry. Int. Arch. Photogramm. Remote Sens. Spat. Inf. Sci. 2020, XLIII-B1-2020, 485–492. [Google Scholar] [CrossRef]
  191. Cromwell, C.; Giampaolo, J.; Hupy, J.; Miller, Z.; Chandrasekaran, A. A Systematic Review of Best Practices for UAS Data Collection in Forestry-Related Applications. Forests 2021, 12, 957. [Google Scholar] [CrossRef]
  192. Tomaštík, J.; Mokroš, M.; Surový, P.; Grznárová, A.; Merganič, J. UAV RTK/PPK Method—An Optimal Solution for Mapping Inaccessible Forested Areas? Remote Sens. 2019, 11, 721. [Google Scholar] [CrossRef] [Green Version]
  193. Emilien, A.V.; Thomas, C.; Thomas, H. UAV & satellite synergies for optical remote sensing applications: A literature review. Sci. Remote Sens. 2021, 3, 100019. [Google Scholar] [CrossRef]
  194. Wulder, M.A.; Masek, J.G.; Cohen, W.B.; Loveland, T.R.; Woodcock, C.E. Opening the archive: How free data has enabled the science and monitoring promise of Landsat. Remote Sens. Environ. 2012, 122, 2–10. [Google Scholar] [CrossRef]
  195. Grizonnet, M.; Michel, J.; Poughon, V.; Inglada, J.; Savinaud, M.; Cresson, R. Orfeo ToolBox: Open source processing of remote sensing images. Open Geospat. Data Softw. Stand. 2017, 2, 15. [Google Scholar] [CrossRef] [Green Version]
  196. Blaschke, T.; Strobl, J. What is wrong with pixels? Some recent developments interfacing remote sensing and GIS. Z. Geoinf. 2001, 14, 12–17. [Google Scholar]
  197. Hossain, M.D.; Chen, D. Segmentation for Object-Based Image Analysis (OBIA): A review of algorithms and challenges from remote sensing perspective. ISPRS J. Photogramm. Remote Sens. 2019, 150, 115–134. [Google Scholar] [CrossRef]
  198. Blaschke, T. Object based image analysis for remote sensing. ISPRS J. Photogramm. Remote Sens. 2010, 65, 2–16. [Google Scholar] [CrossRef] [Green Version]
  199. Jaskierniak, D.; Lucieer, A.; Kuczera, G.; Turner, D.; Lane, P.; Benyon, R.G.; Haydon, S. Individual tree detection and crown delineation from Unmanned Aircraft System (UAS) LiDAR in structurally complex mixed species eucalypt forests. ISPRS J. Photogramm. Remote Sens. 2021, 171, 171–187. [Google Scholar] [CrossRef]
  200. Kattenborn, T.; Leitloff, J.; Schiefer, F.; Hinz, S. Review on Convolutional Neural Networks (CNN) in vegetation remote sensing. ISPRS J. Photogramm. Remote Sens. 2021, 173, 24–49. [Google Scholar] [CrossRef]
  201. Feng, Q.; Liu, J.; Gong, J. UAV Remote Sensing for Urban Vegetation Mapping Using Random Forest and Texture Analysis. Remote Sens. 2015, 7, 1074–1094. [Google Scholar] [CrossRef] [Green Version]
  202. Prospero, S.; Cleary, M. Effects of Host Variability on the Spread of Invasive Forest Diseases. Forests 2017, 8, 80. [Google Scholar] [CrossRef] [Green Version]
  203. Dale, V.H.; Joyce, L.A.; McNulty, S.; Neilson, R.P.; Ayres, M.P.; Flannigan, M.D.; Hanson, P.J.; Irland, L.C.; Lugo, A.E.; Peterson, C.J.; et al. Climate Change and Forest Disturbances. BioScience 2001, 51, 723. [Google Scholar] [CrossRef] [Green Version]
  204. Millar, C.I.; Stephenson, N.L. Temperate forest health in an era of emerging megadisturbance. Science 2015, 349, 823–826. [Google Scholar] [CrossRef] [PubMed]
  205. Minarik, R.; Langhammer, J. Use of A Multispectral UAV Photogrammetry For Detection Furthermore, Tracking of Forest Disturbance Dynamics. In Proceedings of the 23rd Congress of the International-Society-for-Photogrammetry-and-Remote-Sensing (ISPRS), Prague, Czech Republic, 12–19 July 2016; Copernicus GmbH: Göttingen, Germany, 2016; Volume 41, pp. 711–718. [Google Scholar] [CrossRef]
  206. Cardil, A.; Vepakomma, U.; Brotons, L. Assessing Pine Processionary Moth Defoliation Using Unmanned Aerial Systems. Forests 2017, 8, 402. [Google Scholar] [CrossRef] [Green Version]
  207. Stoyanova, M.; Kandilarov, A.; Koutev, V.; Nitcheva, O.; Dobreva, P. Potential of multispectral imaging technology for assessment coniferous forests bitten by a bark beetle in Central Bulgaria. In Proceedings of the 13th National Congress on Theoretical and Applied Mechanics (NCTAM), Sofia, Bulgaria, 6–10 September 2017; EDP Sciences: Ulys, France, 2018; Volume 145, p. 01005. [Google Scholar] [CrossRef] [Green Version]
  208. Safonova, A.; Tabik, S.; Alcaraz-Segura, D.; Rubtsov, A.; Maglinets, Y.; Herrera, F. Detection of Fir Trees (Abies sibirica) Damaged by the Bark Beetle in Unmanned Aerial Vehicle Images with Deep Learning. Remote Sens. 2019, 11, 643. [Google Scholar] [CrossRef] [Green Version]
  209. Barmpoutis, P.; Kamperidou, V.; Stathaki, T. Estimation of Extent of Trees’ and Biomass’ Infestation of the Suburban Forest of Thessaloniki (Seich Sou) using UAV Imagery and Combining R-CNNs and Multichannel Texture Analysis. In Proceedings of the 12th International Conference on Machine Vision (ICMV), Amsterdam, The Netherlands, 16–18 November 2019; SPIE-INT SOC Optical Engineering: Bellingham, WA, USA, 2020; Volume 11433. [Google Scholar] [CrossRef]
  210. Zhang, N.; Wang, Y.; Zhang, X. Extraction of tree crowns damaged by Dendrolimus tabulaeformis Tsai et Liu via spectral-spatial classification using UAV-based hyperspectral images. Plant Methods 2020, 16, 135. [Google Scholar] [CrossRef]
  211. Park, J.K.; Kim, M.G. Application of unmanned aerial vehicle for detection of pine wilt disease. Asia Life Sci. 2014, 10, 191–202. [Google Scholar]
  212. Jung, K.Y.; Park, J.K. Analysis of Vegetation Infection Information Using Unmanned Aerial Vehicle with Optical Sensor. Sens. Mater. 2019, 31, 3319. [Google Scholar] [CrossRef]
  213. Deng, X.; Tong, Z.; Lan, Y.; Huang, Z. Detection and Location of Dead Trees with Pine Wilt Disease Based on Deep Learning and UAV Remote Sensing. AgriEngineering 2020, 2, 294–307. [Google Scholar] [CrossRef]
  214. Iordache, M.D.; Mantas, V.; Baltazar, E.; Pauly, K.; Lewyckyj, N. A Machine Learning Approach to Detecting Pine Wilt Disease Using Airborne Spectral Imagery. Remote Sens. 2020, 12, 2280. [Google Scholar] [CrossRef]
  215. Hoshikawa, T.; Yamamoto, K. Individual Tree Detection and Classification for Mapping Pine Wilt Disease Using Multispectral and Visible Color Imagery Acquired from Unmanned Aerial Vehicle. J. Remote Sens. Soc. Jpn. 2020, 40, 13–19. [Google Scholar] [CrossRef]
  216. Tao, H.; Li, C.; Zhao, D.; Deng, S.; Hu, H.; Xu, X.; Jing, W. Deep learning-based dead pine tree detection from unmanned aerial vehicle images. Int. J. Remote Sens. 2020, 41, 8238–8255. [Google Scholar] [CrossRef]
  217. Sun, Z.; Wang, Y.; Pan, L.; Xie, Y.; Zhang, B.; Liang, R.; Sun, Y. Pine wilt disease detection in high-resolution UAV images using object-oriented classification. J. For. Res. 2021, 1–13. [Google Scholar] [CrossRef]
  218. Shin, J.i.; Seo, W.W.; Kim, T.; Park, J.; Woo, C.s. Using UAV Multispectral Images for Classification of Forest Burn Severity—A Case Study of the 2019 Gangneung Forest Fire. Forests 2019, 10, 1025. [Google Scholar] [CrossRef] [Green Version]
  219. Tran, D.Q.; Park, M.; Jung, D.; Park, S. Damage-Map Estimation Using UAV Images and Deep Learning Algorithms for Disaster Management System. Remote Sens. 2020, 12, 4169. [Google Scholar] [CrossRef]
  220. Woo, H.; Acuna, M.; Madurapperuma, B.; Jung, G.; Woo, C.; Park, J. Application of Maximum Likelihood and Spectral Angle Mapping Classification Techniques to Evaluate Forest Fire Severity from UAV Multi-spectral Images in South Korea. Sens. Mater. 2021, 33, 3745–3760. [Google Scholar] [CrossRef]
  221. Gallardo-Salazar, J.L.; Pompa-García, M. Detecting Individual Tree Attributes and Multispectral Indices Using Unmanned Aerial Vehicles: Applications in a Pine Clonal Orchard. Remote Sens. 2020, 12, 4144. [Google Scholar] [CrossRef]
Figure 1. Abstraction of the distribution of potentially beneficial use cases of crewed aircraft and different UAV types used for remote sensing in forestry: (a) by scale and spatial resolution, (b) by scale and costs per m2. Note: within the overlap area in the top graph, UAVs often have a significant cost advantage over crewed aircraft and are faster and more frequently deployable. Multirotor drones are easier to handle compared to fixed-wing aircraft, but are only suitable for relatively small areas.
Remotesensing 14 03205 g001
Figure 2. General workflow of UAV-based data acquisition and processing procedures.
Remotesensing 14 03205 g002
Figure 3. Different UAV types, commonly used for civilian applications: (a) rotary-wing (quadcopter), (b) rotary-wing (octocopter), (c) Hybrid VTOL solution, and (d) fixed-wing.
Remotesensing 14 03205 g003
Figure 4. Different sensors for remote sensing applications that can be attached to UAVs: (a) RGB camera, (b) multispectral camera, (c) thermal camera, (d) hyperspectral camera, and (e) LiDAR sensor.
Remotesensing 14 03205 g004
Figure 5. PRISMA flow diagram depicting the different phases of the bibliographic dataset creation (n = number of papers).
Remotesensing 14 03205 g005
Figure 6. Bar graph of peer-reviewed papers related to UAV-based forest health monitoring published between 2012 and 2021.
Remotesensing 14 03205 g006
Figure 7. (a) Bar chart showing the distribution of different types of UAV-mounted sensors used for forest health monitoring in the literature dataset. (b) Bar chart showing the number of different types of UAV-mounted sensors used for forest health monitoring per year over the selected publication date range.
Remotesensing 14 03205 g007
Figure 8. Distribution of different machine learning techniques used per year for image analysis over the selected publication period.
Remotesensing 14 03205 g008
Figure 9. Pie chart of the distribution of different types of stressors addressed in the literature dataset.
Remotesensing 14 03205 g009
Publisher’s Note: MDPI stays neutral with regard to jurisdictional claims in published maps and institutional affiliations.

