Article

Characteristics of Freeze–Thaw Cycles in an Endorheic Basin on the Qinghai-Tibet Plateau Based on SBAS-InSAR Technology

1
Cryosphere Research Station on the Qinghai-Tibet Plateau, State Key Laboratory of Cryospheric Science, Northwest Institute of Eco-Environment and Resources, Chinese Academy of Sciences, Lanzhou 730000, China
2
University of Chinese Academy of Sciences, Beijing 100049, China
3
School of Geographical Sciences, Nanjing University of Information Science & Technology (NUIST), Nanjing 210044, China
*
Author to whom correspondence should be addressed.
Remote Sens. 2022, 14(13), 3168; https://doi.org/10.3390/rs14133168
Submission received: 8 May 2022 / Revised: 21 June 2022 / Accepted: 27 June 2022 / Published: 1 July 2022
(This article belongs to the Topic Cryosphere: Changes, Impacts and Adaptation)

Abstract

:
The freeze–thaw (F-T) cycle of the active layer (AL) causes the “frost heave and thaw settlement” deformation of the terrain surface. Accurately identifying its amplitude and time characteristics is important for climate, hydrology, and ecology research in permafrost regions. We used Sentinel-1 SAR data and small baseline subset-interferometric synthetic aperture radar (SBAS-InSAR) technology to obtain the characteristics of F-T cycles in the Zonag Lake-Yanhu Lake permafrost-affected endorheic basin on the Qinghai-Tibet Plateau from 2017 to 2019. The results show that the seasonal deformation amplitude (SDA) in the study area mainly ranges from 0 to 60 mm, with an average value of 19 mm. The date of maximum frost heave (MFH) occurred between November 27th and March 21st of the following year, averaged in date of the year (DOY) 37. The maximum thaw settlement (MTS) occurred between July 25th and September 21st, averaged in DOY 225. The thawing duration is the thawing process lasting about 193 days. The spatial distribution differences in SDA, the date of MFH, and the date of MTS are relatively significant, but there is no apparent spatial difference in thawing duration. Although the SDA in the study area is mainly affected by the thermal state of permafrost, it still has the most apparent relationship with vegetation cover, the soil water content in AL, and active layer thickness. SDA has an apparent negative and positive correlation with the date of MFH and the date of MTS. In addition, due to the influence of soil texture and seasonal rivers, the seasonal deformation characteristics of the alluvial-diluvial area are different from those of the surrounding areas. This study provides a method for analyzing the F-T cycle of the AL using multi-temporal InSAR technology.

Graphical Abstract

1. Introduction

The upper layer of permafrost (active layer) experiences a freeze–thaw (F-T) cycle seasonally. The F-T cycle affects the climate, ecology, and water cycle process in the permafrost region [1,2,3,4] by influencing the soil thermal conductivity, surface radiation balance, soil moisture evaporation, and infiltration [5,6,7]. Caused by the difference in physical properties between ice and water, a seasonal deformation of “frost heave and thaw subsidence” was accompanied by the F-T cycle of the active layer (AL). The seasonal deformation amplitude (SDA) can indicate the soil water content of the AL [8] and directly affects the engineering construction stability in the cold region [9,10,11,12]. The timing of the F-T cycle also determines the growing season of vegetation [13,14], affects the energy exchange between land and atmosphere [7,15], and changes the carbon release in permafrost [16,17].
The Qinghai-Tibet Plateau (QTP) is the largest frozen soil region in middle and low latitudes [18], and the permafrost area accounts for approximately 41% of the QTP [19]. Permafrost degradation is characterized by ground temperature increase [20,21,22,23], AL thickening [24,25,26], and permafrost area reduction [27,28] during the past 30 years. Meanwhile, the timing of the F-T cycle has also exhibited changes due to climate warming and permafrost degradation, which is manifested as the delayed onset of freezing and the advanced onset of thawing, and the extended thawing duration on the QTP [5,29,30,31,32]. Accurate identification of the timing, duration, and amplitude of seasonal deformation is essential for revealing the hydrothermal state of the AL and is important for the studies of hydrology and ecology in the permafrost regions.
The monitoring stations on QTP are sparse due to the extremely harsh climate and complex terrain. An accurate F-T state is one of the primary goals of remote sensing applications on the QTP [33,34]. Microwave radiometers have proven the ability to detect near-surface (about 0–20 cm) ground F-T state [35,36,37,38,39,40] and been applied successfully on the QTP [41,42,43,44,45]. However, due to its coarse spatial resolution (~25 km), its application in fine-scale research is limited. Active microwave sensors, including synthetic aperture radar (SAR), mainly obtain the F-T state through the backscattering coefficient [46,47,48,49,50], generally have a fine spatial resolution (1 km or ~10 m for SAR) but are highly susceptible to scatterings from vegetation, snow, and surface roughness changes other than ground F-T state [51,52,53]. The combination of active and passive microwave technology has become a reliable method for monitoring the F-T state [38,53,54,55,56,57,58,59]. The studies mentioned above focused on identifying the F-T state of the near-surface. Over permafrost terrain, in addition to the F-T state of the near-surface, the F-T state and F-T processes in the AL [44,53] are also very important but still lack investigation.
Small baseline subset-interferometric synthetic aperture radar (SBAS-InSAR) technology as a multi-temporal InSAR (MT-InSAR) algorithm has been used to monitor the surface deformation of frozen ground in both circum-Arctic and QTP [60,61,62,63,64,65,66,67,68,69,70,71] with high precision and large-scale advantage [72,73]. Benefits from the revisiting period, Sentinel-1 SAR data have been proven to detect the F-T cycle of AL [8,74,75,76,77]. The latest research in the Arctic shows that the SBAS-InSAR technology can obtain the DOY subsidence maxima of AL based on seasonal displacement progression [78]. However, the time-related characteristics of F-T in AL, such as the onset of freezing/thawing and thawing duration, are the main factors determining vegetation growth and energy exchange between land and air [76,79] and have not been explored yet. Many factors influence the amplitude and temporal variability of seasonal deformation amplitude (SDA), such as spatial location [71,78,80,81], topography [82,83,84,85], vegetation [70,75], ground thermal regime variability [76,79], soil water content [8,74,77,80,86], soil particle size [87,88], active layer thickness (ALT) [8,64,76,89,90], etc. These factors also lack detailed analysis as well. Therefore, the relationship between SDA and time characteristics of F-T in the AL is waiting to be revealed.
In this study, we took the Zonag Lake (ZL)-Yanhu Lake (YL) basin as the study area and conducted a detailed analysis of seasonal deformation, and firstly the time characteristics of F-T in the AL were involved in the analysis. The ZL-YL basin was an endorheic region in the hinterland of permafrost on the QTP. However, due to precipitation increase and permafrost degradation, the lake expanded continuously from 2011 to 2019 [91], making the basin a new component of the Yangtze River source. Monitoring the permafrost deformation in the ZL-YL basin is significant for assessing permafrost status and relevance to the hydrological cycle research of the Yangtze River. Previous studies have found the large deformation of both long-term subsidence and seasonal amplitude due to permafrost degradation in the ZL-YL basin [71,75,77,85,92], but the detailed information on the time characteristic and SDA of the F-T cycle is relatively limited.
This study used SBAS-InSAR technology to analyze AL’s SDA, freeze/thaw transition, and duration time in the middle latitude QTP permafrost region. The relationships between seasonal deformation characteristics and their influencing factors are also discussed. We first monitored ground surface deformation by SBAS-InSAR technology and then extracted seasonal deformation (including amplitude, the timing of F-T transition, and duration) from the deformation time series. After that, we obtained SDA characteristics and F-T time of AL in the ZL-YL basin. Finally, the seasonal deformation properties were analyzed using multiple influence factor data. The AL’s F-T characteristics were first revealed in the middle latitude permafrost environment, and the proposed investigation method can be transferred to other permafrost regions.

2. Study Area and Datasets
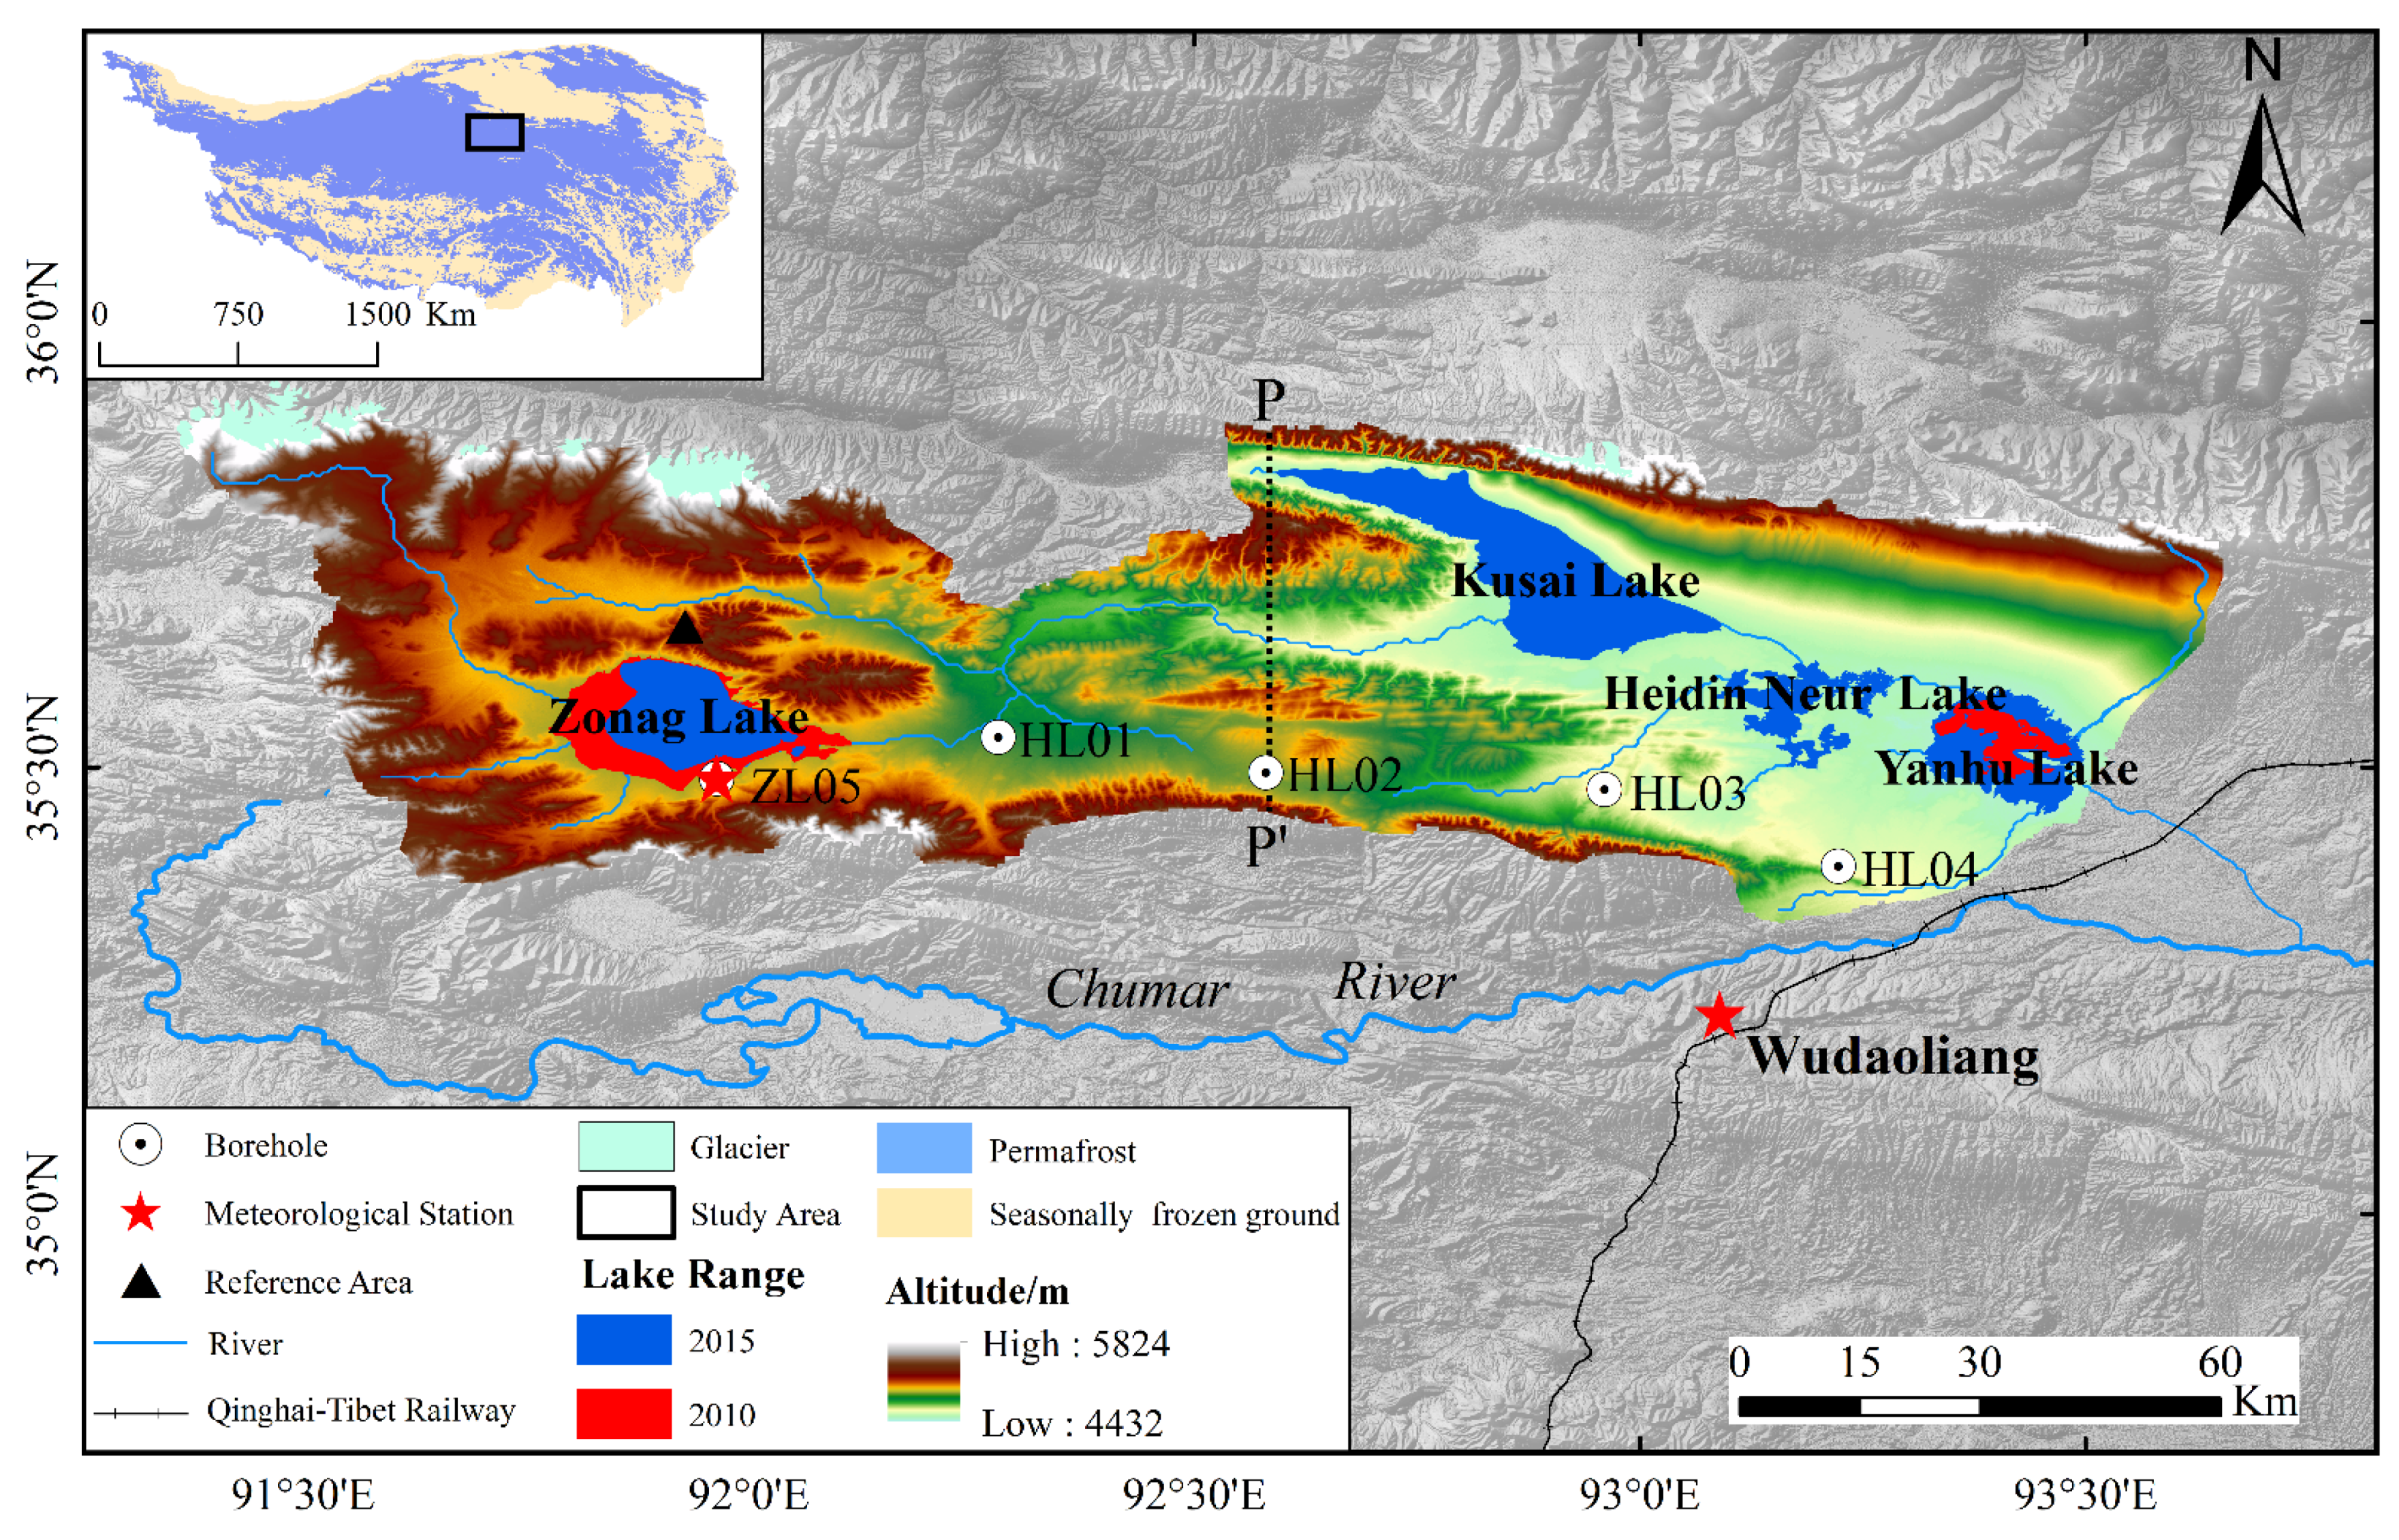
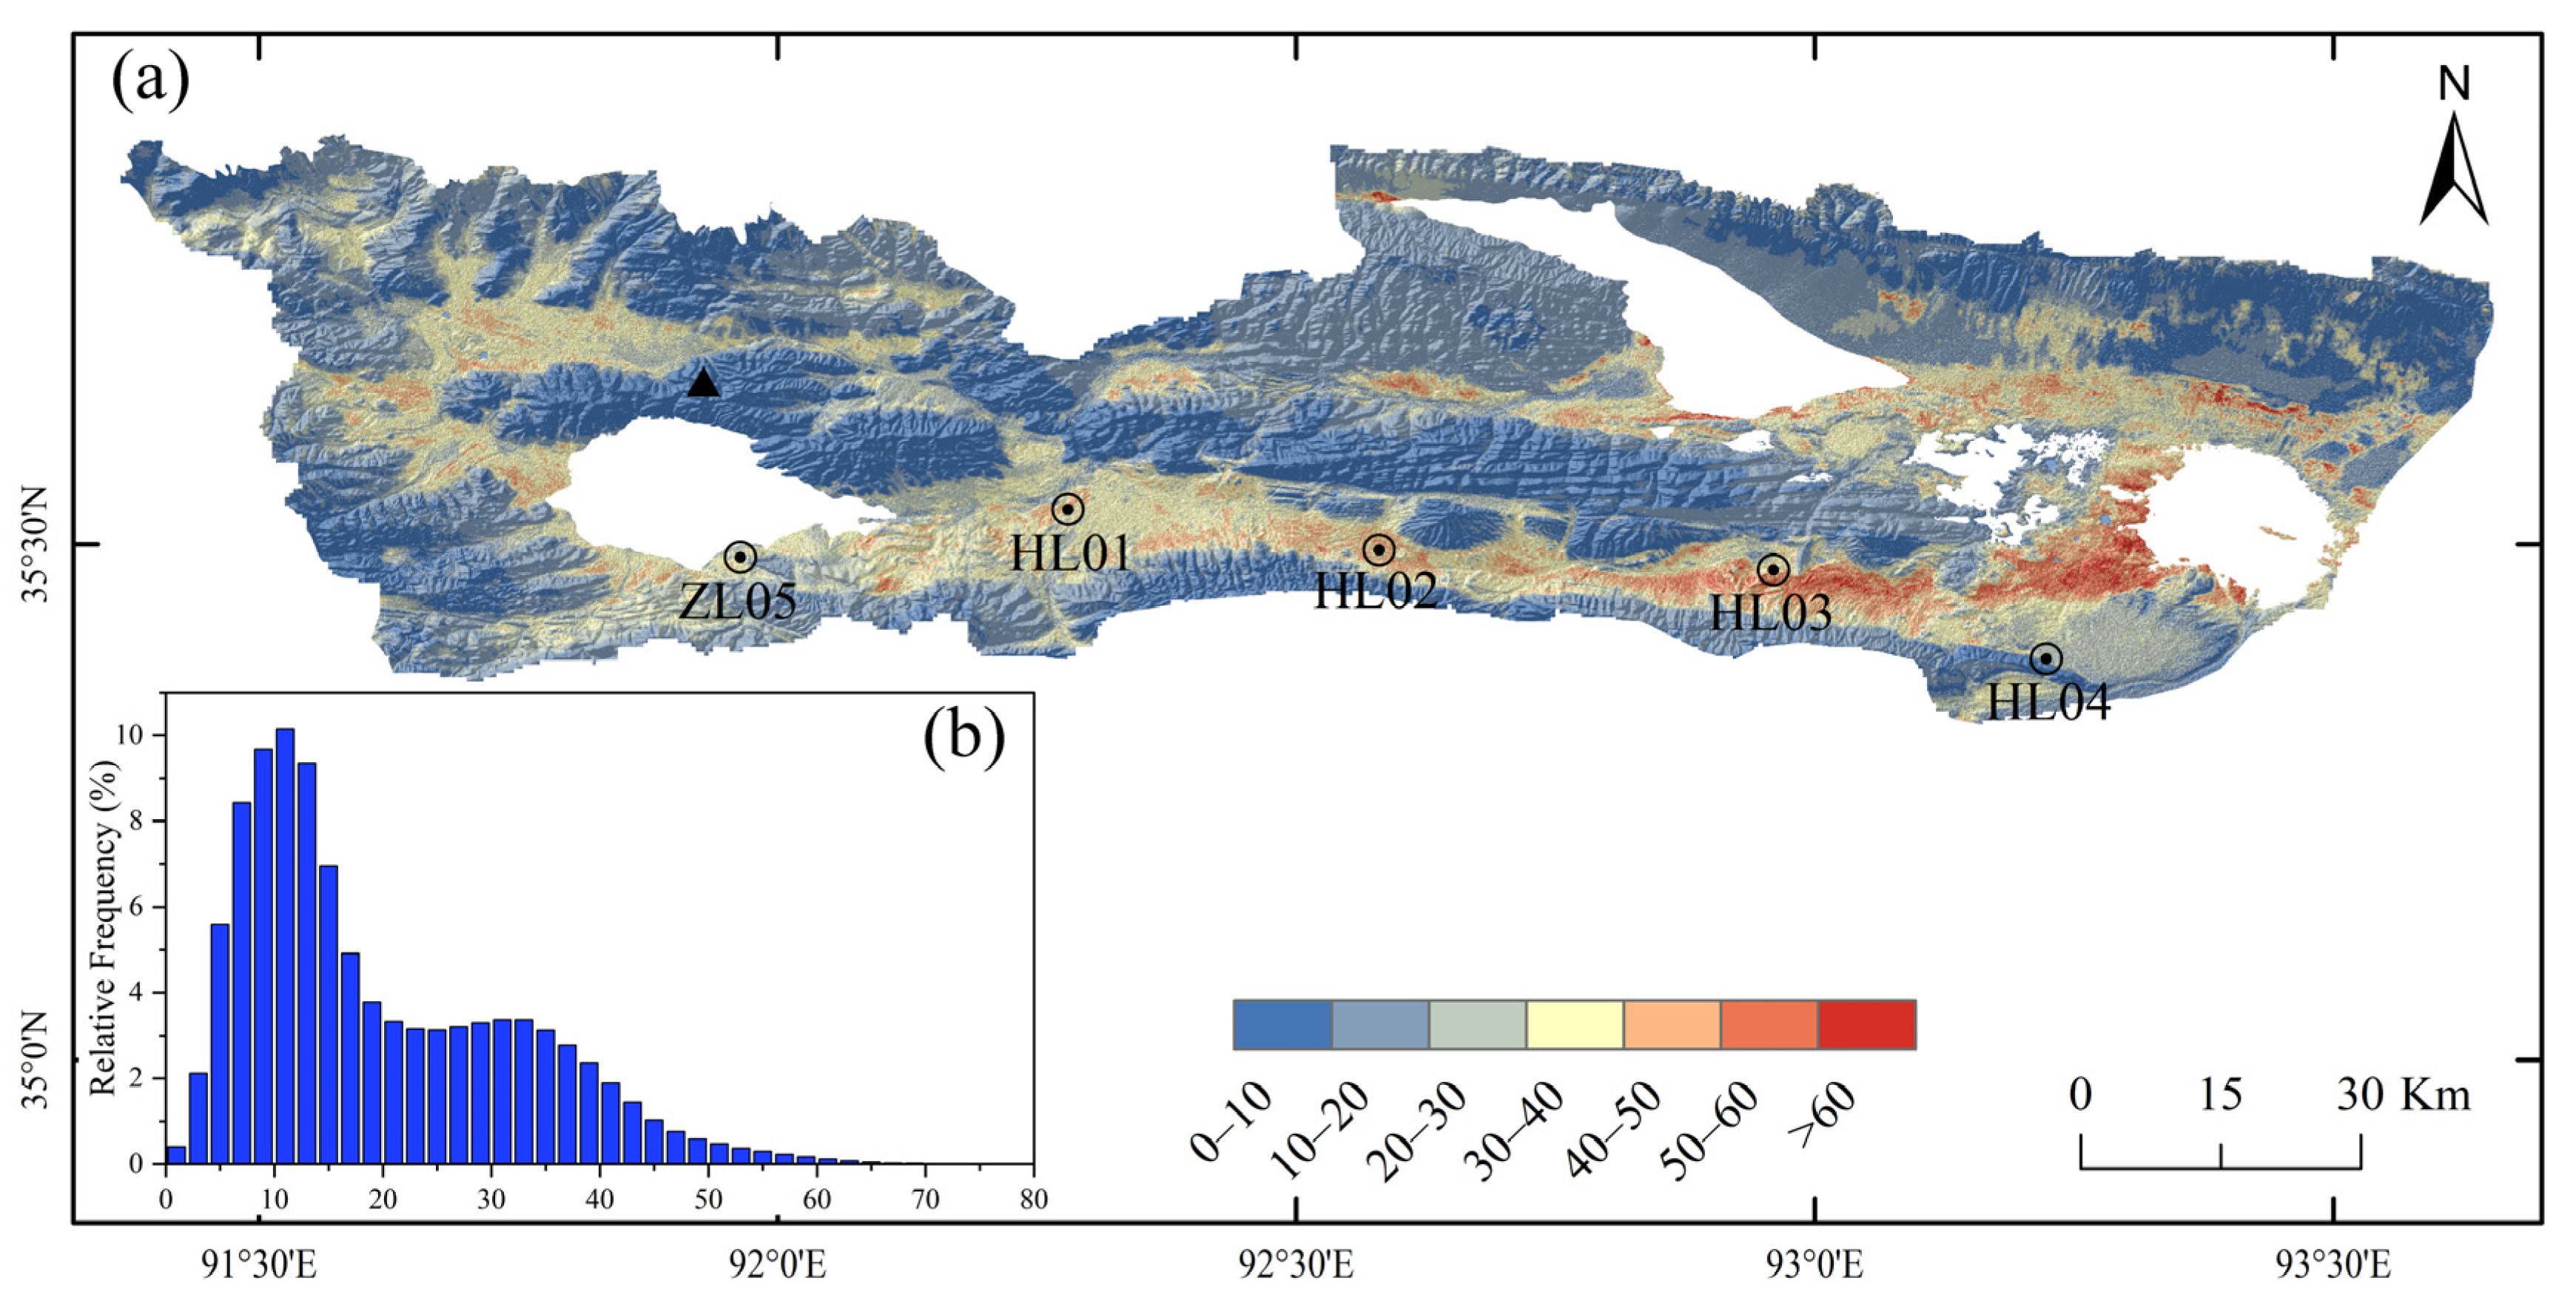
2.1. Study Area

The ZL-YL basin is located in the Hoh Xil inflow area in the permafrost hinterland of QTP [19]. The average elevation and area of the basin are approximately 4905 m (a.s.l.) and 8.52 × 10³ km2, respectively. The basin terrain is high in the west and low in the east, and small glaciers exist above 5000 m (a.s.l.). The four lakes in the ZL-YL basin are Zonag Lake, Kusai Lake, Heidin Neur Lake, and Yanhu Lake from west to east. The elevation of the four lakes decreases from west to east, among which the height difference between Zonag Lake and Kusai Lake is the largest, about 278 m; the height difference between the three lakes in the east is 9~18 m. The primary recharge sources include the thawing water of ice and snow on the south slope of the Kunlun Mountains and precipitation [93]. According to the long-term monitoring at Wudaoliang station from 1961 to 2017, the average annual precipitation is 294.2 mm, and the average annual air temperature is −4.17 °C, which belongs to a semi-arid climate.
We conducted a field survey in the study area by drilling, pit exploration, and ground-penetrating radar in 2012 and established a comprehensive meteorological monitoring station near the ZL05 borehole on the south bank of the Zonag lake. The temperature observation from 2013 to 2020 shows that the thawing duration is from May to September, and the freezing duration is from October to April. Except for some seasonally frozen ground around the lake due to the thermal influence of water, the types of frozen soils in most areas are permafrost. In the study area, vegetation mainly develops in intermountain basins with relatively low altitudes, such as areas around lakes, while in mountain areas with relatively high altitudes, the surface cover is mainly bare bedrock [94].
After the outburst of Zonag lake in September 2011, its water flowed through Kusai Lake and Heidin Neur Lake and finally poured into Yanhu lake. As a result, the four lakes are connected through surface waterways, forming a typical inflow area. From 2011 to 2019, the area of Yanhu lake continued to increase, and the total catchment area of the study area reached 8.48 × 10³ km2 [91]. After a continuous expansion, Yanhu lake is currently only 8 km away from the Qinghai-Tibet Railway. A connecting channel dug on the south bank of the Yanhu lake in 2019 made the basin flow into the Chumar River in the south of the study area, becoming a source of the Yangtze River.

2.2. Field Observation Data

The soil information data (soil texture, mass water content, and soil bulk density), types and coverage of vegetation, permafrost thickness, and ALT were obtained during the field investigation. In addition to the comprehensive observation site located in ZL05, we also selected the data of four boreholes for analysis. The four boreholes, HL01, HL02, HL03, and HL04, are all located in river valleys with flat terrain (slope ≤ 1°), with vegetation coverage above 85%. Except for the barren land, water bodies, and glaciers, the vegetation-covered ground is classified into four groups: alpine swamp meadow (ASM), alpine meadow (AM), and alpine steppe (AS), and alpine desert (AD) [94]. The monitoring data used in this study include vegetation form, ALT, volume water content (calculated by mass water content and soil bulk density) in AL, and soil texture data (Table 1).
In addition, the leveling data observed at Wudaoliang (Figure 1) were used to verify the SBAS-InSAR observations, and the time range of leveling data used for verification is from 2017 to 2019. The leveling data used for each verification is the average of 25 points in the observation field, covering an area of about 400 m2. For detailed information about the devices and methods of the deformation observation field, please refer to other studies from our team [95,96].

2.3. Remote Sensing Data

C-band Sentinel-1 SAR data were used to monitor the surface deformation and downloaded from Alaska Satellite Facility (https://vertex.daac.asf.alaska.edu, accessed on 1 April 2020). Level 1 single look complex (SLC) images of interferometric wide-swath (IW) mode with VV polarization in the descending orbit were used in the study, and the orbit number is 150. Finally, we chose 112 acquisition dates from October 2014 to December 2019.
The daily temperature determines the freeze and thaw onsets of the land surface. It is obtained by fitting 8-days MODIS LSTs based on an empirical multi-linear regression model [97], and it has been well used in the study of the distribution permafrost on the QTP [19]. For a better interpretation of the seasonal deformation, the potential influencing factors, including underlying surface data and permafrost-related data, were selected for analysis (Table 2).
The DEM data was used to calculate the slope and aspect. The vegetation form map was produced from field investigation [94]. The NDVI is the growing season average from 2017 to 2019. Soil organic carbon data within 3 m depth was simulated based on field investigation [98]. The soil texture data is the clay, sand, and silt percentage within 3 m depth [99]. The mean annual air temperature and mean annual precipitation are reanalysis data [100]. The permafrost-related data mainly include ALT [101], mean annual ground temperature (MAGT) [101], and ground ice content data [18]. The maximum degree days of freezing (DDF) and maximum degree days of thawing (DDT) were calculated based on the daily average temperature data calculated by MODIS LST.

3. Methods

3.1. SBAS-InSAR Processing

Figure 2 shows the flowchart of SBAS-InSAR processing in this study. We used InSAR Scientific Computing Environment (ISCE) software to generate interferograms [102]. Except for the last image in the time series, all master images interfered with two adjacent images (slave images) in the subsequent time series [103]. The multi-look parameters are 3 and 13 in distance direction and azimuth direction, respectively, and the final pixel is a rectangle of about 40 m. The precise orbit files for correcting track errors are obtained from the Payload Data Ground Segment and downloaded from (https://qc.sentinel1.eo.esa.int, accessed on 1 April 2020). We used an adaptive filtering method to filter the interferograms [104], the filtering strength is 0.6, and the window is 5 × 5. The 1-arcsecond SRTM DEM was used to remove terrain errors, and then the statistical-cost network-flow algorithm for phase unwrapping (SNAPHU) [105] was used to unwrap the interferograms. Finally, we obtained 324 unwrapped interferograms through manual inspection.
After acquiring unwrapped phases, we used the Miami InSAR Time-series software (MintPy) [106] for time series analysis, and the coherence threshold of time series inversion is 0.7. The Generic Atmospheric Correction Online Service for InSAR (GACOS) utilizes the Iterative Tropospheric Decomposition model [107] to separate stratified and turbulent signals from total tropospheric delays, and we used it to correct the atmospheric error of SBAS-InSAR measurements. Because the lake is not permafrost, it is not very sensible to study the deformation characteristics of the lake, so we masked all lakes. The water mask data came from the latest lake data [108] and was used to remove the influence of the water body. Finally, we obtained the time series deformation of the satellite line of sight direction.

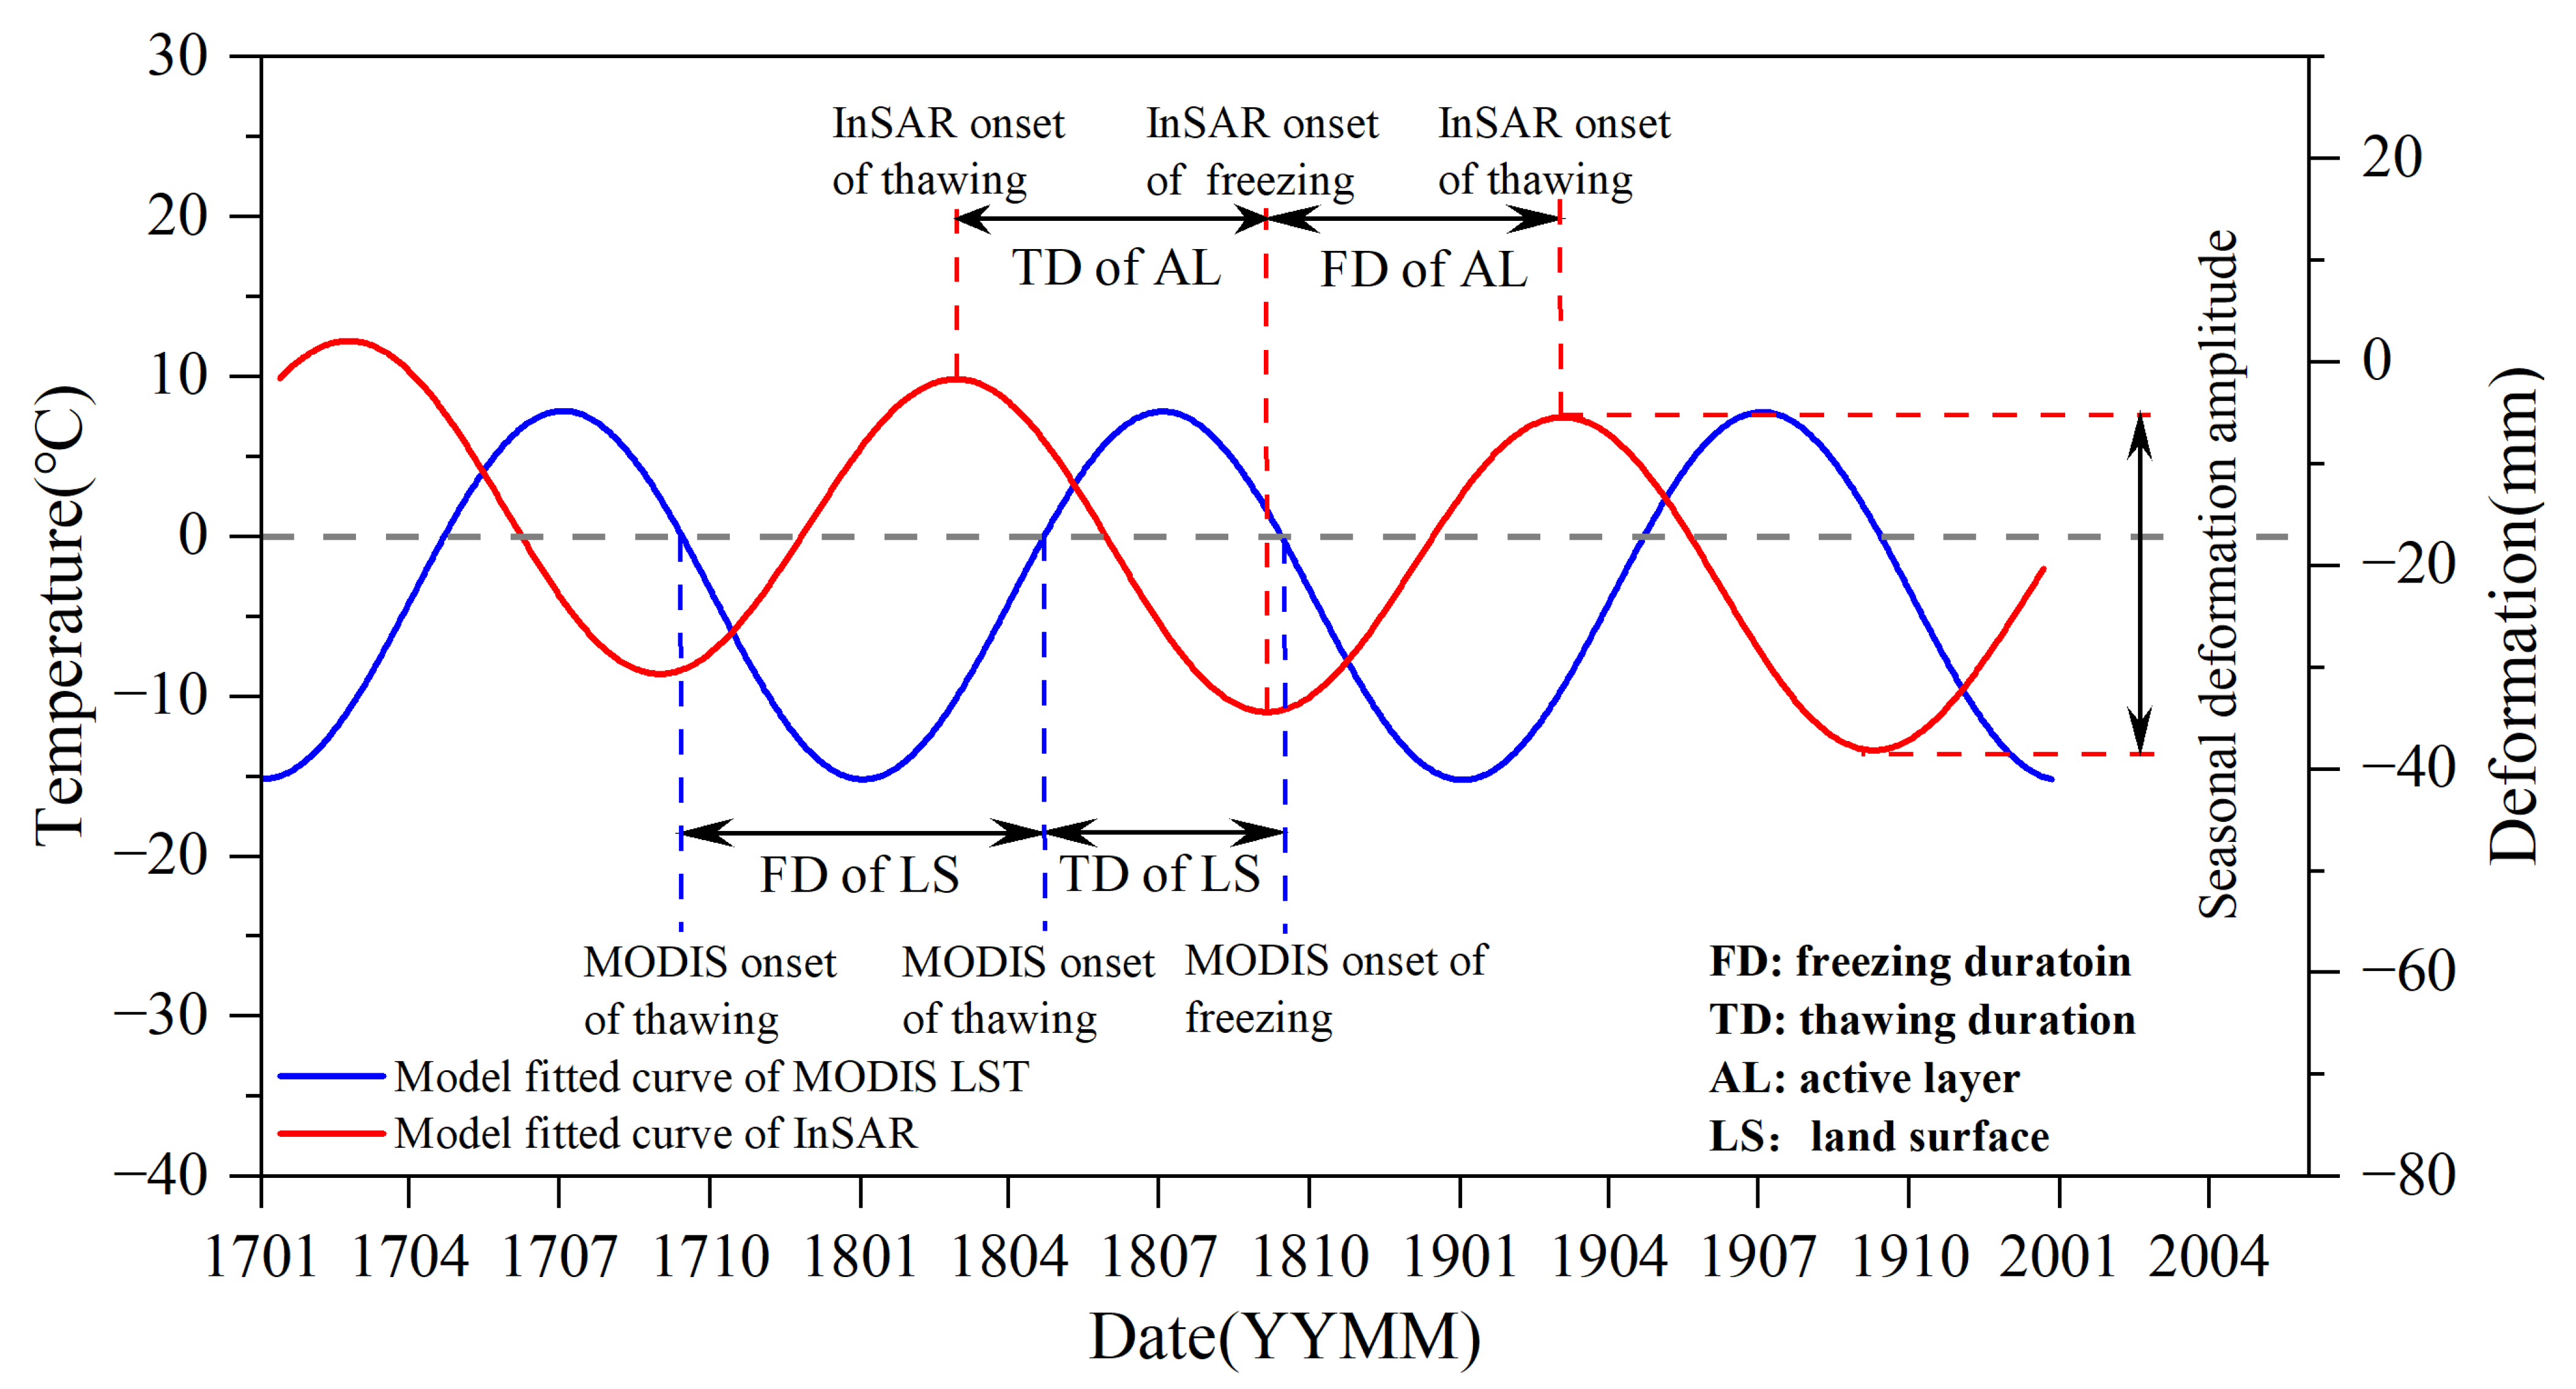
3.2. Seasonal Deformation Characteristics Extraction

In order to separate the seasonal deformation from the long-term deformation trend, a permafrost terrain deformation model that describes linear long-term deformation trends and intra-annual deformation dynamics was used in this study [64,69].
d i = v   ·   t + A   ·   sin   ( 2 π T · t + φ ) + ε
where di is the deformation of the ith day in every year relative to the reference time (the time of the first SAR image, that is, 14 January 2017). The v is the long-term displacement rate, A is deformation amplitude, T is the period of seasonal deformation caused by the F-T cycle of AL (here set to 365 days), φ is the timing of the seasonal deformation, and ε is the noise and deformation residuals caused by other processes. SDA is the maximum deformation magnitude caused by the ice–water phase transition in AL, which can be expressed as the peak-to-peak value (2|A|). By fitting the SBAS-InSAR-derived deformation time series, the unknown parameters in Equation (1) can be acquired.
The maximum frost heave (MFH) and maximum thaw settlement (MTS) are the seasonal deformation of the AL, and the F-T time characteristics of the AL based on the deformation in this study mainly come from these two indexes (Figure 3).
Since the AL’s thawing duration and freezing duration form an F-T cycle (365 days), the time characteristics calculated based on the surface deformation include the date of MFH, the date of MTS, and the thawing duration. The calculation method of the thawing duration is as follows:
Δ t = { t MTS   t MFH t MTS     t MFH   365     t MFH + t MTS t MTS   <   t MFH
The tMTS and tMFH are the date of MTS and the date of MFH, respectively. The Δt is the thawing duration, representing the duration from the date of MFH to the date of MTS.

3.3. Influencing Factor Analysis

Previous studies have shown that seasonal deformation has apparent spatial heterogeneity [8,71,78]. This study used geographical detection to analyze the influencing factor of SDA and the correlation analysis method to analyze the relationship between SDA and time characteristics. The core idea behind the geographical detector is that the similarity of spatial patterns between ground deformation and relevant environmental factors is determined by the q-statistic, determined by the local and global variances [109]. The value of the q-statistic is between 0 and 1, where 1 means the factor controls the spatial patterns of ground deformation and vice versa. Due to AL’s lack of water content data on a spatial scale, we only analyzed the influence of volume water content of AL on SDA at borehole sites.

4. Results

4.1. Comparison with Field Observation Data

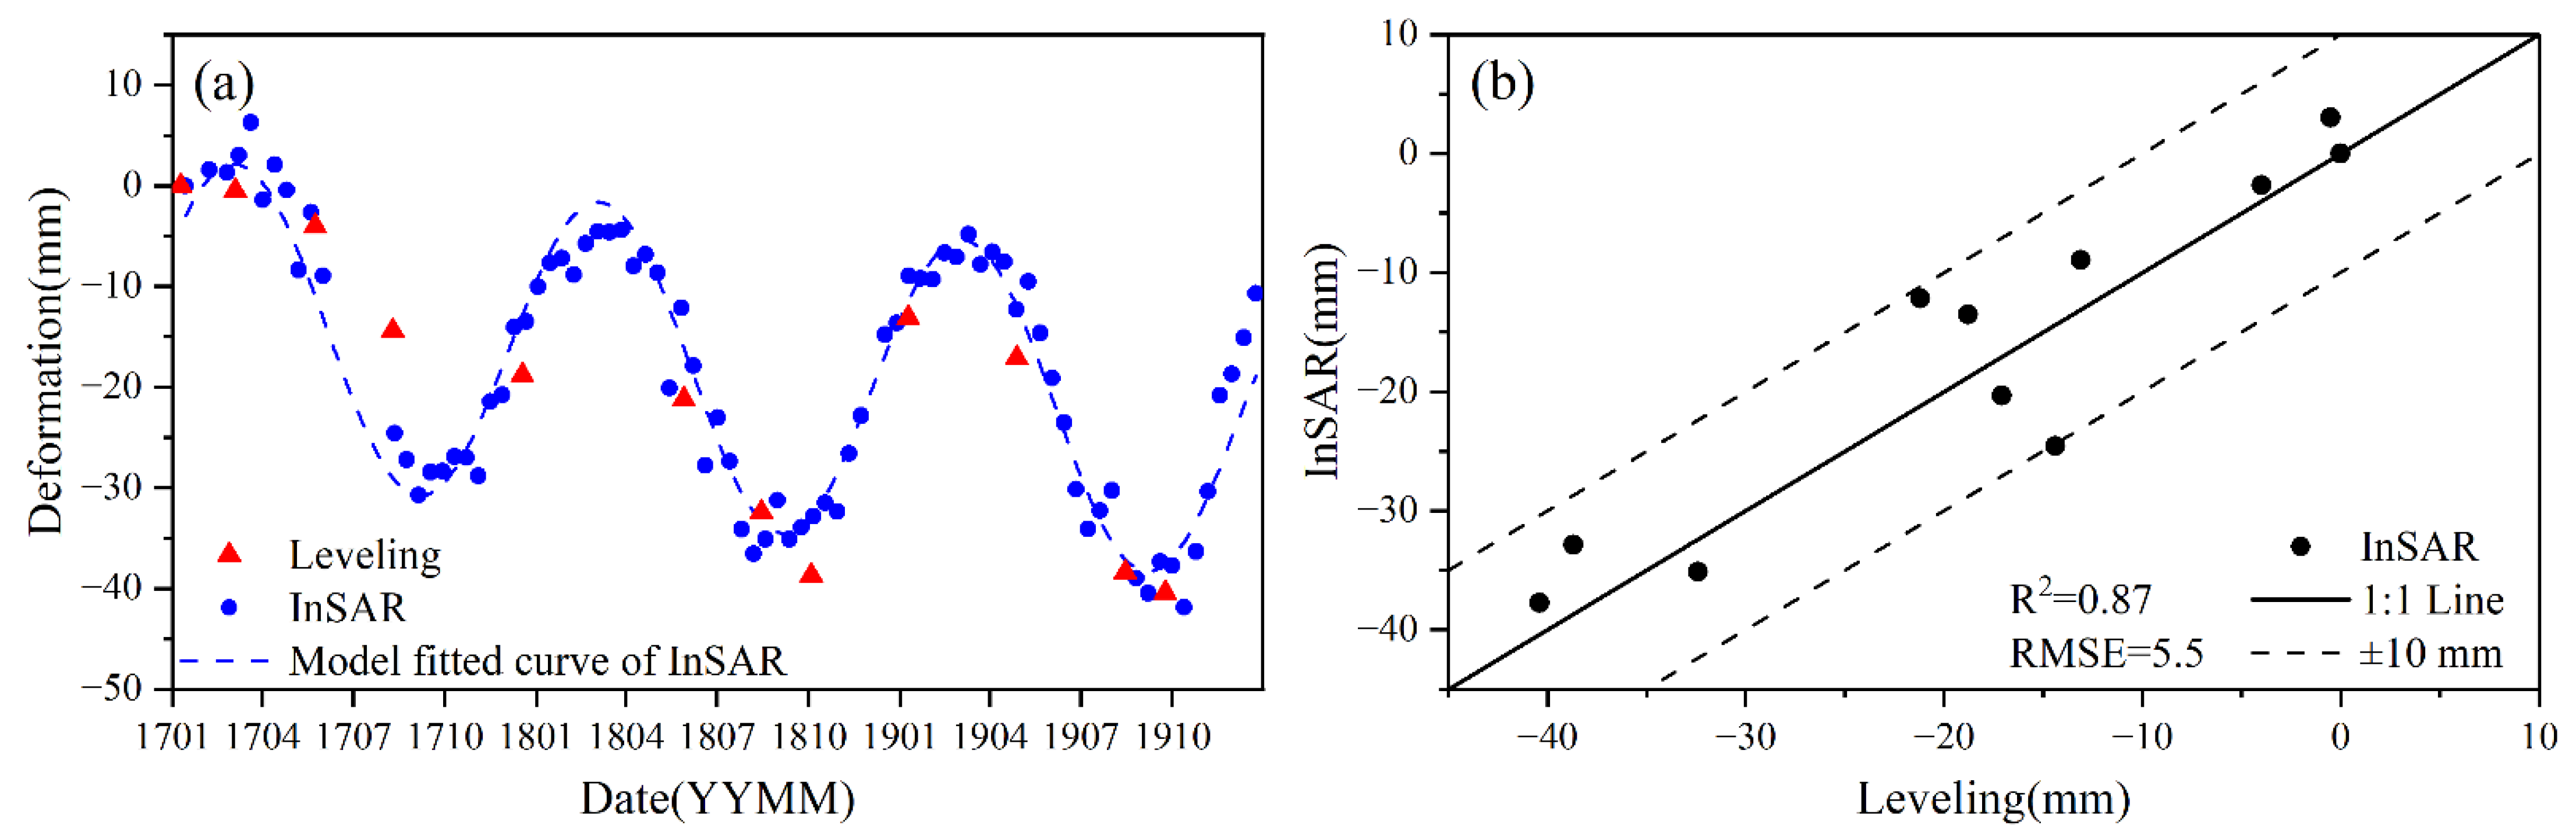
4.1.1. Validation with Leveling Data

In the Wudaoliang leveling observation site, the SBAS-InSAR-derived deformation time series was extracted and converted from the line of sight direction to the vertical ground direction compared with leveling observation. Those observations with SBAS-InSAR and leveling near time, smaller than 10 days, were used for comparison (Table 3).
Figure 4 indicates that the R2 and RMSE of SBAS-InSAR observation and leveling measurements are 0.87 and 5.5 mm, respectively, and the maximum difference is 10.2 mm. It indicates that the SBAS-InSAR observation and leveling measurements are consistent.

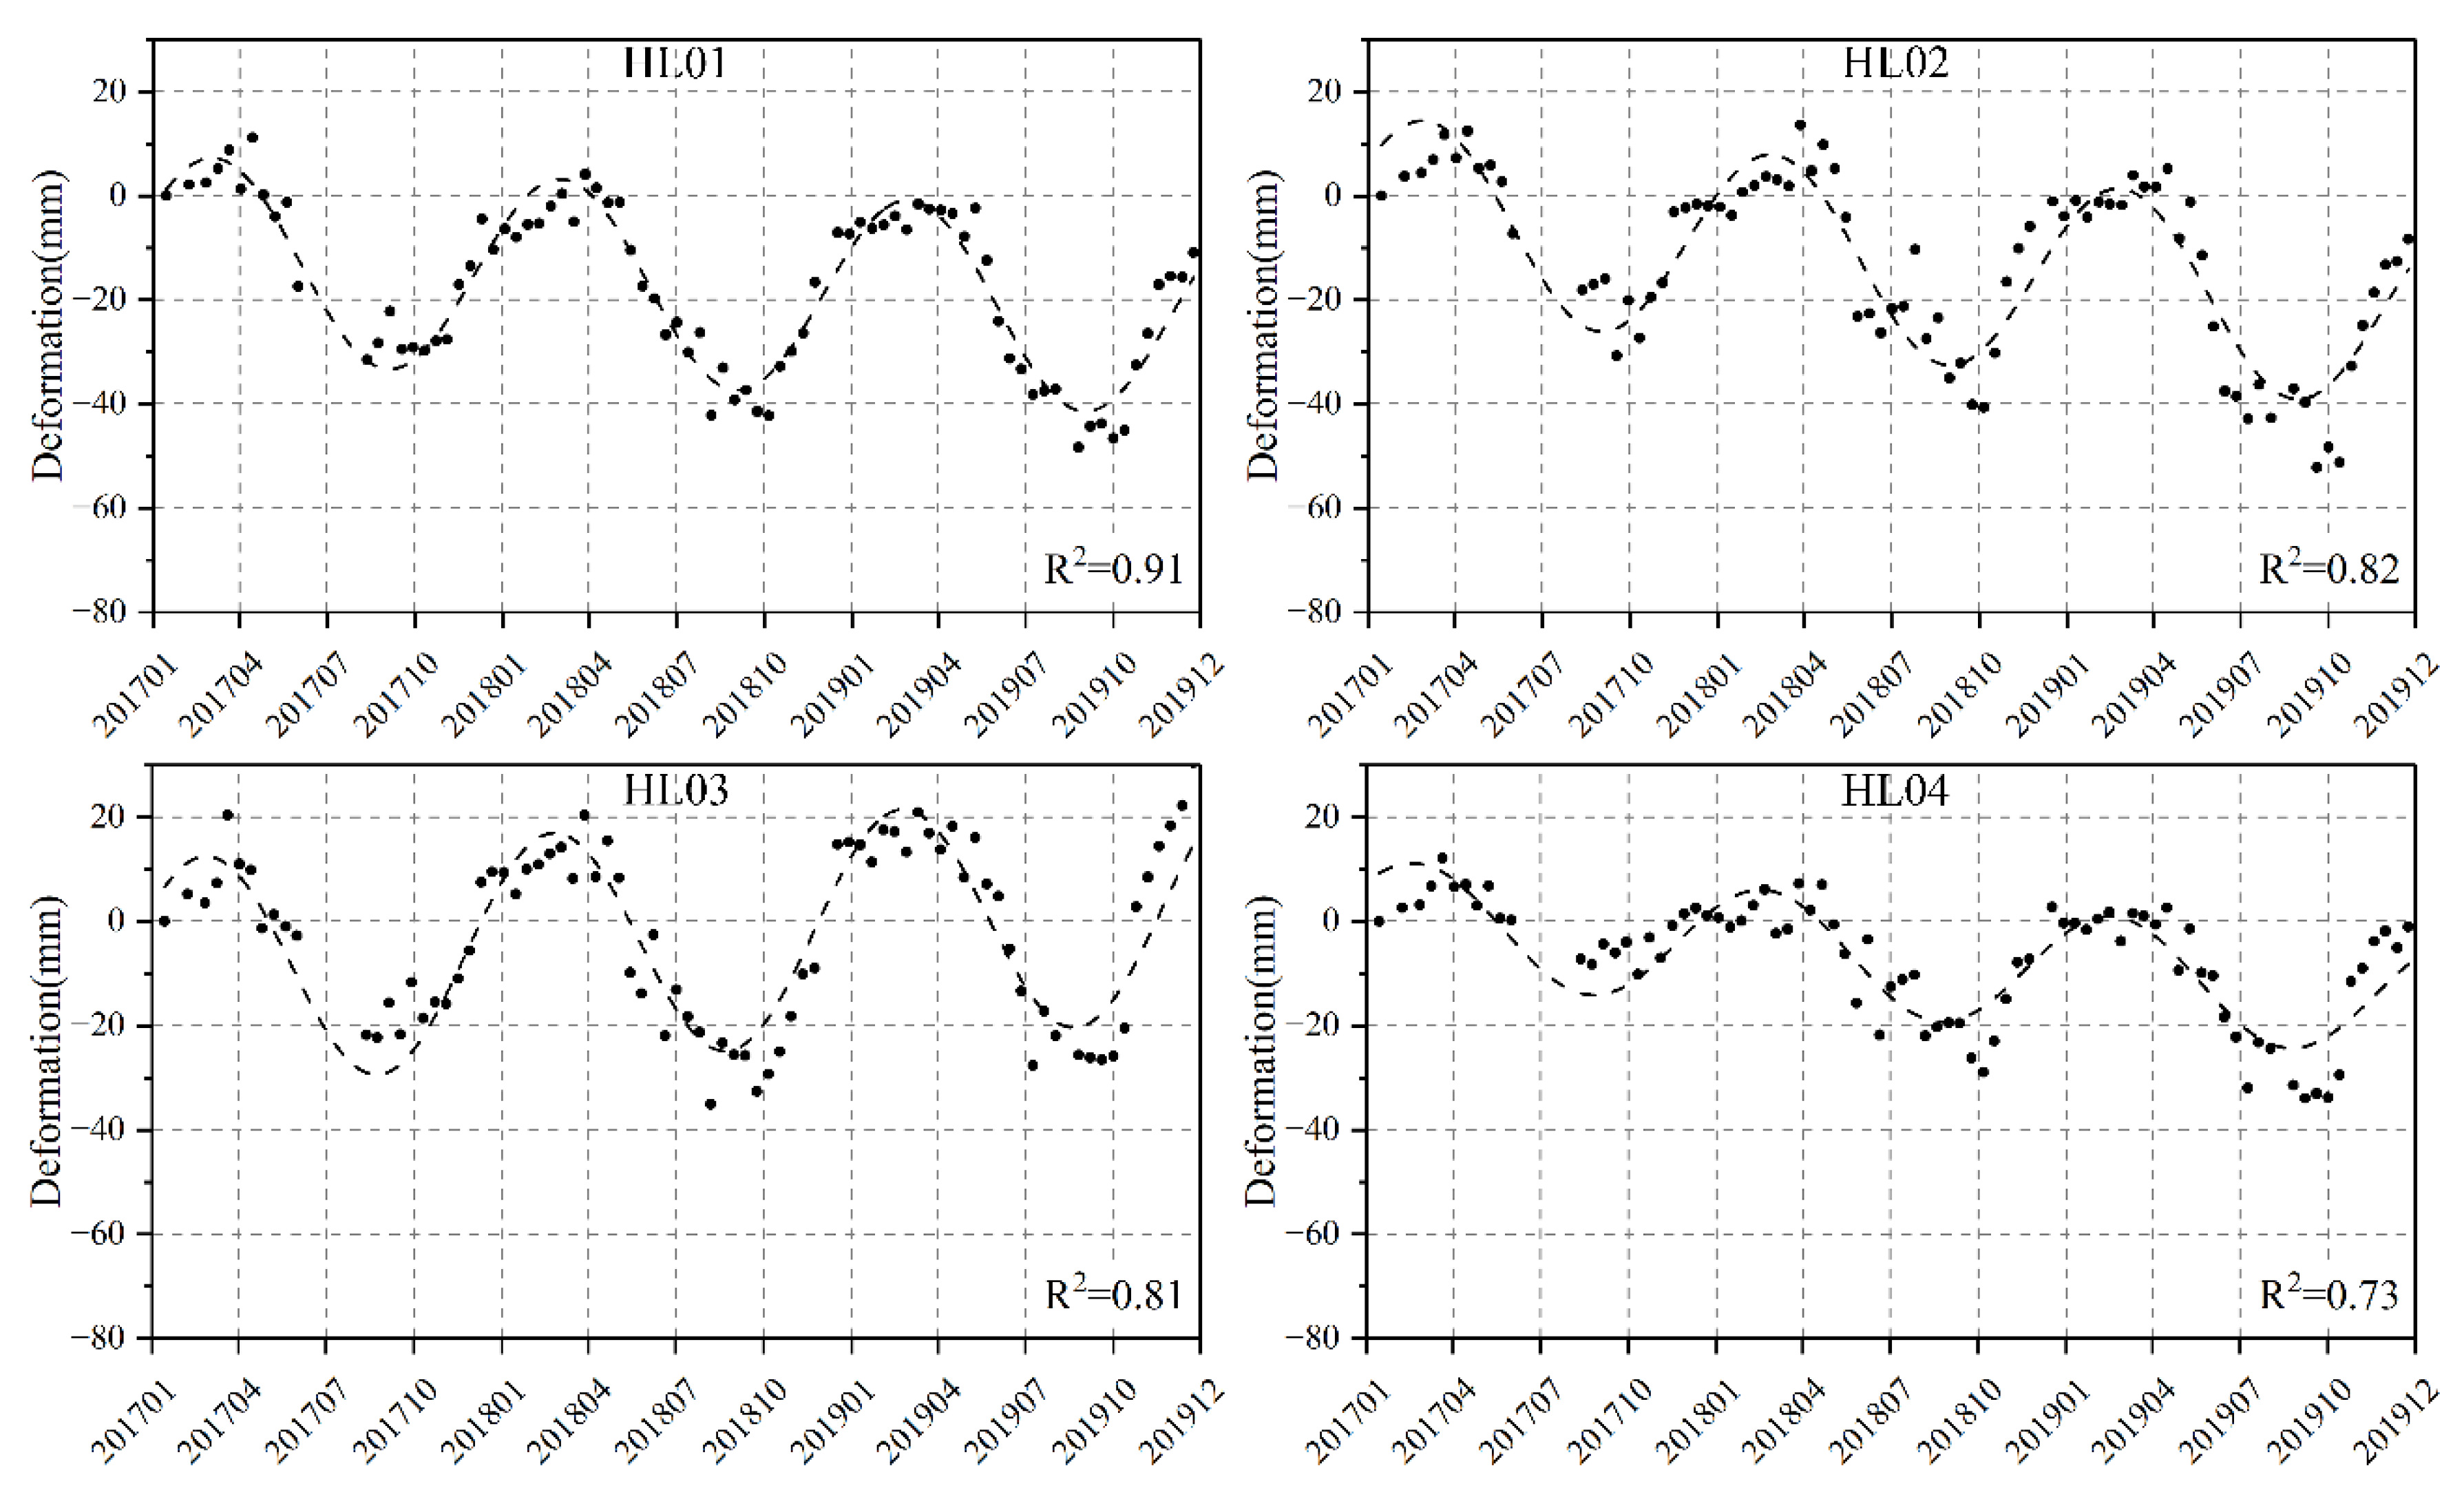
4.1.2. Deformation Time Series at Borehole Sites

Figure 5 shows the SBAS-InSAR-derived deformation time series and the corresponding model-fitted lines at four boreholes (HL01, HL02, HL03, and HL04 marked in Figure 1). There is a good correlation between the model fitting and the SBAS-InSAR observation, with R2 above 0.7 at four sites. The SDAs of HL01, HL02, HL03, and HL04 are 42, 44, 41, and 26 mm, respectively. Borehole HL04 has smaller seasonal deformation than the other three sites.
According to the field investigation, the four boreholes are in river valleys with flat terrain, vegetation coverage above 85%, and ALT around 1.8 m, and the soil water content in AL of HL01, HL02, and HL03 are similar and significantly higher than HL04 (Table 1). We can find that when the topography, vegetation, and the ALT are similar, the SDA has an obvious positive correlation with the water content in AL.

4.2. Spatial Distribution of Seasonal Deformation

Figure 6 shows that the SDA is about 0~60 mm, with an average value of 19 mm in the study area. According to the statistical results, two apparent SDA classifications exist in the ZL-YL basin. In mountainous areas, the SDA is 0~20 mm with concentrated distribution, and its central value is about 12 mm, while in intermountain basins, the SDA is 20~60 mm with wide distribution, and its central value is about 32 mm. In the exposed area of bedrock at relatively high altitudes, the range of SDA is 0~10 mm. There is a significant difference in the SDA between the upstream and downstream of the basin. The SDA around the basin of Zonag lake is mainly 20~50 mm, while around the basin of Kusai Lake, Heidin Neur Lake, and Yanhu lake downstream is mainly 20~60 mm, among which the maximum SDA around the basin of the Yanhu lake can exceed 60 mm.

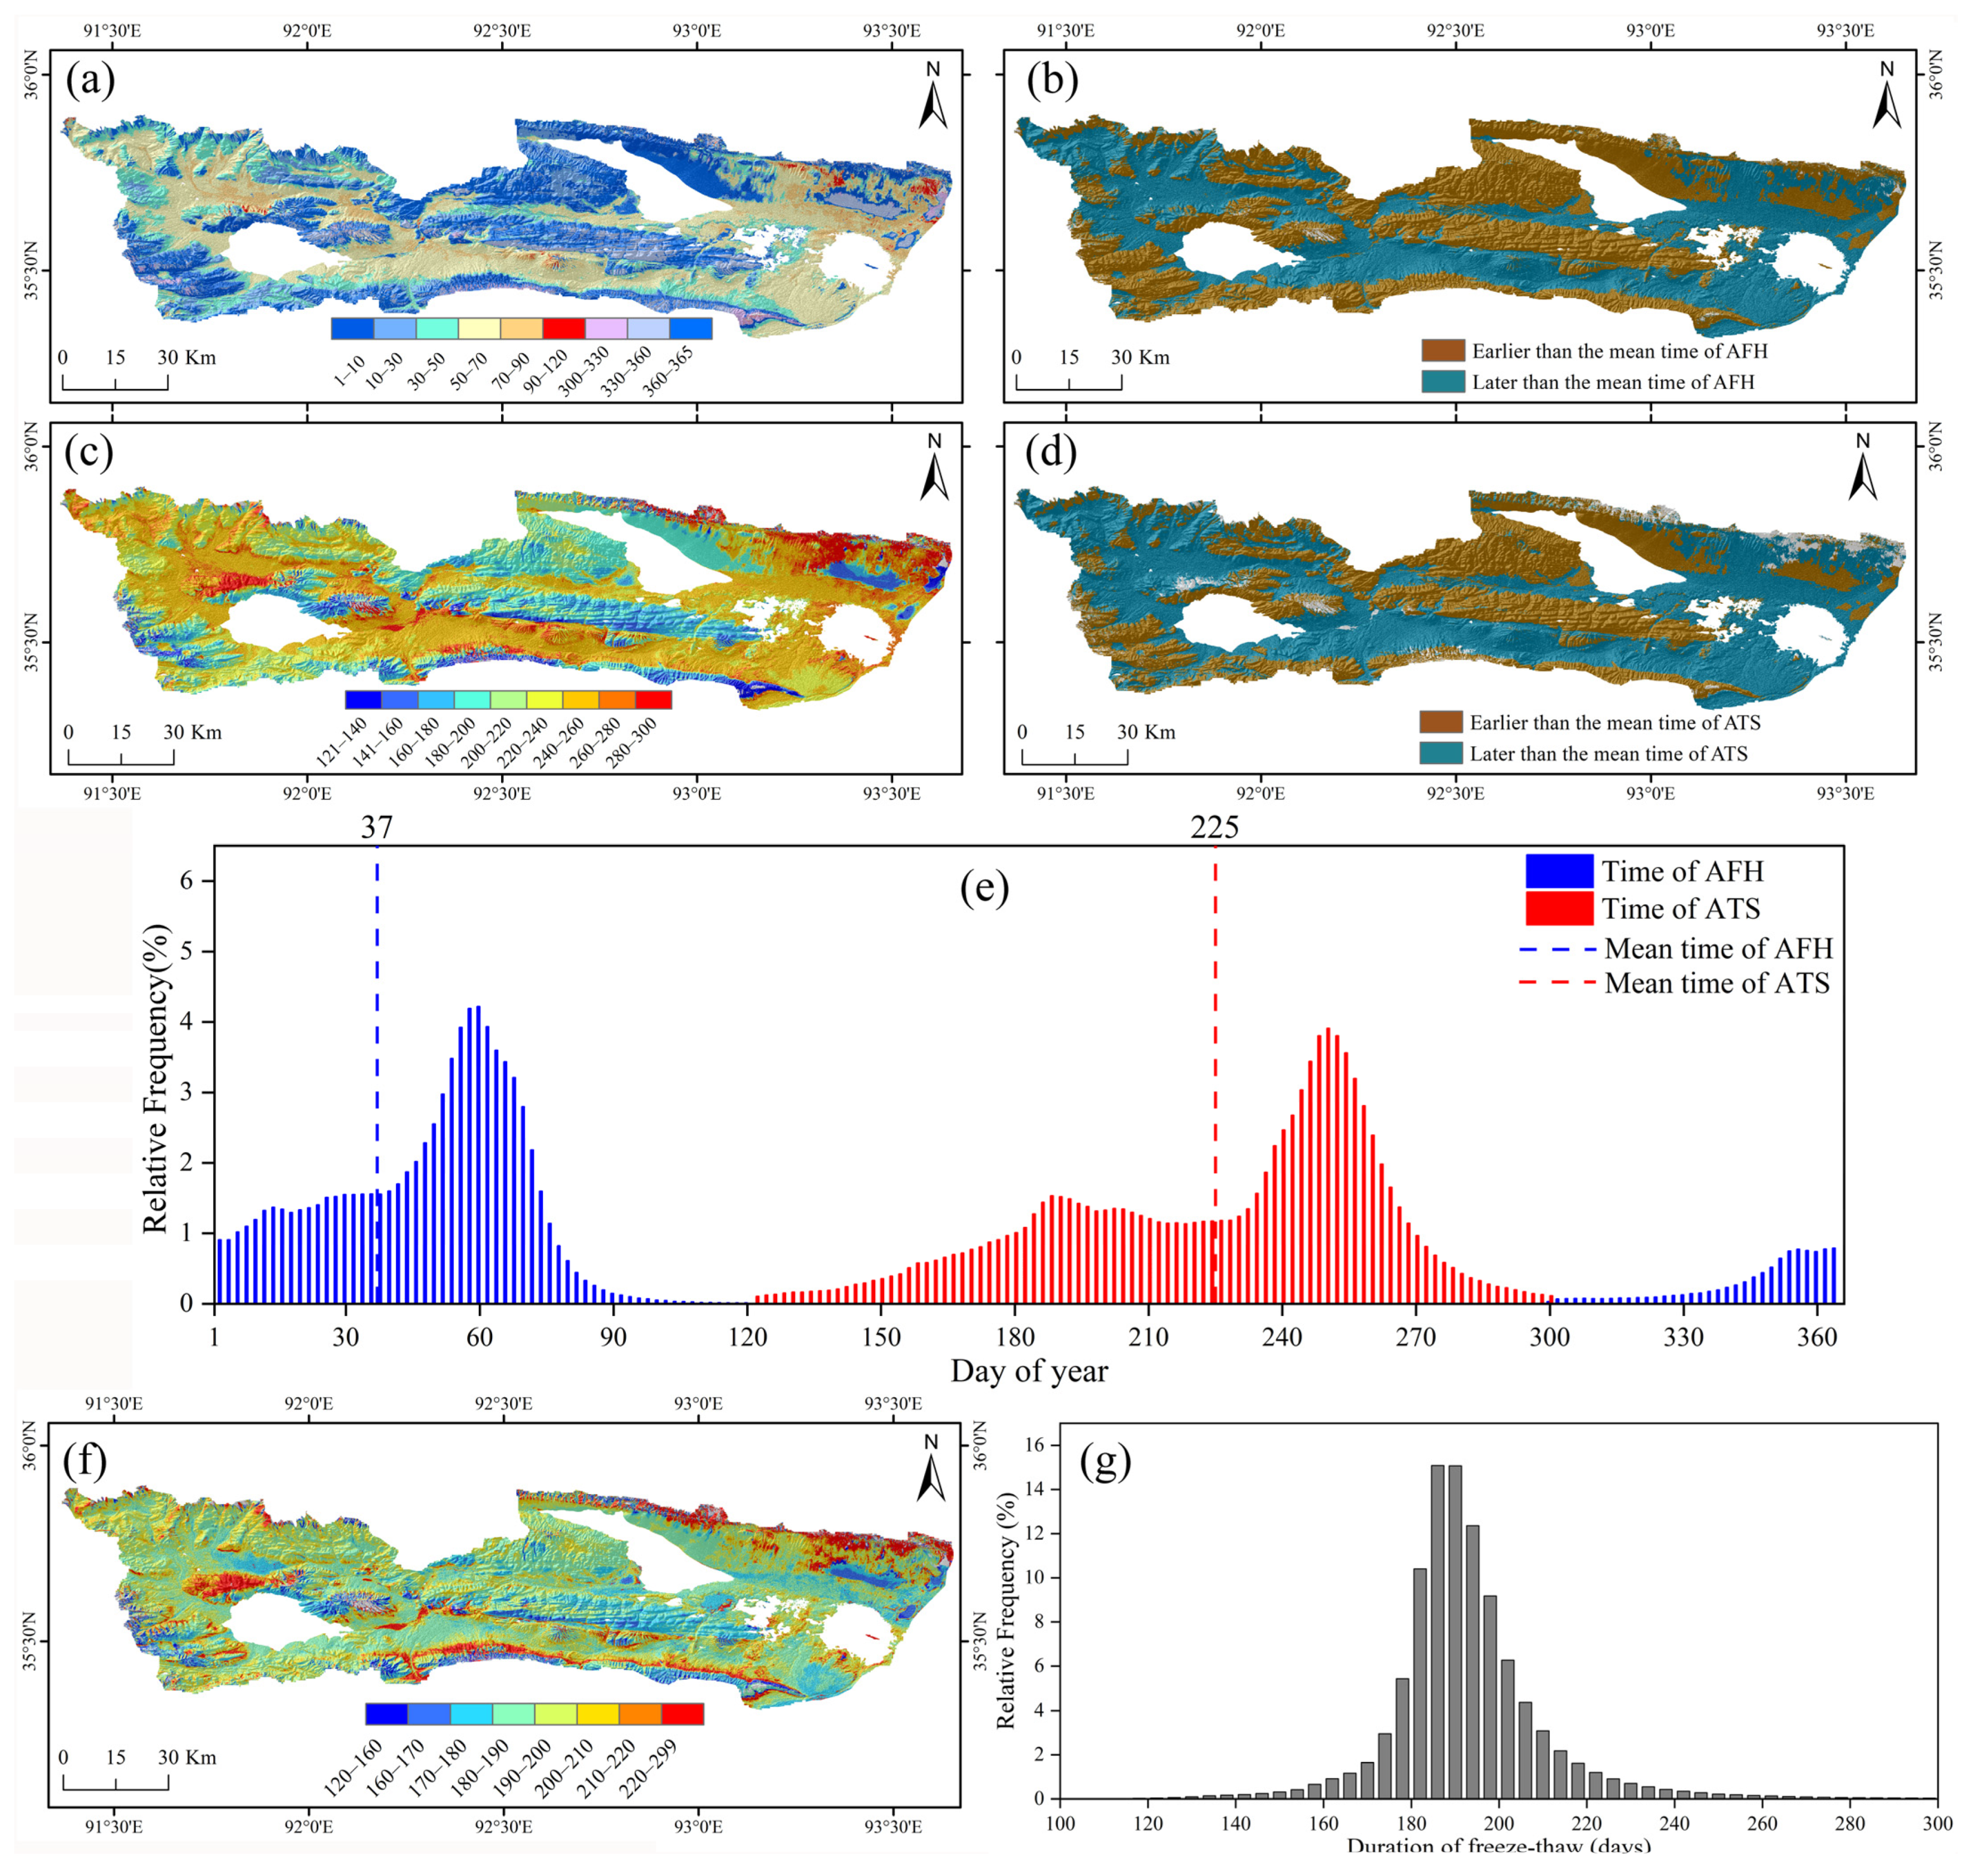
4.3. Time Characteristics of Seasonal Deformation Processes

Figure 3 shows that, in the ZL05, the date of MFH lags behind the lowest surface temperature by 35 days, while the date of MTS lags behind the highest surface temperature by 29 days. The thawing duration of ZL05 is slightly longer than the freezing duration, which indicates that its permafrost has a certain degree of degradation. Figure 7 shows that, on the regional scale, the date that MFH occurred was mainly distributed from 27 November to 21 March of the following year, with an annual average of date of year (DOY) 37, which is about one month earlier than the onset time of thawing. The date that MTS occurred was mainly distributed from 25 July to 21 September of the following year, with an annual average of DOY 225, about 39 days earlier than the onset time of freezing. According to the classification results of the date of MFH and the date of MTS, the intermountain basin and lake basin in relatively low altitude areas, the date of MFH is somewhat earlier than the piedmont plain, while the date of MTS is relatively later than the piedmont plain.
The average thawing duration in the study area is 195 days, larger than the thawing duration calculated based on MODIS LST (average 156 days). In most areas (within three standard deviations), the thawing duration is 175~225 days. The shortest thawing duration is 104~160 days in the high-altitude mountain areas at the edge of the study area and the bedrock at the lower altitude in the middle. In contrast, the longest thawing duration is more than 260 days at the glacier terminus. The thawing duration is longer in the piedmont alluvial-pluvial fan, the middle of the river channel, and the seasonal thawing period around the relatively flat mountain basin, river valley, and lake basin.

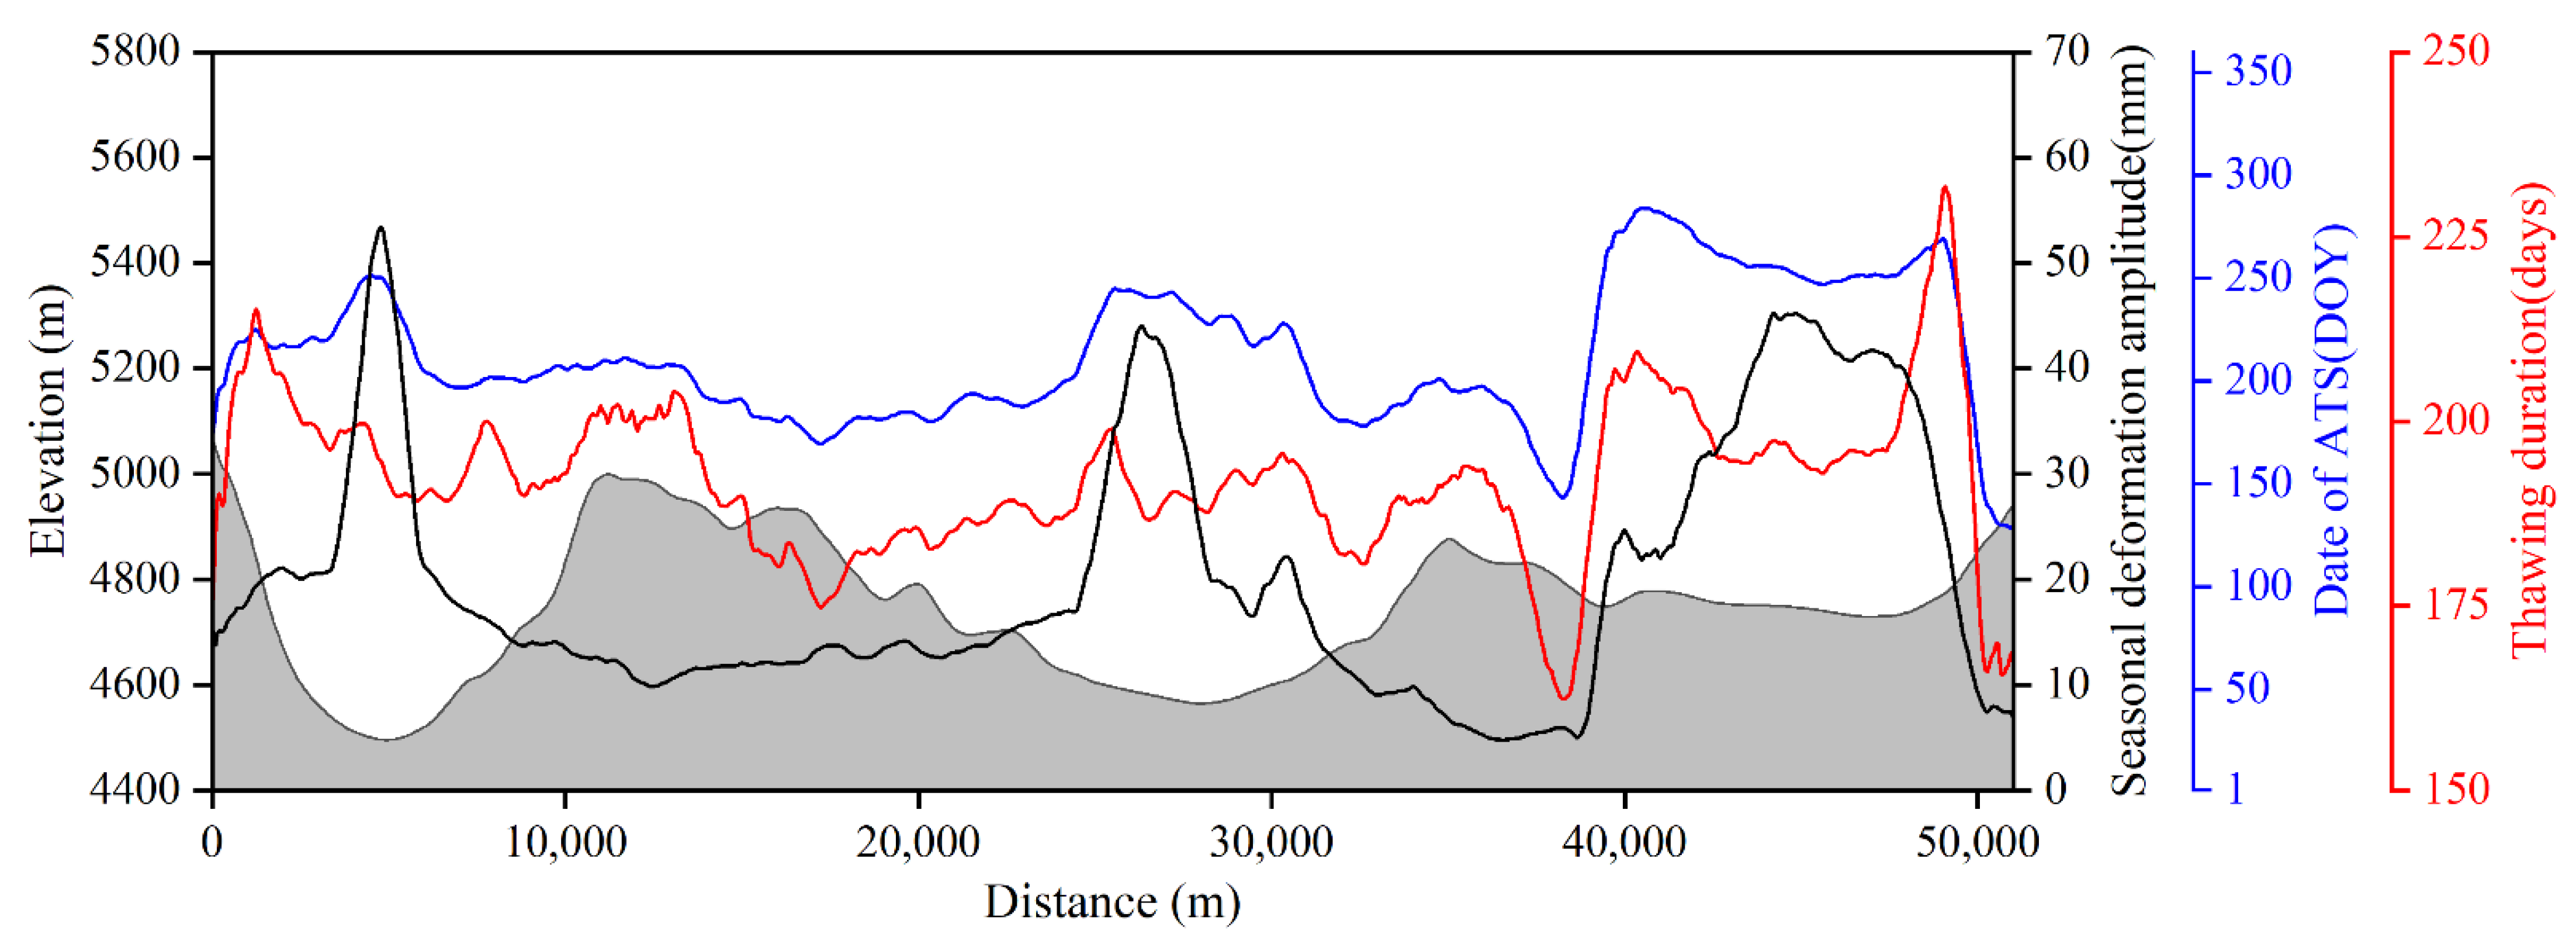
4.4. Relationship between Amplitude and Time of Seasonal Deformation

Figure 8 shows a specific negative correlation between SDA and altitude, similar to previous research results [71,74]. Moreover, there is an apparent correlation between seasonal deformation amplitude and the time characteristics of the F-T process in AL.
According to the correlation analysis (Table 4), the result shows a strong negative correlation between SDA and altitude, and there is also an obvious correlation with seasonal deformation time characteristics. Therefore, the correlation of seasonal deformation characteristics of all pixels in space is analyzed. The correlation of SDA, date of MFH, date of MTS, and thawing duration all passed the significance test of 0.001. There is a strong correlation coefficient between thawing duration and the date of MFH and MTS, mainly determined by its calculation method. SDA is negatively correlated with the date of MFH and thawing duration while positively correlated with the date of MTS.

4.5. Influencing Factors of Seasonal Deformation Amplitude

Figure 9 shows that except for latitude and longitude, the results reveal that all factors passed the significance test (p < 0.005). The explanation ratios of factors are different. DDF and MAGT contribute more than 60% to the seasonal deformation in the study area. The factors that contribute more than 40% to the seasonal deformation include mean annual air temperature, the ratio of DDF to DDT, DDT, and ALT. The soil organic carbon, precipitation, NDVI, and ground ice content contribute more than 20% to the seasonal deformation. The contribution of soil texture, slope direction, slope, and vegetation type to seasonal deformation is relatively low (less than 10%), among which the vegetation form is only 2%, mainly because the study area is an inland lake area with a relatively simple landform.
Figure 5 demonstrates the seasonal deformation variance at four borehole sites, and Figure 6 displays the spatial heterogeneity of seasonal deformation. According to the field investigation, these four boreholes are all located in river valleys, in flat terrain (slope ≤ 1°), vegetation coverage is above 85%, and ALT is around 1.8 m (Table 2). When other conditions are similar, the soil moisture of boreholes HL01, HL02, and HL03 is identical and significantly higher than that of borehole HL04. The vegetation development is closely connected with water supplies in the study area and they are good indicators of soil water content [94], e.g., the swamp meadow environment has much higher soil water content than the meadow or desert environment. Since the soil water content in the AL is not available in the entire study area, we used NDVI as a substitute index of soil water content to analyze the relationship between soil water content and SDA. Moreover, the ALT data also was used to analyze the relationship between ALT and SDA. We analyzed the relationship between various factors and SDA and found that only NDVI and ALT had the most apparent effect on the SDA. Figure 10 shows that the SDA increases obviously with the increase in NDVI and ALT.

5. Discussion

5.1. The Amplitude of Seasonal Deformation

5.1.1. Comparison of Seasonal Deformation Amplitude with Values in Historical Studies

Table 5 lists the SDA retrieved in this study and values in the previous studies. Before 2010, the SDA was in the range of 0~20 mm, as revealed both by the L-band data of ALOS PALSAR [110] and the C-band data of ENVISAT ASAR [85]. The SDA values derived by Sentinel-1 after the 2010s are larger than before the 2010s. Our results are similar to Chen’s [71].
The seasonal deformation of permafrost acquired by MT-InSAR technology is influenced by many factors such as radar data (mainly wavelength), MT-InSAR algorithm, and model (which is used to separate the seasonal deformation from surface deformation), and monitoring period.
(1)
Wavelength. The longer the wavelength of the radar, the stronger the penetrating ability, and the less susceptible it is to vegetation [61,113]. The vegetation in permafrost regions of QTP is mainly alpine grassland and alpine desert [94,114]. Previous research results show that, compared with permafrost regions around the Arctic, the wavelength of radar signal has relatively little influence on obtaining the surface deformation of permafrost regions of the QTP [62,115].
(2)
MT-InSAR algorithm. The Stamps-InSAR and SBAS-InSAR algorithms are based on permanent scatterers [116] and distributed scatterers [117]. They have been widely used to obtain ground deformation in permafrost regions [60,78,118,119], and their reliability and accuracy have been proved. Because of the requirements for the scattering characteristics in the permafrost region, the SDA obtained by the two algorithms may be different.
(3)
Model. Different models may lead to differences in the calculated SDA. The seasonal deformation is caused by the F-T cycle in AL and is determined by many factors, such as topography, soil texture, and soil moisture [62,66,68,71,74]. Both the physical model and statistical model have some shortcomings in obtaining seasonal deformation of AL in permafrost areas [95,119,120].
(4)
Monitoring period. For Sentinel-1 SAR data with the same wavelength and MT-InSAR algorithm, the SDA obtained by SBAS-InSAR [71,75,112,121] is somewhat different, and the SDA increases with period generally. Previous studies have shown that permafrost in the study area shows an evident degradation trend [93], which will lead to the thawing of ground ice at the bottom of the AL and the increase in the ALT [18]. An increase in the soil water content in the AL leads to an increase in the SDA.
In this study area, the SDA tends to increase with time in the study area, which may be related to permafrost degradation and ground ice thawing. Our research and Chen [71] obtained the SDA of AL based on Sentinel-1 SAR and SBAS-InSAR. Although the model is different, the results are consistent with the observed data. The ALT change in the QTP was 19.5 cm per decade from 1981 to 2018 [122], and the precipitation was about 300 mm [123] in the study area. The interannual variation in the ALT and the soil moisture change in AL may be the undetectable difference between the SDA in this study and Chen’s [71].

5.1.2. Influencing Factors of Seasonal Deformation Amplitude

Regarding SDA in the northwest of QTP, unsaturated soil water is mainly concentrated at the bottom of AL and is relatively small, which was 2.5~12 mm from 2003 to 2011 [74]. However, the SDA range from 2007 to 2011 was 0.5~28 mm in the southern boundary of permafrost because the AL is thick and soil moisture content is higher [64]. Previous studies have shown that the SDA positively correlates with the ALT in the same vegetation form [70,71,90]. In the alpine swamp area located in the south of the study area, the SDA ranged from 0 to 74 mm from 2018 to 2019 [77], while in the alpine desert area located in Wudaoliang, the SDA ranged from 2014 to 2019 and was only 9~26 mm [111], which indicated that the influence of vegetation on the SDA was also very prominent. The increased NDVI may be related to the increase in soil water content in the uppermost AL, leading to a larger SDA. Consistent with previous studies [62,111], our study also confirms that SDA at the foot of the slope is also larger than that of the slope, mainly related to the soil water content in AL.
The research in the central of QTP shows that slope and latitude are the main influencing factors of SDA on a large scale [71]. However, our study reveals that the SDA’s main influencing factors are DDF and MAGT. It reflects that the main influencing factors are relevant to the studying scales. In addition, similar to other studies, our results also show that the SDA is related to the vegetation cover and the soil water content in AL and ALT. In addition, similar to other studies, our results also show that the SDA is positively correlated with the vegetation cover [70,71,79] and soil water content of AL [8,74] and the ALT [71].

5.2. Time Characteristics of Seasonal Deformation

For the first time, the time characteristics of seasonal deformation of AL were obtained by SBAS-InSAR and analyzed in detail. It is different from the characteristics of surface F-T time calculated on MODIS LST.
Compared with the F-T time calculated by MODIS LST, which represents the land surface F-T state, the F-T cycle process of the AL is more complicated. In addition to the factors, e.g., climate, altitude, latitude, and surface conditions that affect the surface F-T cycles [5,29,124], the F-T cycles in the AL are also affected by soil texture and soil moisture [5,78]. The F-T cycle of the AL includes four stages: spring warming, summer thawing, autumn freezing, and winter cooling [125]. It is observed that the date of MTS and the date of MFH is earlier than the onset of surface freezing and surface thawing, respectively, and the thawing duration is smaller than the thawing period. Therefore, the time characteristics of the F-T cycle obtained based on seasonal deformation may better reflect the F-T process of AL.
Although existing studies have found that the seasonal deformation time of AL is obviously different from air temperature or surface temperature [74,84], the research on obtaining the time characteristics of the F-T cycle of AL using InSAR technology is still relatively scarce. In Svalbard in the Arctic, Rouyet et al. [78] used MT-InSAR technology and Sentinel-1 data for the first time to obtain the DOY subsidence maxima of AL. Therefore, by comparing their research, we discussed the DOY difference between the QTP and the circum-Arctic region when the AL reached the subsidence maxima. It should be noted that, since the research results of Rouyet et al. are mainly concentrated in flat areas (the slope is less than 2°), we only compared the DOY of MTS in flat areas, and the results are shown in Table 6.
The DOY of MTS time of the AL in the study area is earlier than that of Svalbard, located in the circum-Arctic region, but it is closest to the Adventdalen area in Svalbard (the difference is about 10 days). In the Adventdalen area and the flat area of this study area (slope less than 2°), the ALT is mainly distributed in 0.9~1.8 and 1.4~3.8 m, while the annual average surface temperature is −0.5~−3.2 and −3.6~−4.75 °C, respectively. The annual average surface temperature and ALT are the critical factors of climate influence on permafrost. The higher the annual average surface temperature, the thinner the ALT and the earlier DOY of MTS of AL. In the thawing season, the migration speed of the thawing front in the AL is also affected by the soil texture and soil water content in the AL [126,127]. The higher the soil water content of AL, the slower the migration speed of the thawing front, while the soil texture affects the migration speed of the thawing front through thermal conductivity, and the higher the thermal conductivity, the faster the migration speed of the thawing front. Due to the lack of data on soil water content and soil texture of AL in the Adventdalen area, we can only speculate that the reason why the DOY of MTS in QTP is earlier than that in the circum-Arctic area is mainly due to the difference in active layer thickness caused by climatic conditions.

5.3. Relationship between Amplitude and Time of Seasonal Deformation

Seasonal deformation characteristics exhibit large spatial heterogeneity in the northern area of Kusai Lake and Yanhu Lake (Figure 11). Four regions of interest (delineated with red lines in Figure 11) were explored to analyze their causes. According to the visual interpretation of remote sensing optical images and field investigation, these four regions are all scoured by seasonal rivers. Region A is mainly a sandy slate with an average slope of 5°. The slope of region B is relatively small (the average slope is 2°), which belongs to the alluvial accumulation area. More than 20 spring groups are in the south of B. Regions C and D are mainly sandy loams located in the upper reaches of the alluvial delta of seasonal rivers and the lower reaches of the alluvial/diluvial delta near lakes. In regions B, C, and D, some seasonal rivers seep into the undercurrent in the alluvial accumulation area from the outlet of the mountain pass to the front section of the inclined plane of the lake basin. Moreover, some seep into groundwater again when they reach the outlet of the exposed spring, overflow, return to surface runoff, and then seep into the lakeside section from the exposed spring.
Figure 12 shows that the date of MFH and MTS in the four regions is earlier than in the surrounding areas, but the thawing duration and SDA are smaller than in the surrounding areas. Due to the continuous supply of seasonal rivers in the thawing period, the average soil moisture in four typical areas will be relatively high [128]. However, in the freezing period, when there is no continuous water supply shortage, the soil moisture in four typical areas is lower than in the surrounding areas due to the poor soil water holding capacity. The above two reasons lead to the earlier date of MFH and MTS in four regions to their surrounding areas and the shorter thawing duration and smaller SDA.

6. Conclusions

We used Sentinel-1 SAR data from 2014 to 2019 to obtain the characteristics of the F-T process of AL from 2017 to 2019 in the ZL-YL basin of the QTP by SBAS-InSAR technology.
The SDA of the AL is about 0~60 mm, and the average SDA is 19 mm. In the study area, many factors jointly control SDA, and the thermal condition of permafrost is the most critical factor affecting the SDA, in which MAGT and DDF have more than 60% influence on the seasonal deformation. In the study area, the thermal condition of permafrost is the main factor in the spatial distribution pattern of SDA, and the SDA has the most apparent relationship with the soil moisture, NDVI, and ALT.
The time characteristics of the F-T cycle show that the date that MFH occurred was mainly distributed from 27 November to 21 March of the following year, with an average time of DOY 37, while the date that MTS occurred was mainly distributed from 25 July to 21 September, with an average time of DOY 225. The average thawing duration of the AL is 193 days, which is about one month longer than the thawing duration of the land surface. SDA is negatively correlated with the date of MFH and thawing duration, while it is positively correlated with the date of MTS. The time characteristics of the F-T cycle obtained based on seasonal deformation may better reflect the F-T process of AL.
In addition, in the alluvial and flood accumulation areas with seasonal river scouring, the soil texture significantly influences the SDA through soil water holding capacity. It mainly shows that the SDA is smaller than its surrounding areas, the date of MFH and MTS is earlier than its surrounding areas, and the thawing duration is shorter than its surrounding areas.
Table 7 shows the abbreviations frequently used in this study and their corresponding full names.

Author Contributions

Conceptualization, H.Z., L.Z. and L.W.; methodology, H.Z., L.Z. and L.W.; software, H.Z. and L.W.; validation, H.Z., L.Z. and L.W.; formal analysis, H.Z., L.Z. and L.W.; investigation, H.Z. and L.W.; resources, H.Z., Q.P., C.X., E.D., G.L., Z.L., S.L. and Y.Q.; data curation, Z.X., J.Z. and Y.L.; writing—original draft preparation, H.Z.; writing—review and editing, H.Z., L.Z., L.W., D.Z. and G.H.; visualization, H.Z., L.W. and J.Z.; supervision, L.Z. and L.W.; project administration, L.Z.; funding acquisition, L.Z. and L.W. All authors have read and agreed to the published version of the manuscript.

Funding

This research was funded by the Second Tibetan Plateau Scientific Expedition and Research Program (No.2019QZKK0201) and the Natural Science Foundation of the Jiangsu Province 491 (BK20200828).

Conflicts of Interest

The authors declare no conflict of interest.

References

  1. Wang, G.; Hu, H.; Li, T. The influence of freeze–thaw cycles of active soil layer on surface runoff in a permafrost watershed. J. Hydrol. 2009, 375, 438–449. [Google Scholar] [CrossRef]
  2. Cuo, L.; Zhang, Y.; Bohn, T.J.; Zhao, L.; Li, J.; Liu, Q.; Zhou, B. Frozen soil degradation and its effects on surface hydrology in the northern Tibetan Plateau. J. Geophys. Res. Atmos. 2015, 120, 8276–8298. [Google Scholar] [CrossRef] [Green Version]
  3. Liljedahl, A.K.; Boike, J.; Daanen, R.P.; Fedorov, A.N.; Frost, G.V.; Grosse, G.; Hinzman, L.D.; Iijma, Y.; Jorgen-son, J.C.; Matveyeva, N.; et al. Pan-Arctic ice-wedge degradation in warming permafrost and its influence on tundra hydrology. Nat. Geosci. 2016, 9, 312–318. [Google Scholar] [CrossRef]
  4. Li, Z.X.; Feng, Q.; Li, Z.J.; Yuan, R.F.; Gui, J.; Lv, Y.M. Climate background, fact and hydrological effect of multiphase water transformation in cold regions of the Western China: A review. Earth-Sci. Rev. 2019, 190, 33–57. [Google Scholar]
  5. Li, X.; Jin, R.; Pan, X.; Zhang, T.; Guo, J. Changes in the near-surface soil freeze–thaw cycle on the Qinghai-Tibetan Plateau. Int. J. Appl. Earth Obs. Geoinf. 2012, 17, 33–42. [Google Scholar] [CrossRef]
  6. Wang, Q.; Jin, H.; Zhang, T.; Wu, Q.; Cao, B.; Peng, X.; Wang, K.; Li, L. Active layer seasonal freeze-thaw processes and influencing factors in the alpine permafrost regions in the upper reaches of the Heihe River in Qilian Mountains. Chin. Sci. Bull. 2016, 61, 2742–2756. [Google Scholar] [CrossRef] [Green Version]
  7. Liu, X.; Yang, W.; Zhao, H.; Wang, Y.; Wang, G. Effects of the freeze-thaw cycle on potential evapotranspiration in the permafrost regions of the Qinghai-Tibet Plateau, China. Sci. Total Environ. 2019, 687, 257–266. [Google Scholar] [CrossRef]
  8. Chen, J.; Wu, Y.; O′Connor, M.; Cardenas, M.B.; Schaefer, K.; Michaelides, R.; Kling, G. Active layer freeze-thaw and water storage dynamics in permafrost environments inferred from InSAR. Remote Sens. Environ. 2020, 248, 112007. [Google Scholar] [CrossRef]
  9. Wu, Q.; Niu, F.; Ma, W.; Liu, Y. The effect of permafrost changes on embankment stability along the Qinghai–Xizang Railway. Environ. Earth Sci. 2013, 71, 3321–3328. [Google Scholar] [CrossRef]
  10. Li, G.-Y.; Ma, W.; Mu, Y.-H.; Wang, F.; Fan, S.-Z.; Wu, Y.-H. Effects of freeze-thaw cycle on engineering properties of loess used as road fills in seasonally frozen ground regions, North China. J. Mt. Sci. 2017, 14, 356–368. [Google Scholar] [CrossRef]
  11. Kurz, D.; Flynn, D.; Alfaro, M.; Arenson, L.U.; Graham, J. Seasonal deformations under a road embankment on degrading permafrost in Northern Canada. Environ. Geotech. 2020, 7, 163–174. [Google Scholar] [CrossRef]
  12. Lindner, F.; Wassermann, J.; Igel, H. Seasonal Freeze-Thaw Cycles and Permafrost Degradation on Mt. Zugspitze (German/Austrian Alps) Revealed by Single-Station Seismic Monitoring. Geophys. Res. Lett. 2021, 48, e2021GL094659. [Google Scholar] [CrossRef]
  13. Piao, S.; Ciais, P.; Friedlingstein, P.; Peylin, P.; Reichstein, M.; Luyssaert, S.; Margolis, H.; Fang, J.; Barr, A.; Chen, A.; et al. Net carbon dioxide losses of northern ecosystems in response to autumn warming. Nature 2008, 451, 49–52. [Google Scholar] [CrossRef] [PubMed]
  14. Man, Z.; Xie, C.; Jiang, R.; Che, S. Freeze-thaw cycle frequency affects root growth of alpine meadow through changing soil moisture and nutrients. Sci. Rep. 2022, 12, 4436. [Google Scholar] [CrossRef] [PubMed]
  15. Ma, J.; Li, R.; Liu, H.; Huang, Z.; Wu, T.; Hu, G.; Xiao, Y.; Zhao, L.; Du, Y.; Yang, S. The Surface Energy Budget and Its Impact on the Freeze-thaw Processes of Active Layer in Permafrost Regions of the Qinghai-Tibetan Plateau. Adv. Atmos. Sci. 2022, 39, 189–200. [Google Scholar] [CrossRef]
  16. Turetsky, M.R.; Abbott, B.; Jones, M.C.; Anthony, K.W.; Olefeldt, D.; Schuur, E.A.G.; Koven, C.; McGuire, A.D.; Grosse, G.; Kuhry, P.; et al. Permafrost collapse is accelerating carbon release. Nature 2019, 569, 32–34. [Google Scholar] [CrossRef] [Green Version]
  17. Payandi-Rolland, D.; Shirokova, L.S.; Labonne, F.; Bénézeth, P.; Pokrovsky, O.S. Impact of freeze-thaw cycles on organic carbon and metals in waters of permafrost peatlands. Chemosphere 2021, 279, 130510. [Google Scholar] [CrossRef]
  18. Cheng, G.; Zhao, L.; Li, R.; Wu, X.; Sheng, Y.; Hu, G.; Zou, D.; Jin, H.; Li, X.; Wu, Q. Characteristic, changes and impacts of permafrost on Qinghai-Tibet Plateau. Chin. Sci. Bull. 2019, 64, 2783–2795. [Google Scholar]
  19. Zou, D.; Zhao, L.; Sheng, Y.; Chen, J.; Hu, G.; Wu, T.; Wu, J.; Xie, C.; Wu, X.; Pang, Q.; et al. A new map of permafrost distribution on the Tibetan Plateau. Cryosphere 2017, 11, 2527–2542. [Google Scholar] [CrossRef] [Green Version]
  20. Ran, Y.; Li, X.; Cheng, G. Climate warming over the past half century has led to thermal degradation of permafrost on the Qinghai–Tibet Plateau. Cryosphere 2018, 12, 595–608. [Google Scholar] [CrossRef] [Green Version]
  21. Hu, G.; Zhao, L.; Li, R.; Wu, X.; Wu, T.; Xie, C.; Zhu, X.; Su, Y. Variations in soil temperature from 1980 to 2015 in permafrost regions on the Qinghai-Tibetan Plateau based on observed and reanalysis products. Geoderma 2019, 337, 893–905. [Google Scholar] [CrossRef]
  22. Liu, G.; Xie, C.; Zhao, L.; Xiao, Y.; Wu, T.; Wang, W.; Liu, W. Permafrost warming near the northern limit of permafrost on the Qinghai-Tibetan Plateau during the period from 2005 to 2017: A case study in the Xidatan area. Permafr. Periglac. Processes 2020, 32, 323–334. [Google Scholar] [CrossRef]
  23. Yin, G.; Luo, J.; Niu, F.; Lin, Z.; Liu, M. Thermal Regime and Variations in the Island Permafrost Near the Northern Permafrost Boundary in Xidatan, Qinghai–Tibet Plateau. Front. Earth Sci. 2021, 9, 708630. [Google Scholar] [CrossRef]
  24. Peng, X.; Zhang, T.; Frauenfeld, O.W.; Wang, K.; Luo, D.; Cao, B.; Su, H.; Jin, H.; Wu, Q. Spatiotemporal Changes in Active Layer Thickness under Contemporary and Projected Climate in the Northern Hemisphere. J. Clim. 2018, 31, 251–266. [Google Scholar] [CrossRef]
  25. Zhao, D.; Wu, S. Projected Changes in Permafrost Active Layer Thickness over the Qinghai-Tibet Plateau under Climate Change. Water Resour. Res. 2019, 55, 7860–7875. [Google Scholar] [CrossRef]
  26. Xu, X.; Wu, Q. Active Layer Thickness Variation on the Qinghai-Tibetan Plateau: Historical and Projected Trends. J. Geophys. Res. Atmos. 2021, 126, e2021JD034841. [Google Scholar] [CrossRef]
  27. Zhang, Z.; Wu, Q.; Xun, X.; Wang, B.; Wang, X. Climate change and the distribution of frozen soil in 1980–2010 in northern northeast China. Quat. Int. 2018, 467, 230–241. [Google Scholar] [CrossRef]
  28. Wang, T.; Wu, T.; Wang, P.; Li, R.; Xie, C.; Zou, D. Spatial distribution and changes of permafrost on the Qinghai-Tibet Plateau revealed by statistical models during the period of 1980 to 2010. Sci. Total Environ. 2019, 650 Pt 1, 661–670. [Google Scholar] [CrossRef]
  29. Guo, D.; Wang, H. Simulated change in the near-surface soil freeze/thaw cycle on the Tibetan Plateau from 1981 to 2010. Chin. Sci. Bull. 2014, 59, 2439–2448. [Google Scholar] [CrossRef]
  30. Wang, K.; Zhang, T.; Zhong, X. Changes in the timing and duration of the near-surface soil freeze/thaw status from 1956 to 2006 across China. Cryosphere 2015, 9, 1321–1331. [Google Scholar] [CrossRef] [Green Version]
  31. Luo, S.; Fang, X.; Lyu, S.; Jiang, Q.; Wang, J. Interdecadal Changes in the Freeze Depth and Period of Frozen Soil on the Three Rivers Source Region in China from 1960 to 2014. Adv. Meteorol. 2017, 2017, 5931467. [Google Scholar] [CrossRef] [Green Version]
  32. Liao, Y.; Li, Y.; Fan, J.; Galoie, M.; Motamedi, A. Spatiotemporal Variations of Freezing and Thawing Indices During the Past Four Decades in Tibet. Front. Ecol. Evol. 2021, 9, 675. [Google Scholar] [CrossRef]
  33. Zhao, T.; Shi, J.; Hu, T.; Zhao, L.; Zou, D.; Wang, T.; Ji, D.; Li, R.; Wang, P. Estimation of high-resolution near-surface freeze/thaw state by the integration of microwave and thermal infrared remote sensing data on the Tibetan Plateau. Earth Space Sci. 2017, 4, 472–484. [Google Scholar] [CrossRef]
  34. Philipp, M.; Dietz, A.; Buchelt, S.; Kuenzer, C. Trends in Satellite Earth Observation for Permafrost Related Analyses—A Review. Remote Sens. 2021, 13, 1217. [Google Scholar] [CrossRef]
  35. Zhang, T.; Armstrong, R.L. Soil freeze/thaw cycles over snow-free land detected by passive microwave remote sensing. Geophys. Res. Lett. 2001, 28, 763–766. [Google Scholar] [CrossRef]
  36. Kimball, J.S.; McDonald, K.C.; Running, S.W.; Frolking, S.E. Satellite radar remote sensing of seasonal growing seasons for boreal and subalpine evergreen forests. Remote Sens. Environ. 2004, 90, 243–258. [Google Scholar] [CrossRef]
  37. Han, L.; Tsunekawa, A.; Tsubo, M. Radar remote sensing of springtime near-surface soil thaw events at mid-latitudes. Int. J. Remote Sens. 2011, 32, 8555–8574. [Google Scholar] [CrossRef]
  38. Derksen, C.; Xu, X.; Dunbar, R.S.; Colliander, A.; Kim, Y.; Kimball, J.S.; Black, T.A.; Euskirchen, E.; Langlois, A.; Loranty, M.M.; et al. Retrieving landscape freeze/thaw state from Soil Moisture Active Passive (SMAP) radar and radiometer measurements. Remote Sens. Environ. 2017, 194, 48–62. [Google Scholar] [CrossRef]
  39. Roy, A.; Toose, P.; Williamson, M.; Rowlandson, T.; Derksen, C.; Royer, A.; Berg, A.A.; Lemmetyinen, J.; Arnold, L. Response of L-Band brightness temperatures to freeze/thaw and snow dynamics in a prairie environment from ground-based radiometer measurements. Remote Sens. Environ. 2017, 191, 67–80. [Google Scholar] [CrossRef]
  40. Prince, M.; Roy, A.; Royer, A.; Langlois, A. Timing and spatial variability of fall soil freezing in boreal forest and its effect on SMAP L-band radiometer measurements. Remote Sens. Environ. 2019, 231, 111230. [Google Scholar] [CrossRef]
  41. Jin, R.; Li, X.; Che, T. A decision tree algorithm for surface soil freeze/thaw classification over China using SSM/I brightness temperature. Remote Sens. Environ. 2009, 113, 2651–2660. [Google Scholar] [CrossRef]
  42. Zhao, T.; Zhang, L.; Jiang, L.; Zhao, S.; Chai, L.; Jin, R. A new soil freeze/thaw discriminant algorithm using AMSR-E passive microwave imagery. Hydrol. Processes 2011, 25, 1704–1716. [Google Scholar] [CrossRef]
  43. Chai, L.; Zhang, L.; Zhang, Y.; Hao, Z.; Jiang, L.; Zhao, S. Comparison of the classification accuracy of three soil freeze–thaw discrimination algorithms in China using SSMIS and AMSR-E passive microwave imagery. Int. J. Remote Sens. 2014, 35, 7631–7649. [Google Scholar] [CrossRef]
  44. Jin, R.; Zhang, T.; Li, X.; Yang, X.; Ran, Y. Mapping Surface Soil Freeze-Thaw Cycles in China Based on SMMR and SSM/I Brightness Temperatures from 1978 to 2008. Arct. Antarct. Alp. Res. 2018, 47, 213–229. [Google Scholar] [CrossRef] [Green Version]
  45. Gao, H.R.; Zhang, Z.J.; Zhang, W.C.; Chen, H.; Xi, M.J. Spatial Downscaling Based on Spectrum Analysis for Soil Freeze/Thaw Status Retrieved From Passive Microwave. IEEE Trans. Geosci. Remote Sens. 2022, 60, 4300211. [Google Scholar] [CrossRef]
  46. Du, J.; Kimball, J.S.; Azarderakhsh, M.; Dunbar, R.S.; Moghaddam, M.; McDonald, K.C. Classification of Alaska Spring Thaw Characteristics Using Satellite L-Band Radar Remote Sensing. IEEE Trans. Geosci. Remote Sens. 2015, 53, 542–556. [Google Scholar]
  47. Park, S.-E. Variations of Microwave Scattering Properties by Seasonal Freeze/Thaw Transition in the Permafrost Active Layer Observed by ALOS PALSAR Polarimetric Data. Remote Sens. 2015, 7, 17135–17148. [Google Scholar] [CrossRef] [Green Version]
  48. Roy, A.; Royer, A.; Derksen, C.; Brucker, L.; Langlois, A.; Mialon, A.; Kerr, Y.H. Evaluation of Spaceborne L-Band Radiometer Measurements for Terrestrial Freeze/Thaw Retrievals in Canada. IEEE J. Sel. Top. Appl. Earth Obs. Remote Sens. 2015, 8, 4442–4459. [Google Scholar] [CrossRef]
  49. Zheng, D.; Wang, X.; Van Der Velde, R.; Zeng, Y.; Wen, J.; Wang, Z.; Schwank, M.; Ferrazzoli, P.; Su, Z. L-Band Microwave Emission of Soil Freeze–Thaw Process in the Third Pole Environment. IEEE Trans. Geosci. Remote Sens. 2017, 55, 5324–5338. [Google Scholar] [CrossRef]
  50. Chen, Y.; Wang, L.; Bernier, M.; Ludwig, R. Retrieving Freeze/Thaw Cycles Using Sentinel-1 Data in Eastern Nunavik (Québec, Canada). Remote Sens. 2022, 14, 802. [Google Scholar] [CrossRef]
  51. Fu, Q.; Hou, R.; Li, T.; Yan, P.; Ma, Z. The Critical Depth of Freeze-Thaw Soil under Different Types of Snow Cover. Water 2017, 9, 370. [Google Scholar] [CrossRef]
  52. Bergstedt, H.; Zwieback, S.; Bartsch, A.; Leibman, M. Dependence of C-Band Backscatter on Ground Temperature, Air Temperature and Snow Depth in Arctic Permafrost Regions. Remote Sens. 2018, 10, 142. [Google Scholar] [CrossRef] [Green Version]
  53. Zheng, D.; Li, X.; Wen, J.; Hofste, J.G.; van der Velde, R.; Wang, X.; Wang, Z.; Bai, X.; Schwank, M.; Su, Z. Active and Passive Microwave Signatures of Diurnal Soil Freeze-Thaw Transitions on the Tibetan Plateau. IEEE Trans. Geosci. Remote Sens. 2021, 60, 4301814. [Google Scholar] [CrossRef]
  54. Hu, T.; Zhao, T.; Shi, J.; Wu, S.; Liu, D.; Qin, H.; Zhao, K. High-Resolution Mapping of Freeze/Thaw Status in China via Fusion of MODIS and AMSR2 Data. Remote Sens. 2017, 9, 1339. [Google Scholar] [CrossRef] [Green Version]
  55. Zhao, T.; Shi, J.; Zhao, S.; Chen, K.; Wang, P.; Li, S.; Xiong, C.; Xiao, Q. Measurement and Modeling of Multi-Frequency Microwave Emission of Soil Freezing and Thawing Processes. In Proceedings of the 2018 Progress in Electromagnetics Research Symposium (PIERS-Toyama), Toyama, Japan, 1–4 August 2018; pp. 31–36. [Google Scholar]
  56. Chen, X.; Liu, L.; Bartsch, A. Detecting soil freeze/thaw onsets in Alaska using SMAP and ASCAT data. Remote Sens. Environ. 2019, 220, 59–70. [Google Scholar] [CrossRef]
  57. Wang, J.; Jiang, L.; Cui, H.; Wang, G.; Yang, J.; Liu, X.; Su, X. Evaluation and analysis of SMAP, AMSR2 and MEaSUREs freeze/thaw products in China. Remote Sens. Environ. 2020, 242, 111734. [Google Scholar] [CrossRef]
  58. Touati, C.; Ratsimbazafy, T.; Poulin, J.; Bernier, M.; Homayouni, S.; Ludwig, R. Landscape Freeze/Thaw Mapping from Active and Passive Microwave Earth Observations over the Tursujuq National Park, Quebec, Canada. Écoscience 2021, 28, 421–433. [Google Scholar] [CrossRef]
  59. Zhong, W.; Yuan, Q.; Liu, T.; Yue, L. Freeze/thaw onset detection combining SMAP and ASCAT data over Alaska: A machine learning approach. J. Hydrol. 2022, 605, 127354. [Google Scholar] [CrossRef]
  60. Liu, L.; Zhang, T.; Wahr, J. InSAR measurements of surface deformation over permafrost on the North Slope of Alaska. J. Geophys. Res. 2010, 115, F03023. [Google Scholar] [CrossRef]
  61. Short, N.; Brisco, B.; Couture, N.; Pollard, W.; Murnaghan, K.; Budkewitsch, P. A comparison of TerraSAR-X, RADARSAT-2 and ALOS-PALSAR interferometry for monitoring permafrost environments, case study from Herschel Island, Canada. Remote Sens. Environ. 2011, 115, 3491–3506. [Google Scholar] [CrossRef]
  62. Chen, F.; Lin, H.; Zhou, W.; Hong, T.; Wang, G. Surface deformation detected by ALOS PALSAR small baseline SAR interferometry over permafrost environment of Beiluhe section, Tibet Plateau, China. Remote Sens. Environ. 2013, 138, 10–18. [Google Scholar] [CrossRef]
  63. Wolfe, S.A.; Short, N.H.; Morse, P.D.; Schwarz, S.H.; Stevens, C.W. Evaluation of RADARSAT-2 DInSAR Seasonal Surface Displacement in Discontinuous Permafrost Terrain, Yellowknife, Northwest Territories, Canada. Can. J. Remote Sens. 2015, 40, 406–422. [Google Scholar] [CrossRef]
  64. Li, Z.-W.; Zhao, R.; Hu, J.; Wen, L.; Feng, G.; Zhang, Z.; Wang, Q. InSAR analysis of surface deformation over permafrost to estimate active layer thickness based on one-dimensional heat transfer model of soils. Sci. Rep. 2015, 5, 15542. [Google Scholar] [CrossRef] [PubMed]
  65. Zhao, R.; Li, Z.W.; Feng, G.C.; Wang, Q.J.; Hu, J. Monitoring surface deformation over permafrost with an improved SBAS-InSAR algorithm: With emphasis on climatic factors modeling. Remote Sens. Environ. 2016, 184, 276–287. [Google Scholar] [CrossRef]
  66. Antonova, S.; Sudhaus, H.; Strozzi, T.; Zwieback, S.; Kääb, A.; Heim, B.; Langer, M.; Bornemann, N.; Boike, J. Thaw Subsidence of a Yedoma Landscape in Northern Siberia, Measured In Situ and Estimated from TerraSAR-X Interferometry. Remote Sens. 2018, 10, 494. [Google Scholar] [CrossRef] [Green Version]
  67. Rudy, A.C.; Lamoureux, S.F.; Treitz, P.; Short, N.; Brisco, B. Seasonal and multi-year surface displacements measured by DInSAR in a High Arctic permafrost environment. Int. J. Appl. Earth Obs. Geoinf. 2018, 64, 51–61. [Google Scholar] [CrossRef]
  68. Rouyet, L.; Lauknes, T.R.; Christiansen, H.H.; Strand, S.M.; Larsen, Y. Seasonal dynamics of a permafrost landscape, Adventdalen, Svalbard, investigated by InSAR. Remote Sens. Environ. 2019, 231, 111236. [Google Scholar] [CrossRef]
  69. Daout, S.; Dini, B.; Haeberli, W.; Doin, M.-P.; Parsons, B. Ice loss in the Northeastern Tibetan Plateau permafrost as seen by 16 yr of ESA SAR missions. Earth Planet. Sci. Lett. 2020, 545, 116404. [Google Scholar] [CrossRef]
  70. Wang, L.; Marzahn, P.; Bernier, M.; Ludwig, R. Sentinel-1 InSAR measurements of deformation over discontinuous permafrost terrain, Northern Quebec, Canada. Remote Sens. Environ. 2020, 248, 111965. [Google Scholar] [CrossRef]
  71. Chen, J.; Wu, T.; Zou, D.; Liu, L.; Wu, X.; Gong, W.; Zhu, X.; Li, R.; Hao, J.; Hu, G.; et al. Magnitudes and patterns of large-scale permafrost ground deformation revealed by Sentinel-1 InSAR on the central Qinghai-Tibet Plateau. Remote Sens. Environ. 2022, 268, 112778. [Google Scholar] [CrossRef]
  72. Biggs, J.; Wright, T.J. How satellite InSAR has grown from opportunistic science to routine monitoring over the last decade. Nat. Commun. 2020, 11, 3863. [Google Scholar] [CrossRef] [PubMed]
  73. Minh, D.H.T.; Hanssen, R.; Rocca, F. Radar Interferometry: 20 Years of Development in Time Series Techniques and Future Perspectives. Remote Sens. 2020, 12, 1364. [Google Scholar] [CrossRef]
  74. Daout, S.; Doin, M.P.; Peltzer, G.; Socquet, A.; Lasserre, C. Large-scale InSAR monitoring of permafrost freeze-thaw cycles on the Tibetan Plateau. Geophys. Res. Lett. 2017, 44, 901–909. [Google Scholar] [CrossRef]
  75. Zhang, X.; Zhang, H.; Wang, C.; Tang, Y.; Zhang, B.; Wu, F.; Wang, J.; Zhang, Z. Time-Series InSAR Monitoring of Permafrost Freeze-Thaw Seasonal Displacement over Qinghai–Tibetan Plateau Using Sentinel-1 Data. Remote Sens. 2019, 11, 1000. [Google Scholar] [CrossRef] [Green Version]
  76. Bartsch, A.; Leibman, M.; Strozzi, T.; Khomutov, A.; Widhalm, B.; Babkina, E.; Mullanurov, D.; Ermokhina, K.; Kroisleitner, C.; Bergstedt, H. Seasonal Progression of Ground Displacement Identified with Satellite Radar Interferometry and the Impact of Unusually Warm Conditions on Permafrost at the Yamal Peninsula in 2016. Remote Sens. 2019, 11, 1865. [Google Scholar] [CrossRef] [Green Version]
  77. Wang, J.; Wang, C.; Zhang, H.; Tang, Y.; Zhang, X.; Zhang, Z. Small-Baseline Approach for Monitoring the Freezing and Thawing Deformation of Permafrost on the Beiluhe Basin, Tibetan Plateau Using TerraSAR-X and Sentinel-1 Data. Sensors 2020, 20, 4464. [Google Scholar] [CrossRef] [PubMed]
  78. Rouyet, L.; Liu, L.; Strand, S.; Christiansen, H.; Lauknes, T.; Larsen, Y. Seasonal InSAR Displacements Documenting the Active Layer Freeze and Thaw Progression in Central-Western Spitsbergen, Svalbard. Remote Sens. 2021, 13, 2977. [Google Scholar] [CrossRef]
  79. Zhang, Z.; Wang, M.; Wu, Z.; Liu, X. Permafrost Deformation Monitoring Along the Qinghai-Tibet Plateau Engineering Corridor Using InSAR Observations with Multi-Sensor SAR Datasets from 1997–2018. Sensors 2019, 19, 5306. [Google Scholar] [CrossRef] [Green Version]
  80. Strozzi, T.; Antonova, S.; Günther, F.; Mätzler, E.; Vieira, G.; Wegmüller, U.; Westermann, S.; Bartsch, A. Sentinel-1 SAR Interferometry for Surface Deformation Monitoring in Low-Land Permafrost Areas. Remote Sens. 2018, 10, 1360. [Google Scholar] [CrossRef] [Green Version]
  81. Teshebaeva, K.; van Huissteden, K.J.; Echtler, H.; Puzanov, A.V.; Balykin, D.N.; Sinitsky, A.I.; Kovalevskaya, N.M.; Dolman, H.A.J. Permafrost Dynamics and Degradation in Polar Arctic From Satellite Radar Observations, Yamal Peninsula. Front. Earth Sci. 2021, 9, 741556. [Google Scholar] [CrossRef]
  82. Shiklomanov, N.I.; Streletskiy, D.A.; Little, J.D.; Nelson, F.E. Isotropic thaw subsidence in undisturbed permafrost landscapes. Geophys. Res. Lett. 2013, 40, 6356–6361. [Google Scholar] [CrossRef]
  83. Leblanc, A.-M.; Oldenborger, G.A.; Short, N. Mapping Permafrost and Terrain Conditions by Combining Corrected DInSAR Seasonal and Inter-Annual Ground Displacements. Cold Reg. Eng. 2019, 2019, 616–624. [Google Scholar]
  84. Reinosch, E.; Buckel, J.; Dong, J.; Gerke, M.; Baade, J.; Riedel, B. InSAR time series analysis of seasonal surface displacement dynamics on the Tibetan Plateau. Cryosphere 2020, 14, 1633–1650. [Google Scholar] [CrossRef]
  85. Li, R.; Li, Z.; Han, J.; Lu, P.; Qiao, G.; Meng, X.; Hao, T.; Zhou, F. Monitoring surface deformation of permafrost in Wudaoliang Region, Qinghai–Tibet Plateau with ENVISAT ASAR data. Int. J. Appl. Earth Obs. Geoinf. 2021, 104, 102527. [Google Scholar] [CrossRef]
  86. Yang, K.; Wang, C. Water storage effect of soil freeze-thaw process and its impacts on soil hydro-thermal regime variations. Agric. For. Meteorol. 2019, 265, 280–294. [Google Scholar] [CrossRef]
  87. Zhang, S.; Zhang, J.; Gui, Y.; Chen, W.; Dai, Z. Deformation properties of coarse-grained sulfate saline soil under the freeze-thaw-precipitation cycle. Cold Reg. Sci. Technol. 2020, 177, 103121. [Google Scholar] [CrossRef]
  88. Yi, S.; He, Y.; Guo, X.; Chen, J.; Wu, Q.; Qin, Y.; Ding, Y. The physical properties of coarse-fragment soils and their effects on permafrost dynamics: A case study on the central Qinghai–Tibetan Plateau. Cryosphere 2018, 12, 3067–3083. [Google Scholar] [CrossRef] [Green Version]
  89. Liu, L.; Schaefer, K.; Zhang, T.; Wahr, J. Estimating 1992–2000 average active layer thickness on the Alaskan North Slope from remotely sensed surface subsidence. J. Geophys. Res. Earth Surf. 2012, 117, F01005. [Google Scholar] [CrossRef]
  90. Wang, C.; Zhang, Z.; Zhang, H.; Zhang, B.; Tang, Y.; Wu, Q. Active Layer Thickness Retrieval of Qinghai–Tibet Permafrost Using the TerraSAR-X InSAR Technique. IEEE J. Sel. Top. Appl. Earth Obs. Remote Sens. 2018, 11, 4403–4413. [Google Scholar] [CrossRef]
  91. Liu, W.; Xie, C.; Zhao, L.; Li, R.; Liu, G.; Wang, W.; Liu, H.; Wu, T.; Yang, G.; Zhang, Y.; et al. Rapid expansion of lakes in the endorheic basin on the Qinghai-Tibet Plateau since 2000 and its potential drivers. Catena 2021, 197, 104942. [Google Scholar] [CrossRef]
  92. Zhang, Z.; Wang, Q.; Jiang, X.; Liu, X. Permafrost Environment Dynamic Monitoring Around the Zonag Lake Using SAR Interferometry. In Proceedings of the 2021 SAR in Big Data Era (BIGSARDATA), Nanjing, China, 22–24 September 2021; pp. 1–4. [Google Scholar]
  93. Liu, W.; Xie, C.; Wang, W.; Yang, G.; Zhang, Y.; Wu, T.; Liu, G.; Pang, Q.; Zou, D.; Liu, H. The Impact of Permafrost Degradation on Lake Changes in the Endorheic Basin on the Qinghai–Tibet Plateau. Water 2020, 12, 1287. [Google Scholar] [CrossRef]
  94. Wang, Z.-W.; Wang, Q.; Zhao, L.; Wu, X.-D.; Yue, G.-Y.; Zou, D.-F.; Nan, Z.-T.; Liu, G.-Y.; Pang, Q.-Q.; Fang, H.-B.; et al. Mapping the vegetation distribution of the permafrost zone on the Qinghai-Tibet Plateau. J. Mt. Sci. 2016, 13, 1035–1046. [Google Scholar] [CrossRef]
  95. Liu, S.; Zhao, L.; Wang, L.; Zhou, H.; Zou, D.; Sun, Z.; Xie, C.; Qiao, Y. Intra-Annual Ground Surface Deformation Detected by Site Observation, Simulation and InSAR Monitoring in Permafrost Site of Xidatan, Qinghai-Tibet Plateau. Geophys. Res. Lett. 2022, 49, e2021GL095029. [Google Scholar] [CrossRef]
  96. Wu, Z.; Zhao, L.; Liu, L.; Zhu, R.; Gao, Z.; Qiao, Y.; Tian, L.; Zhou, H.; Xie, M. Surface deformation monitoring in the permafrost regions over Tibetan Plateau using Sentinel-1 data. Sci. Cold Arid Reg. 2018, 10, 0114–0125. [Google Scholar]
  97. Zou, D.; Zhao, L.; Wu, T.; Wu, X.; Pang, Q.; Wang, Z. Modeling ground surface temperature by means of remote sensing data in high-altitude areas: Test in the central Tibetan Plateau with application of moderate-resolution imaging spectroradiometer Terra/Aqua land surface temperature and ground-based infrared radiometer. J. Appl. Remote Sens. 2014, 8, 083516. [Google Scholar]
  98. Wang, D.; Wu, T.; Zhao, L.; Mu, C.; Li, R.; Wei, X.; Hu, G.; Zou, D.; Zhu, X.; Chen, J.; et al. A 1 km resolution soil organic carbon dataset for frozen ground in the Third Pole. Earth Syst. Sci. Data. 2021, 13, 3453–3465. [Google Scholar] [CrossRef]
  99. Shangguan, W.; Dai, Y.; Liu, B.; Ye, A.; Yuan, H. A soil particle-size distribution dataset for regional land and climate modelling in China. Geoderma 2012, 171, 85–91. [Google Scholar] [CrossRef]
  100. Peng, S.; Ding, Y.; Liu, W.; Li, Z. 1 km monthly temperature and precipitation dataset for China from 1901 to 2017. Earth Syst. Sci. Data 2019, 11, 1931–1946. [Google Scholar] [CrossRef] [Green Version]
  101. Ran, Y.; Li, X.; Cheng, G.; Nan, Z.; Che, J.; Sheng, Y.; Wu, Q.; Jin, H.; Luo, D.; Tang, Z.; et al. Mapping the permafrost stability on the Tibetan Plateau for 2005–2015. Sci. China Earth Sci. 2020, 64, 62–79. [Google Scholar] [CrossRef]
  102. Rosen, P.A.; Gurrola, E.M.; Agram, P.; Cohen, J.; Lavalle, M.; Riel, B.V.; Fattahi, H.; Aivazis, M.A.; Simons, M.; Buckley, S.M. The InSAR Scientific Computing Environment 3.0: A Flexible Framework for NISAR Operational and User-Led Science Processing. In Proceedings of the IGARSS 2018—2018 IEEE International Geoscience and Remote Sensing Symposium, Valencia, Spain, 22–27 July 2018. [Google Scholar]
  103. Yague-Martinez, N.; de Zan, F.; Prats-Iraola, P. Coregistration of Interferometric Stacks of Sentinel-1 TOPS Data. IEEE Geosci. Remote Sens. Lett. 2017, 14, 1002–1006. [Google Scholar] [CrossRef] [Green Version]
  104. Goldstein, R.M.; Werner, C.L. Radar interferogram filtering for geophysical applications. Geophys. Res. Lett. 1998, 25, 4035–4038. [Google Scholar] [CrossRef] [Green Version]
  105. Chen, C.W.; Zebker, H.A. Two-dimensional phase unwrapping with use of statistical models for cost functions in nonlinear optimization. J. Opt. Soc. Am. A 2001, 18, 338–351. [Google Scholar] [CrossRef] [PubMed] [Green Version]
  106. Zhang, Y.J.; Fattahi, H.; Amelung, F. Small baseline InSAR time series analysis: Unwrapping error correction and noise reduction. Comput. Geosci. 2019, 133, 104331. [Google Scholar]
  107. Yu, C.; Penna, N.T.; Li, Z. Generation of real-time mode high-resolution water vapor fields from GPS observations. J. Geophys. Res. Atmos. 2017, 122, 2008–2025. [Google Scholar] [CrossRef]
  108. Zhang, G.; Ran, Y.; Wan, W.; Luo, W.; Chen, W.; Xu, F.; Li, X. 100 years of lake evolution over the Qinghai–Tibet Plateau. Earth Syst. Sci. Data 2021, 13, 3951–3966. [Google Scholar] [CrossRef]
  109. Wang, J.F.; Li, X.H.; Christakos, G.; Liao, Y.L.; Zhang, T.; Gu, X.; Zheng, X.Y. Geographical Detectors-Based Health Risk Assessment and its Application in the Neural Tube Defects Study of the Heshun Region, China. Int. J. Geogr. Inf. Sci. 2010, 24, 107–127. [Google Scholar] [CrossRef]
  110. Jia, Y.; Kim, J.-W.; Shum, C.K.; Lu, Z.; Ding, X.; Zhang, L.; Erkan, K.; Kuo, C.-Y.; Shang, K.; Tseng, K.-H.; et al. Characterization of Active Layer Thickening Rate over the Northern Qinghai-Tibetan Plateau Permafrost Region Using ALOS Interferometric Synthetic Aperture Radar Data, 2007–2009. Remote Sens. 2017, 9, 84. [Google Scholar] [CrossRef] [Green Version]
  111. Lu, P.; Han, J.; Hao, T.; Li, R.; Qiao, G. Seasonal Deformation of Permafrost in Wudaoliang Basin in Qinghai-Tibet Plateau Revealed by StaMPS-InSAR. Mar. Geod. 2019, 43, 248–268. [Google Scholar] [CrossRef]
  112. Wang, J.; Wang, C.; Zhang, H.; Tang, Y.; Duan, W.; Dong, L. Freeze-Thaw Deformation Cycles and Temporal-Spatial Distribution of Permafrost along the Qinghai-Tibet Railway Using Multitrack InSAR Processing. Remote Sens. 2021, 13, 4744. [Google Scholar] [CrossRef]
  113. Wang, L.; Marzahn, P.; Bernier, M.; Jacome, A.; Poulin, J.; Ludwig, R. Comparison of TerraSAR-X and ALOS PALSAR Differential Interferometry With Multisource DEMs for Monitoring Ground Displacement in a Discontinuous Permafrost Region. IEEE J. Sel. Top. Appl. Earth Obs. Remote Sens. 2017, 10, 4074–4093. [Google Scholar] [CrossRef]
  114. Zou, D.; Zhao, L.; Liu, G.; Du, E.; Hu, G.; Li, Z.; Wu, T.; Wu, X.; Chen, J. Vegetation Mapping in the Permafrost Region: A Case Study on the Central Qinghai-Tibet Plateau. Remote Sens. 2022, 14, 232. [Google Scholar] [CrossRef]
  115. Tang, P.; Zhou, W.; Tian, B.; Chen, F.; Li, Z.; Li, G. Quantification of Temporal Decorrelation in X-, C-, and L-Band Interferometry for the Permafrost Region of the Qinghai–Tibet Plateau. IEEE Geosci. Remote Sens. Lett. 2017, 14, 2285–2289. [Google Scholar] [CrossRef]
  116. Hooper, A.; Zebker, H.; Segall, P.; Kampes, B. A new method for measuring deformation on volcanoes and other natural terrains using InSAR persistent scatterers. Geophys. Res. Lett. 2004, 31, L23611. [Google Scholar] [CrossRef]
  117. Berardino, P.; Fornaro, G.; Lanari, R.; Sansosti, E. A new algorithm for surface deformation monitoring based on small baseline differential SAR interferograms. IEEE Trans. Geosci. Remote Sens. 2002, 40, 2375–2383. [Google Scholar] [CrossRef] [Green Version]
  118. Chen, J.; Liu, L.; Zhang, T.; Cao, B.; Lin, H. Using Persistent Scatterer Interferometry to Map and Quantify Permafrost Thaw Subsidence: A Case Study of Eboling Mountain on the Qinghai-Tibet Plateau. J. Geophys. Res. Earth Surf. 2018, 123, 2663–2676. [Google Scholar] [CrossRef]
  119. Wang, L.; Zhao, L.; Zhou, H.; Liu, S.; Du, E.; Zou, D.; Liu, G.; Wang, C.; Li, Y. Permafrost Ground Ice Melting and Deformation Time Series Revealed by Sentinel-1 InSAR in the Tanggula Mountain Region on the Tibetan Plateau. Remote Sens. 2022, 14, 811. [Google Scholar] [CrossRef]
  120. Gruber, S. Ground subsidence and heave over permafrost: Hourly time series reveal interannual, seasonal and shorter-term movement caused by freezing, thawing and water movement. Cryosphere 2020, 14, 1437–1447. [Google Scholar] [CrossRef]
  121. Liu, H.; Li, B.; Zhang, L. Deformation Retrieval Using the Spatially Constrained MTInSAR Method. IEEE Geosci. Remote Sens. Lett. 2022, 19, 4011205. [Google Scholar] [CrossRef]
  122. Zhao, L.; Zou, D.; Hu, G.; Du, E.; Pang, Q.; Xiao, Y.; Li, R.; Sheng, Y.; Wu, X.; Sun, Z.; et al. Changing climate and the permafrost environment on the Qinghai–Tibet (Xizang) plateau. Permafr. Periglac. Processes 2020, 31, 396–405. [Google Scholar] [CrossRef]
  123. Zhao, L.; Zou, D.; Hu, G.; Wu, T.; Du, E.; Liu, G.; Xiao, Y.; Li, R.; Pang, Q.; Qiao, Y.; et al. A synthesis dataset of permafrost thermal state for the Qinghai-Xizang (Tibet) Plateau, China. Earth Syst. Sci. Data 2021, 13, 4207–4218. [Google Scholar] [CrossRef]
  124. Yuan, C.; Yu, Q.; You, Y.; Guo, L. Deformation mechanism of an expressway embankment in warm and high ice content permafrost regions. Appl. Therm. Eng. 2017, 121, 1032–1039. [Google Scholar] [CrossRef]
  125. Zhao, L.; Cheng, G.; Li, S.; Zhao, X.; Wang, S. Thawing and freezing processes of active layer in Wudaoliang region of Tibetan Plateau. Chin. Sci. Bull. 2000, 45, 2181–2187. [Google Scholar] [CrossRef]
  126. Hu, G.-J.; Tian, L.-M.; Zhao, L.; Wu, X.-D.; Li, R.; Wu, T.-H.; Zhu, X.-F.; Du, E.-J.; Wang, Z.-W.; Hao, J.-M.; et al. Soil infiltration processes of different underlying surfaces in the permafrost region on the Tibetan Plateau. Hydrol. Sci. J.-J. Des Sci. Hydrol. 2018, 63, 1733–1744. [Google Scholar] [CrossRef]
  127. Yuan, L.; Zhao, L.; Li, R.; Hu, G.; Du, E.; Qiao, Y.; Ma, L. Spatiotemporal characteristics of hydrothermal processes of the active layer on the central and northern Qinghai-Tibet plateau. Sci. Total Environ. 2020, 712, 136392. [Google Scholar] [CrossRef]
  128. Zhu, X.; Wu, T.; Li, R.; Xie, C.; Hu, G.; Qin, Y.; Wang, W.; Hao, J.; Yang, S.; Ni, J.; et al. Impacts of Summer Extreme Precipitation Events on the Hydrothermal Dynamics of the Active Layer in the Tanggula Permafrost Region on the Qinghai-Tibetan Plateau. J. Geophys. Res. Atmos. 2017, 122, 11–549. [Google Scholar] [CrossRef]
Figure 1. Study area. The background is the hillshade of terrain. The black box in the upper left corner of the figure indicates the location of the study area on the QTP. The black triangle represents the reference point of SBAS-InSAR observation. The black dotted lines (P-P’) are the random profiles used to analyze the relationship between SDA and time characteristics of the F-T cycle.
Remotesensing 14 03168 g001
Figure 2. SBAS-InSAR processing flow. The gray box represents ISCE processing, while the white box represents Mintpy processing flow.
Remotesensing 14 03168 g002
Figure 3. The time characteristics of seasonal deformation of the ZL05.
Remotesensing 14 03168 g003
Figure 4. Comparision (a) and cross-validation (b) between SBAS-InSAR observation and measured data.
Remotesensing 14 03168 g004
Figure 5. Seasonal deformation time series at boreholes. The black solid point is the deformation observed by SBAS-InSAR, and the black dotted line is the model fitted curves.
Remotesensing 14 03168 g005
Figure 6. The spatial distribution (a) and statistical characteristics (b) of seasonal deformation (the time-series deformation of the boreholes is shown in Figure 3 and Figure 5).
Remotesensing 14 03168 g006
Figure 7. Characteristics of seasonal deformation time. (a,b) The date of MFH and classification based on the average date of MFH, respectively; (c,d) the date of MTS and the classification type based on the average date of MTS, respectively; (e) the statistics of the date of MFH, and the date of MTS; (f,g) the thawing duration spatially and its value statistics, respectively.
Remotesensing 14 03168 g007
Figure 8. The relationship between SDA and time characteristics of seasonal deformation at the selected profile line P-P’ (Figure 1).
Remotesensing 14 03168 g008
Figure 9. The q-statistic of environmental factors in controlling the amplitude of seasonal deformation (the red bars are greater than 0.6).
Remotesensing 14 03168 g009
Figure 10. The relationship between NDVI (a) and active layer thickness (b) and seasonal deformation amplitude.
Remotesensing 14 03168 g010
Figure 11. Seasonal deformation characteristics of the regions of interest and their surroundings (delineated with red lines). (a) The regions of interest (delineated with red lines), and the background is the Landsat-8 natural actual color image. (b) The SDA, the date of MFH, the date of MTS, and thawing duration in the north of Kusai lake and Yanhu lake.
Remotesensing 14 03168 g011
Figure 12. Date of MFH (a), date of ATS (b), thawing duration (c), and seasonal deformation amplitude (d) of the regions (black boxes) and their surrounding regions (gray boxes) which delineated with red lines in Figure 11.
Remotesensing 14 03168 g012
Table 1. Basic information on field observation data.
BoreholeVegetation ALT (m)Volume Water Content (%)Soil Texture in the AL
HL01AS1.9121.3Lacking
HL02AS2.0319.50~0.3 m, clay content 20%; 0.3~1.0 m, sand content 30%; 1~2.2 m, clay content 30%.
HL03AS1.8220.80~0.5 m, sandy soil with gravel content of 20%. 0.5~1.2 m, sandy loam with gravel content of 10%. 1.2~1.8 m, clay, clay content of 40%.
HL04ASM1.649.50~0.2 m, gravelly sandy soil, gravel content 30%; 0.2~0.9 m, gravel soil, gravel content 30%; 0.9~1.6 m, clay, clay content 45%.
Table 2. Basic information on influencing factors.
DataGrid Size (m)Time (Year)Data Source
DEM30/http://gdex.cr.usgs.gov/gdex/ (accessed on 1 April 2020)
Vegetation form10002009~2013[94]
NDVI2502017~2019http://data.tpdc.ac.cn (accessed on 1 January 2021).
Soil organic carbon10002009~2019[98]
Soil texture10001980s[99]
Mean annual air temperature10002017~2019[100]
Mean annual precipitation10002017~2019[100]
ALT10002000~2015[101]
MAGT10002005~2015[101]
Ground ice content10002009~2015[18]
DDT10002017~2019MODIS LST
DDF10002017~2019MODIS LST
Table 3. Time of SBAS-InSAR and leveling observation.
Date (DDMMYYYY)Time Interval (Days)
SBAS-InSAR Leveling
14 January 20179 January 20175
9 March 20175 March 20174
20 May 201724 May 20174
10 August 201712 August 20172
22 December 201718 December 20174
27 May 201829 May 20182
19 August 201815 August 20184
6 October 20184 October 20182
10 January 20199 January 20191
28 April 201928 April 20190
1 October 201924 September 20197
Note: 14 January 2017 and 9 January 2017 are the reference times of SBAS-InSAR observation and leveling measurements, respectively.
Table 4. The correlation coefficient between seasonal deformation characteristics.
SDADate of MFHDate of MTSThawing Duration
SDA1
Date of MFH−0.271
Date of MTS0.43−0.541
Thawing duration−0.03−0.250.681
Table 5. Comparison with the previous results in the study area.
SDA (mm)DataTimeMT-InSAR AlgorithmSource
0~20ALOS PALSAR2007~2009SBAS-InSAR[110]
0~20ENVISAT ASAR2006~2009SBAS-InSAR[85]
0~40Sentinel-12017~2018StaMPS-InSAR[111]
0~30Sentinel-12017~2018SBAS-InSAR[75]
0~50Sentinel-12014~2019SBAS-InSAR[112]
0~60Sentinel-12017~2020SBAS-InSAR[71]
0~60Sentinel-12017~2019SBAS-InSARThis study
Table 6. Comparison of the DOY subsidence maxima of AL between QTP and Circum-Arctic region.
SourceDataTimeMT-InSAR AlgorithmThe DOY of MTS
[78]Sentinel-1June to November 2017SBAS-InSARAdventdalen251~269
Kapp Linné287~305
Ny-Ålesund287~299
This studySentinel-12017~2019SBAS-InSAR 237~263
Table 7. List of acronyms.
AcronymsFull Name
ALActive layer
ALTActive layer thickness
DDFDegree days of freezing
DDTDegree days of thawing
DOYDate of year
F-TFreeze–thaw
InSARInterferometric synthetic aperture radar
LSTLand surface temperature
MAGTMean annual ground temperature
MFHMaximum frost heave
MTSMaximum thaw subsidence
MT-InSARMulti-temporal Interferometric synthetic aperture radar
QTPQinghai-Tibet Plateau
SBAS-InSARSmall baseline subset-interferometric synthetic aperture radar
SDASeasonal deformation amplitude
ZL-YLZonag lake-Yanhu lake
Publisher’s Note: MDPI stays neutral with regard to jurisdictional claims in published maps and institutional affiliations.

