Article

Extraction of Floating Raft Aquaculture Areas from Sentinel-1 SAR Images by a Dense Residual U-Net Model with Pre-Trained Resnet34 as the Encoder

1
Key Laboratory of Water Cycle and Related Land Surface Processes, Institute of Geographic Sciences and Natural Resources Research, Chinese Academy of Sciences, Beijing 100101, China
2
University of Chinese Academy of Sciences, Beijing 100049, China
3
Aerospace Information Research Institute, Chinese Academy of Sciences, Beijing 100094, China
4
Department of Civil, Environmental & Geomatics Engineering, College of Engineering & Computer Science, Florida Atlantic University, Boca Raton, FL 33431, USA
*
Author to whom correspondence should be addressed.
Remote Sens. 2022, 14(13), 3003; https://doi.org/10.3390/rs14133003
Submission received: 5 May 2022 / Revised: 29 May 2022 / Accepted: 15 June 2022 / Published: 23 June 2022
(This article belongs to the Special Issue Remote Sensing in Intelligent Maritime Research)

Abstract

:
Marine floating raft aquaculture (FRA) monitoring is significant for marine ecological environment and food security assessment. Synthetic aperture radar-based monitoring is considered to be an effective means of FRA identification because of its capability for all-weather applications. Considering the poor generalization and extraction accuracy of traditional monitoring methods, a semantic segmentation model called D-ResUnet is proposed to extract FRA areas from Sentinel-1 images. The proposed model has a U-Net-like structure but combines the pre-trained ResNet34 as the encoder and adds dense residual units into the decoder. For this model, the final layer and cropping operation of the original U-Net model are removed to eliminate the model parameters. The mean and standard deviation of Precision, Recall, Intersection over Union (IoU), and F1 score are calculated under a five-fold training strategy to evaluate the model accuracy. The test experiments indicated that the proposed model performs well with the F1 of 92.6% and IoU of 86.24% in FRA extraction tasks. In particular, the ablation experiments and application experiments proved the effectiveness of the improvement strategy and the portability of the proposed D-ResUnet model, respectively. Compared with the other three state-of-the-art semantic segmentation models, the experiments demonstrate a clear accuracy advantage of the D-ResUnet model. For the FRA extraction task, this paper presents a promising approach that has refined extraction capability, high accuracy, and acceptable model complexity.

Graphical Abstract

1. Introduction

The Food and Agriculture Organization of the United Nations (FAO) reports that the global marine aquaculture industry has been developing rapidly year by year [1]. As a critical component of mariculture, the rapid growth of marine floating raft aquaculture (FRA) has huge economic benefits but may harm the marine ecological environment, maritime traffic safety, and mariculture sustainable development [2,3,4,5]. Therefore, monitoring the distribution and quantity of FRA areas is of great significance for marine aquaculture planning and food security assessment.
The FRA, which uses floats and ropes to form floating rafts on the sea surface and is fixed to the seabed with cables, has mariculture products suspended on slings and sunk in the water. Shellfish and algae are the two main products of FRA; the former mainly includes oysters, scallops, clams, mussels, etc., while the latter mainly includes seaweed, nori, etc. The FRA is widely distributed in several countries around the world, such as China [6,7], Japan [8], France [9], and the United States [10], and has contributed greatly to the local marine product acquisition and fisheries economy. The traditional on-site investigation is laborious and time consuming, with low efficiency for large-scale FRA monitoring. Therefore, remote sensing (RS) technology is considered an effective approach because of its advantages in terms of wide spatial coverage, short revisit period, and high economic efficiency [6,11,12,13]. Various remote-sensing-based methods have been applied for FRA extraction, including the visual interpretation method [7,14], the spectral feature-based method [15], the polarization feature-based method [16,17], and others. However, the visual interpretation method is time consuming and relies heavily on the experts’ level of experience; the spectral feature-based method cannot solve the classification problem whereby different objects have a similar spectral signature; the polarization feature-based method requires too much extensive preprocessing to reduce the speckle noise. In addition, the poor portability and generalization ability of the above traditional methods also lead to a lower extraction accuracy. As for the data sources, although researchers have indicated that FRA extraction using optical images can achieve impressive accuracy in some cases [2,18], the characteristics of optical images lead to its unsuitability for all-weather applications and result in unsuccessful observations when the FRA is below the sea surface. In contrast, synthetic aperture radar (SAR) can actively transmit signals and receive reflected signals, and thus has the capability to be used in all-weather and day/night applications [19]. Therefore, the SAR-based extraction method is considered to be a promising means of FRA monitoring.
With the development of the Deep Learning (DL) method, various state-of-the-art semantic segmentation models have been proposed, such as FCN [20], U-Net [21], DeepLabs [22,23,24], LinkNet [25], etc. The semantic segmentation method can achieve image segmentation and target recognition by using the captured multi-level semantic features and complex contents of RS images. In the above semantic segmentation models, convolutional neural networks that consist of multiple convolutional layers and pooling layers are used to learn low- and high-level features of the target object from RS images. By these different levels of target classification features, the forward propagation algorithms are used in combination with backward propagation algorithms to force the output values of models closer to the true values [26,27]. Since the convolutional neural network structure is highly suitable for processing RS images with a regular arrangement of pixels, these semantic segmentation models and their improved versions enable the pixel-level segmentation and have achieved significant success in many RS image analysis tasks, such as object detection, image classification, road extraction, etc. [28,29,30,31,32,33].
However, only limited research has been conducted in recent years on SAR-based FRA extraction tasks using deep learning methods. Among these studies, Geng et al. [34] proposed a deep collaborative sparse coding network (DCSCN) to extract the optimized texture features and contour features from Radarsat-2 images. Then, the collaborative features were used to identify the FRA areas, with an overall accuracy between 89.04% and 98.76%. Zhang et al. [35] paid more attention to using the nonsubsampled contourlet transform (NSCT) to extract the contour and orientation features of large FRA areas from Sentinel-1 images. The multiscale and asymmetric convolutions, channel, and spatial attention modules were combined to improve the basic U-Net model, and the extraction results showed an F1 score of 90.7%. Wang et al. [36] proposed a self-attention semantic segmentation method named SA-U-Net++, and a FRA-ISAR data generation method was combined to alleviate the sample shortage problem and improved the IoU accuracy of extraction results to 60.2%. Although meaningful attempts were made in the above studies, many limitations also exist. For example, Geng’s method requires a lot of complex preprocessing to obtain texture features and contour features of the target FRA areas, and research on deep learning algorithm is relatively weak [34]. Zhang’s study and Wang’s study focus only on the extraction of the outer boundaries of large FRA areas and cannot extract specific FRA units within large FRA areas. Furthermore, the IoU accuracy of Wang’s study was 60.2%, which still needs further improvement. In general, DL methods for SAR-based FRA extraction tasks are still insufficiently explored, and the extraction accuracy also needs to be further improved.
In this paper, a semantic segmentation model with dense residual units and a U-shaped structure, which we call D-ResUnet, is proposed to extract FRA areas from Sentinel-1 SAR images. The D-ResUnet was inspired by the U-Net model and residual units in ResNets [37]. The innovations of the proposed D-ResUnet model are as follows: (1) stronger feature extraction capability by adopting the pre-trained ResNet34 without a classifier layer as the encoder; (2) enhanced fine-grained recovery of output images by adding dense residual units instead of plain neural units into decoder; and (3) acceptable calculation complexity. The rest of this paper is organized as follows: Section 2 describes the design and training details of the proposed D-ResUnet model. Section 3 introduces the study area and RS datasets for experiments. Section 4 conducts various experiments and gives detailed experimental accuracy and resulting maps to evaluate the model performance. Section 5 and Section 6 provide a discussion about the model and conclusions of the paper, respectively.

2. Methodology

In this paper, the proposed D-ResUnet model has a U-Net-like structure but with completely different model components and model parameters, resulting in stronger feature extraction and image recovery capability. The major differences are as follows: (1) the pre-trained ResNet34 without a classifier layer was adopted as the encoder to extract multi-level features; (2) dense residual units instead of plain neural units are applied to build the decoder to recover the details of the output image more finely.
Here, a brief review of the U-Net structure and deep residual units is given. Also, we give a detailed introduction of the proposed D-ResUnet model, specific parameters for model training, and accuracy evaluation metrics.

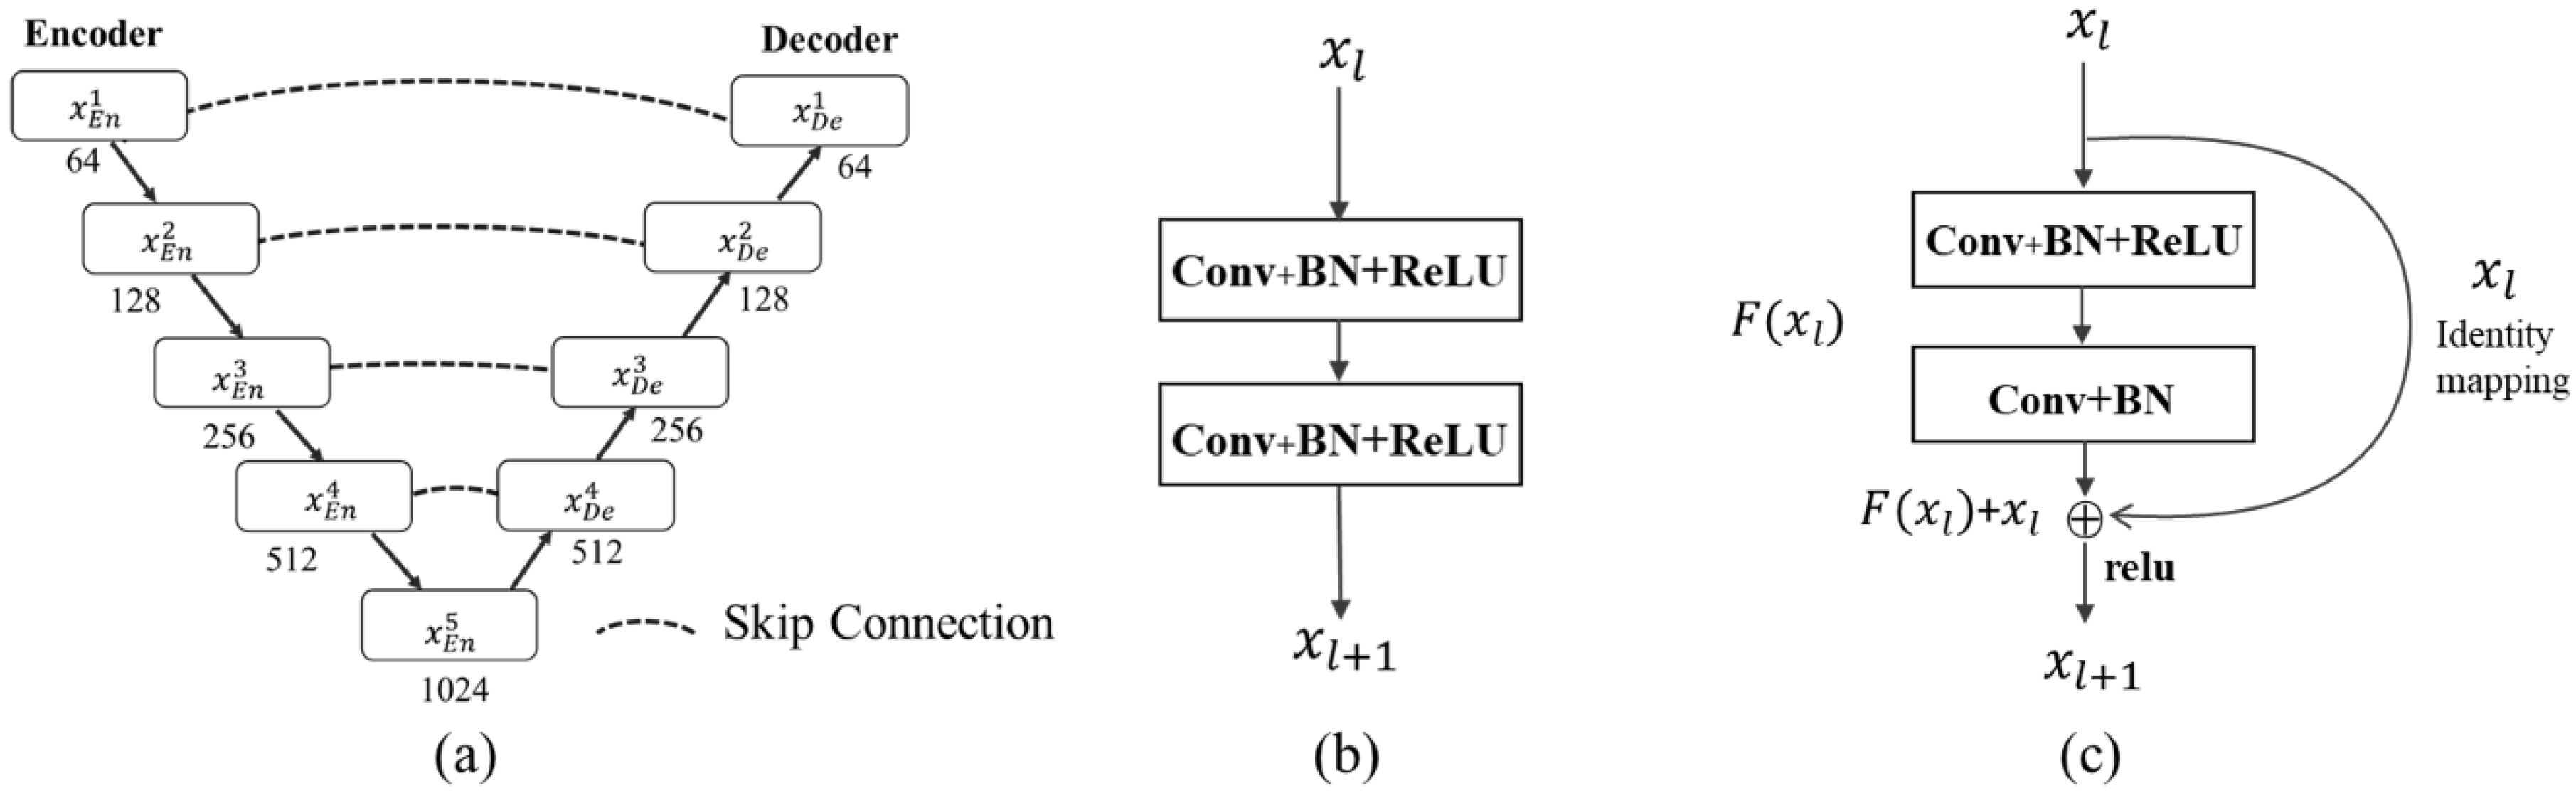
2.1. U-Net and Deep Residual Networks

The classical U-Net model was proposed by He et al. to achieve the biomedical image segmentation task (Figure 1a) [21]. It consists of a 5-layer symmetrical architecture that includes the contracting path (encoder stage) and expansive path (decoder stage) to down-sample the image sample and restores it to its original size. In addition, the unique skip connection structure supplies the path whereby feature information of different levels in the encoder stage can propagate to the corresponding decoder stage. Therefore, the symmetrical encoder-decoder structure and skip connection structure can combine the low-level detail features and high-level semantic features to improve the segmentation performance.
In semantic segmentation tasks, network depth is crucial for segmentation performance because a deeper network means a stronger extraction ability of high-level features and better classification results [38,39]. However, training a “very deep” neural network is very hard because the ensuing gradient disappearance problem always leads to the degradation of the network [40]. To overcome this problem, the residual neural networks (ResNets) were proposed to ease the training and address the degradation problem when only limited training samples are available [37]. The superiority of the deep residual networks comes from many stacked “Residual Units”(Figure 1c) [41]. The residual unit can be expressed in a general form (Equations (1) and (2)):
y l = h ( x l ) + F ( x l , W l )
x l + 1 = f ( y l )
where x l and x l + 1 are input and output of the l-th unit; h ( x l )   is an identity mapping, i.e., h ( x l ) = x l ; F is a residual function; W l is the weight of the l-th unit; f ( y l ) is an activation function (ReLU). These residual units can facilitate the training of networks and gain accuracy from considerably increased network depth.

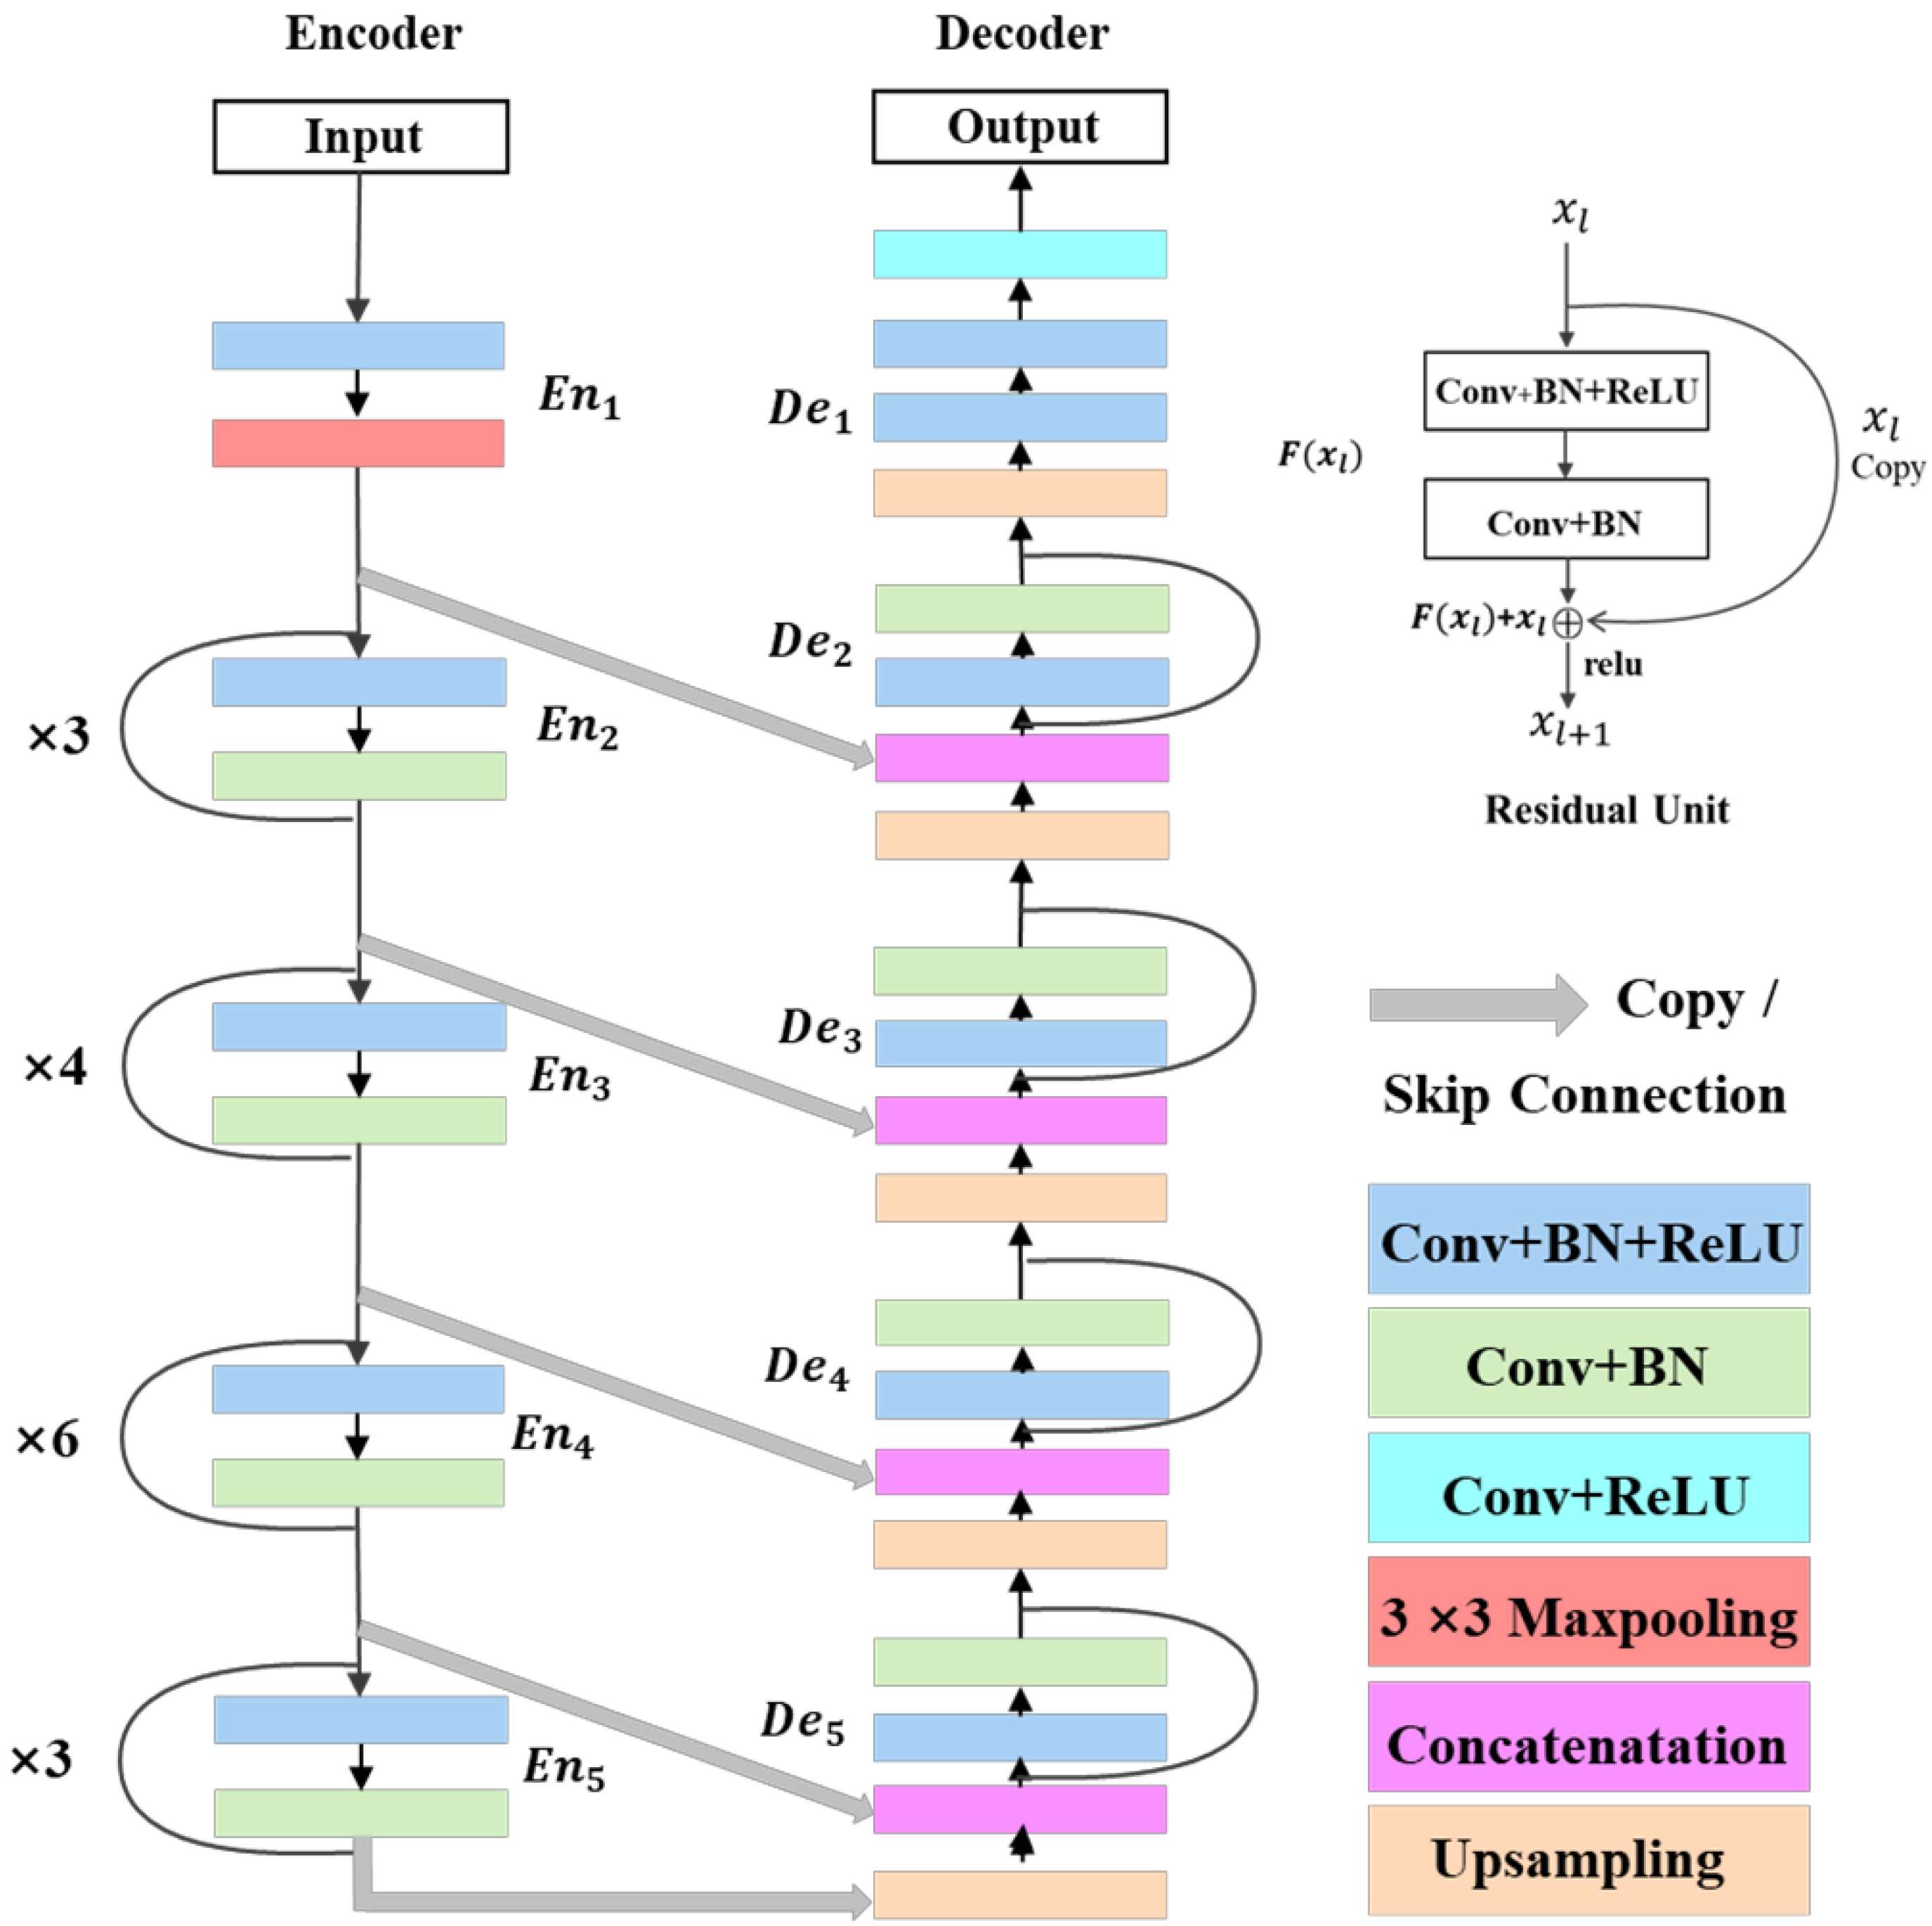
2.2. The Proposed D-ResUnet

In this paper, our proposed D-ResUnet model was mainly inspired by the structure of U-Net model, including the encoder-decoder structure and skip connection structure. Different from the U-Net model, the proposed D-ResUnet model enables stronger capabilities of feature extraction in the encoder and more effective recovery of image details in the decoder. The former is derived from the use of the ResNet34, which has deeper convolutional layers to capture more high-level features, and the latter is derived from the use of dense residual units to create a simpler way that information can propagate effectively.
The proposed D-ResUnet model has a 5-level architecture in the encoder stage and decoder stage (Figure 2). The E n i (i = 1, 2, 3, 4, and 5) represents the encoder block, and D e i (i = 1, 2, 3, 4, and 5) represents the decoder block. The Conv represents the convolutional layer, and a total of 3 types of convolutional units containing a different combination of batch normalization layer and ReLU activation layer are used here (Conv + BN + ReLU, Conv + BN, and Conv + ReLU). Encoder block 1 has a 7 × 7 convolutional layer and a 3 × 3 pooling layer, both of which have a stride of 2 to reduce the feature map by half. Encoder blocks 2 to 5 have the residual units, and ×N means the similar convolutional unit and residual unit are repeated N times in this block. It is worth noting that the first convolutional layer at the beginning of each encoder block has a stride of 2, and others have a default stride of 1. The sample images are fed to encoder block 1 and processed into feature maps, then the feature maps are re-fed to the next encoder block until encoder block 5 outputs the final feature map. In total, 5 levels of feature maps are obtained in the encoder and then copied as the input of corresponding decoder blocks. Correspondingly, decoder blocks 2 to 5 have up-sampling layers, concatenation layers, convolutional units, and residual units. The feature map from a lower level of the decoder is up-sampled and then concatenated with the corresponding feature map from the encoder block. There is no concatenation but an additional convolutional layer in decoder block 1, which is used to output the final semantic segmentation result. The parameters and output size in each stage of the D-ResUnet model are provided in Table 1.

2.3. Pre-Training

Since labeled remote sensing images are valuable and limited, image segmentation tasks often pre-train models on large-scale datasets and then fine-tune the pre-trained model to obtain a better performance in target tasks [42]. Here, the most highly used ImageNet Large Scale Visual Recognition Challenge (ILSVRC) 2012 classification dataset was used to pre-train the encoder of the D-ResUnet model and initial network weights. It spans 1000 object classes and contains 1,281,167 training images, 50,000 validation images and 100,000 test images [43]. In this way, techniques such as pre-training and fine-tuning were used to initialize weights for the encoder of the D-ResUnet network and improve the performance in the FRA extraction task.

2.4. Parameters and Implementation Details

2.4.1. Learning Rate

Learning rate is a significant hyperparameter in the model training process to control the convergence rate of the model [44]. A suitable learning rate can make the objective function converge to a local minimum or the best accuracy in a short time. Here, the step-based decay strategy with the gamma factor of 0.2 in every 10 steps was used to change the learning rate; the strategy can be described as shown in Equation (3):
l r = l r b a s e   × g a m m a s t e p s t e p s i z e
where l r is the current learning rate; l r b a s e   is the initial learning rate; g a m m a factor is the attenuation parameter; s t e p is the current training epoch; s t e p s i z e is the set decay interval, i.e., l r decays once after specific epochs; is the Floor function. The determination of the initial learning rate will be specifically introduced in Section 4.1.

2.4.2. Loss Function

The loss function is used to measure the difference between the predicted value of the model and the true value of label images. By means of the loss function, the model can evaluate the difference between the predicted value of the forward propagation and the true value, and then update the model parameters by backward propagation to force the predicted value as close as possible to the true value. In the model training process, the BCEWithLogitsLoss is a commonly used loss function and usually has good performance in binary classification tasks. Therefore, the BCEWithLogitsLoss was used here to evaluate the difference between the predicted value and the true value. It is essentially the BCELoss function (Equation (4)) and then activated by the sigmoid function (Equation (5)).
B C E L o s s = 1 N   i = 1 N [ y i log ( p i ) + ( 1 y i ) log ( 1 p i ) ]
f ( x ) = 1 1 + e x
where N is the total number of samples; y i is the value of the category that the i-th sample belongs; p i is the predicted value of the i-th sample; f ( x ) is the sigmoid function.

2.4.3. Other Configurations

All models were implemented in the PyTorch framework and optimized by the Adam algorithm with the weight decay factor of 1 × 10⁻³. Given the available hardware status, models were trained with a batch size of 8 on the NVIDIA Quadro RTX 4000 GPU.

2.4.4. Evaluation Metrics

Four metrics were used to assess the experiment results in this paper (Equations (6)–(9)), including Precision, Recall, F1-Score (F1), and Intersection over Union (IoU). These metrics are frequently used to evaluate the classification performance in similar binary classification studies [2,35]. The confusion matrix (Table 2) of the extraction result and the ground truth is as follows:
Precision is the proportion of true FRA areas among FRA areas that the model predicted, and it measures the model’s ability not to misclassify true negative samples into positive samples.
Precision = TP / ( TP + FP )
Recall is the proportion of true FRA areas that are correctly predicted, and it is used to measure the ability of the model to find all true FRA areas.
Recall = TP TP + FN
F1 is an evaluation index that takes into account both Precision and Recall, it means that Precision and Recall are equally important.
F 1 = 2   ×   Precision   ×   Recall Precision + Recall
IoU indicates the intersection ratio of the predicted result map and ground truth map. The ideal situation is complete overlap, i.e., a ratio of 1.
IoU = TP TP + FP + FN

3. Study Area and Experiment Data
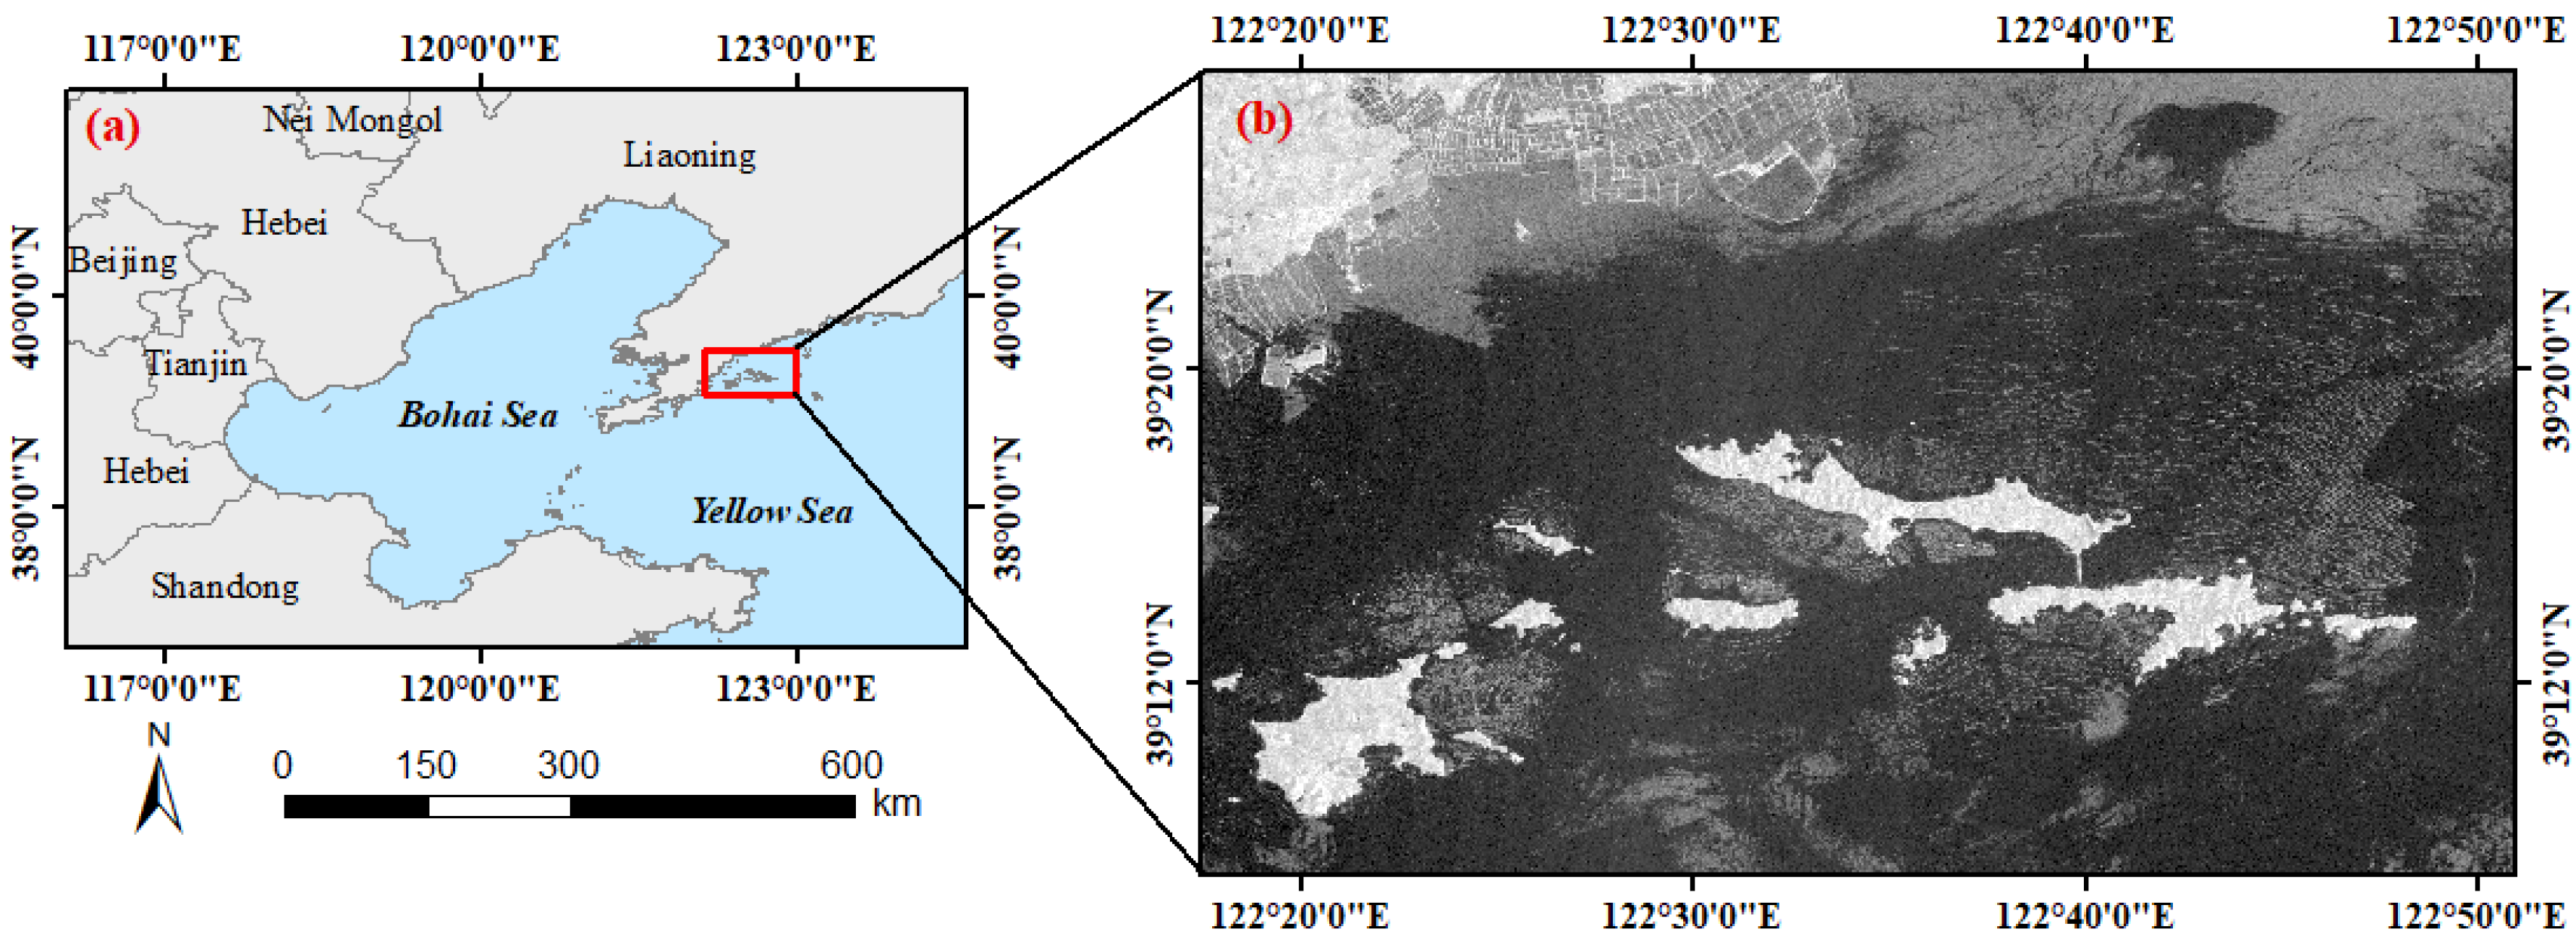
3.1. The Study Area

Northern China has large-scale marine floating raft aquaculture areas, especially in the Bohai Sea and Yellow Sea [36]. In this study, the Changhai county, Liaoning province, China, was selected as the study area (Figure 3). Changhai county is located in the northern part of the Yellow Sea, between 122°13′ to 123°17′E and 38°55′ to 39°18′N. It has a coastline of 358.9 km and a sea area of 10,324 km2, with a water depth between 10 and 40 m [45]. Since Changhai county is far from the mainland, it is less likely to be affected by the pollution of mainland river runoff, factories, and mines. Thus, it is a typical FRA area and ideal for floating raft aquacultures of oysters, scallops, and other sea products.

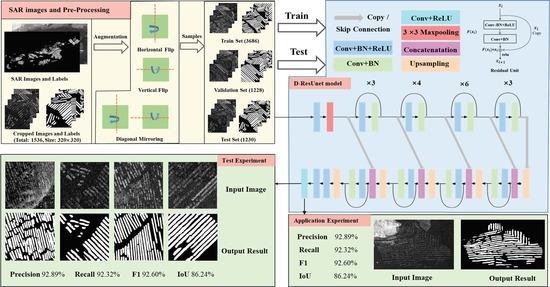
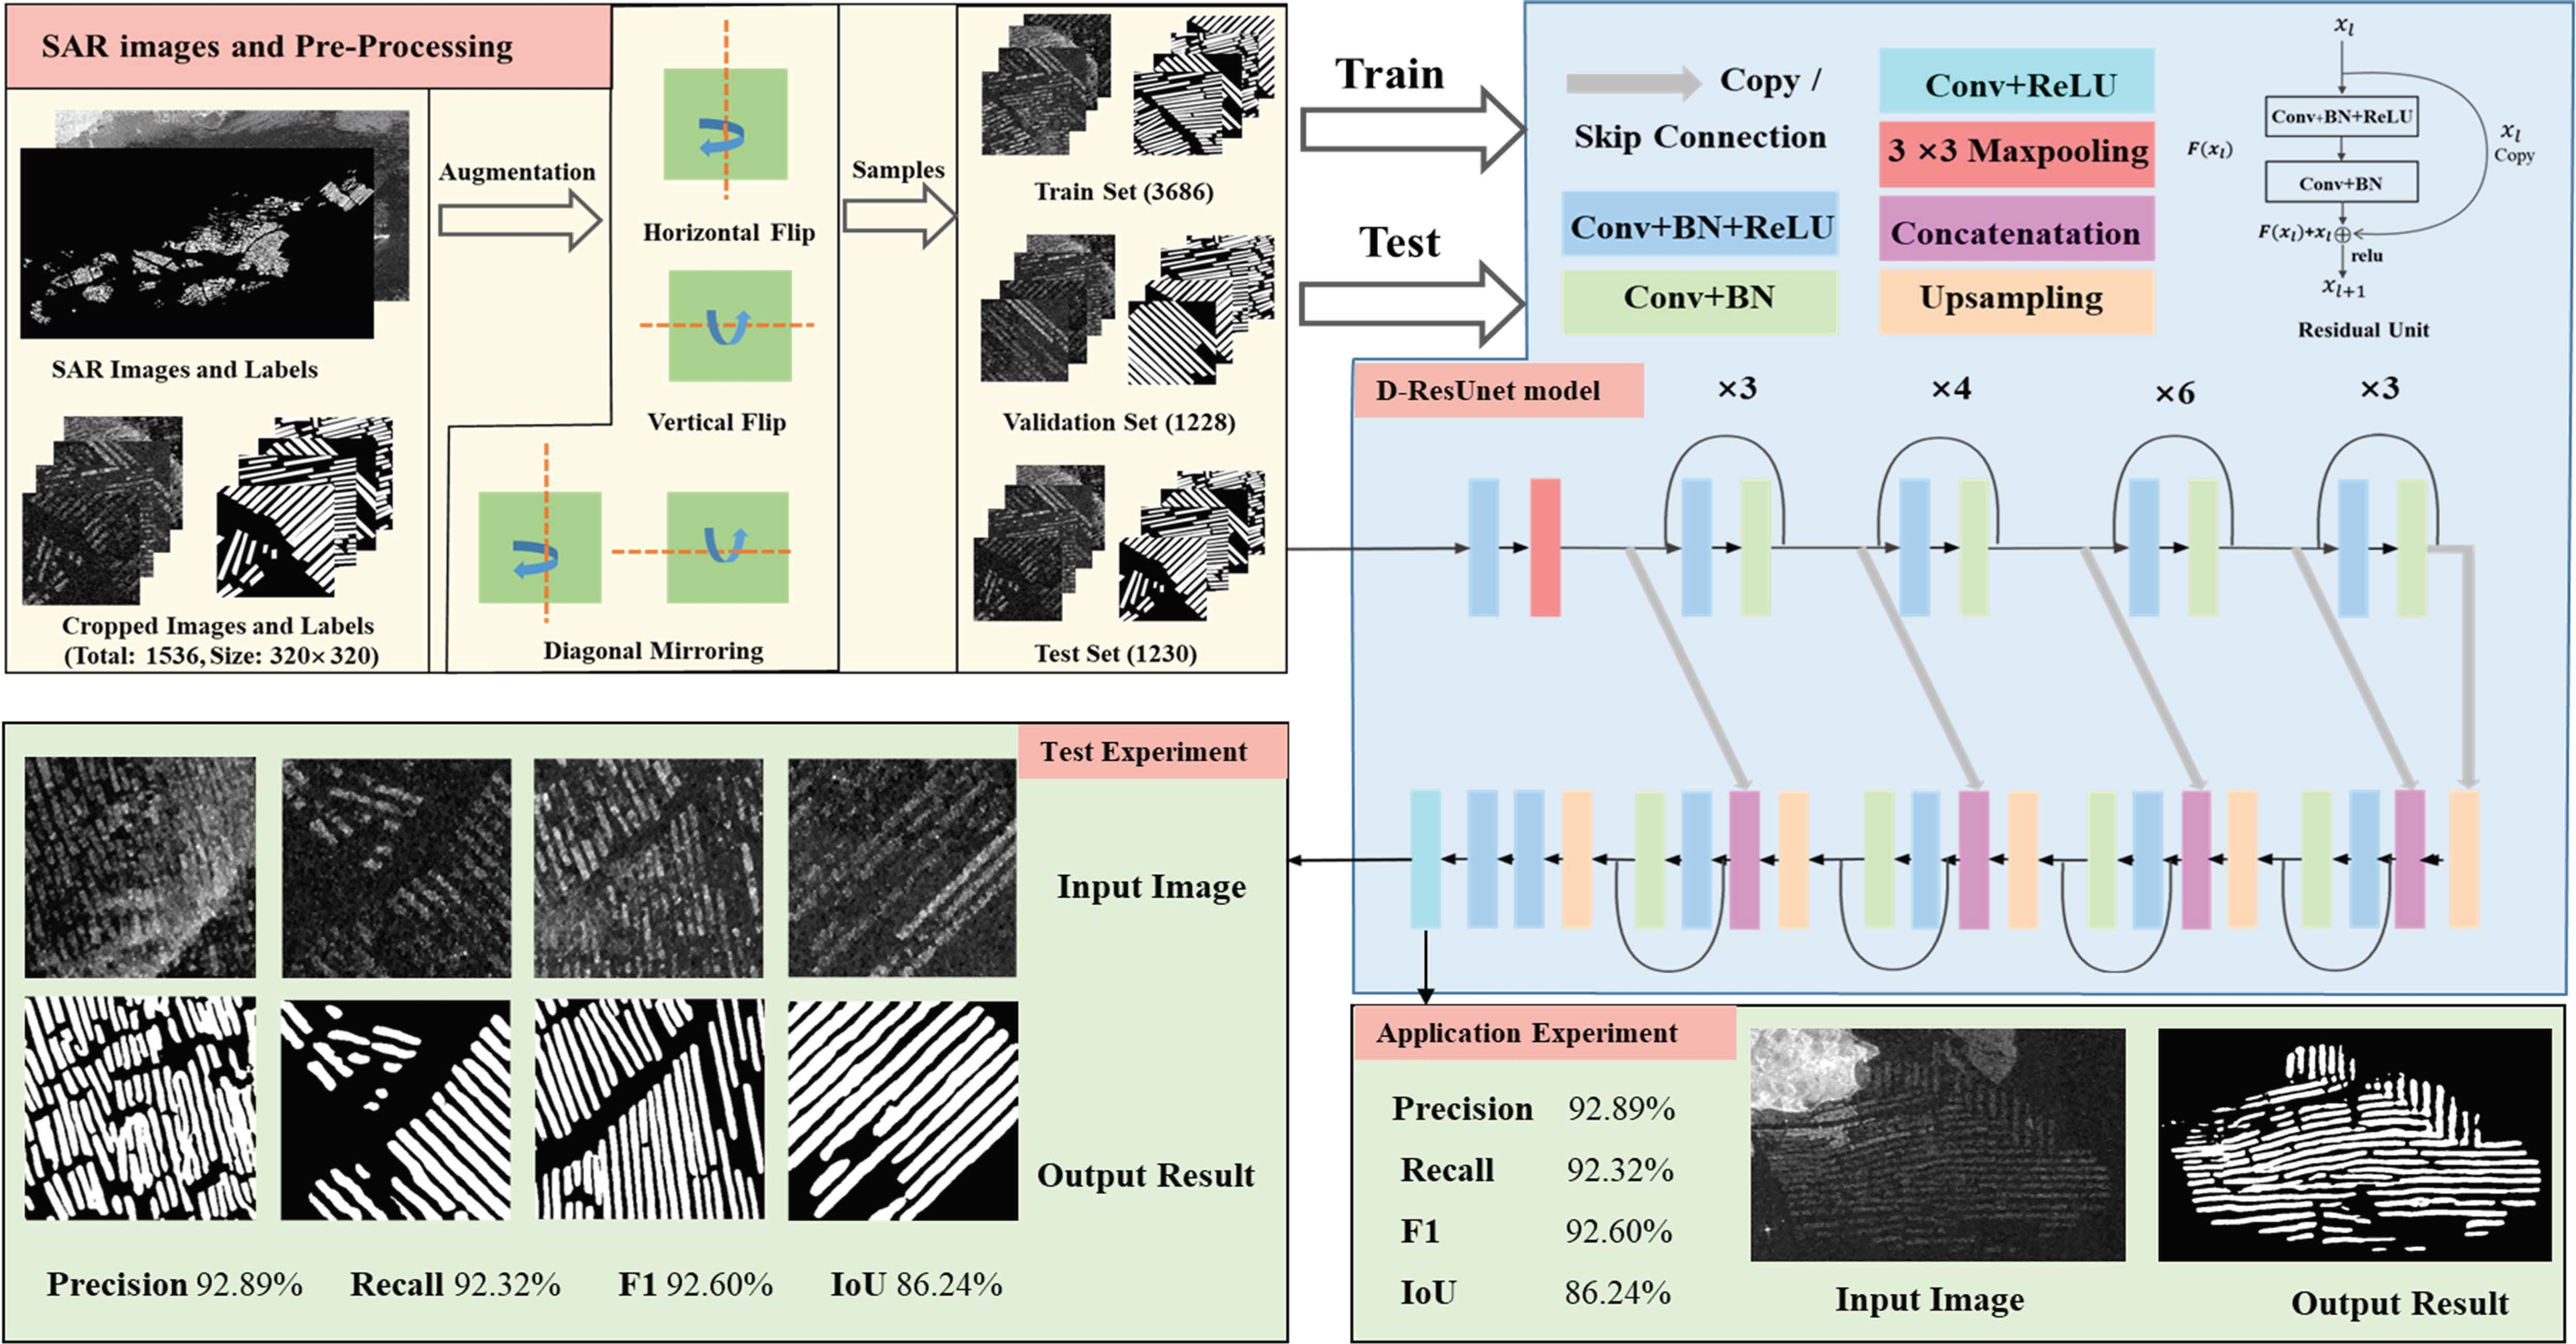
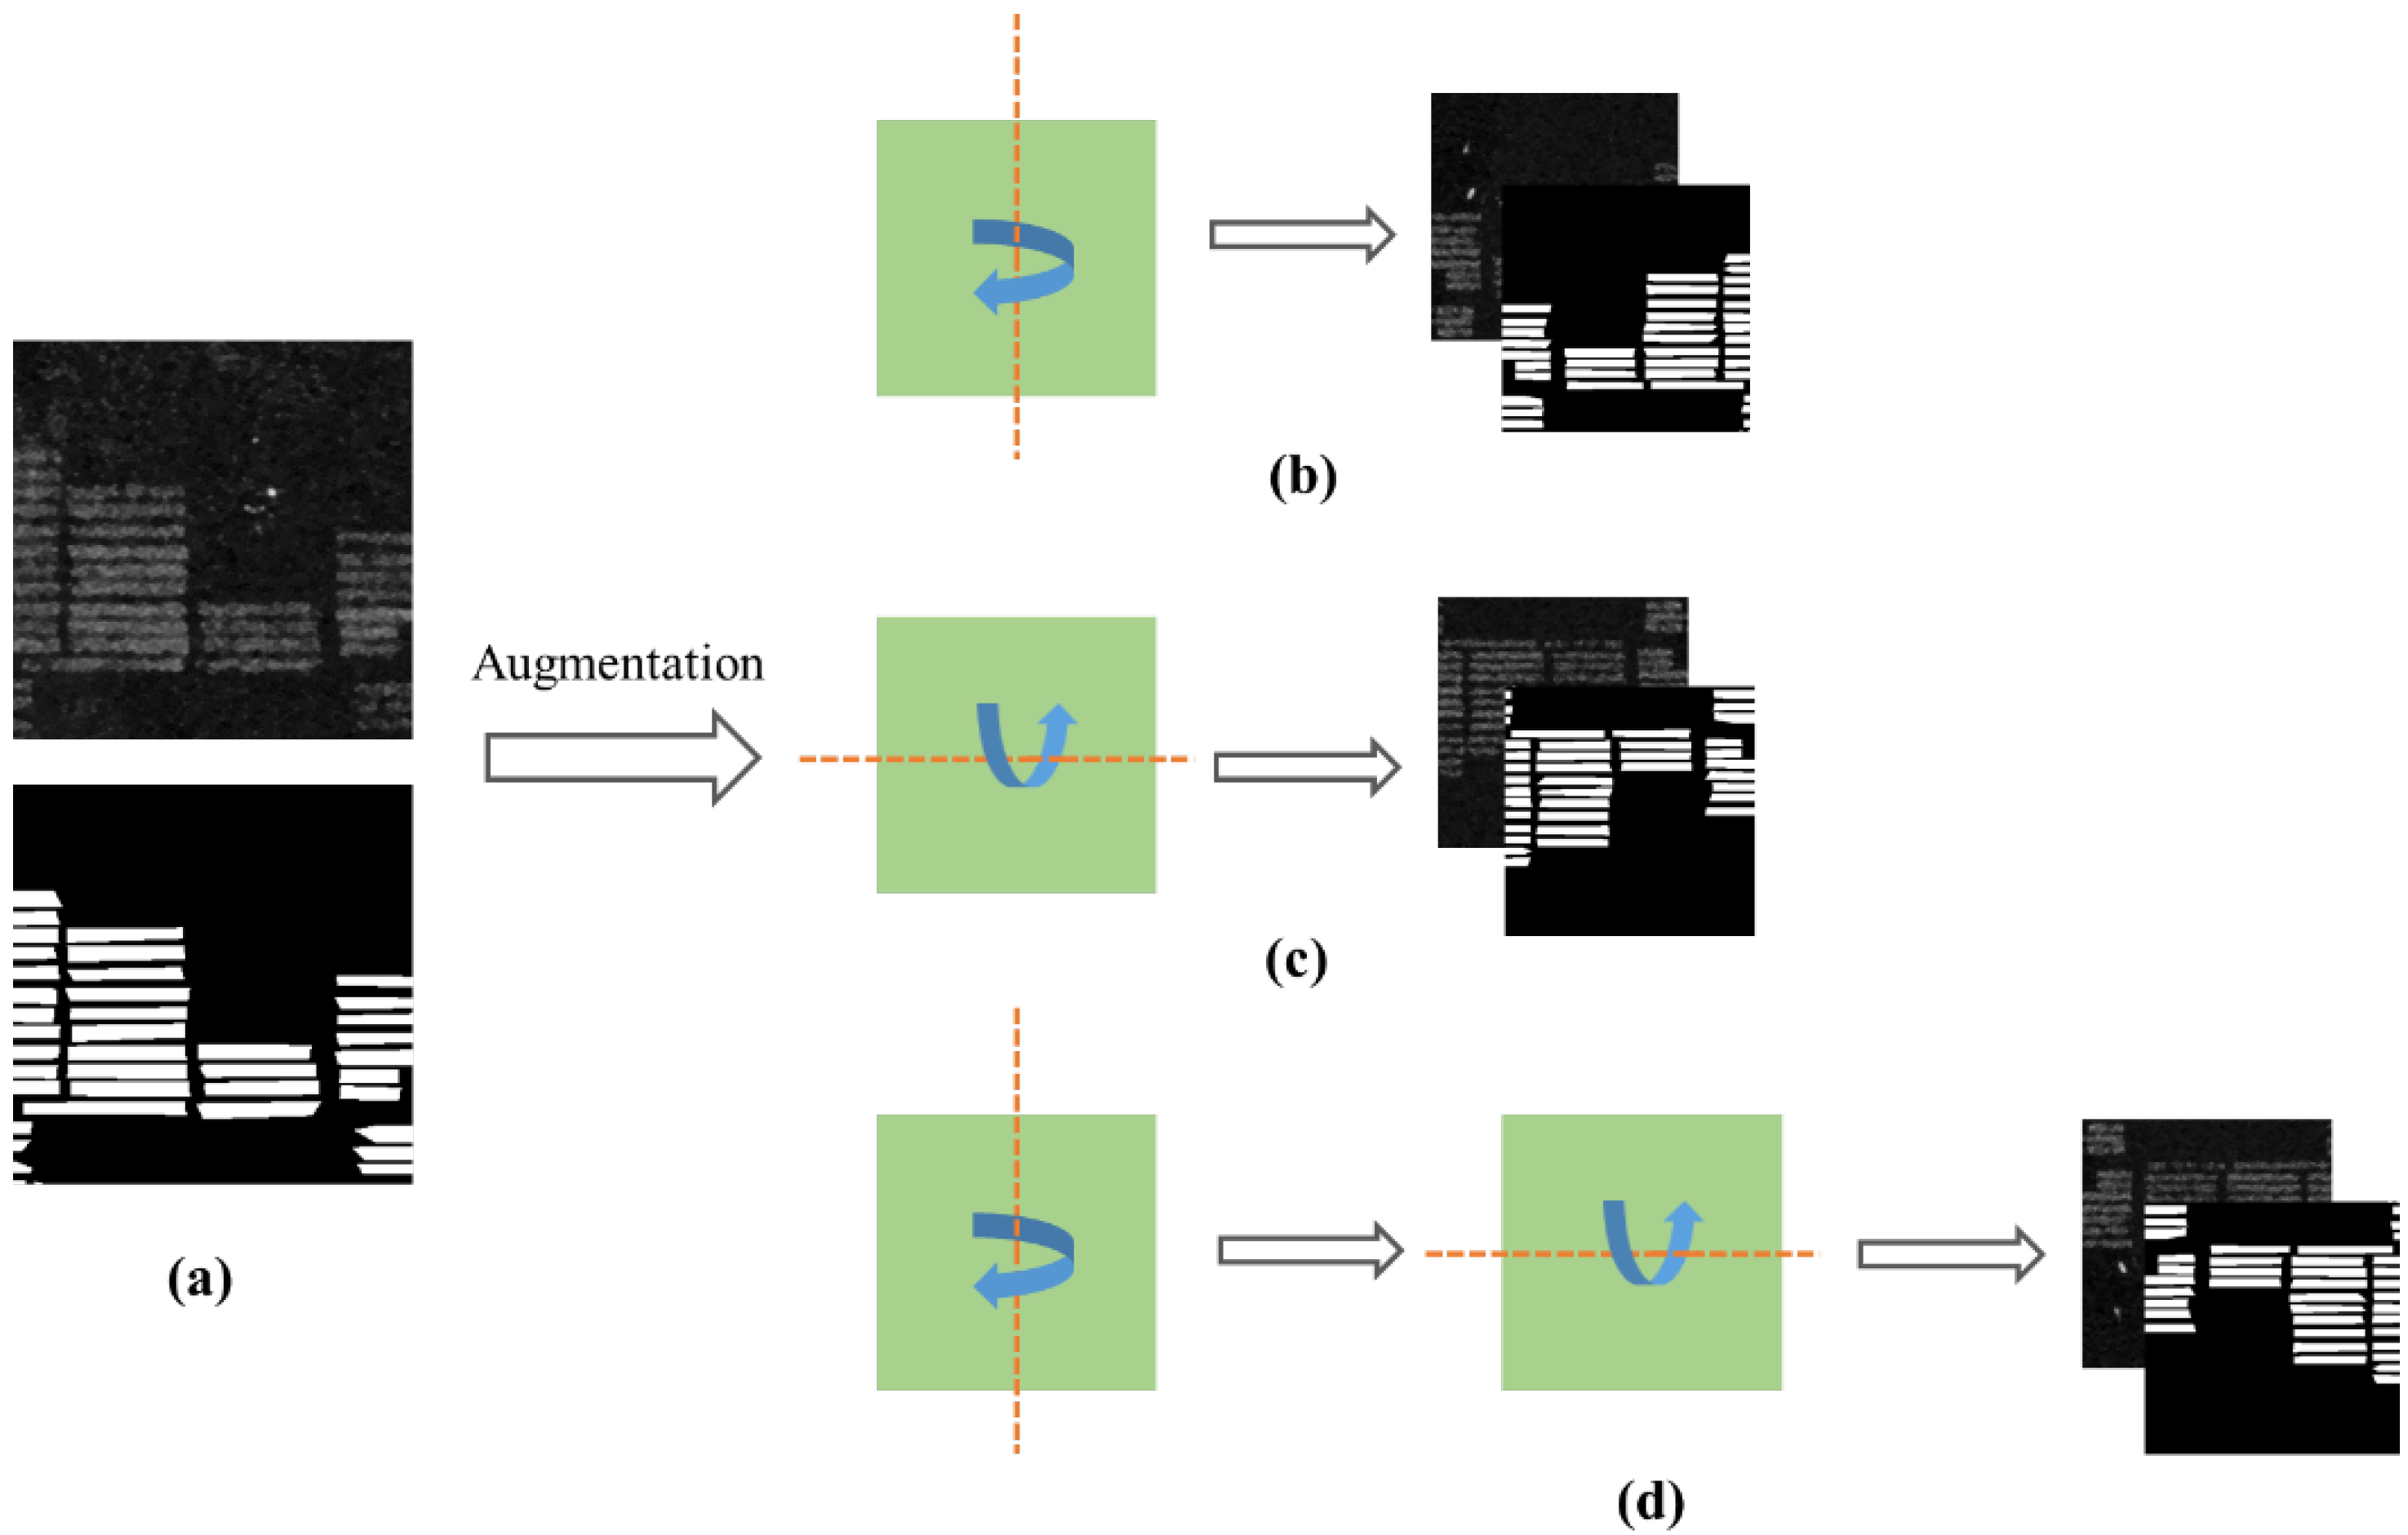
3.2. Dataset and Pre-Processing

Sentinel-1 satellites can provide high-quality C-band SAR data and have four polarization capabilities (HH, VV, HH + HV, and VV + VH) [46]. Sentinel-1 SAR images of the study area were obtained freely from the website of the Sentinel-1 Scientific Data Hub (https://scihub.esa.int, 17 June 2020). Existing studies demonstrated that VV polarization is more permeable than the other three polarization modes from direct observation and mathematical analysis, and the backscattering feature of the FRA area under VV polarization is more significant and more likely to be observed [35,36]. Therefore, three images of the VV polarized Level-1 Ground Range Detected (GRD) Sentinel-1 SAR images acquired on 20 March 2020, 17 June 2020, and 18 July 2019 were utilized for this study.
All three images were pre-processed on the Sentinel’s Application Platform (SNAP) including radiometric calibration, speckle noise removal with the default 7 × 7 Refined Lee filter, and terrain correction with the default SRTM1 Sec HGT data. Experienced interpreters used the ArcGIS tool to manually delineate the FRA areas from Sentinel-1 SAR images and saved the labeled results as the ground truth map. Furthermore, the high-resolution optical images from the Google Earth platform were utilized to check the labeled results and make them as accurate as possible.
The SAR images and the ground truth maps were cropped to generate 1536 patches with a size of 320 × 320. All 1536 patches were augmented to 6144 patches by horizontal flip, vertical flip, and diagonal mirroring (Figure 4), and then divided into the training set, validation set, and test set with an approximate ratio of 3:1:1 (Table 3).

4. Experiment, Evaluation, and Analysis

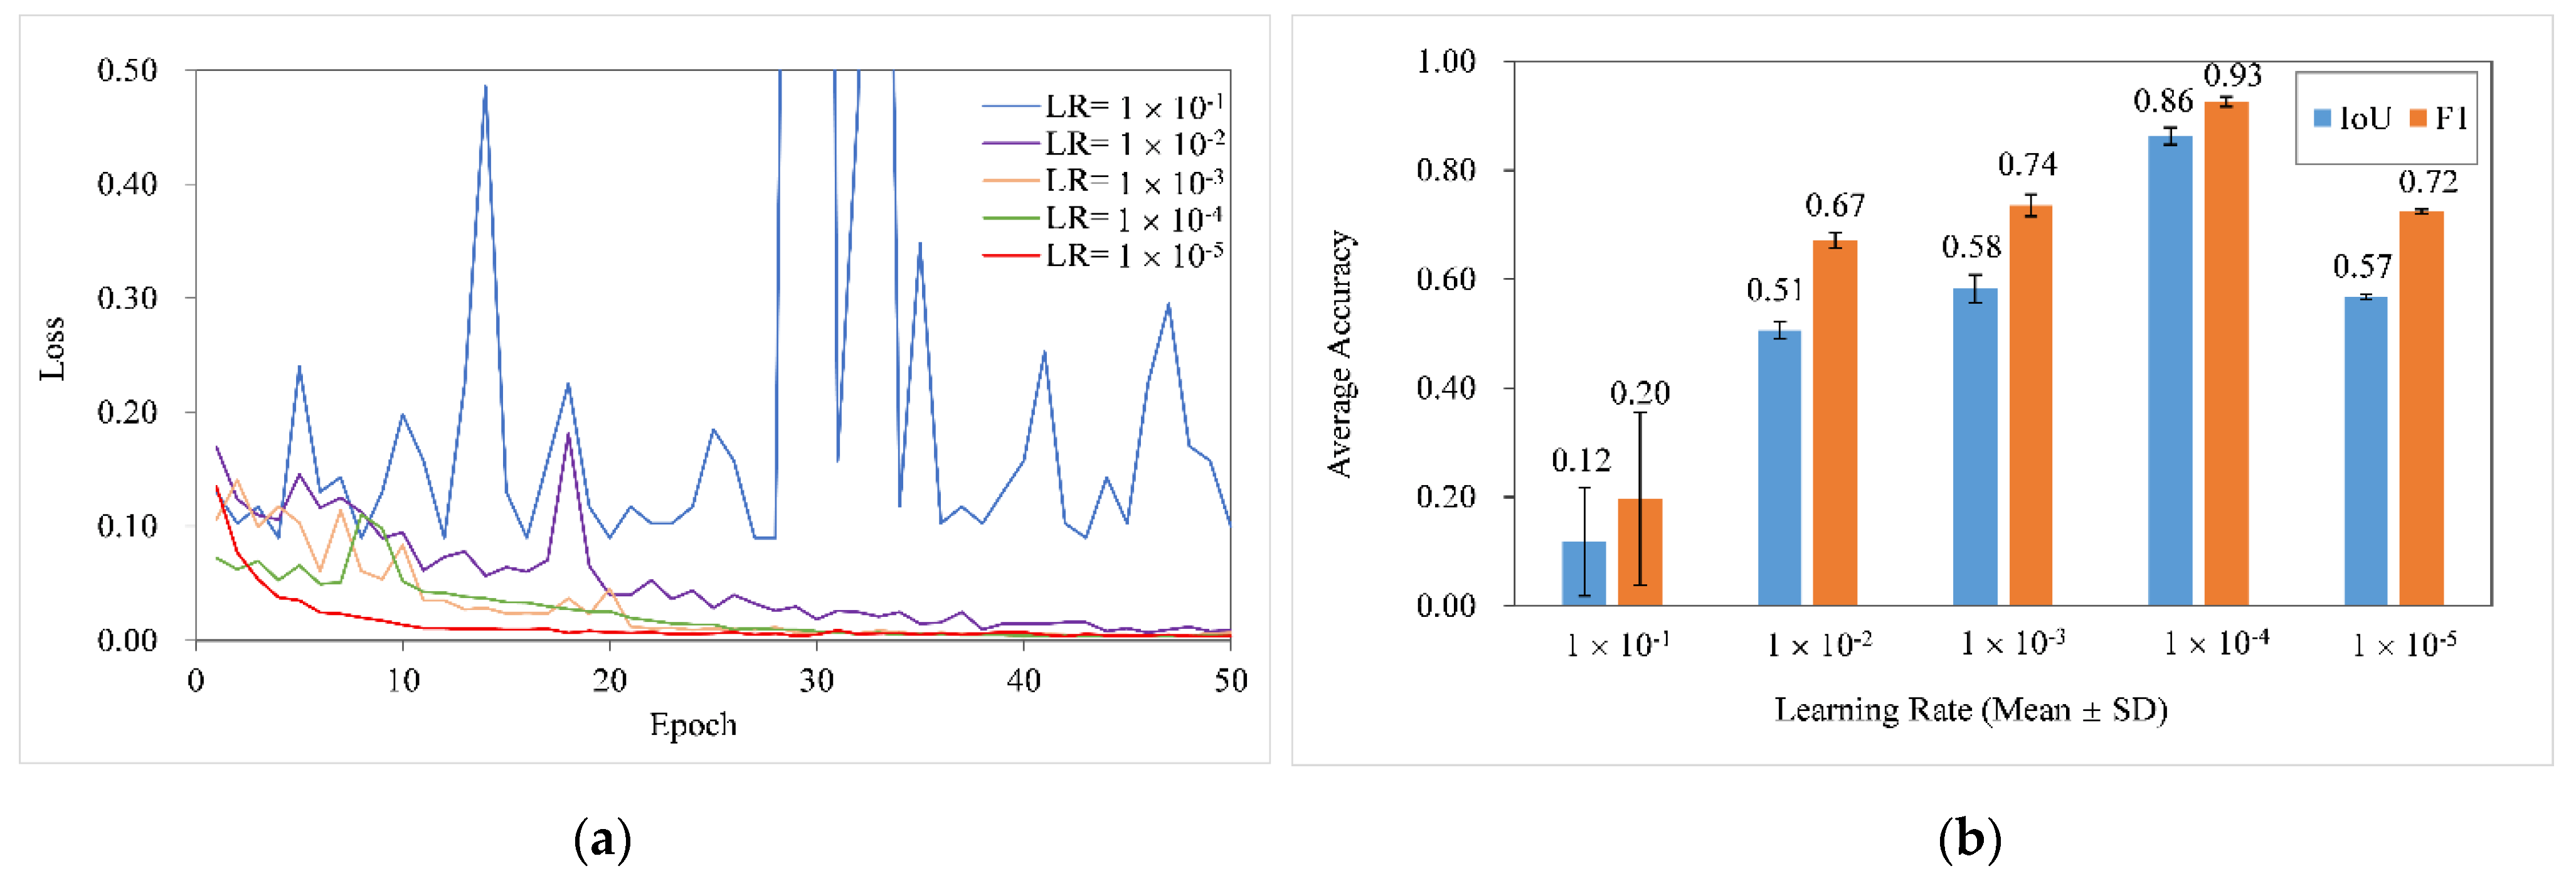
4.1. Initial Learning Rate Set

In training tasks, it is a common challenge to determine a proper learning rate at the beginning of the model training process [44]. If the initial learning rate is set too high, the objective function can fail to converge to a local minimum value and keep oscillating randomly around the local minimum value. Conversely, the objective function can fail to converge to the local minimum within the specified time when the initial learning rate is set too low. In this paper, the learning rate was initialized as 1 × 10⁻¹, 1 × 10⁻², 1 × 10⁻³, 1 × 10⁻⁴, and 1 × 10⁻⁵, respectively (Figure 5). The D-ResUnet model was five-fold trained to show the change of loss function of different learning rates. In addition, the average value and standard deviation of IoU and F1 are obtained under different learning rates in 50 epochs. Figure 5a indicates that the loss decreases steadily and finally stays at a small value when the learning rate is set to 1 × 10⁻⁴ (the green line) and 1 × 10⁻⁵ (the red line), respectively. Figure 5b clearly shows that the learning rate of 1 × 10⁻⁴ receives the highest accuracy and acceptable standard deviation in the FRA extraction task. In addition, subsequent experiments also demonstrated that other DL models used in this paper converged in 50 epochs using the learning rate of 1 × 10⁻⁴. Therefore, the initial learning rate was set to 1 × 10⁻⁴ in this paper.

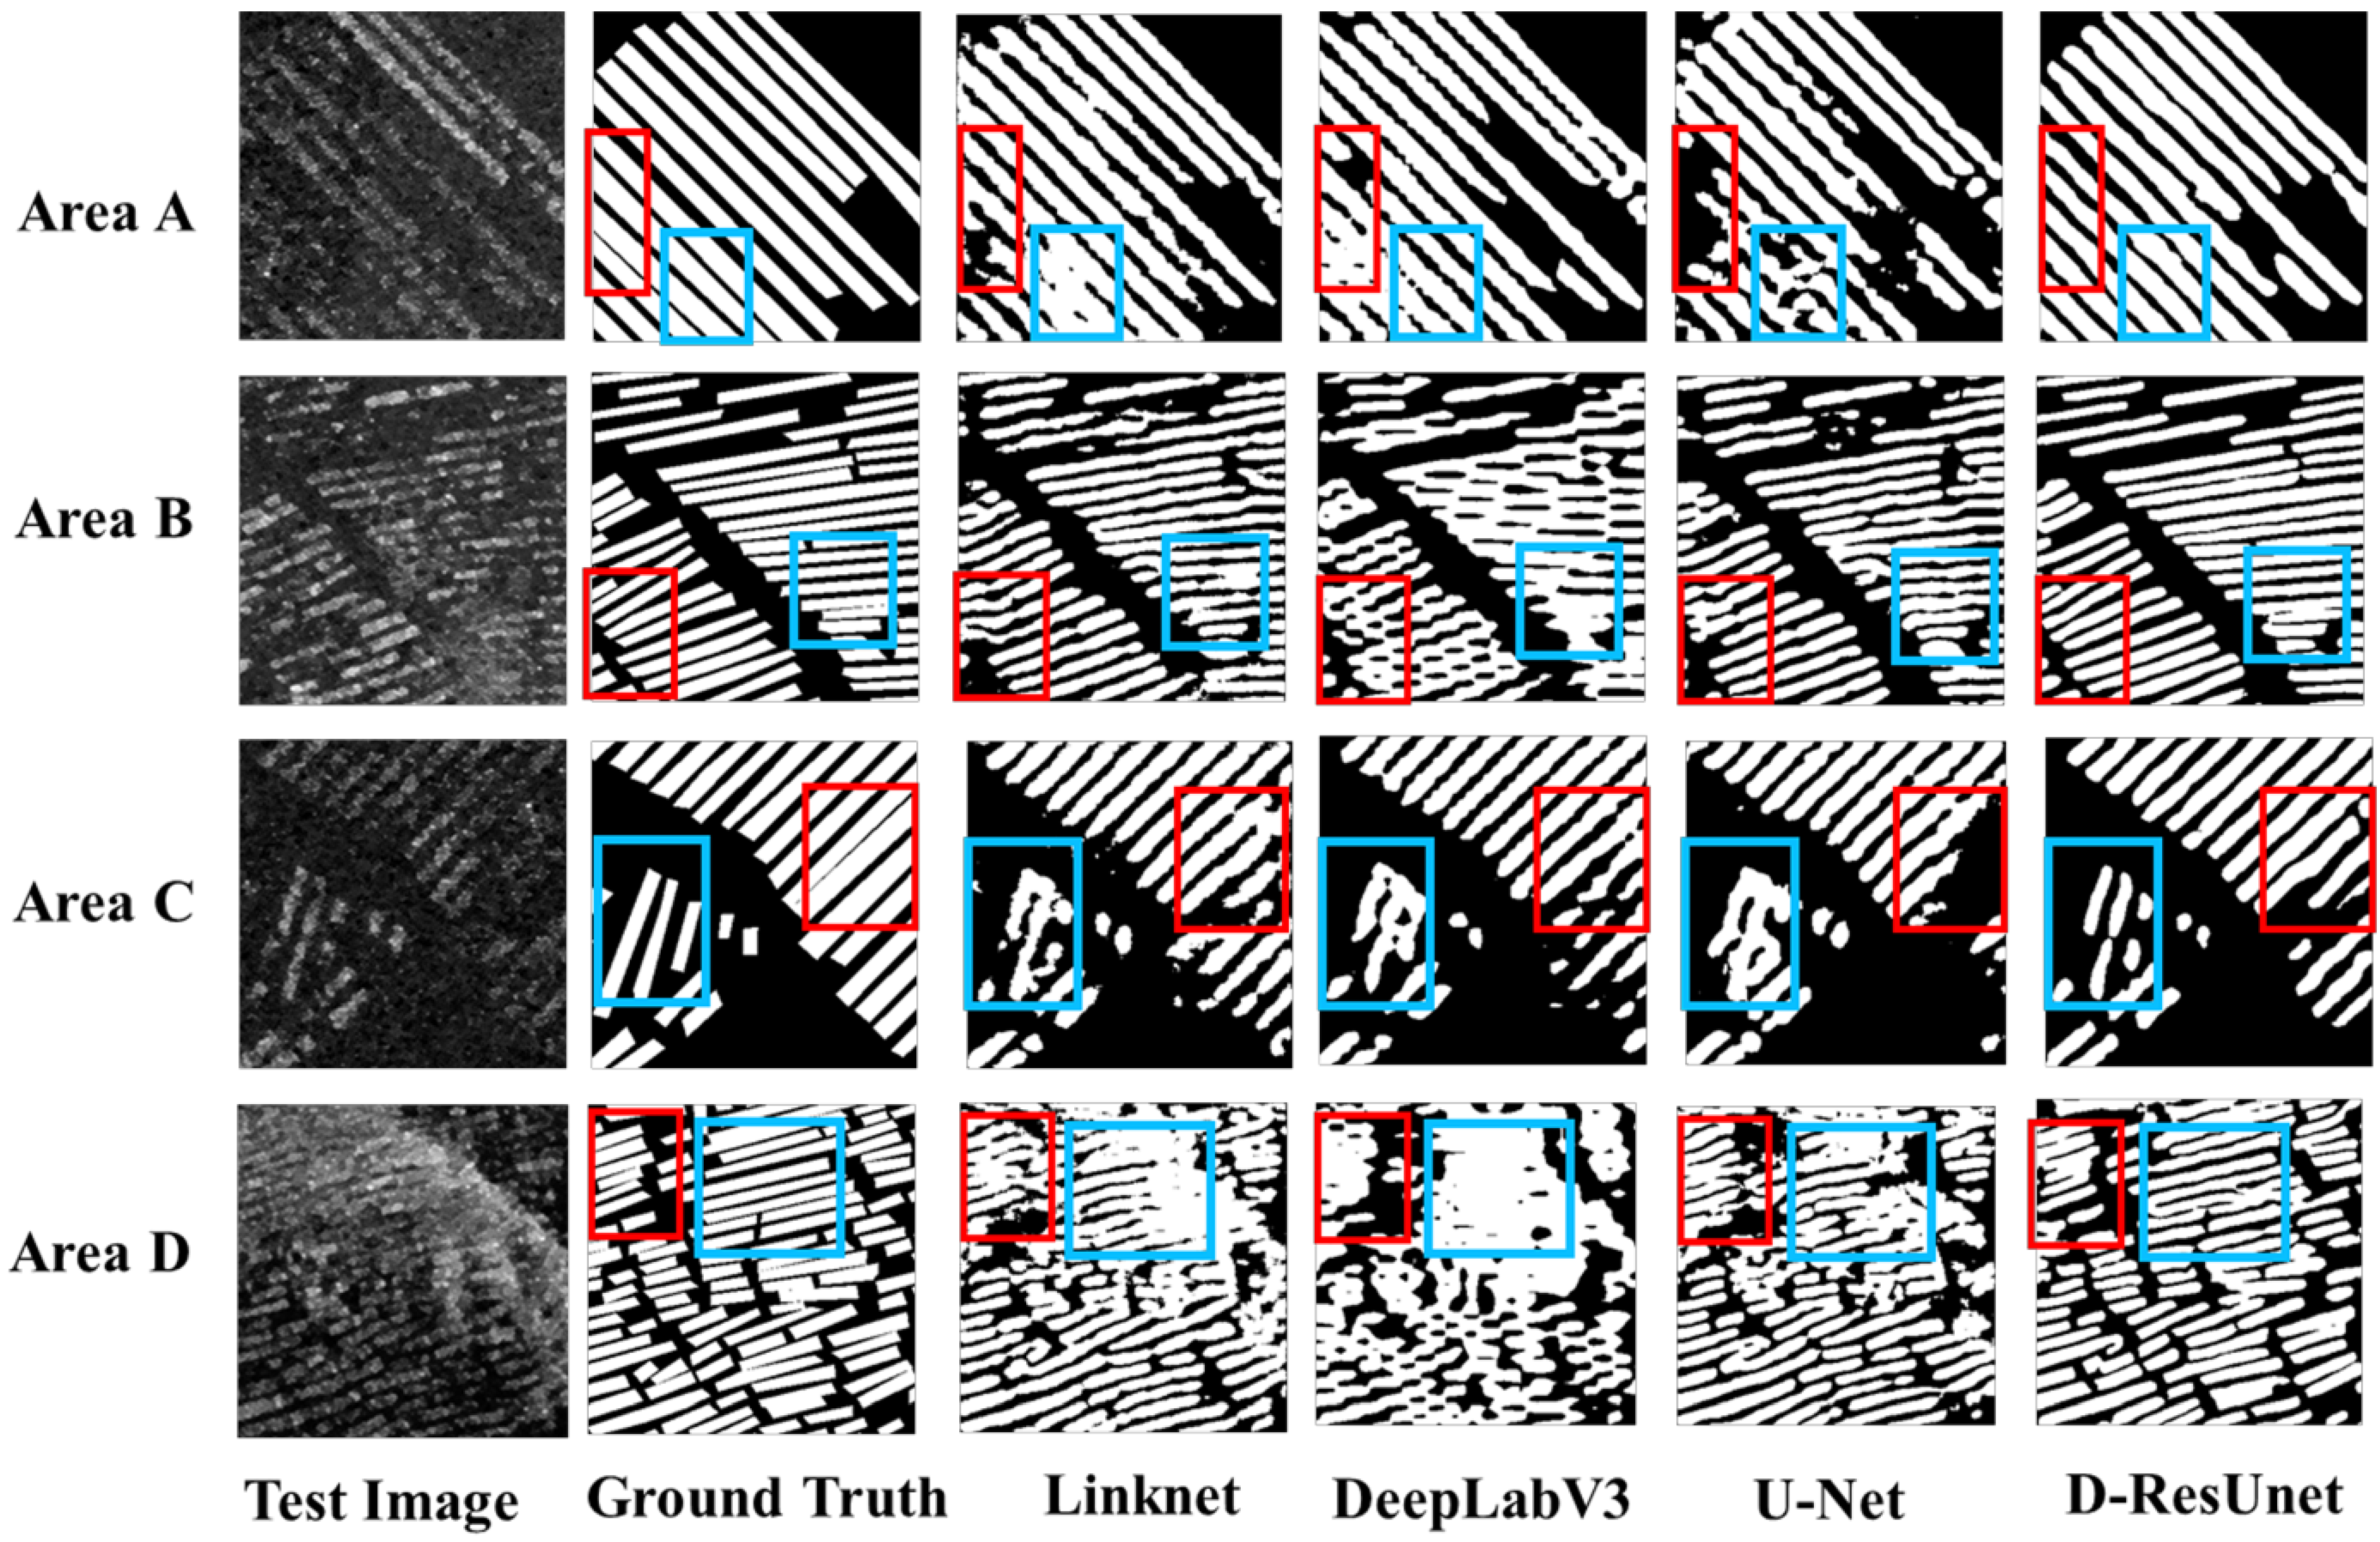
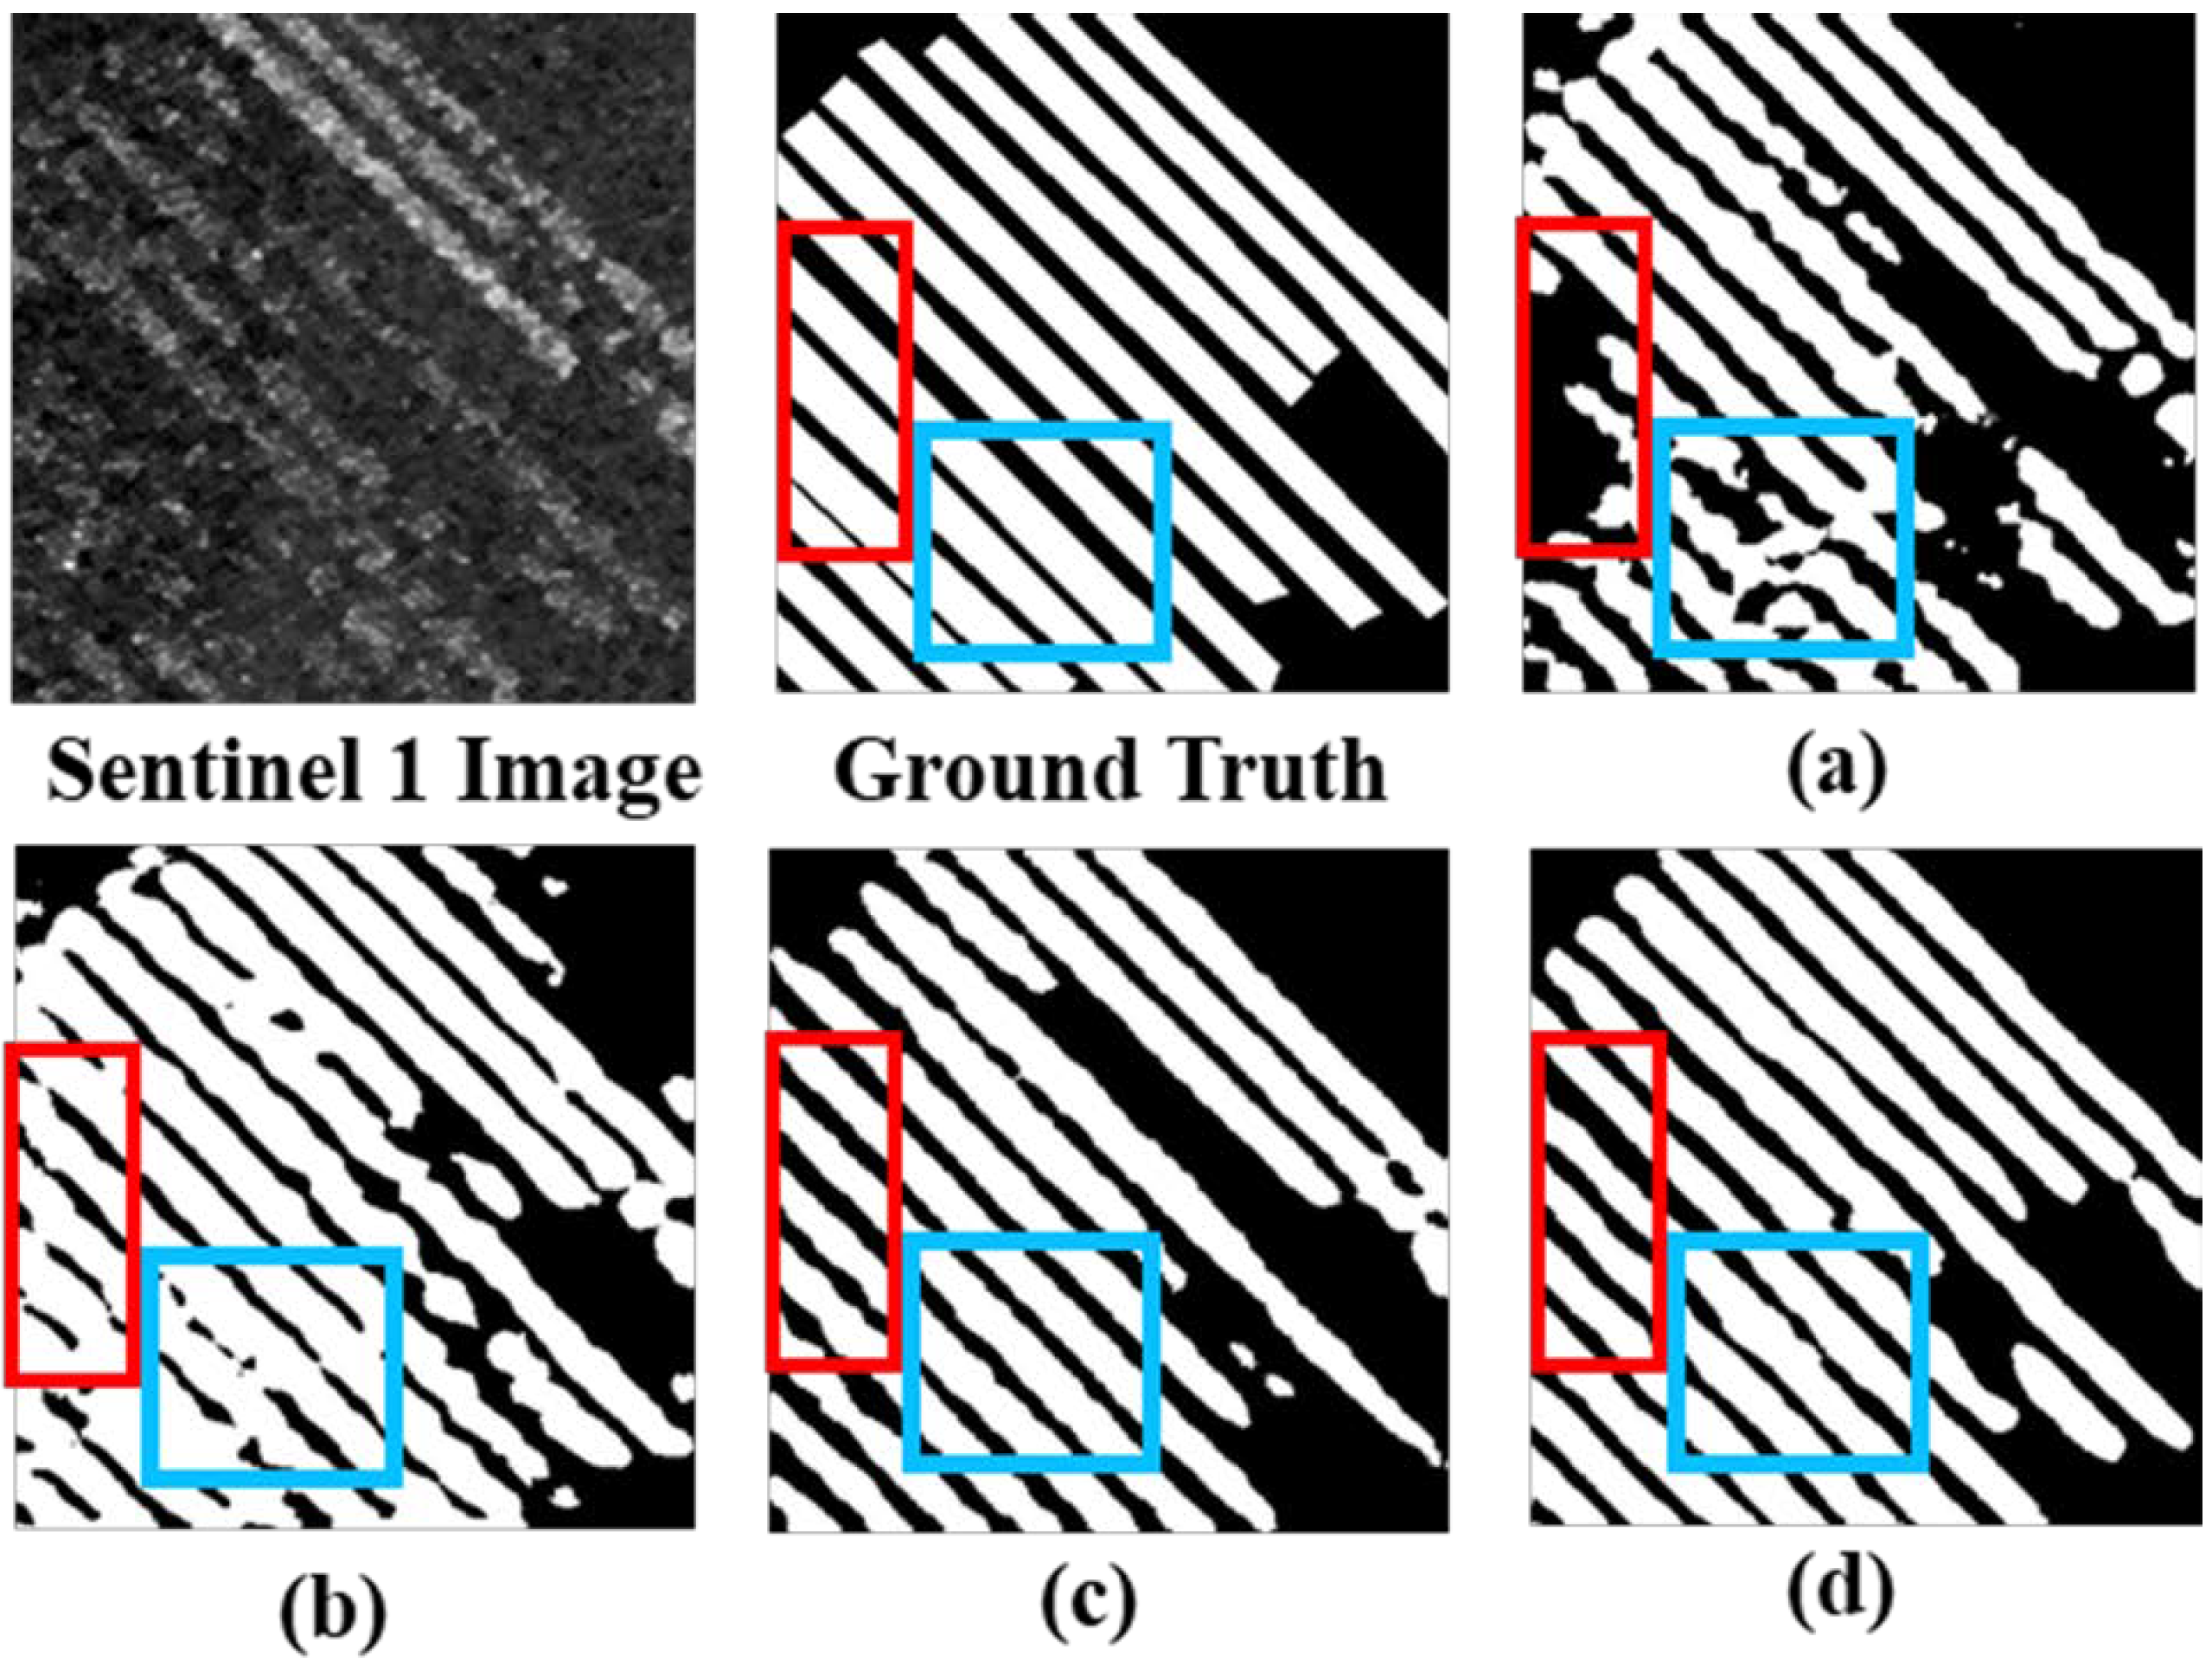
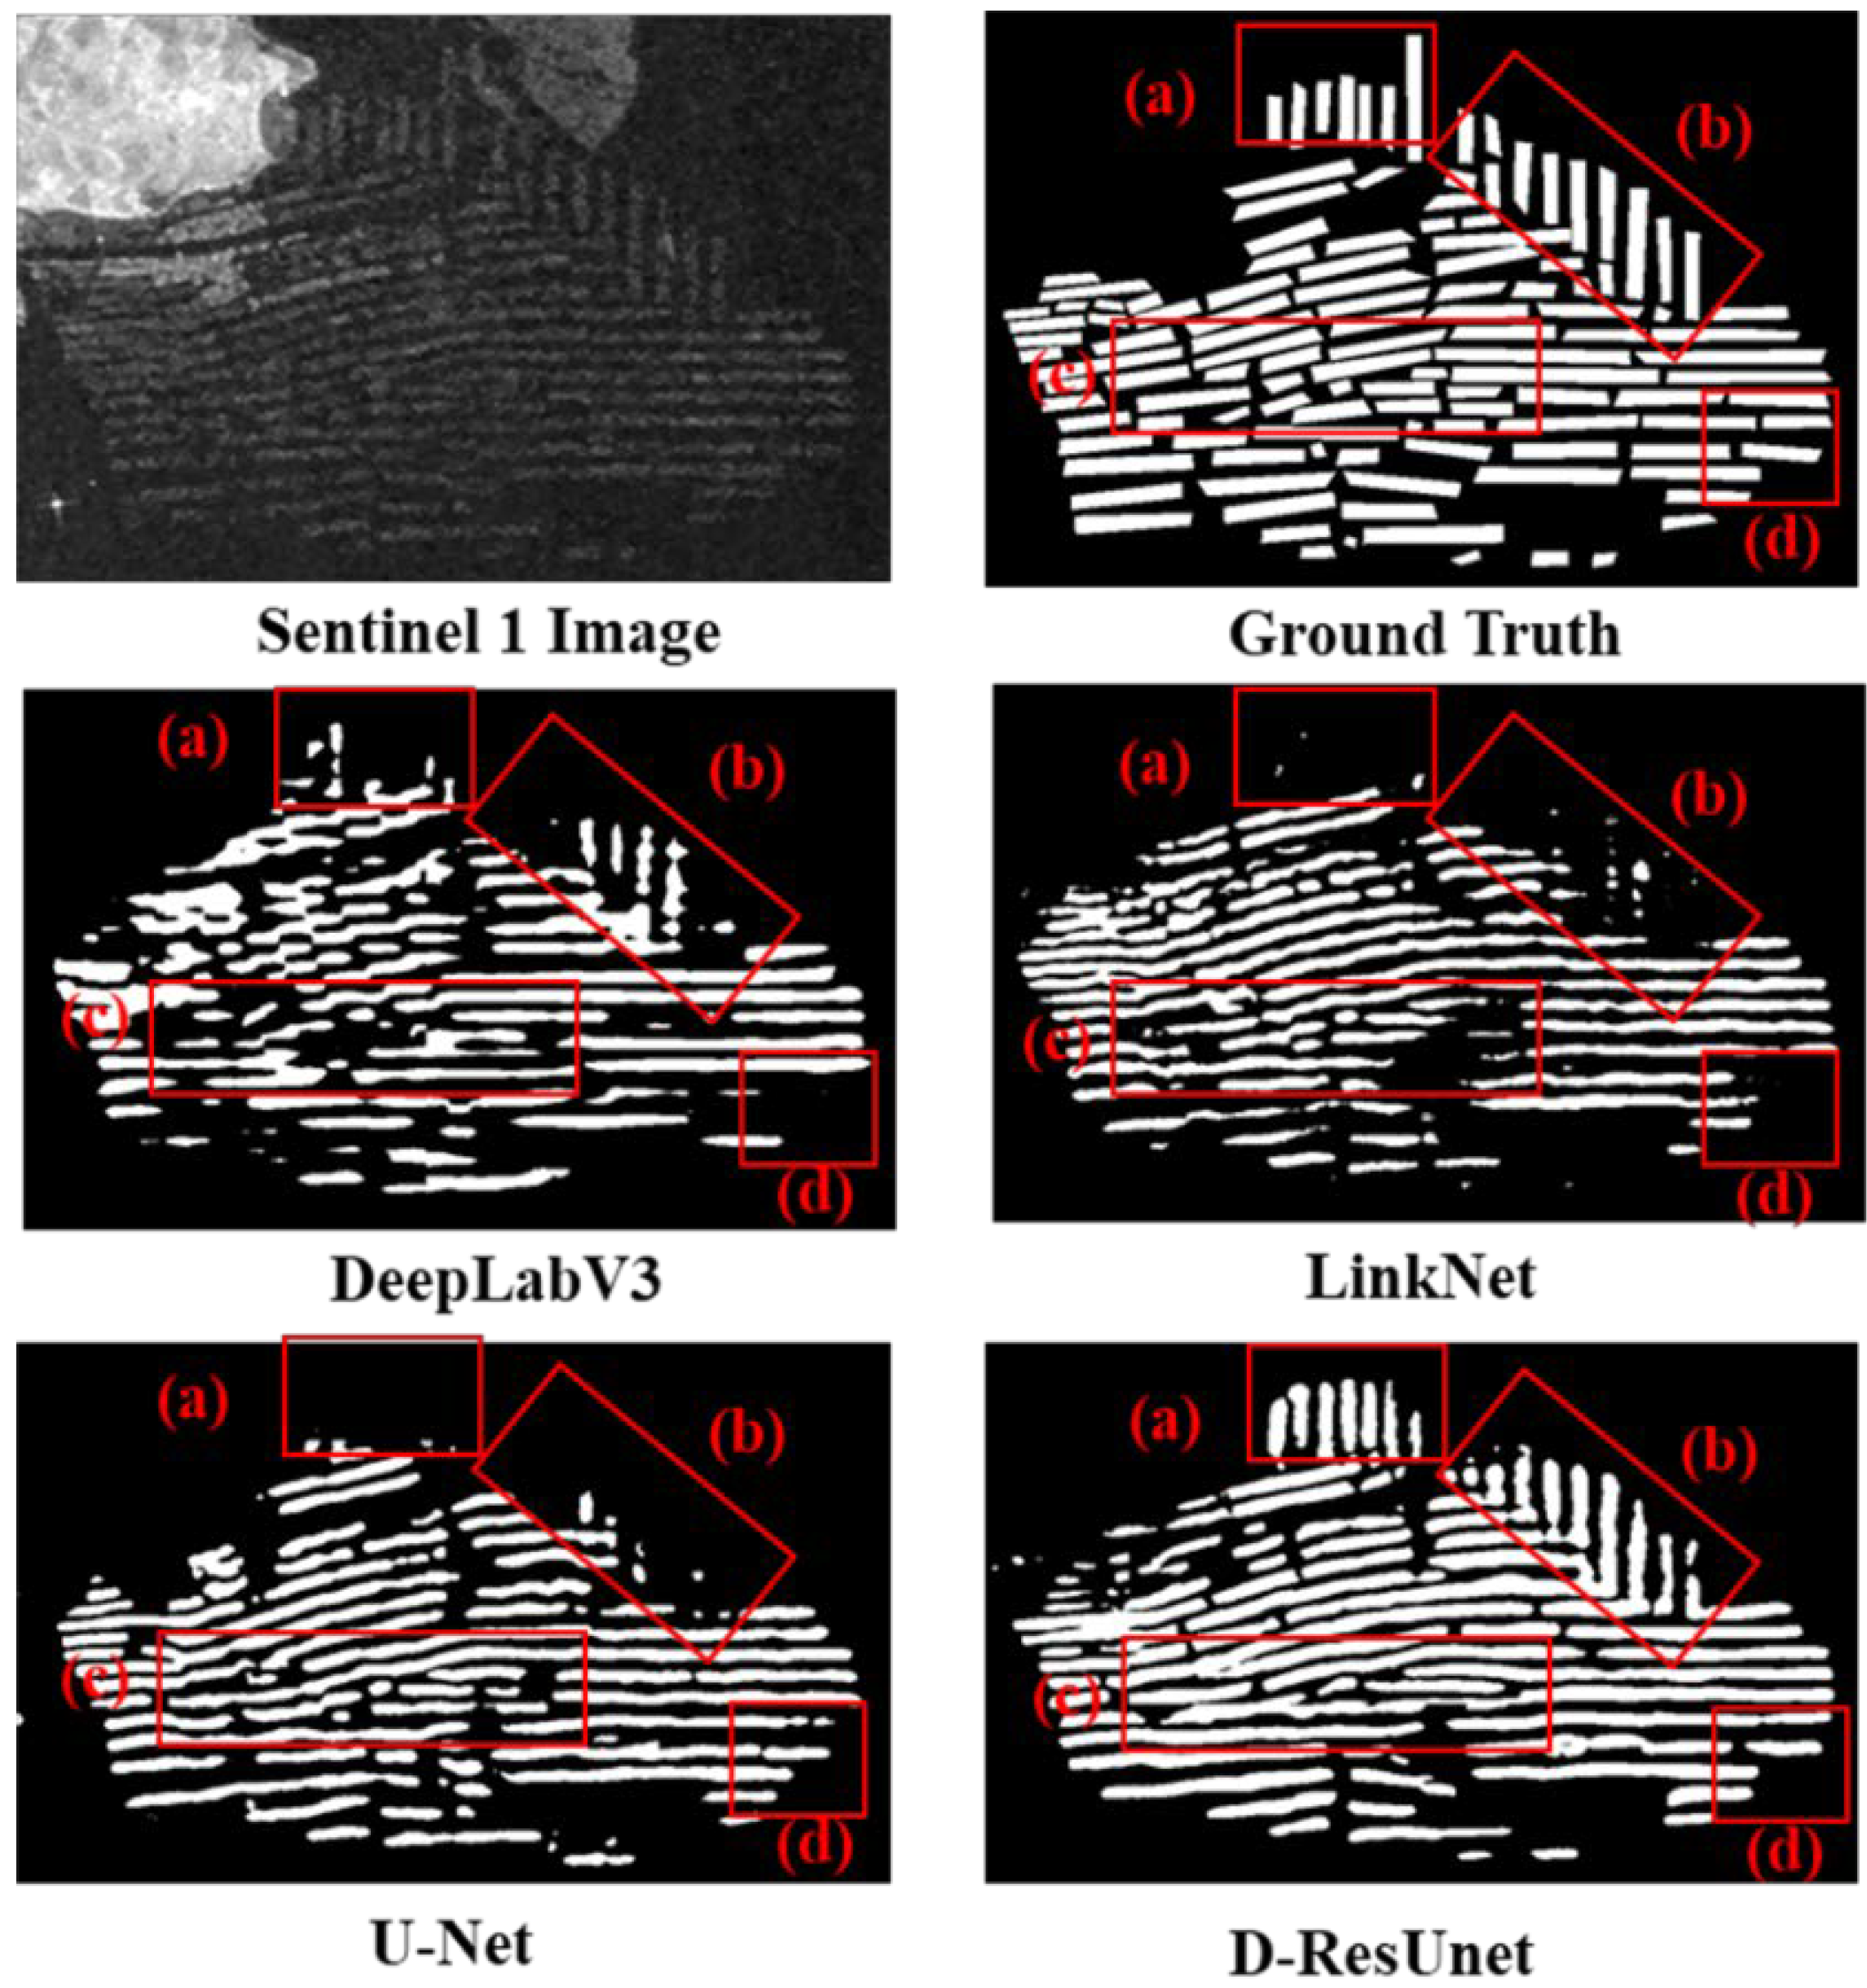
4.2. Experimental Results

Here, the experiments were conducted on the test datasets of the study area to assess the effectiveness of the D-ResUnet model. Previous state-of-the-art semantic segmentation models, including U-Net, LinkNet, and DeeplabV3, were chosen and implemented as a reference to assess the performance of the proposed model. All models were five-fold trained to obtain the average value, and Table 4 showed the mean and standard deviation of Precision, Recall, F1, and IoU.
The LinkNet model has a Precision of 78.81%, Recall of 74.23%, F1 of 76.44%, and IoU of 61.89%, which are lower than U-Net and DeepLabV3 in the corresponding metric. The U-Net model achieves a better Precision (80.75%) than DeepLabV3 but has a lower value (81.20%) in Recall. In terms of F1 and IoU, the U-Net model is slightly better with F1 of 80.97% and IoU of 68.04% than DeepLabV3. As for the standard deviation, the U-Net model has a lower standard deviation in four metrics than DeepLabV3 and LinkNet, which shows a less deviation between single experiment accuracy and the average accuracy. The D-ResUnet model is improved compared to the classical U-Net model, and its performance outperforms the U-Net model by improving the Precision by 12.14%, Recall by 11.12%, F1 by 11.63%, and IoU by 18.20%. A significant enhancement of the FRA extraction accuracy was achieved by the proposed D-ResUnet model in the study area. In addition, the D-ResUnet model reported a lower standard deviation for the Precision with a value of 1.06% (0.11 % lower than U-Net), a standard deviation value of 0.77% for Recall (0.71% lower than U-Net), a standard deviation value of 0.91% for F1 (0.37% lower than U-Net), and a value of 1.57% for IoU (0.25% lower than U-Net). Overall, the D-ResUnet has the best performance in all four metrics and a lower standard deviation in Recall, F1, and IoU compared to the three reference models, which indicates that it is the optimal one among the four DL models.
Figure 6 shows the extraction results of different DL methods in four randomly selected sub-areas of the study area, with black pixels representing the ocean background and white pixels representing the extracted FRA areas. Omissions and adhesions are common problems in binary semantic segmentation tasks. The red rectangle shows the FRA area, which can be easily missed, and the blue rectangle gives the area where the FRA extraction results are prone to adhesions. As seen from the resulting maps, the LinkNet has poor integrity in the red rectangles of Area A, B, C, and D. In addition, obvious adhesions occur in the blue rectangles of Area A and D. Furthermore, the extraction results of the LinkNet model has relatively inward shrinking edges in all test areas. The DeepLabV3 has more serious adhesions, especially for the blue rectangles in Area B and D. The narrower gaps between two neighboring floating rafts cannot be identified accurately on the resulting maps. In addition, the edges of the FRA areas partially overflow and show an irregular wavy shape. The U-Net model has obvious omissions in red rectangles of Area A and C, which shows the poor extraction capability for these FRA areas. Meanwhile, less adhesion exists in the U-Net extraction result compared to LinkNet and DeepLabV3. Compared with the above models, the proposed D-ResUnet model has better integrity and more accurate edges, where the gaps between two adjacent floating rafts can be identified and displayed clearly. As can be seen from the resulting maps, fewer omission and adhesion areas exist in the test area from A to D with the D-ResUnet model.

4.3. Ablation Experiment

In this paper, the pre-trained ResNet34 structure and dense residual units were used in the encoder and decoder respectively to improve the D-ResUnet performance. To quantify the effectiveness of the proposed improvement strategy, experiments based on original U-Net, ResNet34 encoder (denoted by ResNet34 + U-Net), dense residual decoder (denoted by ResNet34 + residual decoder + U-Net) and pre-training (denoted by pre-trained ResNet34 + residual decoder + U-Net) were conducted on test images.
Table 5 shows the detailed accuracy value of Precision, Recall, F1, and IoU under the different combinations of improvement strategies. As a baseline model, the original U-Net gives the reference values of Precision, Recall, F1, and IoU (strategy 1). When ResNet34 was adopted as the encoder (strategy 2), the Recall improved by 4.13%, but Precision decreased by 13.84%. This implies an increase in model extraction capability but a decrease in extraction accuracy, i.e., for uncertain areas, the model prefers to consider them as FRA areas. When dense residual units are added to the decoder (strategy 3), almost all metrics have an obvious improvement with the Precision of 84.95%, the Recall of 85.24%, F1 of 85.09%, and IoU of 74.05%. Compared to U-Net with only the ResNet34 encoder (strategy 2), the Precision improves by 18.04% and Recall is essentially the same, which results in a final improvement of F1 by 10.09%. Meanwhile, the IoU is improved by 14.05% and it shows superior performance in the FRA extraction task. When both pre-trained ResNet34 and dense residual decoder are added to the U-Net model (strategy 4), Precision, Recall, F1, and IoU are improved by 7.94% to 12.19% compared with the model without pre-training. It can be seen that the pre-training strategy is critical for the excellent performance of the proposed D-ResUnet model.
Taking a closer look at test area A, Figure 7 presents the resulting maps of the FRA areas under different improvement strategies. As can be seen in Figure 7a, the original U-Net has serious omission areas but acceptable adhesions. This indicates that the U-Net model is weak in extraction capability. For uncertain pixels, the U-Net model prefers to consider it as the ocean background. When only the ResNet34 encoder was used, the extraction capability was improved, but extraction accuracy was decreased. As displayed on the resulting map (Figure 7b), the missed FRA areas in the red rectangle of Figure 7a were re-identified; however, adhesions also increased, leading to a decrease in F1 at the same time. When dense residual units were added to the decoder, as shown in Figure 7c, the missed FRA in Figure 7a was re-identified, and adhesions in Figure 7b were also reduced at the same time. This demonstrated that the model encoder has a stronger capability for extracting the object, while the decoder can achieve better RS image recovery using different-level information. When pre-trained ResNet34 and dense residual decoder are both used (Figure 7d), there are no obvious omissions or adhesions, showing the best integrity and accuracy of the extraction results.

4.4. Application Experiment

To validate the applicability and portability of the proposed model, application experiments were conducted in a different place in Penglai county, Shandong province, China. In Figure 8, the red rectangles labeled from (a) to (d) are the FRA areas that are easily missed in extraction results. As seen from the results, DeepLabV3 and LinkNet have serious omissions in all red rectangles compared to the ground truth map. In addition, DeepLabV3 has worse integrity and shows a fragmented extraction result. The U-Net model shows omissions in red rectangles (a) and (b), but better integrity in rectangles (c) and (d). Compared to the above models, the proposed D-ResUnet model has better integrity of extraction results in all red rectangles, showing the best performance in the application experiment. Meanwhile, the resulting maps show that the narrower end of adjacent floating rafts is prone to stick together.
In Table 6, the F1 of D-ResUnet is about 5% (compared to U-Net) to 10% (compared to DeepLabV3) higher than the three reference models, and the IoU of D-ResUnet is 6% (compared to U-Net) to 12% (compared to DeepLabV3) higher than other models.

5. Discussion

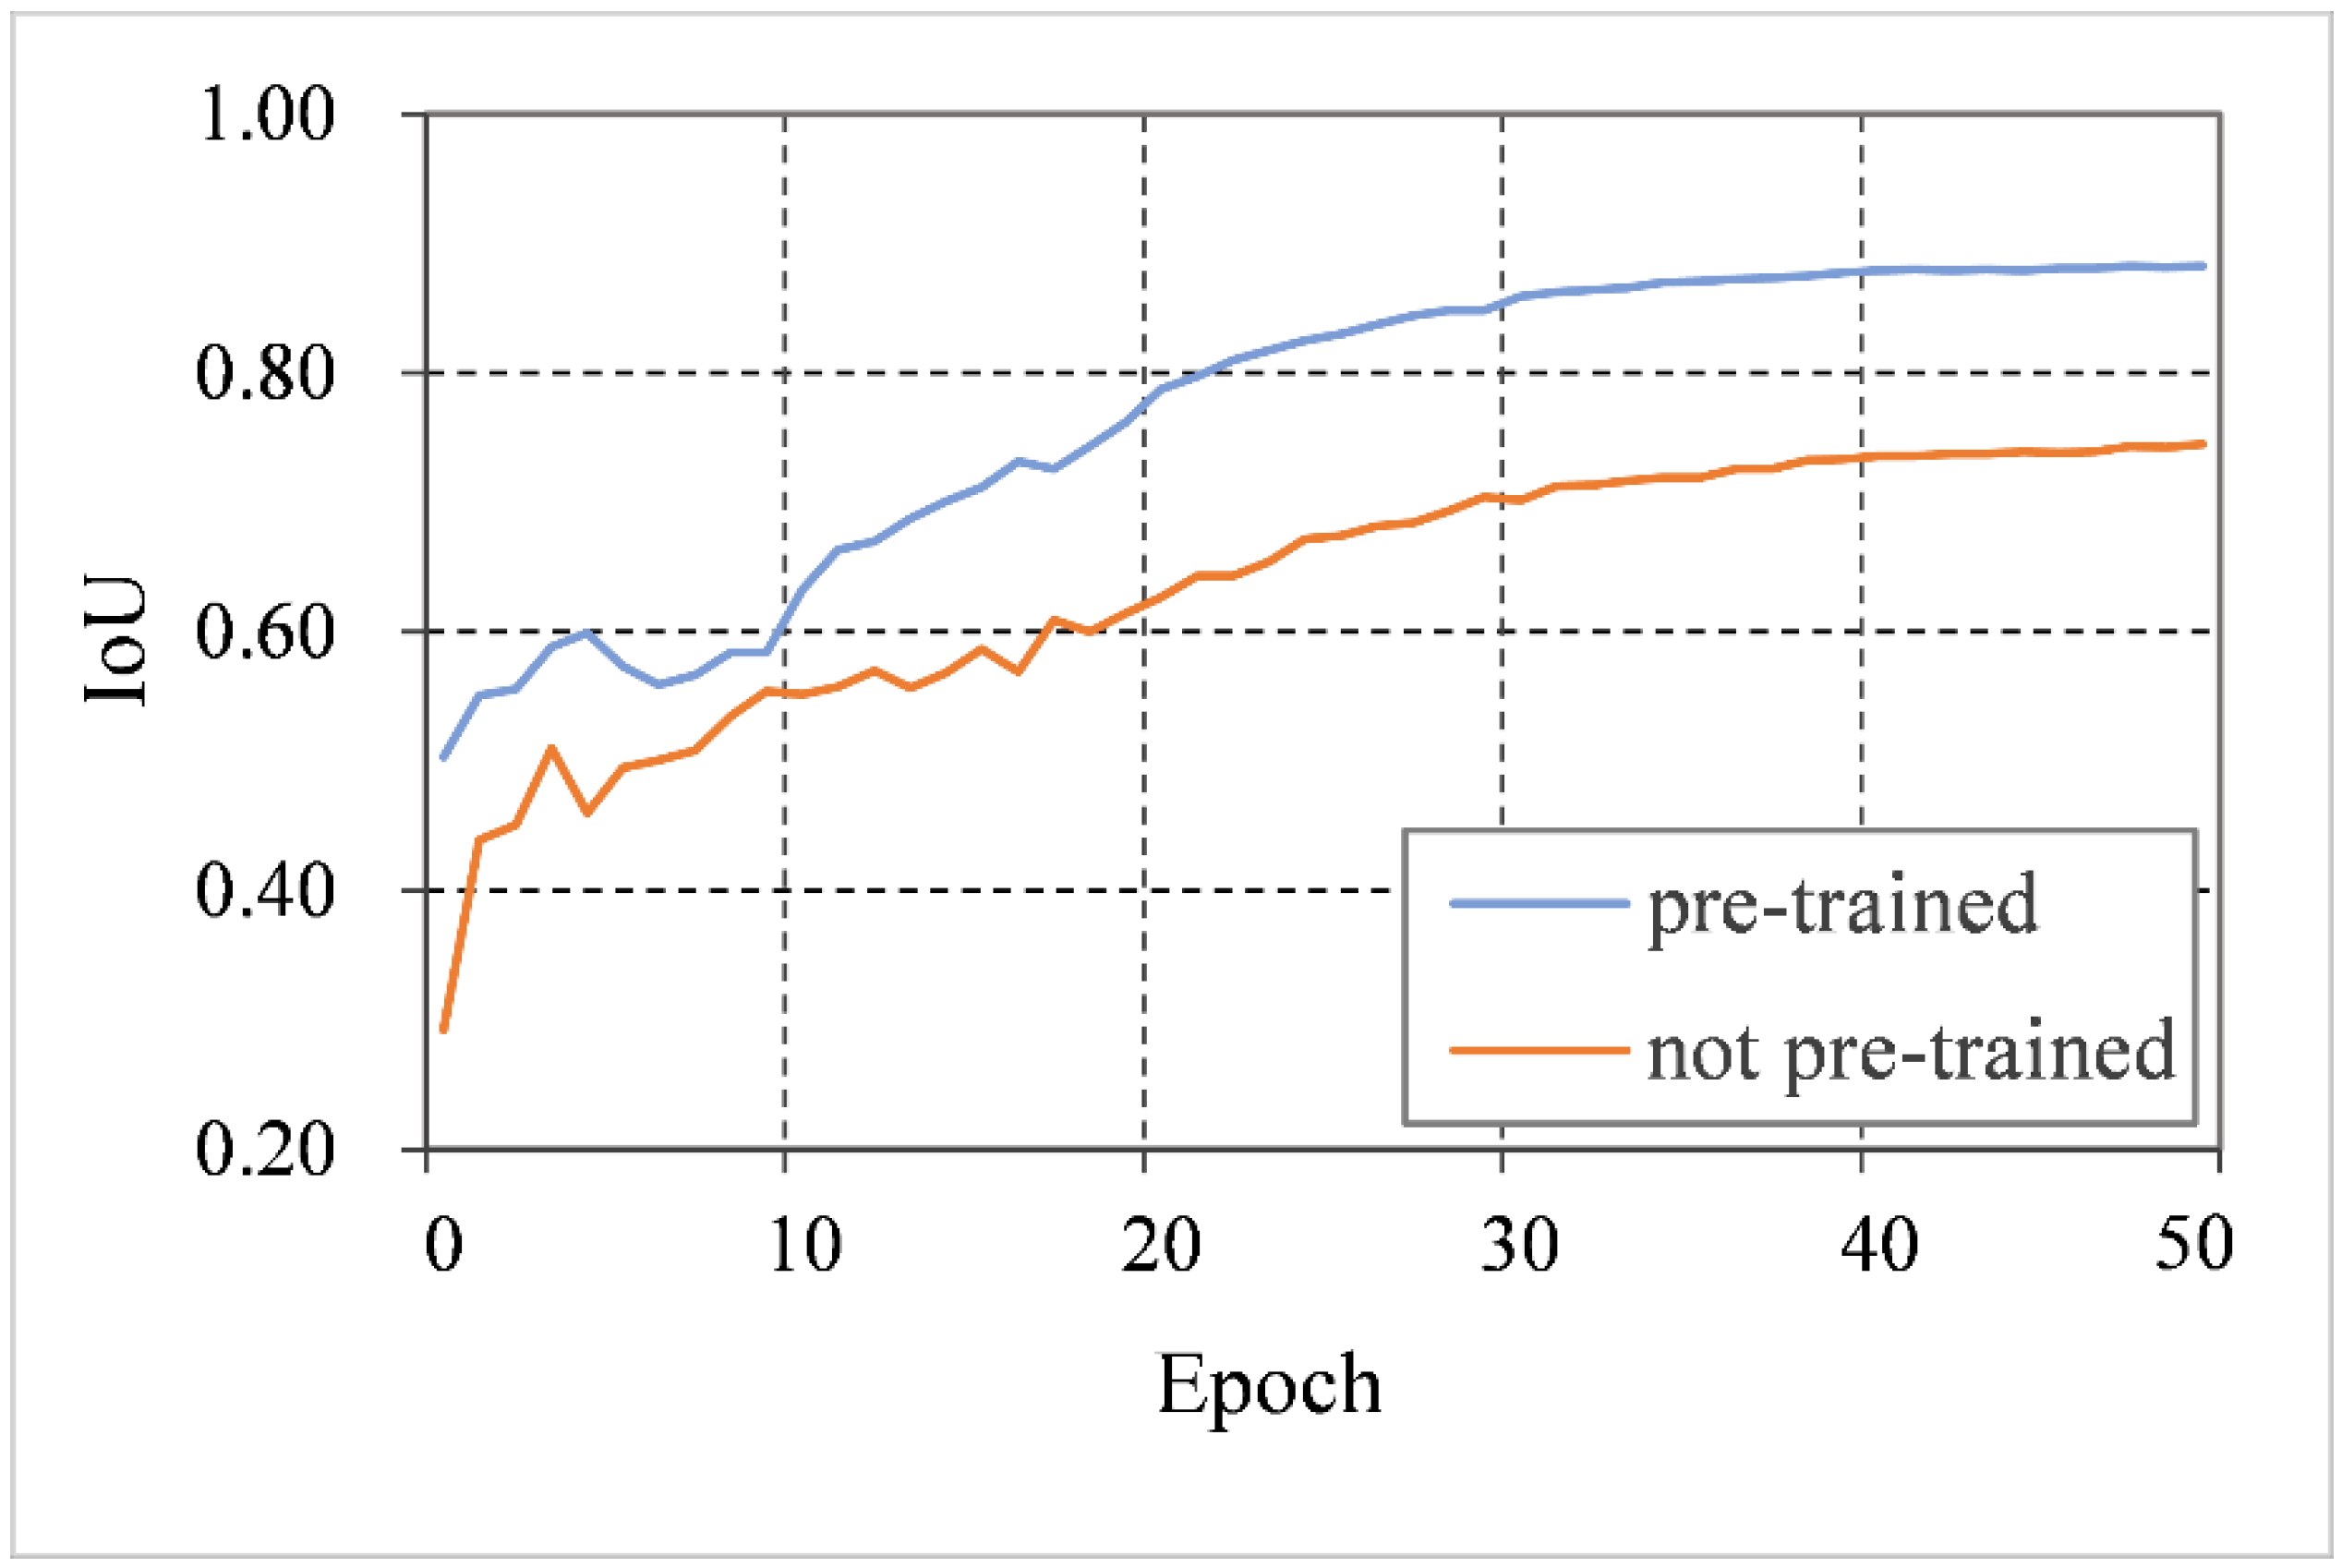
5.1. Influence of Pre-Training Strategy

Typically, deep learning models are trained from scratch starting with randomly initialized weights; however, it is very hard when researchers do not have thousands or even millions of training images to overcome the over-fitting issue [37,43,47,48]. Therefore, existing image datasets such as ImageNet are always used to initialize the network weights in a customized task [42,49]. Here, the IoU of D-ResUnet with and without a pre-trained model in 50 epochs is obtained to further illustrate the role of pre-training and fine-tuning (Figure 9). As seen from the results, the IoU of the pre-trained model is consistently higher than the other one, and it also grows faster and fluctuates less in the first 20 epochs, which indicates that the pre-trained one is more likely to converge. Therefore, the obvious improvement of the accuracy in the comparison reveals that the pre-training is valuable and effective in the FRA extraction task.
Although pre-training has been proved to be important for the target task, the current strategy of pre-training and fine-tuning applies the learning procedure of the original dataset only in several non-pre-trained layers or even the last layer of the target network. In other words, fewer learning processes based on the original RS images may lead to higher uncertainty in determining the accurate model parameters. Here, the mean and standard deviation of Precision, Recall, F1, and IoU of pre-trained D-ResUnet and the non-pre-trained one are listed in Table 7. Though pre-trained D-ResUnet improved the accuracy in all four metrics compared to the other one, a worse standard deviation in Precision (denoted by 0.45% increase), F1 (denoted by 0.45% increase), and IoU (denoted by 0.87% increase) were presented. This enlightens stakeholders that pre-training and fine-tuning the model only once may lead to significant uncertainty in extraction results; thus, training multiple times to ensure the model capability as much as possible is necessary.

5.2. Model Complexity

In addition to model accuracy, model complexity is another important indicator for evaluating model performance. Here, the numbers of parameters and floating-point operations (FLOPs) were used to evaluate the algorithm complexity [36]. In Table 8, the lightweight LinkNet model has advantages in terms of parameters and FLOPs, indicating that it is more suitable for tasks that need a fast response. Compared to the DeepLabV3 and U-Net models, the proposed D-ResUnet model exhibited a decrease of 4.5% and 20% in parameters, and 49.50% and 74.84% in FLOPs, respectively. This shows its advantages in calculation complexity because less physical memory and prediction time are needed when the D-ResUnet model is employed in specific tasks.

5.3. Error Analysis

Though the proposed D-ResUnet model produces more satisfactory results than the other three state-of-the-art models, some issues also exist. For example, the edges of the FRA areas are easily misidentified as seawater, and the narrower gaps between two neighboring floating rafts cannot be identified accurately. These issues can largely be attributed to the dynamic ocean environment. Specifically, floating rafts will mix with the seawater and become unobvious on SAR images when the wind speed increases and high waves appear, thus resulting in low extraction accuracy of the models. Minimization of the mis-detection of edges in the FRA semantic segmentation task can be achieved by the following approaches: (1) Using a more appropriate loss function to optimize the model’s learning strategy and refine the FRA boundary [36,50]. (2) Developing an additional FAR contour correction model to optimize the extraction results and reduce the edge errors [34].
In addition, the high-quality sample dataset plays a critical role in model training of the semantic segmentation tasks [26,43,48]. Although the significant superiority and applicability of the proposed D-ResUnet model have been proved in various experiments, model accuracy in application experiments (Section 4.4) decreased to varying degrees compared to its performance in the test experiments (Section 4.2). A few possible reasons are as follows: (1) FRA areas in different regions have different physical structures and show different characteristics on SAR images. The current training dataset is not abundant enough to encompass all types of FRA structures. In other words, the sample dataset prepared in Changhai county does not consist of the floating raft types and their structural features in Penglai country, thus showing decreased applicability for extracting FRA areas of Penglai country. (2) Similar FRA areas have large differences in grayscale values when serious speckle noise exists randomly on SAR images at different times, thus causing inevitable errors when DL models are used to extract the target objects by analyzing the pixel matrix values of SAR images. In this context, more samples of FRA areas need to be added to the training dataset in future work, and more effective image processing algorithms should be adopted to further reduce the speckle noise.

6. Conclusions

In this paper, we proposed the D-ResUnet model for extracting the floating raft aquaculture areas from Sentinel-1 SAR images. The proposed model has innovations such as using the pre-trained ResNet34 network in the encoder to achieve a stronger extraction capability for abstract features and adding dense residual units in the decoder to recover fine-grained details more efficiently. In addition, the strategy of pre-training on the ImageNet dataset was used to further improve the segmentation accuracy. The ablation experiments and application experiments proved the effectiveness of the improvement strategy and the application value of the proposed model. Compared with three state-of-the-art semantic segmentation models, the proposed model achieved the best performance in the task of floating raft aquaculture extraction and provides a promising approach for stakeholders. In future work, multiple types of skip connection structures and residual units will be employed to further improve the extraction accuracy of the model. In addition, more sample datasets and effective pre-processing methods for SAR images will be added to improve the portability of the proposed models.

Author Contributions

L.G. proposed the methodology, conducted the data analysis, and wrote the manuscript; C.W., K.L., S.C., G.D. and H.S. developed the methodology and revised the manuscript. All authors have read and agreed to the published version of the manuscript.

Funding

This research was supported jointly by the National Key Research and Development Program of China (2021YFC3201102), and by the National Natural Science Foundation of China (41971315 and U2003105), and by Big data on Earth in Support of Ocean Sustainable Development Goals Research (XDA19090123).

Acknowledgments

Great thanks to the anonymous reviewers whose comments and suggestions significantly improved the manuscript.

Conflicts of Interest

The authors declare no conflict of interest.

References

  1. FAO. The State of World Fisheries and Aquaculture 2020; FAO: Rome, Italy, 2020. [Google Scholar]
  2. Pan, X.; Jiang, T.; Zhang, Z.; Sui, B.; Liu, C.; Zhang, L. A New Method for Extracting Laver Culture Carriers Based on Inaccurate Supervised Classification with FCN-CRF. J. Mar. Sci. Eng. 2020, 8, 274. [Google Scholar] [CrossRef]
  3. Liu, Y.; Yang, X.; Wang, Z.; Lu, C.; Li, Z.; Yang, F. Aquaculture area extraction and vulnerability assessment in Sanduao based on richer convolutional features network model. J. Oceanol. Limnol. 2019, 37, 1941–1954. [Google Scholar] [CrossRef]
  4. Cui, B.-G.; Zhong, Y.; Fei, D.; Zhang, Y.-H.; Liu, R.-J.; Chu, J.-L.; Zhao, J.-H. Floating Raft Aquaculture Area Automatic Extraction Based on Fully Convolutional Network. J. Coast. Res. 2019, 90, 86–94. [Google Scholar] [CrossRef]
  5. Cui, B.; Fei, D.; Shao, G.; Lu, Y.; Chu, J. Extracting Raft Aquaculture Areas from Remote Sensing Images via an Improved U-Net with a PSE Structure. Remote Sens. 2019, 11, 2053. [Google Scholar] [CrossRef] [Green Version]
  6. Zhang, X.; Ma, S.; Su, C.; Shang, Y.; Wang, T.; Yin, J. Coastal Oyster Aquaculture Area Extraction and Nutrient Loading Estimation Using a GF-2 Satellite Image. IEEE J. Sel. Top. Appl. Earth Obs. Remote Sens. 2020, 13, 4934–4946. [Google Scholar] [CrossRef]
  7. Liu, Y.; Wang, Z.; Yang, X.; Zhang, Y.; Yang, F.; Liu, B.; Cai, P. Satellite-based monitoring and statistics for raft and cage aquaculture in China’s offshore waters. Int. J. Appl. Earth Obs. Geoinf. 2020, 91, 102118. [Google Scholar] [CrossRef]
  8. Naylor, R.; Troell, M.; Little, D.; Hardy, R.; Bush, S.; Shumway, S.; Lubchenco, J.; Cao, L.; Klinger, D.; Buschmann, A. A 20-Year Retrospective Review of Global Aquaculture. Nature 2021, 591, 551. [Google Scholar] [CrossRef]
  9. Palmer, S.; Gernez, P.; Thomas, Y.; Simis, S.; Miller, P.; Glize, P.; Laurent, B. Remote Sensing-Driven Pacific Oyster (Crassostrea gigas) Growth Modeling to Inform Offshore Aquaculture Site Selection. Front. Mar. Sci. 2020, 6, 802. [Google Scholar] [CrossRef]
  10. Snyder, J.; Boss, E.; Weatherbee, R.; Thomas, A.; Brady, D.; Newell, C. Oyster Aquaculture Site Selection Using Landsat 8-Derived Sea Surface Temperature, Turbidity, and Chlorophyll a. Front. Mar. Sci. 2017, 1, 190. [Google Scholar] [CrossRef] [Green Version]
  11. Liu, K.; Chen, S.; Li, X.; Chen, S. Development of a 250-m Downscaled Land Surface Temperature Data Set and Its Application to Improving Remotely Sensed Evapotranspiration Over Large Landscapes in Northern China. IEEE Trans. Geosci. Remote Sens. 2020, 60, 5000112. [Google Scholar] [CrossRef]
  12. Liu, K.; Chen, S.; Li, X. Comparative Assessment of Two Vegetation Fractional Cover Estimating Methods and Their Impacts on Modeling Urban Latent Heat Flux Using Landsat Imagery. Remote Sens. 2017, 9, 455. [Google Scholar] [CrossRef] [Green Version]
  13. Li, X.; Wu, T.; Liu, K.; Li, Y.; Zhang, L. Evaluation of the Chinese Fine Spatial Resolution Hyperspectral Satellite TianGong-1 in Urban Land-Cover Classification. Remote Sens. 2016, 8, 438. [Google Scholar] [CrossRef] [Green Version]
  14. Jayanthi, M. Monitoring brackishwater aquaculture development using multi-spectral satellite data and GIS-a case study near Pichavaram mangroves south-east coast of India. Indian J. Fish. 2018, 58, 85–90. [Google Scholar]
  15. Zhu, H.; Li, K.; Wang, L.; Chu, J.; Gao, N.; Chen, Y. Spectral Characteristic Analysis and Remote Sensing Classification of Coastal Aquaculture Areas Based on GF-1 Data. J. Coast. Res. 2019, 90, 49–57. [Google Scholar] [CrossRef]
  16. Geng, J.; Fan, J.; Wang, H. Weighted Fusion-Based Representation Classifiers for Marine Floating Raft Detection of SAR Images. IEEE Geosci. Remote Sens. Lett. 2017, 14, 444–448. [Google Scholar] [CrossRef]
  17. Fan, J.; Chu, J.; Geng, J.; Zhang, F. Floating raft aquaculture information automatic extraction based on high resolution SAR images. In Proceedings of the 2015 IEEE International Geoscience and Remote Sensing Symposium (IGARSS), Milan, Italy, 26–31 July 2015; pp. 3898–3901. [Google Scholar] [CrossRef]
  18. Cheng, B.; Liang, C.; Liu, X.; Liu, Y.; Ma, X.; Wang, G. Research on a novel extraction method using Deep Learning based on GF-2 images for aquaculture areas. Int. J. Remote Sens. 2020, 41, 3575–3591. [Google Scholar] [CrossRef]
  19. Shen, X.; Wang, D.; Mao, K.; Anagnostou, E.; Hong, Y. Inundation Extent Mapping by Synthetic Aperture Radar: A Review. Remote Sens. 2019, 11, 879. [Google Scholar] [CrossRef] [Green Version]
  20. Shelhamer, E.; Long, J.; Darrell, T. Fully Convolutional Networks for Semantic Segmentation. IEEE Trans. Pattern Anal. Mach. Intell. 2017, 39, 640–651. [Google Scholar] [CrossRef]
  21. Ronneberger, O.; Fischer, P.; Brox, T. U-Net: Convolutional Networks for Biomedical Image Segmentation. In Medical Image Computing and Computer-Assisted Intervention—MICCAI 2015; Springer: Cham, Switzerland, 2015; pp. 234–241. [Google Scholar] [CrossRef] [Green Version]
  22. Chen, L.-C.; Papandreou, G.; Kokkinos, I.; Murphy, K.; Yuille, A. DeepLab: Semantic Image Segmentation with Deep Convolutional Nets, Atrous Convolution, and Fully Connected CRFs. IEEE Trans. Pattern Anal. Mach. Intell. 2016, 40, 834–848. [Google Scholar] [CrossRef] [Green Version]
  23. Chen, L.-C.; Papandreou, G.; Schroff, F.; Adam, H. Rethinking Atrous Convolution for Semantic Image Segmentation. arXiv 2017, arXiv:1706.05587. [Google Scholar]
  24. Chen, L.-C.; Zhu, Y.; Papandreou, G.; Schroff, F.; Adam, H. Encoder-Decoder with Atrous Separable Convolution for Semantic Image Segmentation. In Proceedings of the European Conference on Computer Vision (ECCV), Munich, Germany, 8–14 September 2018; pp. 801–818. [Google Scholar]
  25. Chaurasia, A.; Culurciello, E. LinkNet: Exploiting encoder representations for efficient semantic segmentation. In Proceedings of the 2017 IEEE Visual Communications and Image Processing (VCIP), St. Petersburg, FL, USA, 10–13 December 2017. [Google Scholar]
  26. Ma, L.; Liu, Y.; Zhang, X.; Ye, Y.; Yin, G.; Johnson, B.A. Deep learning in remote sensing applications: A meta-analysis and review. ISPRS J. Photogramm. Remote Sens. 2019, 152, 166–177. [Google Scholar] [CrossRef]
  27. Zhu, X.X.; Tuia, D.; Mou, L.; Xia, G.-S.; Zhang, L.; Xu, F.; Fraundorfer, F. Deep Learning in Remote Sensing: A Comprehensive Review and List of Resources. IEEE Geosci. Remote Sens. Mag. 2017, 5, 8–36. [Google Scholar] [CrossRef] [Green Version]
  28. Henry, C.; Azimi, S.; Merkle, N. Road Segmentation in SAR Satellite Images with Deep Fully Convolutional Neural Networks. IEEE Geosci. Remote Sens. Lett. 2018, 15, 1867–1871. [Google Scholar] [CrossRef] [Green Version]
  29. Chen, S.-W.; Tao, C.-S. PolSAR Image Classification Using Polarimetric-Feature-Driven Deep Convolutional Neural Network. IEEE Geosci. Remote Sens. Lett. 2018, 15, 627–631. [Google Scholar] [CrossRef]
  30. Cheng, G.; Zhou, P.; Han, J. Learning Rotation-Invariant Convolutional Neural Networks for Object Detection in VHR Optical Remote Sensing Images. IEEE Trans. Geosci. Remote Sens. 2016, 54, 7405–7415. [Google Scholar] [CrossRef]
  31. Marmanis, D.; Datcu, M.; Esch, T.; Stilla, U. Deep Learning Earth Observation Classification Using ImageNet Pretrained Networks. IEEE Geosci. Remote Sens. Lett. 2015, 13, 105–109. [Google Scholar] [CrossRef] [Green Version]
  32. Chen, Y.; Lin, Z.; Zhao, X.; Wang, G.; Gu, Y. Deep Learning-Based Classification of Hyperspectral Data. IEEE J. Sel. Top. Appl. Earth Obs. Remote Sens. 2014, 7, 2094–2107. [Google Scholar] [CrossRef]
  33. Chen, L.-C.; Papandreou, G.; Kokkinos, I.; Murphy, K.; Yuille, A. Semantic Image Segmentation with Deep Convolutional Nets and Fully Connected CRFs. arXiv 2014, arXiv:1412.7062. [Google Scholar]
  34. Geng, J.; Fan, J.C.; Chu, J.L.; Wang, H.Y. Research on marine floating raft aquaculture SAR image target recognition based on deep collaborative sparse coding network. Acta Autom. 2016, 42, 593–604. [Google Scholar] [CrossRef]
  35. Zhang, Y.; Wang, C.; Ji, Y.; Chen, J.; Deng, Y.; Chen, J.; Jie, Y. Combining Segmentation Network and Nonsubsampled Contourlet Transform for Automatic Marine Raft Aquaculture Area Extraction from Sentinel-1 Images. Remote Sens. 2020, 12, 4182. [Google Scholar] [CrossRef]
  36. Deyi, W.; Han, M. SA-U-Net++: SAR marine floating raft aquaculture identification based on semantic segmentation and ISAR augmentation. J. Appl. Remote Sens. 2021, 15, 016505. [Google Scholar] [CrossRef]
  37. He, K.; Zhang, X.; Ren, S.; Sun, J. Deep Residual Learning for Image Recognition. In Proceedings of the IEEE Conference on Computer Vision and Pattern Recognition, Las Vegas, NV, USA, 27–30 June 2016; pp. 770–778. [Google Scholar] [CrossRef] [Green Version]
  38. Szegedy, C.; Liu, W.; Jia, Y.; Sermanet, P.; Reed, S.; Anguelov, D.; Erhan, D.; Vanhoucke, V.; Rabinovich, A. Going deeper with convolutions. In Proceedings of the IEEE Conference on Computer Vision and Pattern Recognition, Boston, MA, USA, 7–12 June 2015; pp. 1–12. [Google Scholar]
  39. Simonyan, K.; Zisserman, A. Very Deep Convolutional Networks for Large-Scale Image Recognition. arXiv 2014, arXiv:1409.1556. [Google Scholar]
  40. Zhang, Z.; Liu, Q.; Wang, Y. Road Extraction by Deep Residual U-Net. IEEE Geosci. Remote Sens. Lett. 2018, 15, 749–753. [Google Scholar] [CrossRef] [Green Version]
  41. He, K.; Zhang, X.; Ren, S.; Sun, J. Identity Mappings in Deep Residual Networks. In Proceedings of the European Conference on Computer Vision, Amsterdam, The Netherlands, 11–14 October 2016; Volume 9908, pp. 630–645. [Google Scholar]
  42. Iglovikov, V.; Shvets, A. TernausNet: U-Net with VGG11 Encoder Pre-Trained on ImageNet for Image Segmentation. arXiv 2018, arXiv:1801.05746. [Google Scholar]
  43. Russakovsky, O.; Deng, J.; Su, H.; Krause, J.; Satheesh, S.; Ma, S.; Huang, Z.; Karpathy, A.; Khosla, A.; Bernstein, M.; et al. ImageNet Large Scale Visual Recognition Challenge. Int. J. Comput. Vis. 2014, 115, 211–252. [Google Scholar] [CrossRef] [Green Version]
  44. Zhang, M.; An, J.; Yu, D.; Yang, L.; Wu, L.; Lv, X. Convolutional Neural Network With Attention Mechanism for SAR Automatic Target Recognition. IEEE Geosci. Remote Sens. Lett. 2020, 19, 4004205. [Google Scholar] [CrossRef]
  45. Qiu, M.; Zhang, Y.; Sui, C.; Yang, P. Evaluation on deep-water cage culture suitability of Changhai County based on GIS. In IOP Conference Series: Earth and Environmental Science; IOP Publishing: Bristol, UK, 2019; Volume 227, p. 062038. [Google Scholar] [CrossRef]
  46. Ottinger, M.; Clauss, K.; Kuenzer, C. Large-Scale Assessment of Coastal Aquaculture Ponds with Sentinel-1 Time Series Data. Remote Sens. 2017, 9, 440. [Google Scholar] [CrossRef] [Green Version]
  47. Khelifi, L.; Mignotte, M. Deep Learning for Change Detection in Remote Sensing Images: Comprehensive Review and Meta-Analysis. IEEE Access 2020, 8, 126385–126400. [Google Scholar] [CrossRef]
  48. Tsagkatakis, G.; Aidini, A.; Fotiadou, K.; Giannopoulos, M.; Pentari, A.; Tsakalides, P. Survey of Deep-Learning Approaches for Remote Sensing Observation Enhancement. Sensors 2019, 19, 3929. [Google Scholar] [CrossRef] [Green Version]
  49. He, K.; Girshick, R.; Dollar, P. Rethinking ImageNet Pre-Training. In Proceedings of the IEEE/CVF International Conference on Computer Vision, Seoul, Korea, 27–28 October 2019; pp. 4917–4926. [Google Scholar] [CrossRef] [Green Version]
  50. Lu, F.; Fu, C.; Zhang, G.; Zhang, W.; Xie, Y.; Li, Z. Convolution neural network based on fusion parallel multiscale features for segmenting fractures in coal-rock images. J. Electron. Imaging 2020, 29, 023008. [Google Scholar] [CrossRef]
Figure 1. (a) The structure of the U-Net model; (b) Plain neural unit in U-Net; (c) Residual unit.
Remotesensing 14 03003 g001
Figure 2. The structure of the proposed D-ResUnet model.
Remotesensing 14 03003 g002
Figure 3. Study area: (a) location; (b) SAR data of the study area.
Remotesensing 14 03003 g003
Figure 4. Data augmentation: (a) raw data; (b) horizontal flip; (c) vertical flip; (d) diagonal mirroring.
Remotesensing 14 03003 g004
Figure 5. (a) Different learning rates on the validation set in 50 epochs; (b) average accuracy and standard deviation under different learning rates.
Remotesensing 14 03003 g005
Figure 6. Resulting maps of four models in four randomly selected test areas. Black pixels represent the ocean background and white pixels represent the extracted FRA areas. Red rectangles are areas where the FRA area is easily missed, and blue rectangles are areas where the FRA extraction result is prone to adhesions.
Remotesensing 14 03003 g006
Figure 7. Resulting maps of four DL models. Black pixels represent the ocean background and white pixels represent the extracted FRA areas. Red rectangles are areas where the FRA area is easily missed, and blue rectangles are areas where the FRA extraction result is prone to adhesions. (a) The results obtained by U-Net; (b) the results obtained by ResNet34 + U-Net; (c) the results obtained by ResNet34 + residual decoder + U-Net; (d) the results obtained by proposed D-ResUnet (Pre-trained ResNet34 + residual decoder + U-Net).
Remotesensing 14 03003 g007
Figure 8. Resulting maps of the application experiment. Black pixels represent the seawater and white pixels represent the extracted FRA areas. Red rectangles (a–d) are areas where the FRA area is easily missed.
Remotesensing 14 03003 g008
Figure 9. IoU of the pre-trained and not pre-trained D-ResUnet model.
Remotesensing 14 03003 g009
Table 1. The parameters and output size of D-ResUnet.
StageBlockConvChannelStrideFeature Map Size
(Default 320 × 320)
17 × 764280 × 80
/642
23 × 3642/140 × 40
Encoder33 × 31282/120 × 20
43 × 32562/110 × 10
53 × 35122/15 × 5
53 × 3256120 × 20
43 × 3128140 × 40
Decoder33 × 364180 × 80
23 × 3641160 × 160
13 × 311320 × 320
Table 2. The confusion matrix of the experiment result.
Confusion MatrixGround Truth
PositiveNegative
Extraction resultPositiveTrue Positive (TP)False Positive (FP)
NegativeFalse Negative (FN)True Negative (TN)
Table 3. Training, validation, and test dataset.
The Data SetNumber
of Patches
Size of ImagesChannel of Images
Training datasetSAR Image3686320 × 3201
Ground truth map
Validation datasetSAR Image1228320 × 3201
Ground truth map
Test datasetSAR Image1230320 × 3201
Ground truth map
Table 4. Precision, Recall, F1, and IoU of the models (Mean ± SD 1).
MethodsPrecision (%)
(Mean ± SD)
Recall (%)
(Mean ± SD)
F1 (%)
(Mean ± SD)
IoU (%)
(Mean ± SD)
LinkNet78.81 ± 0.9574.23 ± 2.1976.44 ± 1.4661.89 ± 1.88
DeepLabV378.95 ± 1.9682.96 ± 2.2380.91 ± 2.0567.98 ± 2.84
U-Net80.75 ± 1.1781.20 ± 1.4880.97 ± 1.2868.04 ± 1.82
D-ResUnet92.89 ± 1.0692.32 ± 0.7792.60 ± 0.9186.24 ± 1.57
1 SD means the standard deviation.
Table 5. Precision, Recall, F1, and IoU of the models (Mean ± SD 1).
StrategyMethodPrecision (%)
(Mean ± SD)
Recall (%)
(Mean ± SD)
F1 (%)
(Mean ± SD)
IoU (%)
(Mean ± SD)
1U-Net80.75 ± 1.1781.20 ± 1.4880.97 ± 1.2868.04 ± 1.82
2ResNet34 + U-Net66.91 ± 1.1685.33 ± 0.6975.00 ± 0.6560.00 ± 0.83
3ResNet34 + residual decoder
+ U-Net
84.95 ± 0.6185.24 ± 0.7885.09 ± 0.4674.05 ± 0.70
4Pre-trained ResNet34 + residual decoder + U-Net 92.89 ± 1.0692.32 ± 0.7792.60 ± 0.9186.24 ± 1.57
1 SD means the standard deviation.
Table 6. Precision, Recall, F1, and IoU of the models (Mean ± SD 1).
MethodsPrecision (%)
(Mean ± SD)
Recall (%)
(Mean ± SD)
F1 (%)
(Mean ± SD)
IoU (%)
(Mean ± SD)
DeepLabV373.74 ± 0.8858.60 ± 4.9665.17 ± 3.1748.42 ± 3.39
LinkNet80.68 ± 1.9361.50 ± 4.4169.64 ± 2.3553.47 ± 2.71
U-Net83.77 ± 0.6360.38 ± 1.2170.17 ± 0.7554.05 ± 0.90
D-ResUnet76.49 ± 1.0374.40 ± 1.2275.42 ± 0.8660.55 ± 1.11
1 SD means standard deviation.
Table 7. The Precision, Recall, F1, and IOU of the models (Mean ± SD 1).
MethodsPrecision (%)
(Mean ± SD)
Recall (%)
(Mean ± SD)
F1 (%)
(Mean ± SD)
IoU (%)
(Mean ± SD)
Not Pre-trained D-ResUet84.95 ± 0.6185.24 ± 0.7885.09 ± 0.4674.05 ± 0.70
Pre-trained D-ResUet92.89 ± 1.0692.32 ± 0.7792.60 ± 0.9186.24 ± 1.57
1 SD means standard deviation.
Table 8. Calculation complexity of four models.
MethodsParametersFLOPs
LinkNet21.77 M8.38 G
DeepLabV326 M42.56 G
U-Net31.04 M85.43 G
D-ResUnet24.83 M21.49 G
Publisher’s Note: MDPI stays neutral with regard to jurisdictional claims in published maps and institutional affiliations.

