Article

Near-Earth Remote Sensing Images Used to Determine the Phenological Characteristics of the Canopy of Populus tomentosa B301 under Three Methods of Irrigation

1
School of Technology, Beijing Forestry University, Beijing 100083, China
2
Beijing Laboratory of Urban and Rural Ecological Environment, Beijing Municipal Education Commission, Beijing 100083, China
3
Key Lab of State Forestry Administration for Forestry Equipment and Automation, Beijing 100083, China
4
Ministry of Education Key Laboratory of Silviculture and Conservation, Beijing Forestry University, Beijing 100083, China
5
China Power (Beijing) Technology Development Co., Ltd., Beijing 100083, China
*
Author to whom correspondence should be addressed.
Remote Sens. 2022, 14(12), 2844; https://doi.org/10.3390/rs14122844
Submission received: 5 May 2022 / Revised: 30 May 2022 / Accepted: 10 June 2022 / Published: 14 June 2022

Abstract

:
Due to global warming, changes in plant phenology such as an early leaf spreading period in spring, a late abscission period in autumn, and growing season extension are commonly seen. Here, near-earth remote sensing images were used to monitor the canopy phenology of Populus tomentosa B301 in planted forests under full drip irrigation, full furrow irrigation, and no irrigation (rain fed). Experiments were conducted to collect phenological data across a growing season. Continuous canopy images were used to calculate different vegetation indices; the key phenological period was determined via the double logistic model and the curvature method. The effects of irrigation methods and precipitation in the rainy season on tree growth changes and key phenological periods were analyzed. The results showed that: (1) The green chromatic coordinate (GCC) conformed to the vegetation index of the tree species canopy phenological study. (2) During the phenological period throughout the year, the GCC reaching peak time (MOE) of the canopy phenology of Populus tomentosa B301 was the same in the three methods, while the time of shedding at the end of the growing season without irrigation (preset point 1) was 8 days longer than with full drip irrigation (preset point 3), and 7 days faster than with full furrow irrigation (preset point 5). (3) In the preliminary rainy season, different irrigation volumes induced different growth changes and phenological periods of the trees, resulting in different data of vegetation indicators under different growth conditions. (4) During the rainy season, the precipitation had different effects on cultivating P. tomentosa B301 using the three methods, that is, high precipitation could increase the growth rate of the fully irrigated area, otherwise the growth rate of this tree species was increased in full drip irrigation areas. Precipitation was lower and irregular, and the growth rate of this species was faster than the other two irrigation methods in the non-irrigated area, which was more adaptable to external environmental changes. The internal growth mechanism of the phenological changes in different areas of the planted forests was influenced by the different cultivation methods. Moreover, the collected phenological data provide a basis for the study of plant phenology with large data sets and deepens our understanding of the phenology of planted forests in response to climate change.

Graphical Abstract

1. Introduction

Global changes since the industrial revolution have included climate warming. In 2019, the global average temperature was approximately 1.1 °C higher than in the pre-industrial period, and the period from 2015 to 2019 was the warmest five years since complete meteorological observation records have been available. As our understanding of such warming has deepened, phenology has been found to be closely associated with the study of global climate change [1]. Phenology is the traditional discipline of studying the seasonal activities of flora and fauna, considering environmental factors as driving forces. Plant phenology, a natural phenomenon in which plants are annually affected by biological and environmental factors [2], is the growth and development rhythm formed by a plant’s long-term adaptation to seasonal changes. Affected by global warming, plant phenology has become a significant and sensitive indicator of global climate change, particularly changes in start of season (SOS), for which the period of decline has become a study hotspot [3]. Nevertheless, the characteristic changes in plant phenology are subject to multiple environmental factors, which are often mutually interdependent. Therefore, it is ideal to implement controlled experiments to test the theoretical phenological hypotheses. By controlling the gradient changes in one or more influencing factors (temperature, moisture, light, etc.), considerable phenological data can be collected in a short period of time [4]. Among the environmental influencing factors, temperature is deemed the foremost meteorological factor affecting plant phenology [5]. Zhai Jia et al. [6] analyzed individual observations and model simulations and discovered that for every 1 °C increase in temperature, the spring phenology of plants growing in China advances by 4.93 d. Mo Fei et al. [7] observed that with small changes in temperature and photoperiod throughout the year, the changes in the phenological period of plants will depend primarily on changes in temperature due to their heat requirements. Illumination is also a significant meteorological factor influencing plant phenology. Keller et al. [8] investigated the blossoms of 33 alpine plants in Austria and discovered that 54% of the plants were sensitive to photoperiod during florescence. Moisture can also influence phenological changes; however, Hou Meiting et al. [9] considered that the main climatic factor to cause notable changes in vegetation in eastern China was temperature, and the role of precipitation was not evident.
From initial human observations to the use of remote sensing technology, plant phenology observation methods have gradually become the current mainstream means. Although satellite remote sensing can be used to observe plant phenology at the regional and global scales, it is vulnerable to external influences such as clouds and the atmosphere. Nevertheless, the camera’s continuous photography technology, known as near-ground remote sensing technology, makes it possible to perform the phenological analysis of time series by extracting image information. This technology is characterized by high resolution, small-scale observation, automatic high-frequency measurement, high-quality images, and low cost [10,11], and it can be used to verify the large-scale vegetation phenology analyses performed on the basis of satellite remote sensing, and observe the fine phenological characteristics of microcosms and individual species. This is a powerful means to counteract insufficient specific and technological analysis of satellite remote sensing and conventional ground phenological observation. It has been widely used in many national phenology observation networks, worldwide. Zhou [12] employed the vegetation data in the phenology camera observation network (Pheno Cam), and multiple phenological extraction methods were compared to verify the accuracy of camera phenological parameter extraction. Zhou et al. [13] used digital cameras to analyze the differences in greenness indices pursuant to the phenology of alpine grasslands in Dangxiong, Tibet, and determined that the absolute greenness index could be used to characterize the seasonal changes in alpine grassland vegetation communities. Ahrend et al. [14] reported that digital cameras could be used to elaborate the phenological changes in mixed beech forests in northern Switzerland. Zhou [15] used near-earth remote sensing (digital camera) at the Oakville Prairie Biological Field Station to analyze the response of GCC to environmental factors such as soil moisture and temperature, air temperature, and solar radiation. Liu et al. [16] adopted near-Earth remote sensing to recognize sources of uncertainty in forest canopy phenology. As indicated by the above literature, the majority of studies focus on the phenological response to climate in terms of temperature and light. Irrigation has a certain impact on phenology. An experiment in Northeast Thailand showed that for most crops in the lowlands, irrigation was able to subtract 6–7 days from the flowering stage [17]. Walk et al. pointed out that the growth and flowering periods of alpine and Arctic plant species were closely related to the snowmelt date, because snowmelt causes changes in water and temperature, thus affecting plant growth [18]. The impact of precipitation on plant flowering is particularly obvious in tropical and arid areas. Lampe et al. [19] studied shrubs in northeast Venezuela and found that, due to the serious impact of drought conditions, they immediately responded by flowering as soon as precipitation occurred, resulting in a highly consistent phenological synchronization. R. Savé et al. [20] modeled the direct effects of global changes in climatic variables and soil water-related characteristics influencing the contribution of crops on the water balance, and found that changes in environmental conditions affected the real water availability in different crops.
Populus spp. is one of the world’s fastest-growing trees in temperate areas and is the main wood species in northern China. Water is a significant limiting factor on the growth of Populus, whose high growth rate is associated with its high water demand. Therefore, Populus is highly susceptible to water and abiotic stresses. Triploid Populus tomentosa is a significant tree species for the development of fast-growing and high-yield forests with independent intellectual property rights in China. However, the average productivity of its forest land is 12 m3·hm−2a−1 [21], which is lower than the international average level of 20 ~ 30 m3·hm−2a−1 [22], and its forest productivity is far from reaching its growth potential. Therefore, it is of great significance to investigate the phenology of planted forests of Populus in order to advance its productivity in China.
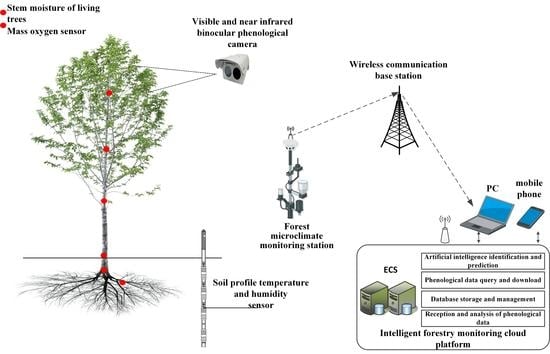
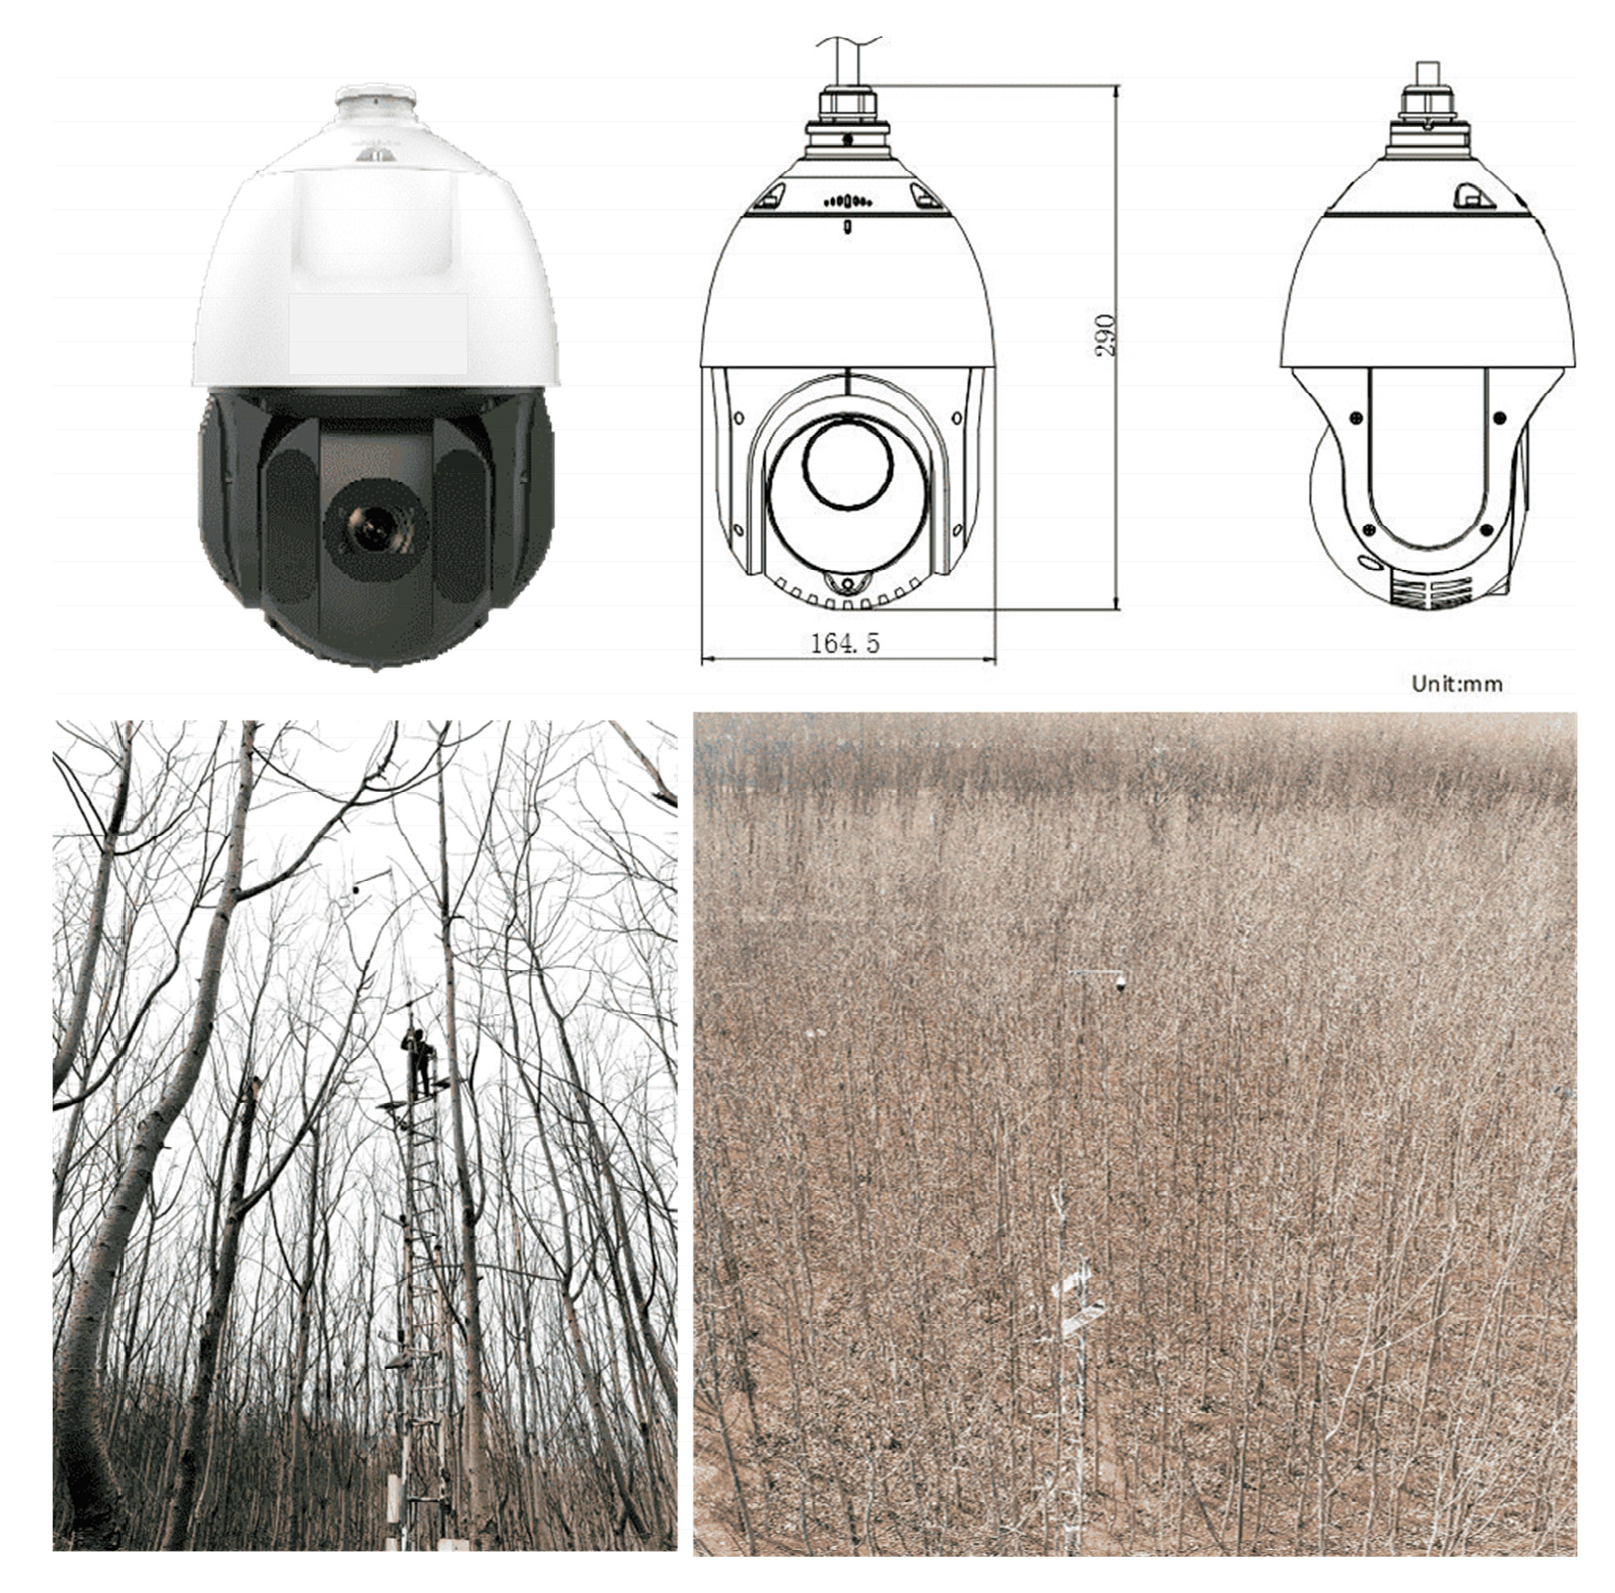
Therefore, under a normal climate (i.e., without extreme weather), in this study, the following assumptions were made when the response mechanism affecting changes in the planted forests’ phenological characteristics in response to adequate water and different irrigation methods was still unclear: (1) water sufficiency will notably influence the changes in the phenological characteristics of vegetation, and (2) different irrigation methods can affect the changes in the phenological characteristics of vegetation. In order to address these hypotheses, we took triploid P. tomentosa B301 clones [(P. tomentosa × P. bolleana) × P. tomentosa] in a planted forest as the study object. Using near-earth satellite remote sensing equipment under the same temperature and light conditions in order to perform a controlled experiment, different irrigation methods—full drip irrigation, full furrow irrigation, and rain feeding (no irrigation)—were adopted on the forest farm, and the changes in the phenological characteristics were analyzed.

2. Materials and Methods

2.1. Profile of the Study Area

The experimental field is situated on the state-owned old town forest farm (116°5′25″E, 36°48′47″N) in Gaotang County, Liaocheng City, Shandong Province, China, with an altitude of 30 m (Figure 1). The field features a temperate semi-humid continental monsoon climate with significant seasonal changes, sufficient light, and abundant heat, and is one of the main planting areas suitable for the growth of Populus Tomentosa. The average annual precipitation is 544.7 mm, concentrated in July–August, the annual evaporation is 1880 mm, the average annual temperature is 12.0–14.1 °C, the extreme maximum temperature is 41.2 °C, and the extreme minimum temperature is −20.8 °C. The annual sunshine time reaches 2651.9 h, the frost-free period is 204 days, and the average groundwater level (about 6.2 m) has been close to the average groundwater level (about 5.84 m) of the plain area of Shandong Province for many years (2000–2016). The physical properties of the soil in the experimental field are indicated in Table 1 [23].

2.2. Study Object

Sufficient water has different effects on vegetation of different stand ages. Xi et al. [24] found that under normal circumstances, irrigation had a significant positive effect on the above-ground growth of Populus, but that this could sometimes be very small, such as in two- or three-year-old forest trees, which are less responsive to irrigation than older trees. Moreover, irrigation can also negatively influence the growth of Populus; for example, irrigation promotes the occurrence of pests and diseases and inhibits the growth of trees. In the case of a stand age less than 6 years, the growth-promoting effect of irrigation increases with increasing age. Therefore, pursuant to the non-linear effect of stand age on the promoting effect of irrigation on poplar growth, in this study, triploid P. tomentosa B301 clones established in spring 2015 [25] were adopted. The trees were uniformly arranged with a plant-row spacing of 2 m × 3 m, with a stand density of 1667 plants/hm−2 and an area of 10,296 m2. The forest farm was established with five irrigation sites in a completely random block, and a total of six experimental repeat regions.

2.3. Experimental Design

Three groups with different irrigation methods and different irrigation volumes were established in the forest’s experimental base: rain fed (no irrigation), full drip irrigation, and full furrow irrigation. The irrigation time started from 25 March, when the leaf buds swelled, and stopped on 26 June, when the rainy season began (Figure 2a).
In the full drip irrigation (DIFI) system (Figure 2c), an irrigation tube produced by Israel NETAFIM was used with the drip discharge controlled to 1.6 L·h−1, and the distance between the drippers was 50 cm. It was placed on the surface of the ground and laid in one row and two belts along the direction of the tree row (the drip irrigation pipes were located 30 cm away from the tree on either side). During the growing season, pursuant to the quantitative relationship between the growth of P. tomentosa and soil water availability [26], when the soil water potential at 20 cm below the dripper reached approximately −18 KPa in DIFI (79% of the field moisture capacity θf, 73% of the soil moisture availability rθ), irrigation started, and it stopped when the soil moisture content in the wet zone of the soil increased to field capacity [27].
The full furrow irrigation (BIFI) system used PVC pipes (Figure 2b), and each trench had a water outlet to ensure the synchronization of water supply, and a tensiometer installed under the trench to record soil water potential. Groundwater was used for irrigation, and the water volume was automatically controlled by a meter and solenoid valve. In this treatment, the irrigation border was 1 m wide, 0.2 m deep, and 20 m long. Trees were planted in the center of the irrigation border and were fully irrigated roughly every five days during the growing season. This design was to ensure that the soil was always under well water conditions. The irrigation duration was about 1 h each time, with an irrigation amount of about 45 mm. According to the field observation, the infiltration depth of irrigation water was about 70 cm under this irrigation scheduling. Thus, the soil wetting volume (WV) perpendicular to the tree row is approximated to be a rectangle of 1 m wide and 70 cm. The non-irrigation group (CK) required no treatment.

2.4. Experimental Monitoring Equipment

The experiment used the high-definition digital network camera DS-2DC4223IW-D/GLT(C) as near-surface remote sensing equipment to capture the growth of the trees. Time-series images were collected through near-earth remote sensing equipment, which had a 1/2.8” progressive scan CMOS sensor, with a maximum resolution of 1920 × 1080 pixels, a lens with a horizontal angle of view of 57.6–2.7 degrees (wide angle-telephoto), 360° horizontal rotation, vertical direction −15~90° (automatic flip), and normal operation under ambient temperature (−30 °C to +65 °C). It supported 23× optical zoom, 16× digital zoom, 3D digital noise reduction, strong light suppression, and other functions.
The camera was supported at the upper end of the weather station facing north, at a height of 20 m above the ground (Figure 3). Due to the installation being so high, it was vulnerable to external environmental influences such as wind and rain, which can cause unavoidable movement and field of view changes, thereby requiring orientation calibration and image registration. The camera was set to the automatic operation mode for exposure and white balance adjustment. In addition, three fixed preset points were set for automatic cruise of the camera in the forest, referred to as preset point 1, preset point 3 and preset point 5, corresponding to all of the irrigation areas in which patrol scans were to be successively conducted. The pictures were transmitted using China Mobile’s 4G signal network, via the Alibaba Cloud server through the network protocol FTP (IP39.102.35.120). To minimize the impact of different sun angles, in this study, the period from 7:03 to 19:00 was selected for shooting the picture, and the time interval was 1 h. Images were named after the time and place of their capture, were uncompressed, and were automatically saved in JPEG format, thus forming a time sequence. The images were entered into the database and used to extract the vegetation index. Images from 24 March 2021 to 3 January 2022 were selected, with a total of 10,296 images taken.

2.5. Study Area Selection and Phenological Evaluation Indicator

In this study, the diagonal center points in different irrigation areas of preset point 1, preset point 3, and preset point 5 were taken as the regions of interest (ROI), with the irrigation equipment below. Due to the late planting time of the crops in the farmland near the research base, the farmland crops had little impact on the early stage of image acquisition. Secondly, the distance between the near-earth remote sensing equipment and the crops in the crop field is relatively large, and the height difference is relatively large. When vegetation and crops grow vigorously, a small degree of error may occur, but the overall impact will not be too great. Considering this problem after image acquisition, the region of interest at preset point 5 was placed in the center, away from the edge of the crop land, so as to minimize the error resulting from the external environment on the extracted vegetation index while not affecting the overall research results, as indicated in Figure 4. The computer PyCharm compiler and the Python language self-compiled algorithm “image processing tool” were used to read images as a time sequence; occasionally, the image quality could be adversely affected by variable light conditions, rain, snow, fog, or condensation frost on the camera housing window. To ensure the objectivity of the results, neither selective editing nor artificial enhancement of any archived images was performed. No smoothness or filtering of the time sequence resulting from the image analysis was conducted. Equation (1) was used to extract the average brightness value (digital number, DN) of the R, G, and B wave bands in the image ROI. To reduce the color balance changes affected by light, the mean value method was adopted, with 1d as a period, so as to calculate the average daily photo RGR brightness value.
D N c h a n n e l = ( s u m D N ) c h a n n e l / N c h a n n e l
DN represents the value of each wave band, ( s u m D N ) c h a n n e l indicates the sum of all pixel brightness values of a certain band in the image, N c h a n n e l indicates the number of pixels in the ROI.

Vegetation Index Calculation

The vegetation index denotes the greenness of each pixel on the basis of the spectral reflection and absorption characteristics of vegetation, and can reflect the growth status of vegetation. This study selects and calculates the time sequence of Green Red Vegetation Index (GRVI), Hue (HUE), Ratio Greenness Index (GGR), Relative Redness Index (RCC), Relative Greenness Index (GCC), and Absolute Greenness Index (GEI) to quantify the vegetation canopy dynamics (Table 2).

2.6. Data Curve Fitting and Phenology Extraction

Common methods of vegetation growth curve fitting include the logistic function-fitting method, the asymmetric Gaussian function-fitting method, and polynomial fitting. Among them, the double logistic (D-L) method features automatic threshold establishment, is suitable for extracting different types of vegetation phenology, and is widely used in the simulation study of vegetation growth process. This study was based on a D-L model to fit the growing season trajectory of P. tomentosa.
g ( t ) = ( m W ) { 1 [ 1 + exp ( m S x ( t S ) ) ] + 1 [ 1 + exp ( m A x ( t A ) ) ] } 1 + W
where g(t) indicates the fitted value of the color index, t refers to the Day of Year (DOY), m means the minimum value of the year, and W represents the maximum value of the year. S and A represent the beginning of the season and the end inflection points (SOS, EOS), mSx and mAx are the rates at points S and A, representing spring greening rate (RSP) and autumn senescence rate (RAU), respectively.
The key phenological parameters were the SOS, end of growing season (EOS), length of growing season (LOS), and the maximum value of growing season, which are the key event points of the vegetation growth process, as well as parameters such as the greening rate and the decline rate. The maximum curvature method was selected to extract phenological parameters, and the rate of change of curvature reflects the node changes in the growth period and the withering period, as well as the speed of growth. The formula based on the maximum curvature method is as follows:
P ( t ) = | g ( t ) ( 1 + g ( t ) 2 ) 3 2 |
where P(t) is the curvature, g ( t ) is the first-order derivative with respect to t, and g ( t ) is the second-order derivative with respect to t.
The following seasonal changes in vegetation were observed: in winter and early spring, there were only bare trunks and other natural phenomena, and at this time, the vegetation was in the dormant period, and the color of the image was primarily that of the trunks. As the external environment changed, notably with respect to temperature, P. tomentosa B301 showed leaf buds and gradually expanded [33] (Figure 5a), and vegetation began to grow (SOS). As the temperature increased, the digital image dominated by the trunk color was steadily replaced by sporadic leaf buds as they formed and elongated, which is known as the leaf bud opening stage (Figure 5b). When the light and temperature were adequate, P. tomentosa B301 gradually spread its leaves and began to enter the vigorous growth period, and emerald green became the dominant tone of the image (Figure 5c). Over time, the leaf color in the image steadily changed from emerald green to dark green (Figure 5d), which is known as the leaf discoloration period. With the gradual yellowing and withering of leaves in autumn and winter, natural shedding occurred, and the tree entered the deciduous stage (Figure 5e), whereupon the digital images show the trunk color again until the end of the vegetation growing season (EOS).

3. Results

3.1. Irrigation Duration and Irrigation Amount

Experiments using different irrigation volumes were performed on P. tomentosa B301 cultivated in three ways, and the data were categorized as shown in
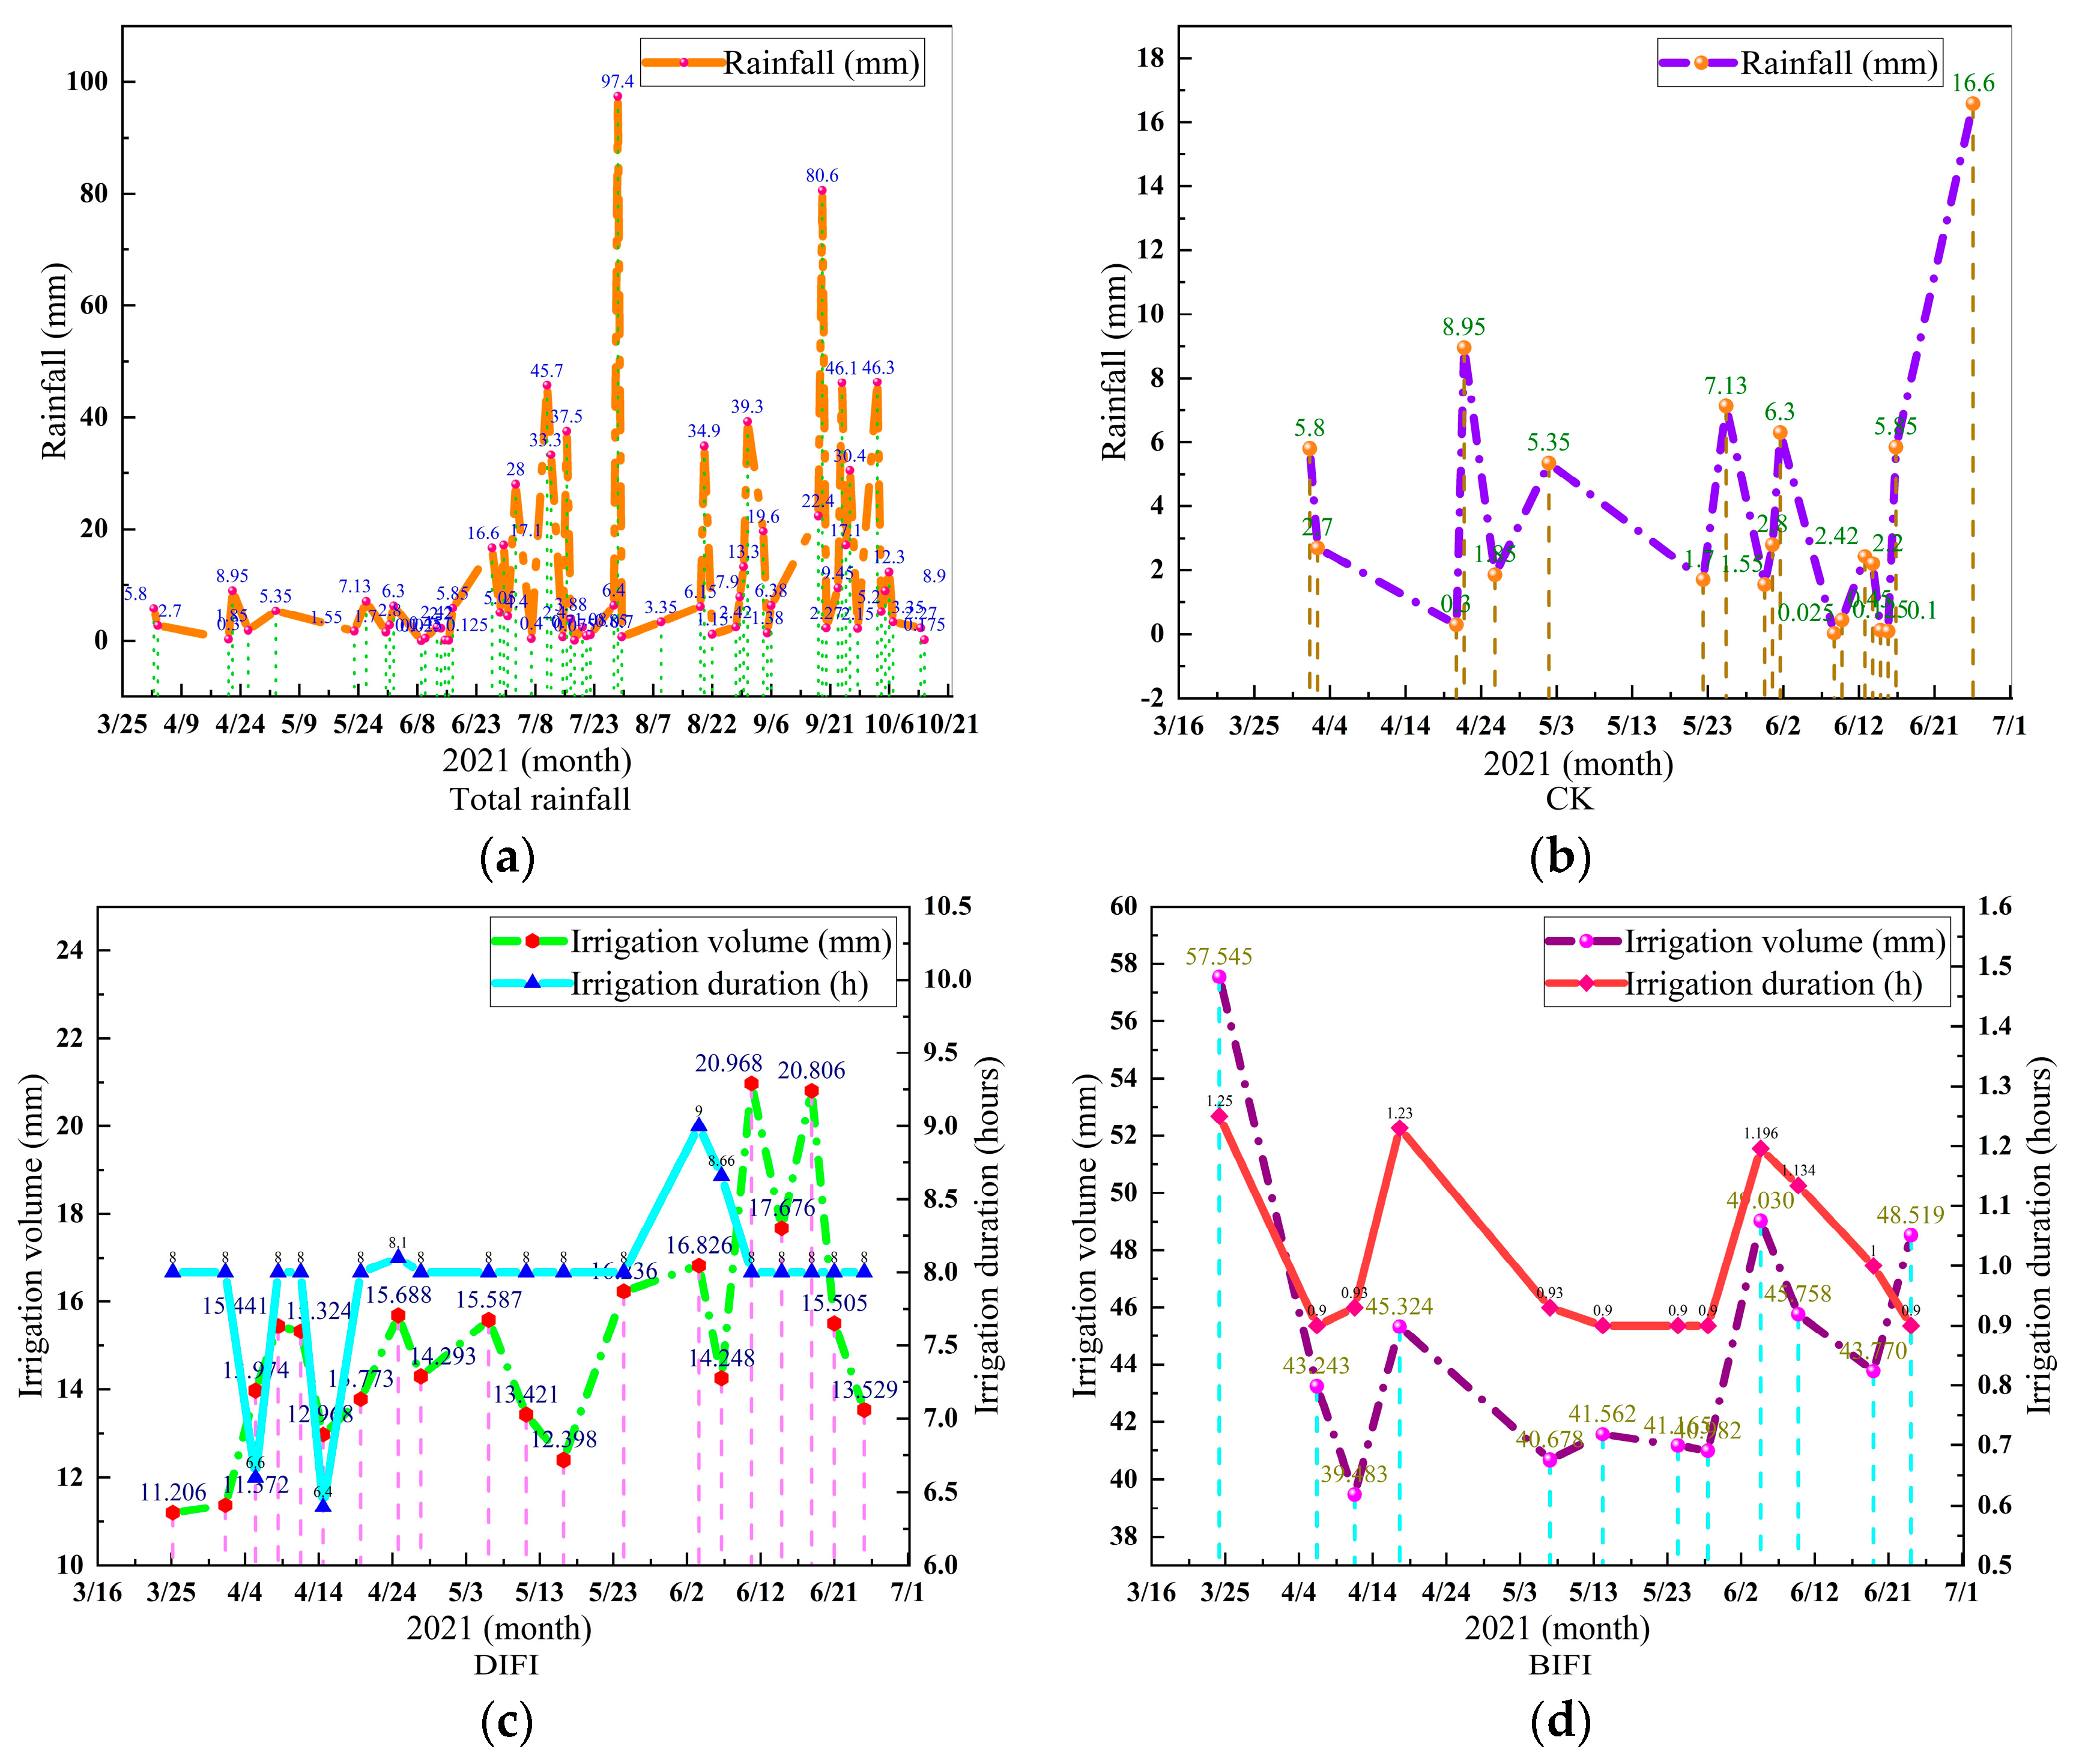
 Figure 6.
Figure 6a shows the annual precipitation measured by a rain gauge. It can be observed that the rainy season in this area occurred after July. Rain fed (CK) develops under normal weather conditions, as shown in the schematic diagram of the precipitation in normal weather recorded from the first precipitation on 2 April to 27 June at preset point 1 in the plantation (Figure 6b). 
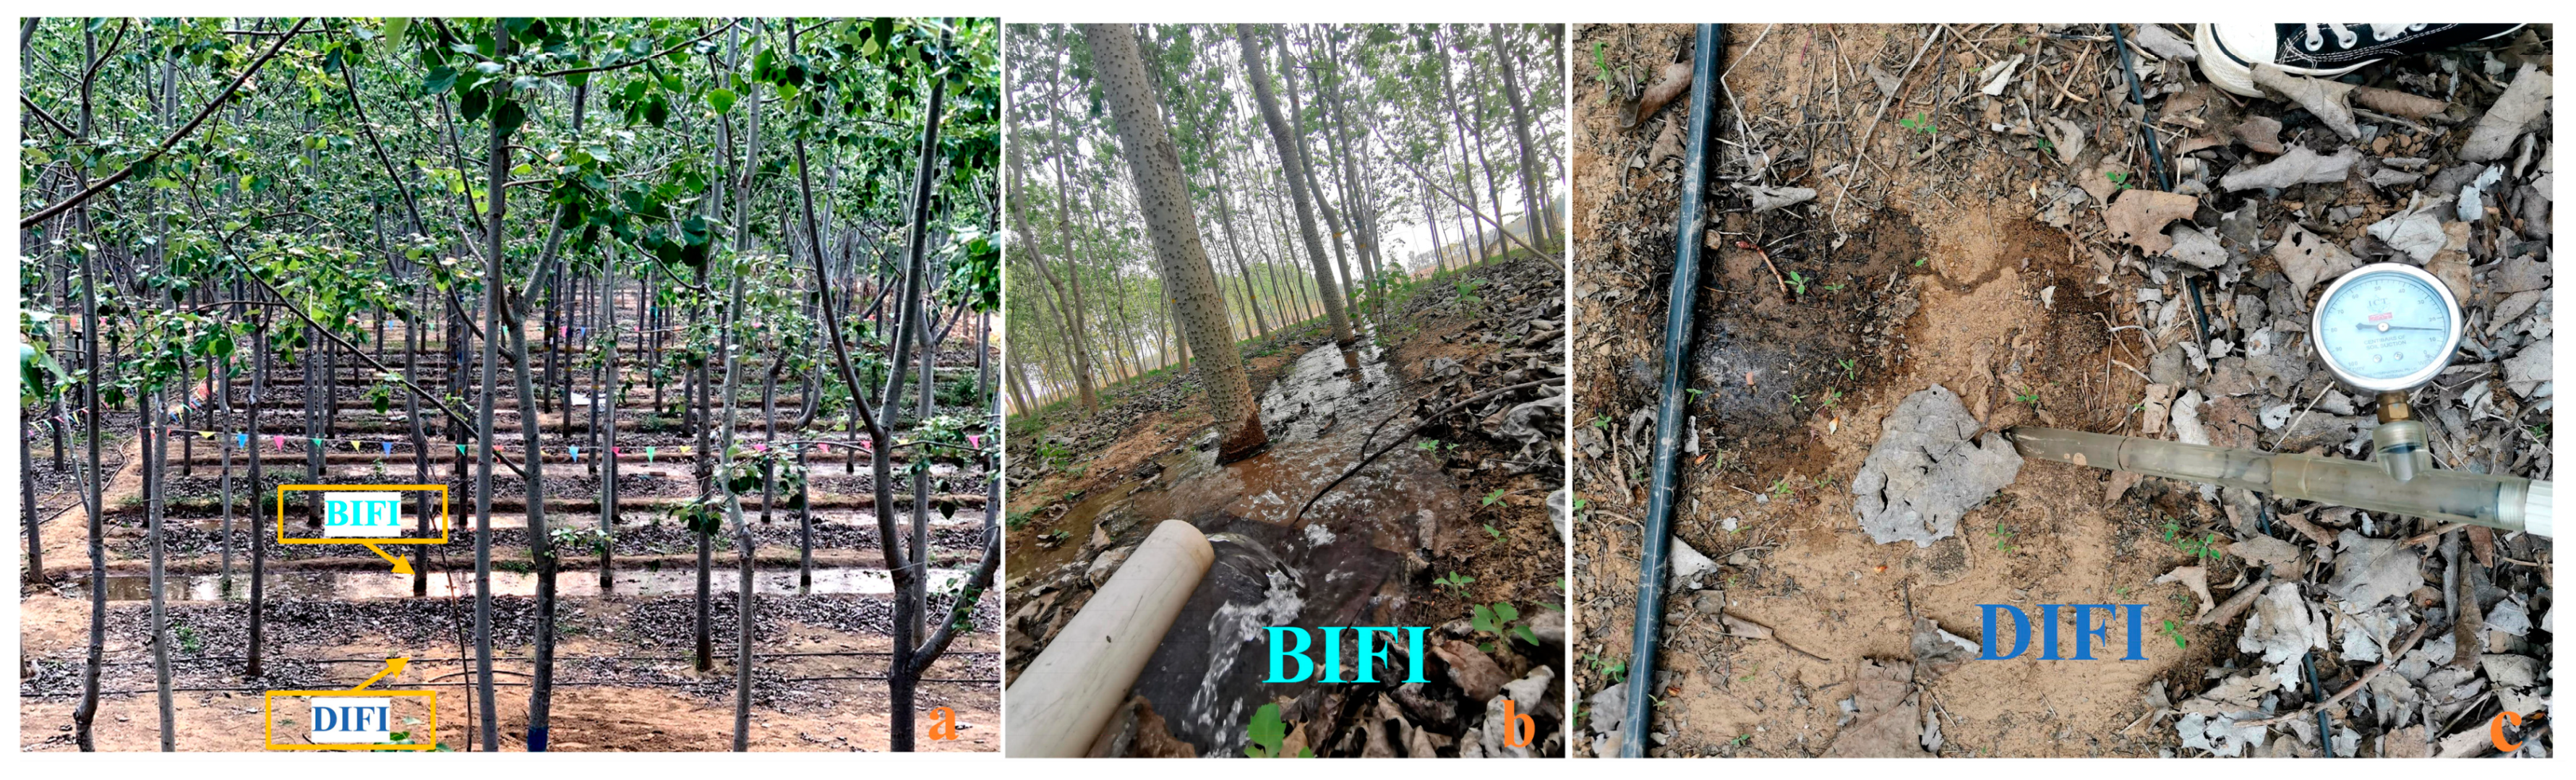
Figure 6c shows DIFI and records the irrigation volume and the irrigation duration, indicating that the tree species at preset point 3 was fully drip-irrigated from 26 March to 26 June. Due to the influence of external environmental factors such as light, the soil moisture content in the wet area was different; therefore, the irrigation volume and irrigation time were different. The average duration of full drip irrigation was 8 h. Figure 6d shows BIFI and records the irrigation volume and duration, indicating that the tree species in the area of preset point 5 was fully irrigated from 25 March to 25 June. Due to the influence of external factors such as temperature, the average soil moisture content in the shallow soil layer (50 cm) was different, and the irrigation amount and irrigation time are also different. The average duration of furrow irrigation was 1 h.

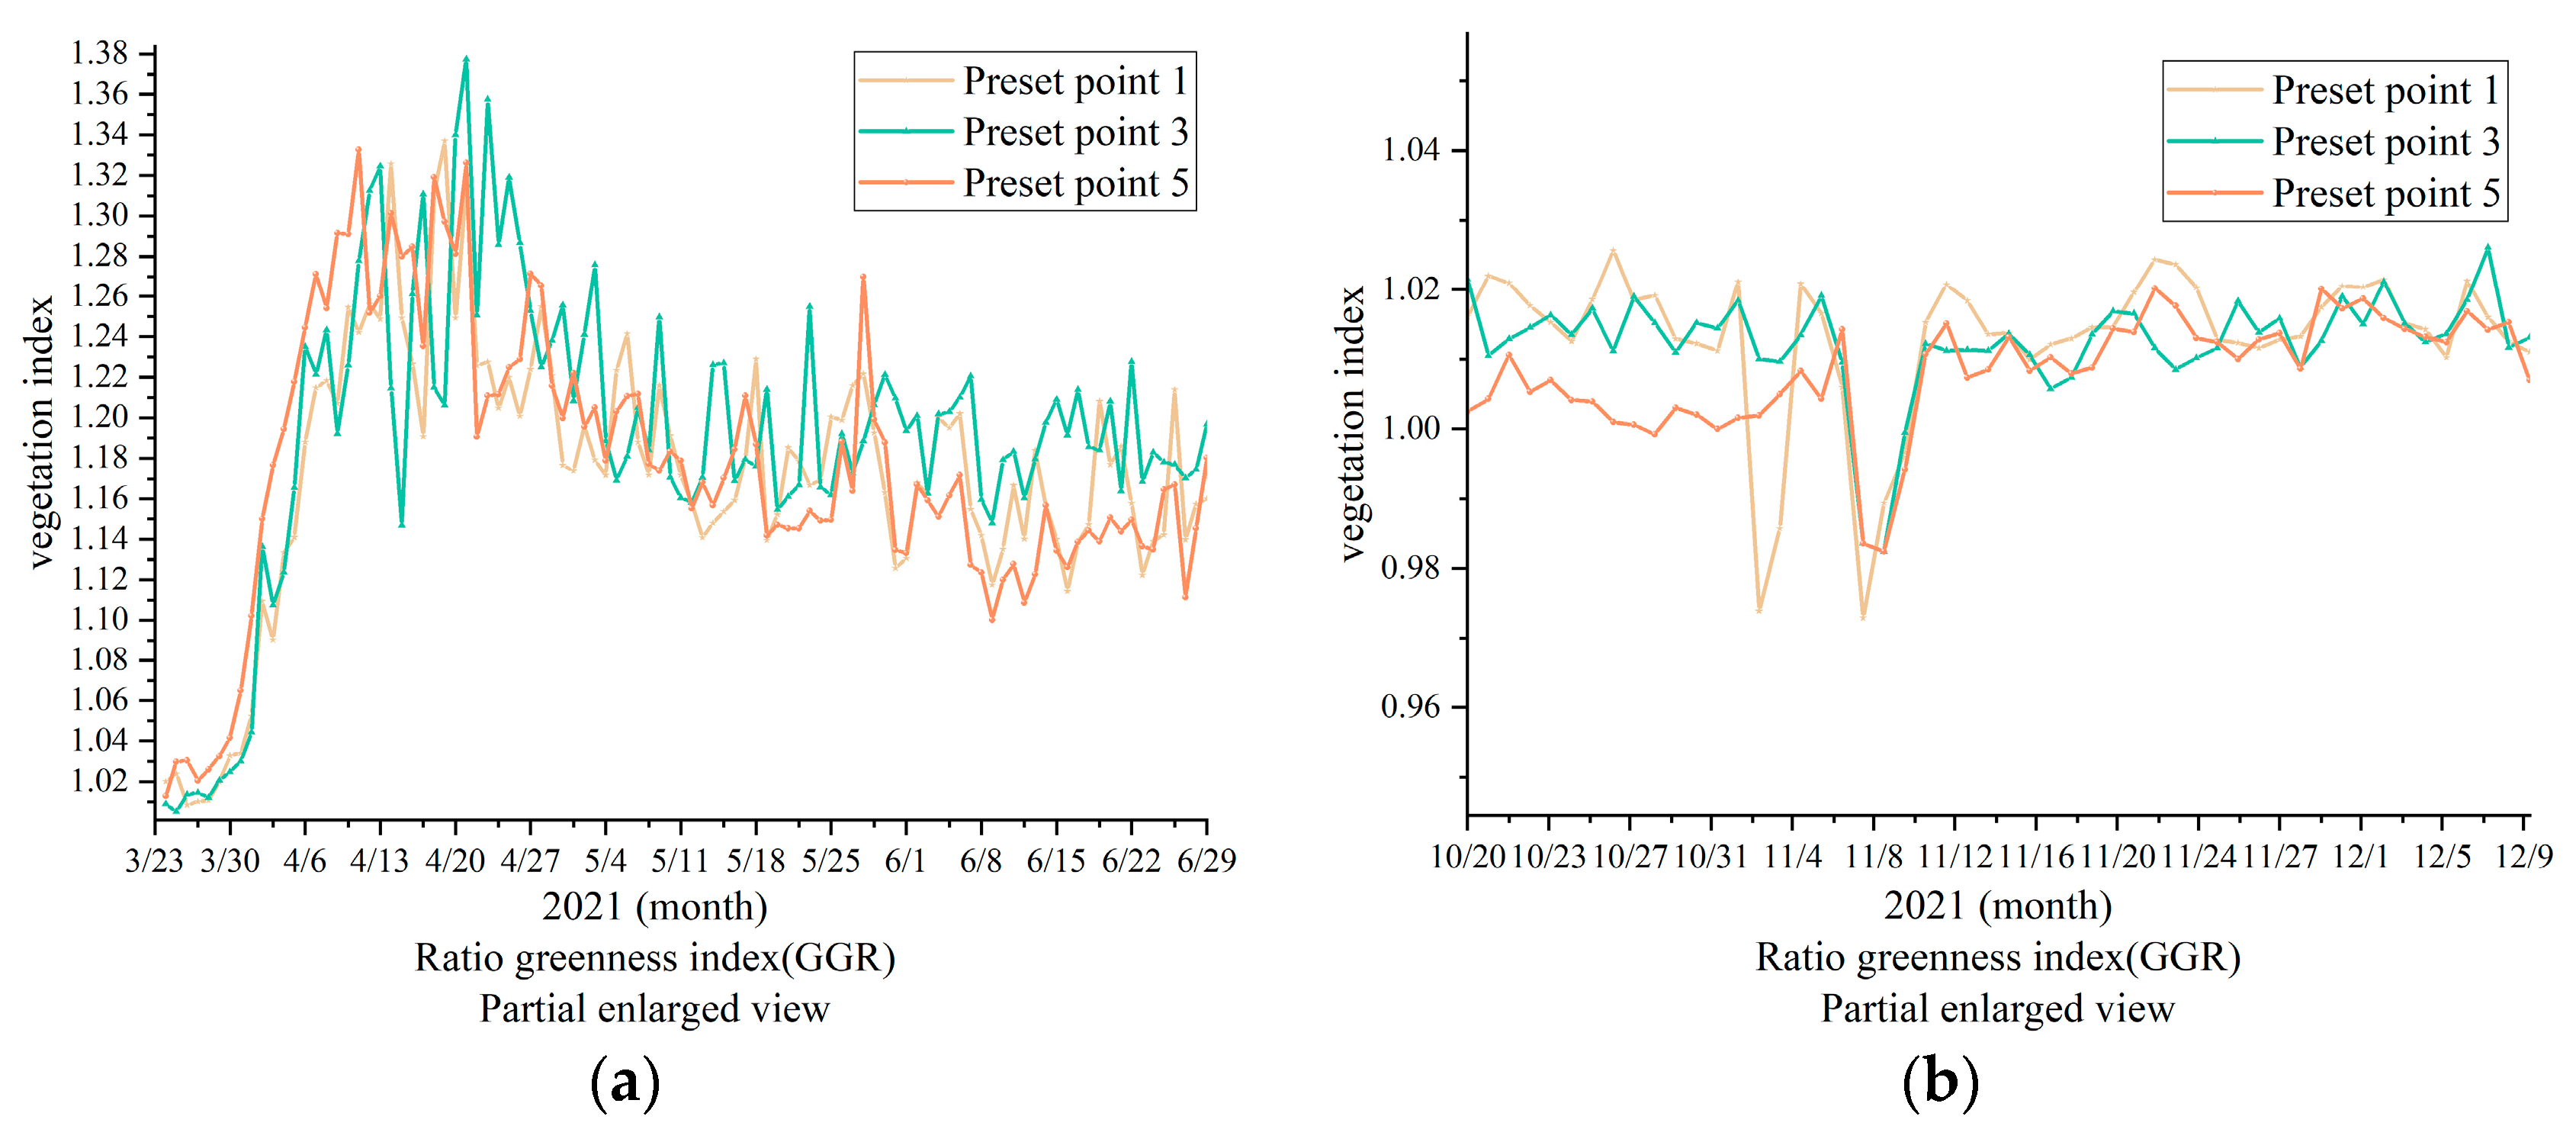
3.2. Comparison of Vegetation Indexes at Different Preset Points

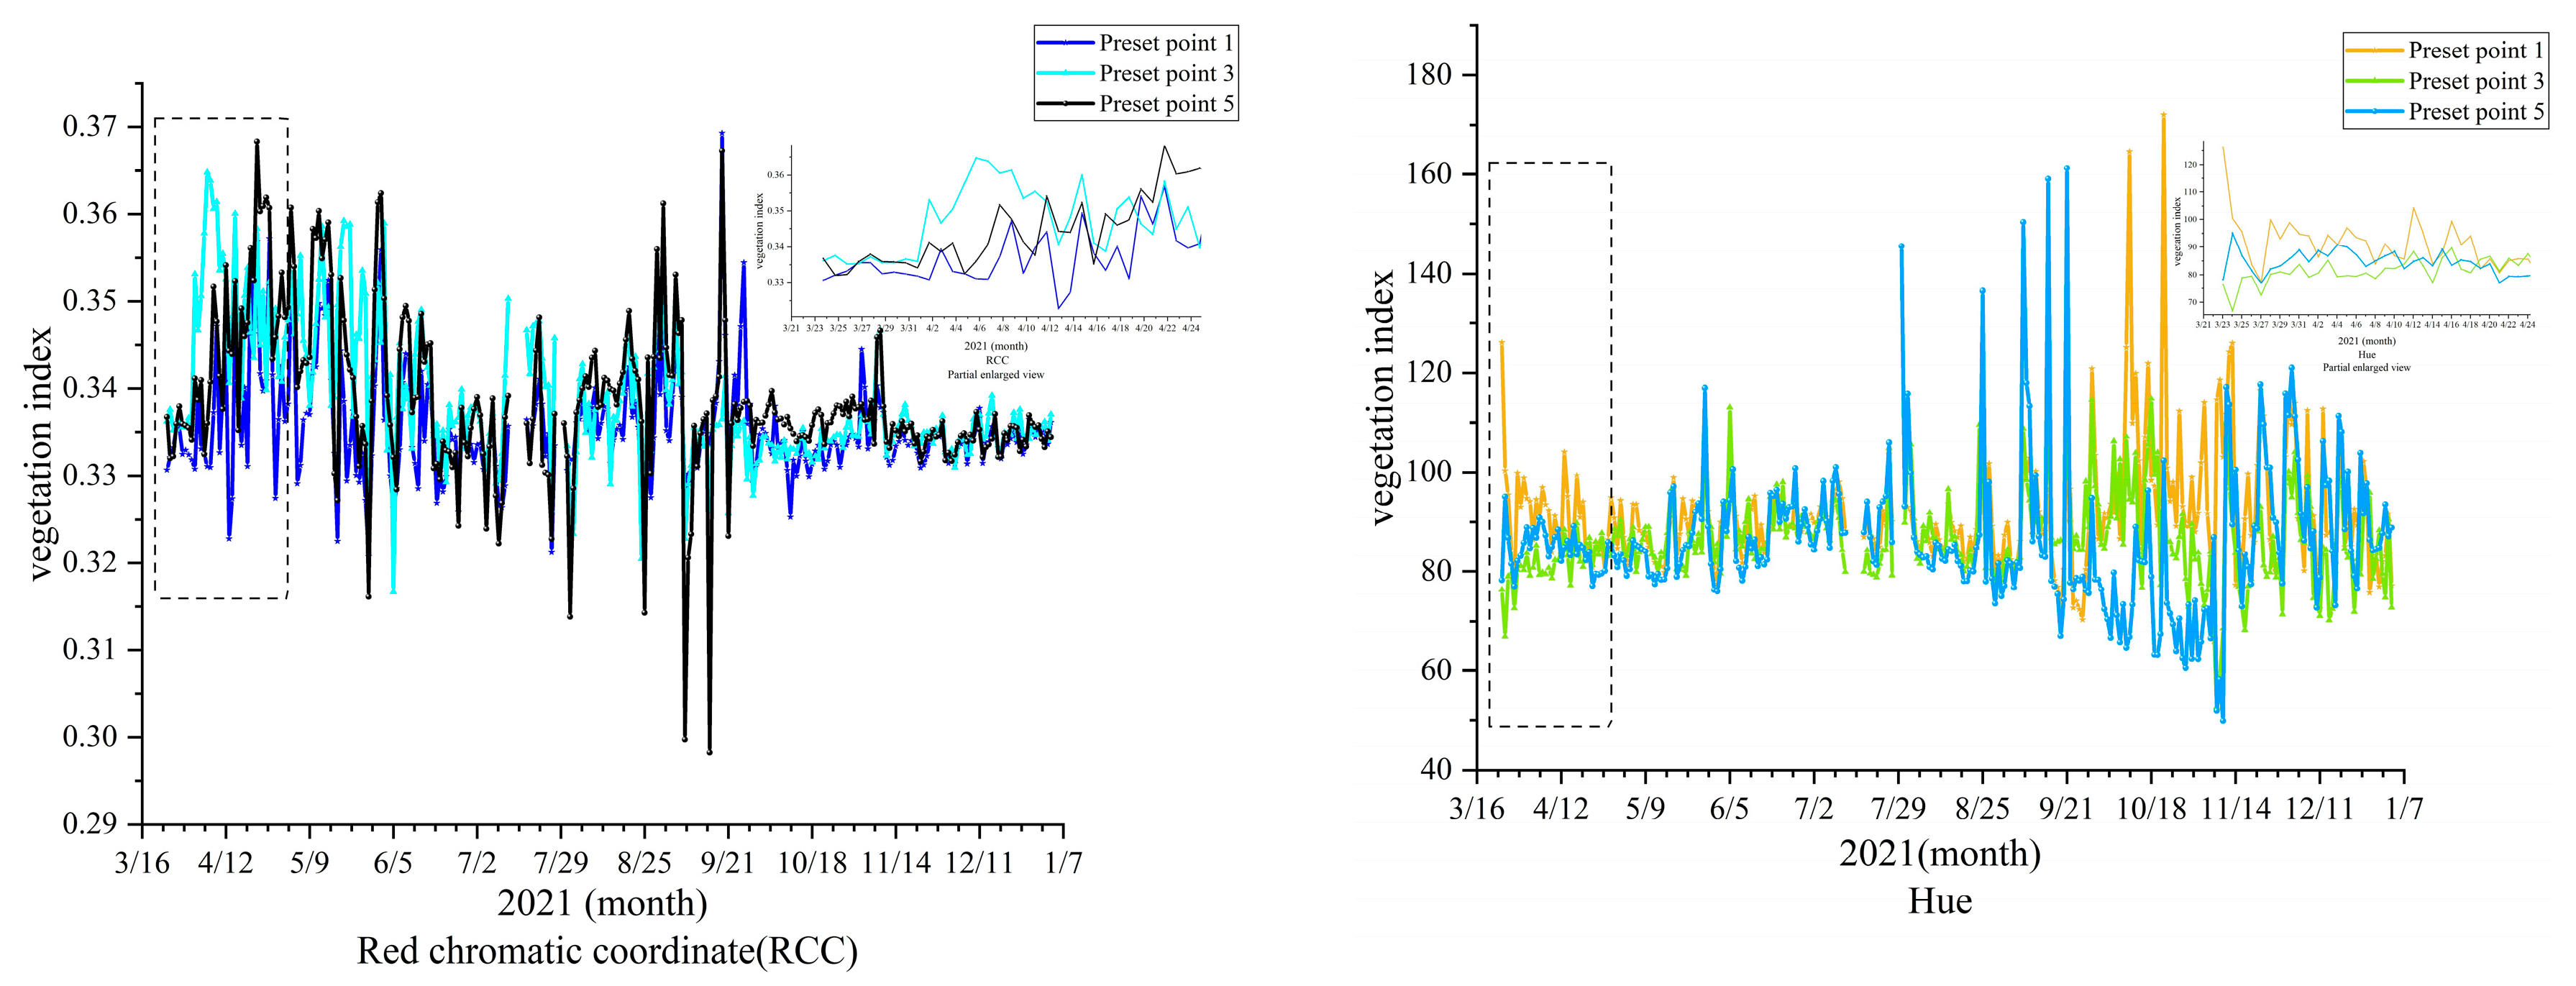
The ROI of the trees was extracted from six colors of vegetation indices, demonstrating that the ratio greenness index (GGR), green chromatic coordinate (GCC), green red vegetation index (GRVI), and green excess index (GEI) were able to reflect the whole process of growth and withering, as indicated in Figure 7.
Figure 7 shows that the entire growth process corresponds to five stages of vegetation phenology: The first stage is the leaf bud expansion stage, and the corresponding GGR, GCC, GRVI, and GEI all show a gentle recursion trend; the second stage is the leaf bud blossom stage, and the corresponding GGR, GCC, GRVI, and GEI all show a rapidly rising trend; the third stage is the leaf spreading period, and the corresponding GGR, GCC, GRVI, and GEI all gradually reach the peak trend; the fourth stage is the leaf discoloration period, and the vegetation index remains relatively stable and only fluctuates slightly, representing a healthy growth trend; the fifth stage is the abscission period, which corresponds to the period when GGR, GCC, GRVI, and GEI begin to drop significantly to the lowest value. When the above four vegetation indexes are at their lowest value, the (RCC) shows the opposite trend. HUE was generally stable throughout the year.

Partial Enlargement of the Same Vegetation Index at Different Preset Points

The overall curves of RCC and HUE remained stable, indicating that the normal growth of 
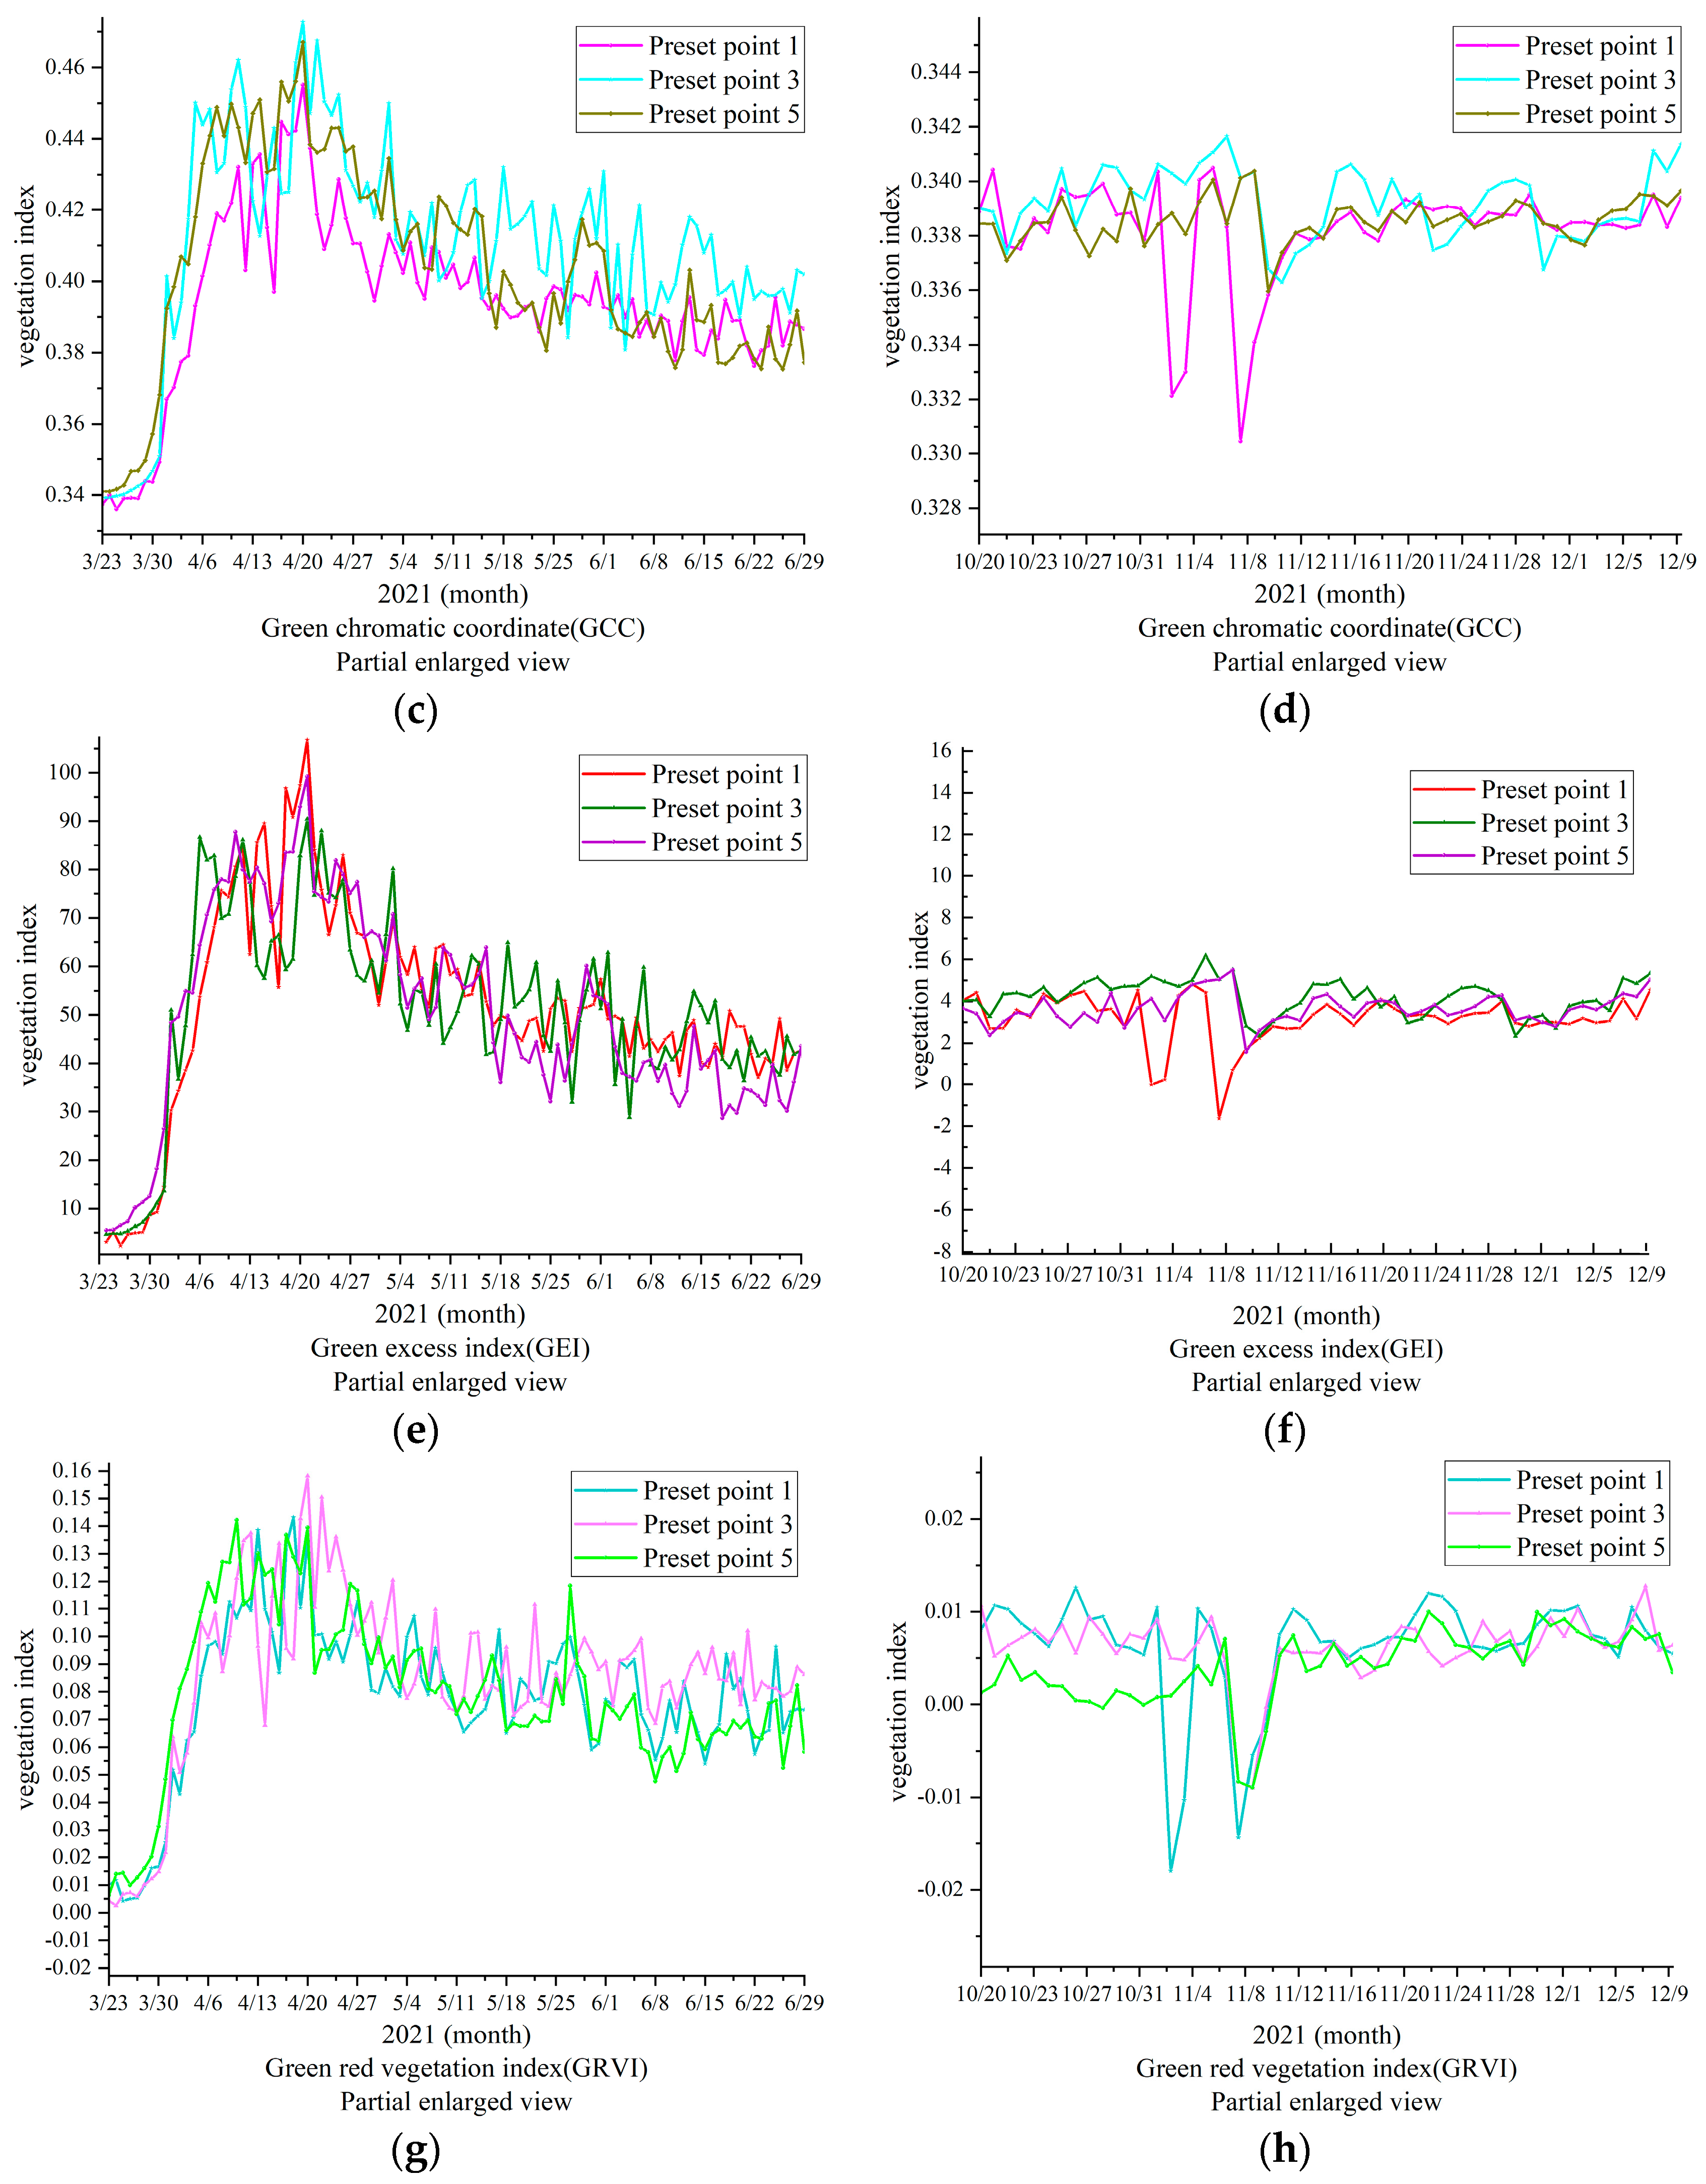
P. tomentosa B301 in the stand was not severely damaged by the natural environment. To observe the growth trend, GGR, GCC, GRVI, GEI and four vegetation indices with distinct trend characteristics were selected for enlarged observation and analysis, as shown in Figure 8.
In Figure 8, the ROIs of the three methods of cultivation are shown, revealing significant changes in GGR, GCC, GRVI, and GEI. The start of growing season was set as the shooting time (for reference only). Rain fed (preset point 1) reached its growth peak (MOE) 2 days earlier than DIFI (preset point 3) and BIFI (preset point 5) GGR, whereas leaves withered and fell (EOS) almost 6 days before DIFI and BIFI for CK (preset point 1), according to the GRVI. The GCC was used to define the peak time (MOE) of the three groups.
Figure 8 shows that different irrigation methods and irrigation volumes affect the growth and withering of P. tomentosa B301, indirectly reflecting that different irrigation methods in the same forest stand cause different micro-ecological environments and increase the severity of diseases and insect pests in the area around the trees, corresponding to the differences in withering speed and color of planted forests.

3.3. Growth Response of P. Tomentosa B301 under Different Irrigation Methods and Irrigation Volumes

According to the results, the change trend of the four vegetation indices was consistent, showing a single peak curve change that first increased, then stabilized, and then finally decreased, whereas the RCC showed the opposite trend. Although they all conformed to the change of growth phenology, there were differences in the peak appearance time and the withering time. It was found that the trend of the vegetation index in the overall growth season aligned with the observations. The changing amplitude of the four vegetation indices was the highest, whereas GGR and GRVI had the highest consistency with GCC, being similar to GEI. However, the amplitude of GCC was higher than that of GEI; therefore, GCC was selected to analyze the phenology of growth changes (Figure 9).
In Figure 9, the high amplitude of the changes in GCC shows the minute changes more clearly; therefore, the partially enlarged drawing obtained before completion of the full irrigation on June 28 was selected for analysis. By comparison of Figure 9a–c, it can be observed that DIFI (preset point 3) was irrigated earlier and more frequently than CK (preset point 1); therefore, DIFI’s increase was greater than that of CK. Similarly, the irrigation time of BIFI (preset point 5) was earlier than that of CK, and its irrigation volume was higher; therefore, BIFI’s increase was greater. However, BIFI’s irrigation volume was higher than that of DIFI; therefore, its growth efficiency was higher. In combination with Figure 9d, it can be observed that when the tree species began to spread its leaves, BIFI’s irrigation volume was higher than the precipitation of DIFI and CK; therefore, BIFI had the greatest increase, followed by DIFI and CK. This indicates that full furrow irrigation is able to provide an adequate water supply that is more conducive to early growth. The irrigation water gradually met the growth needs of the trees. It can be observed from the data in Figure 2 and Figure 3 that the overall irrigation volume of DIFI was lower than that of BIFI, but DIFI increased faster than BIFI, and then more gradually before reaching its growth peak. The vegetation index was higher than 0.01 (Table 3). This may be caused by the microorganisms and environmental pathogens, which grew without limitation and absorbed the nutrients in BIFI. DIFI inhibited the growth of bacteria, diseases, and insect pests in the microbial environment. Compared with BIFI, DIFI was adopted to reduce the waste of water resources, and it was more conducive to the growth of the tree species. In summary, the overall moisture contents of DIFI and BIFI were found to be higher than that of CK, and their growth rate was faster, indicating that the moisture was of greater significance to the growth of the tree species than other factors. After reaching the growth peak, the overall trend of DIFI was more stable than that of BIFI, which indirectly shows that the growth environment in the DIFI area was healthier.

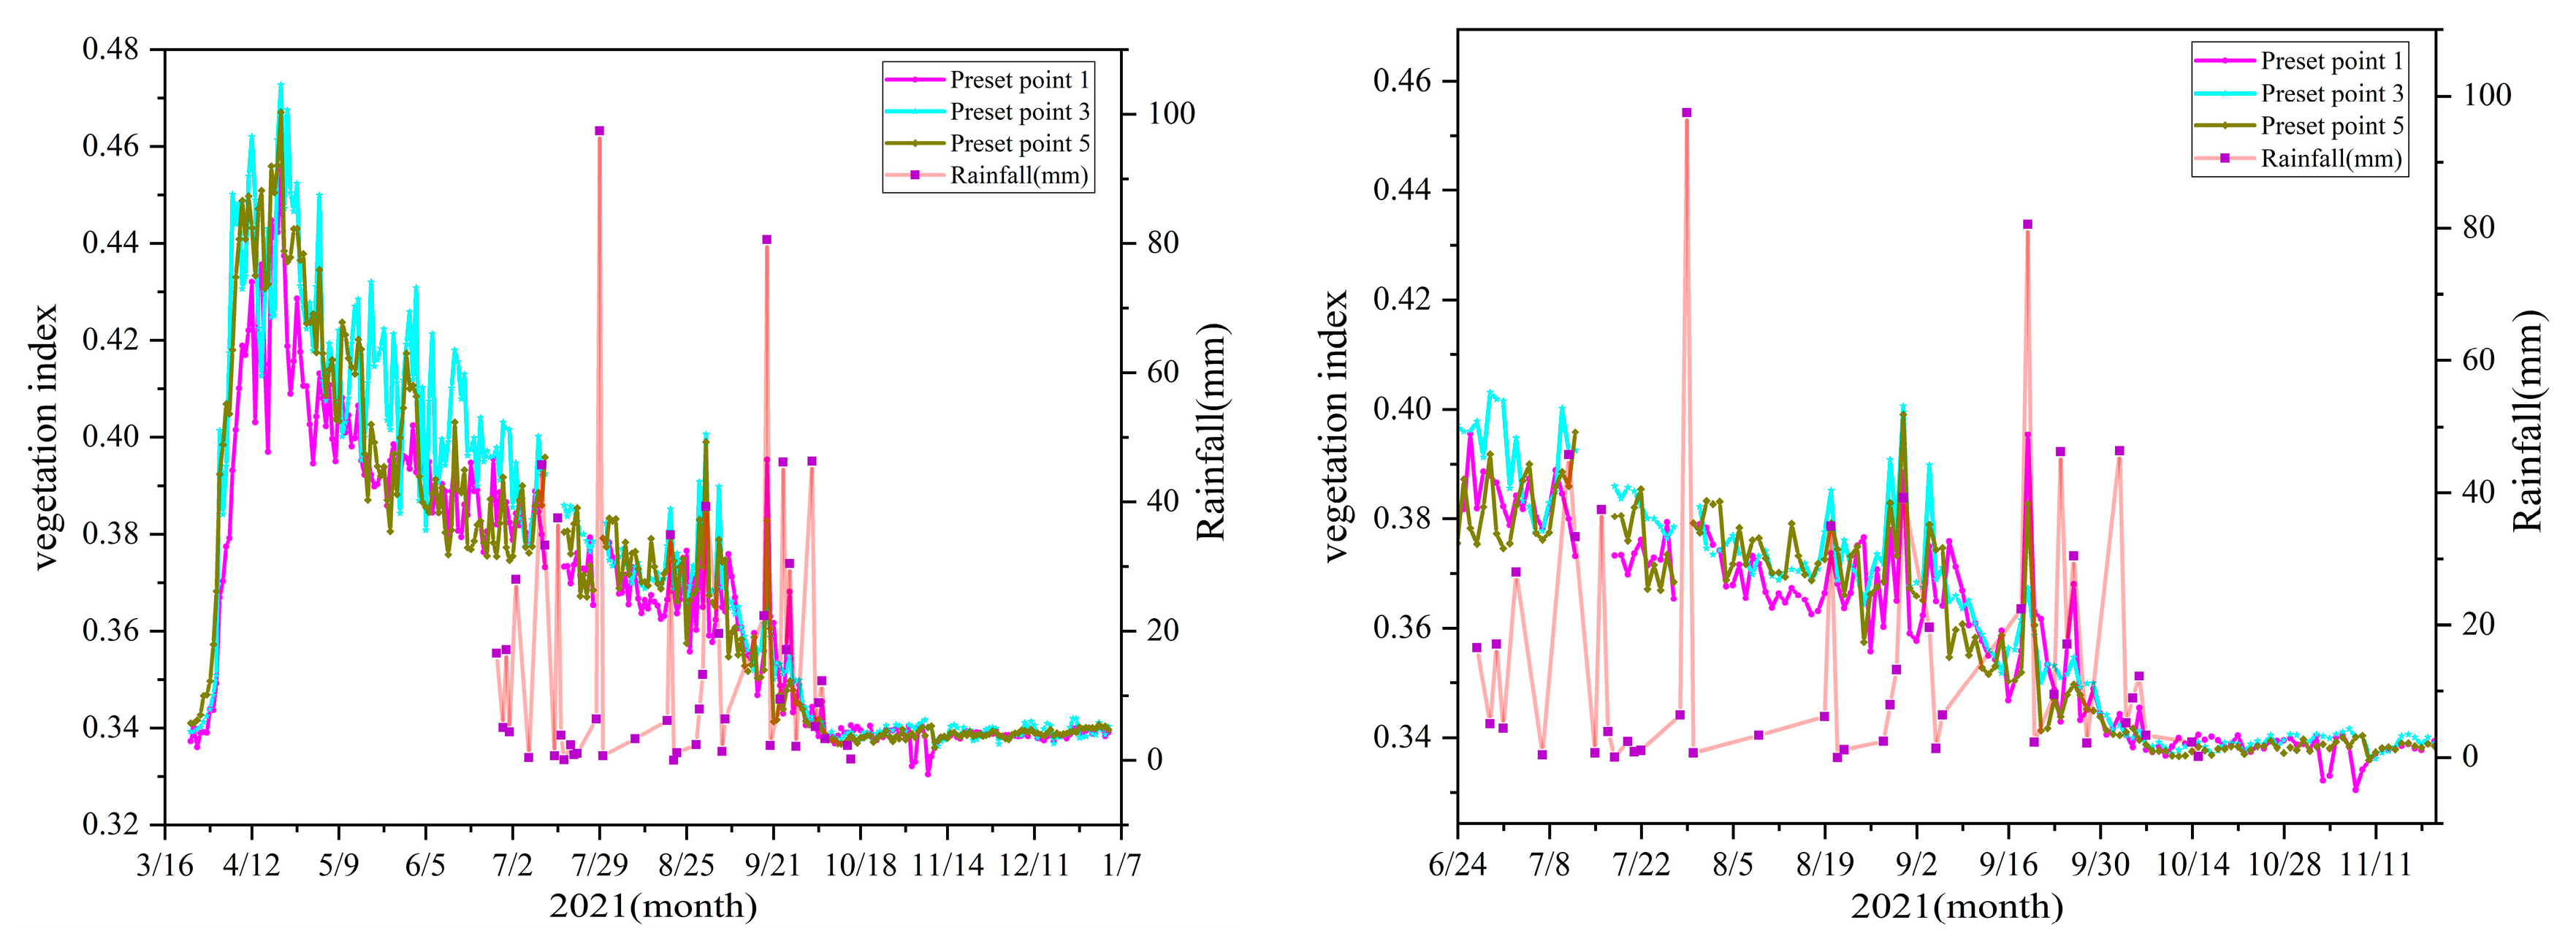
3.4. Impact of Precipitation on Growth during the Rainy Season

On 29 June, the BIFI and DIFI experiments were completed, and it was found that the growth changes in the trees exhibited variation in the rainy season, as shown in Figure 10.
From 24 June to 22 July, DIFI (preset point 3) continued to present the highest vegetation index, and BIFI (preset point 5) was lower than CK (preset point 1) due to there being less precipitation. When there was abundant precipitation during the rainy season (reaching 97.4 mm on 29 July), BIFI was higher than DIFI and the vegetation index at preset point 1 for a short period. From 19 August to 2 September, the precipitation was less and frequent, and the earlier period of DIFI adapted to the growth status of adequate drip irrigation, and was higher than BIFI and CK. From September 2 to 9, the precipitation was lower and irregular in the early period and the vegetation index for DIFI was higher than that of CK, but DIFI did not adapt to the changes in the new environment. CK grew with no interference, and, therefore, was better adapted to the external environment, growing more than DIFI. Due to there being less precipitation, along with the growth of surrounding microorganisms, BIFI had lower average soil moisture content in the shallow soil layer. The vegetation index decreased and was lower than that obtained for DIFI. On 16 September, the precipitation increased suddenly and the vegetation index for CK was significantly higher than the data for DIFI. In addition, the precipitation was higher than 80.6 mm, and the average soil moisture content increased; therefore, the vegetation index of BIFI was higher than that of DIFI, but lower than that of CK. Compared with DIFI and BIFI, the tree species under CK were better able to adapt to the changes in the external environment during the normal rainy reason. High precipitation affected the growth changes under BIFI. From 17 September to October, the precipitation was lower than 50 mm and was frequent. The overall trend of the CK vegetation index was higher than DIFI and BIFI. Due to there being less precipitation, the BIFI index was lower than that for DIFI.
The leaves of the trees gradually withered from 21 October to 14 November, as they entered the abscission period. Due to the water shortage in the early period, the CK trees grew quickly during the rainy reason; therefore, their leaves fell earlier. Although its water content was sufficient in the early period, the BIFI trees experienced serious diseases and breeding of pests in the surrounding environment that absorbed the nutrients. In addition, the overall precipitation in the rainy season was lower than the irrigation volume in the early period; therefore, the growth changes in BIFI trees were blocked, and their withering was accelerated. The overall precipitation in the growing environment of DIFI was relatively stable. The vegetation index of DIFI (preset point 3) was higher than those of CK (preset point 1) and BIFI (preset point 5) until the end of withering. From 15 November to 3 January, colder air was prevalent. All leaves fell naturally until the end of the vegetation growth season. The digital image presented only the trunk color, and the vegetation indices for the CK, DIFI and BIFI trees were stable.

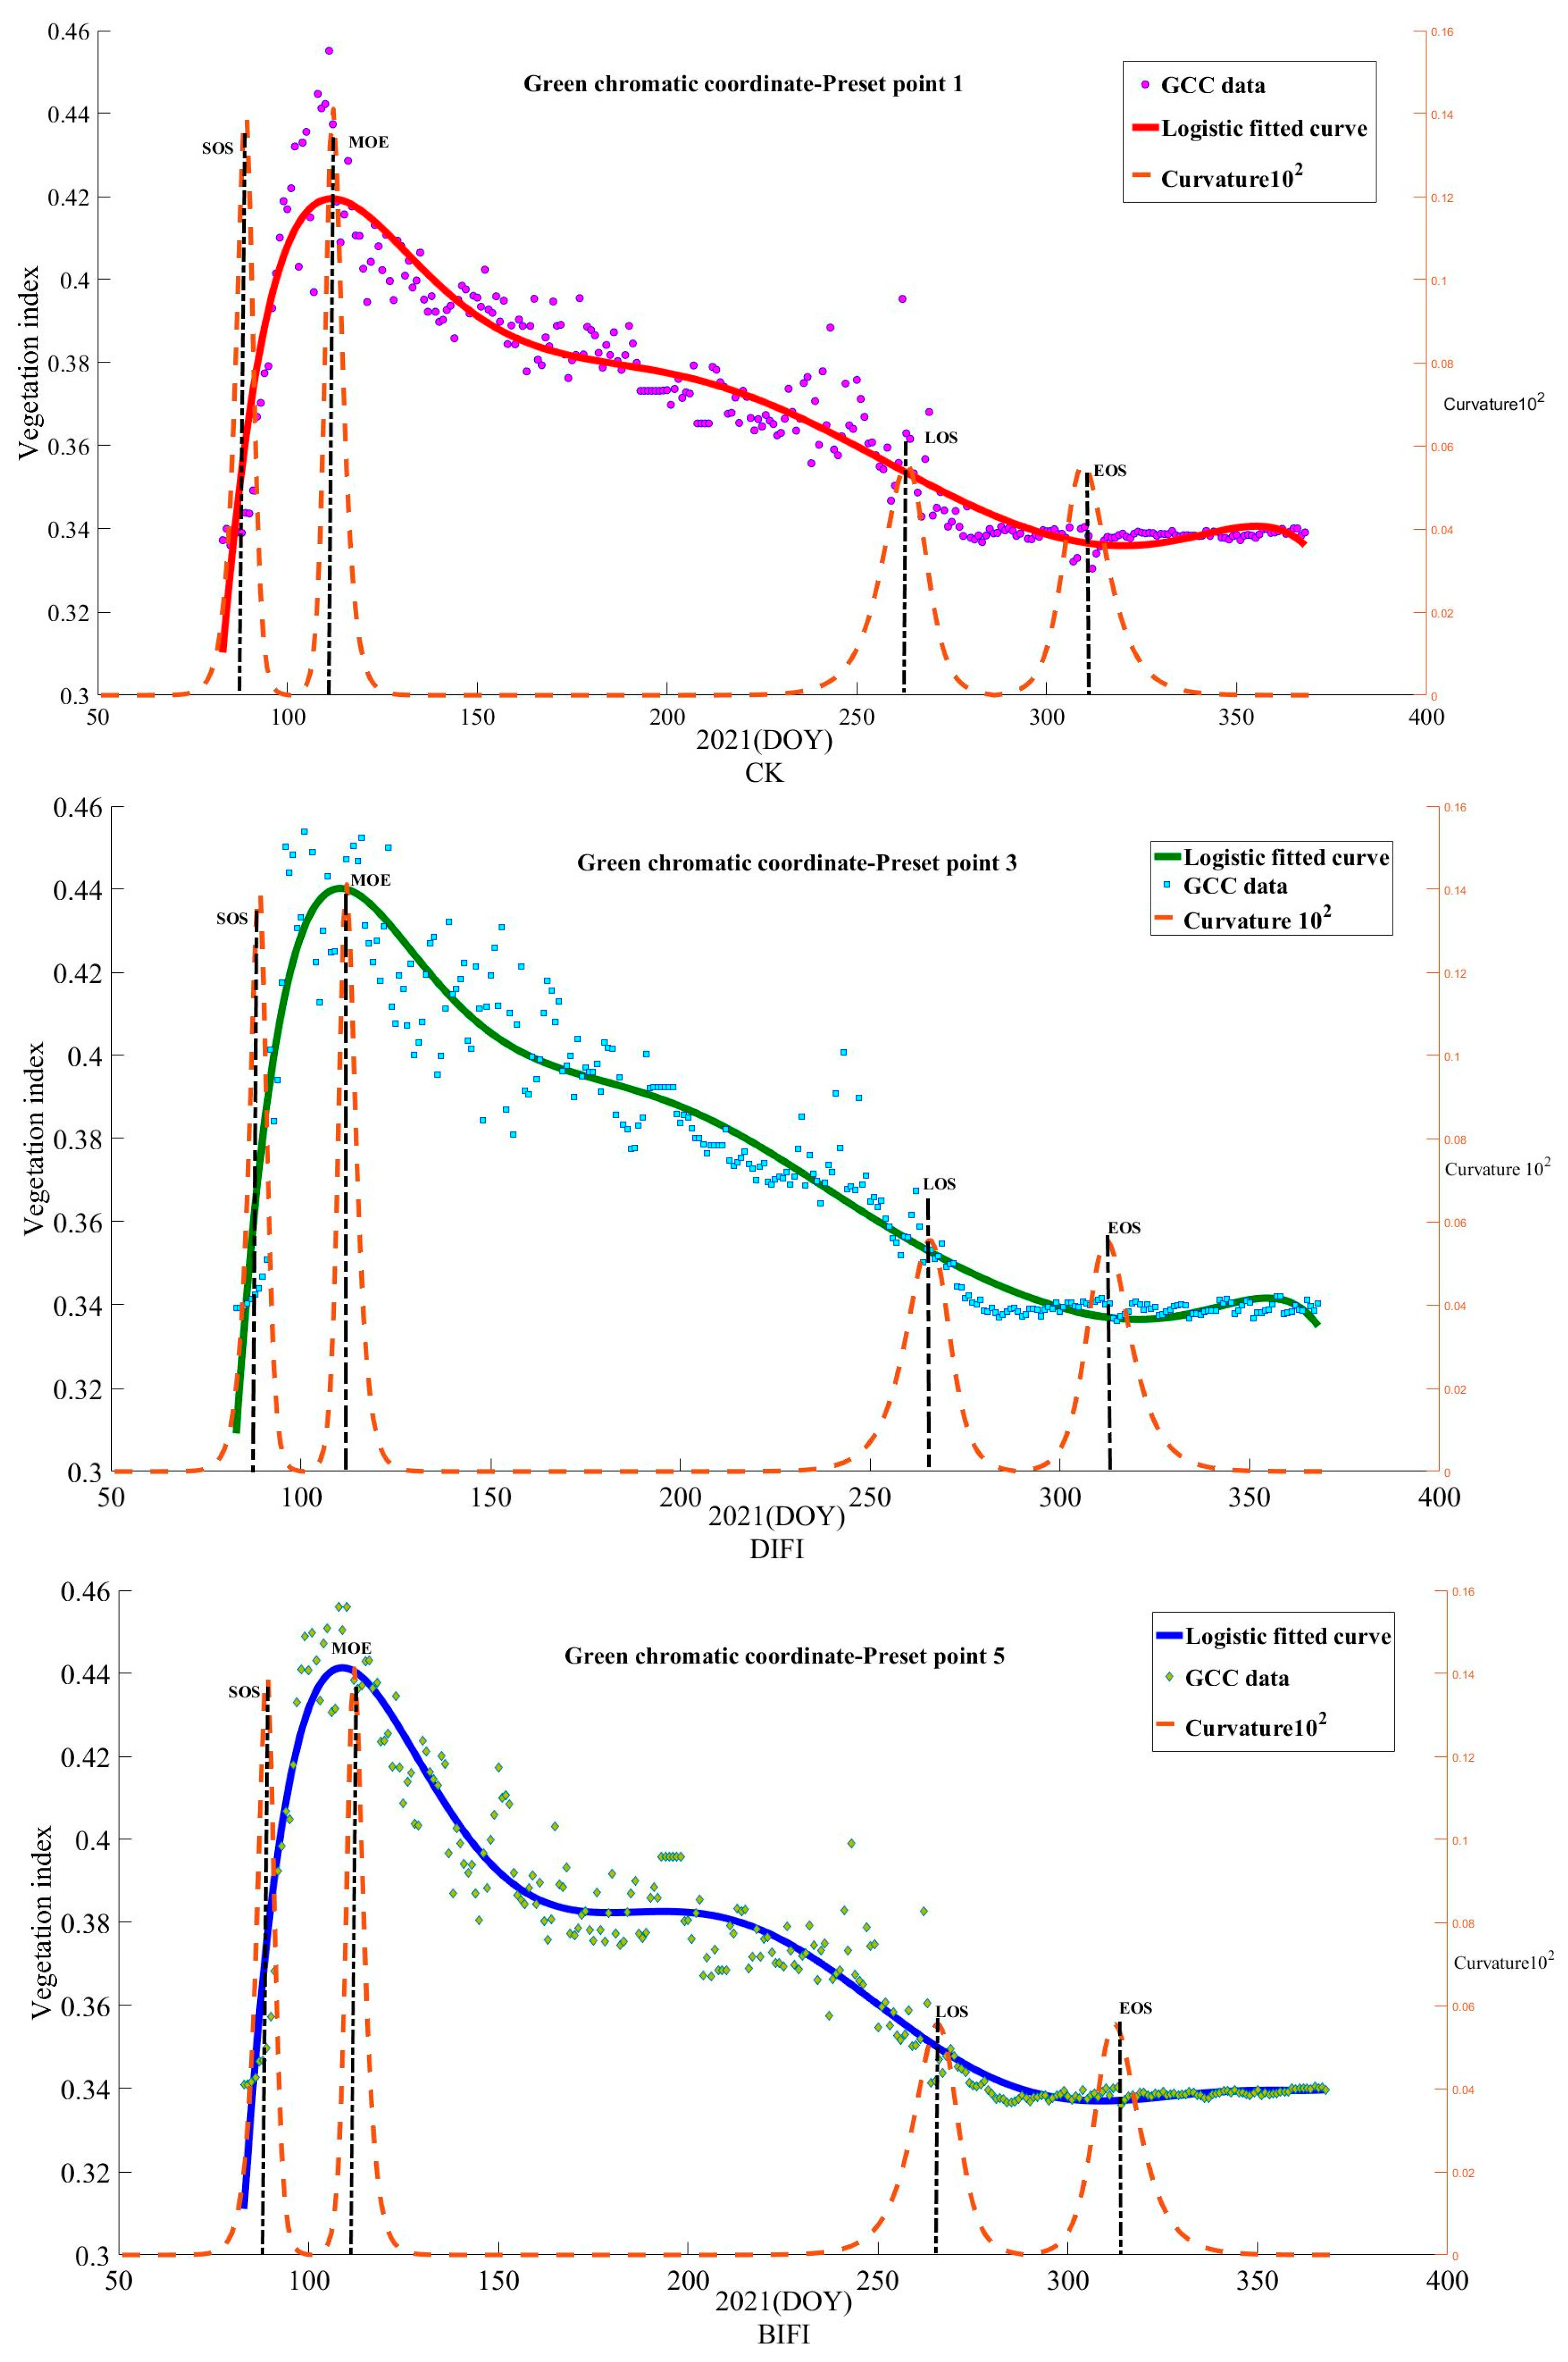
3.5. Fitting of the Vegetation Growth Data Curve and Extraction of the Growth Feature Time Nodes

The time-series data of the plant phenology index reflected the growth and development cycle of the plants, and the fluctuation represented the growth and withering in the development cycle. In general, the wave crest corresponded to the different periods in growth and development. The D-L and the curvature maximum method were applied, and Equations (2) and (3) were adopted to fit the GCC growth curve of the trees in the three modes. According to the characteristic curves of the extracted indices, the critical growth period of the trees was obtained, namely the SOS, EOS, and MOE, as shown in Figure 11.
From Figure 11, it can be seen that from day 87 to 100, CK (preset point 1) increased sharply. Due to insufficient precipitation, the overall growth vegetation index was at its lowest. The period from day 137 to 187 was the leaf bud blossom stage with normal growth. Due to the decreased precipitation, the leaf spreading rate gradually accelerated. The period from day 187 to 237 was the leaf spreading stage. Due to the lower but frequent precipitation, CK accelerated gradually from a slow rate. The period from day 237 to day 287 was the leaf discoloration stage. Due to the frequent precipitation and increased rain capacity, the rate accelerated. The period from day 287 to day 350 was the abscission stage, and the leaves fell off quickly. From day 87 to day 100, DIFI (preset point 3) grew quickly. Due to the sufficient irrigation volume, the vegetation growth index was relatively high in the leaf bud expansion stage. The period from day 137 to day 187 was the leaf bud blossom stage, and the leaf spreading rate gradually increased. The period from day 187 to day 237 was the leaf expansion stage. Due to the lower but frequent precipitation in the rainy season, preset point 3 maintained quick growth. The period from day 237 to day 287 was the leaf discoloration stage. Due to the lower but stable precipitation, the growth curve decreased slowly. The period from day 287 to day 350 was the abscission stage, and the leaves fell off gradually. From day 87 to 100, BIFI (preset point 5) grew quickly. Due to the sufficient irrigation volume, the vegetation growth index was relatively high in the leaf bud expansion stage. The period from day 137 to day 187 was the leaf bud blossom stage, and the leaf expansion rate gradually slowed, which may be affected by the plant diseases and insect pests that were evident. The period from day 187 to 237 was the leaf expansion stage. Due to the full furrow irrigation before the normal rainy season with precipitation below 60 mm, the leaf spreading was relatively slow. From day 237 to 287, trees entered the leaf discoloration stage. Due to precipitation being less than 60 mm, BIFI had an accelerated growth rate. The period from day 287 to 350 was the abscission stage and the leaves fell off gradually.
In summary, the period from day 87 to day 100 was the leaf bud expansion stage and the value increased for three sides; however, the vegetation index in DIFI and BIFI was higher than the preset point 1 due to full irrigation. The period from day 137 to day 150 was the leaf budding stage, in which the change rate of BIFI was higher than DIFI and CK. The sufficient moisture of BIFI accelerated leaf budding. The leaf spreading rate of DIFI under full furrow irrigation was higher than CK with less precipitation. The tree was fully irrigated from day 150 to 200, and the growth rate of DIFI was higher than that of CK. Affected by the plant diseases and insect pests, BIFI developed gradually, and it was lower than CK. From day 200 to 250, full irrigation was completed, and the rainy season began. At the beginning, DIFI was higher than CK and BIFI, then BIFI gradually decreased due to the low precipitation. From day 250 to 300, precipitation was frequent and irregular, and the change rate of CK increased, whereas DIFI and BIFI decreased gradually.

Time Node Extraction of Vegetation Growth Characteristics

According to Formula (3), it was concluded that the SOS of the forest was the starting point of the rising slope of the curve, and the EOS was the lowest end of the curve. The start of the forest growth season under CK, DIFI and BIFI was the same as the chronological day at which the MOE was reached. As shown in Table 4, SOS and MOS were days 83 and 111, respectively. However, the EOS days were different. Before day 83, the trees were in a period of dormancy, GCC was affected by snowfall, and the overall trend was relatively stable. Affected by the temperature rise, the forest gradually began to germinate, the GCC index increased, and the vegetation growing season began. At day 111, the MOE was realized, and the relative GCC reached a high value. Around day 265, the withering stage began. As the temperature dropped, the forest activities weakened and the GCC decreased accordingly. The growing seasons of CK, DIFI and BIFI ended at days 307, 315 and 314, respectively. At this time, the value of GCC dropped to its lowest point. In addition, the leaves of the planted forest almost withered, returning the trees to their initial stable state. The trend remained unchanged.

4. Discussion

It was observed in this study that there were various changes in forest growth at different preset points of the planted forest. On the basis of the vegetation index data, the phenological change in P. tomentosa B301 varied under the different irrigation methods, which supports our initial hypothesis. To explain this phenomenon, six vegetation indices were analyzed in three groups of trees to select the most appropriate one. Next, the same vegetation indices were applied to study the phenological growth of all three groups. The impact of the rainy season on the trees was analyzed.
P. tomentosa B301 grows under different micro-ecological environments, so the chlorophyll produced varies. Additionally, it cannot be excluded that the external differences were affected by the selected preset points and the orientation of the camera obtaining the images. This variation may have been caused by the various irrigation methods, meaning that the P. tomentosa B301 was not able to absorb the nutrients evenly. However, all six selected vegetation indices were able to reflect the phenological growth phenomenon of the forest. It was found on the basis of comparison that GEI and GCC conformed to the law of the forest growth. In view of the amplitude, GCC is more appropriate for phenological studies of tree species. For example, it was found that, with respect to the sensitivity of the determination of leaf color index on the basis of digital photos, the hue was the most appropriate color index [34]. In a rubber plantation, measured results indicated that Sgreen and GEI showed a better relationship than hue and GPP [35]. In addition, some researchers have indicated that hue is not associated with GPP, and is susceptible to white balance. Therefore, RCC has been reported to be more suitable for estimating the abscission period of evergreen forest [36]. Liu et al. [37] applied RCC to trace the phenology of the canopy’s photosynthesis in the ENF ecosystem, and found it to be more efficient than GCC. Jiakun Teng et al. [38] surmised that GEI was more suitable for monitoring the seasonal variation of Robinia pseudoacacia, but GCC was not sensitive to seasonal changes in birch trees [39]. Consistent with our findings, previous studies have shown that the six color indices are able to reflect the phenological growth period with slight differences, and appropriate vegetation indices should be selected according to the ecosystem of the tree species studied.
This study found that, due to there being insufficient precipitation in March, the canopy’s vegetation index of trees at CK (preset point 1) was significantly lower than DIFI (preset point 3) and BIFI (preset point 5). Due to the large irrigation volume, the tree species with full furrow irrigation had the fastest growth rate in the leaf budding stage, followed by DIFI and CK. As the water contents gradually satisfied the growth demand, the irrigation volume increased, and the trees grew while absorbing nutrients. Therefore, the further growth rate would be higher than that of BIFI. This indirectly implies that DIFI is more advantageous than BIFI, which is supported by the work of others [40,41], who found that efficient irrigation was able to significantly improve stand growth. Additional studies also indicate that drip irrigation could improve water use efficiency when compared with other irrigation methods [42,43]. Before the rainy season began, the tree species at CK (preset point 1) always had the lowest growth rate. This further shows that sufficient water has a significant impact on the growth of the trees; therefore, improved irrigation could increase the productivity of planted forests [44]. In addition, different moisture treatments could influence soil diseases and insect pests, and therefore changes in vegetation phenology [45]. Fuchun Zhang [46] deemed that the main meteorological factor affecting the woody plant phenology in China was air temperature, and that precipitation and sunshine have relatively less impact. Wang Lianxi et al. believed that the temperature was the most important factor affecting phenological change, but that when water content becomes the stress factor, its influence on phenology is of great significance. Drought would delay the phenological period of plant development. When drought occurs, the plant is not able to use the light and heat, even if they meet the requirements for growth. Under such circumstances, water has become the main ecological factor affecting plant growth and development [47]. Valdés et al. [48] analyzed the phenology and soil temperature response in the Hengill geothermal area, Iceland, and observed that the phenotypic response of phenology toward global warming may often be the integration of a short-term plastic reaction and a long-term evolutionary response. Our research results indicate that changes in the phenological cycle could be reflected by monitoring the canopy vegetation index, and that the same vegetation index may show different performances under the three irrigation modes, because irrigation can affect the growth cycle changes in the forest. Therefore, it can be inferred from this study that sufficient water content can influence the phenological change of tree plantations.
When the precipitation was greater than 60 mm, the growth rate was accelerated significantly under BIFI (preset point 5), while the growth rate may decrease in DIFI (preset point 3). In contrast, when the precipitation was lower than 60 mm, the growth rate under DIFI (preset point 3) was faster than that under BIFI (preset point 5). In the rainy season, different levels of precipitation may affect the original growth environment. For example, Chao et al. [49] found that, compared with air temperature, vegetation index was more sensitive to precipitation. Bai et al. [50] found that precipitation influenced vegetation density and above-ground biomass. The results of Yang [51] showed that precipitation could change the soil temperature and salinity, thus affecting vegetation change and the ecological environment. It was found in this study that precipitation was frequent and irregular in the later period of the rainy season. CK (preset point 1) had the highest growth change rate, followed by DIFI (preset point 3) and BIFI (preset point 5). This study showed that precipitation affects the growth and phenological change of the forest plantations of P. tomentosa B301, which is consistent with other studies.
Using near-earth remote sensing images with respect to P. tomentosa B301, in summary: (1) The data of the six vegetation indices was slightly different, and the same vegetation index was extracted for three different types of cultivation for analysis. On the basis of comparison, it could be observed that GCC was more aligned to the phenological growth laws of the species. The vegetation index of the tree species cultivated in three different ways showed various different effects; (2) The changes in phenological growth of P. tomentosa B301 cultivated using the three different methods were different when analyzing the GCC vegetation index. Sufficient water and different irrigation methods affected the growth of P. tomentosa B301. It was proved that different irrigation methods directly affect changes in the growth and phenology of P. tomentosa B301 [52], indicating that the DIFI trees were more suitable in another aspect for achieving increased production than the BIFI trees; (3) In the rainy season, precipitation leads to different results for the P. tomentosa B301 species cultivated in three different ways, where there are different responses with precipitation, and CK (preset point 1) adapts better to changes in the external environment; (4) The phenology of Populus tomentosa B301 can be well monitored using near-earth remote sensing images

5. Conclusions

With respect to P. tomentosa B301, our research results show that all six vegetation indices were able to reflect the phenological growth law, but there were slight differences among them. To represent the growth conditions objectively in the process of phenological analysis, GCC and GEI were selected to show the seasonal changes in the vegetation. However, the amplitude of variation in GCC is relatively large, so it was deemed to be more suitable for accurately studying P. tomentosa B301. Under sufficient water conditions, the overall vegetation index of P. tomentosa B301 under DIFI (preset point 1) was higher, and the withering process was relatively short. BIFI (preset point 5) performed rapidly in the early stage and gradually slowed during the later stage. The amplitude of variation of the vegetation value was large. This indicates that the irrigation results of DIFI were better than those of BIFI, and that DIFI was more conducive to the growth of P. tomentosa B301 after reducing the waste of water resources. Additionally, the irrigation methods exert different degrees of damage due to diseases and insect pests on P. tomentosa B301. Furthermore, this indicates that sufficient water is more conducive to the growth and development of planted forests than rain fed (preset point 1). In the rainy season, the high precipitation could improve the growth rate of P. tomentosa B301 in the BIFI area, but the growth rate decreased for this tree species in the DIFI area. Conversely, low precipitation was able to increase the growth rate of P. tomentosa B301 in the DIFI area. In view of the irregular follow-up and low precipitation, the tree species under CK (preset point 1) had better development, indicating that vegetation with rain-fed irrigation (preset point 1) was better able to adapt to changes in the environment. Overall, precipitation had different impacts on P. tomentosa B301 in the DIFI and BIFI areas. From the perspective of long-term development, monitoring forest phenology using near-earth remote sensing images using scientific cultivation modes could improve productivity.
This study provides corresponding scientific measurements for precision irrigation, nutrient supply and pest prevention, forms an information system while reducing material waste and financial cost, provides a feasible way to study the relationship between seasonal changes in vegetation communities and different health factors, and provides an effective means to diagnose the seasonal evolution characteristics of artificial forests and the rapid response of ecosystems to climate change on local, regional and global scales.

Author Contributions

Conceptualization, P.G.; methodology, P.G. and L.Z.; formal analysis, P.G.; investigation, P.G., Y.L., Y.G. and Y.W.; writing—original draft preparation, P.G.; writing—review and editing, P.G., Y.Z., B.X. and G.L.; supervision, Y.Z. All authors have read and agreed to the published version of the manuscript.

Funding

This work is supported by The National Key Research and Development Program of China (2021YFD2201203) and The Fundamental Research Funds for the Central Universities (2021ZY74).

Data Availability Statement

All data will be available on request.

Conflicts of Interest

The authors declare no conflict of interest.

References

  1. Schwartz Mark, D. The phylogeny of The Canterbury Tales. Green-Wave Phenol. Nat. 1998, 394, 839–840. [Google Scholar] [CrossRef]
  2. Lu, P.; Yu, Q.; He, Q. Responses of plant phenology to climatic change. Acta Ecol. Sin. 2006, 26, 923–929. [Google Scholar] [CrossRef]
  3. Zhou, Y. Asymmetric Behavior of Vegetation Seasonal Growth and the Climatic Cause: Evidence from Long-Term NDVI Dataset in Northeast China. Remote Sens. 2019, 11, 2107. [Google Scholar] [CrossRef] [Green Version]
  4. Dai, W.J.; Jin, H.Y.; Zhang, Y.H.; Zhou, Z.Q.; Liu, T. Advances in plant phenology. Acta Ecol. Sin. 2020, 40, 6705–6719. [Google Scholar] [CrossRef]
  5. Ma, T.; Zhou, C. Climate-associated changes in spring plant phenology in China. Int. J. Biometeorol. 2012, 56, 269–275. [Google Scholar] [CrossRef]
  6. Zhai, J.; Yuan, F.; Wu, J. Research progress on vegetation phenological changes. Chin. J. Ecol. 2015, 34, 3237–3243. [Google Scholar] [CrossRef]
  7. Fei, M.O.; Hong, Z.H.A.O.; Wang, J.; Qiang, S.; Zhou, H.; Wang, S.; Xiong, Y. The Key issues on plant phenology under global change. Acta Ecol. Sin. 2011, 31, 2593–2601. [Google Scholar]
  8. Keller, F.; Körner, C. The role of photoperiodism in alpineplant development. Arct. Antarct. Alp. Res. 2003, 35, 361–368. [Google Scholar] [CrossRef]
  9. Hou, M.; Yan, X. Detecting Vegetation Phenological Changes in Response to Climate in Eastern China. Adv. Meteorol. Sci. Technol. 2012, 2, 39–47. [Google Scholar] [CrossRef]
  10. Oliver, S.; Koen, H.; Cory, T.; Young, A.M.; Mark, F.; Bobby, H.B.; Thomas, M.; John, O.; Andrew, R. Digital repeat photography for phenological research in forest ecosystems. Agric. For. Meteorol. 2012, 152, 159–177. [Google Scholar] [CrossRef]
  11. Liu, F.; Wang, X.; Wang, C. Autumn phenology of a temperate deciduous forest: Validation of remote sensing approach with decadal leaf-litterfall measurements. Agric. For. Meteorol. 2019, 279, 107758. [Google Scholar] [CrossRef]
  12. Zhou, Y.K. Comparative study of vegetation phenology extraction methods based on digital images. Prog. Geogr. 2018, 37, 1031–1044. [Google Scholar] [CrossRef]
  13. Zhou, L.; He, H.; Zhang, L.; Sun, X.; Shi, P.; Ren, X.; Yu, G. Simulations of phenology in alpine grassland communities in Damxung, Xizang, based on digital camera images. Chin. J. Plant Ecol. 2012, 36, 1125–1135. [Google Scholar] [CrossRef]
  14. Ahrends, H.E.; Robert, B.; Reto, S.; Jürg, S.; Pavel, M.; Francois, J.; Heinz, W.; Werner, E. Quantitative phenological observations of a mixed beech forest in northern Switzerland with digital photography. J. Geophys. Res. 2008, 113, 1–11. [Google Scholar] [CrossRef] [Green Version]
  15. Zhou, Y. Greenness Index from Phenocams Performs Well in Linking Climatic Factors and Monitoring Grass Phenology in a Temper-ate Prairie Ecosystem. J. Resour. Ecol. 2019, 10, 481–493. [Google Scholar] [CrossRef]
  16. Liu, F.; Wang, K.-C.; Wang, X.-C. Application of near-surface remote sensing in monitoring the dynamics of forest canopy phenology. Chin. J. Appl. Ecol. 2018, 29, 1768–1778. [Google Scholar] [CrossRef]
  17. Chen, X.; Zhang, F. Spring phonological Change in Beijing in the Last 50 Years and Its Response to the Climatic Changes. Agricultural 2001, 22, 1–5. [Google Scholar] [CrossRef]
  18. Walker, M.D.; Ingersoll, R.C.; Webber, P.J. Effets of interannual climate variation on phenology and growth of two alpines forbs. Ecology 1995, 76, 1067–1083. [Google Scholar] [CrossRef]
  19. Lampe, M.G.; Bergeron, Y.; McNeil, R.; Leduc, A. Seasonal flowering and fruiting patterns in tropical semi-arid vegetation of northeastern Venezuela. Biotropica 1992, 24, 64–76. [Google Scholar] [CrossRef]
  20. Savé, R.; de Herralde, F.; Aranda, X.; Pla, E.; Pascual, D.; Funes, I.; Biel, C. Potential changes in irrigation requirements and phenology of maize, apple trees and alfalfa under global change conditions in Fluvià watershed during XXIst century: Results from a modeling approximation to watershed-level water balance. Agric. Water Manag. 2012, 114, 78–87. [Google Scholar] [CrossRef]
  21. Xi, B.; Li, G.; Mark, B.; Jia, L. The effects of subsurface irrigation at different soil water potential thresholds on the growth and transpiration of Populus tomentosa in the North China Plain. Aust. For. 2014, 77, 159–167. [Google Scholar] [CrossRef] [Green Version]
  22. Zheng, S.K. High Yield Cultivation of Poplar; Golden Shield Press: Beijing, China, 2006. (In Chinese) [Google Scholar]
  23. Li, D.; Xi, B.; Tang, L.; Feng, C.; He, Y.; Zhang, Y.; Liu, L.; Liu, J.; Jia, L. Patterns of Soil Water Movement in Drip-Irrigated Young Populus tomentosa Plantations on Sandy Loam Soil and Their Simulation. Sci. Silvae Sin. 2018, 54, 157–168. [Google Scholar] [CrossRef]
  24. Xi, B.; Clothier, B.; Coleman, M.; Duan, J.; Hu, W.; Li, D.; Di, N.; Liu, Y.; Fu, J.; Li, J.; et al. Irrigation management in poplar (Populus spp.) plantations: A review. For. Ecol. Manag. 2021, 494, 119330. [Google Scholar] [CrossRef]
  25. Zhu, Z.; Lin, H.; Kang, X. Studies on allotripl breeding of populus Tomentosa B301clones. Sci. Silvae Sin. 1995, 31, 499–505. Available online: http://www.linyekexue.net/CN/Y1995/V31/I6/499 (accessed on 12 July 2021).
  26. Xi, B.; Bloomberg, M.; Watt, M.S.; Wang, Y.; Jia, L.M. Modeling growth response to soil water availability simulated by HYDRUS for a mature triploid Populus tomentosa plantation located on the North China Plain. Agric. Water Manag. 2016, 176, 243–254. [Google Scholar] [CrossRef]
  27. Li, D.; Xi, B.; Wang, F.; Jia, S.; Zhao, H.; He, Y.; Liu, Y.; Jia, L. Patterns of variations in leaf turgor pressure and responses to environmental factors in Populus tomentosa. Chin. J. Plant Ecol. 2018, 42, 741–751. [Google Scholar] [CrossRef]
  28. Adamsen, F.J.; Pinter, P.J., Jr.; Barnes, E.M.; LaMorte, R.L.; Wall, G.W.; Leavitt, S.W.; Kimball, B.A. Measuring wheat senescence with a digital camera. Crop Sci. 1999, 39, 719–724. [Google Scholar] [CrossRef]
  29. Gillespie, A.R.; Kahle, A.B.; Walker, R.E. Color-enhancement of highly correlated images-channel ratio and ‘chromaticity’ transformation techniques. Remote Sens. Environ. 1987, 22, 343–365. [Google Scholar] [CrossRef]
  30. Woebbecke, D.M.; Meyer, G.E.; Von Bargen, K.; Mortensen, D.A. Color indices for weed identification under various soil, residue, and lighting conditions. Trans. ASAE 1995, 38, 259–269. [Google Scholar] [CrossRef]
  31. Kawashima, S.; Nakatani, M. An algorithm for estimating chlorophyll content in leaves using a video camera. Ann. Bot. 1998, 81, 49–54. [Google Scholar] [CrossRef] [Green Version]
  32. Joblove, G.H.; Greenberg, D. Color spaces for computer graphics. In Proceedings of the 5th Annual Conference on Computer Graphics and Interactive Techniques, New York, NY, USA, 23–25 August 1978; Volume 12, pp. 20–25. [Google Scholar]
  33. Xia, L.; Niu, Y.; Li, A.; Wu, S.; Wang, X. Discussion on the request and standard of Woody plant phenological observation. Shanxi Meteorol. Q. 2006, 75, 47–48. [Google Scholar]
  34. Nijland, W.; De Jong, R.; De Jong, S.M.; Wulder, M.A.; Bater, C.W.; Coops, N.C. Monitoring plant condition and phenology using infrared sensitive consumer grade digital cameras. Agric. For. Meteorol. 2014, 184, 98–106. [Google Scholar] [CrossRef] [Green Version]
  35. Zhou, R.; Zhang, Y.; Song, Q.; Lin, Y.; Sha, L.; Jin, Y.; Liu, Y.; Fei, X.; Gao, J.; He, Y.; et al. Relationship between gross primary production and canopy colour indices from digital camera images in a rubber (Hevea brasiliensis) plantation Southwest China. For. Ecol. Manag. 2019, 437, 222–231. [Google Scholar] [CrossRef]
  36. Yang, X.; Tang, J.; Mustard, J.F. Beyond leaf color: Comparing camera-based phenological metrics with leaf biochemical, biophysical, and spectral properties throughout the growing season of a temperate deciduous forest. J. Geophys. Res. Biogeosci. 2014, 119, 181–191. [Google Scholar] [CrossRef] [Green Version]
  37. Liu, Y.; Wu, C.; Sonnentag, O.; Desai, A.R.; Wang, J. Using the red chromatic coordinate to characterize the phenology of forest canopy photosynthesis. Agric. For. Meteorol. 2020, 285–286, 107910. [Google Scholar] [CrossRef]
  38. Teng, J.; Liu, Y.; Ding, M. The Evaluation of Efficiency of Color Metrics in Monitoring Robiuia Pseudoucuciu Phonology based on RUB images. Remote Sens. Technol. Appl. 2018, 33, 476–485. [Google Scholar] [CrossRef]
  39. Mikko, P.; Mika, A.; Kristin, B.; Pasi, K.; John, L.; Tatu, H.; Jouni, K.; Maiju, L.; Melih, T.C.; Sari, M.; et al. Networked web-cameras monitor congruent seasonal development of birches with phenological feld observations. Agric. For. Meteorol. 2017, 249, 335–347. [Google Scholar] [CrossRef] [Green Version]
  40. Xi, B.; Wang, Y.; Di, N.; Jia, L.M.; Li, G.D.; Huang, X.F.; Gao, Y.Y. Effects of soil water potential on the growth and physiological characteristics of Populus tomentosa pulpwood plantation under subsurface drip irrigation. Acta Ecol. Sin. 2012, 32, 5318–5329. [Google Scholar] [CrossRef] [Green Version]
  41. Xi, B.; Wang, Y.; Jia, L.M.; Bloomberg, M.; Li, G.D.; Di, N. Characteristics of fine root system and water uptake in a triploid Populus tomentosa plantation in the North China Plain: Implications for irrigation water management. Agric. Water Manag. 2013, 117, 83–92. [Google Scholar] [CrossRef]
  42. Bhunia, S.R.; Verma, I.M.; Sahu, M.P.; Sharma, N.C.; Balai, K. Effect of drip irrigation and bioregulators on yield, economics and water use of fenugreek (Trigonella foenum-graecum). J. Spices Aromat. Crops 2015, 24, 102–105. [Google Scholar]
  43. Li, J.; Li, Y.; Wang, J.; Wang, Z.; Zhao, W. Microirrigation in China: History, current situation and prospects. J. Hydraul. Eng. 2016, 47, 372–381. [Google Scholar] [CrossRef]
  44. Jia, L.M.; Xing, C.S.; Wei, Y.K.; Li, Y.A.; Yang, L. The growth and photosynthesis of poplar trees in fast-growing and high-yield plantations with subterranean drip irrigation. Sci. Silvae Sin. 2004, 40, 61–67. [Google Scholar] [CrossRef]
  45. Zhao, S.; Xing, H.; Yang, Q. Effect of regulated deficit irrigation in the vegetative growth stage on the growth of Panax notoginseng and the microenvironment of its root zone. J. Hunan Agric. Univ. (Nat. Sci.) 2019, 45, 92–96. [Google Scholar]
  46. Zhang, F. Effects of global warming on plant phenological everts in China. Acta Geogr. Sin. 1995, 50, 402–410. [Google Scholar] [CrossRef]
  47. Wang, L.; Chen, H.; Li, Q.; Yu, W. Research advances in plant phenology and clin ate. Acta Ecol. Sin. 2010, 30, 447–454. [Google Scholar]
  48. Valdés, A.; Marteinsdóttir, B.; Ehrlén, J.A. natural heating experiment: Phenotypic and genotypic responses of plant phenology to geothermal soil warming. Glob. Chang. Biol. 2018, 25, 954–962. [Google Scholar] [CrossRef] [Green Version]
  49. Luo, C.; Jiu, J.; Hu, H.; Li, K.; Qing, P. Response of vegetation index to climate change in Wushaoling Plateau of Qilian Mountains. Ecol. Sci. 2021, 40, 74–81. [Google Scholar] [CrossRef]
  50. Bai, W.; Hu, F.; Zhao, Y. Effect of Preciptatian on Vegetation Coverage and Aboveground Biomass in Alpine Meadow Grassland. J. Anim. Sci. Vet. Med. 2021, 40, 62–64. [Google Scholar] [CrossRef]
  51. Yang, Q. Influence of Rainfall on Vegetation Change and Ecological Environment in Source Region of Yellow River. Environ. Sci. Manag. 2021, 45, 146–151. [Google Scholar] [CrossRef]
  52. Li, M.; Li, G. Relationship between phenology of vegetation canopy and phenology of tree cambium in Helan Mountains, China. Chin. J. Appl. Ecol. 2021, 32, 495–502. [Google Scholar] [CrossRef]
Figure 1. Aerial photograph of the study location and Forest Farm.
Remotesensing 14 02844 g001
Figure 2. Schematic diagram of different irrigation methods in the test base:(a) Base experiment, (b) BIFI Irrigation map, (c) DIFI Irrigation map.
Remotesensing 14 02844 g002
Figure 3. Test equipment and installation site.
Remotesensing 14 02844 g003
Figure 4. Preset point location and region of interest:(Image taken by state owned forest farm of Gaotang County, Liaocheng City, Shandong Province).
Remotesensing 14 02844 g004
Figure 5. Variation of growing season in one year: (The experimental base was photographed in the state-owned forest farm of Gaotang County, Liaocheng City, Shandong Province, China).
Remotesensing 14 02844 g005
Figure 6. Rainfall data: (a) annual rainfall, (b) CK rainfall, (c) DIFI irrigation volume and duration, (d) BIFI irrigation volume and duration.
Remotesensing 14 02844 g006
Figure 7. Vegetation index analysis of different irrigation methods.
Remotesensing 14 02844 g007aRemotesensing 14 02844 g007b
Figure 8. Partial enlargement of vegetation index: (a) GGR-local enlarged view during growth, (b) GGR-Detail enlarged view during defoliation, (c) GCC-local enlarged view during growth, (d) GCC-Detail enlarged view during defoliation, (e) GEI-local enlarged view during growth, (f) GEI-Detail enlarged view during defoliation, (g) GRVI-local enlarged view during growth, (h) GRVI- Detail enlarged view during defoliation.
Remotesensing 14 02844 g008aRemotesensing 14 02844 g008b
Figure 9. Changes in GCC vegetation index under different irrigation methods: (a) Relationship between CK and GCC vegetation index data, (b) Relationship between DIFI and GCC vegetation index data, (c) Relationship between BIFI and GCC vegetation index data, (d) GCC- local enlarged view during growth.
Remotesensing 14 02844 g009
Figure 10. Growth changes at different preset points during the rainy season.
Remotesensing 14 02844 g010
Figure 11. Growth curve fitting and key phenological period extraction at different preset points.
Remotesensing 14 02844 g011
Table 1. Basic physical and chemical properties of the soil at the test site.
Soil Depth
(cm)
Particle Size Distribution (%)Texture 1Bulk Density
(g·cm−3)
Field Water-Holding Capacity
(cm3·cm−3)
Saturated Water Content/(cm3·cm−3)Organic
Matter
(g·kg−1)
Available
Phosphorus
(mg·kg−1)
Available
Potassium
(mg·kg−1)
Sand Silt Clay
0–5061.7935.522.70Sandy loam1.410.340.444.77.2644.42
50–14063.9233.692.39Sandy loam1.430.360.452.30.9727.85
140–30029.6265.544.84Silt loam1.460.350.442.61.6341.98
1 United States Department of Agriculture classification.
Table 2. Equations of color indices measured.
Color IndexEquationReference
Ratio greenness index GGR = G/R[28]
Green chromatic coordinateGCC = G/(R + G + B)[29]
Green excess indexGEI = 2G − (R + B)[29]
Red chromatic coordinateRCC = R/(R+G+B)[30]
Green red vegetation indexGRVI = (GR)/(G + R)[31]
HueHUE = (BR)/(ImaxImin) × 60 + 120
G = Imax
HUE = (BR)/(ImaxImin) × 60 + 240
B = Imax
HUE = (GB)/(ImaxImin) × 60 + 340
G < B
HUE = (GB)/(ImaxImin) × 60
other
[32]
Note. R, G, and B represented the brightness of red, green, and blue channel, respectively; I m a x and Imin represented the maximum and minimum of R, G and B, respectively.
Table 3. The difference in values like amplitude and change at some critical dates.
Irrigation MethodIrrigation TimeIrrigation Duration (H)Irrigation Volume (mm)Vegetation IndexRemarks
CK (preset point 1) 26 March03.60.336
20 April000.442
21 April00.30.455MOE
27 June07.60.382
DIFI (preset point 3)26 March811.210.339
20 April813.770.461
21 April000.473MOE
26 June813.530.396
BIFI (preset point 5)25 March1.2557.540.341
18 April1.2345.320.456
21 April000.467MOE
25 June0.948.520.387
Table 4. Growth of the same vegetation index at different preset points.
IndexPresetSOSMOEEOS
GGR1 (CK)83 (24 March)109 (19 April)307 (3 November)
3 (DIFI)83 (24 March)111 (21 April)313 (9 November)
5 (BIFI)83 (24 March)111 (21 April)313 (9 November)
GCC1 (CK)83 (24 March)111 (21 April)307 (3 November)
3 (DIFI)83 (24 March)111 (21 April)315 (11 November)
5 (BIFI)83 (24 March)111 (21 April)314 (10 November)
GEI1 (CK)83 (24 March)111 (21 April)307 (3 November)
3 (DIFI)83 (24 March)111 (21 April)315 (11 November)
5 (BIFI)83 (24 March)111 (21 April)314 (10 November)
GRVI1 (CK)83 (24 March)109 (19 April)307 (3 November)
3 (DIFI)83 (24 March)111 (21 April)313 (9 November)
5 (BIFI)83 (24 March)111 (21 April)313 (9 November)
Publisher’s Note: MDPI stays neutral with regard to jurisdictional claims in published maps and institutional affiliations.

