Article

Evaluation of the Moso Bamboo Age Determination Based on Laser Echo Intensity

College of Environmental and Resource Sciences, Zhejiang A&F University, Hangzhou 311300, China
*
Author to whom correspondence should be addressed.
These authors contributed equally to this work.
Remote Sens. 2022, 14(11), 2550; https://doi.org/10.3390/rs14112550
Submission received: 15 April 2022 / Revised: 20 May 2022 / Accepted: 24 May 2022 / Published: 26 May 2022

Abstract

:
Determination of bamboo age is an important task for bamboo forest management and bamboo utilization. However, the bamboo age is usually manually determined in the field, which is time-consuming and labor-intensive. Due to the ability to generate very high-density point clouds, terrestrial laser scanning (TLS) has been applied in forestry to acquire forest parameters. This study evaluated the potential of using the laser echo intensity data generated by TLS technology to determine the Moso bamboo age represented by “du.” The intensity data were first corrected for the distance and incidence angle effects using an intensity correction method that constructed an empirical correction model by fitting piecewise polynomials to the intensity data collected based on a reference target. Then the models expressing the relationship between intensity and bamboo culm section number were constructed for different bamboo du by fitting polynomials to the intensity data of individual bamboo culms through least-squares adjustment. For a bamboo plant whose age is determined, the bamboo du could be determined based on the constructed intensity-culm section models. The proposed bamboo age determination method was tested at a site in a managed Moso bamboo forest in Lin’an District, Hangzhou City, Zhejiang Province, China. From the test site, 56 and 120 bamboo plants with known bamboo ages were selected to construct the intensity-culm section models and to validate the bamboo age determination method, respectively. The bamboo age determination accuracies for each bamboo du were all above 90%. The result indicates a great potential for automatic determination of bamboo age in practice using TLS technology.

Graphical Abstract

1. Introduction

Laser scanning is an emerging non-contact measurement technology for rapidly and precisely capturing three-dimensional (3D) data of our environment. The data usually includes x, y, and z coordinates, supplemented by such attributes as the intensity of the laser beam reflected from the target object [1]. In particular, terrestrial laser scanning (TLS) technology enables rapid non-contact measurement of observed objects to obtain a large amount of laser point cloud data with a high spatial resolution and high digitization accuracy [2]. Due to its capability of capturing 3D information, TLS technology has been used in forestry to collect forest structural parameters, such as stem density [3], tree height, crown diameter, diameter at breast height (DBH) [4,5], leaf area index [6], canopy cover [7,8], and aboveground biomass [9,10]. Using the high spatial resolution TLS data, the parameters of individual trees can be precisely extracted [11,12] and the structural dynamics in plants can be analyzed [13,14].
Moso bamboo (Phyllostachys pubescens) is the most widely cultivated bamboo species in subtropical regions of Asia, Africa, and Latin America [15,16]. Moso bamboo forests are widely distributed in southern China, having a long history of cultivation and utilization [17,18]. Moso bamboo is characterized by fast growth, high yield, high material quality, wide use, short harvesting cycle, and high economic value. As bamboo’s vitality, metabolic level, renewal ability, and material mechanical properties are closely related to bamboo age, accurately determining the age of Moso bamboo is of great significance for bamboo cultivation management, harvesting, and material utilization [19]. Unlike common tree species, whose age can be determined based on annual rings, the age of a Moso bamboo plant is usually difficult to determine [20].
Bamboo age is commonly denoted by the unit “du” in China. New bamboo or bamboo of 1 year old is referred to as 1 du, 2–3 years as 2 du, 4–5 years as 3 du, and so on [21]. The new bamboo plants are those that emerged out of the ground this spring, while 1-year-old bamboo plants emerged last spring, and so forth. Nowadays, bamboo age is usually manually determined in the field based on the culm color or traces of growth [19,20]. The color of a bamboo culm changes as the bamboo plant grows (Figure 1). The culms of 1-du bamboo are emerald green in color and are usually covered by a white wax layer when they have just emerged. The color of the culms of 2-du bamboo becomes light green and the white wax layer disappears. The culms of 3-du and 4-du bamboo are greenish-yellow or even grayish-white color. The traces of growth are left by the old branches that have fallen off as new branches grow. Based on the number of traces, the bamboo age can be determined. The job of manual determination of bamboo age, which depends on expert experience, is time-consuming and labor-intensive. It is imperative to develop an automatic method for bamboo age determination.
The TLS technology has been recently utilized in the study of Moso bamboo. Yan et al. [22] analyzed the competition between Moso bamboo and broad-leaved trees in a mixed forest using TLS data. Zheng et al. [23] used the TLS technology to build a geometric model of bamboo shoots, based on which a biomass estimation model was established. Li et al. [24] used TLS to accurately quantify the above- and below-ground structure and dynamics of Moso bamboo forests after reforestation. However, to the author’s knowledge, no study has evaluated the potential of TLS technology to estimate the age of Moso bamboo. The intensity of the laser beam reflected from a target object is closely related to the spectral reflectance of the target [25]. Since the bamboo culms of different ages have different colors, it is possible to use TLS intensity data to determine the bamboo age.
In addition to the spectral reflectance of the target, the raw intensity is also affected by other factors, such as instrumental configurations, atmospheric condition, distance (range), and incidence angle [26,27,28,29]. During a laser scanning task, the instrumental configurations are constant and the atmospheric attenuation can be ignored; the intensity data are predominantly influenced by target reflectance, distance, and incidence angle [30,31]. Therefore, the distance and incidence angle effects should be eliminated so that the intensity data is solely related to the reflectance of the target [32], i.e., Moso bamboo in this study. The incidence angle and distance effects can be corrected by using theoretical methods [27,33,34] or based on models that are empirically determined using reference targets [30,33,35,36] or naturally homogeneous surfaces (e.g., asphalt roads) [31]. Although the theoretical correction methods are more generalized, they have limitations when physical and sensor-related parameters in the laser radar equation are unknown [37].
This study aims to evaluate the potential of using the laser intensity data derived by TLS for Moso bamboo age (i.e., du) determination. To correct the TLS intensity data to eliminate the influence of distance and incidence angle, an empirical intensity correction method based on a flat reference target is adopted. A method is proposed to determine Moso bamboo age based on the models expressing the relationship between intensity and bamboo culm section number. The remainder of this article is organized as follows. Section 2 describes the study area. Section 3 introduces the process of data acquirement and pre-processing, the intensity correction method, and the bamboo age determination method. Section 4 and Section 5 provide the results and discussions, respectively. Section 6 presents the conclusions.

2. Study Area

As shown in Figure 2, the test site is located in the managed Moso bamboo forest on the hill of Donghu Village, Lin’an District, Hangzhou City, Zhejiang Province, China (119°40′E, 30°15′N). The area has a subtropical monsoon climate with an average annual temperature of 16.4 °C and annual precipitation of 1500.0 mm to 1628.6 mm. The test site mainly contains Moso bamboo of different ages, from new growth to 6 years old, with a standing density of about 1200–2000 bamboo plants per hm2, as well as a few shrubs and weeds in the understory. There are no other trees in the bamboo forest. Within the test site, the elevation ranges from 50 m to 75 m and the slope from 15° to 27°.

3. Methodology

The workflow of bamboo age determination is shown in Figure 3. First, we established three sample plots in the Moso bamboo forest and collected the field data. We scanned the sample plots using a TLS instrument. The laser scanning data was pre-processed to derive point clouds. We then adopted an empirical intensity correction method to correct the effects of distance and incidence angle. Subsequently, a number of bamboo plants of different ages were selected and the corrected intensity data were extracted from each bamboo culm section. The laser intensity-culm section models were established to express the variation patterns of intensity with respect to culm section number, based on which the bamboo age could be determined. Finally, we selected some bamboo plants to validate the bamboo age determination method.

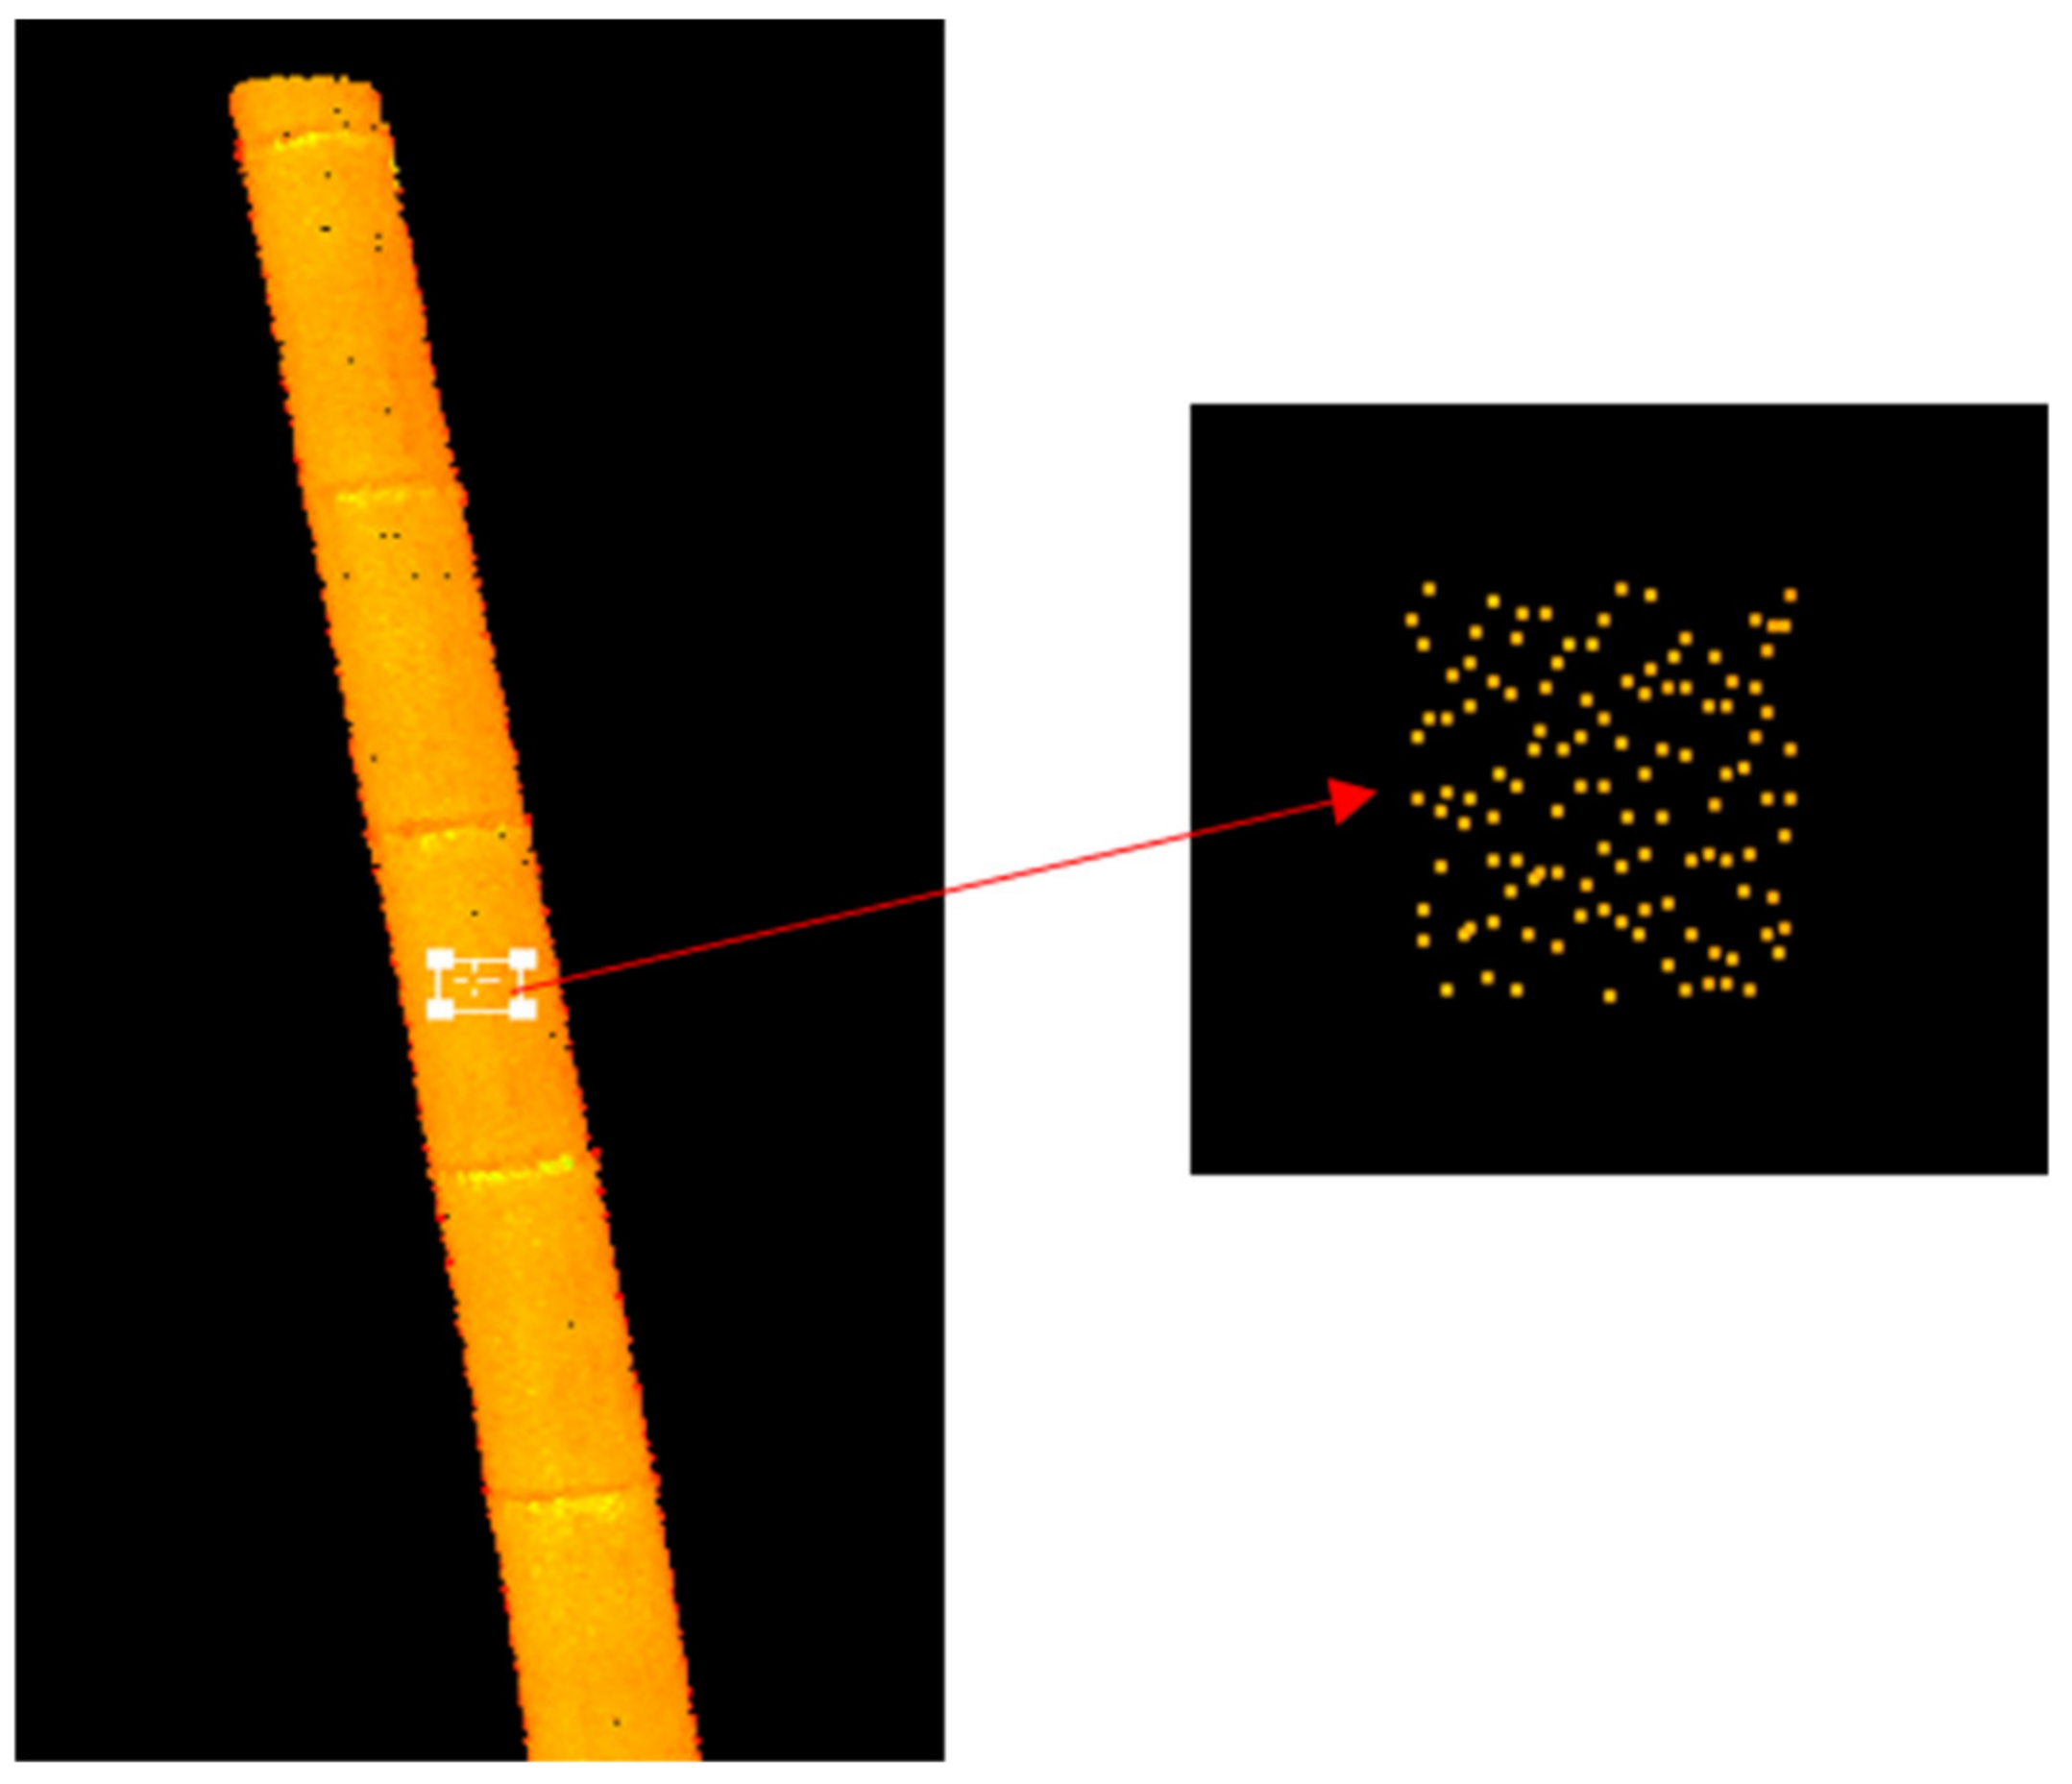
3.1. Data Collection and Pre-Processing

The TLS data for this experiment were collected in December 2019 using a Leica ScanStation C5 terrestrial laser scanner. The main parameters of this scanner are listed in Table 1. Three 20 m × 20 m sample plots, containing a total of 188 Moso bamboo plants, were established within the test site. One sample plot is located at the foot of a hill and two on the hillside. For each plot, the laser scanning data were acquired from five scan positions distributed outside and at the center of the sample plot. Three 3-inch flat targets were placed within the plot during the scanning process for the following registration of all laser scans. Within the sample plots, each Moso bamboo plant’s location, diameter at breast height at 1.3 m, and height were measured. The year of a bamboo plant growing out has been manually tagged on the bamboo culm and hence the bamboo age can be directly collected in the field. All the three sample plots contain Moso bamboo plants from 1 to 4 du.
The software Leica Cyclone 8.0 was used to pre-process the laser scanning data. Multiple laser scans for a single sample plot were registered into a point cloud using the registration module of Cyclone and noises were removed using the edit module.

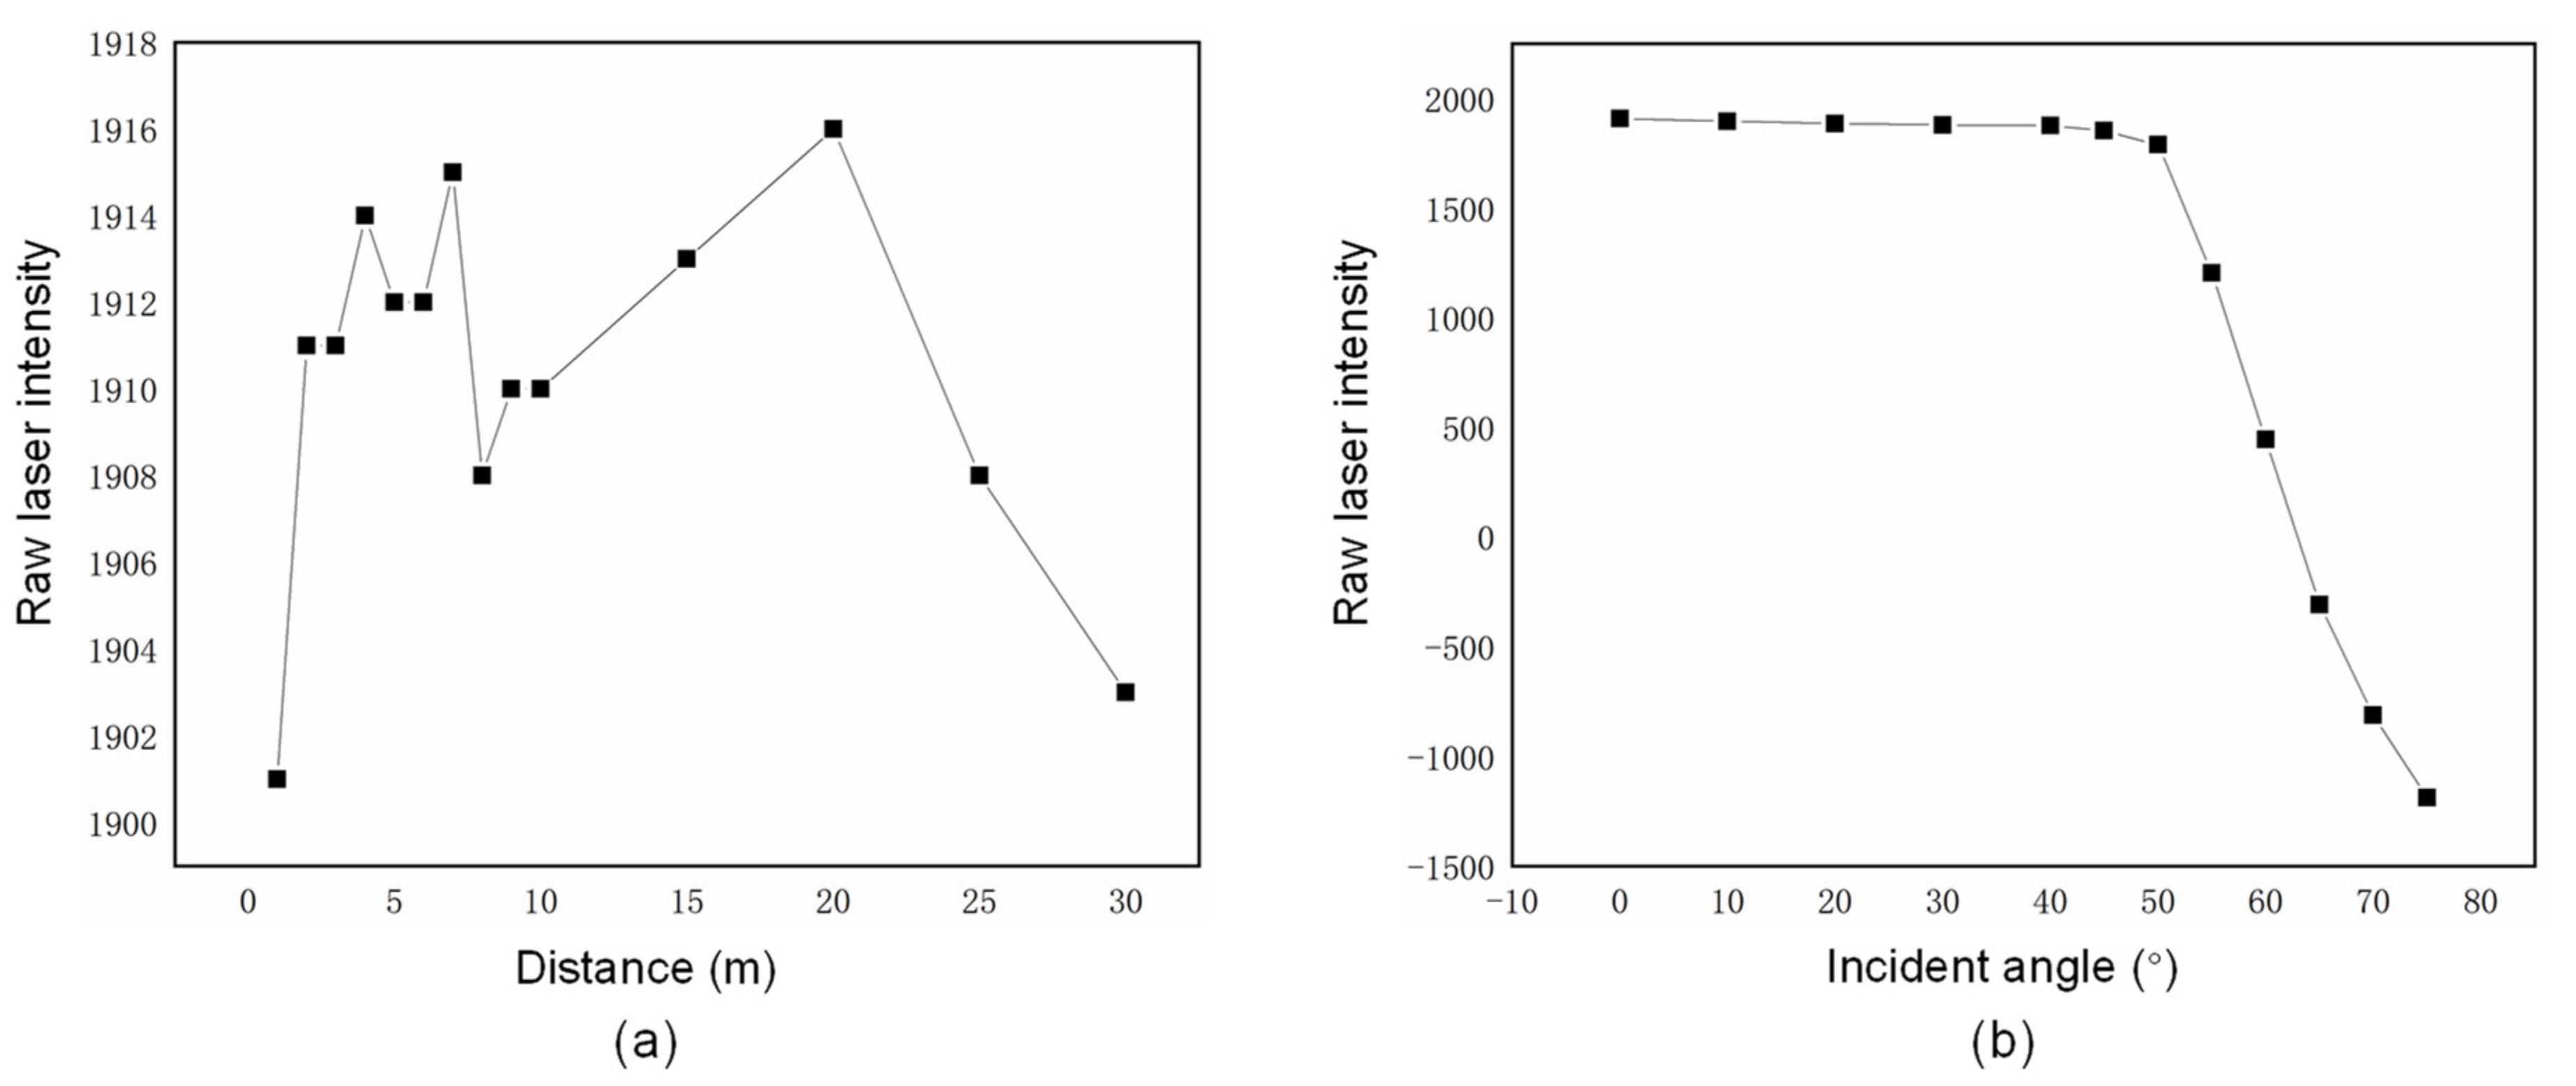
3.2. Laser Echo Intensity Correction

Laser echo intensity is strongly related to the spectral reflectance of targets [25]. It is influenced by various factors such as sensor characteristics, distance, incidence angle, weather, the atmosphere condition, etc. The influence of these factors on laser intensity can be summarized by the following equation [26,27]:
P r = P t D r 2 ρ cos θ 4 R 2 η s y s η a t m
where Pr is the received power, Pt is the transmitted power, Dr is the receiver aperture diameter, ρ is the target reflectance, θ is the incidence angle of the laser pulse, R is the distance between sensor and target, ηsys is the optical system transmission coefficient of the scanner, ηatm is the atmospheric transmission coefficient.
Given that laser scanning data are acquired by the same sensor during a single campaign, all sensor-related factors, i.e., Pt, Dr, ηsys, can be considered constant [30]. Under the assumption of linear amplification between the received power and the intensity value, the formula of intensity can be expressed as follows [27]
I = K ρ cos θ R 2 η a t m   K = P t D r 2 η s y s / 4
where I is the laser intensity and K is a constant factor.
Equation (2) indicates that the laser intensity is inversely proportional to the distance squared. However, this is not true for TLS, as the system would amplify the received power at a large distance and reduce the power at a near distance to improve range accuracy [37]. Equation (2) is a simplified mathematical law and cannot represent the complicated relationship between the intensity and the distance or incidence angle. Assuming that the influence of various factors on laser intensity is independent of each other, the formula of laser intensity can be expressed as [33]
I = K f 1 ( ρ ) f 2 ( cos θ ) f 3 ( R ) η a t m
where f1(ρ), f2(cos θ), and f3(R) are functions of target reflectance, angle of incidence, and distance, respectively.
To reflect the spectral characteristics of targets, intensity correction should convert a laser intensity value to a corrected value proportional or equal to the target reflectance [27]. In this study, we used a flat reference target to establish the intensity correction model, and hence the effect of target reflectance on the laser intensity is considered a constant. Even though the atmospheric effect is related to the distance R, the atmospheric factor ηatm can be regarded as a constant since the distances are generally short when using TLS. Therefore, Equation (3) can be simplified as
I = G f 2 ( cos θ ) f 3 ( R )
where G is a constant parameter. Based on the representation of intensity in Equation (4), an intensity correction model is given as follows [30]
I s = G f 2 ( cos θ s ) f 3 ( R s ) G f 2 ( cos θ ) f 3 ( R ) I
where Is is the corrected intensity value that is independent of the distance and incidence angle, θs is a reference incidence angle, and Rs is a reference distance. In this study, the reference distance of 10 m and the reference incidence angle of 0° were adopted. The distance and the incidence angle can be calculated using Equations (6) and (7), respectively. The distance R was calculated using the geometrical coordinates of the point of interest S(X, Y, Z) and the scanner center O(X0, Y0, Z0). To obtain the incidence angle θ, the normal vector n(n1, n2, n3) of the target surface was estimated by computing a best-fitting plane using the points in the neighborhood of the point of interest [30].
R = X X 0 2 + Y Y 0 2 + Z Z 0 2
cos θ = OS · n R · n
In the intensity correction model, polynomials were used to approximate the functions f2(cos θ) and f3(R), respectively. To derive the polynomials, we used a method similar to Tan et al. [30]. Two sets of experiments were conducted to examine the effects of varying distances and incidence angles on intensity values and collect intensity data for polynomial fitting. After setting up the laser scanner on the ground, a 3-inch flat target was set up at different distances (R) to the laser scanner with fixed intervals. The incidence angle (θ) was fixed by setting the target plane perpendicular to the ground so that the relationship between intensity and distance was analyzed. For R ≤ 10 m, the interval was 1 m, while for R > 10 m, the interval was 5 m. The maximum distance was 30 m. The height of the target remained the same for each distance placement. To study the relationship between intensity and incidence angle, the target was set up at a 10 m distance to the laser scanner and the target surface was rotated in fixed steps from 0° to 80°. For θ ≤ 40°, the step was 10°, while for θ > 40°, the step was 5°.
The experimental results are shown in Figure 4. Each value in the figure is the mean intensity value of all laser echoes at a specific distance or incidence angle. For the Leica ScanStation C5 laser scanner, the laser intensity value tends to increase and then decrease within the range between 0 and 30 m, with two obvious peaks and the maximum intensity value at 20 m. The effect of the incidence angle on the intensity value is relatively small within the range of 0° to 50°, whereas the intensity value decreases sharply when the incidence angle is greater than 50°. The effect of the incidence angle on the laser intensity is more significant than that of the distance.
Based on the results indicated in Figure 4, piecewise polynomials were used to approximate the functions f2(cos θ) and f3(R) in the intensity correction model. One problem is to determine the critical points of the piecewise polynomials. As shown in Figure 4a,b, the critical point for function f3(R) lies between 8 and 10 m, while the critical point for function f2(cos θ) lies between 40° and 55°. Therefore, the point cloud data within the distance or the angle range were used to fit a polynomial function, and the extreme value was taken as the critical point of the piecewise polynomial model. The critical points for the functions f3(R) and f2(cos θ) were determined to be 9.9 m and 45°, respectively. The specific forms of functions f3(R) and f2(cos θ) are given as follows
f 3 R = i = 0 N 1 A i R i ,   R 9.9   m i = 0 N 2 B i R i ,   R > 9.9   m
f 2 cos θ = i = 0 N 3 C i cos i θ ,   θ 45 ° i = 0 N 4 D i cos i θ ,   θ > 45 °
where Ai, Bi, Ci, and Di are polynomial coefficients, N1, N2, N3, and N4 are the degrees of the polynomials.
The intensity data in the distance and incidence angle experiments were used to fit the piecewise polynomials through least-squares adjustment. Different polynomial degrees were tried, i.e., N1, N2, N3, and N4. Root mean square errors (RMSEs) were calculated to indicate the accuracy of the polynomial fitting. The polynomial degrees and corresponding RMSEs are shown in Table 2. To avoid over-fitting as well as keep high model accuracy, N1 = 3, N2 = 2, N3 = 2, and N4 = 2 were finally adopted.

3.3. Laser Intensity-Culm Section Model

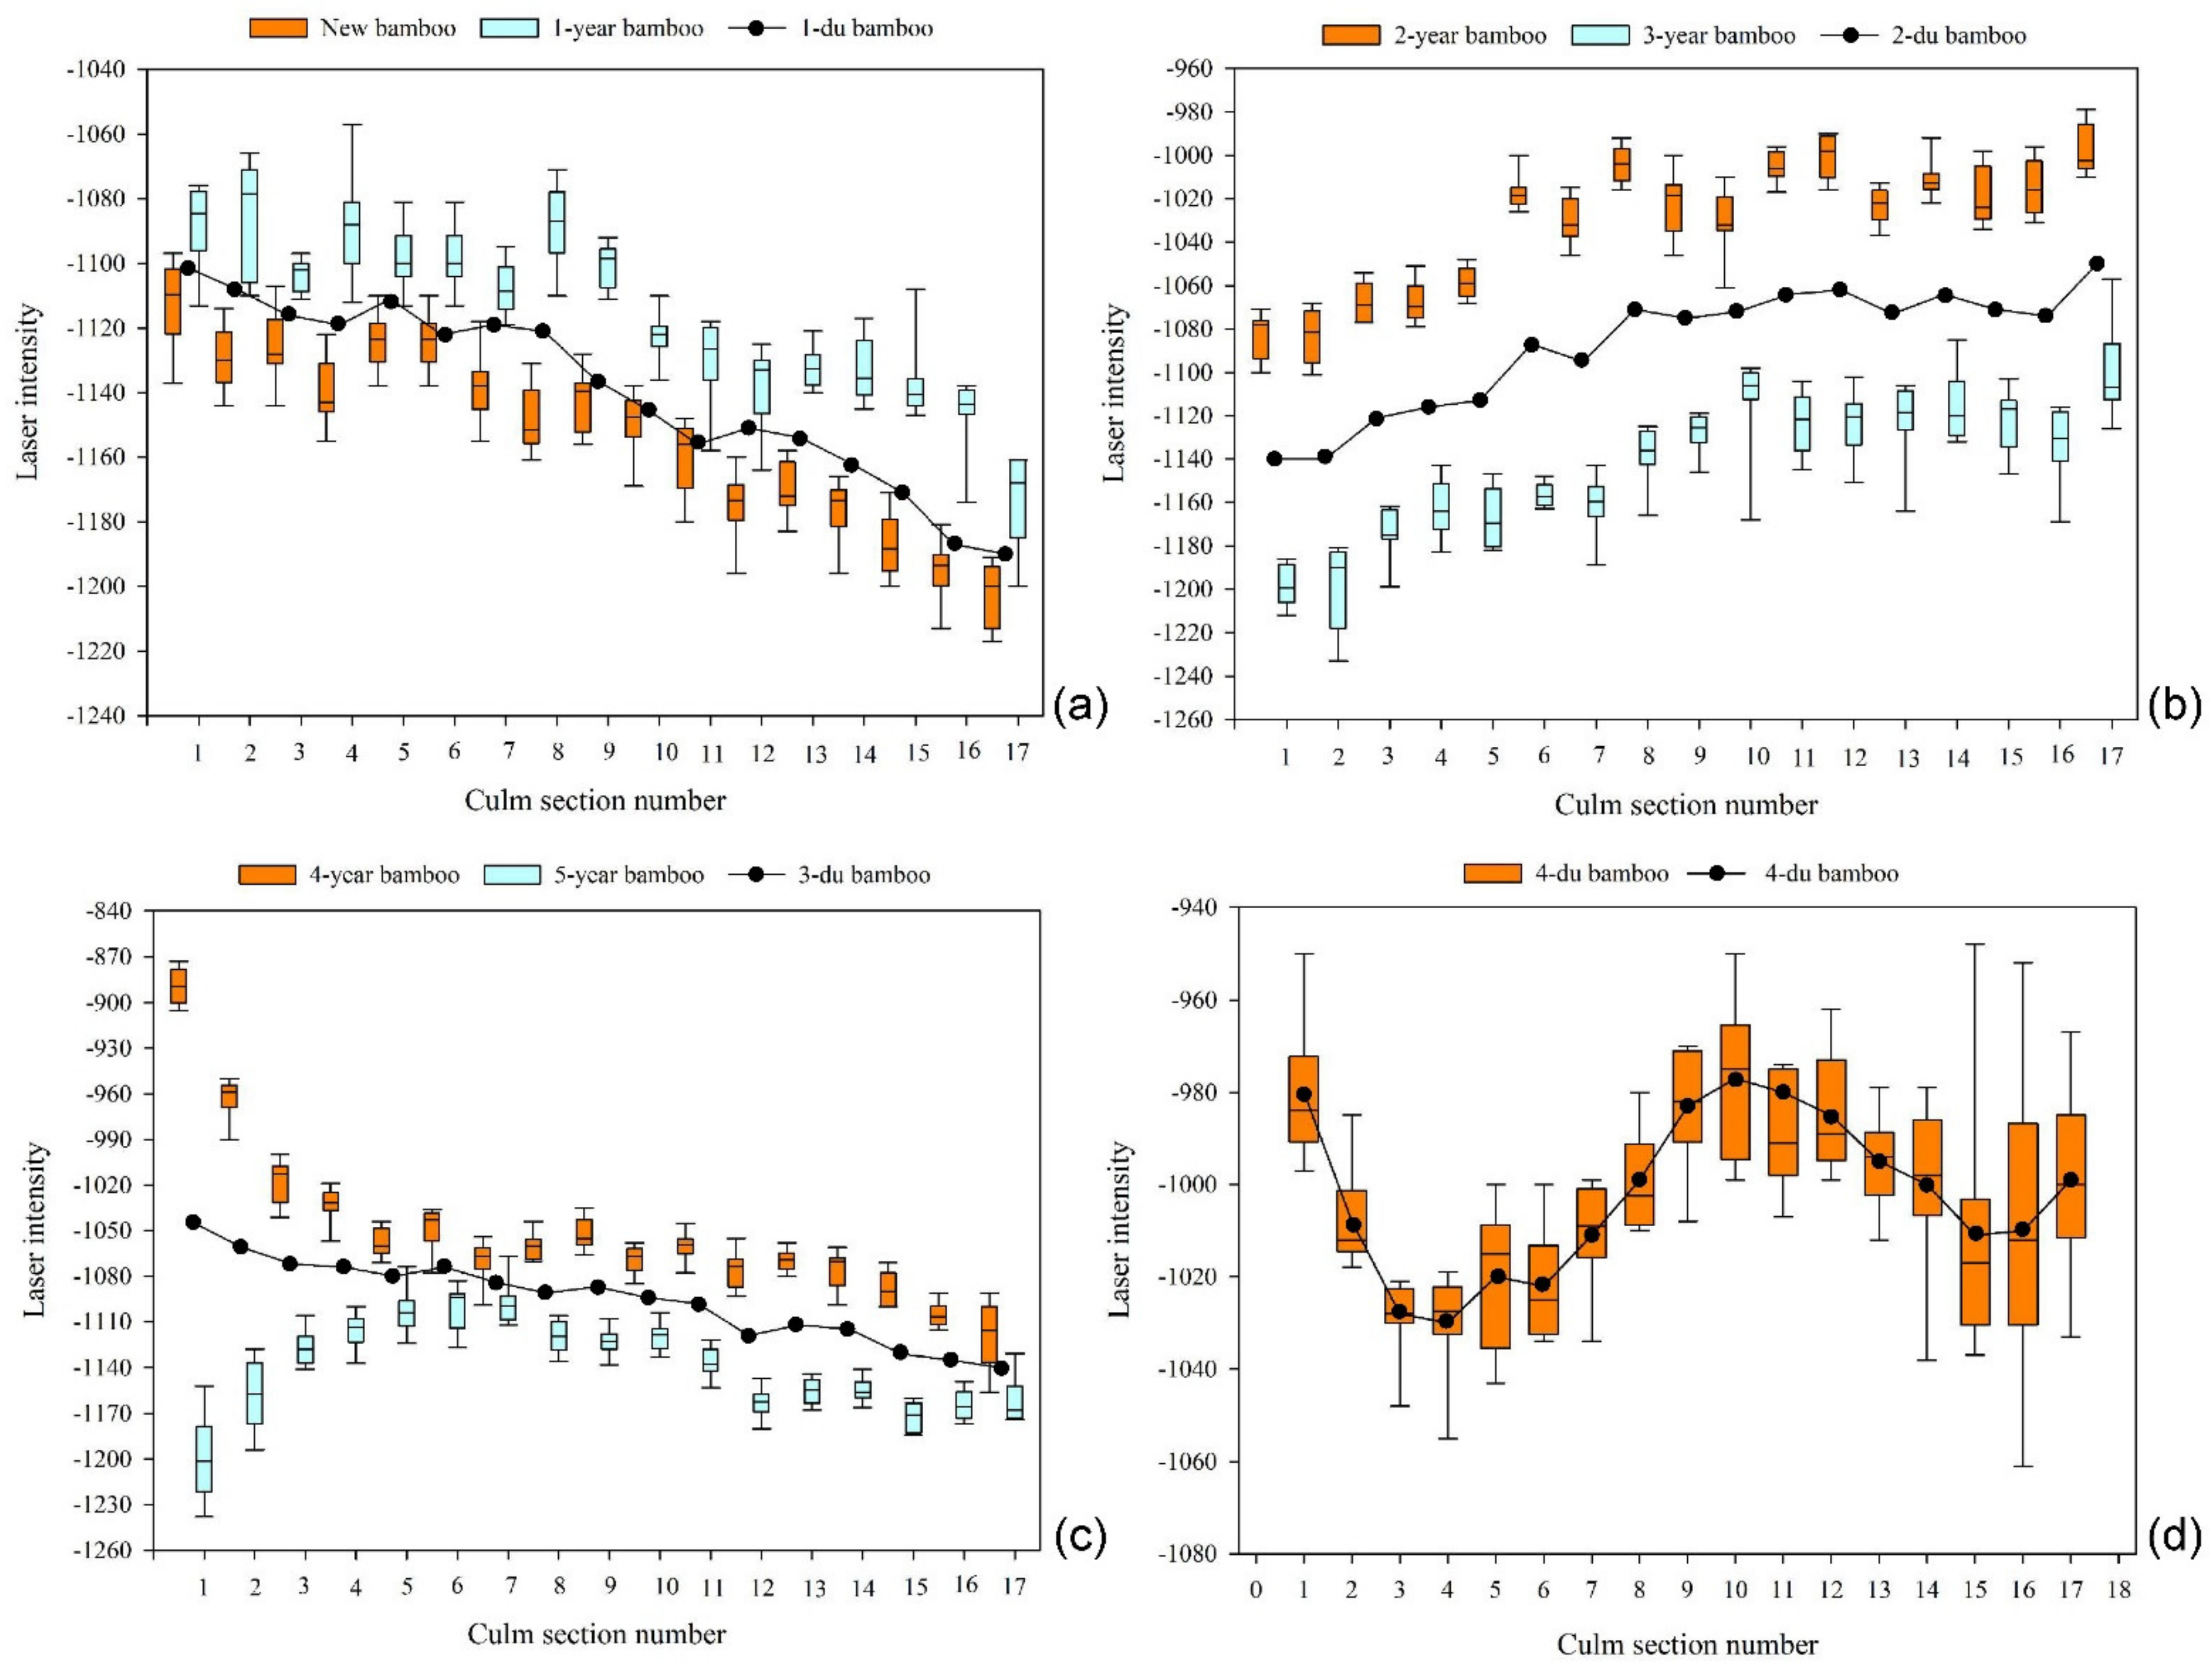
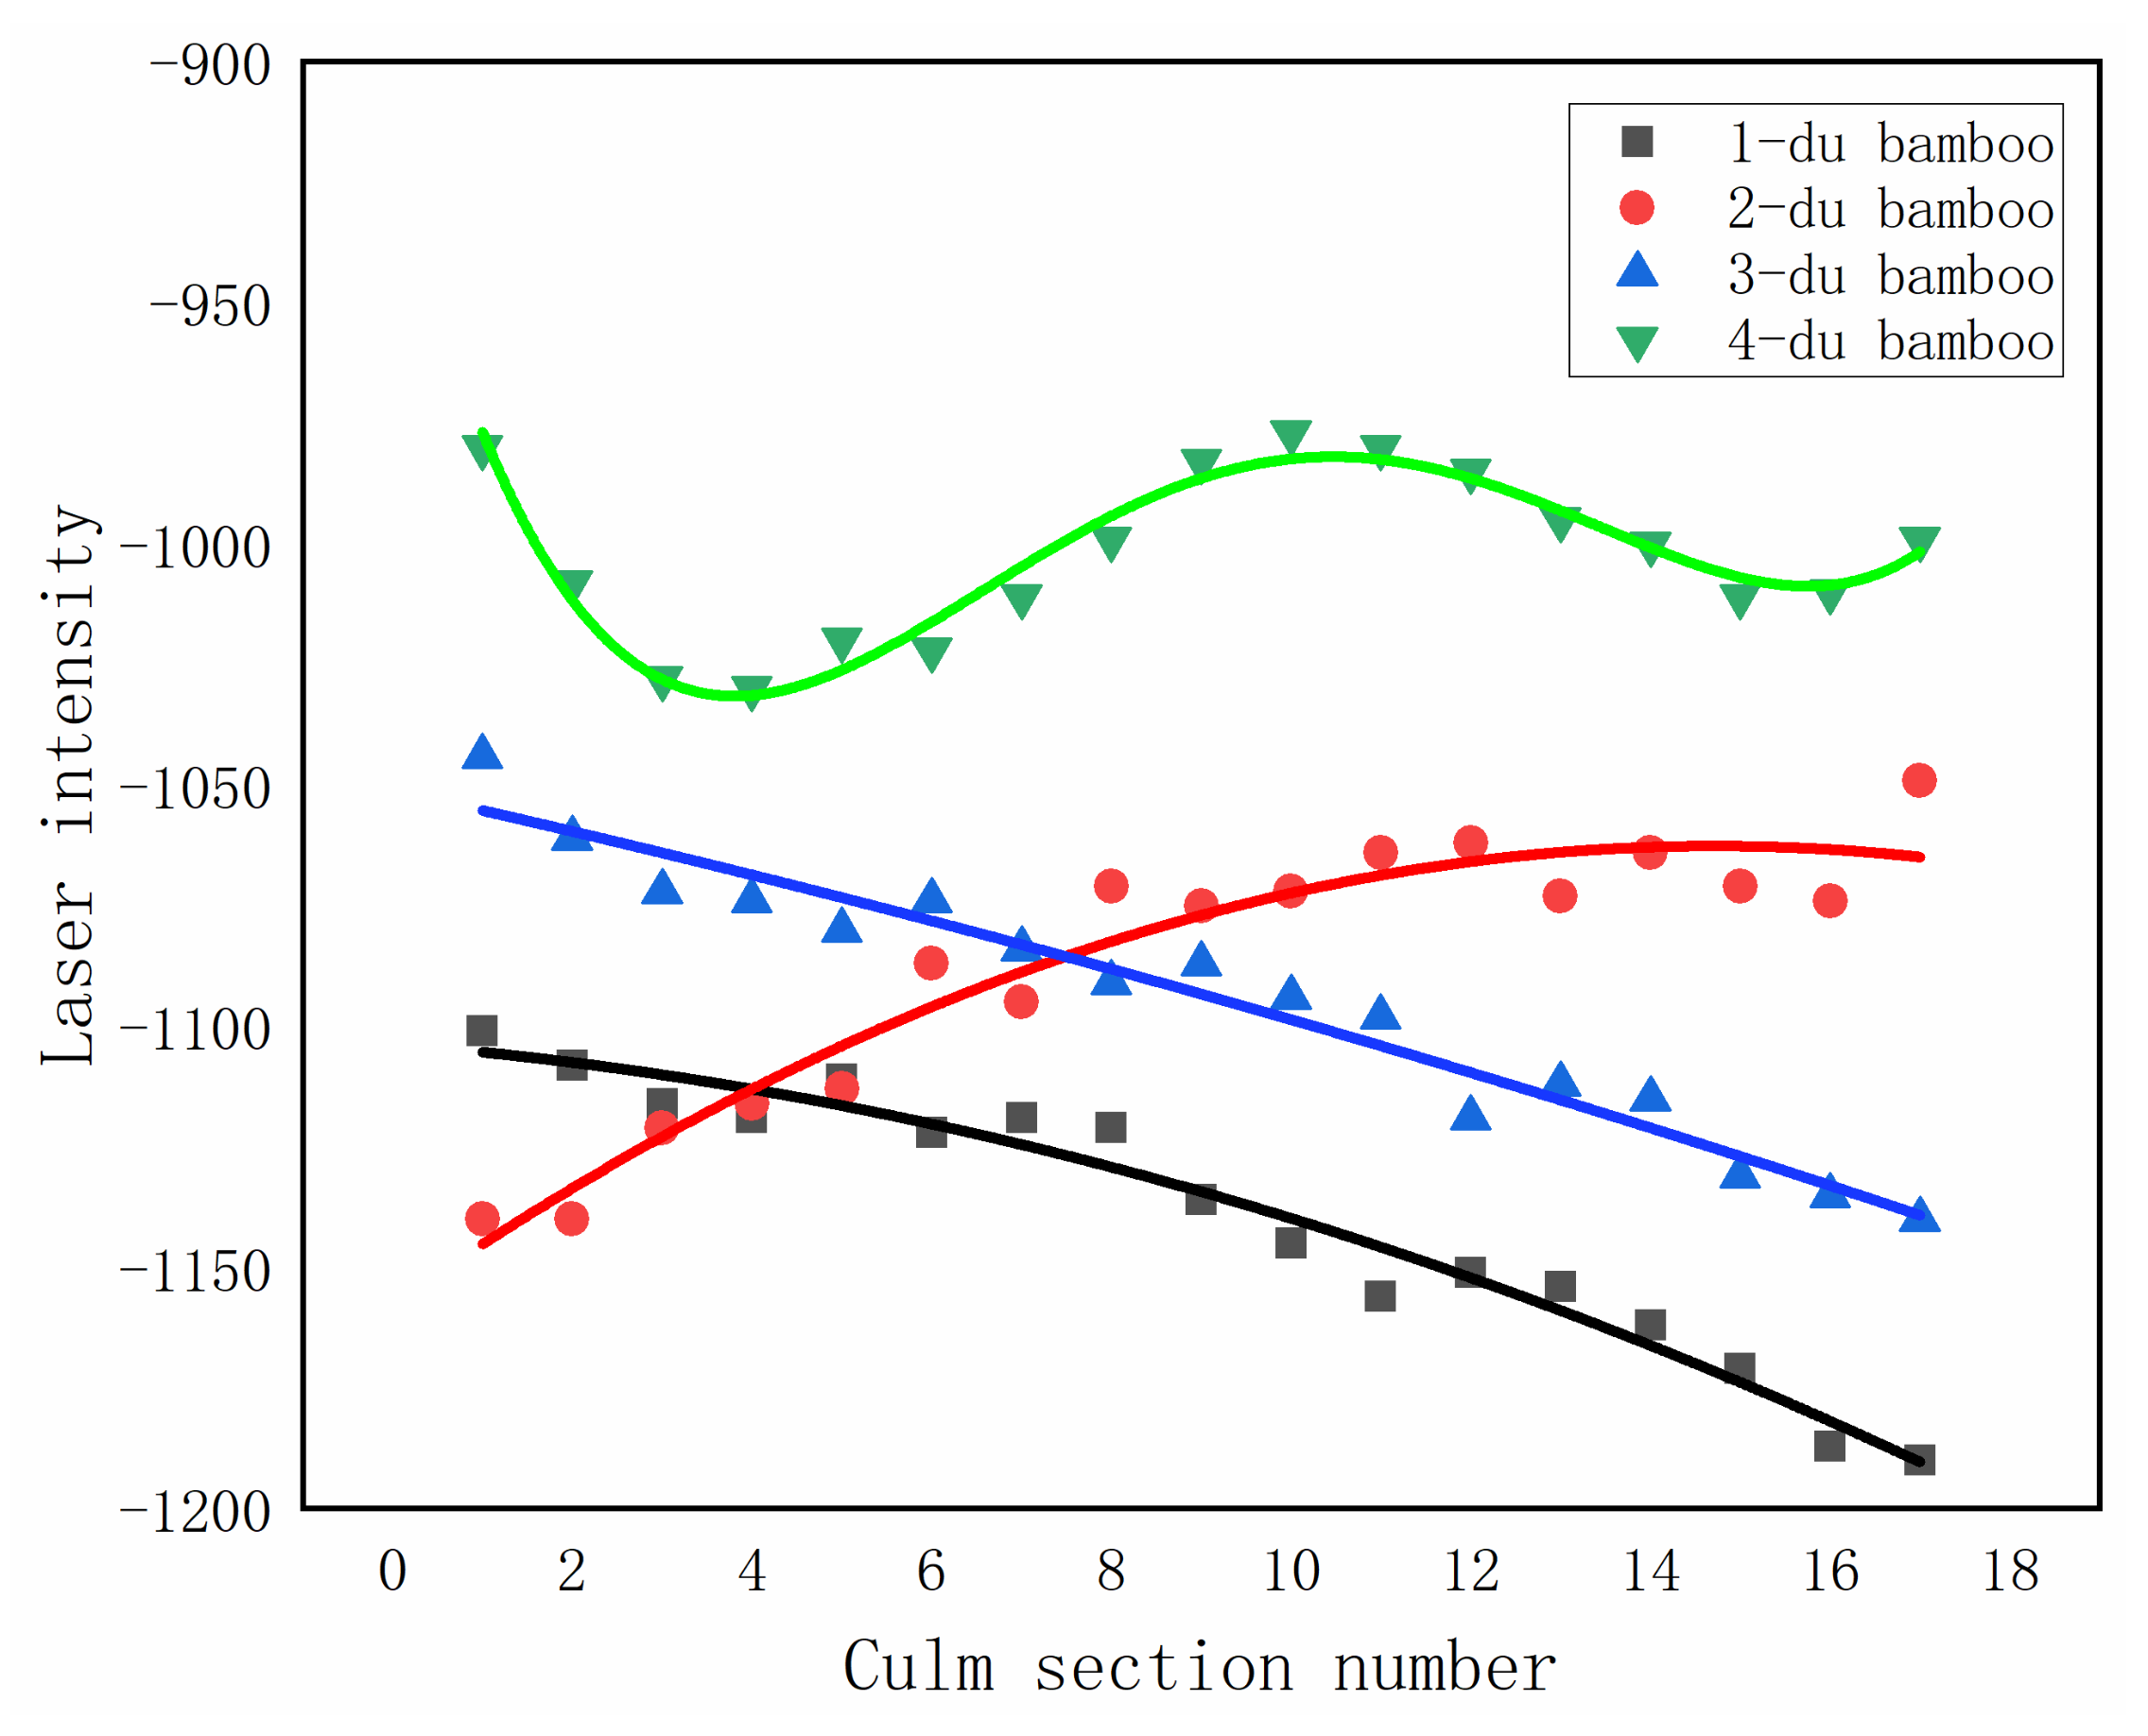
3.3.1. Analysis of Laser Intensity of Moso Bamboo Culms

A total of 56 Moso bamboo plants, eight for each year from new growth to six years old, were selected to analyze the relationship between intensity and bamboo age. Using the software Cyclone, the culms of the selected bamboo plants were manually segmented from the point cloud. A single bamboo culm consists of multiple sections separated by bamboo joints (Figure 1). From the ground to the lowest branch, the culm sections were identified and numbered. A window of approximately 2 cm × 2 cm was used to extract laser points from the middle of each culm section (Figure 5). For a bamboo culm section, the laser intensity values within the window were corrected for the distance and incidence angle effects using the proposed correction model. Then the corrected intensity values were averaged to be taken as the laser intensity value for that section. As for different bamboo plants, the total number of culm sections below the lowest branch is not unified; the smallest total number (i.e., 17) of culm sections among all bamboo plant samples was adopted for the following analysis.
The culm section intensity values of bamboo plants of different ages are shown in Figure 6. For each du, the intensity values of two years’ bamboo plants were averaged from section to section as the intensity values of this du. For the 1-du bamboo, the intensity values of the culms of the new growth and the 1-year-old bamboo plants varied in the same pattern, with a decreasing trend from the first to the 17th bamboo section. The intensity values of the culms of the 2-year-old and the 3-year-old bamboo also showed the same variation pattern (Figure 6b), with an increasing trend from the first to the 17th bamboo section. The laser intensity values of the culms of the 4-year-old and the 5-year-old bamboo showed opposite variation patterns before the 6th bamboo section, with an increasing trend for the 5-year-old bamboo and a decreasing trend for the 4-year-old bamboo (Figure 6c). Both showed a decreasing trend after the 6th bamboo section. The data of the 4-du bamboo only contained the intensity values of the 6-year-old bamboo. The intensity values of the 4-du bamboo culms were mostly higher than the 1-du, 2-du, and 3-du bamboo culms (Figure 6d), showing no obvious trend. It should be noted that the intensity values of some bamboo sections, such as the 16th section of the 4-du bamboo, varied within a relatively large range among the bamboo plant samples. The reasons might be multiple. The intensity data collected from the sunlit or shady side of a culm would have different values, and the nonuniform culm color caused by scratches or diseases might also affect the intensity values.
One-way ANOVA was performed in the software SPSS to test for differences among bamboo groups of different bamboo du (independent variable). Each group consisted of the average intensity values of individual bamboo culms of the same du. The boxplot in Figure 7 displays the distributions of the intensity values with respect to the groups. The boxplot shows that the distributions are roughly symmetric, and the center of the distribution of the intensity data of 4-du bamboo culms appears to be different from others. The result of the variance homogeneity test was not significant (p > 0.05), indicating homogeneity of variance through groups. The F test indicated significant differences (p < 0.001) existed between group means. Then unequal sample size post-hoc tests were performed to compare the differences between each pair of group means. The test results shown in Table 3 indicated that the group means of 1-du and 4-du bamboo was significantly different (p < 0.001) from the other three group means, while the difference between the group means of 2-du and 3-du bamboo was insignificant (p > 0.05).

3.3.2. Construction of Laser Intensity-Culm Section Models

Although the difference in intensity value between 2-du and 3-du bamboo culms was not significant, the intensity values of 2-du and 3-du bamboo culms varied in different patterns from the 1st to the 17th section, as shown in Figure 6. Therefore, we constructed models to express the various patterns and used such models to distinguish the bamboo du of bamboo culms.
Polynomials in the following form were fitted to the intensity values of each bamboo culm section through least-squares adjustment,
I = i = 0 N α i x i
where I is the average corrected intensity value within an approximately 2 cm × 2 cm window placed in the middle of a culm section, x is the culm section number, N is the polynomial degree, and αi represents polynomial coefficients. For each bamboo du, different polynomial degrees were applied, and RMSEs were calculated based on the observed and estimated intensity values. The optimal value of N was selected, which maintained a balance of the simplicity and accuracy of the model. The model accuracy is measured by RMSE and a low RMSE value represents a high model accuracy. The model simplicity is determined by the polynomial degree and a low polynomial degree helps prevent over-fitting.
The fit polynomial functions for different bamboo du and the corresponding R2 values are both shown in Equations (11)–(14):
I 1 = 0.2068 x 2 1.6059 x 1003.2 , R 2 = 0.9642
I 2 = 0.4425 x 2 + 12.983 x 1157.8 , R 2 = 0.9231
I 3 = 0.0547 x 2 4.2539 x 1050.8 , R 2 = 0.9546
I 4 = 0.0293 x 4 1.1749 x 3 + 15.53 x 2 73.715 x 917.53 , R 2 = 0.9518
where I1, I2, I3, I4 are the average corrected intensity values of a bamboo culm section for 1, 2, 3, 4-du bamboo, respectively, and x is the bamboo culm section number. All the R2 values were above 0.90, indicating that the fit functions followed the trends in the intensity data (Figure 8).

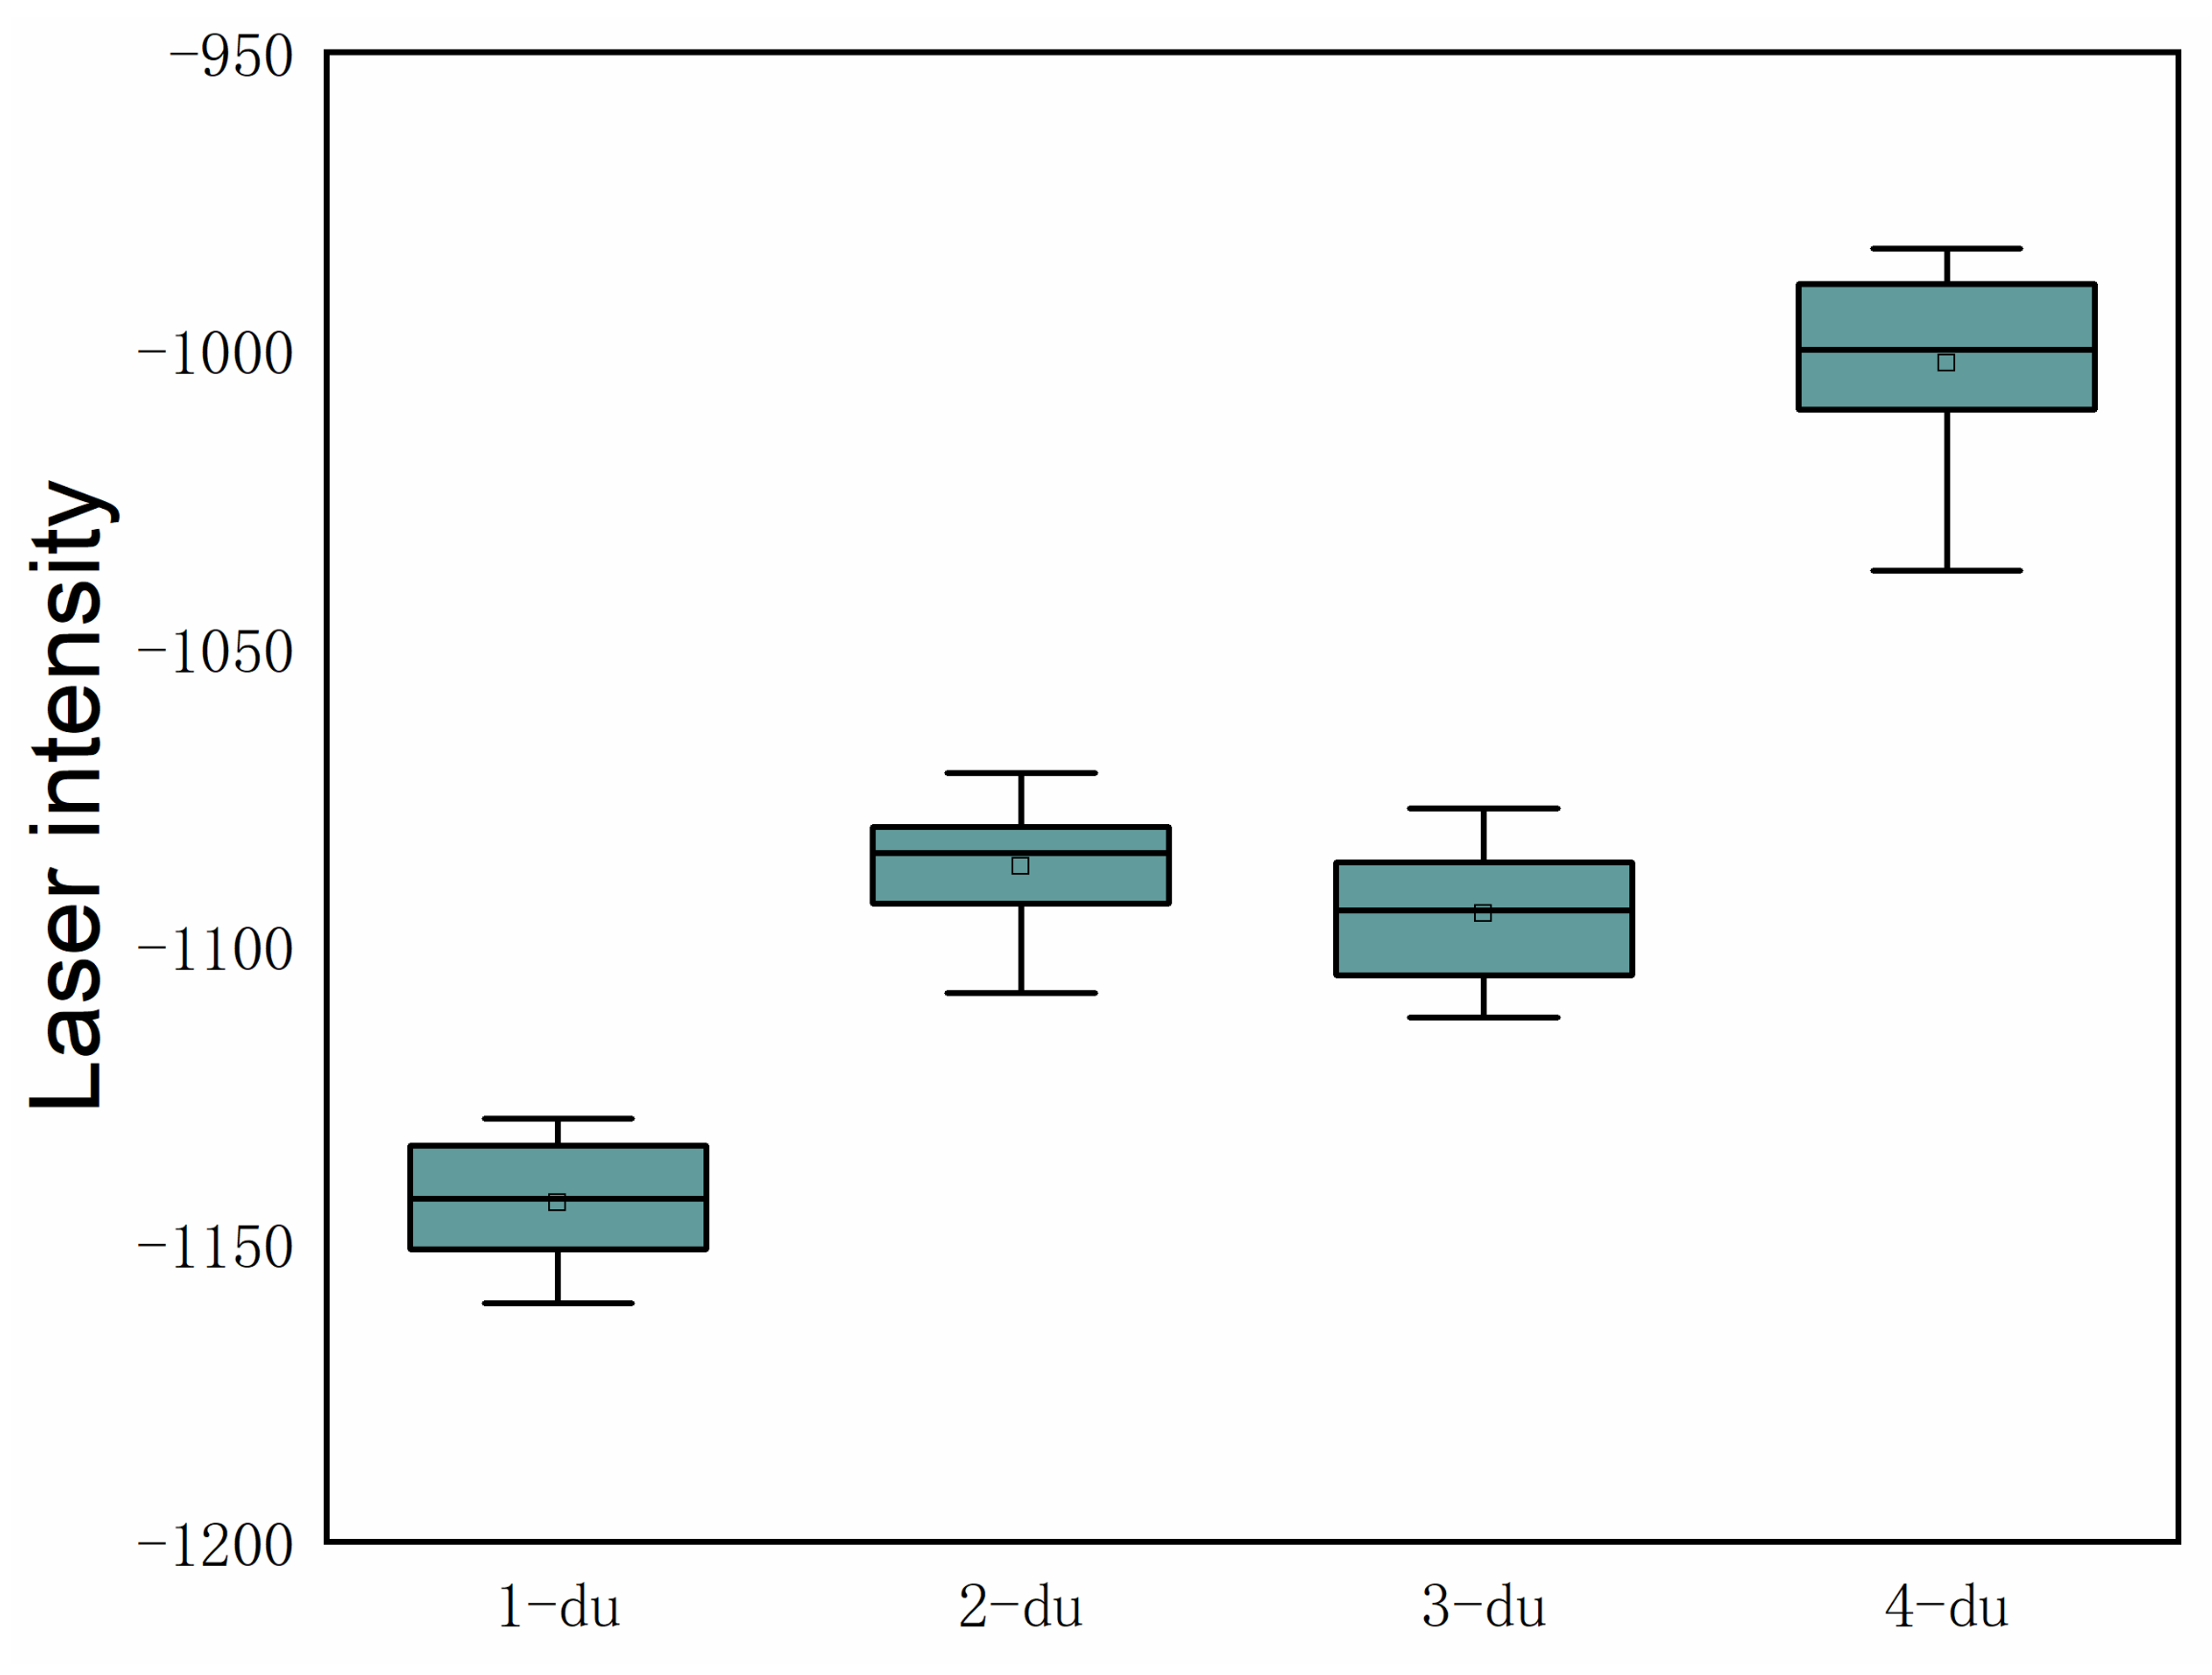
3.4. Bamboo Age Determination

After the laser intensity-culm section models have been constructed, for a Moso bamboo plant whose age is to be determined, an approximately 2 cm × 2 cm window is used to extract intensity values from each culm section. Then the intensity values are corrected for the distance and incidence angle effects using the intensity correction model constructed in Section 3.2 and the average corrected intensity values are calculated for each section. The four polynomial functions constructed in Section 3.3.2 are then applied to this bamboo plant, respectively, to calculate the estimated intensity values for each culm section. Subsequently, four RMSEs are calculated using Equation (15):
σ = i = 1 n y i 1 y i 0 2 n
where yi1 is the estimated intensity value of the ith culm section, yi0 is the observed value, i.e., the average corrected intensity value of this section, and n = 17 is the total number of culm sections. Among the four calculated RMSEs, i.e., σ1, σ2, σ3, and σ4, the smallest one indicates the bamboo du of the target bamboo plant.

4. Results

4.1. Intensity Correction Results

By applying the intensity correction model constructed in Section 3.2, the intensity values of the flat target used in the distance and incidence angle experiments were corrected for the distance and angle effects. The average intensity values at each distance or incidence angle, and the corrected values are both shown in Figure 9. Figure 9a displays the correction result for the distance effect, while Figure 9b shows the correction result for the incidence angle effect. As shown in the figure, the average intensity values of the target after the correction were less affected by the distance and incidence angle. The coefficient of variation was calculated for the average intensity values of the target before and after the correction and is shown in Table 4. The distance correction led to a small degree of decrease in standard deviation. The reason is that the variation of the original intensity values was limited to a small range (1900–1918) as distance varied. Hence, the distance correction could only lead to a limited influence. In contrast, the incidence angle correction greatly influenced the intensity values when the angle was above 45°.
When the intensity correction was applied to the intensity data of bamboo culms, the corrected intensity values extracted from an individual culm section using the 2 cm × 2 cm window tended to have a smaller variation range. The difference among the corrected intensity values extracted from an individual culm section was smaller than 20 for all bamboo culm sections. In contrast to the uncorrected data with a larger variation range, the corrected intensity values are more representative of the characteristics of each culm section, which is beneficial to the analysis of the intensity variation pattern from one to another section and the difference in intensity value among bamboo culms of different bamboo du.

4.2. Validation of Bamboo Age Determination Method

To evaluate the proposed bamboo du discrimination method, 30 Moso bamboo plants for each bamboo du were selected from the sample plots. After the intensity correction, the bamboo du determination method was applied to each bamboo plant. The bamboo du determination results are shown in Table 5. The accuracy rate was calculated as the ratio of successful discriminations to the total number of samples. As shown in the table, for 2-du and 4-du bamboo, the age of all bamboo plants was successfully determined using the proposed method. The ages of one 1-du bamboo plant and two 3-du bamboo plants were wrongly determined. Based on the in-situ observation, the misjudged 1-du bamboo plant had some scratches on its culm, while the two 3-du bamboo plants had some black spots on their culms. The scratches and the black spots possibly affected the intensity values.

5. Discussion

In this study, we used a data-driven intensity correction method which constructed an empirical correction model by fitting piecewise polynomials to the intensity data collected at specific distances or incidence angles by using a reference target. This method is similar to that in [33]. The reason for using piecewise polynomials is the TLS receiver’s power amplification for large distances and power reduction for near distances [35,36,37]. The advantage of such a method is that the variation of the intensity data with distance or incidence angle could be precisely expressed by the fit polynomial functions. The limitation is that the discrete data acquired at discontinuous distances or incidence angles could not accurately reflect the relationship between intensity and distance or incidence angle [37]. Some local changes in intensity with respect to the distance or incidence angle would possibly be omitted [31].
From Figure 9, we see that the original intensity values were weakly affected by the distance compared to the incidence angle. The variation pattern of intensity with respect to distance is different from the observations in other studies [30]. The influence of distance and incidence angle on intensity is related to the internal processing steps of the laser scanner, such as the power reduction and the receiver optics’ defocusing for near distance [33]. The laser scanners provided by different manufacturers may have diverse internal processing steps, leading to different influences of distance on intensity. The Leica ScanStation C5 terrestrial laser scanner was used throughout the entire experiment. Therefore, the intensity correction model established in this study may be unsuitable for other scanners with different instrument characteristics. It is impractical to construct a specific intensity correction model using a reference target for each instrument as it is time-consuming [31]. In a further study, naturally homogeneous surfaces near bamboo forests could be considered during the process of constructing the intensity correction model so that the intensity correction model can be quickly established without using a reference target.
Nevertheless, the main purpose of this study is to validate the feasibility and applicability of using TLS intensity data to determine the age of a single Moso bamboo plant rather than propose a generalized intensity correction model. As shown in Section 4.1, after the intensity correction, the variation of intensity with distance or incidence angle has been suppressed, and the difference among the corrected intensity values extracted from an individual culm section was small. This is beneficial for the following bamboo age determination based on the intensity data.
According to the existed studies, the laser intensity is strongly related to the spectral reflectance of targets [25]. The significant difference in intensity value among bamboo culms of different bamboo du is due to several factors related to the characteristics of Moso bamboo culms. The culm of 1-du bamboo contains a relatively high amount of chlorophyll and is emerald green in color. As the plant ages, the chlorophyll contained in the culm decreases. Hence, the culm color becomes light green first and then greenish-yellow or even grayish white. Because the laser scanner uses a 532 nm green laser, theoretically, the laser intensity values should decrease from bamboo du 1 to 4 with decreasing chlorophyll content. However, an opposite trend is shown in Figure 8, i.e., increasing intensity values from bamboo du 1 to 4. According to the experiments conducted under laboratory conditions, the rate of water content in the culm of 1-du Moso bamboo was about 73% and the water content decreased as bamboo du increased [38]. This may be one reason why the culm intensity values increased with bamboo age in our study. In addition, the material density of bamboo culms was observed to increase with bamboo age [39], which possibly affects the intensity values of bamboo culms of different bamboo du.
The different variation patterns of intensity values from one culm section to another for different bamboo du are also related to the characteristics of Moso bamboo culms. For all bamboo du, the culm color appears gradually lighter from the lowest to the highest culm section. This is because the chlorophyll content decreases from low to high. For both 1-du and 3-du bamboo, the intensity value decreased from the lowest to the highest section, as shown in Figure 8. This conforms to the relationship between spectral reflectance and the amount of chlorophyll. However, the intensity value of 2-du bamboo showed an opposite variation pattern, while the 4-du bamboo culms had undulating intensity values. This is possibly due to the variation of water content and the material density in each culm section.
According to the analysis of laser intensity of Moso bamboo culms, the difference in intensity value among groups of different bamboo du was statistically significant. The post-hoc tests indicated that both the group means of 1-du and 4-du bamboo were significantly different from the means of other groups, whereas the difference between the group means of 2-du and 3-du bamboo were insignificant. Therefore, it is difficult to determine the bamboo age by solely comparing the magnitude of the intensity data of a bamboo culm with that of others. On the other hand, the intensity values from the 1st to the 17th bamboo culm section showed different variation patterns for different bamboo du. The proposed method is based on the models expressing the relationship between intensity and culm section number. Since the models consider both intensity values and variation patterns, the proposed method could derive such high accuracies (>90%), indicating a high potential for using TLS intensity data to determine Moso bamboo age.
The bamboo age determination method proposed in this study has limitations. It has been reported that the forest density and site condition (e.g., elevation, slope, and soil) affect the characteristics of bamboo culms [20] and thus the spectral reflectance of bamboo culms. The models expressing the relationship between intensity and bamboo culm section number were empirically constructed based on the bamboo samples randomly selected from the three sample plots. Although the three 20 m × 20 m sample plots have unsimilar site conditions, i.e., different elevation and slope, the constructed intensity-culm section models may not be transferable to a new site due to the proximity of the three sample plots and the relatively small size of bamboo samples. In a further study, more test sites with different forest density and site conditions should be used for the model construction, and the approaches (e.g., neural network) that can construct more generalized intensity-bamboo age models should be investigated.

6. Conclusions

In this study, we evaluated the potential of using the intensity data generated by TLS technology to determine the Moso bamboo age represented by bamboo “du”. A method is proposed that utilizes the intensity data extracted from each bamboo section to determine the bamboo age. In the method, the intensity data is firstly corrected for the distance and incidence angle effects using a data-driven intensity correction method which constructs an empirical correction model by fitting piecewise polynomials to the intensity data collected using a reference target. Then regression models expressing the relationship between intensity and bamboo culm section number are constructed based on the analysis of the intensity values of bamboo culms of different bamboo du. Based on the intensity-culm section models, the bamboo du is finally determined according to the difference between the estimated and observed intensity values. The results indicate that the adopted intensity correction method decreased the variation range of the intensity values extracted from the same bamboo culm section, which is beneficial for the bamboo age determination. High bamboo age determination accuracies (>90%) were derived for all bamboo du, indicating the efficiency of the proposed bamboo age determination method. However, the empirically constructed intensity correction model is closely related to the instrument characteristics of the laser scanner and may be unsuitable for other laser scanners with different instrument characteristics. Further research could consider using naturally homogeneous surfaces during model construction so that the data collection step based on a reference target can be omitted. The regression models expressing the relationship between intensity and bamboo section number were empirically constructed using the bamboo plant samples from a relatively small-size test site, which limits the transferability of the models to a large area. In further studies, more test sites that differ in forest density and site condition should be used for the model construction, and the approaches that can construct more generalized intensity-bamboo age models should be investigated.

Author Contributions

Conceptualization, W.X. and Z.F.; methodology, W.X. and Z.F.; validation, Z.F. and S.D.; formal analysis, W.X., Z.F., and S.D.; investigation, Z.F. and S.F.; writing—original draft preparation, Z.F. and S.D.; writing—review and editing, S.D. and S.F. All authors have read and agreed to the published version of the manuscript.

Funding

This research was funded by the National Virtual Simulation Experiment Teaching Project, grant number SY2018005, National Natural Science Foundation of China, grant number 32101517, Natural Science Foundation of Zhejiang Province, grant number LGF22C160001, Research Fund of Zhejiang A&F University, grant number 2021LFR057, Overseas Expertise Introduction Project for Discipline Innovation, grant number 111 Project D18008.

Institutional Review Board Statement

Not applicable.

Informed Consent Statement

Not applicable.

Data Availability Statement

The data presented in this study are available on request from the corresponding author.

Acknowledgments

The authors would like to acknowledge the anonymous reviewers for their valuable comments.

Conflicts of Interest

The authors declare no conflict of interest.

References

  1. Rashidi, M.; Mohammadi, M.; Sadeghlou Kivi, S.; Abdolvand, M.M.; Truong-Hong, L.; Samali, B. A Decade of modern bridge monitoring using terrestrial laser scanning: Review and future directions. Remote Sens. 2020, 12, 3796. [Google Scholar] [CrossRef]
  2. Liang, X.; Kankare, V.; Hyyppä, J.; Wang, Y.; Kukko, A.; Haggrén, H.; Yu, X.; Kaartinen, H.; Jaakkola, A.; Guan, F.; et al. Terrestrial laser scanning in forest inventories. ISPRS J. Photogramm. Remote Sens. 2016, 115, 63–77. [Google Scholar] [CrossRef]
  3. Liang, X.; Litkey, P.; Hyyppa, J.; Kaartinen, H.; Vastaranta, M.; Holopainen, M. Automatic stem mapping using single-scan terrestrial laser scanning. IEEE Trans. Geosci. Remote Sens. 2012, 50, 661–670. [Google Scholar] [CrossRef]
  4. Strahler, A.H.; Jupp, D.L.B.; Woodcock, C.E.; Schaaf, C.B.; Yao, T.; Zhao, F.; Yang, X.; Lovell, J.; Culvenor, D.; Newnham, G.; et al. Retrieval of forest structural parameters using a ground-based lidar instrument (Echidna®). Can. J. Remote Sens. 2008, 34, S426–S440. [Google Scholar] [CrossRef] [Green Version]
  5. Yang, X.; Strahler, A.H.; Schaaf, C.B.; Jupp, D.L.B.; Yao, T.; Zhao, F.; Wang, Z.; Culvenor, D.S.; Newnham, G.J.; Lovell, J.L. Three-dimensional forest reconstruction and structural parameter retrievals using a terrestrial full-waveform lidar instrument (Echidna®). Remote Sens. Environ. 2013, 135, 36–51. [Google Scholar] [CrossRef]
  6. Zhu, X.; Skidmore, A.K.; Wang, T.; Liu, J.; Darvishzadeh, R.; Shi, Y.; Premier, J.; Heurich, M. Improving leaf area index (LAI) estimation by correcting for clumping and woody effects using terrestrial laser scanning. Agric. For. Meteorol. 2018, 263, 276–286. [Google Scholar] [CrossRef]
  7. Danson, F.M.; Hetherington, D.; Morsdorf, F.; Koetz, B.; Allgower, B. Forest canopy gap fraction from terrestrial laser scanning. IEEE Geosci. Remote Sens. Lett. 2007, 4, 157–160. [Google Scholar] [CrossRef] [Green Version]
  8. Li, Y.; Guo, Q.; Su, Y.; Tao, S.; Zhao, K.; Xu, G. Retrieving the gap fraction, element clumping index, and leaf area index of individual trees using single-scan data from a terrestrial laser scanner. ISPRS J. Photogramm. Remote Sens. 2017, 130, 308–316. [Google Scholar] [CrossRef]
  9. Calders, K.; Newnham, G.; Burt, A.; Murphy, S.; Raumonen, P.; Herold, M.; Culvenor, D.; Avitabile, V.; Disney, M.; Armston, J.; et al. Nondestructive estimates of above-ground biomass using terrestrial laser scanning. Methods Ecol. Evol. 2015, 6, 198–208. [Google Scholar] [CrossRef]
  10. Greaves, H.E.; Vierling, L.A.; Eitel, J.U.H.; Boelman, N.T.; Magney, T.S.; Prager, C.M.; Griffin, K.L. Estimating aboveground biomass and leaf area of low-stature Arctic shrubs with terrestrial LiDAR. Remote Sens. Environ. 2015, 164, 26–35. [Google Scholar] [CrossRef]
  11. Disney, M.; Burt, A.; Wilkes, P.; Armston, J.; Duncanson, L. New 3D measurements of large redwood trees for biomass and structure. Sci. Rep. 2020, 10, 16721. [Google Scholar] [CrossRef] [PubMed]
  12. Ye, W.; Qian, C.; Tang, J.; Liu, H.; Fan, X.; Liang, X.; Zhang, H. Improved 3D stem mapping method and elliptic hypothesis-based DBH estimation from terrestrial laser scanning data. Remote Sens. 2020, 12, 352. [Google Scholar] [CrossRef] [Green Version]
  13. Lin, X.; Gong, Y.; Sun, Y.; Jiang, J.; Zhang, Y.; Wen, X. Analysis of dynamic forest structures based on hierarchical features extracted from multi-station LiDAR scanning. Environ. Sci. Proc. 2021, 3, 21. [Google Scholar] [CrossRef]
  14. Puttonen, E.; Lehtomäki, M.; Litkey, P.; Näsi, R.; Feng, Z.; Liang, X.; Wittke, S.; Pandžić, M.; Hakala, T.; Karjalainen, M. A clustering framework for monitoring circadian rhythm in structural dynamics in plants from terrestrial laser scanning time series. Front. Plant Sci. 2019, 10, 486. [Google Scholar] [CrossRef] [PubMed] [Green Version]
  15. Lv, W.; Zhou, G.; Chen, G.; Zhou, Y.; Ge, Z.; Niu, Z.; Xu, L.; Shi, Y. Effects of Different Management Practices on the Increase in Phytolith-Occluded Carbon in Moso Bamboo Forests. Front. Plant Sci. 2020, 11, 591852. [Google Scholar] [CrossRef] [PubMed]
  16. Gratani, L.; Crescente, M.F.; Varone, L.; Fabrini, G.; Digiulio, E. Growth pattern and photosynthetic activity of different bamboo species growing in the Botanical Garden of Rome. Flora 2008, 203, 77–84. [Google Scholar] [CrossRef]
  17. Li, Z.; Kobayashi, M. Plantation future of bamboo in China. J. For. Res. 2004, 15, 233–242. [Google Scholar] [CrossRef]
  18. Li, P.; Zhou, G.; Du, H.; Lu, D.; Mo, L.; Xu, X.; Shi, Y.; Zhou, Y. Current and potential carbon stocks in Moso bamboo forests in China. J. Environ. Manag. 2015, 156, 89–96. [Google Scholar] [CrossRef]
  19. Xiong, W.; Zhou, F.; Hu, C. Determination of age of Phyllostachys pubescens. Sci. Silvae 1965, 10, 87–88. (In Chinese) [Google Scholar]
  20. Yang, C. Study on age determination of Phyllostachys pubescens. Sci. Silvae 1965, 10, 83–86. (In Chinese) [Google Scholar]
  21. Xu, X.; Du, H.; Zhou, G.; Ge, H.; Shi, Y.; Zhou, Y.; Fan, W.; Fan, W. Estimation of aboveground carbon stock of Moso bamboo (Phyllostachys heterocycla var. pubescens) forest with a Landsat Thematic Mapper image. Int. J. Remote Sens. 2011, 32, 1431–1448. [Google Scholar] [CrossRef]
  22. Yan, Y.; Xia, M.; Fan, S.; Zhan, M.; Guan, F. Detecting the competition between Moso bamboos and broad-leaved trees in mixed forests using a terrestrial laser scanner. Forests 2018, 9, 520. [Google Scholar] [CrossRef] [Green Version]
  23. Zheng, Y.; Xu, W. Volume-biomass conversation model of Moso bamboo shoots based on point cloud data. Laser Optoelectron. Prog. 2020, 57, 212803. (In Chinese) [Google Scholar] [CrossRef]
  24. Li, C.; Cai, Y.; Xiao, L.; Gao, X.; Shi, Y.; Zhou, Y.; Du, H.; Zhou, G. Rhizome extension characteristics, structure and carbon storage relationships with culms in a 10-year moso bamboo reforestation period. Forest Ecol. Manag. 2021, 498, 119556. [Google Scholar] [CrossRef]
  25. Yan, W.Y.; Shaker, A.; Habib, A.; Kersting, A.P. Improving classification accuracy of airborne LiDAR intensity data by geometric calibration and radiometric correction. ISPRS J. Photogramm. Remote Sens. 2012, 67, 35–44. [Google Scholar] [CrossRef]
  26. Coren, F.; Sterzai, P. Radiometric correction in laser scanning. Int. J. Remote Sens. 2006, 27, 3097–3104. [Google Scholar] [CrossRef]
  27. Höfle, B.; Pfeifer, N. Correction of laser scanning intensity data: Data and model-driven approaches. ISPRS J. Photogramm. Remote Sens. 2007, 62, 415–433. [Google Scholar] [CrossRef]
  28. Kaasalainen, S.; Krooks, A.; Kukko, A.; Kaartinen, H. Radiometric calibration of terrestrial laser scanners with external reference targets. Remote Sens. 2009, 1, 144–158. [Google Scholar] [CrossRef] [Green Version]
  29. Errington, A.F.C.; Daku, B.L.F. Temperature compensation for radiometric correction of terrestrial LiDAR intensity data. Remote Sens. 2017, 9, 356. [Google Scholar] [CrossRef] [Green Version]
  30. Tan, K.; Cheng, X. Intensity data correction based on incidence angle and distance for terrestrial laser scanner. J. Appl. Remote Sens. 2015, 9, 094094. [Google Scholar] [CrossRef]
  31. Tan, K.; Cheng, X. Distance effect correction on TLS intensity data using naturally homogeneous targets. IEEE Geosci. Remote Sens. Lett. 2020, 17, 499–503. [Google Scholar] [CrossRef]
  32. Tan, K.; Zhang, W.; Dong, Z.; Cheng, X.; Cheng, X. Leaf and wood separation for individual trees using the intensity and density data of terrestrial laser scanners. IEEE Trans. Geosci. Remote Sens. 2021, 59, 7038–7049. [Google Scholar] [CrossRef]
  33. Xu, T.; Xu, L.; Yang, B.; Li, X.; Yao, J. Terrestrial laser scanning intensity correction by piecewise fitting and overlap-driven adjustment. Remote Sens. 2017, 9, 1090. [Google Scholar] [CrossRef] [Green Version]
  34. Carrea, D.; Abellan, A.; Humair, F.; Matasci, B.; Derron, M.H.; Jaboyedoff, M. Correction of terrestrial LiDAR intensity channel using Oren–Nayar reflectance model: An application to lithological differentiation. ISPRS J. Photogramm. Remote Sens. 2016, 113, 17–29. [Google Scholar] [CrossRef]
  35. Kaasalainen, S.; Jaakkola, A.; Kaasalainen, M.; Krooks, A.; Kukko, A. Analysis of incidence angle and distance effects on terrestrial laser scanner intensity: Search for correction methods. Remote Sens. 2011, 3, 2207–2221. [Google Scholar] [CrossRef] [Green Version]
  36. Fang, W.; Huang, X.; Zhang, F.; Li, D. Intensity correction of terrestrial laser scanning data by estimating laser transmission function. IEEE Trans. Geosci. Remote Sens. 2015, 53, 942–951. [Google Scholar] [CrossRef]
  37. Kashani, A.; Olsen, M.; Parrish, C.; Wilson, N. A review of LiDAR radiometric processing: From ad hoc intensity correction to rigorous radiometric calibration. Sensors 2015, 15, 28099–28128. [Google Scholar] [CrossRef] [Green Version]
  38. Xu, W.; Cheng, X. Impact of plant surface features on 3D laser point cloud. Laser Optoelectron. Prog. 2020, 57, 242802. (In Chinese) [Google Scholar] [CrossRef]
  39. Cui, M.; Yin, Y.; Jiang, X.; Liu, B.; Zhang, S. Variation analysis of physical characteristics in Phyllostachy pubescens stem at different growth ages. J. Fujian Coll. For. 2010, 30, 338–343. (In Chinese) [Google Scholar] [CrossRef]
Figure 1. Photos of Moso bamboo culms of different du. (a) The 1-du bamboo; (b) The 2-du bamboo; (c) The 3-du bamboo; (d) The 4-du bamboo.
Remotesensing 14 02550 g001
Figure 2. Test site location (yellow rectangle) and three sample plots (red triangles). The Landsat 8 image of 30 m resolution was acquired in December 2019 and was downloaded from the website of the U.S. Geological Survey.
Remotesensing 14 02550 g002
Figure 3. Flowchart of bamboo age determination.
Remotesensing 14 02550 g003
Figure 4. The relationship between raw laser intensity and distance or incidence angle. (a) The relationship between laser intensity and distance; (b) The relationship between laser intensity and incidence angle.
Remotesensing 14 02550 g004
Figure 5. Extraction of laser intensity values from a culm section.
Remotesensing 14 02550 g005
Figure 6. Laser intensity of Moso bamboo plants of different ages. For each du, the intensity value of a single culm section is the mean intensity value of all bamboo plants of the same du. The central lines within each box are the medians. The boxes’ edges represent the upper and lower quantiles. (a) The 1-du bamboo; (b) The 2-du bamboo; (c) The 3-du bamboo; (d) The 4-du bamboo.
Remotesensing 14 02550 g006
Figure 7. Boxplot of laser intensity values of bamboo culms of different bamboo du. The central lines within each box are the medians. The boxes’ edges represent the upper and lower quantiles.
Remotesensing 14 02550 g007
Figure 8. Polynomial fitting results for different bamboo du.
Remotesensing 14 02550 g008
Figure 9. Comparison of original and corrected laser intensity values of the flat target used in the experiments. (a) Correction for the distance effect; (b) Correction for the incidence angle effect.
Remotesensing 14 02550 g009
Table 1. Main parameters of Leica ScanStation C5 terrestrial laser scanner.
Parameter NameParameter Value
Maximum range300 m @ 90% albedo
Wavelength532 nm
Field of view360° (horizontal), 270° (vertical)
Scan rate50,000 pts/s
Table 2. Selection of piecewise polynomial degrees.
N1N2N3N4RMSERMSERMSERMSE
R ≤ 9.9 mR > 9.9 mθ ≤ 45°θ > 45°
22224.002.086.6722.43
33332.313.157.3825.81
44443.489.0110.8918.44
55551.988.2411.2327.51
66662.718.919.0833.37
Table 3. Post-hoc test results of one-way ANOVA for comparing each pair of group means. Each group consisted of the average intensity values of individual bamboo culms of the same du.
Bamboo Du (I)Bamboo Du (J)Difference in Group Means (I-J)Significance
12−58.50.000
3−50.10.000
4−143.00.000
2158.50.000
38.40.307
4−84.50.000
3150.10.000
2−8.40.307
4−92.90.000
41143.00.000
284.50.000
392.90.000
Table 4. Coefficient of variation of the laser intensity values of the flat target before and after the intensity correction.
Type of CorrectionCoefficient of Variation
Before CorrectionAfter Correction
Distance Correction0.00210.0007
Angle Correction0.62070.0094
Table 5. Validation results of the proposed bamboo du determination method.
Bamboo DuNumber of SamplesNumber of Successful DiscriminationsAccuracy Rate (%)
1302996.7
23030100.0
3302893.3
43030100.0
Publisher’s Note: MDPI stays neutral with regard to jurisdictional claims in published maps and institutional affiliations.

