Article

Analysis of the Variability and Influencing Factors of Ice Thickness during the Ablation Period in Qinghai Lake Using the GPR Ice Monitoring System

1
College of Geography and Environmental Science, Northwest Normal University, Lanzhou 730070, China
2
College of Forestry Engineering, Gansu Forestry Polytechnic, Tianshui 741020, China
3
Dalian Zhongrui Science and Technology Development Co., Ltd., Dalian 116000, China
4
Surveying and Mapping Engineering Institute of Gansu Province, Lanzhou 730070, China
*
Author to whom correspondence should be addressed.
Remote Sens. 2022, 14(10), 2437; https://doi.org/10.3390/rs14102437
Submission received: 7 April 2022 / Revised: 14 May 2022 / Accepted: 18 May 2022 / Published: 19 May 2022
(This article belongs to the Topic Cryosphere: Changes, Impacts and Adaptation)

Abstract

:
As a reliable indicator of regional climate change, the growth and decline of lake ice thickness affect the regional intra–annual heat and energy balance. In this study, a ground-penetrating radar (GPR) ice monitoring system, located approximately 1.7 km west of Bird Island in Qinghai Lake, in the territory of Qinghai Province and located in northwest China, was designed to carry out continuous fixed–point observations of local ice thickness and meteorological elements from 7 to 24 March 2021. The characteristics of continuous daily changes in ice thickness during the ablation period of Qinghai Lake and their relationship with meteorological elements were analyzed. The results showed that the average daily ice thickness of Qinghai Lake increased and then decreased during the observation period, with an average ice thickness of 42.83 cm, an average daily ice thickness range of 39.35~46.15 cm, and a growth rate of 0.54 cm/day during 8–13 March 2021, with an ice melting rate of −0.61 cm/day during 14–24 March 2021. The daily ice thickness variations were divided into two phases, which were relatively stable before dawn and followed a decreasing, increasing, and then decreasing trend during 8–13 March 2021 and a decreasing, increasing (for several hours), and then decreasing trend during 14–24 March 2021. There was a significant positive correlation (R = 0.745, p < 0.01) between near-surface air temperature and ice surface temperature during the observation period, but a significant negative correlation (R = −0.93, p < 0.05) between the average daily ice thickness and cumulative temperature of the ice surface. Temperature was the dominant factor affecting lake ice thickness, as compared to near-surface air humidity, wind speed, and illuminance. However, a sudden increase in wind speed have also played an important role at certain periods. A large number of cracks appeared on the ice surface on 26 March 2021, which, combined with the forces of wind speed, wind direction, and temperature, contributed to the rapid melt of the lake ice. This study filled the gap in situ measurement data on the continuous ice thickness variability during the ablation period in Qinghai Lake. It provided scientific support for the further study of lake ice on the Qinghai–Tibet Plateau (QTP).

Graphical Abstract

1. Introduction

The Qinghai–Tibet Plateau (QTP) is known as the “Roof of the World” [1] and the “Water Tower of Asia” [2,3], where several freshwater, brackish, and salt lakes have developed [4]. The thermal cycles of lakes have a significant impact on the regional and global climate [3,5], making it a hotspot for researching ecological changes in the QTP and its surrounding areas [6,7]. Influenced by QTP’s geographical location and climatic conditions, its lakes experience long seasonal ice periods each year [8], during which the formation and melting of lake ice affect the regional energy balance, resulting in complex feedback to regional climate change. So far, many lake ice studies on the QTP have focused on ice phenology rather than ice thickness, such as research in Qinghai Lake [4,9,10], Nam Co [11,12,13,14], Siling Co [15], and Lake Ngoring [16], as well as the typical lakes on the northern slopes of the Himalayas [17], and the Hoh Xil region [18] on the QTP.
Ice thickness, one of the important physical parameters of lake ice [9], and morphology, directly determine the process and rate of the water–air energy exchange. This, in turn, affects the kinematic deformation, that is, the freezing and melting process of lake ice [19], as well as changes the light field of the water body [20] and its nutrient cycling [21], resulting in important ecological and economic impacts [22]. To monitor ice thickness, traditional methods have used manual drilling, pressure sensors, electromagnetic induction, and other equipment for fixed-point observation with issues related to low efficiency, difficult data access, insufficient power supply, and poor safety [23]. Benefiting from the development of microwave technology, the satellite-based Synthetic Aperture Radar [24] and satellite altimeter methods [25] have obtained large-scale ice thickness data, but with deficiencies in ease of data acquisition, low temporal and spatial resolution, poor continuous observability, and recognizing geographical differences. The introduction of ground–penetrating radar (GPR) has provided powerful technical support for acquiring lake (river) ice thickness data, and different media has been distinguished using different GPR frequencies. Galley et al. [26] measured snow and ice thickness at the Churchill Estuary using 250 MHz and 1 GHz dual-frequency GPR. Stevens et al. [27] described a multi-frequency GPR system with 50 MHz, 100 MHz, and 250 MHz antennas that identified shallow subsurface features of floating and grounded ice, water depth, and sedimentary formation in the nearshore Mackenzie Delta in northwest Canada. A 200 MHz GPR was applied to detect the ice thickness around the bridge piers of the Yellow River, which provided basic data for the analysis of the freezing and melting processes of the river ice and the management of ice jams and dams in spring [28]. Fu et al. [29] performed a study with dual-frequency GPR with 100 MHz and 1500 MHz antennas to measure ice thickness and water depth in the Mohe section of the Heilongjiang River and the Togtok section of the Yellow River in Inner Mongolia. They found that the developed double–frequency GPR was suitable for in situ measurement of ice thickness and water depth in rivers during ice periods. Jin [30] monitored ice thickness in Gahai on the eastern side of Qinghai Lake using 400 MHz airborne ice radar. It determined the general ice thickness distribution in the lake area with thicker characteristics in the northwest and thinner in the southeast. The above-mentioned GPR based on different frequencies for ice thickness measurements has the advantages of high efficiency, accuracy, and controllability, but the limitations of battery power hinder the acquisition of ice thickness data over large areas for long time series [9]. Therefore, prolonged power supply facilities have been critical to the continuous fixed-point observation of ice thickness. In addition, various meteorological elements could be monitored if the GPR site was equipped with an automatic meteorological station, which could be of great significance for understanding ice thickness variations and the mechanism contributing to local energy balance.
Qinghai Lake is the largest saltwater lake in China and an important water body that maintains the ecological security of the northeastern QTP. Typically, Qinghai Lake freezes in mid-December and early January. The ice melt occurs in mid–late March and early April, with a freezing period of approximately 88 days each year [31]. Liu et al. [32] reported an alkenone–based reconstruction of late Holocene temperature changes in Qinghai Lake over the past 3500 years. The results indicated up to a 1 °C change in mean annual air temperature and a 2 °C change in summer lake water temperature during the late Holocene of Qinghai Lake, with oscillating warm and cold periods that could be related to the 20th-century warm period, the Little Ice Age, the Medieval Warm Period, the Dark Ages Cold Period, and the Roman Warm Period. Subsequently, Qinghai Lake had delayed freezing but advanced ablation, with shortened complete freezing and ice coverage duration by 14.84 days and 21.21 days, respectively, from 1979 to 2016 [33]. As compared to lake ice phenology [4,9,31,33,34,35,36], there have been few studies on lake ice thickness and its temporal-spatial variation in Qinghai Lake, and these include existing studies using fixed–point ice thickness observation [4] and intermittent radar observation [9]. In this study, a GPR ice monitoring system equipped with an automatic meteorological station was used to measure the local ice thickness and meteorological factors in Qinghai Lake during the ablation period. Furthermore, our goal was to understand the changing characteristics of lake ice thickness over a continuous melting period at Qinghai Lake and explore the relationship between lake ice thickness and local meteorological factors such as temperatures, wind speed, near-surface air humidity, and illumination. In addition, this study filled the gap of in situ data based on the continuous changes in ice thickness during the melting period at Qinghai Lake. It provided an evidence-based foundation for future in-depth studies of lake ice on QTP.

2. Lake Ice Monitoring System and Methods

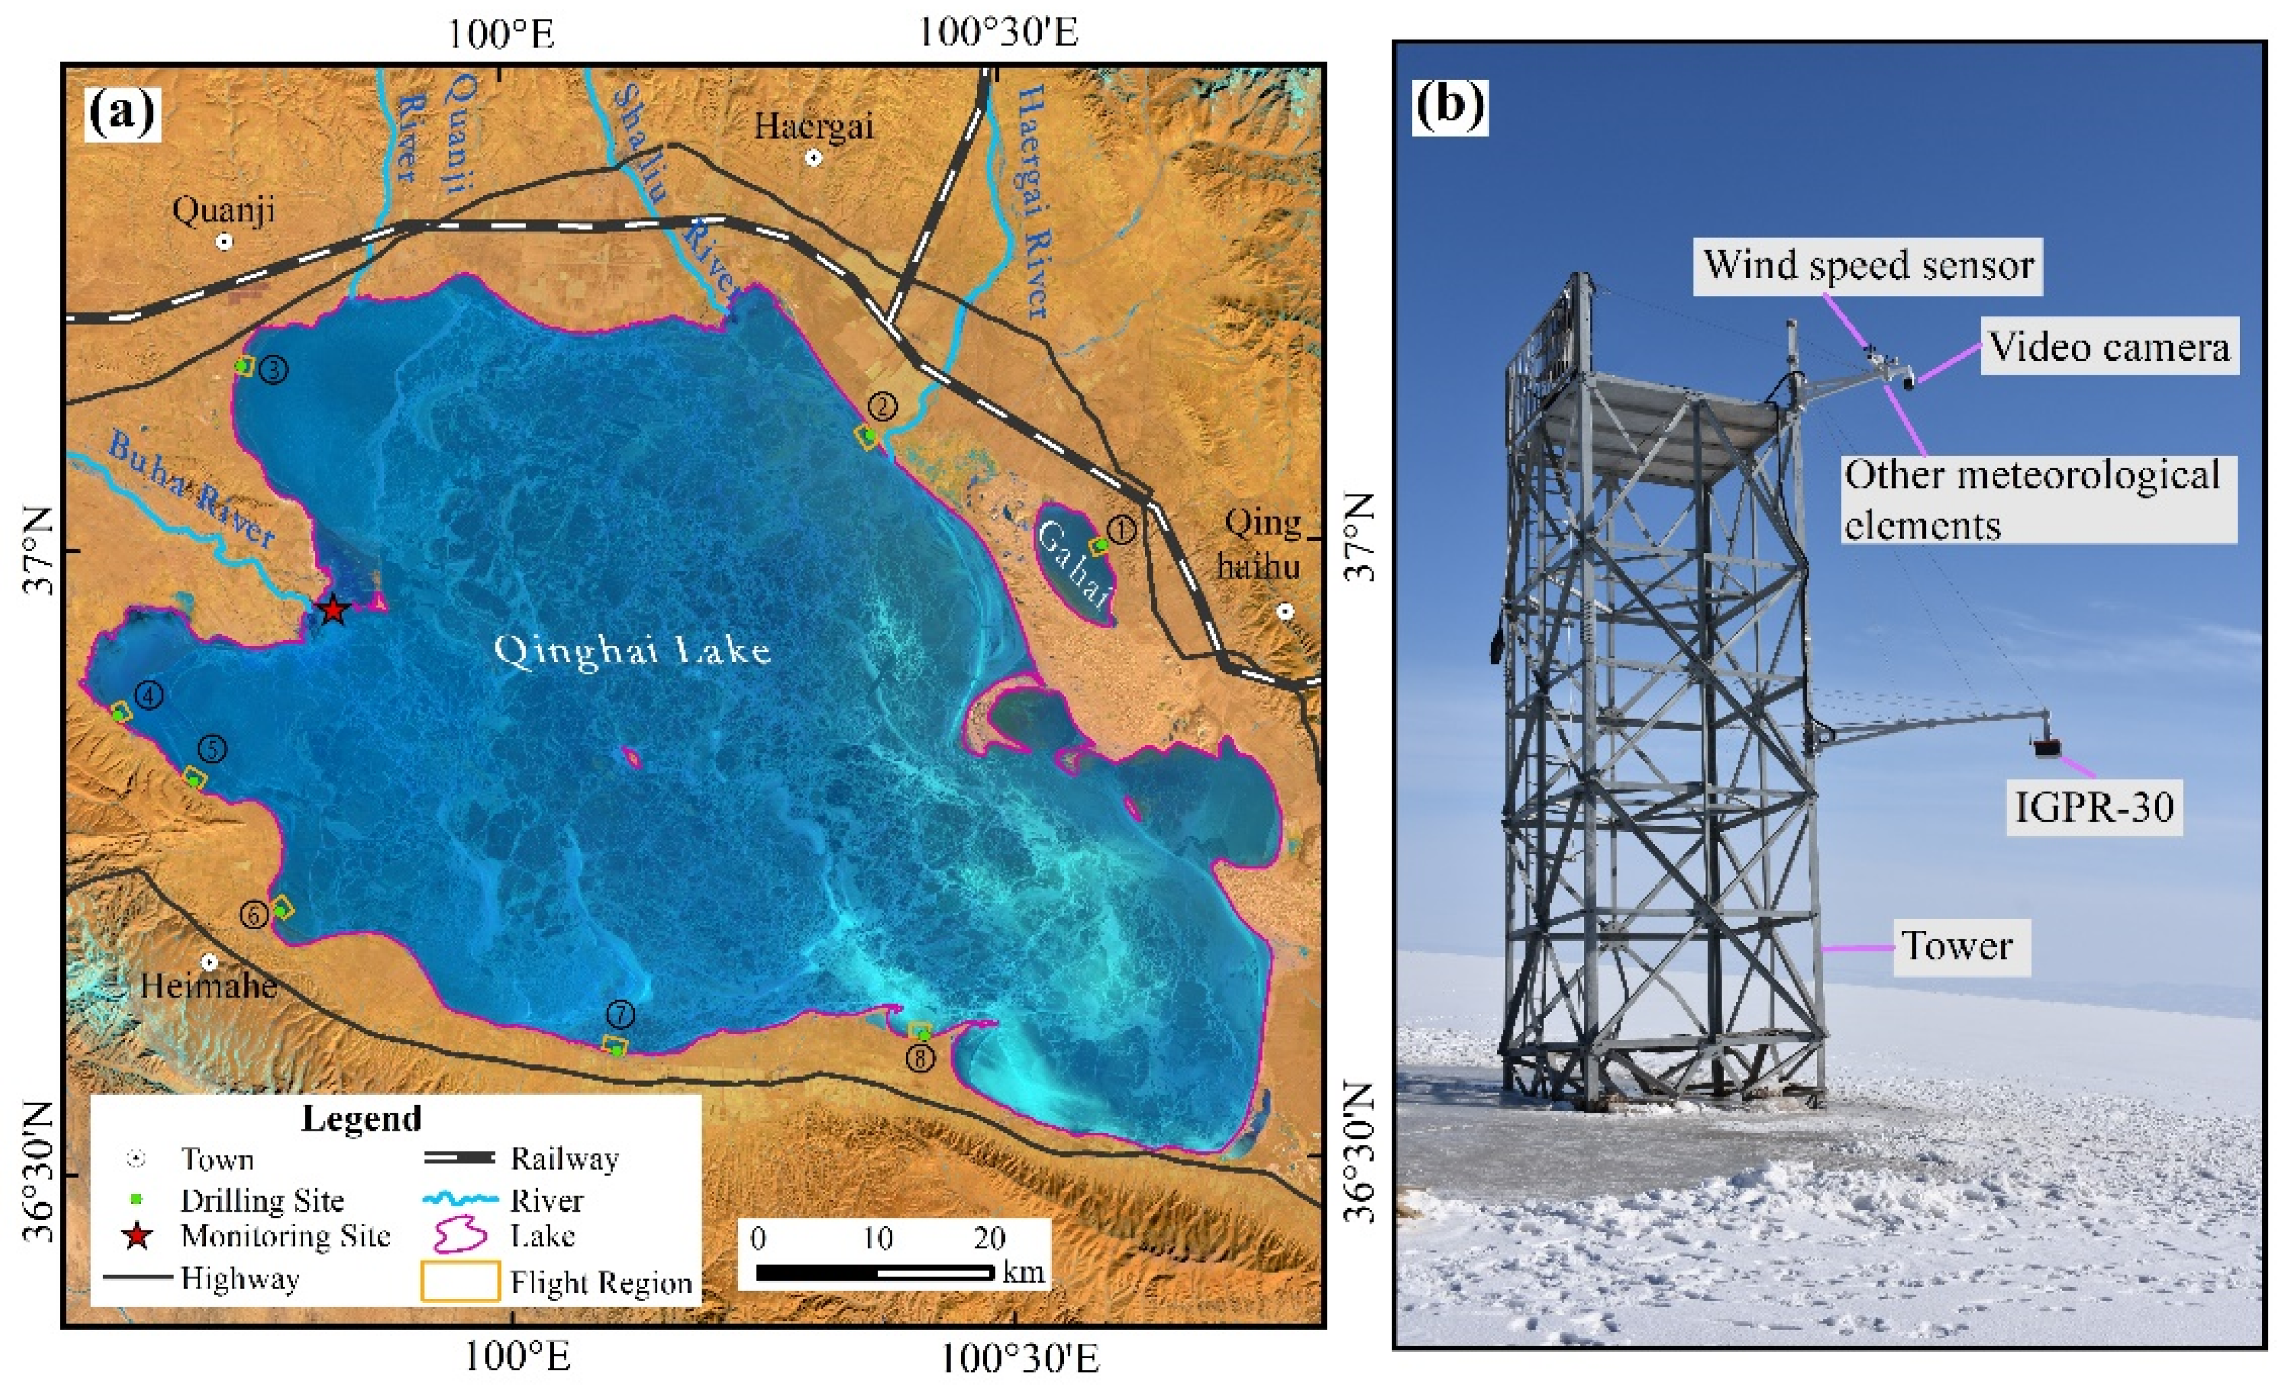
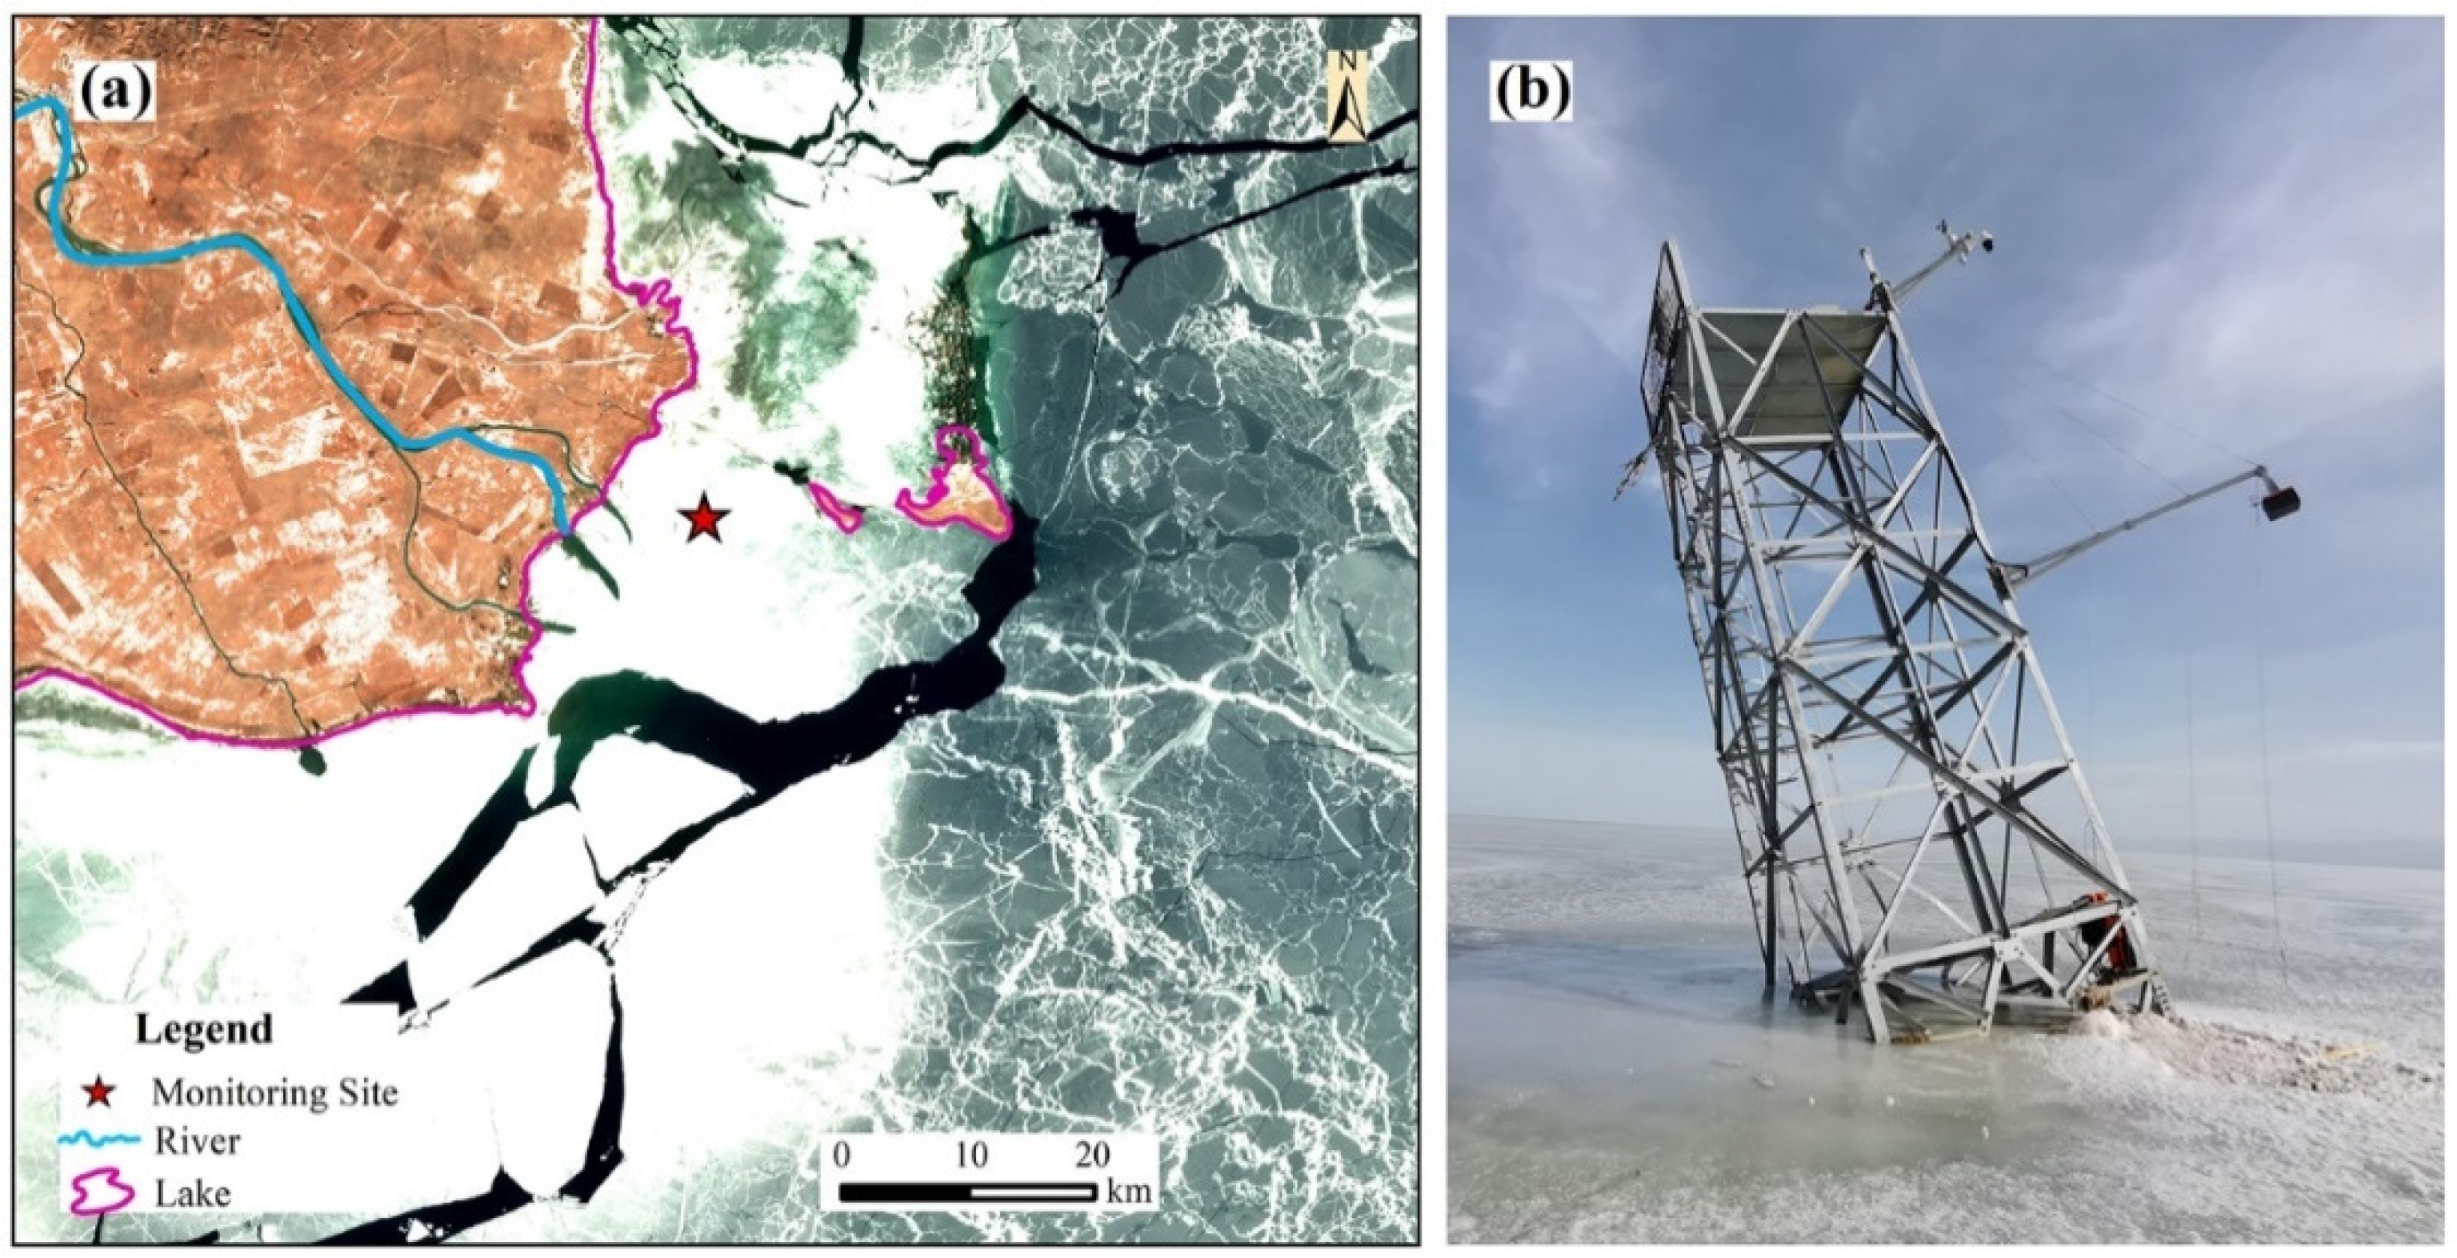
2.1. GPR Ice Monitoring System Introduction and Deployment

GPR is a device that transmits high-frequency electromagnetic waves in the form of wideband short pulses via a transmitting antenna and then receives echo signals reflected from the target to the surface by a receiving antenna. When electromagnetic waves propagate through a medium, their path, electromagnetic field strength, and the electrical properties of the medium vary with the geometrical state changes in the object interface. The interior structure of the medium can be discriminated based on information such as the two–way travel time, amplitude, and phase of the reflected echoes [28,37]. Benefiting from the fast detection speed, continuous detection process, high detection accuracy, and safe operation [38], GPR is especially suitable for ice investigation and monitoring in complex operational environments where manual operation has been impossible or too risky [39]. Moreover, due to the low propagation attenuation rate and strong penetration of the electromagnetic waves emitted by GPR in ice medium, it has been widely used to study ice thickness and subglacial topography [40]. In this study, the GPR instrument used to measure the ice thickness of Qinghai Lake at a fixed–point was IGPR–30, which was manufactured by Dalian Zhongrui Science and Technology Development Company, China, and had previously been combined with an M600 Pro drone (manufactured by DJI Innovation Technology Co. in China), GPS antenna, camera, data acquisition software, and post-processing software, to form a fly-by-wire rapid ice monitoring radar system. With a center frequency of 400 MHz, IGPR–30 could detect the thickness distribution of ice cover, ice accumulation, ice plugs, and dams in real-time, and it featured high operational efficiency, excellent accuracy (millimeter-level ice thickness detection capability), small size, and low power consumption. Table 1 shows the parameters of the GPR ice monitoring system in this study.
The GPR ice monitoring system was deployed on a steel tower approximately 1.7 km west of Bird Island in Qinghai Lake (Figure 1a). The tower, made of steel and anchored in a concrete block at the lake bottom, was 2.15 m below the ice surface and 10.35 m above the ice surface, measured on 6 March 2021, with a length and width of 3.05 m. The water depth measured with a telescopic measuring rod near the tower on the same day was 1.71 m. Radar was mounted on the tower at the height of 4.6 m above the ice surface and fixed to one end of the protruding steel frame, while multiple tow ropes were placed on the steel frame to enhance its stability. The system was installed on 6 March 2021 (Figure 1b), and data collection began the following afternoon. Plenty of instruments, including the IGPR–30, temperature and humidity transmitter, infrared temperature sensor, illuminance tester, wind speed sensor, weathervane, and video camera, were used to collect radar images, near-surface air temperature, near-surface air humidity, ice surface temperature, illuminance, wind speed, wind direction, photographs, and videos, respectively. Data transmission and storage were conducted in the Ice Intelligent Monitoring Cloud Platform via the 4G network. Regarding the amount of data transmission, photographs and videos were collected and transmitted at 30–min intervals, while radar images, temperatures, humidity, wind speed and direction, illumination, and other meteorological elements were collected and transmitted at 1–min intervals.
Unfortunately, observation was forcibly ended due to the steel tower mounted with the GPR ice monitoring system being significantly tilted as of 25 March 2021, and it overturned after three days, dropping the entire ice monitoring system, as well as the tower into the lake. The incident occurred during the rapid melting of the lake ice, and many ice cracks had been formed. Factors such as rising temperatures and wind speed, along with the increase in new cracks and the expansion of the existing cracks by the movement of the lake ice, the tower eventually destabilized and then collapsed. Therefore, the data used in this study were dated 7–24 March 2021. These valuable data, despite the shortened time series, were sufficient for this study to characterize the lake ice ablation period in Qinghai Lake.

2.2. Methods

2.2.1. Radar Data Processing

The radar profile image after the GPR processing of the echo signals was in 1-min increments, which were then resampled to each channel every 30 min, resulting in a total of 835 channels for this study. GPR Studio v2.0 software was used to remove the zero drift (removing the DC component of the echo signals), gain adjustment (amplifying the target echo, Figure 2b), and FIR filtering (Figure 2c) of the radar profile image after resampling (Figure 2a). Finally, the layer–tracking processing allowed a clear distinction between different material interfaces (Figure 2d), with the blue line in Figure 2d indicating the air–ice interface and the purple one indicating the ice/water interface.

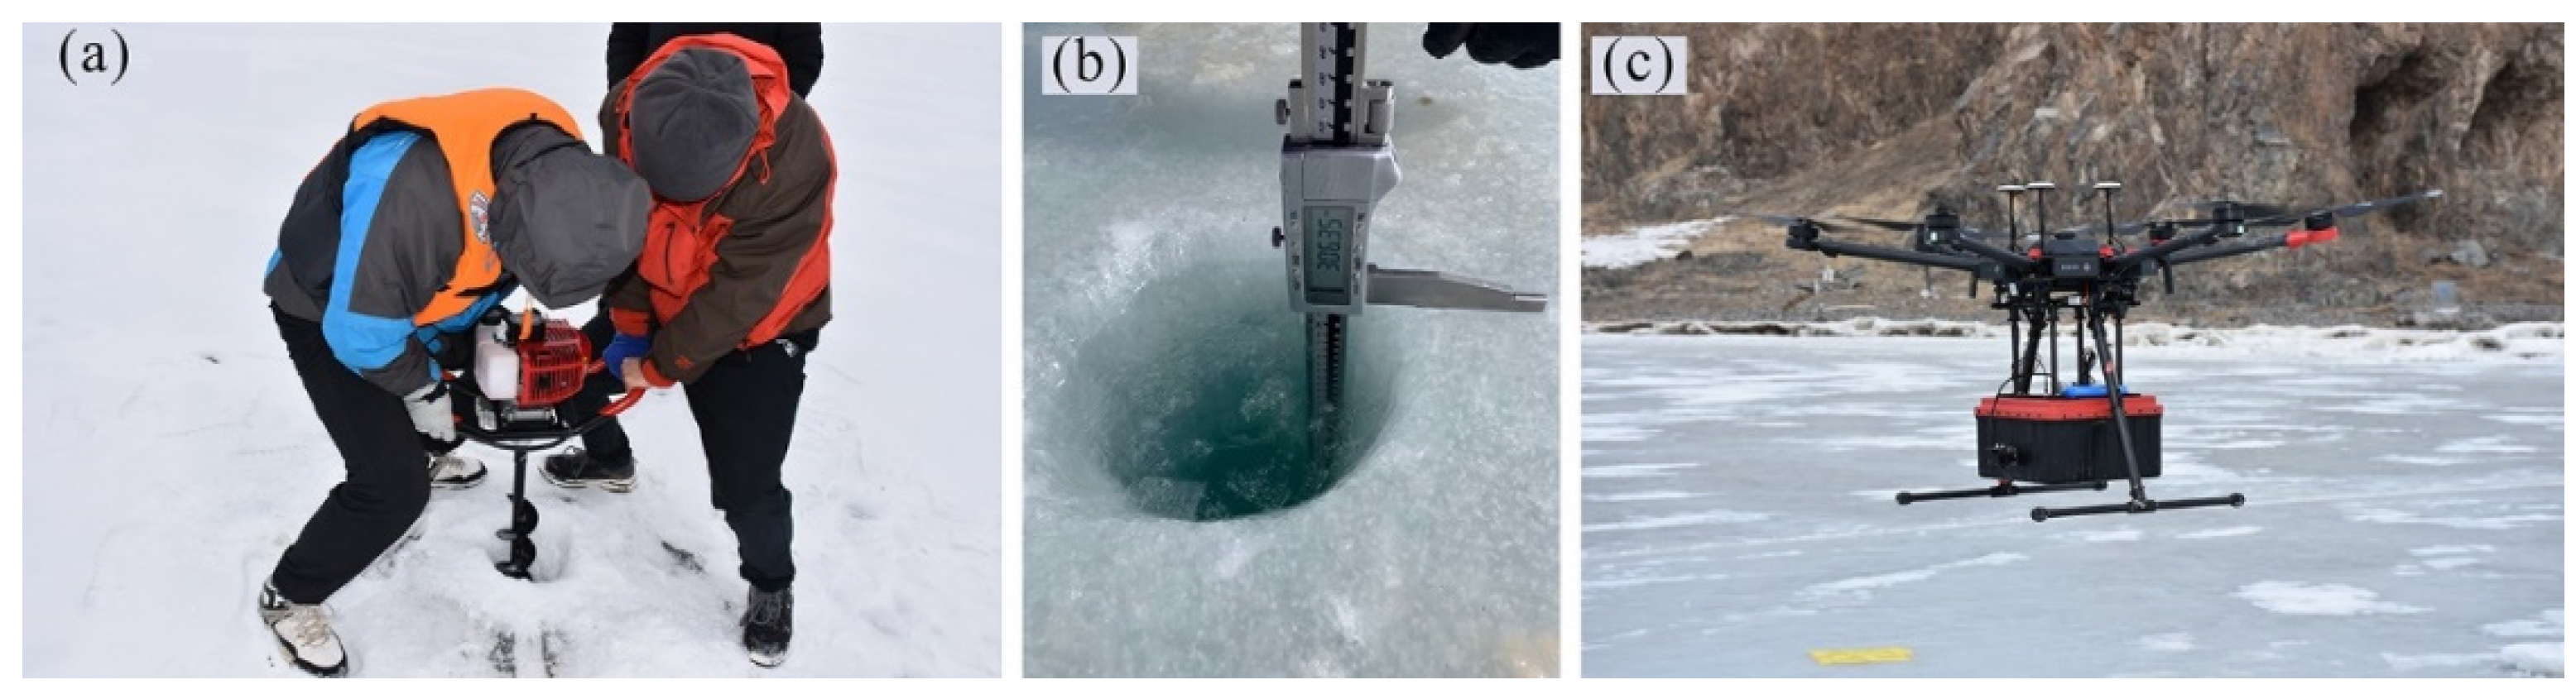
2.2.2. Ice Thickness Verification

Due to the COVID-19 pandemic, field measurements of ice thickness could not be made at the site during the observation period. Our research team conducted the lake ice thickness measurement tests via drilling and airborne ice measuring radar in Qinghai Lake from January 2019 to March 2019, and the distribution of 8 sample sites and the range of the flying area are shown in Figure 1. Both for safety and due to the limitation of battery-powered UAV, the drilling points and the flight region were stationed around the perimeter of the lake [9]. To ensure the spatial and temporal consistency of these two methods, the experiments were conducted simultaneously. After drilling with an ice drill (Figure 3a), the borehole measurement was measured by L–type digital ice measuring tape (accuracy of 0.01 mm, Figure 3b), and the radar measurement was conducted by IGPR–30 (Figure 3c) with UAV as the carrier platform and equipped with components of laser ranging instrument, GPS, high–definition camera, and others. In addition, this radar instrument model and initial parameters (radar center frequency of 400 MHz, number of time windows of 70 ns, and number of sampling points of 1024) corresponded to these used in this study as reference. Table 2 shows drilling data for all sites and simulated ice thickness from airborne ice measuring radar. The results showed that the average value of the dielectric constant was 4.3, with propagation velocity ranging from 0.121 to 0.180 m/ns and an average value of 0.146 m/ns. By calculation, GPR simulated ice thickness error and root mean square error (RMSE) were 1.97 cm and 2.17 cm, respectively, which were significantly correlated with the drilling ice thickness with a correlation coefficient of 0.96 (p < 0.05).

2.2.3. Lake Ice Thickness Calculation

GPR works by the transmitting antenna emitting ultra-high-frequency broadband short-pulse electromagnetic waves to the ice surface, while incident electromagnetic waves change at the air–ice and ice–water interfaces. The reflected waves are received by the receiving antenna, and then the radar measures the two–way travel time of the electromagnetic waves at each level. Furthermore, the GPR radiated electromagnetic pulses downward at an angle of 100° in this study. Combined with the radar setup position at the height of 4.6 m from the ice surface, we obtained the ice thickness data collected by the radar as the average ice thickness within a radius of approximately 5.5 m and an area of approximately 95.03 m2, which was centered on the position point of the radar projection on the lake ice surface. To obtain the ice thickness, the electromagnetic wave propagation speed of the medium was calculated by Equation (1).
ν = ω β = [ μ ε 2 ( 1 + ( σ ω ε ) 2 + 1 ) ] 1 / 2
where v denotes the propagation speed of electromagnetic waves in a medium, ω is the angular frequency, β is phase constant, μ is magnetic permeability, σ is electrical conductivity, and ε is dielectric constant. The majority of media in nature are non–magnetic, non–conductive, and often meet σ ω ε < < 1 ; therefore, Equation (2) [41] is obtained from Equation (1).
ν = c ε r
where c is the speed of electromagnetic wave propagation in a vacuum (0.3 m/ns) and εr is the relative dielectric constant. Assuming that the time for radar waves to reach the air–ice and ice–water interfaces from the transmitting antenna is the same as the time for reflection back to be received by the receiving antenna [9]. Equation (3) is the ice thickness calculation formula [42].
d = ν × ( t 2 t 1 ) / 2 = ( t 2 t 1 ) × c ξ i c e / 2
where d is lake ice thickness (m), t1 indicates the two–way travel time at the air–ice interface (ns), t2 indicates the two–way travel time at the ice–water interface (ns), and εice is the dielectric constant of ice. Jin [30] conducted the ice thickness monitoring at Qinghai Lake in spring 2019 using IGPR–30 (400 MHz) as well as an ice drill and L–type digital ice measuring tape, and they determined the average value of the relative dielectric constant during the freezing period of the lake ice in Qinghai Lake. Based on the same GPR instrument model and close observation of time and geographical position, we adopted the same dielectric constant of 4.3 in this study.

3. Results

3.1. Changes in Lake Ice Thickness during the Observation Period

From 7–24 March 2021, the average daily thickness of lake ice in the GPR monitoring area showed a parabolic pattern, with an increasing and then decreasing trend (Figure 4). It increased at a rate of 0.54 cm/d, with an average ice thickness of 44.29 cm during 7–13 March; however, it decreased at a rate of −0.61 cm/d, with an average ice thickness of 41.99 cm during 14–24 March. The average ice thickness during the observation period was 42.83 cm, with the average daily ice thickness ranging from 39.35 to 46.15 cm, of which the maximum value of 46.15 cm occurred on 13 March, and the minimum of 39.35 cm occurred on 23 March. Throughout the observation period, the average daily ice thickness was greater than 40 cm, except for 21–23 March, and the thickness for 9–17 March was greater than the average value of 42.83 cm. An unusual increase in the average daily ice thickness was observed on 19 and 24 March, corresponding to values of 42.43 and 40.07 cm, respectively, which could have been related to factors involving reduced ice surface temperatures and wind speed as well as deviations in the fixed position of the monitoring instrument. The mean daily variation of ice thickness was 4.24 cm, with a maximum value of 6.89 cm on 20 March and a minimum of 1.48 cm on 24 March. For the moment thickness of lake ice, the maximum value (49.68 cm) occurred on 13 March, and the minimum (36.40 cm) occurred on 23 March, which coincided with the date of the maximum and minimum average daily ice thickness. Furthermore, the mean daily maximum and minimum moment lake ice thickness during the observation period were 45.12 and 40.88 cm, respectively.
Photographs taken at the ice thickness monitoring site in Qinghai Lake showed early snow on the ice surface during 7–13 March 2021, and it completely melted after 14 March 2021 (Figure 5). Snow has a low thermal conductivity, resulting in a blockage in the direct heat exchange process between the lake ice and the atmosphere [43]. At the same time, snow melts due to daytime sunshine. The melt water reaches the ice surface via gaps in the snow and then refreezes on the ice due to the sub-zero night temperatures, resulting in a continuous thickening of the lake ice. During 14–24 March, there were small puddles on the ice surface, and reflections occurred during the day from 12:00 to 14:00 h under sunlight, corresponding to a decreasing trend in the average daily ice thickness.

3.2. Characteristics of Daily Changes in Lake Ice Thickness

Figure 6a shows the daily ice thickness variation for specific days in the observation period. When the average daily ice thickness increased from 7–13 March 2021, the ice thickness exhibited consistent variations throughout the day. It remained relatively stable before dawn, fluctuated slightly in the morning, increased around noon (from 10:30 h on 12–13 March), and then decreased at approximately 17:30 h after reaching the maximum daily ice thickness. During the period of decreasing average daily ice thickness in 14–24 March 2021, the moment thickness of the lake ice also presented with consistent daily changes. The ice thickness showed a continuous decreasing trend before dawn, but the decreasing times varied (5.5 h or less on 15, 16, 20, and 21 March 2021, and more than 8 h on the rest of the days). After reaching the minimum value of daily ice thickness, it increased until reaching the maximum and continued for several hours with minor fluctuations. As compared to the period of 7–13 March, the maximum ice thickness appeared relatively early and increased significantly. Afterward, the ice thickness thinned from 18:00 h but had an abnormal increase at 20:00 and 21:30 on 24 March 2021. Overall, the statistics of the maximum and minimum ice thickness at each moment in the observation period show that the minimums were concentrated between 07:30 and 09:30 h, and the maximums concentrated between 15:30 and 18:00 h (Figure 6b).
The effect of sub-zero temperatures on the previous night, due to near-surface air and ice surface temperature remaining below 0 °C caused ice thickness values to stabilize in the early morning hours during 8–13 March 2021. However, the positive daytime temperatures of the previous day led to a gradual increase in daily cumulative temperatures, resulting in a gradual decrease in ice thickness each morning from 14–24 March 2021. There was a lagging effect of the ice thickness variation in response to the changing temperatures [4,20], which was the main reason for the maximum ice thickness occurring in the afternoon. It was worth noting that snow ice appeared on the surface of the ice sheet due to alternating positive and negative temperatures near the midday hours [44]. A small amount of meltwater appeared on the uppermost surface of the lake ice, with the ice crystal structure changing and air bubbles pouring into the ice; therefore, the internal structure of the ice became complex. The effects of meltwater on the ice surface were discussed in the discussion section.

3.3. Analysis of Factors Influencing the Lake Ice Thickness

In addition to external factors such as near-surface air temperatures, ice surface temperatures, near-surface air humidity, solar radiation, sunshine hours, wind speed and direction, as well as rain, snow, and dust storms [10,12,43,45,46,47], the variations in lake ice thickness were also influenced by internal ice structure aspects such as crystal type, surface structure, ice transparency, bubble content, bubble morphology, salinity, subglacial temperatures, as well as latent and sensible heat [8,20,48,49]. Based on the meteorological elements collected by the GPR ice monitoring system, the influences on the variations in the lake ice thickness were analyzed in this study.

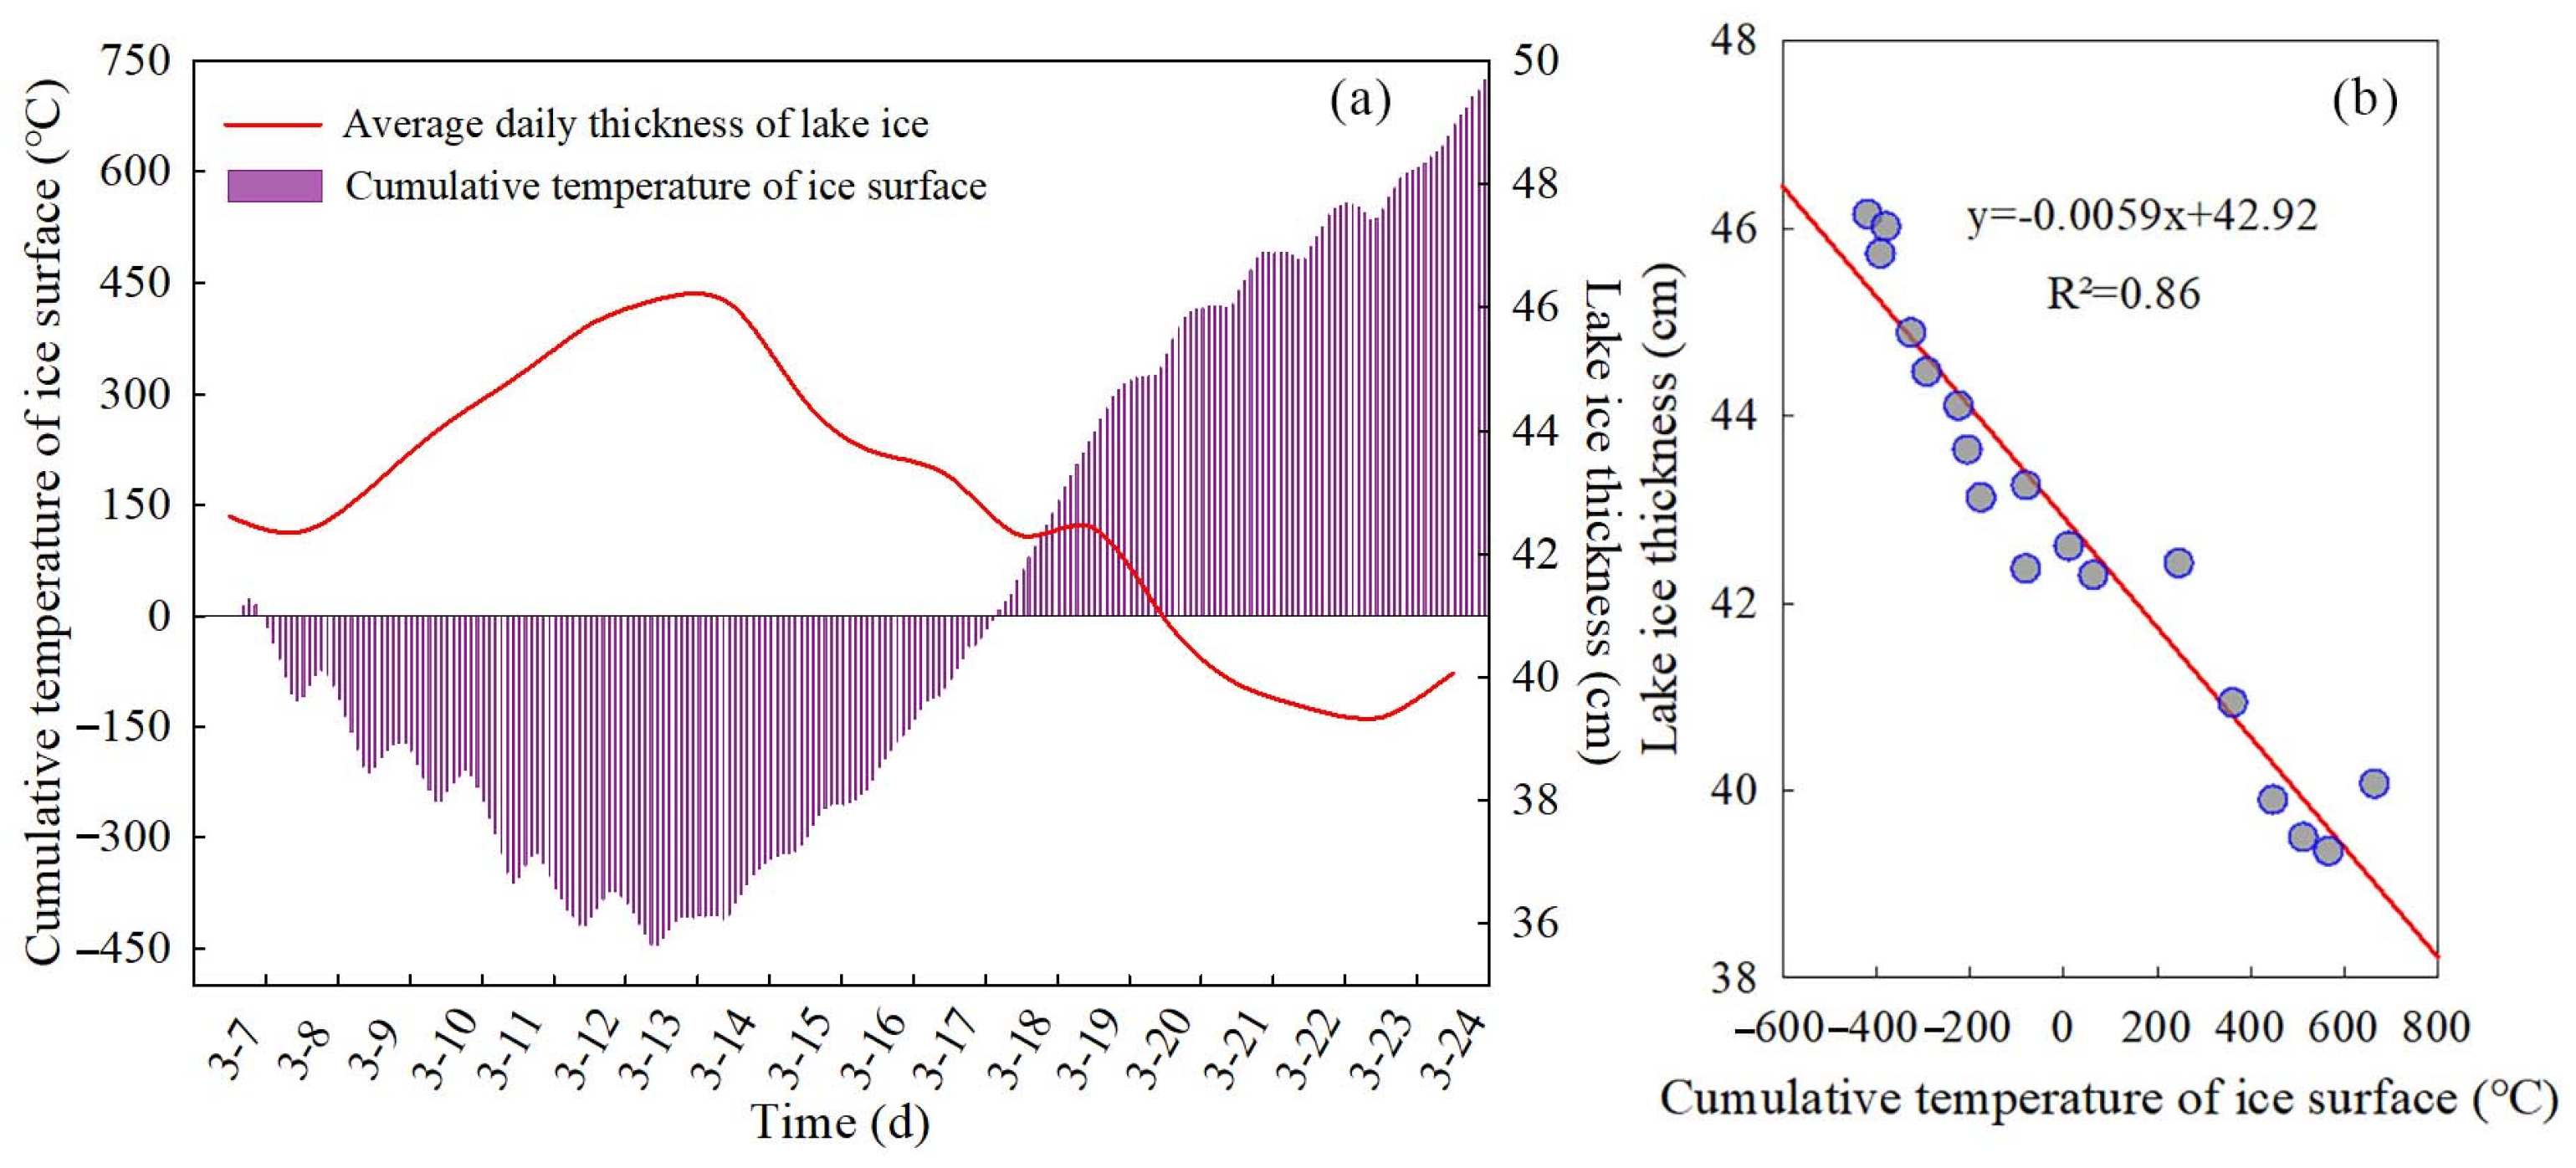
3.3.1. Effects of Temperature Changes and Cumulative Temperature on Lake Ice Thickness

Several studies have shown that temperature was the most important factor influencing lake ice thickness [46,48]. The curves of near-surface air and ice surface moment and average daily temperatures during the observation period (Figure 7) indicated that the daily near-surface air moment temperature varied between positive and negative values, with a decreasing, increasing, and then decreasing trend, with an unusual increase occurring during the decreasing period on individual dates, such as 8, 10, 12, 14, and 22 March 2021. The decreasing rates of daily near-surface air temperatures were more rapid during 7–15 March 2021 and slower during 16–23 March. The maximum and minimum near-surface moment temperatures during the ice thickness monitoring period were 16.32 and −16.27 °C, respectively. The maximum daily near-surface moment temperature ranged from 0.49 to 16.32 °C, with the most frequent occurrence between 11:00 and 13:00 h, and the minimum ranged from −16.27 to −3.98 °C, with the most frequent occurrence at 06:30 to 08:00 h. During the observation period, the average daily near-surface air temperature varied from −7.10 to 1.10 °C, presenting a generally decreasing, slowly increasing, decreasing, and then increasing trend, with positive average daily temperature on 14, 17, 18, and 24 March 2021, corresponding to 0.75, 1.10, 0.47 and 1.04 °C, respectively. The average near-surface air temperature throughout the observation period was −2.32 °C. The statistics on the daily variations of near-surface air temperatures and ice surface temperatures (Figure 8) indicated that the near-surface air temperatures varied the most on 11 March 2021 with a value of 26.78 °C, followed by 15 March 2021 at 26.17 °C and the least on 19 March 2021 at 6.98 °C. In addition, there were seven days that the near-surface air temperature varied by 20 °C or more.
The ice surface temperatures varied less than the near-surface air temperatures. The daily ice surface temperature trend had a positive correlation with the near-surface air temperatures (R = 0.745, p < 0.01); it first decreased and then increased, reaching the daily maximum temperatures at 12:00 h and then having a continuous decrease with an unusual increase on individual days (Figure 7). The maximum and minimum of the momentary ice surface temperature during the observation period were 5.96 and −7.54 °C, respectively. The daily maximum of the ice surface temperatures ranged from 3.65 to 5.96 °C, mostly occurring between 10:00 and 15:00 h, while the minimum ranged from −7.54 to 2.27 °C, mostly occurring between 02:30 and 03:30 h and between 05:30 and 07:00 h. The average daily ice surface temperatures varied between −2.45 and 3.61 °C, with a general trend of upward fluctuation followed by a slow decline, in which it was negative from 7–14 March and positive after that, and the ice surface moment temperatures were positive throughout the day in 14–19 March 2021. The average ice surface temperature during the observation period was 0.88 °C. The highest daily variations exceeded 10 °C in ice surface temperatures, which were 11.83°C on 11 March 2021, followed by 11.06, 11.06, and 10.48 °C on 10, 9, and 8 March 2021, respectively, and the smallest variation was 3.32 °C on 18 March 2021 (Figure 8).
In daily morning ice thickness variations, there was an anomalous decrease on 13 March 2021 during a continuous ice thickness increase, 8–14 March 2021, and an anomalous increase on 19 and 22 March during a period of continuous ice thickness decrease in 14–24 March 2021. Analysis of the moment temperature changes of the ice surface and near-surface air showed that the ice surface moment temperature was higher in the early hours of 13 March than it had been during the night, 7–12 March. From the night of 18 March to the wee hours of 19 March and the night of 21 March to the early hours of 22 March, both the near-surface air and ice surface temperatures decreased to different degrees. On 19 March 2021, the ice surface temperature decreased slightly while reaching the lowest value for several days on the early morning of 22 March. Therefore, we concluded that the lake ice thickness was sensitive to the temperature on the ice surface and played a decisive role in the changes in lake ice thickness, while other meteorological factors had not been considered. Moreover, decreasing temperatures increased lake ice thickness, but increasing temperatures thinned it.
A certain thermal relationship between the lake ice surface temperatures and the lake ice thickness was shown in a previous study [50]. The cumulative temperatures of the ice surface were an important physical quantity. In the study by Qu et al. [12], they found that Nam Co Lake had a significant association between the freezing period of the lake ice and the negative winter cumulative temperature during the period 2006–2011. Zhang et al. [49] studied the relationship between positive cumulative temperatures of the ice and lake ice thickness during the ablation period of the Wuliang Suhai lake and found a good correlation between them. During the observation period, the combination of snow cover on the ice surface and alternating ice temperatures between positive and negative values affected lake ice thickness from 7–13 March. Cumulative temperatures of the ice surface were calculated for the entire observation period. The plot of the relationship between it and the lake ice thickness for the observation period (Figure 9a) showed that the cumulative temperatures of the ice surface fluctuated decrease in 7–13 March 2021 and reached their lowest value on the morning of 13 March 2021 before, fluctuated upwards during 14–24 March. The lagging effect of the lake ice thickness on the cumulative temperatures of the ice surface during the observation period was significant. We calculated the time when the daily minimum or maximum cumulative temperatures of the ice surface corresponded to the maximum or minimum thickness of the lake ice, respectively. The results showed that the lag time was the shortest on 15 March (3.5 h) and the longest on 22 March (10.5 h), with a lag time concentrated in the range of 6.5–9.5 h for 12 days, and the average lag time for the observation period was approximately 7.5 h. Additionally, the average daily lake ice thickness was highly correlated with variations in the cumulative temperatures of the ice surface, with increased during 7–13 March, maximum on the afternoon of 13 March, and generally decreased during 14–23 March, following a slight increase on 24 March. The decreases or increases of cumulative temperatures of the ice surface were accompanied by the increases or decreases of the average daily lake ice thickness, respectively. Therefore, the various degrees of cumulative temperatures of the ice surface directly impacted the lake ice thickness. The correlation analysis of the average daily cumulative temperatures of the ice surface and the average daily thickness of lake ice showed a significant negative correlation of −0.93 when p < 0.05 (Figure 9b).

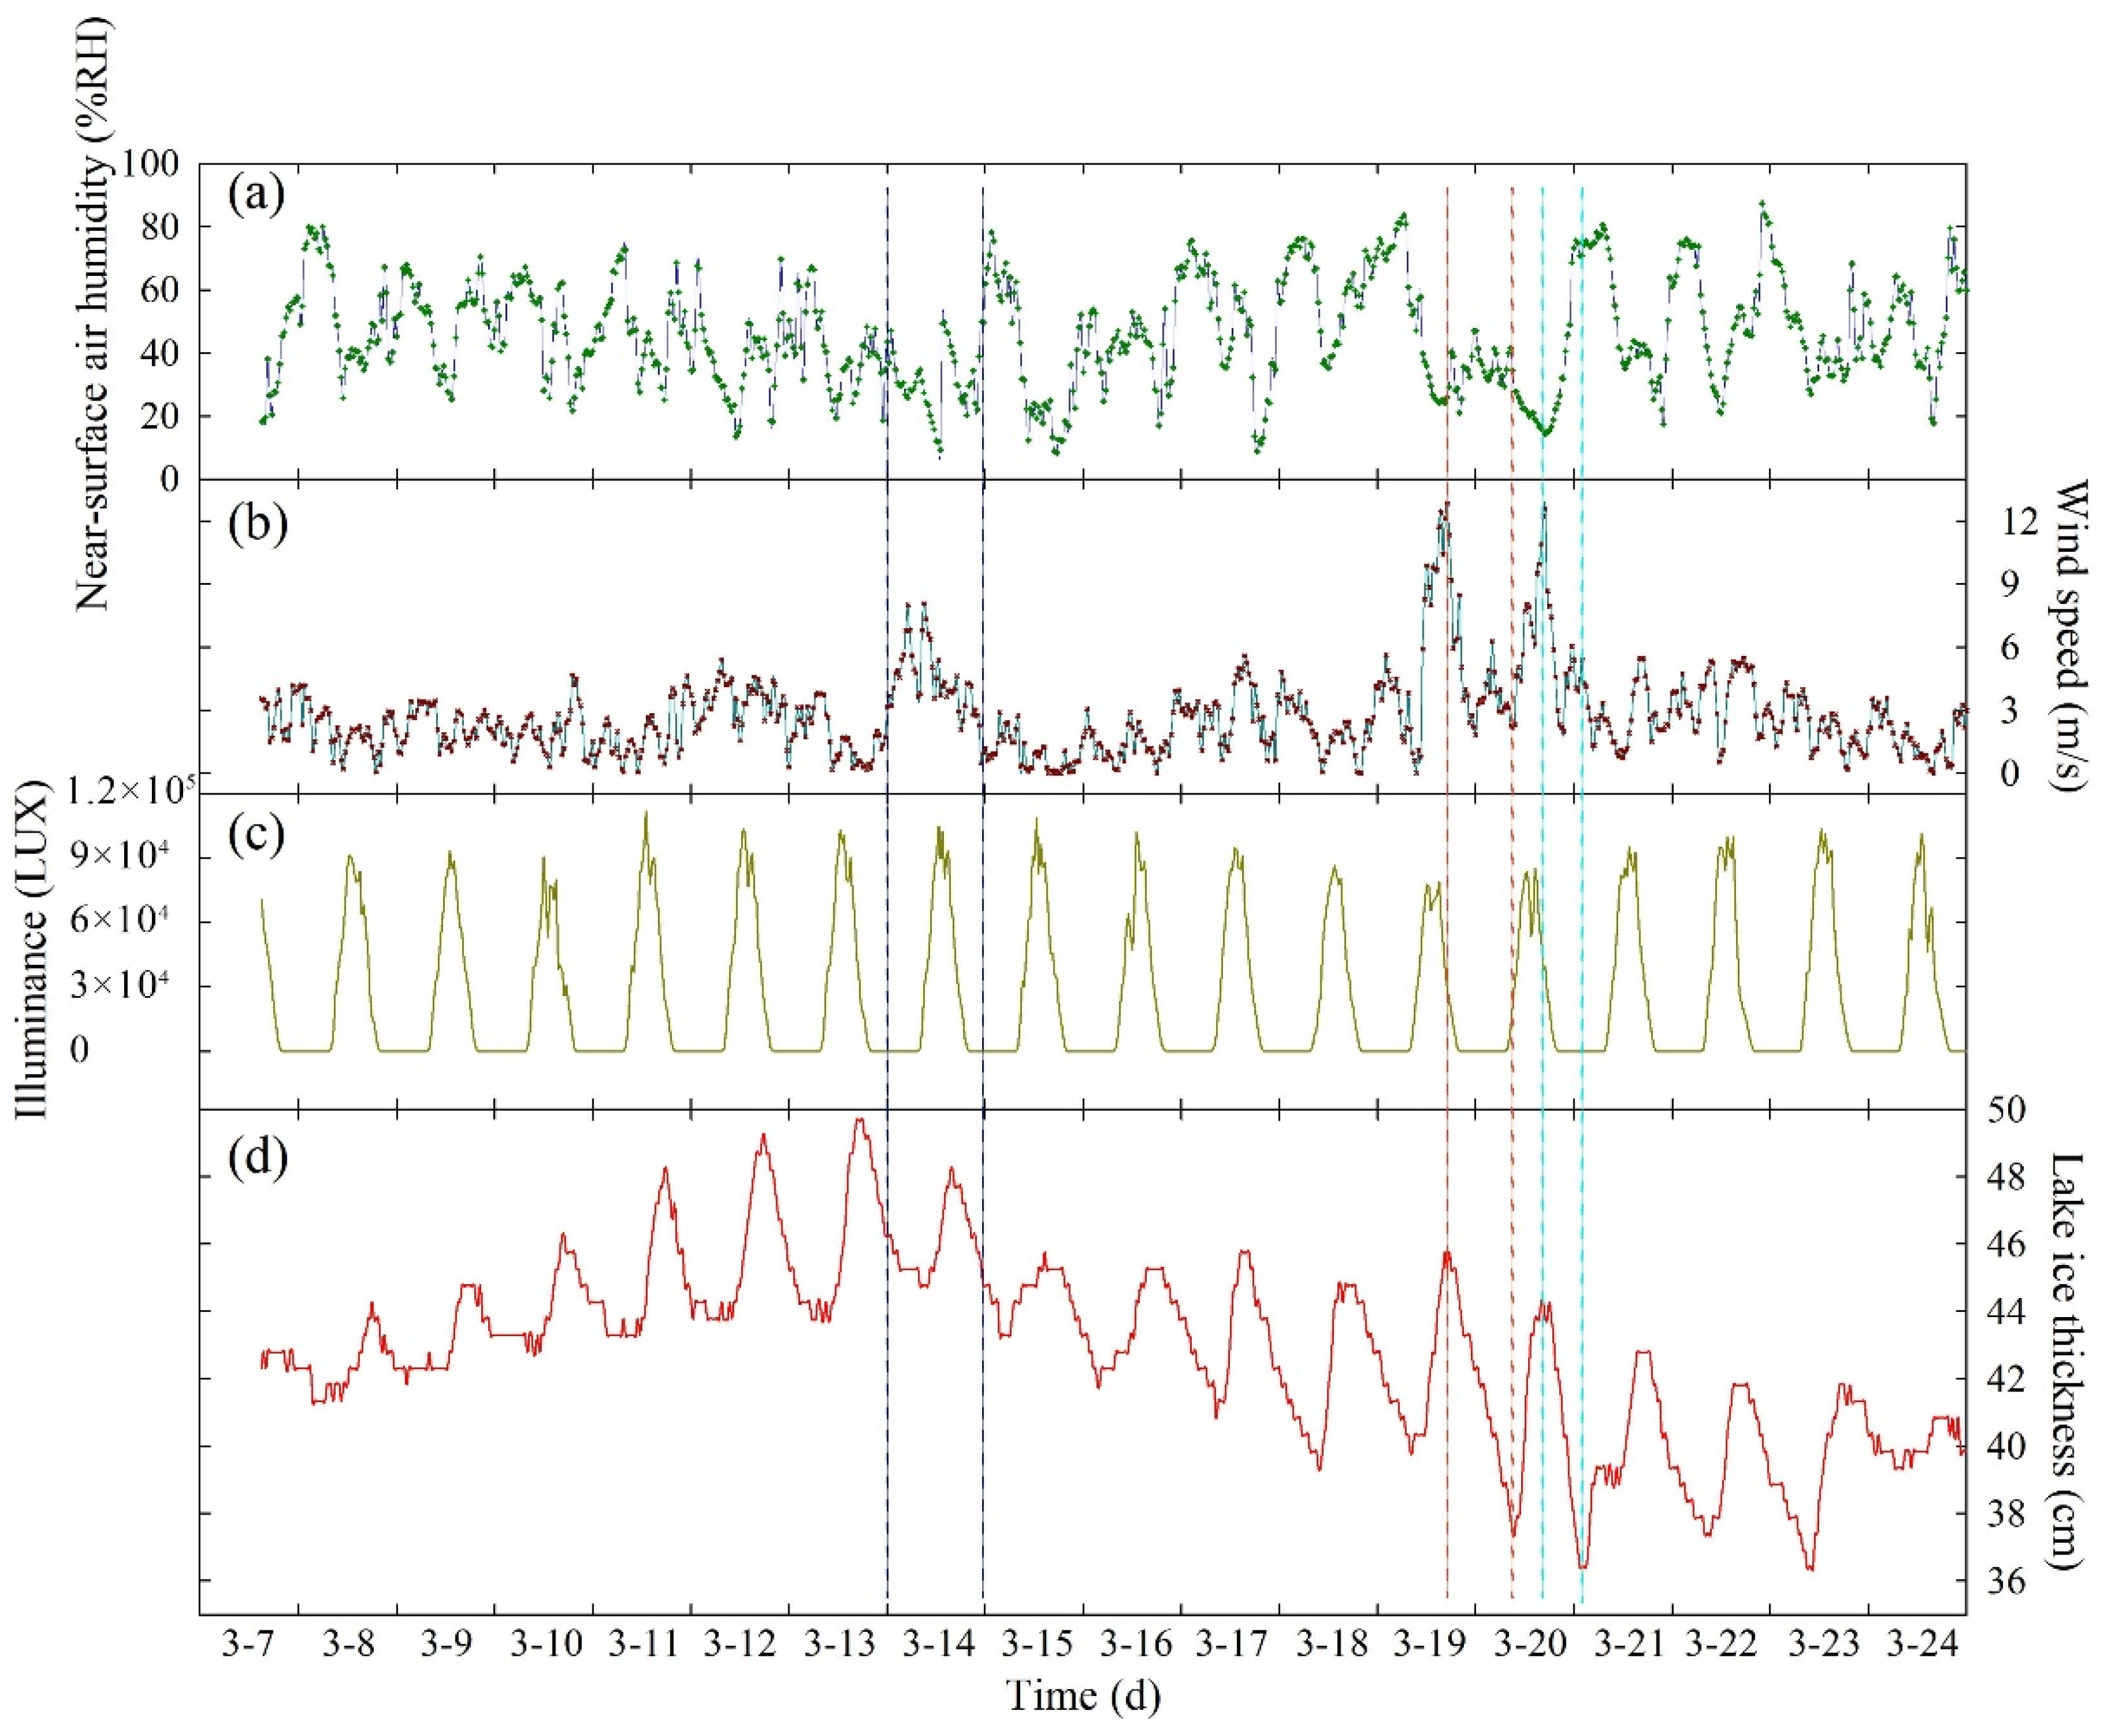
3.3.2. Effects of Illuminance, Wind Speed, and Near-Surface Air Humidity on Lake Ice Thickness

In addition to the significant influence of temperature, the variation of lake ice thickness was also influenced by the near-surface air humidity, wind speed and direction, illuminance and radiation, etc. Figure 10 shows the variation curves of near-surface air humidity, wind speed, illuminance, and lake ice thickness during the observation period. Near-surface air humidity varied considerably from day to day during the observation period, with an average variation of 54.28% RH and a mean value of 45.54% RH. The highest near-surface air humidity value of 87.36% RH was recorded at 21:30 h on 22 March, and the lowest value of 8.44% RH was recorded at 17:00 h on 15 March. During the observation period, the daily near-surface air humidity exceeded 50% RH for a longer period, causing the longwave radiation from the solar radiation reaching the ice surface to be absorbed by the water vapor, thus increasing the amount of short–wave radiation [51]. Therefore, near-surface air humidity affects the transmission of solar radiation energy, which affects the light field environment of the ice and water bodies, and in combination with other factors, such as temperature and wind speed, affects the thickness and accelerates the melt of the lake ice.
Wind speed has the following effects on lake ice during the ablation period: (1) larger wind speeds in spring will produce strong dragging forces on the broken ice, accelerating the rate of lake ice ablation and opening; (2) when snow is present on the ice surface, larger wind speeds can keep the snow–sealed ice surface smooth and accelerate the heat exchange between the upper and lower parts of the ice; (3) ice thickness develops from the heat loss of the water column under the ice, and the level of heat loss is determined by the efficiency of the air–ice heat exchange, and larger wind speeds can enhance this level of heat exchange [44]; (4) the effect of larger winds on the plateau can cause broken lake ice to migrate, accumulate and superimpose in unfrozen water, resulting in the formation of aggregated ice, which mostly accumulates at the edges of the lakeshore [52]. The average wind speed during the observation period was 2.72 m/s. On 14, 19, and 20 March, the wind speed varied considerably, with average daily wind speeds of 4.32, 5.50, and 5.32 m/s, as well as the daily maximum wind speeds of 8.07, 12.83, and 12.58 m/s, respectively. On the rest of the days, the wind speed variation was less, with values ranging from 2.53 to 5.12 m/s. The average ice thickness of 46.02 cm on 14 March was less than 46.15 cm from the previous day, which could have been caused by the gradually increasing wind speed between 00:30 and 04:30 h and between 07:00 and 08:30 h on 14 March. Although the increase in ice surface temperature dominated the decreases in ice thickness, the wind speed improved the efficiency of air–ice heat exchange on the ice surface, aiding in the decrease in ice thickness. Moreover, the ice thickness on 19–20 March changed significantly due to the increase in wind speed, with the rising wind speed increasing the amplitude of variation and decreasing the duration of the changes from maximum to minimum lake ice thickness and the time of variation in ice thickness lagged behind the time of the wind speed changes. On 19 March 2021, the wind speed increased from 1.11 (10:00) to 12.83 m/s (16:30), and the ice thickness decreased from 45.75 (17:00 h on the 19th) to 37.38 cm (07:30 h on the 20th), with a variation value of 8.37 cm and a time of 14.5 h. While on 20 March, the wind speed increased from 2.2 (08:30) to 12.58 m/s (16:30), and the ice thickness decreased from 44.27 (17:30 h on the 20th) to 36.40 cm (01:00 h on the 21st), with a variation value of 7.87 cm and a time of 7.5 h. In addition, the greatly increased wind speed on 19 and 20 March resulted in decreasing near-surface air humidity rates, allowing the ice surface to absorb more solar shortwave radiation energy than on other dates, which also contributed to the significant decreasing ice thickness.
It has been shown that solar radiation has a more significant effect than temperature [44], but its effect on ice thickness variability was insignificant in this study. The duration of illuminance during the observation period was 5.5 h on 7 March, 13 h from 8 to 16 March, 13.5 h on 17 and 18 March, and 14 h from 19 to 24 March, with a daily duration of illuminance, increasing as time progressed. According to Figure 10c, the daily illuminance increased in the morning, reaching a maximum value between 12:00 and 13:00 h, and then gradually decreased until more light was directed towards the lake ice surface after 20:00 h. The effect of illumination on the thickness of the lake ice was shown by the constant thinning of the ice thickness with increasing light time.
In summary, factors of longer light hours, increased illuminance, and wind speed, and the corresponding decreased near-surface air humidity promoted lake ice melting and led to a reduction in ice thickness. These factors were not as sensitive to lake ice thickness as temperature, but the suddenly increased wind speed became a major factor during certain periods. The energy exchange between water–ice–air and the local environment of the lake were complex, and the degrees of impact of various factors on ice thickness could not yet be quantified and will require future in-depth study.

4. Discussion

4.1. Analysis of the Impact of Lake Ice Break–Up

Figure 11 shows the local image of the ice break–up in Qinghai Lake based on a scene from the Sentinel–2A image on 26 March 2021. Many cracks on the ice surface had developed on that day, distributing across approximately 80% of the lake surface from the southwest to the northeast of Qinghai Lake. The widest ice crevasse was located in the northwest corner of the lake, about 2.5 km from the entrance to the Buha River, and the widest part reached 1.28 km, which was approximately 2.75 km to the south of the GPR ice monitoring system (Figure 11a). The direct exposure and low solar albedo of the lake water [53,54] at the cracks caused a rapid increase in solar radiation absorption, which led to a dramatic increase in the temperature of the lake water beneath the ice. The lake ice subsequently began to melt under the influence of the heat flow and in combination with other key factors that accelerated the melting process, such as rising water levels, wind-driven ice cracking, and increased contact area between the ice and its surroundings [55,56]. It has been observed that wind speeds and temperatures at the surface of Qinghai Lake gradually increased in March and April [31]. This caused sufficient mixing of the thermal layer at the surface and then deeper at the bottom of the lake, producing an effect that slowed the rate at which the temperature of the ice surface decreased to the freezing point, further disturbing or destroying the existing ice sheet and causing the ice to melt faster [57]. Figure 11b shows a photograph of the GPR ice monitoring system erection tower taken near the ice thickness monitoring point on 27 March 2021, on which a significant tilt of the tower and a large amount of meltwater at the bottom of the tower due to the rapid heat absorption by the metal material could be observed. Studies have shown that meltwater from the ice surface could flow into cracks and increase their depth, leading to ice cover instability [58]. The meteorological data measured by the GPR ice monitoring system showed that the maximum daily temperature on 26 and 27 March was 21 and 15 °C, respectively, and the maximum daily wind speed on 26 and 27 March were 5.57 and 6.12 m/s, respectively, with the wind direction being south-westerly. Between the open water and the fixed ice zone was the fixed ice edge, where complex thermodynamics and the dynamics of temperature, wind speed, and wind direction combined to cause the varying degrees of ice dispersion and increase the width of ice cracks. As a result of these factors, on 28 March 2021, an ice crevasse near the location of the GPR ice monitoring system cracked through to the lakeshore, causing the tower to overturn and then sink to the bottom of the lake.

4.2. Limitations and Applicability of GPR Ice Monitoring System

Melting water on the ice surface continued until mid-afternoon on 24 March (Figure 5), during which time there were two non–negligible errors in ice thickness monitoring using GPR. On the one hand, the GPR reflections were mainly caused by dielectric constant gradients that varied considerably with the moisture content of the ice (or snow) layer, and, in general, the higher the volumetric water content of the material, the higher the dielectric constant would be [38]. Therefore, the present water in the measured ice/snow medium could increase the reflection and scattering of radio waves at the target surface, thus reducing the transmission of the radio waves to the underlying target components. Meanwhile, the propagation speed of the radar waves was reduced by the ice crystal structure, bubble content, sediment content, possible cracks, etc. [28,59,60]. On the other hand, according to research conducted by Maria Kämäri et al. [59], the ice cover was predominantly black ice. The presence of white ice with different thicknesses on the top of the ice cover was indicated as snow ice, but the difference in the dielectric constant between the two ice types was too small to be observed using GPR systems. In summary, the water content of the lake ice surface increased during the daytime in the ablation period due to solar irradiation and the greater dielectric constant. In addition, a fixed dielectric constant resulted in larger ice thickness values due to the reduced speed and longer path of radar waves propagation in the lake ice medium and the longer propagation time in both directions between air–ice and ice–water interfaces. Therefore, the errors caused by meltwater and the GPR system could not be overlooked when the maximum daily lake ice thickness occurred in the afternoon during the observation period. To solve these issues, the ice surface water content would need to be monitored, which would be very challenging under in situ conditions. In the future, it may be possible to obtain the relationship between the water content and the dielectric constant by conducting small indoor simulations.
Currently, several automatic monitoring stations for lake ice thickness have also been developed. A prototype snow and ice mass balance apparatus (SIMBA) has been deployed in Lake Orajärvi in northern Finland since 2009 to monitor climate variability and change as reflected in snow depth as well as lake ice thickness and composition [47]. The variation of lake ice thickness during the ablation period was not observed by SIMBA in the early years due to safety concerns [61]. Moreover, meteorological data could only be provided by the nearby meteorological station. In addition, SIMBA’s two types of temperature strongly increased in the upper part of the ice during the melting season, resulting in an isothermal status of the entire ice column, which led to significant errors in the snow depth and ice thickness values. Xie et al. [62] designed a floating remote observation system (FROS) to investigate the full seasonal evolution of lake ice, which automatically measured meteorological data, such as the air temperature and solar radiation, as well as ice and snow data, including ice thickness and snow depth. However, the system had to be corrected for vertical displacement due to lake ice ablation. Also, its applicability in lakes at high altitudes such as the QTP would need to be further investigated. As compared to SIMBA and FROS, the GPR ice monitoring system obtained continuous data on lake ice thickness and meteorological elements steadily throughout the ice period, and the data were transmitted in real-time through the 4G network to a cloud platform. This system was able to perform sufficiently under severe environmental conditions, with the lowest temperature reaching –16.27 °C and the maximum wind speed reaching 12.83 m/s in this study.

4.3. Enhancement and Transplantability of GPR Ice Monitoring System

Many improvements could be considered in future studies using the GPR ice monitoring system. To understand snow and ice albedo and associated feedback, the effect of aerosol deposition on snow and ice, and snow and ice transmittance [63], a GPR ice monitoring system should add corresponding spectroradiometers to monitor incidental solar radiation on the snow and ice surfaces and underwater, as well as reflected solar radiation from the ice surface and water. Temperature measurements are also needed for different layers from the top of the ice to the bottom of the water, which could assist our understanding of the heat budget of the lake [64]. The field monitoring of these parameters above will contribute to the construction and accuracy of a thermodynamic model of lake ice. The GPR ice monitoring system has been taken automatically. However, it is still important to carry out in situ observations, such as collecting ice core and snow samples, as such observations cannot be made by automatic instruments [47]. Meanwhile, a regular on-site safety inspection and system maintenance should be performed on each component of the GPR ice monitoring system under the premise of ensuring safety to avoid the accident that occurred in this study.
The lakes on the QTP are located at high altitudes where the environments are extremely difficult for people and transportation to reach, especially during thick snow cover in winter, making it more challenging to monitor the lake ice dynamics. However, the GPR ice monitoring system can detect the continuous changes in lake ice thickness and local meteorological elements at the monitoring sites and transmit the data in real-time while ensuring stability and safety. In addition, this pattern can also be extended to studies on lake thermodynamics and water quality. Two aspects of the GPR ice monitoring system are worth consideration in future applications. First, it is challenging to construct multiple GPR systems on a large area lake such Qinghai Lake, which has various water levels and characteristics at different locations. Second, most of the lakes on the QTP are located in the National-level Nature Reserves. The site selection for observation points needs to consider economic impacts and ecological concerns, as well as other factors, to ensure that the observation equipment will not cause unforeseen damage.

5. Conclusions

Based on a GPR ice monitoring system, we analyzed the ice thickness and local meteorological elements at a site approximately 1.7 km west of Bird Island in Qinghai Lake during 7–24 March 2021 and reached the following conclusions:
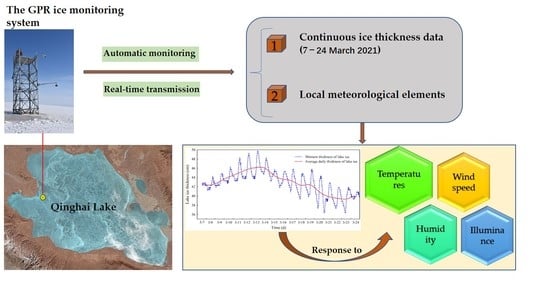
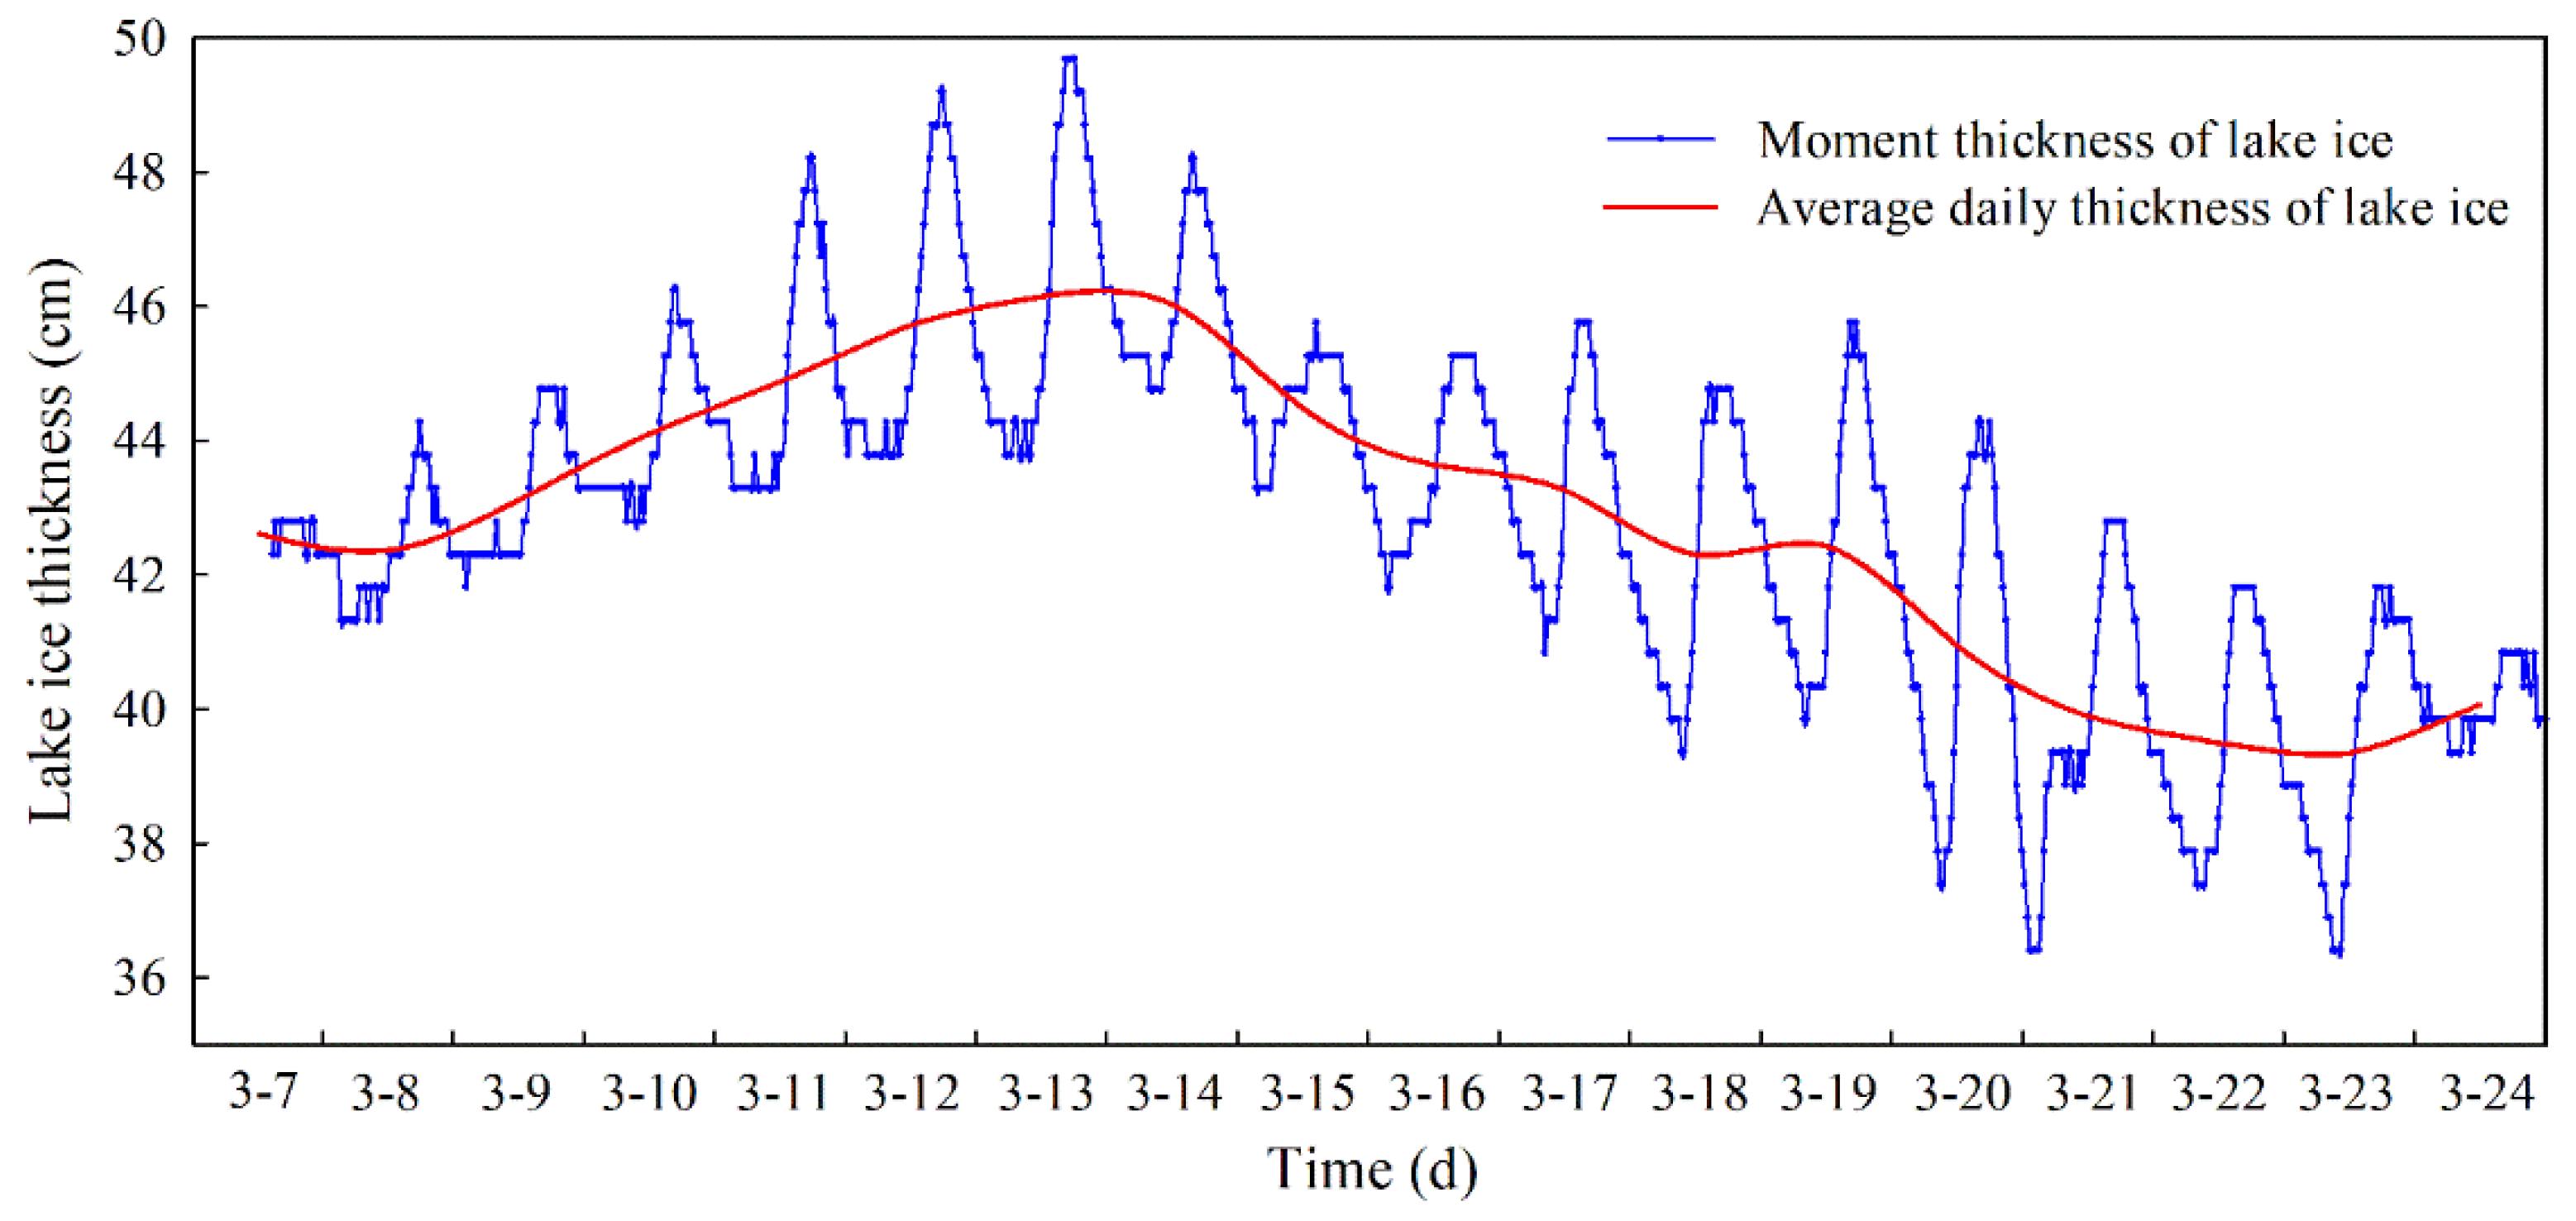
  • During the ice ablation period of Qinghai Lake, the average daily ice thickness showed a steady increasing trend of 0.54 cm/d during 7–13 March 2021, and then a decreasing trend of −0.61 cm/d during 14–24 March 2021. The average ice thickness of Qinghai Lake during the observation period was 42.83 cm, with an average daily ice thickness variation ranging from 39.35 to 46.15 cm, as well as an increased rate of 0.54 cm/d from 8–13 March and a decreased rate of −0.61 cm/d during 14–24 March 2021.
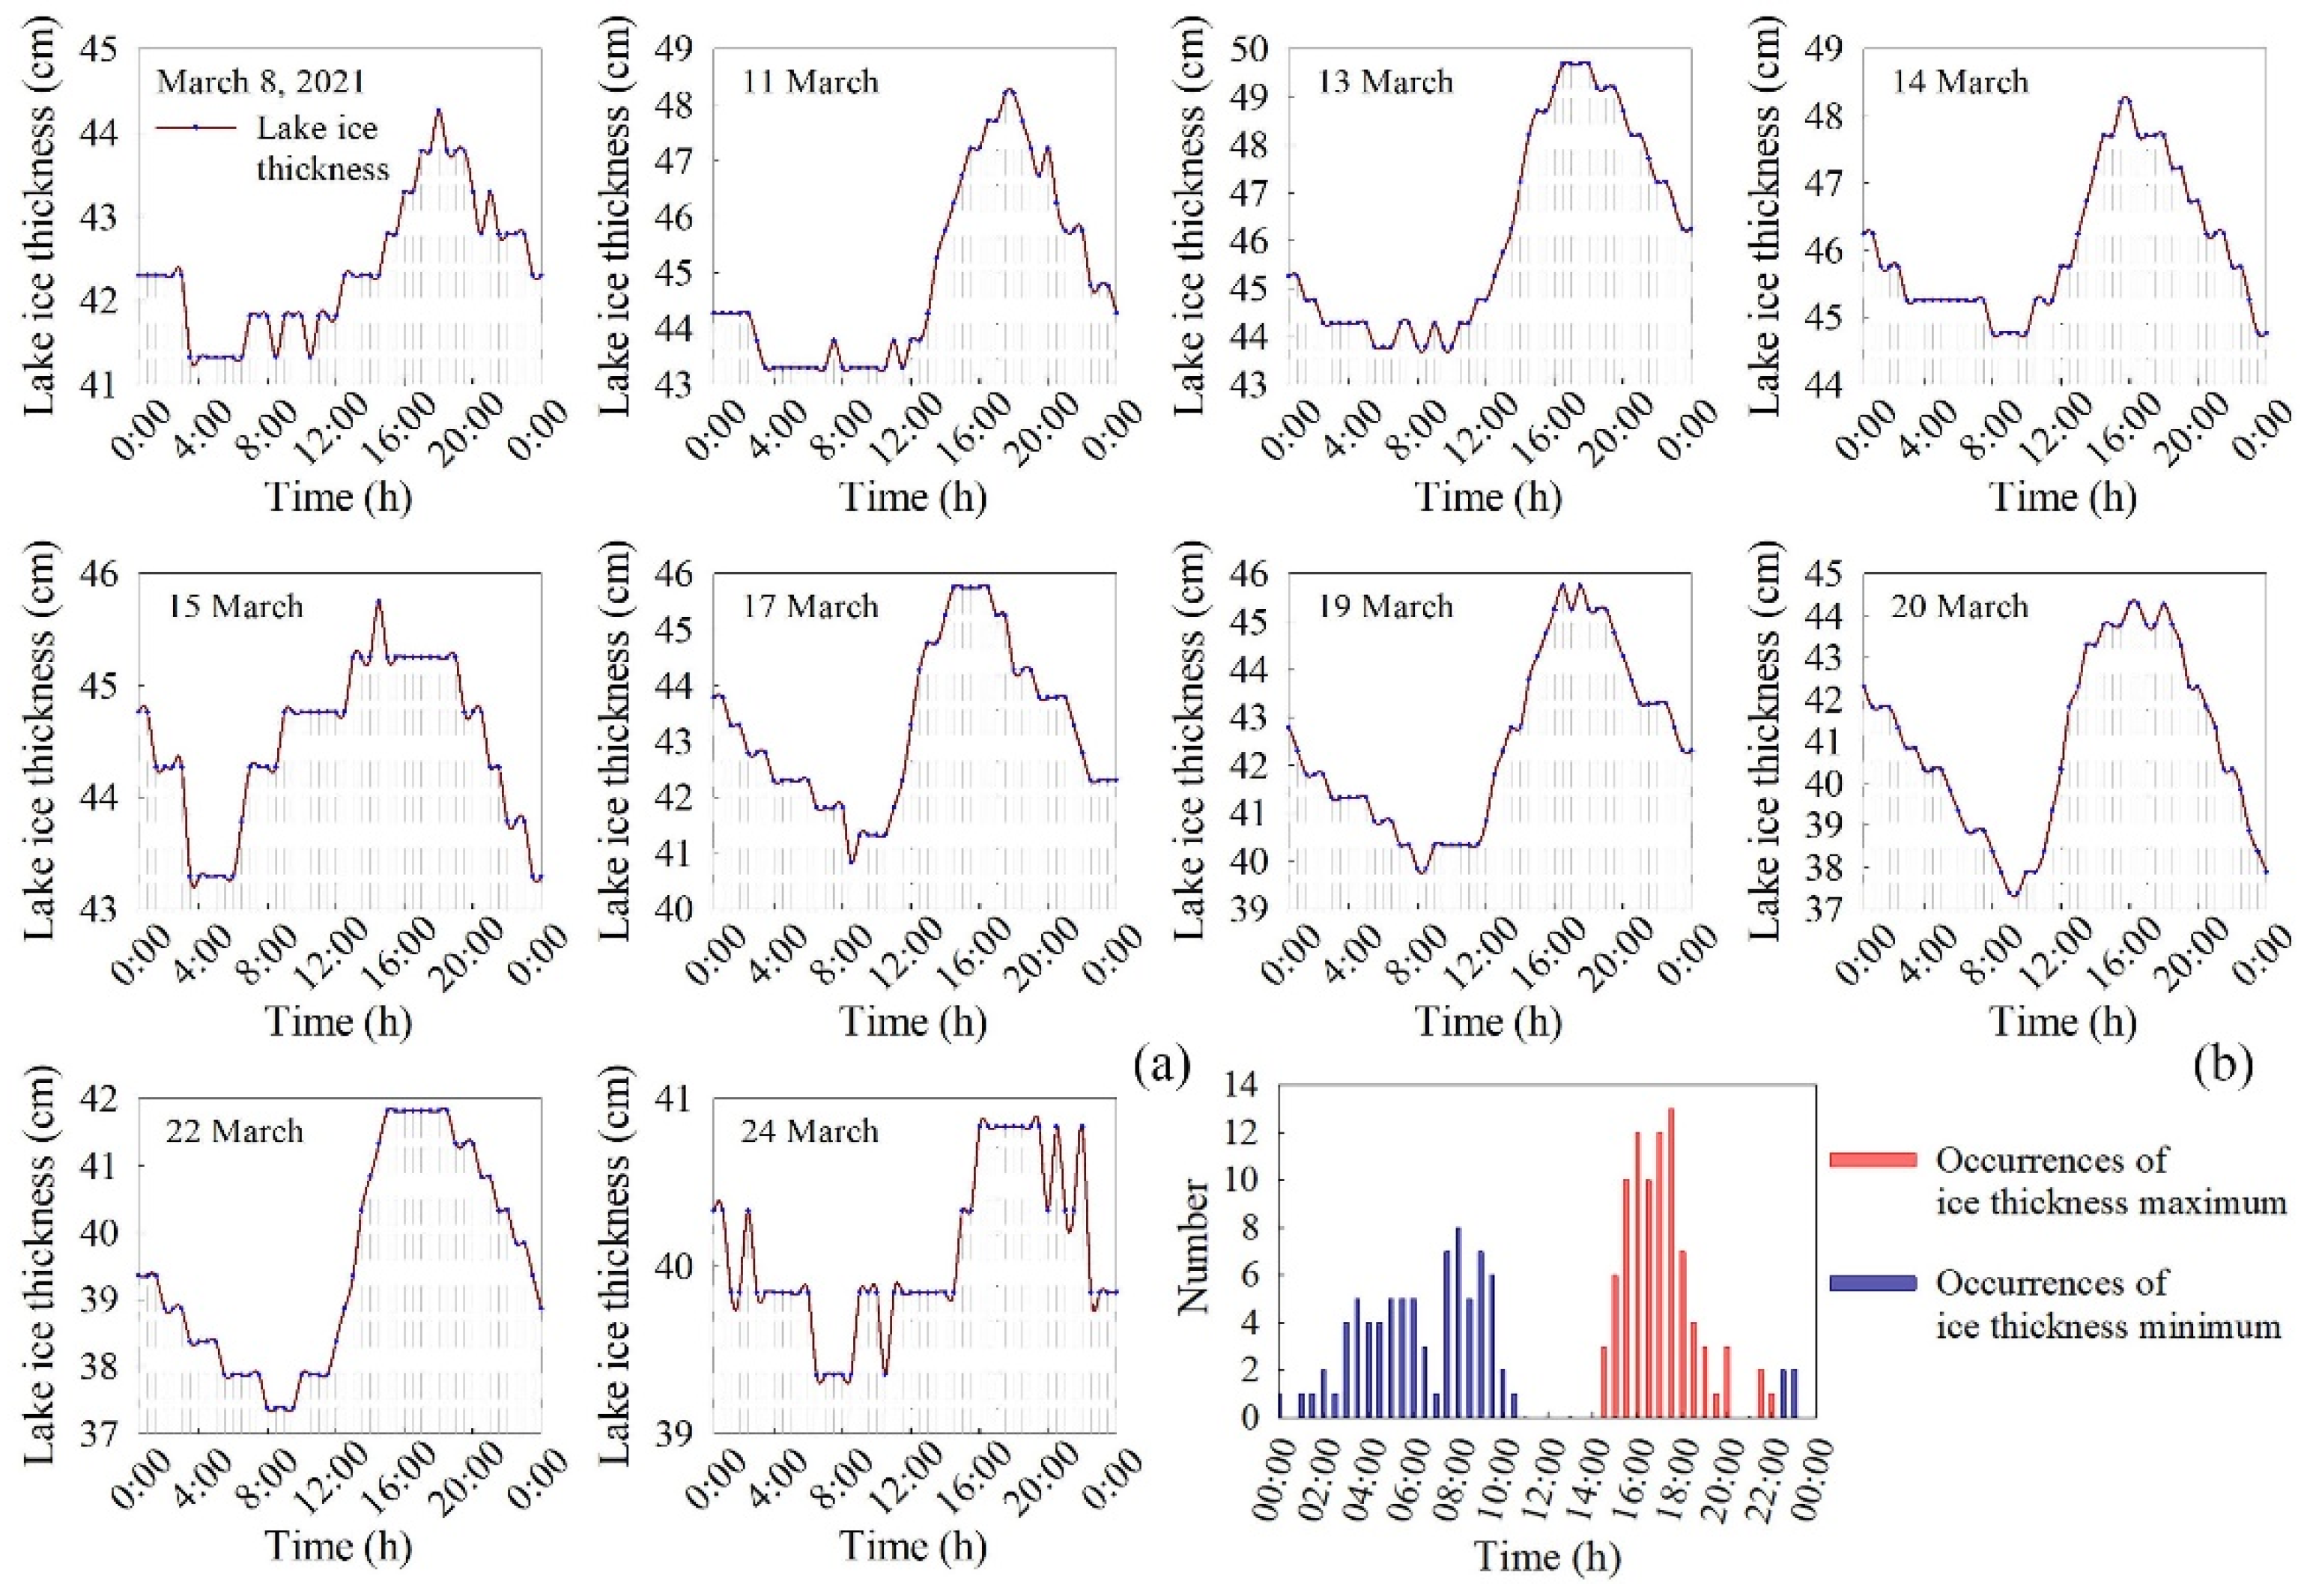
  • The daily variation in lake ice thickness during the observation period showed different patterns. From 8–13 March 2021, the thickness had a similar daily moment variation, which was steady before dawn and then experienced a decreasing, increasing, and then decreasing process; during 14–24 March 2021, the ice thickness underwent a similar daily decreasing, increasing (for several hours), and then decreasing trend. Minimum daily lake ice thickness generally occurred between 07:30 and 9:30 h, and the maximum was between 15:30 and 18:00 h. The occurrence of the maximum daily lake ice thickness in the afternoon was mainly due to the lagging effect of ice thickness in response to temperature changes. However, errors caused by meltwater on the lake ice surface and the GPR should be considered, although they have not yet been precisely quantified.
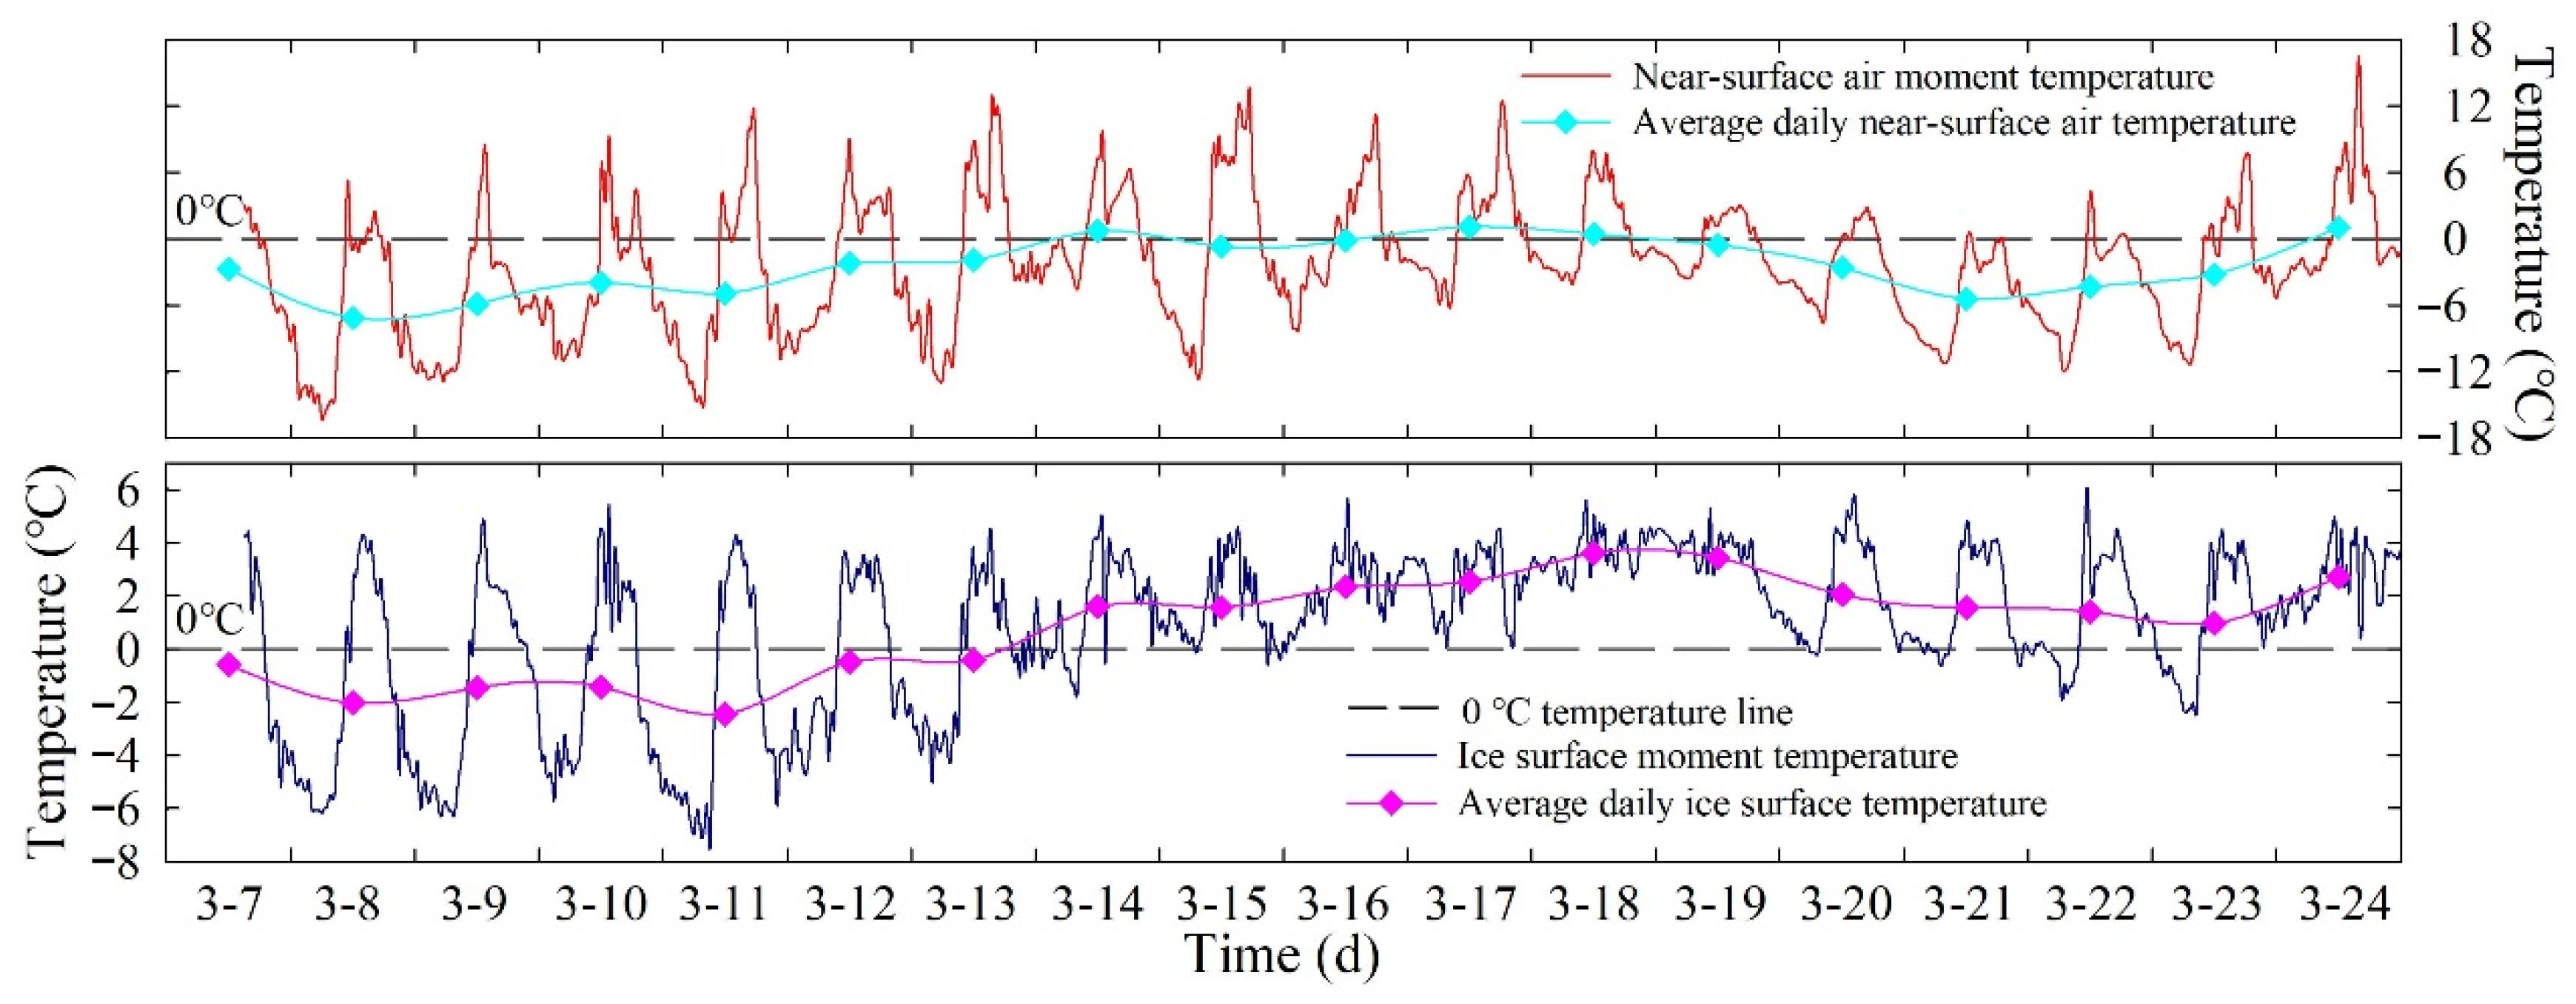
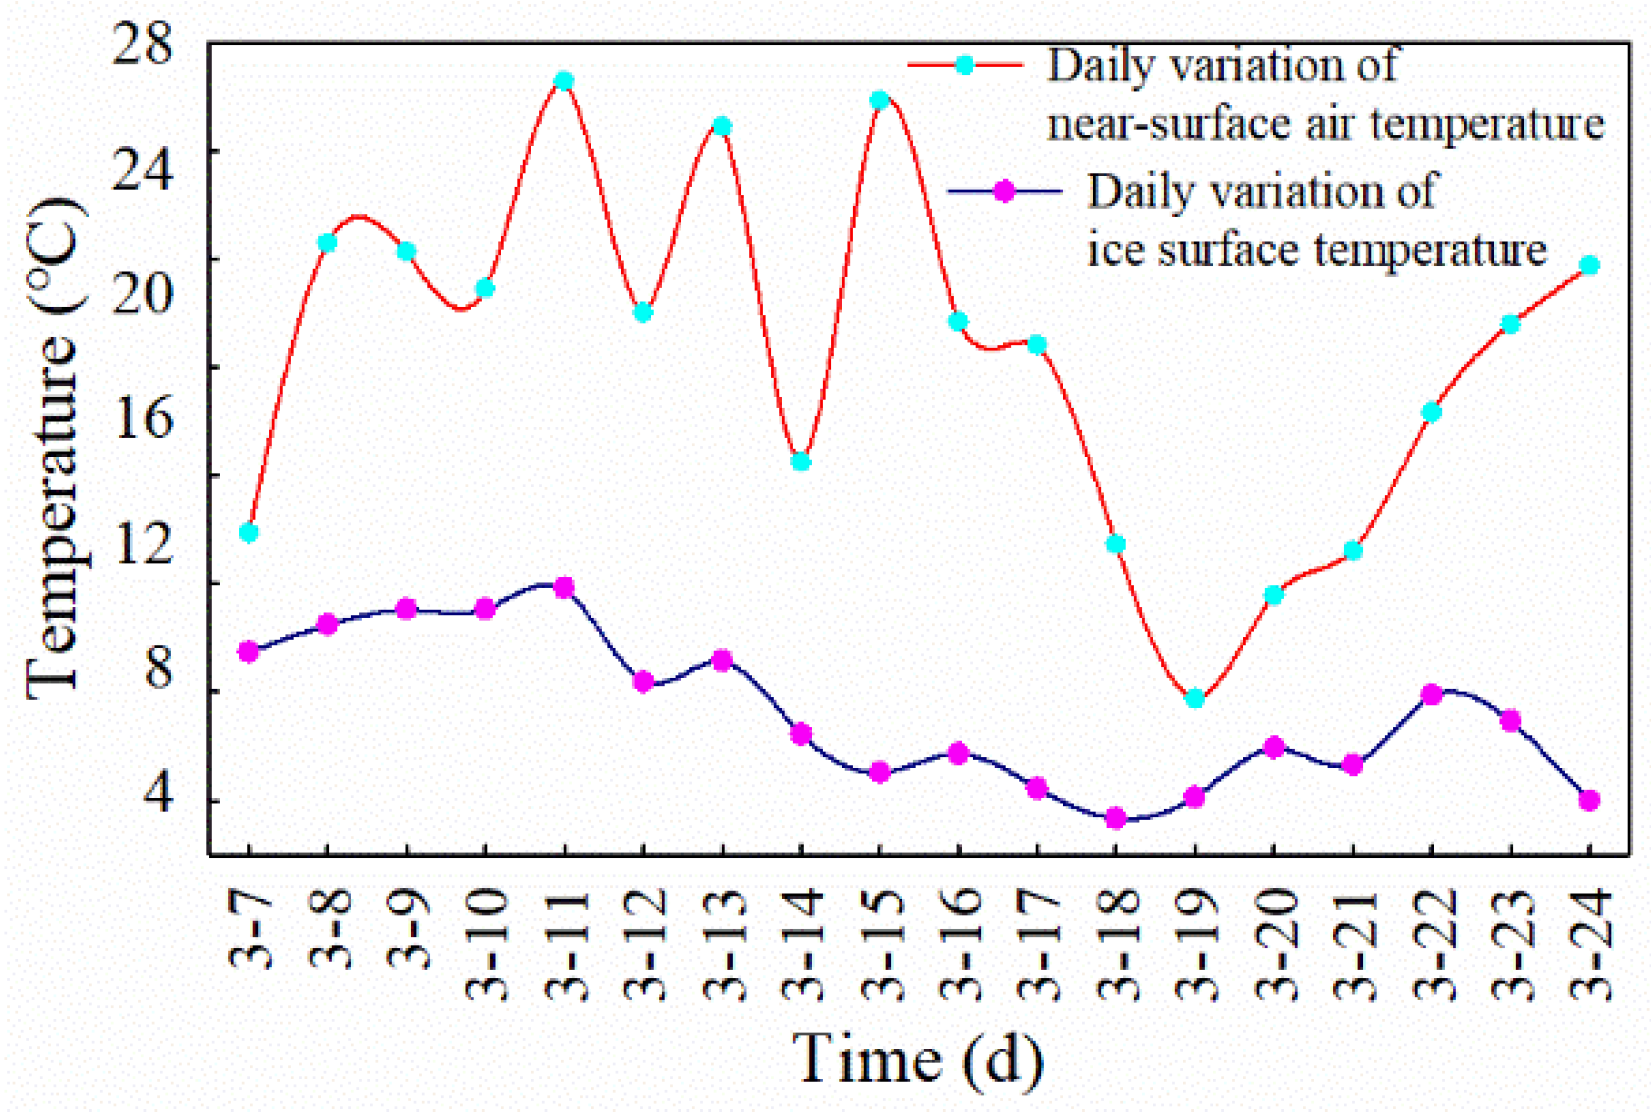
  • There was a significant positive correlation between the temperatures of near-surface air and ice surface with a coefficient of 0.745 (p < 0.01) during the observation period of Qinghai Lake, and a significant negative correlation between the average daily ice thickness and the cumulative temperature of the ice surface with a coefficient of −0.93 (p < 0.05). Temperature was the main factor affecting the lake ice thickness. In addition, increased wind speeds and illuminance, prolonged light hours, and decreased near-surface air humidity led to the lake ice melt, thus decreasing the lake ice thickness. Furthermore, a sudden increased wind speed could also be a major factor promoting ice melt.
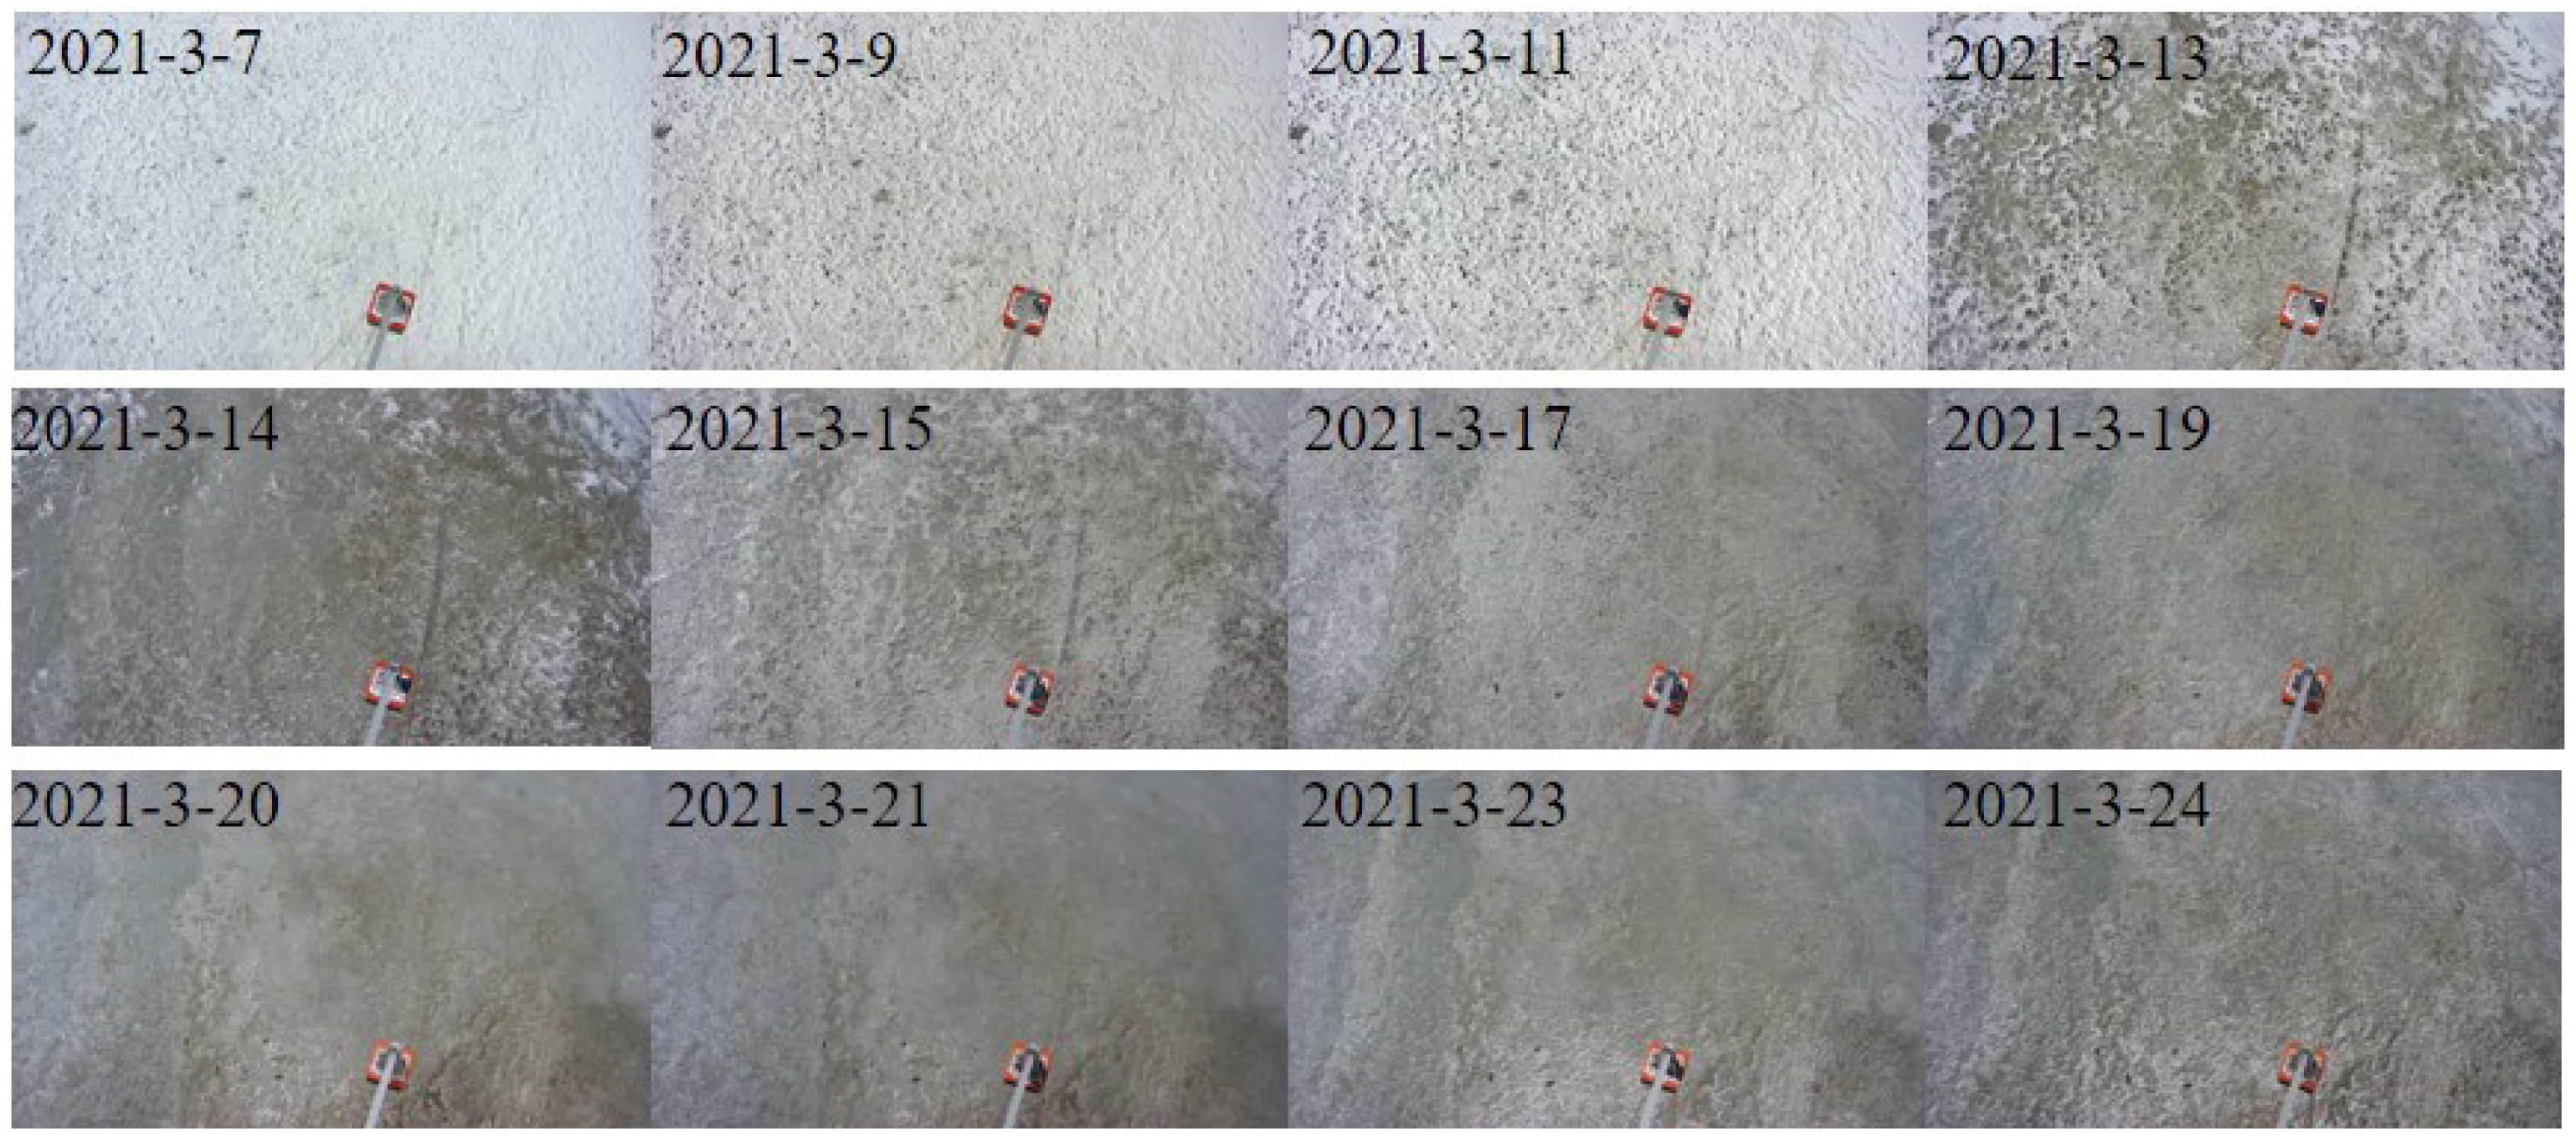
  • A large number of cracks already existed in a wide area from southwest to northeast of the ice surface in Qinghai Lake on 26 March 2021. The water at the cracks was directly exposed to air, resulting in a significant increase in the temperature of the water body at the bottom of the ice. Under the combined forces of wind speed, wind direction, and temperature, the fixed ice edge was subject to a complex effect of thermodynamics and dynamics, leading to different degrees of ice dispersion and the rapid melting of lake ice.

Author Contributions

Conceptualization, Q.W. and X.Y.; methodology, Q.W.; software, Q.W.; validation, X.Y., H.Z. and H.D.; formal analysis, J.C. (Juan Cao); investigation, H.J.; resources, H.J. and J.C. (Jie Chen); data curation, Q.W.; writing—original draft preparation, Q.W.; writing—review and editing, X.Y.; visualization, Q.W.; supervision, X.Y.; project administration, X.Y.; funding acquisition, X.Y. All authors have read and agreed to the published version of the manuscript.

Funding

This research has been supported by the National Natural Science Foundation of China, grant number: 41861013, 42071089.

Data Availability Statement

Landsat 8 data are available at https://earthexplorer.usgs.gov, accessed on 1 February 2021 (USGS, 2021). Sentinel–2A data are available at https://scihub.copernicus.eu/dhus, accessed on 26 March 2021 (Serco and GAEL Systems consortium, 2021). GPR profile images with meteorological data in this paper can be provided by the corresponding author upon request.

Acknowledgments

We thank the technical staff of Dalian Zhongrui Science and Technology Development Company in China for their technical support in installing the GPR ice monitoring system at the study area of Qinghai Lake. The three anonymous reviewers and academic editors are thanked for their comments, which considerably improved this work.

Conflicts of Interest

The authors declare no conflict of interest. The funders had no role in the design of the study; in the collection, analyses, or interpretation of data; in the writing of the manuscript; or in the decision to publish the results.

References

  1. Song, C.Q.; Huang, B.; Ke, L.H.; Richards, K.S. Remote sensing of alpine lake water environment changes on the Tibetan Plateau and surroundings: A review. Isprs J. Photogramm. Remote Sens. 2014, 92, 26–37. [Google Scholar] [CrossRef]
  2. Yao, T.D.; Chen, F.H.; Cui, P.; Ma, Y.M.; Xu, B.Q.; Zhu, L.P.; Zhang, F.; Wang, W.C.; Ai, L.K.; Yang, X.X. From Tibetan Plateau to Third Pole and Pan–Third Pole. Bull. Chin. Acad. Sci. 2017, 32, 924–931. [Google Scholar]
  3. Huang, W.F.; Zhang, J.R.; Lepparanta, M.; Li, Z.J.; Cheng, B.; Lin, Z.J. Thermal structure and water–ice heat transfer in a shallow ice–covered thermokarst lake in central Qinghai–Tibet Plateau. J. Hydrol. 2019, 578, 124122. [Google Scholar] [CrossRef]
  4. Chen, X.Z.; Wang, G.Y.; Li, W.J.; Zeng, Q.Z.; Jin, D.H.; Wang, L.H. Lake lce and Its Remote Sensing Monitoring in the Tibetan Plateau. J. Glaciol. Geocryol. 1995, 17, 241–246. [Google Scholar]
  5. Zhang, G.Q.; Yao, T.D.; Xie, H.J.; Yang, K.; Zhu, L.P.; Shum, C.K.; Bolch, T.; Yi, S.; Allen, S.; Jiang, L.G.; et al. Response of Tibetan Plateau lakes to climate change: Trends, patterns, and mechanisms. Earth–Sci. Rev. 2020, 208, 103269. [Google Scholar] [CrossRef]
  6. Kropáček, J.; Maussion, F.; Chen, F.; Hoerz, S.; Hochschild, V. Analysis of ice phenology of lakes on the Tibetan Plateau from MODIS data. Cryosphere 2013, 7, 287–301. [Google Scholar] [CrossRef] [Green Version]
  7. Zhang, Y.; Zhang, G.; Zhu, T. Seasonal cycles of lakes on the Tibetan Plateau detected by Sentinel–1 SAR data. Sci. Total Environ. 2020, 703, 135563. [Google Scholar] [CrossRef]
  8. Huang, W.F.; Li, Z.J.; Han, H.W.; Niu, F.J.; Lin, Z.J.; Lepparanta, M. Structural analysis of thermokarst lake ice in Beiluhe Basin, Qinghai–Tibet Plateau. Cold Reg. Sci. Technol. 2012, 72, 33–42. [Google Scholar] [CrossRef]
  9. Cao, J.; Yao, X.J.; Jin, H.A.; Zhang, T.F.; Gao, Y.P.; Zhang, D.H.; Zhao, Q.N. Spatiotemporal variation of ice thickness of Lake Qinghai derived from field measurements and model simulation. J. Lake Sci. 2021, 33, 607–621. [Google Scholar]
  10. Wang, G.; Zhang, T.; Li, X.; He, Z.; Li, Y. Detecting changes of ice phenology using satellite passive microwave remote sensing data in Qinghai Lake. J. Glaciol. Geocryol. 2021, 43, 296–310. [Google Scholar]
  11. Wei, Q.F.; Ye, Q.H. Review of Lake lce Monitoring by Remote Sensing. Prog. Geogr. 2010, 29, 803–810. [Google Scholar]
  12. Qu, B.; Kang, S.C.; Chen, F.; Zhang, Y.J.; Zhang, G.S. Lake ice and its effect factors in the Nam Co basin, Tibetan Plateau. Clim. Chang. Res. 2012, 8, 327–333. [Google Scholar]
  13. Ke, C.Q.; Tao, A.Q.; Jin, X. Variability in the ice phenology of Nam Co Lake in central Tibet from scanning multichannel microwave radiometer and special sensor microwave/imager: 1978 to 2013. J. Appl. Remote Sens. 2013, 7, 073477. [Google Scholar] [CrossRef]
  14. Gou, P.; Ye, Q.H.; Wei, Q.F. Lake ice change at the Nam Co Lake on the Tibetan Plateau during 2000–2013 and influencing factors. Prog. Geogr. 2015, 34, 1241–1249. [Google Scholar]
  15. Wang, Q.; Wang, J.B.; Guo, J.Y.; Liang, J. Lake Ice extraction of Selin Co and its space–time distribution based on support vector machine. Manned Spacefl. 2019, 25, 789–798. [Google Scholar]
  16. Lang, J.H.; Ma, Y.M.; Li, Z.G.; Su, D.S. The Impact of Climate Warming on Lake Surface Heat Exchange and Ice Phenology of Different Types of Lakes on the Tibetan Plateau. Water 2021, 13, 634. [Google Scholar] [CrossRef]
  17. Sun, H.; Li, C.H.; Yao, X.J. Extraction and analysis of lake ice in typical lakes on the northern slopes of the Himalayas based on NPP–VRS data. J. Glaciol. Geocryol. 2020, 43, 70–79. [Google Scholar]
  18. Yao, X.J.; Li, L.; Zhao, J.; Sun, M.P.; Li, J.; Gong, P.; An, L.N. Spatial–temporal variations of lake ice in the Hoh Xil region from 2000 to 2011. Acta Geogr. Sin. 2015, 70, 1114–1121. [Google Scholar] [CrossRef]
  19. Wang, B.B.; Sun, B.; Tian, G.; Guo, J.X.; Wang, D.L. The application of the 3D GPR method to measuring the depth of arctic summer sea ice and analyzing its under side morphology. Geophys. Geochem. Explor. 2007, 31, 189–192, 283–284. [Google Scholar]
  20. Yang, Q.; Song, K.S.; Hao, X.H.; Wen, Z.D.; Tan, Y.; Li, W.B. Investigation of spatial and temporal variability of river ice phenology and thickness across Songhua River Basin, northeast China. Cryosphere 2020, 14, 3581–3593. [Google Scholar] [CrossRef]
  21. Bartosiewicz, M.; Przytulska, A.; Deshpande, B.N.; Antoniades, D.; Cortes, A.; MacIntyre, S.; Lehmann, M.F.; Laurion, I. Effects of climate change and episodic heat events on cyanobacteria in a eutrophic polymictic lake. Sci. Total Environ. 2019, 693, 133414. [Google Scholar] [CrossRef]
  22. Murfitt, J.; Duguay, C.R. 50 years of lake ice research from active microwave remote sensing: Progress and prospects. Remote Sens. Environ. 2021, 264, 112616. [Google Scholar] [CrossRef]
  23. Zhang, B.S.; Zhang, F.X.; Liu, Z.Y.; Han, H.W.; LI, Z.J. Field experimental study of the characteristics of GPR images of Yellow River ice. South North Water Transf. Water Sci. Technol. 2017, 15, 121–125. [Google Scholar]
  24. Duguay, C.R.; Lafleur, P.M. Determining depth and ice thickness of shallow sub–Arctic lakes using space–borne optical and SAR data. Int. J. Remote Sens. 2010, 24, 475–489. [Google Scholar] [CrossRef]
  25. Beckers, J.F.; Casey, J.A.; Haas, C. Retrievals of Lake Ice Thickness From Great Slave Lake and Great Bear Lake Using CryoSat–2. IEEE Trans. Geosci. Remote Sens. 2017, 55, 3708–3720. [Google Scholar] [CrossRef]
  26. Galley, R.J.; Trachtenberg, M.; Langlois, A.; Barber, D.G.; Shafai, L. Observations of geophysical and dielectric properties and ground penetrating radar signatures for discrimination of snow, sea ice and freshwater ice thickness. Cold Reg. Sci. Technol. 2009, 57, 29–38. [Google Scholar] [CrossRef]
  27. Stevens, C.W.; Moorman, B.J.; Solomon, S.M.; Hugenholtz, C.H. Mapping subsurface conditions within the near–shore zone of an Arctic delta using ground penetrating radar. Cold Reg. Sci. Technol. 2009, 56, 30–38. [Google Scholar] [CrossRef]
  28. Cao, X.W.; Li, C.J.; Yan, X.F.; Wu, Y.F.; Li, Z.J. Measuring ice thickness around the curve and piers in the Yellow River with ground penetrating radar. South North Water Transf. Water Sci. Technol. 2016, 14, 91–95. [Google Scholar]
  29. Fu, H.; Liu, Z.P.; Guo, X.L.; Cui, H.T. Double–frequency ground penetrating radar for measurement of ice thickness and water depth in rivers and canals: Development, verification and application. Cold Reg. Sci. Technol. 2018, 154, 85–94. [Google Scholar] [CrossRef]
  30. Jin, H. Ice Thickness Monitoring of Gahai Lake Based on Airborne Radar and Sentinel–1 SAR; Northwest Normal University: Lanzhou, China, 2021. [Google Scholar]
  31. Qi, M.M.; Yao, X.J.; Li, X.F.; Duan, H.Y.; Gao, Y.P.; Liu, J. Spatiotemporal characteristics of Qinghai Lake ice phenology between 2000 and 2016. J. Geogr. Sci. 2019, 29, 115–130. [Google Scholar] [CrossRef] [Green Version]
  32. Liu, Z.; Henderson, A.C.G.; Huang, Y. Alkenone–based reconstruction of late–Holocene surface temperature and salinity changes in Lake Qinghai, China. Geophys. Res. Lett. 2006, 33, L09707. [Google Scholar]
  33. Cai, Y.; Ke, C.Q.; Duan, Z. Monitoring ice variations in Qinghai Lake from 1979 to 2016 using passive microwave remote sensing data. Sci. Total Environ. 2017, 607–608, 120–131. [Google Scholar] [CrossRef] [PubMed]
  34. Che, T.; Li, X.; Jin, R. Monitoring the frozen duration of Qinghai Lake using satellite passive microwave remote sensing low frequency data. Chin. Sci. Bull. 2009, 54, 2294–2299. [Google Scholar] [CrossRef]
  35. Qi, M.M.; Liu, S.Y.; Yao, X.J.; Xie, F.M.; Gao, Y.P. Monitoring the Ice Phenology of Qinghai Lake from 1980 to 2018 Using Multisource Remote Sensing Data and Google Earth Engine. Remote Sens. 2020, 12, 2217. [Google Scholar] [CrossRef]
  36. Wang, G.X.; Zgabf, T.J.; Yang, R.M.; Zhong, X.Y.; Dong, L.X. Lake ice changes in the Third Pole and the Arctic. J. Glaciol. Geocryol. 2020, 42, 124–139. [Google Scholar] [CrossRef] [Green Version]
  37. Wang, N.L.; Pu, J.C. Ice Thickness, Sounded by Ground Penetrating Radar, on the Bayi Glacier in the Qilian Mountains, China. J. Glaciol. Geocryol. 2009, 31, 431–435. [Google Scholar]
  38. Bohleber, P.; Sold, L.; Hardy, D.R.; Schwikowski, M.; Klenk, P.; Fischer, A.; Sirguey, P.; Cullen, N.J.; Potocki, M.; Hoffmann, H.; et al. Ground–penetrating radar reveals ice thickness and undisturbed englacial layers at Kilimanjaro’s Northern Ice Field. Cryosphere 2017, 11, 469–482. [Google Scholar] [CrossRef] [Green Version]
  39. Wu, Z.; Zhang, S.Q.; Liu, S.Y.; Du, W.T. Structural characteristics of the No.12 Glacier in Laohugou valley, Qilian Mountain based on the ground penetrating radar combined with FDTD simulation. Adv. Earth Sci. 2011, 26, 631–641. [Google Scholar]
  40. Liu, J.; Wang, S.J.; He, Y.Q.; Li, Y.Q.; Wang, Y.Z.; Wei, Y.Q.; Che, Y.J. Estimation of Ice Thickness and the Features of Subglacial Media Detected by Ground Penetrating Radar at the Baishui River Glacier No. 1 in Mt. Yulong, China. Remote Sens. 2020, 12, 4105. [Google Scholar] [CrossRef]
  41. Annan, A.P. Electromagnetic Principles of Ground Penetrating Radar. In Ground Penetrating Radar Theory and Applications; Jol, H.M., Ed.; Elsevier Science: Amsterdam, The Netherlands; Oxford, UK, 2009; pp. 1–40. [Google Scholar]
  42. Al–Qadi, I.L.; Lahouar, S. Measuring layer thicknesses with GPR—Theory to practice. Constr. Build. Mater. 2005, 19, 763–772. [Google Scholar] [CrossRef]
  43. Xie, F.; Zhang, Y.W.; Lu, P.; Cao, X.W.; Zu, Y.H.; Li, Z.J. Characteristics and influencing factors of lake ice growth and decay in a shallow lake from a cold region*. J. Lake Sci. 2021, 33, 1552–1563. [Google Scholar]
  44. Xie, F. Study on the Heat Exchange Processes and the Growth and Decay Processes of Shore Ice in Nenjiang (Qiqihar section); Northeast Agricultural University: Harbin, China, 2019. [Google Scholar]
  45. Reed, D.E.; Desai, A.R.; Whitaker, E.C.; Nuckles, H. Evaluation of Low–Cost, Automated Lake Ice Thickness Measurements. J. Atmos. Ocean. Technol. 2019, 36, 527–534. [Google Scholar] [CrossRef] [Green Version]
  46. Bartosiewicz, M.; Ptak, M.; Woolway, R.I.; Sojka, M. On thinning ice: Effects of atmospheric warming, changes in wind speed and rainfall on ice conditions in temperate lakes (Northern Poland). J. Hydrol. 2021, 597, 125724. [Google Scholar] [CrossRef]
  47. Cheng, B.; Cheng, Y.B.; Vihma, T.; Kontu, A.; Zheng, F.; Lemmetyinen, J.; Qiu, Y.B.; Pulliainen, J. Inter–annual variation in lake ice composition in the European Arctic: Observations based on high–resolution thermistor strings. Earth Syst. Sci. Data 2021, 13, 3967–3978. [Google Scholar] [CrossRef]
  48. Lei, R.B.; Li, Z.J.; Zhang, Z.H.; Cheng, Y.F. Comparisons of thermodynamic processes between likeice and landfast seaice around ZHONGSHAN station, east antarctica. Chin. J. Polar Res. 2011, 23, 289–298. [Google Scholar]
  49. Zhang, Y.; Li, C.Y.; Shi, X.H.; Pei, G.X.; Qiao, L.M. Field observation of ice melting process in Wuliangsuhai Lake. Trans. Oceanol. Limnol. 2016, 4, 38–42. [Google Scholar]
  50. Kheyrollah Pour, H.; Duguay, C.R.; Scott, K.A.; Kang, K.-K. Improvement of Lake Ice Thickness Retrieval From MODIS Satellite Data Using a Thermodynamic Model. IEEE Trans. Geosci. Remote Sens. 2017, 55, 5956–5965. [Google Scholar] [CrossRef]
  51. Grenfell, T.C.; Perovich, D.K. Spectral albedos of sea ice and incident solar irradiance in the southern Beaufort Sea. J. Geophys. Res. 1984, 89, 3573–3580. [Google Scholar] [CrossRef]
  52. Wang, M.X.; Wen, L.J.; Li, Z.G.; Su, D.S. Study on the Warming Characteristics during the Ice–covered Peried of Ngoring Lake in the Qinghai–Xizang Plateau. Plateau Meteorol. 2021, 40, 965–976. [Google Scholar]
  53. Allison, I.; Brandt, R.E.; Warren, S.G. East Antarctic sea ice: Albedo, thickness distribution, and snow cover. J. Geophys. Res. 1993, 98, 12417–12429. [Google Scholar] [CrossRef]
  54. Zhang, R.; Wang, H.; Fu, Q.; Rasch, P.J.; Wang, X. Unraveling driving forces explaining significant reduction in satellite–inferred Arctic surface albedo since the 1980s. Proc. Natl. Acad. Sci. USA 2019, 116, 23947–23953. [Google Scholar] [CrossRef] [PubMed] [Green Version]
  55. Duan, A.M.; Xiao, Z.X.; Wu, G.X. Characteristics of climate change over the Tibetan Plateau under the global warming during 1979–2014. Clim. Chang. Res. 2016, 12, 374–381. [Google Scholar]
  56. Weber, H.; Riffler, M.; Noges, T.; Wunderle, S. Lake ice phenology from AVHRR data for European lakes: An automated two–step extraction method. Remote Sens. Environ. 2016, 174, 329–340. [Google Scholar] [CrossRef]
  57. You, Q.L.; Min, J.Z.; Kang, S.C. Rapid warming in the Tibetan Plateau from observations and CMIP5 models in recent decades. Int. J. Climatol. 2016, 36, 2660–2670. [Google Scholar] [CrossRef]
  58. Montgomery, L.; Miege, C.; Miller, J.; Scambos, T.A.; Wallin, B.; Miller, O.; Solomon, D.K.; Forster, R.; Koenig, L. Hydrologic Properties of a Highly Permeable Firn Aquifer in the Wilkins Ice Shelf, Antarctica. Geophys. Res. Lett. 2020, 47, e2020GL089552. [Google Scholar] [CrossRef]
  59. Kämäri, M.; Alho, P.; Colpaert, A.; Lotsari, E. Spatial variation of river–ice thickness in a meandering river. Cold Reg. Sci. Technol. 2017, 137, 17–29. [Google Scholar] [CrossRef]
  60. Liao, H.J.; Sun, J.Y.; Zan, Y.W.; Zhu, Q.N.; Gu, F. Dielectric constant model for soil and its application in engineering. Chin. J. Geotech. Eng. 2016, 38, 36–41. [Google Scholar]
  61. Cheng, B.; Vihma, T.; Rontu, L.; Kontu, A.; Pour, H.K.; Duguay, C.; Pulliainen, J. Evolution of snow and ice temperature, thickness and energy balance in Lake Orajärvi, northern Finland. Tellus A Dyn. Meteorol. Oceanogr. 2014, 66, 1. [Google Scholar] [CrossRef]
  62. Xie, F.; Lu, P.; Li, Z.; Wang, Q.; Zhang, H.; Zhang, Y. A floating remote observation system (FROS) for full seasonal lake ice evolution studies. Cold Reg. Sci. Technol. 2022, 199, 103557. [Google Scholar] [CrossRef]
  63. Vihma, T.; Pirazzini, R.; Fer, I.; Renfrew, I.A.; Sedlar, J.; Tjernström, M.; Lüpkes, C.; Nygård, T.; Notz, D.; Weiss, J.; et al. Advances in understanding and parameterization of small–scale physical processes in the marine Arctic climate system: A review. Atmos. Chem. Phys. 2014, 14, 9403–9450. [Google Scholar] [CrossRef] [Green Version]
  64. Shirasawa, K.; Lindgren, E.; Leppäranta, M. The heat budget of Lake Kilpisjärvi in the Arctic tundra. Hydrol. Res. 2017, 48, 969–980. [Google Scholar]
Figure 1. The location (a) and photo (b) of the GPR ice monitoring system setup (the base map is a Landsat OLI image acquired on 1 February 2021).
Remotesensing 14 02437 g001
Figure 2. The process of GPR profile image including resampling (a), Gain–adjusted (b), FIR filtered (c), and layer–tracking (d).
Remotesensing 14 02437 g002
Figure 3. Lake ice thickness measurements via drilling (a,b) and airborne ice measuring radar (c) in Qinghai Lake during January–March 2019.
Remotesensing 14 02437 g003
Figure 4. Variations of the moment and average daily thickness of lake ice.
Remotesensing 14 02437 g004
Figure 5. Photographs of the ice surface below the GPR ice thickness monitoring system.
Remotesensing 14 02437 g005
Figure 6. Variations of lake ice thickness on different dates (a) and statistics of time when ice thickness reached its maximum and minimum (b).
Remotesensing 14 02437 g006
Figure 7. Changes in near-surface air and ice surface moment and average daily temperature.
Remotesensing 14 02437 g007
Figure 8. Daily variation of near-surface air and ice surface temperature.
Remotesensing 14 02437 g008
Figure 9. Relations among the average daily thickness of lake ice, the cumulative temperature of ice surface (a), and average daily cumulative temperature of ice surface (b).
Remotesensing 14 02437 g009
Figure 10. Changes in near-surface air humidity (a), wind speed (b), illuminance (c), and lake ice thickness (d) near the GPR ice monitoring system from 7–24 March 2021.
Remotesensing 14 02437 g010
Figure 11. Distribution of melting ice (in black color) near GPR ice monitoring system (in pentacle) in Sentinel 2A MSI image acquired on 26 March 2021 (a) and photo of the tilted tower on 27 March 2021 (b).
Remotesensing 14 02437 g011
Table 1. Parameters of GPR ice monitoring system.
IndicatorsParametersIndicatorsParameters
Radar center frequency400 MHzTemperature and humidity transmitter accuracyTemperature: ±0.5 °C
Humidity: ±3% RH
Ice detection thickness≥6 mTemperature and humidity transmitter rangeTemperature: −40 ~+120 °C
Humidity: 0~80% RH
Ice thickness detection accuracymmInfrared camera pixels>2 million
Pulse repetition frequency400 kHzInfrared effective distance>50 m
Radar dynamic range>120 dBIlluminance tester accuracy±7%
Number of time windows70 nsWind speed sensor accuracy±(0.2 + 0.03 V) m/s
Number of sampling points1024Wind speed sensor range0~60 m/s
Data transmission methodWiFi and Ethernet interfaceWeathervane accuracy±1°
Operating temperature range−30~+60 °CCamera pixels2 million
Table 2. In–situ ice thickness data of Qinghai Lake from January 2019 to March 2019.
Drilling HoleAirborne Ice Measuring Radar
IDCoordinateDateIn-Situ Thickness (cm)DateFlight Path (km)Simulated Thickness (cm)
137.021°N, 100.593°E30 January 201941.530 January 20193.9543.8
237.109°N, 100.370°E30 January 201942.530 January 20194.7243.0
337.168°N, 99.762°E30 January 201942.031 January 20195.1841.4
436.898°N, 99.640°E2 March 201945.23 March 20194.4647.6
536.846°N, 99.713°E2 March 201928.02 March 20194.9231.0
636.745°N, 99.795°E2 March 201936.22 March 20194.8633.2
736.634°N, 100.118°E2 March 201949.22 March 20195.0647.6
836.643°N, 100.414°E2 March 201955.12 March 20193.5452.7
Publisher’s Note: MDPI stays neutral with regard to jurisdictional claims in published maps and institutional affiliations.

