1. Introduction
Global nighttime lights are among the most widely recognized satellite data products, providing a visual expression of humanity’s presence across the earth’s surface. In addition, the global delineation of lit areas and their brightness levels are used by scientists spanning a wide range of disciplines, from economists and biologists to astronomers [
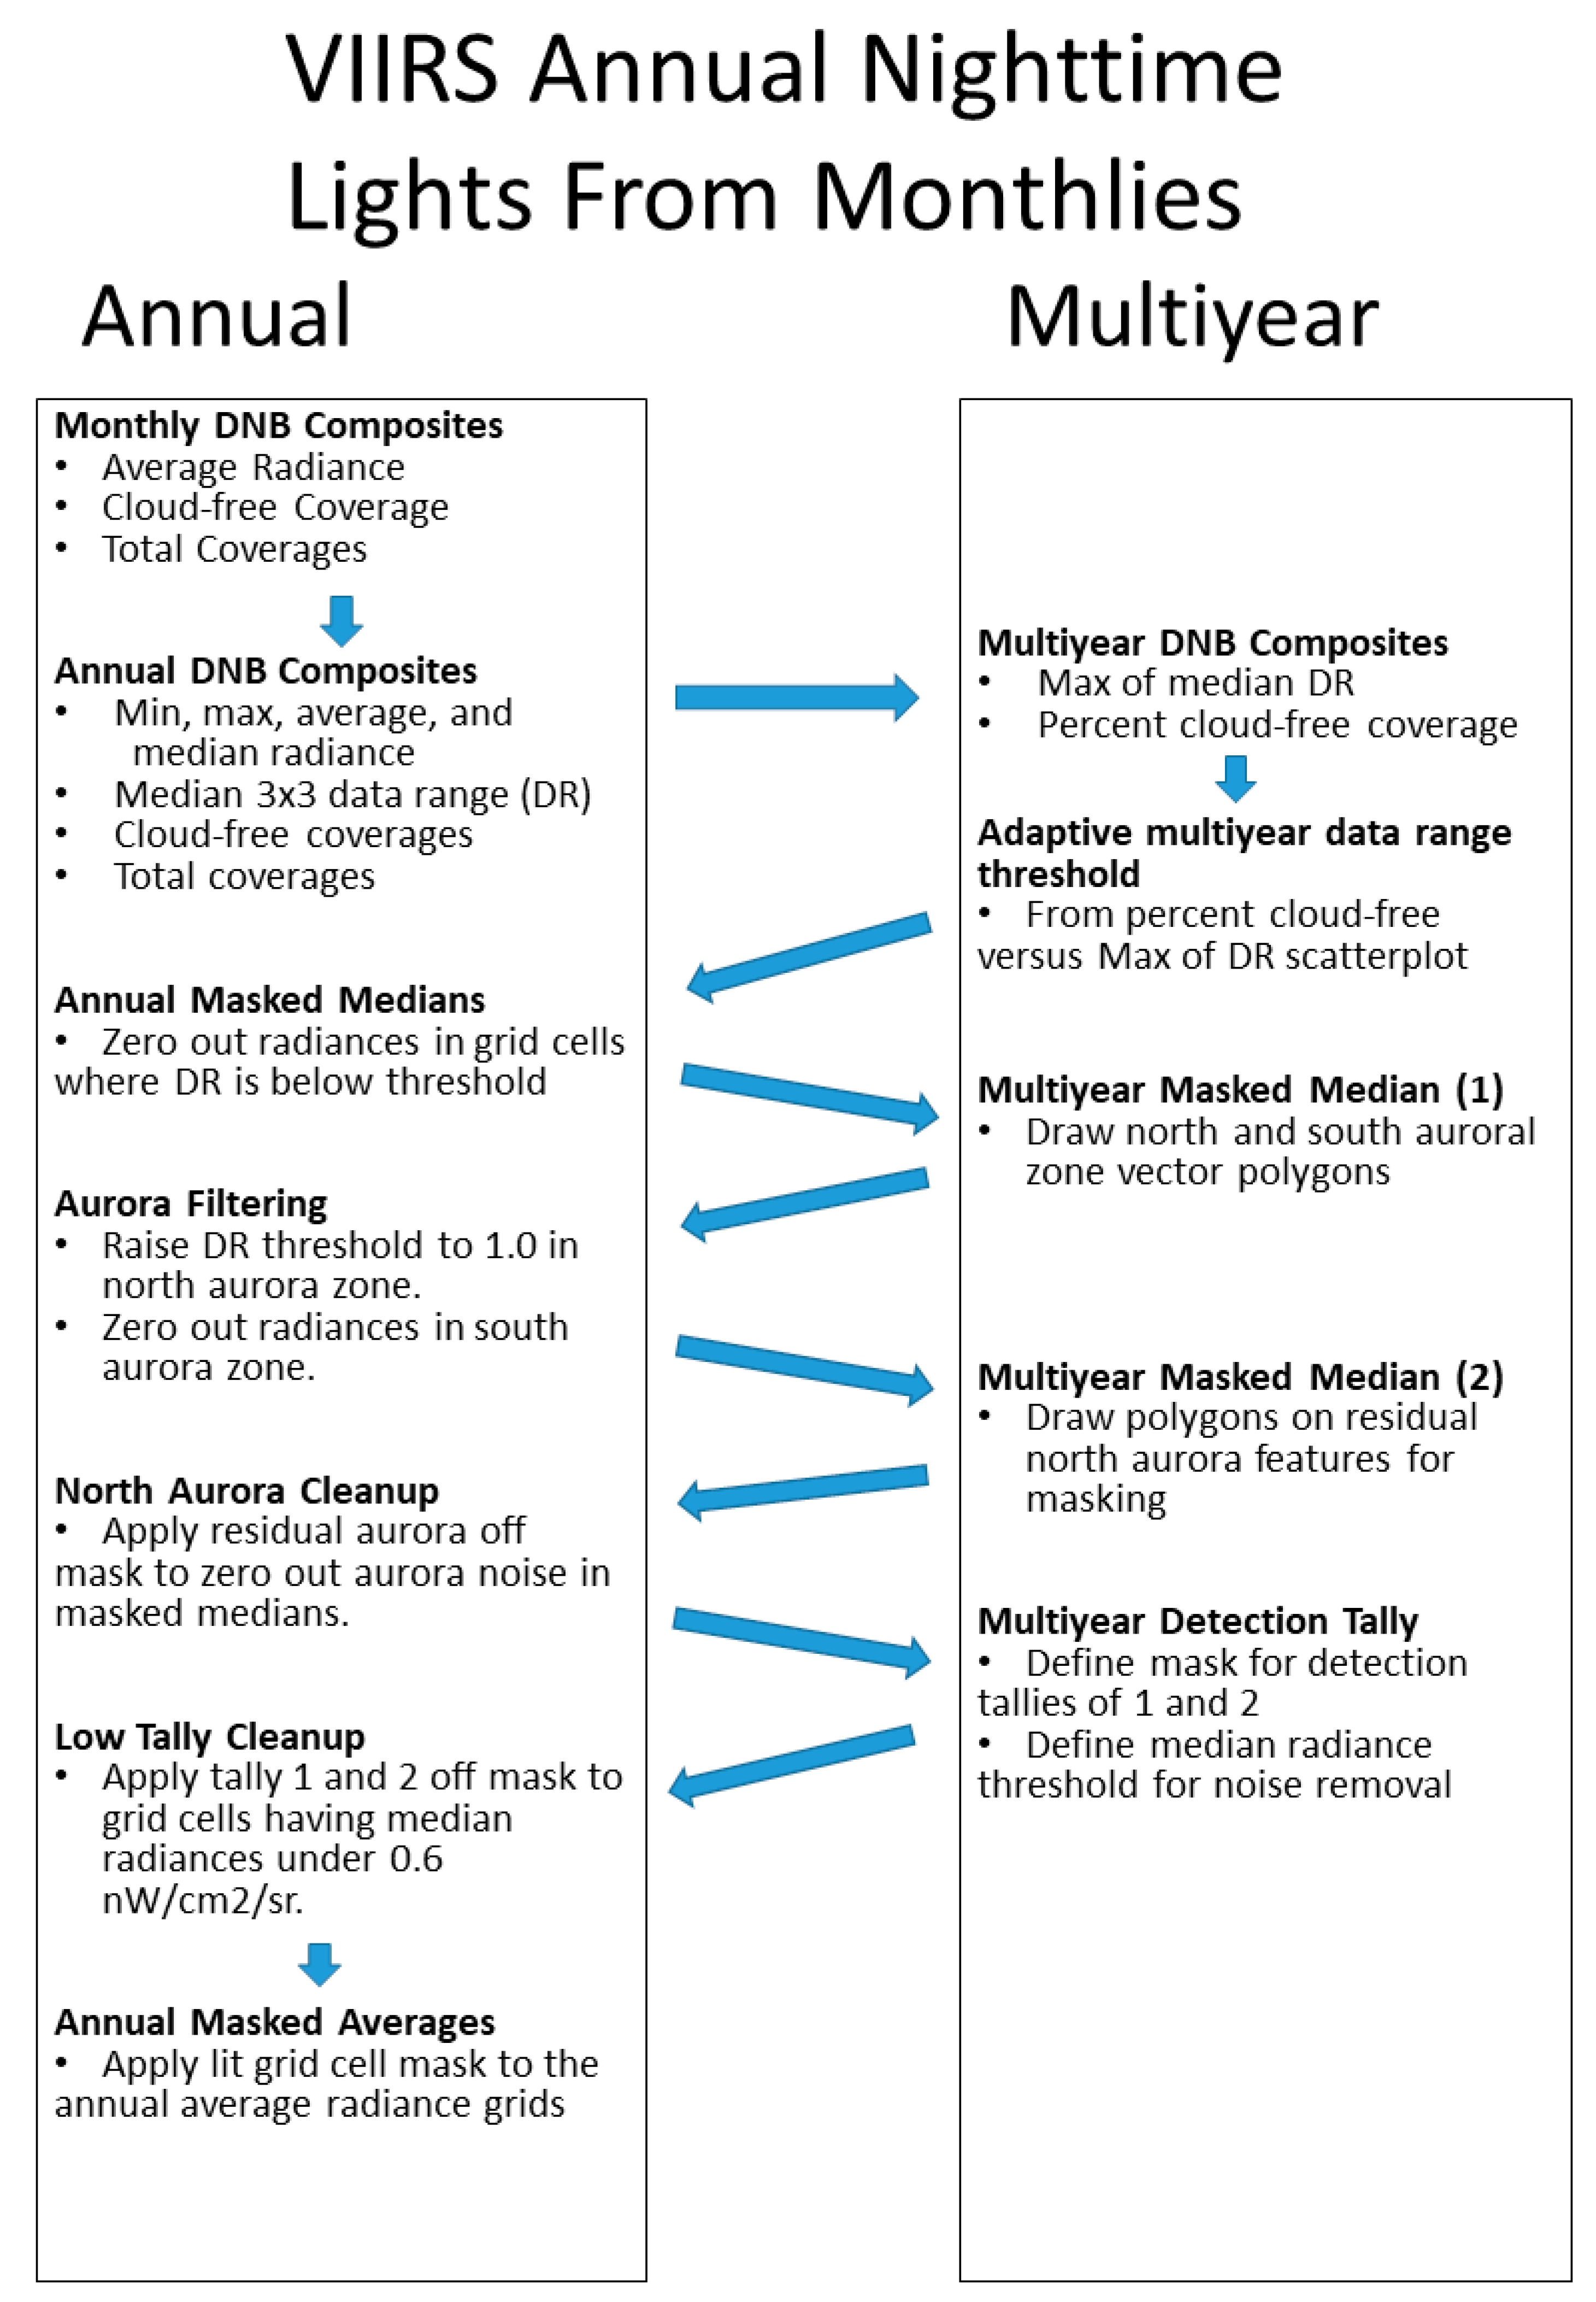
1]. Construction of global nighttime lights requires sifting through large numbers of nightly observations and obtaining sufficient numbers of high-quality observations in order to derive a stable measure of brightness as seen from space. In general, it takes a full year of nightly observations to ensure that the product’s latitude range reaches the fullest possible extent, with the majority of the Earth’s surface having multiple observations free of extraneous features unrelated to electric lighting. The processing chain features a cascading set of filtering steps [
2]. The initial filtering removes cloudy, sunlit, and moonlit data to obtain a set of candidate pixels for inclusion in the annual data product. The next processing step is to trim off outliers, such as biomass burning and aurora, to obtain a grid where background areas, lacking detectible lighting, can be more readily distinguished from lighting. The background areas are then converted to zeros and lit grid cells are filled with the average radiances. The objective of the filtering is to retain as many of the surface lighting features as possible while completely zeroing out the background and extraneous features.
The Earth Observation Group (EOG) first developed its annual nighttime lights product generation system for low light imaging data collected by the U.S. Air Force Defense Meteorological Satellite Program (DMSP) Operational Linescan System (OLS) in the mid-1990s [
3]. In 2015, the system was modified for the production of annual global nighttime products based on nightly day/night band (DNB) low light imaging data collected by the NASA/NOAA Visible Infrared Imaging Radiometer Suite (VIIRS). EOG produced two annual nighttime lights products from nightly VIIRS data: 2015 and 2016. The sponsor declined to renew the funding to continue production on the VIIRS nighttime lights (VNL) time series. However, EOG continued the production of monthly cloud-free average radiances for the DNB data collected by the first VIIRS instrument, flown on the Suomi National Polar Partnership (SNPP) satellite. At mid-to-high latitudes, the monthly DNB products have outages due to solar contamination in summer months and no filtering has been applied to remove fires, aurora, or background. These characteristics limit their utility in many applications where the focus is on electric lighting. As of December 2020, EOG’s collection of monthly products spans April 2012 through November 2020—a total of 104 months. In this paper we report on methods developed to produce annual VNL products with filtering to remove fires and background from the monthly DNB product sets. We compare the V.2 annual product made from monthly data with the one produced several years ago (V.1) with nightly data.
2. Materials and Methods
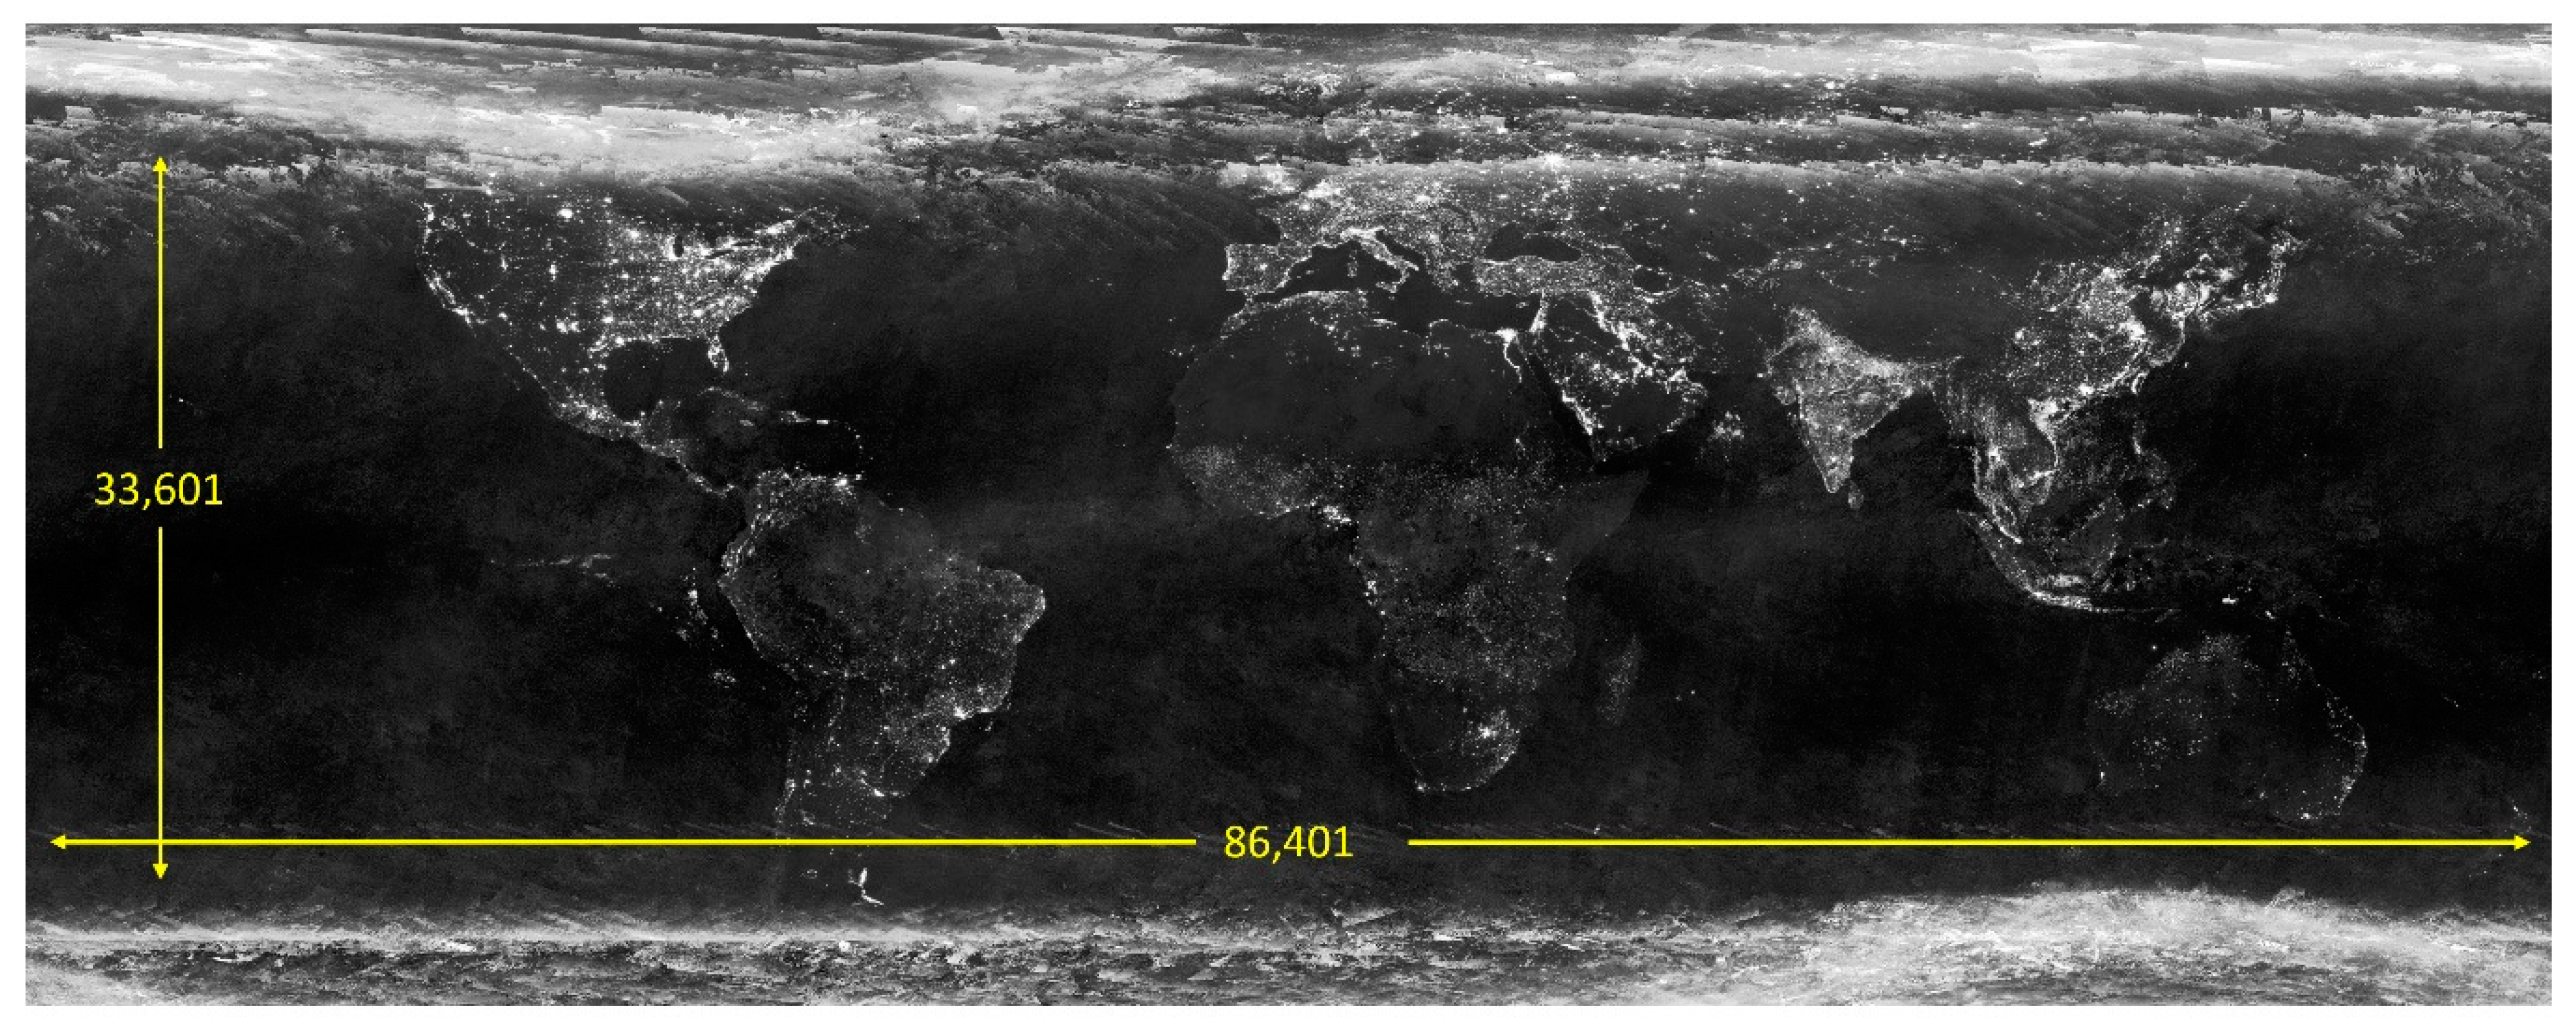
The process of assembling annual global nighttime light products begins with the establishment of a reference grid. We use a 15-arc second grid extending from 65 south to 75 north with 86,401 grid cells east to west and 33,601 grid cells north to south. The processing considers all the nightly VIIRS SNPP DNB data collected during a year, working in monthly increments (
Figure 1). The monthly DNB cloud-free composites are generated by averaging the radiances from orbital segments that are free of sunlight, moonlight, and cloudy data based on the VIIRS cloud mask [
2]. In addition to the average radiance, the V.1 monthly product set includes grids tallying the number of cloud-free observations and total number of observations. The V.1 monthly product sets are available at
https://eogdata.mines.edu/download_dnb_composites.html (accessed on 30 December 2020).
The V.1 monthly products are produced with and without stray light corrected data. The versions excluding stray light corrected data are indicated with a “vcm” in the file name. Those with stray light corrected data included are indicated by a “vcmsl” in the file name. For V.2 we used the “vcmsl” file sets, except in 2012 and 2013 when our in-house collection predates the advent of the stray light correction. EOG plans to remake the 2012 and 2013 V.2 VNL to include stray light corrected data.
The next challenge to making annual VNL from the monthlies is filtering out biomass burning and other outliers, thus isolating the background. In the original method based on the nightly DNB data, histogram-based outlier removal was used to generate an annual average radiance grid free of biomass burning and other ephemeral events. We found that the outlier removed average made from nightly data was approximated by the median radiance calculated from twelve monthly products. The median effectively excludes both high and low radiance outliers. This includes biomass burning, which is a seasonal phenomenon.
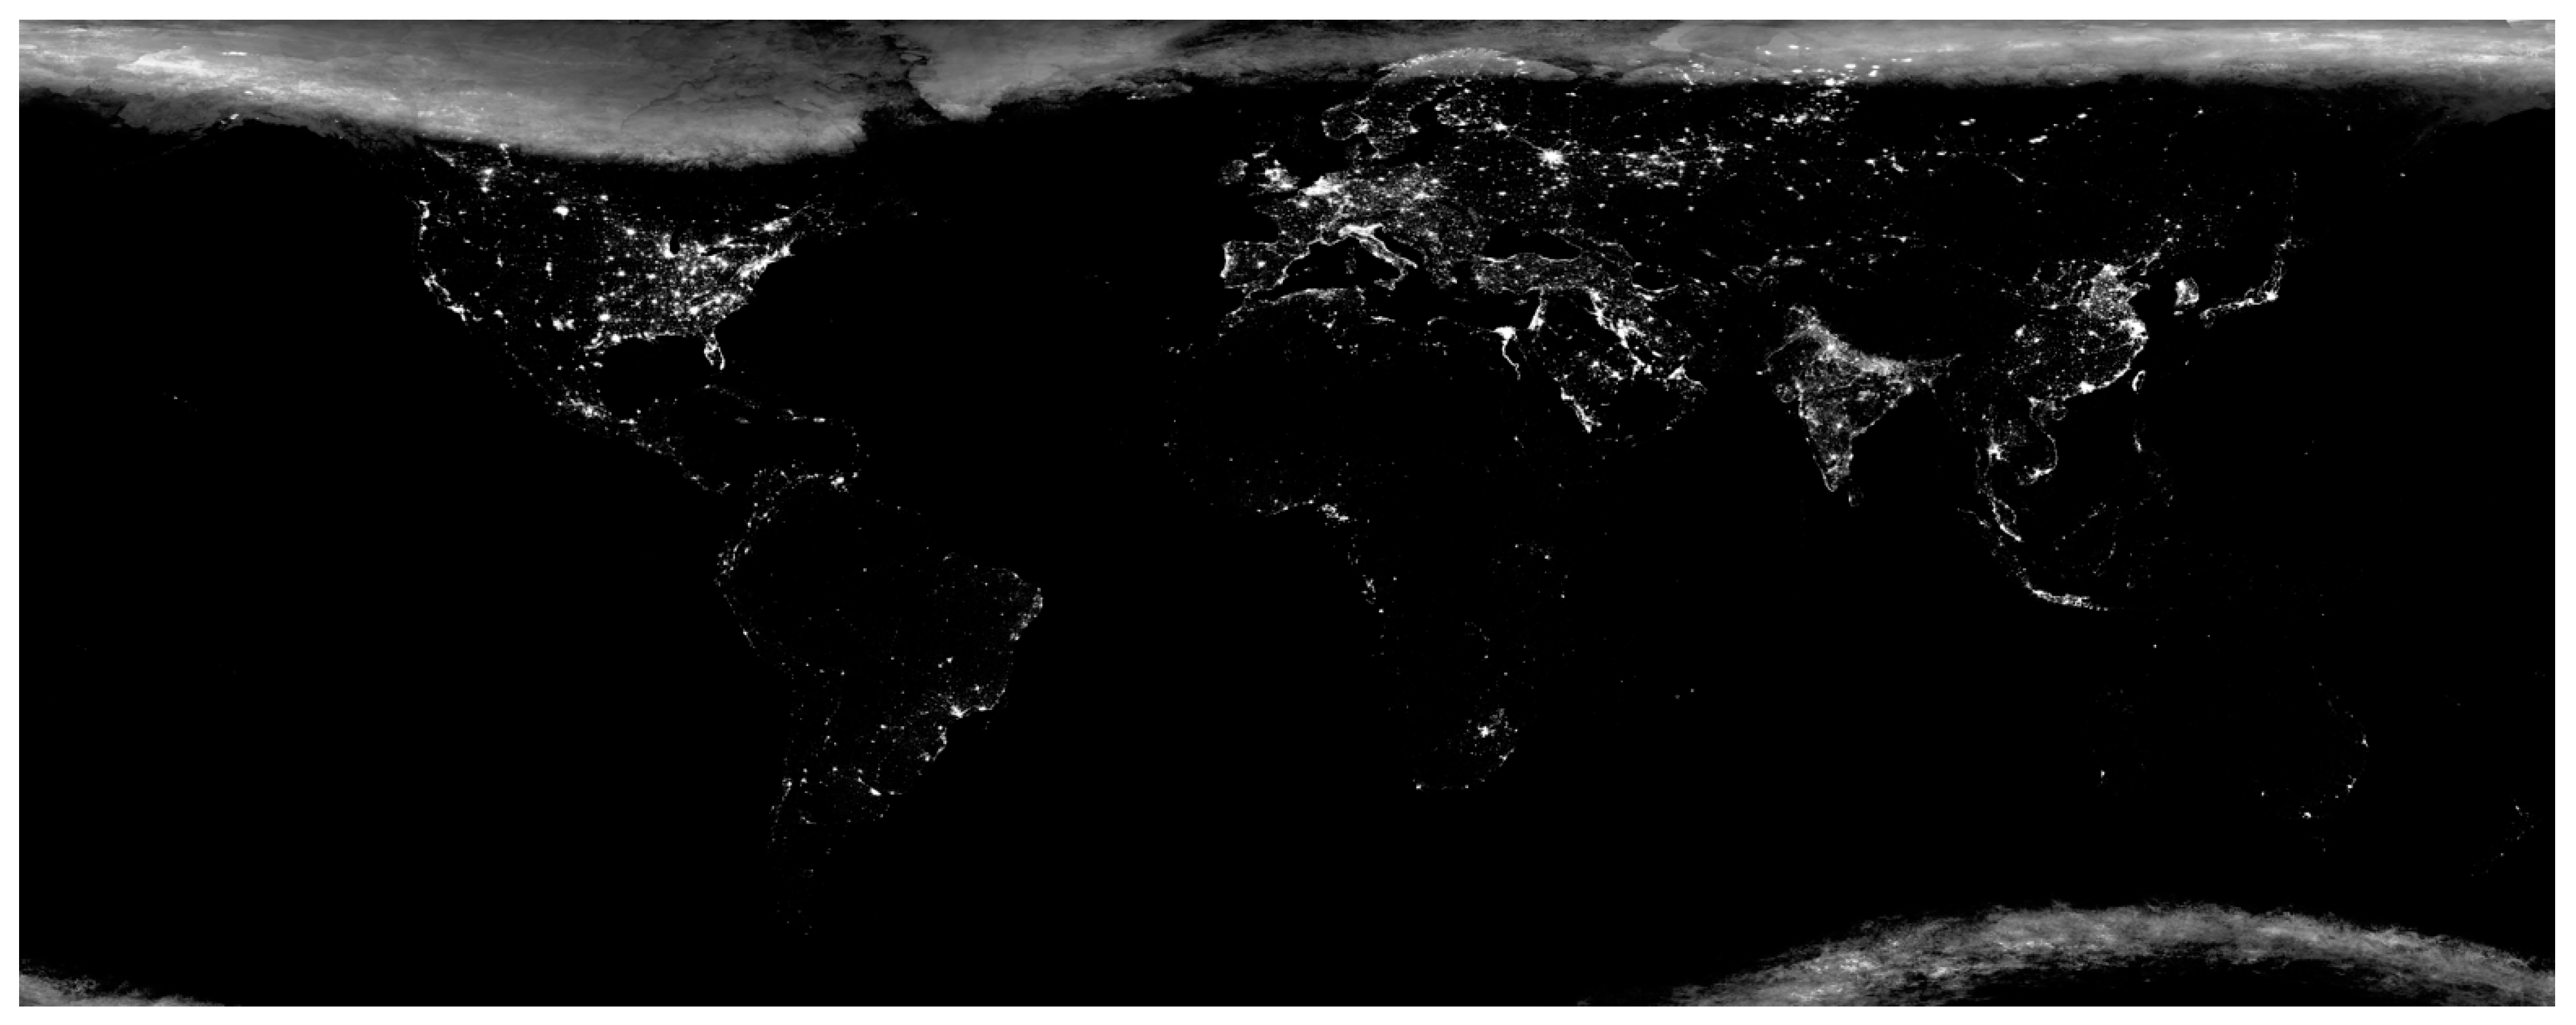
Figure 2 and
Figure 3 show the maximum and median radiances from the twelve monthly products of 2019.
In the original VNL method, lit areas for each annual product are distinguished from background by applying a threshold to the data range (DR) calculated from the outlier removed average radiance grid. The grid cell DR is calculated as the maximum minus the minimum radiance from the surrounding 3 × 3 grid cell set. The DR threshold used to zero out background grid cells is indexed to the number of cloud-free observations to accommodate the rise in the noise floor found in areas having low numbers of cloud-free observations. Thus, the DR threshold is designed to ride above the noise—resulting in a cleaner final produc.
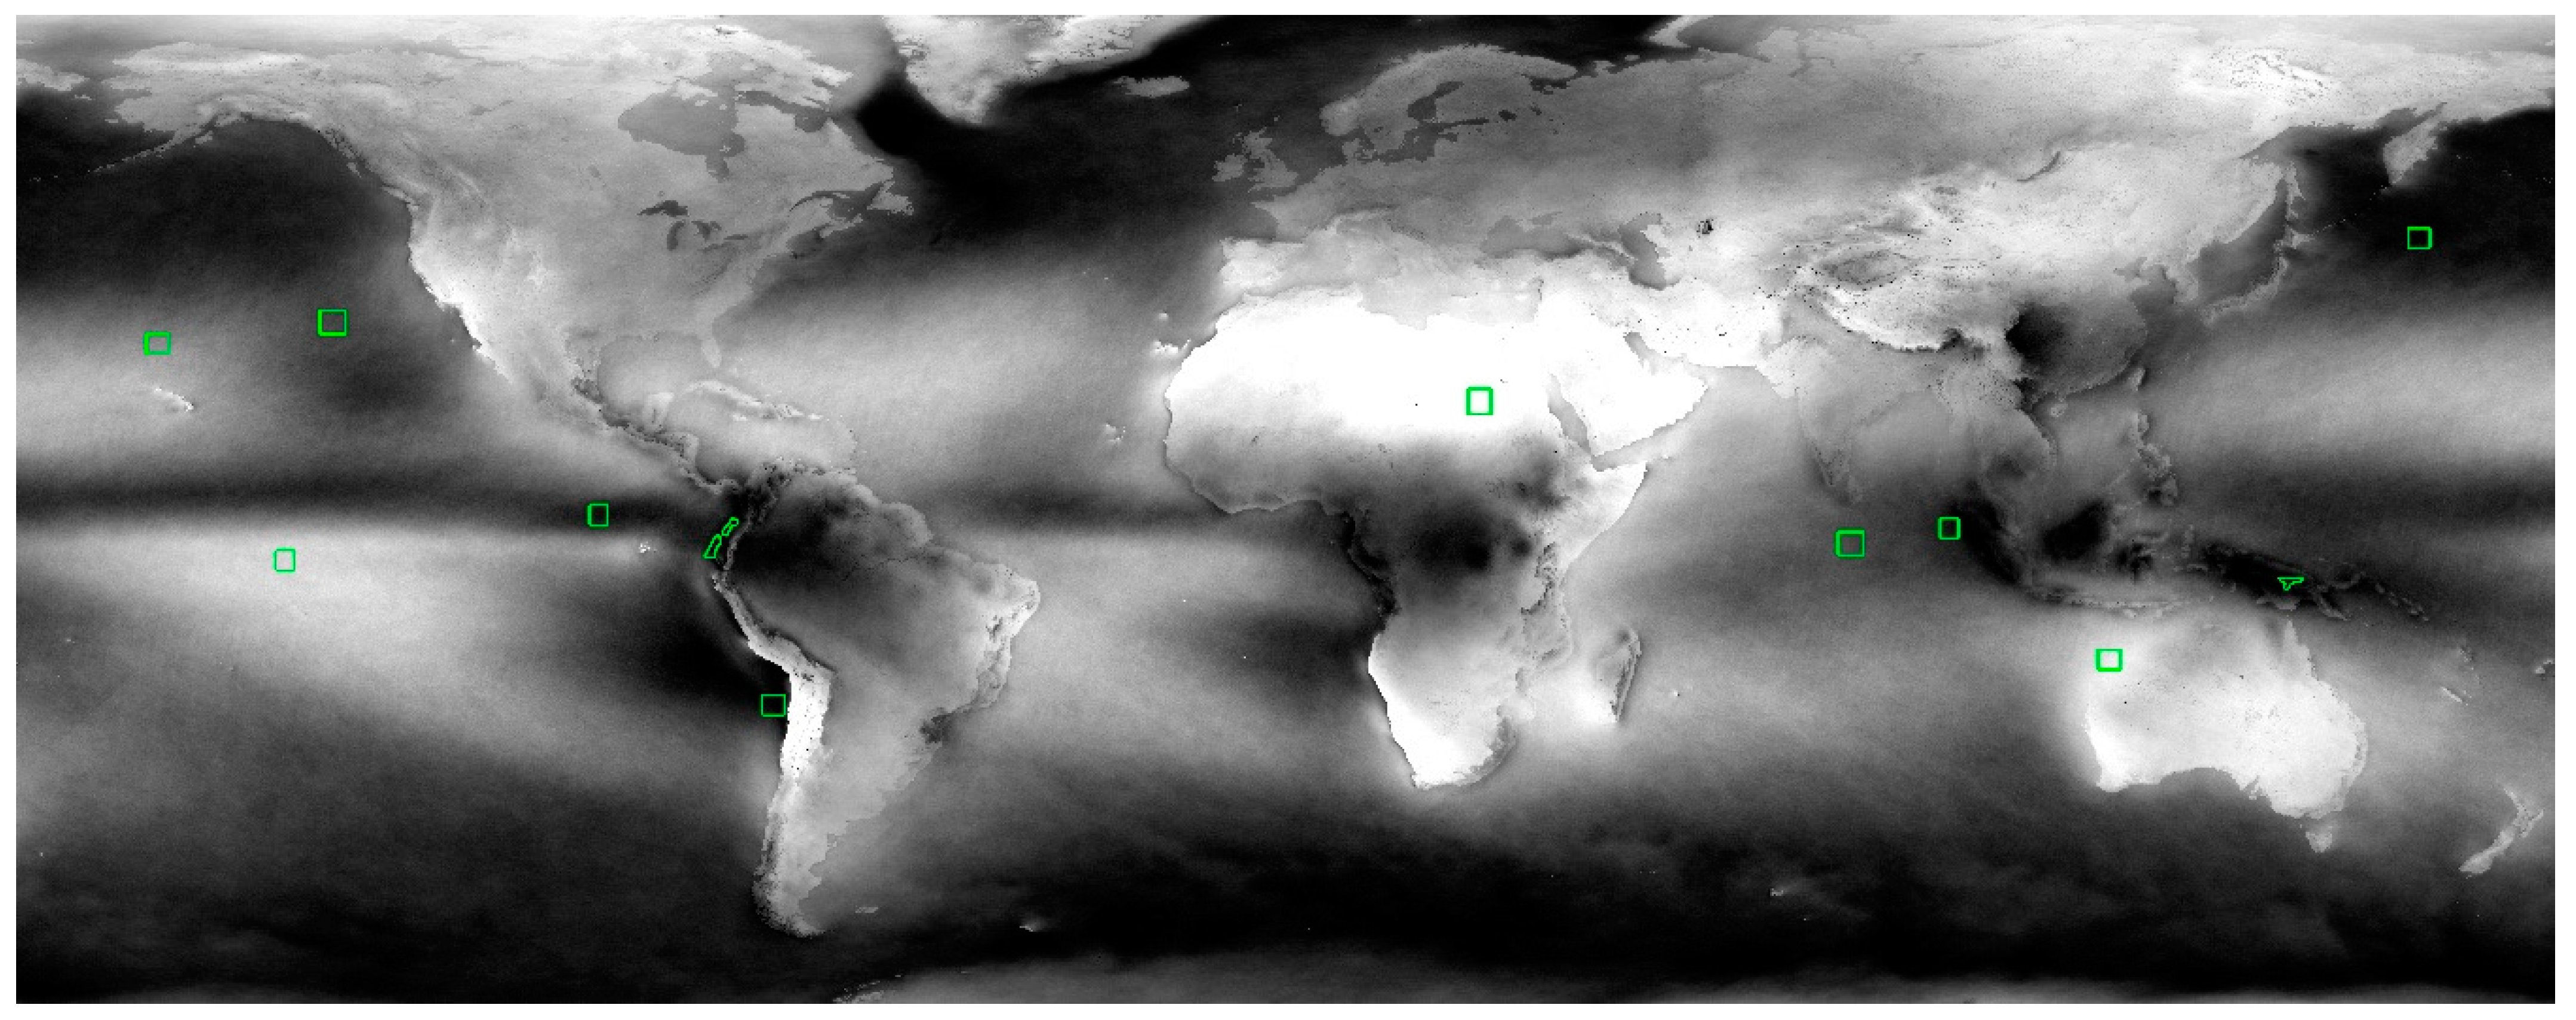
In the development of the V.2 VNL time series, particular attention was paid to applying the same DR threshold in each year of the series. This was accomplished by developing the DR threshold curve from a multiyear maximum median and percent cloud-free product spanning the entire set of years: 2012 to 2019. Sample sets of grid cells were extracted to cover a wide range of % cloud-free conditions (
Figure 4), and a scattergram was prepared by plotting % cloud free versus DR (
Figure 5). A gamma curve was fit to lie above the scattergram noise levels with tie points set at 0.2 at 100% cloud-free and 1.0 at 0% cloud-free. The DR threshold remained steady at 0.2 from 50% to 100% cloud-free and rose above the increased noise level present at lower % cloud-free levels. The DR threshold line was then used to create a global grid of DR thresholds from the multiyear percent cloud-cover product. This was then applied to each of the annual DR grids to identify and zero out background.
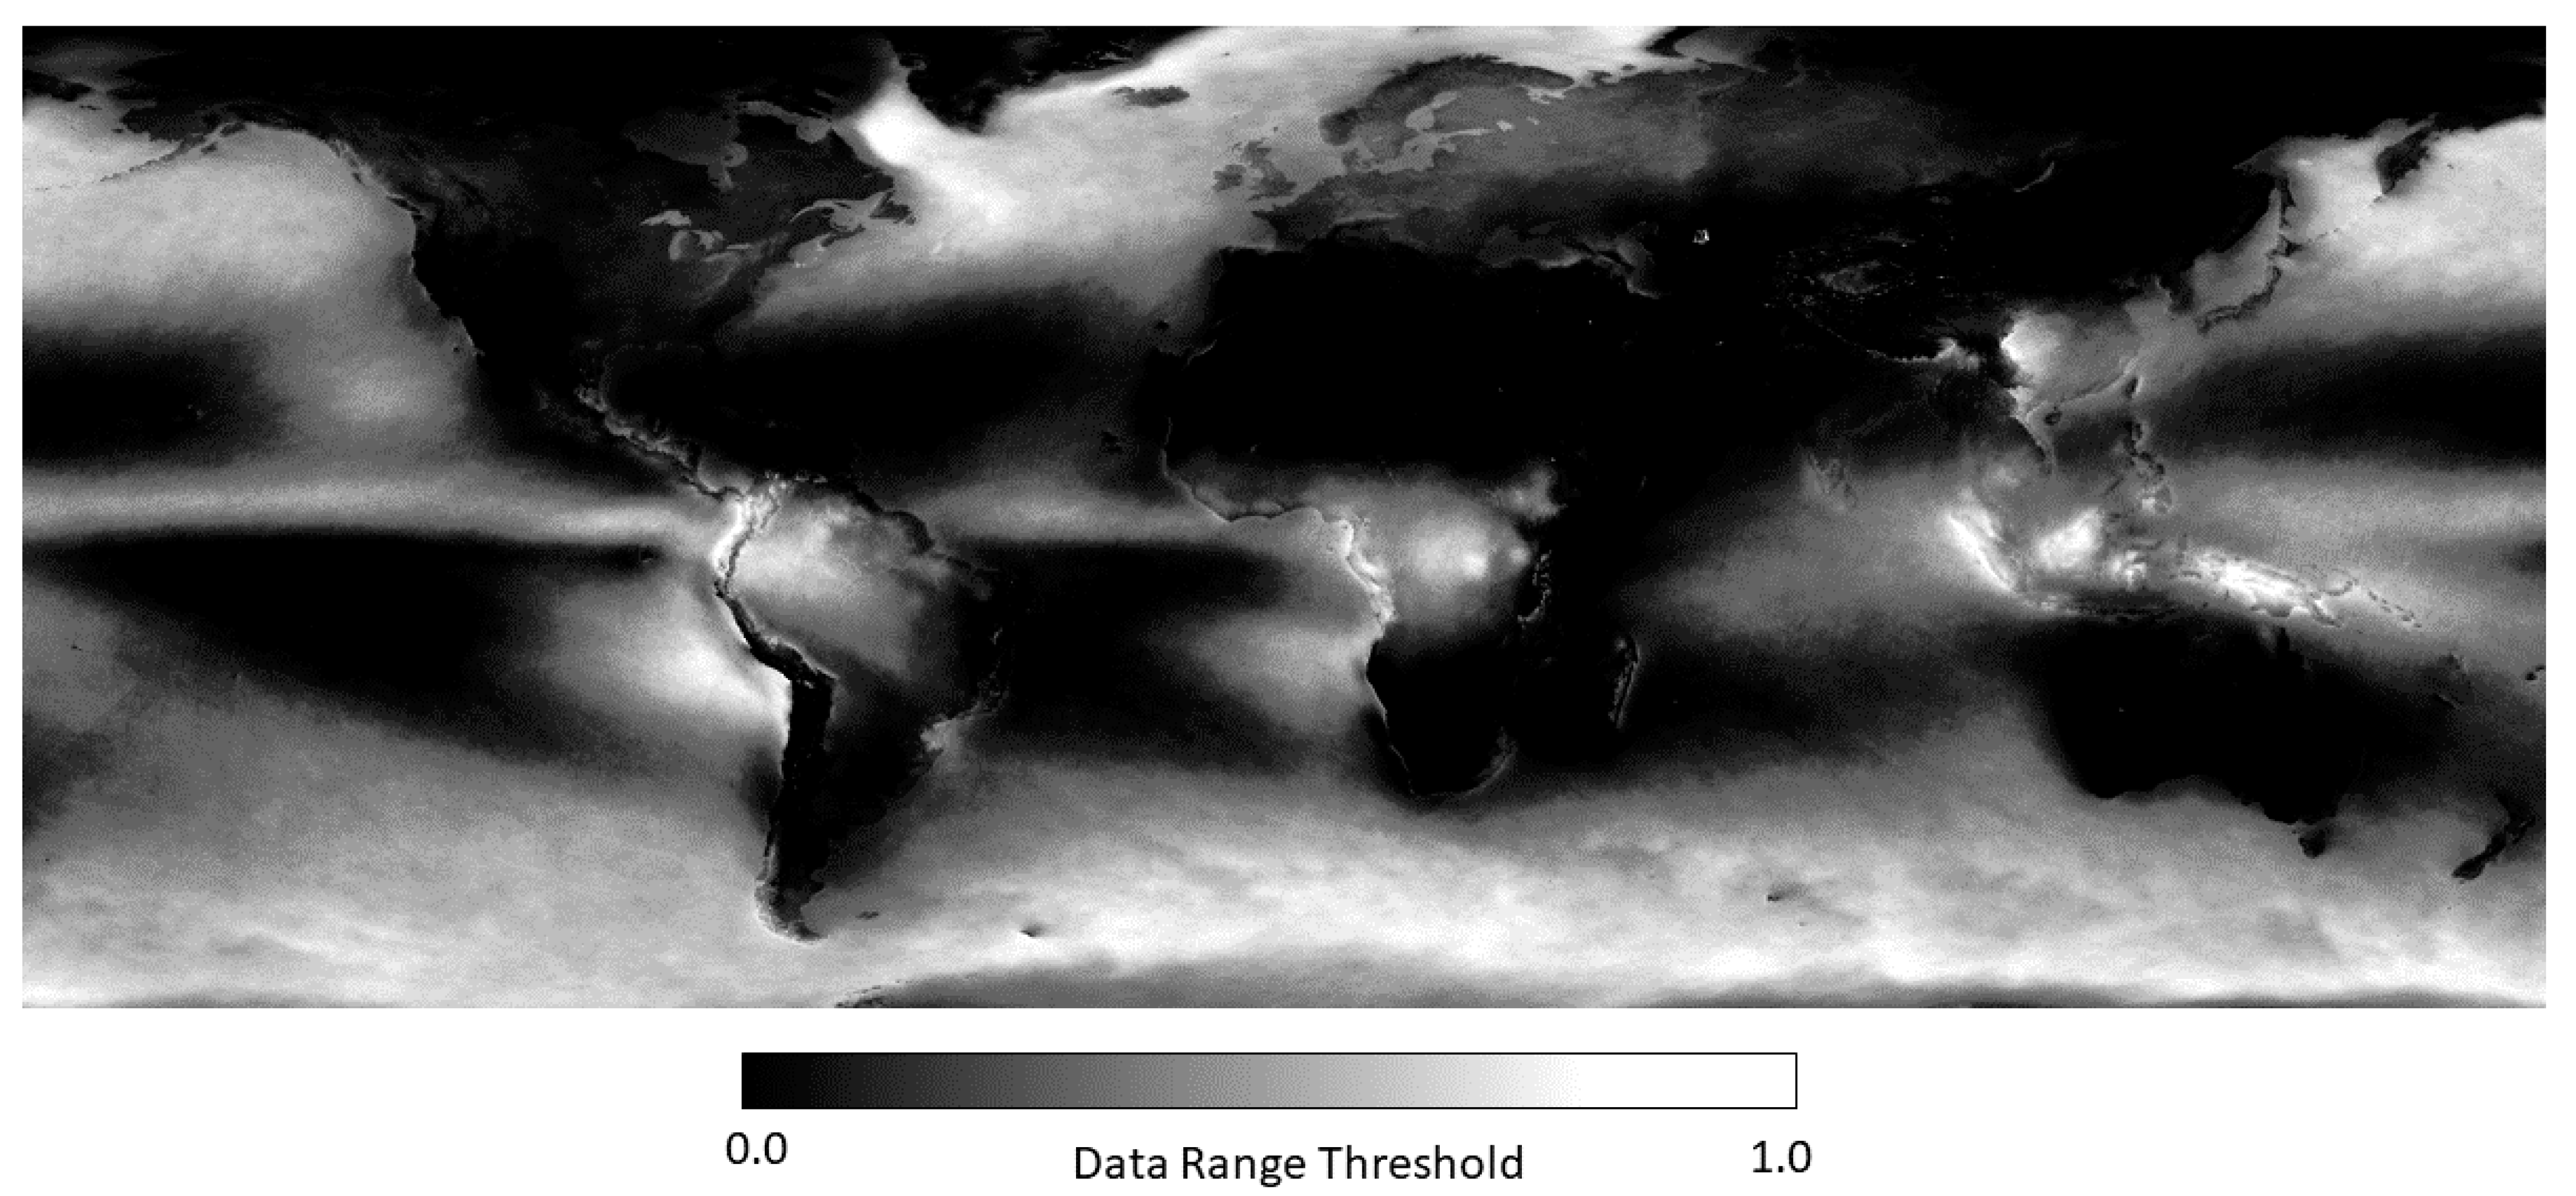
The multiyear DR threshold was calculated from the cloud-free coverages (
Figure 4) based on the threshold curve (
Figure 5) and is shown in
Figure 6. The curve is based on a gamma function fit to yield 0.2 at 100% cloud free and 1.0 at 0% cloud free. The formula for the threshold curve as a function of PCT (% cloud-free) is as follows:
where
is the normalized lower incomplete gamma function
The DR threshold curve was then combined with the multiyear percent cloud-free grid (
Figure 4) to form a global multiyear DR threshold image (
Figure 6). Application of the DR threshold grid to the multiyear DR grid left residual background noise in both the north and south aurora zones and biomass burning zones in portions of Africa and elsewhere. Raising the DR threshold to remove all the noise in the aurora and biomass burning zones would have resulted in the loss of dim lighting detection in other areas. Therefore, we employed several methods to further reduce the residual noise in the annual VNL products in the aurora zones and several biomass burning zones. First, vector polygons were drawn on the residual noise present in the north and south aurora zones, carefully avoiding the splitting of lighting features. Since no lighting features remained in the south aurora zone, the covered grid cells were all zeroed out. In the north aurora zone the DR threshold was raised to 1.0. Remaining noise present in the north aurora zone was covered by a series of vector polygons, carefully drawn to preserve lighting features. Grid cells covered by the vectors were then zeroed out.
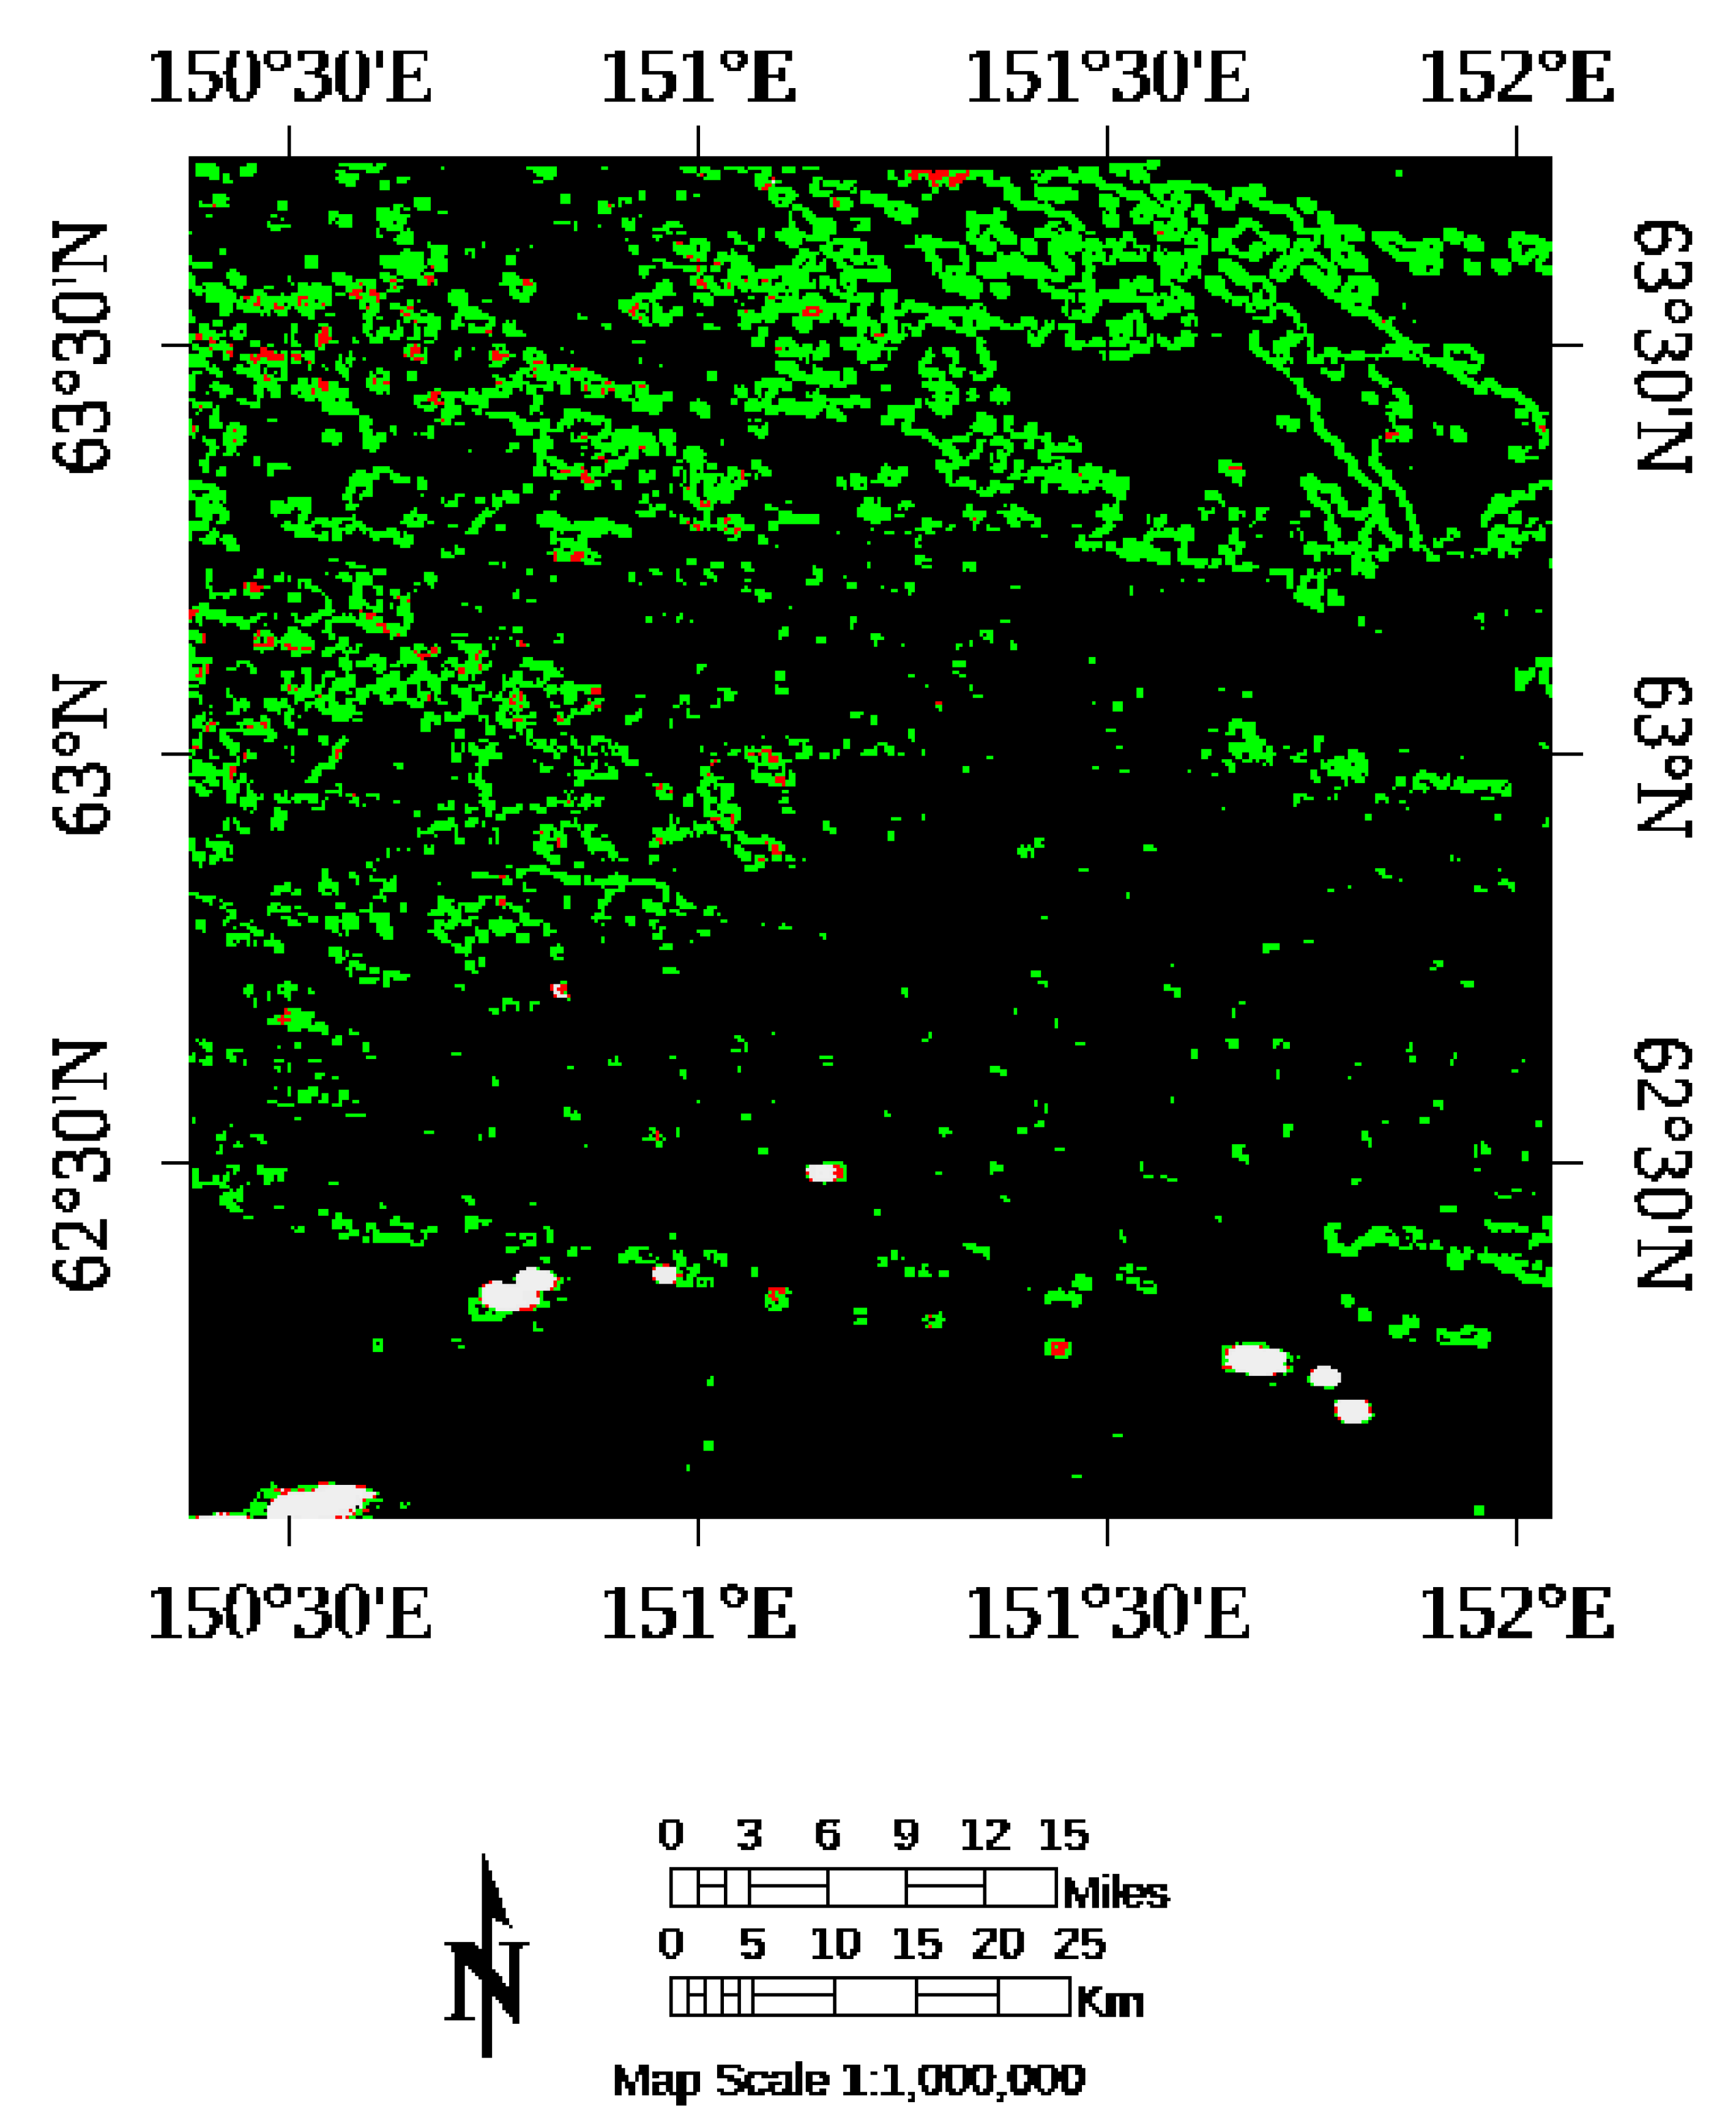
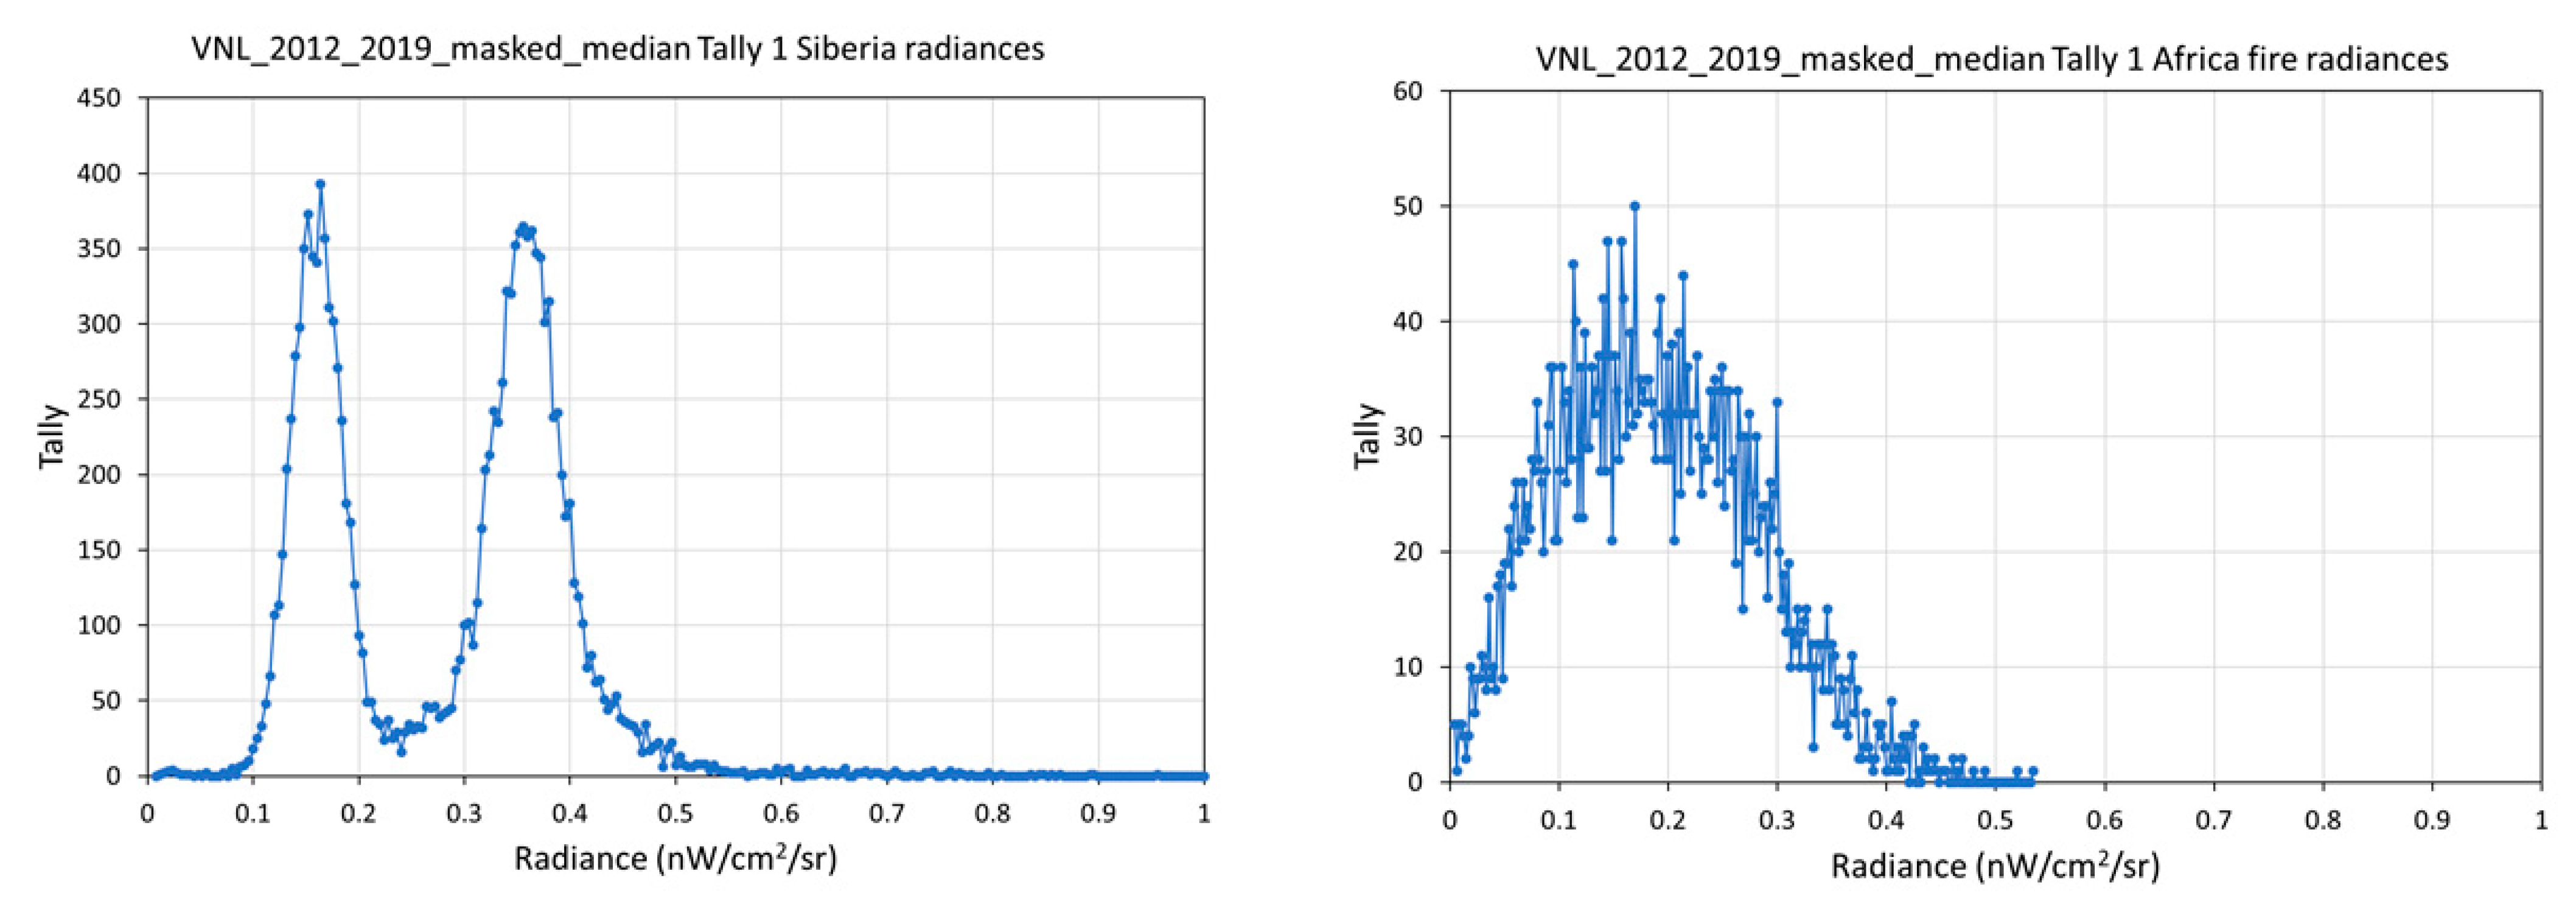
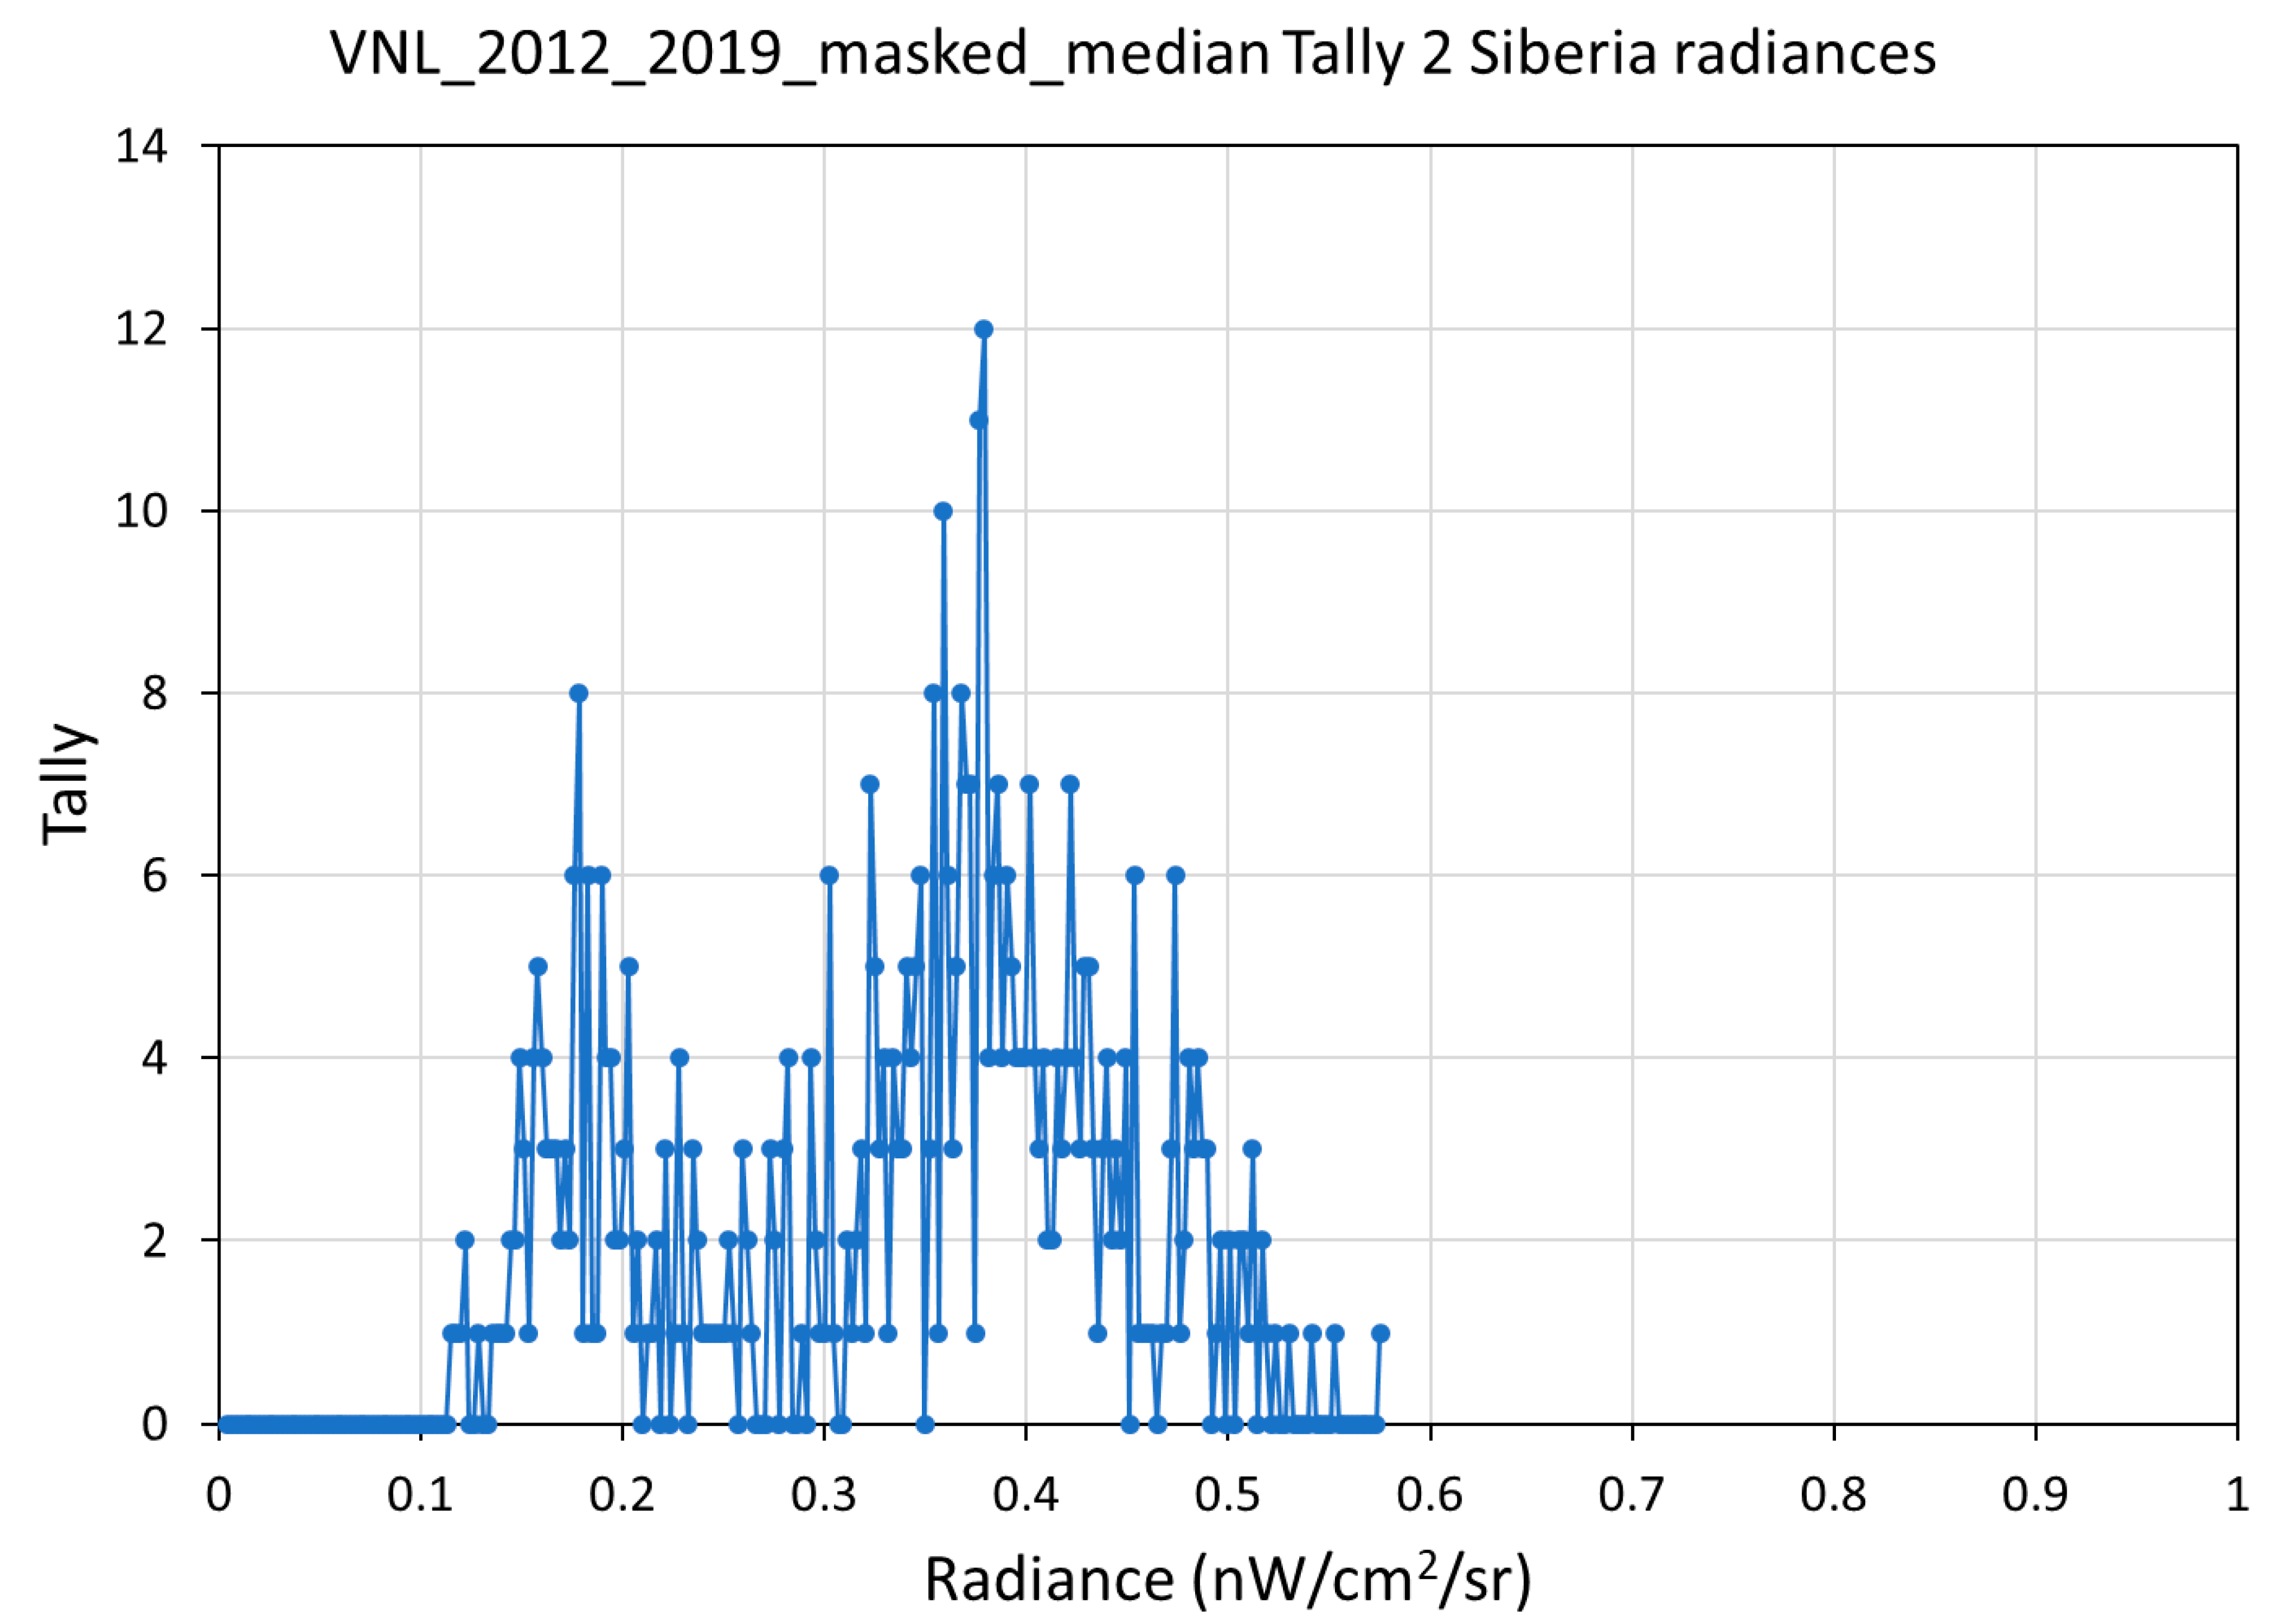
To address the remaining noise leaks, the detection numbers were tallied across all eight years. Noise leaks were found in African fire belts and in the far north, linked to imperfections in the stray light removal process (
Figure 7). It was determined that the remaining noise leaks occurred only once or twice in eight years. Samples of the grid cells tallying 1 and 2 median radiances from two of the prominent noise areas were examined (
Figure 8 and
Figure 9) to set thresholds of 0.6 nW/cm
2/sr, completing the noise removal.
The result of the filtering steps was a set of annual “masked medians” where background areas have been zeroed out. These were then used to make annual lit grid cell masks, which were applied to zero out the background grid cells in the annual averages and annual median images. The lit grid cell masks can also be applied to the corresponding V.1 monthly averages to clear out fires and zero out the background.
3. Results
3.1. V. 2 VNL Annual Product Sets
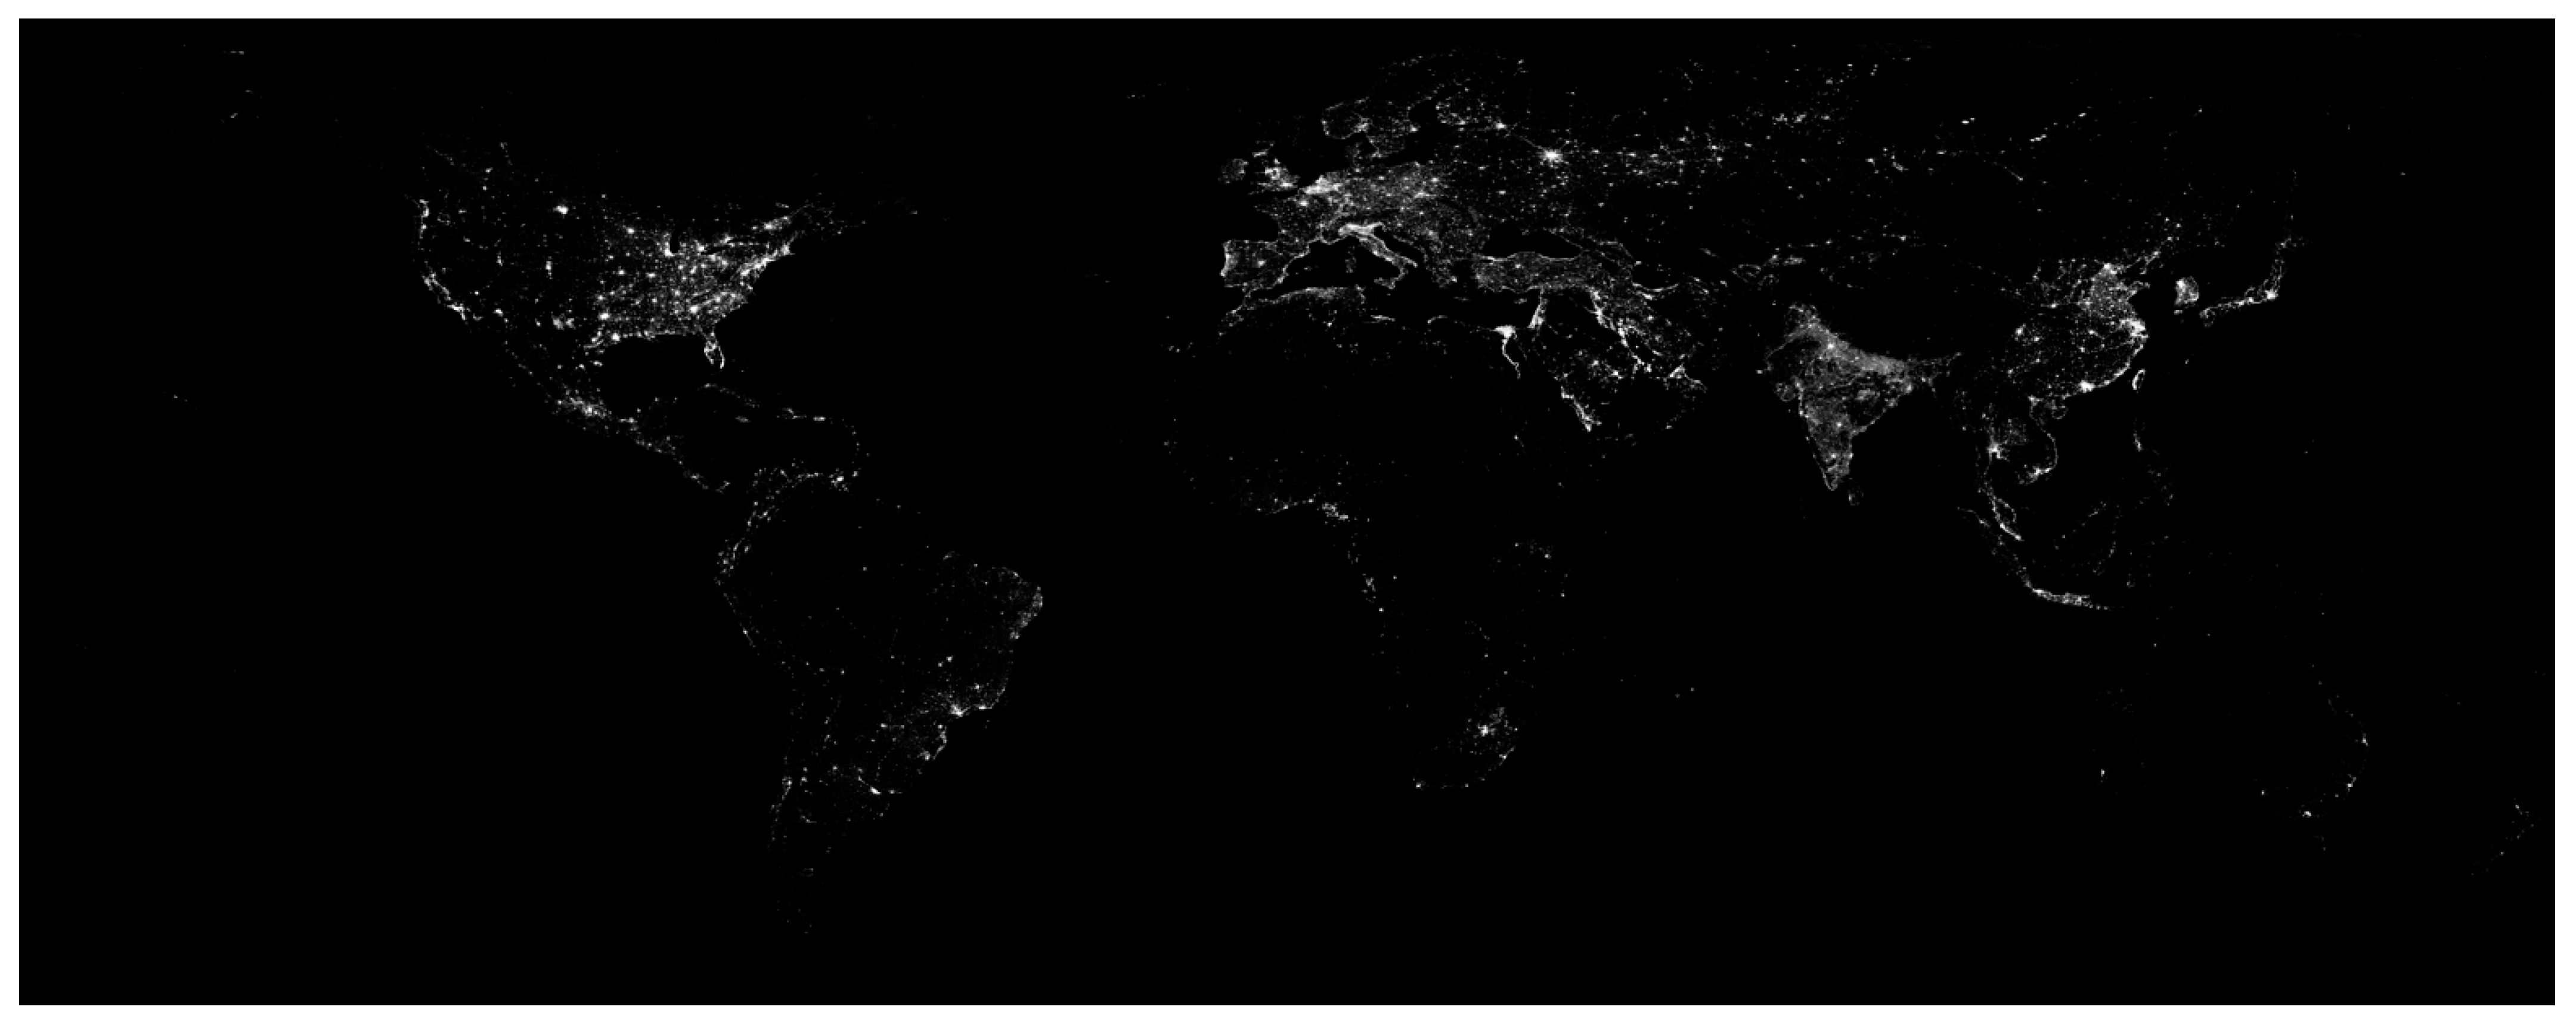
The processing resulted in eight annual global VIIRS nighttime light product sets spanning 2012–2019. Each product set includes the following:
Masked average radiance—with background, biomass burning, and aurora zeroed out.
Masked median radiance—with background, biomass burning, and aurora zeroed out. Shown in
Figure 10.
Average radiance—calculated from the monthly average radiances weighted based on the number of cloud-free coverages from each month.
Median radiance from the monthly averages.
Minimum radiance from the monthly averages.
Maximum radiance from the monthly averages.
Cloud-free observations.
Total number of observations free of sunlight and moonlight.
It should be noted that the V.2 average, median, minimum, and maximum radiances are from the monthly product sets and not the full temporal resolution pixel sets that are analyzed in the V.1 method.
3.2. Comparison with Previously Produced VNL
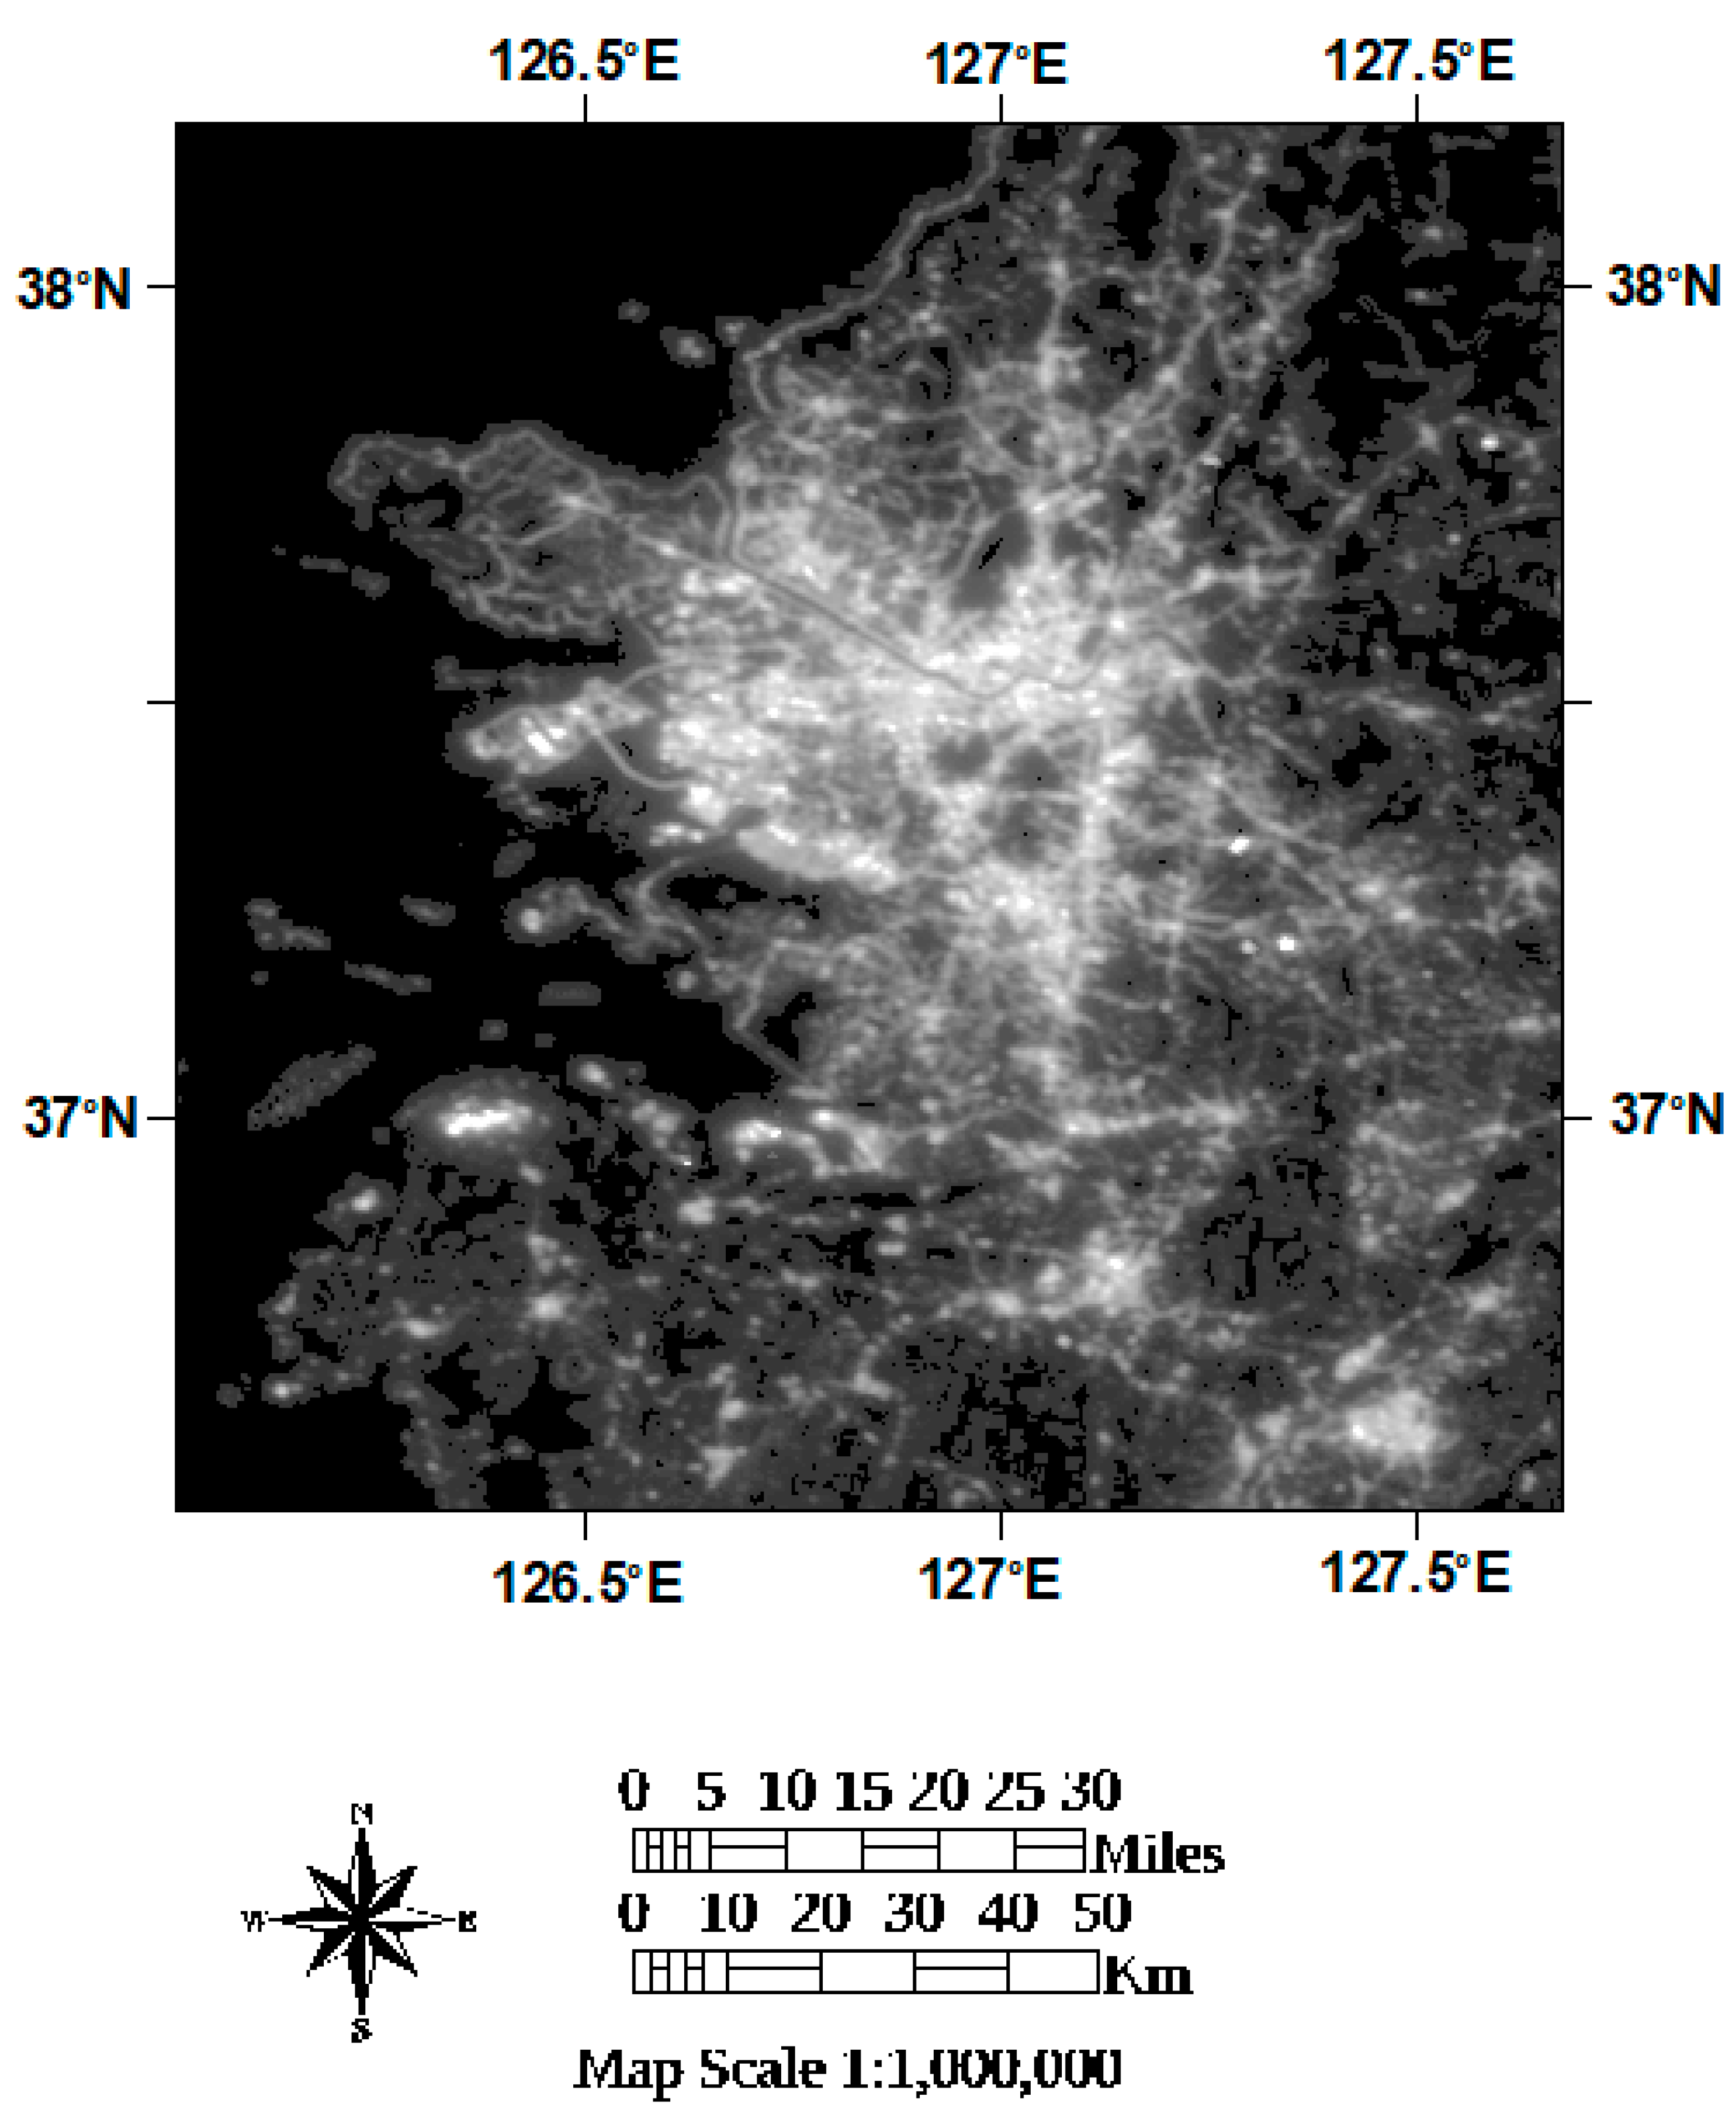
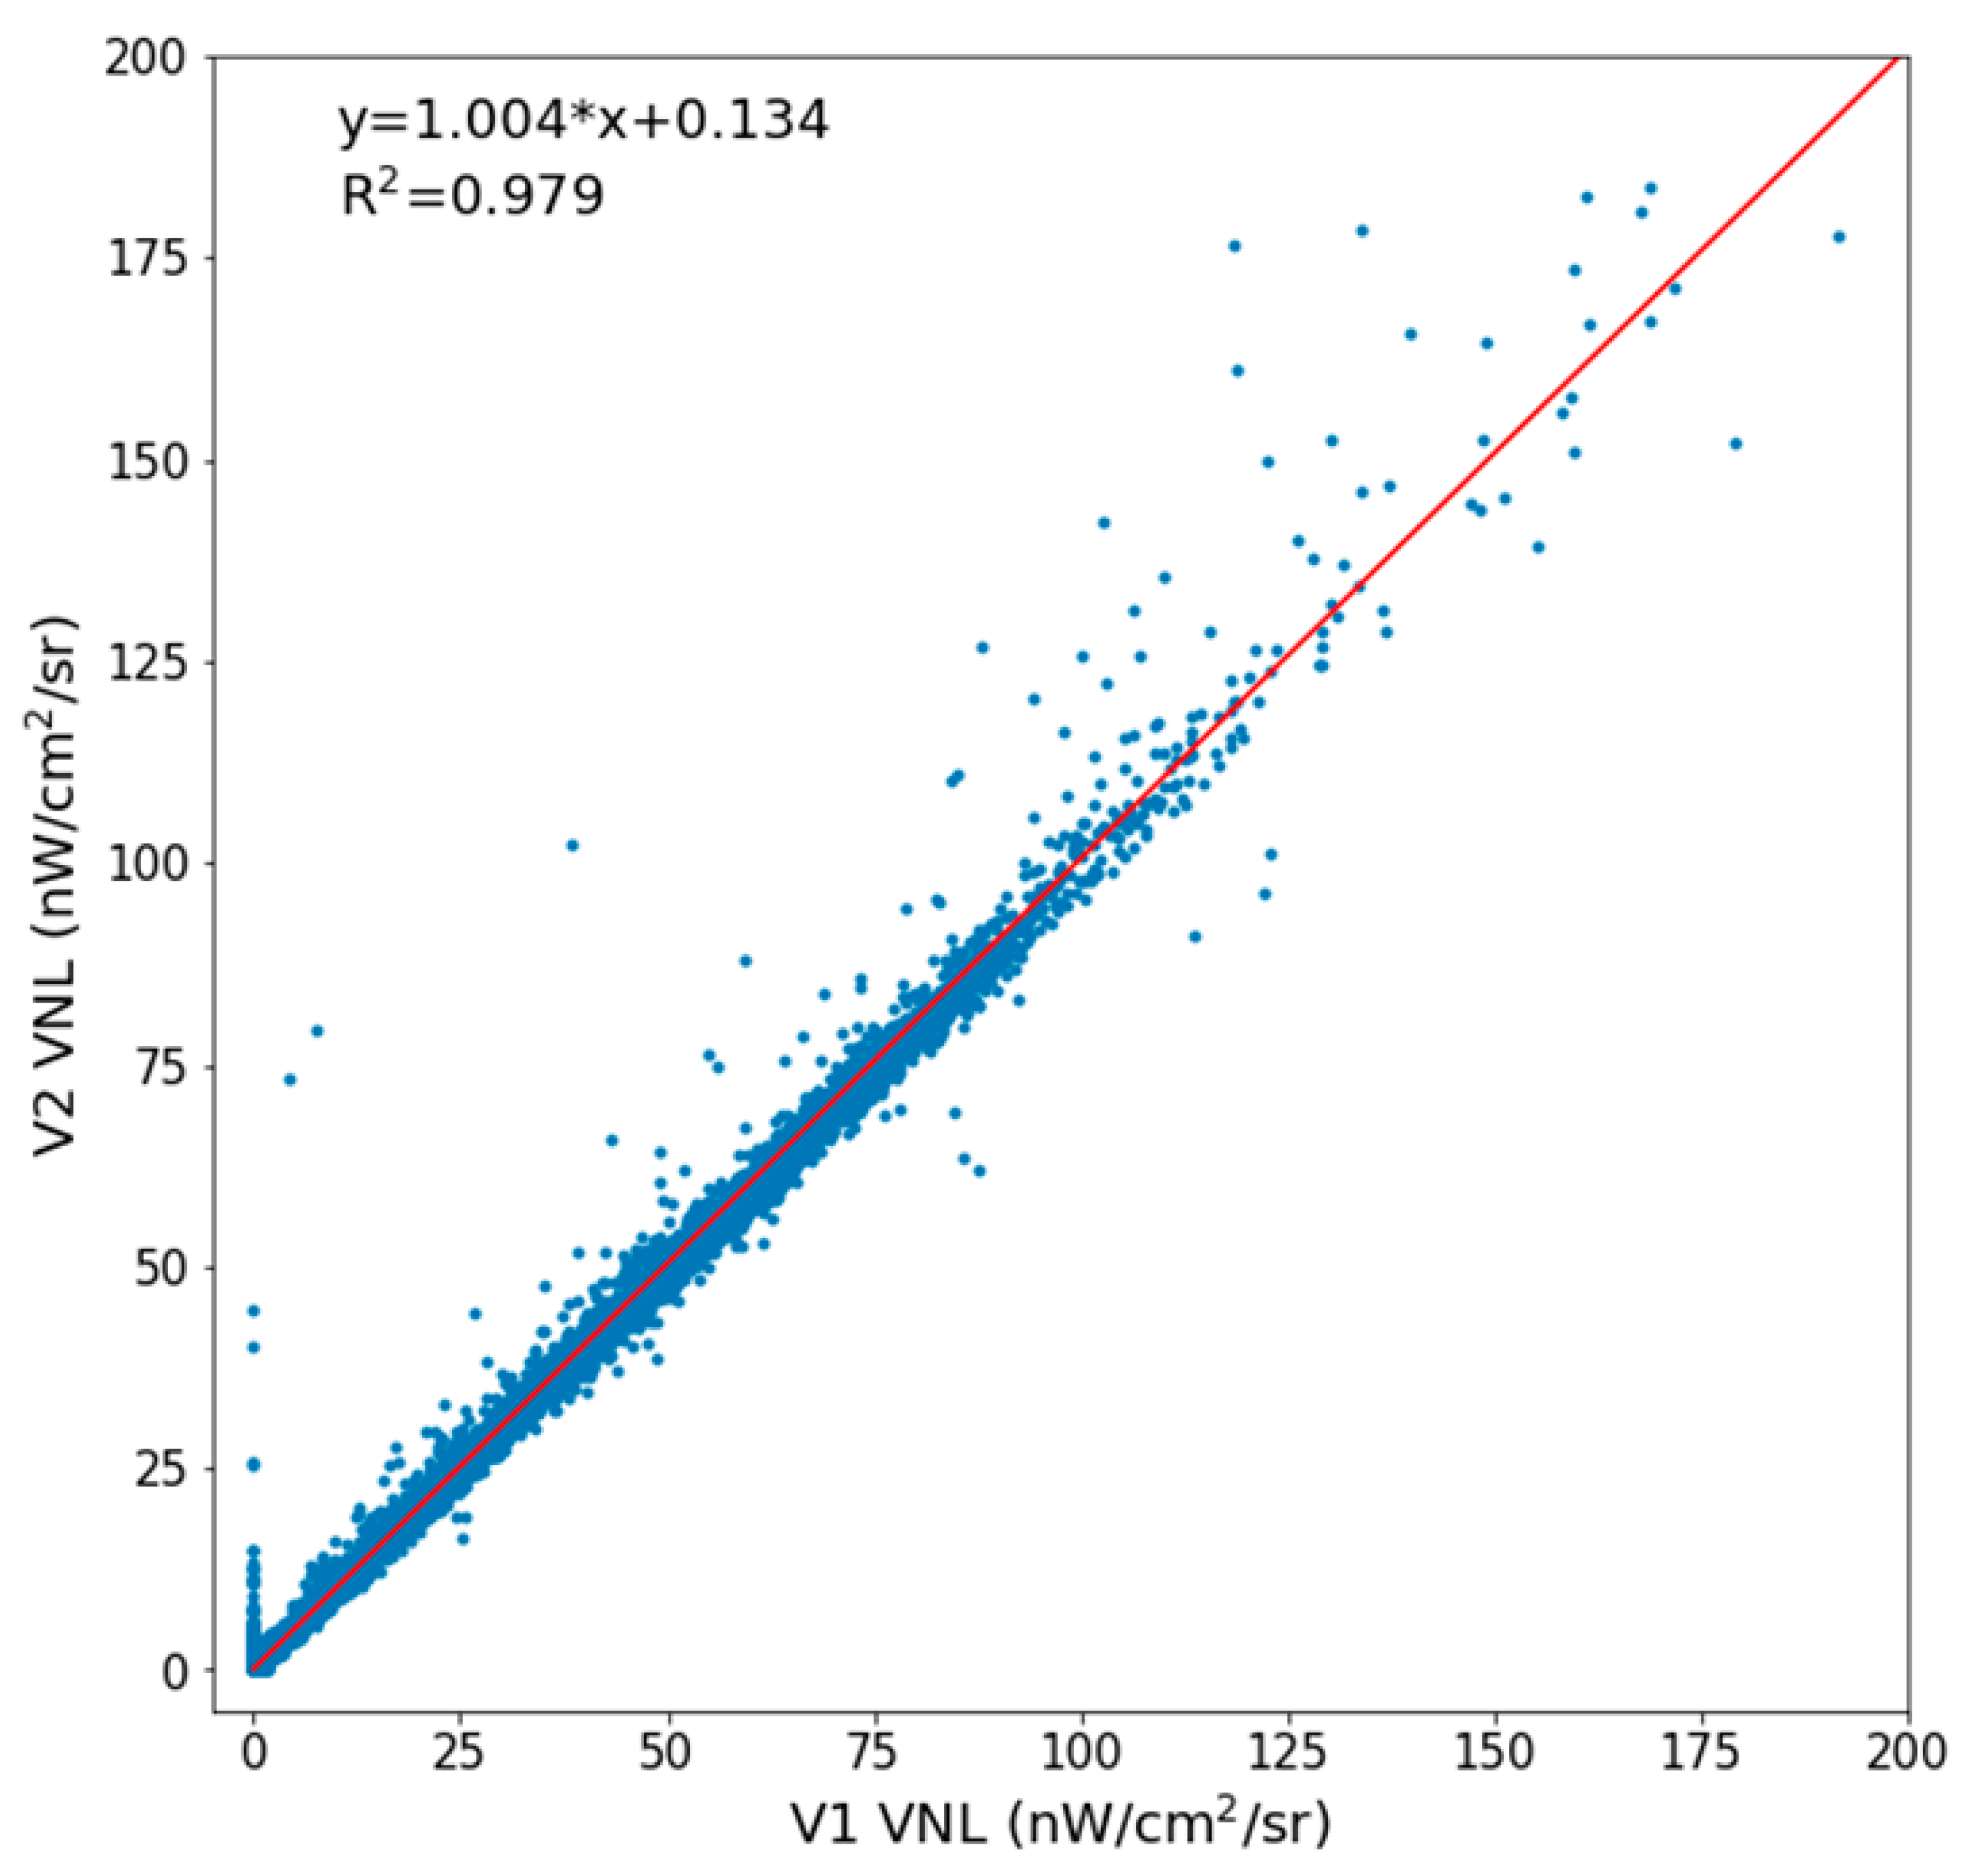
To compare the average radiance level and extent of lighting from the V.2 series and the V.1 set, we examine the two 2015 masked average radiance products in the Seoul region (
Figure 11). Outwardly, the two products look quite similar. The scattergram made from the two images (
Figure 12) shows a strong diagonal data cloud with a slope near 1, indicating that the radiance levels in the two are quite similar for the vast majority of grid cells, with only a small number of grid cells (0.59%) having departure of more than 3 nW/cm
2/sr from the diagonal.
Figure 12 also shows that the V.2 2015 product has dimly lit grid cells, with radiances under 15 nW/cm
2/sr, that were not detected in the V.1 product. These grid cells show up in the small vertical spike near the origin on
Figure 12. In total, V.2 has 10.48% more lit grid cells in the Seoul region (
Figure 11). In comparison, the V.1 product has only 0.016% of its lit grid cells undetected in the V.2 product.
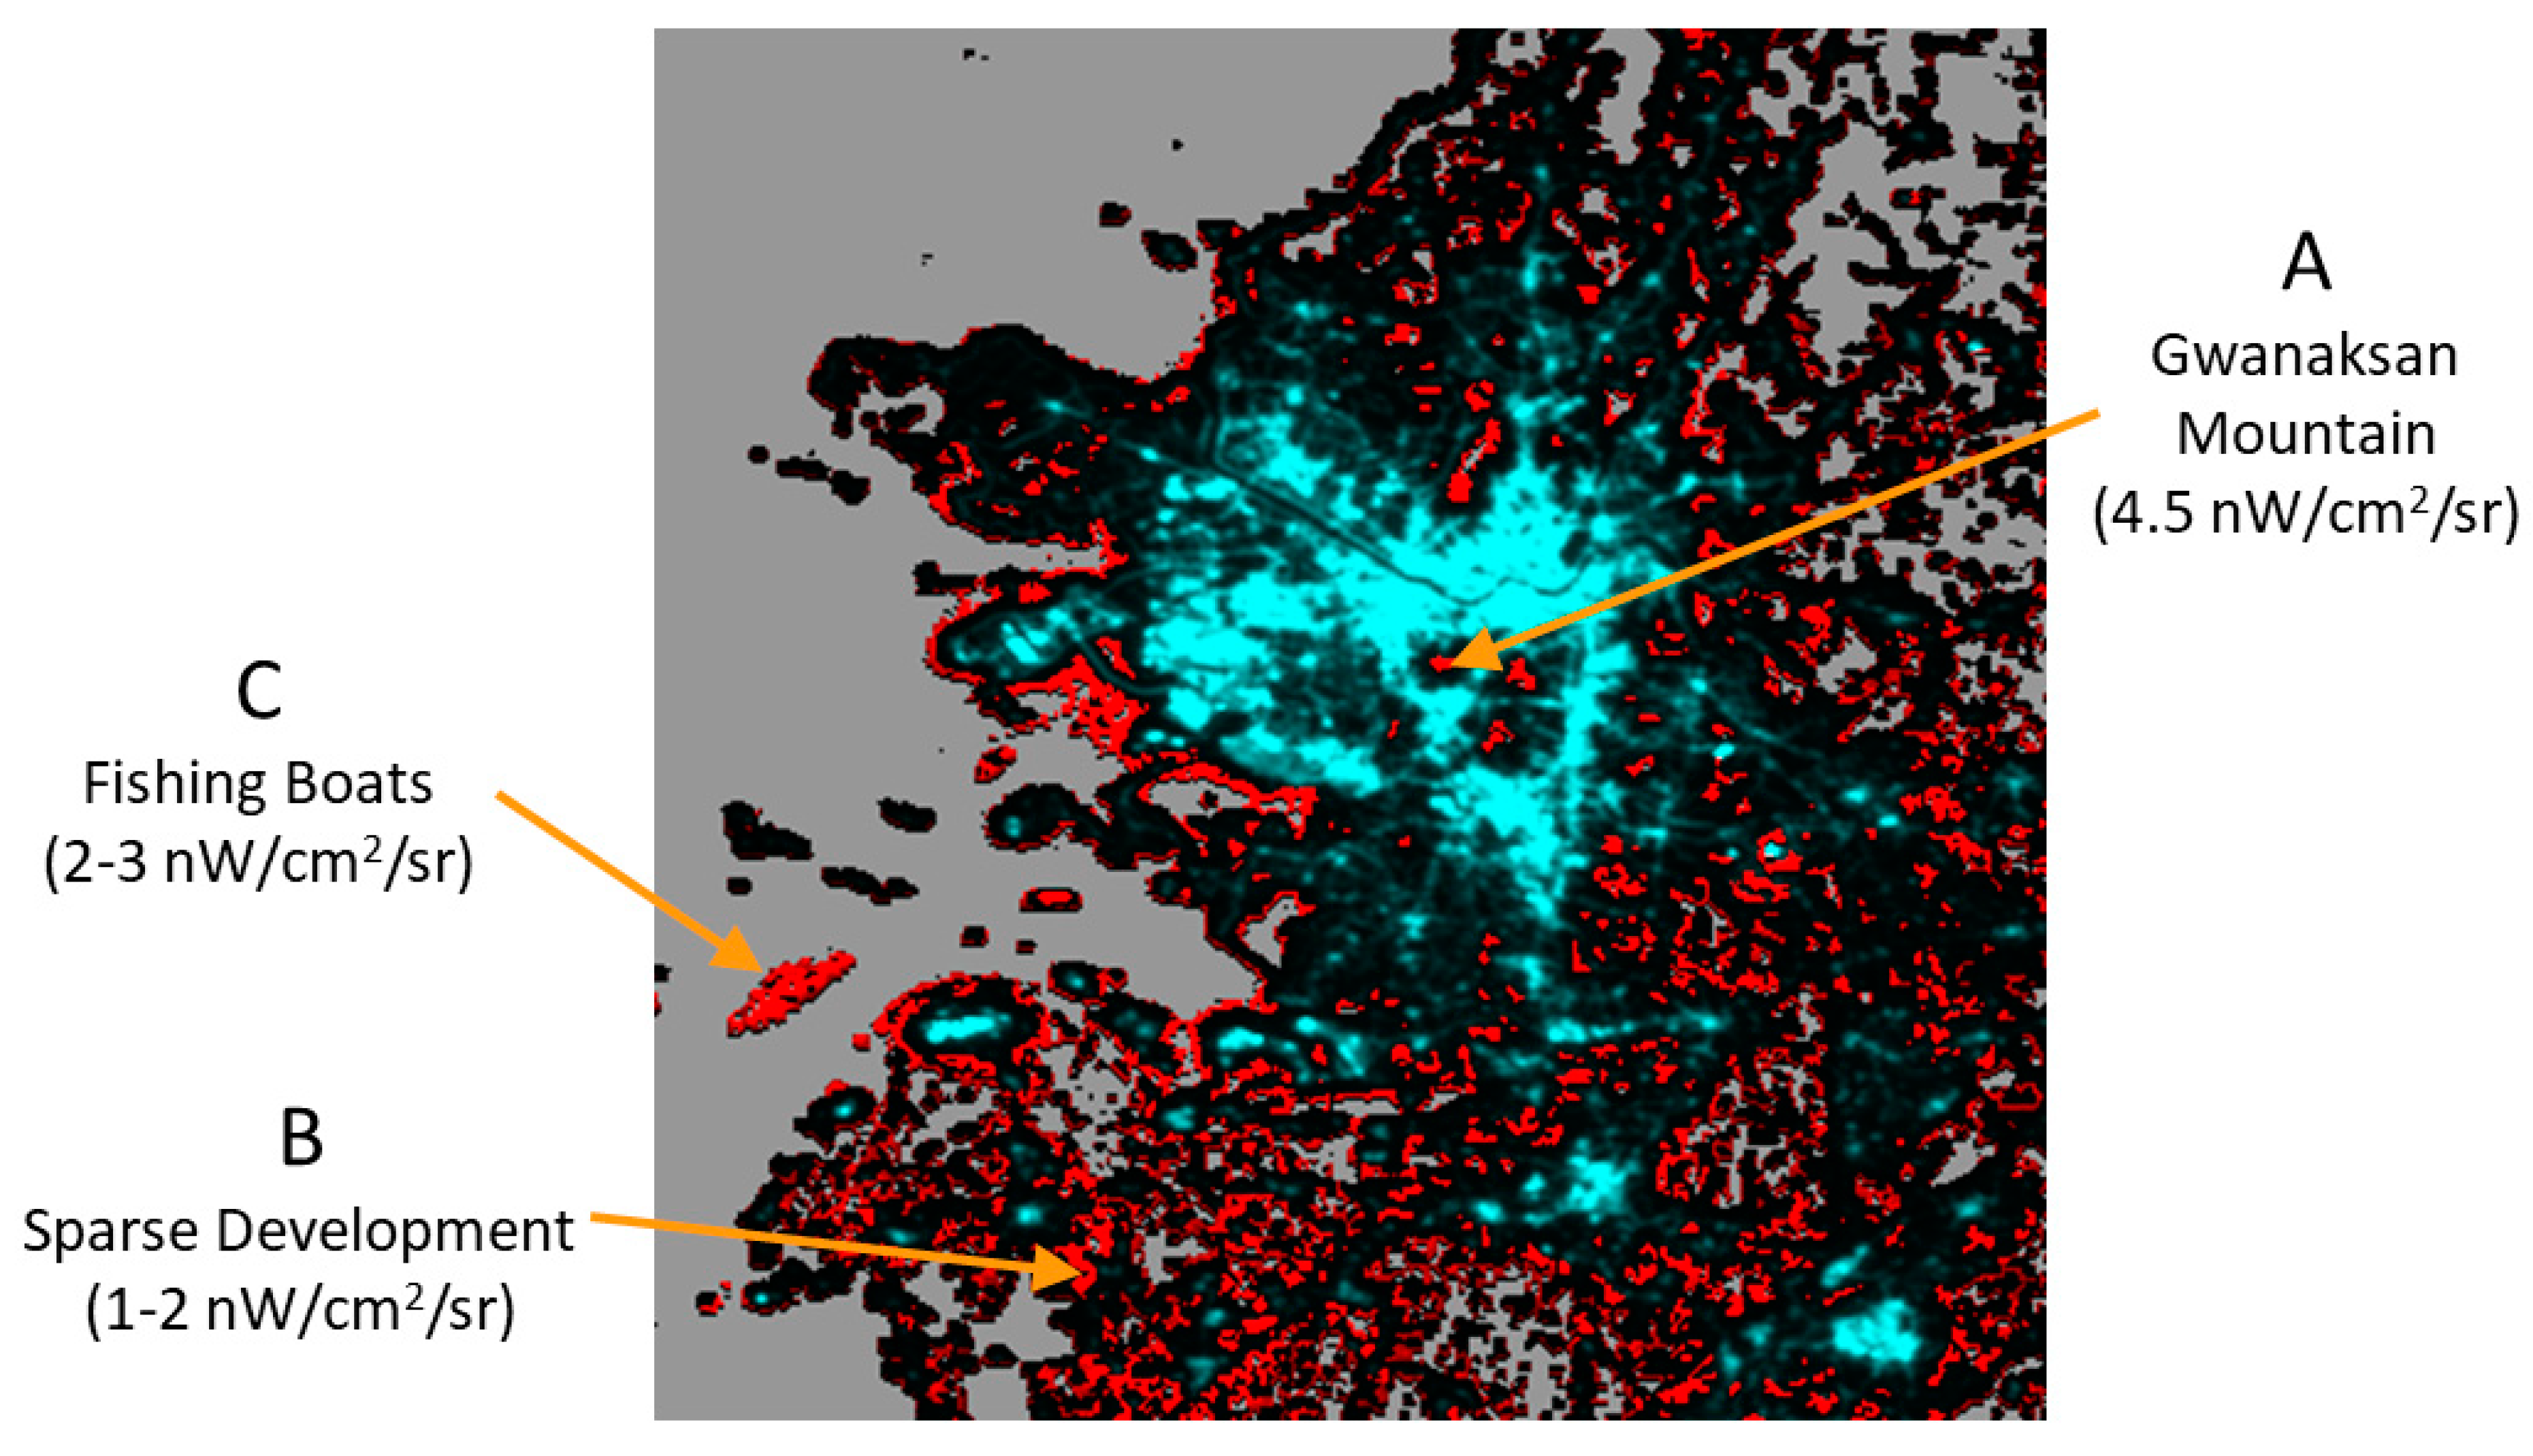
The next step is to examine the spatial distribution of the new lit grid cells, features present in only one of the two images.
Figure 13 shows a color composite of the new lit grid cells as red and the old product as cyan for the Seoul region from
Figure 11. The new lighting features present in the V.2 product include rims surrounding bright lights and areas of dim lighting missed in the V.1 2015 product. In effect, the detection limits of the V.2 product are lower than that of the V.1 2015 product.
4. Discussion
A new, consistently processed time series of annual global VIIRS nighttime lights has been produced from monthly cloud-free average radiance grids spanning 2012 to 2019. The new methodology is a modification of the original method based on nightly data [
2]. In both methods there is an initial filtering to remove sunlit, moonlit, and cloudy pixels, leading to rough composites that contain lights, fires, aurora, and background. In the original method, the rough annual composites are made from a full year of nightly DNB data. In the new method, the rough composites are made on monthly increments and then combined to form rough annual composites.
Both methods employ outlier removal to discard biomass burning pixels and isolate the background. In the V.1 method, the outlier removal is performed on histograms generated for each 15-arc second grid cell, with outliers clipped off from both the high and low radiance sides of the histogram. The discard of outlier pixels proceeds until the histogram’s standard deviation stabilizes. The new method uses the twelve-month median radiance to discard high and low radiance outliers, filtering out most fires and isolating the background.
Background areas are zeroed out in both methods using the data range (DR) calculated from 3 × 3 grid cells. In both methods, the DR threshold for background is indexed to cloud-cover levels, with higher DR thresholds in areas having low numbers of cloud-free coverages.
In the new method, particular attention is given to setting a single DR threshold for distinguishing lit grid cells from background for each 15-arc second grid cell. This is achieved by setting the DR threshold from a multiyear maximum median and a corresponding multiyear percent cloud-cover grid. The multiyear approach makes it possible to detect lighting present in each 15-arc second grid cell with a single DR threshold across all the years in the series.
5. Conclusions
Several years ago, EOG produced a pair of V.1 annual global VIIRS nighttime lights for 2015 and 2016 working from nightly data, with filtering to exclude sunlit, moonlit, clouds, biomass burning, aurora, and background. Due to funding constraints, the V.1 annual product generation from nightly DNB data went on hiatus. However, EOG was able to continue the monthly cloud-free average radiance product generation. The monthly DNB average radiance sets now span more than 100 months, from April 2012 through November 2020. This paper describes the methods developed to make a V.2 annual VIIRS nighttime lights series from the monthly products, with filtering to remove biomass burning, aurora, and background noise. The monthly DNB average radiance product generation includes the same upfront filtering to remove moonlit, sunlit, and cloudy pixels used in the V.1 annual product generation. For outlier removal, the V.2 series relies on the median radiance. Both V.1 and V.2 apply a threshold to the data range calculated from 3 × 3 blocks of grid cells to identify background arras, where no surface lighting could be detected. The background areas are zeroed out, a process we refer to as masking. This makes it possible to focus analyses on the lit grid cells and eliminates background from being included in change analyses.
In the V.1 method for production of annual VIIRS nighttime lights, each year was produced independently. Thus, the data range threshold for identifying lit grid cells could vary from year to year and had to be placed high enough to eliminate background noise from the outlier removed data range image. In the V.2 method the data range threshold for identifying lit grid cells is derived from a multiyear maximum data range and a multiyear percent cloud-free grid. This ensures that for each grid cell the same data range threshold is used in all the years. In addition, the DR threshold in the new method is lower, ranging from 0.2 to 1.0 as compared to 0.5 to 1.3 in the V.1 method. The lower DR threshold results in noise leakage in northern latitudes due to imperfections in the stray light correction and in some of the high frequency fire belts, such as Central Africa. The residual noise can be isolated and filtered out based on a low frequency of occurrence (one or two years out of eight) and low average radiance (less than 0.6 nW/cm2/sr). One of the consequences of the lower DR threshold is that detection is extended to dimmer areas of lighting. In some cases, the additional detections are from atmospheric scatter (glow) surrounding areas of bright lighting. In other cases, the additional areas of dim lighting detection appear to be areas of sparse development in the absence of glow from nearby bright lighting.
It should be noted that the masking of the background based on data range thresholding results in the loss of some dim lighting features. The classic examples are dimly lit roadways that can be seen in the V.1 outlier removed average radiance images or the V.2 annual median images prior to masking. Users interested in those dim features can find them in the outlier removed averages or medians prior to background masking.
The V.2 and V.1 versions of the 2015 VNL were quantitatively compared and found to be highly correlated to each other for the vast majority of grid cells. However, it was found that the V.2 VNL had dim lighting detections in grid cells assigned to background in the V.1 VNL. Because of the different processing steps and thresholds, it is probably best not to mix the two product sets for multitemporal analysis. The V.2 product users can have confidence that all the processing steps and thresholds are the same across the entire series from 2012 through 2019. This is an advance over the V.1 methods, where a grid cell’s DR threshold could vary from year to year. This is an important distinction when it comes to making a superior product set for the analysis of lighting changes.
The shapefiles used to indicate the sample set locations for defining the DR threshold curve, and that drawn on the residual noise present in the north and south Aurora zones can be found as
Supplementary Materials.
Author Contributions
Each of the authors were actively involved in the product generation or preparation of the paper. C.D.E. developed the concept for the V.2 time series, directed the new product development and wrote the initial draft of the paper. T.G. processed the V.1 monthly DNB product sets. M.Z. developed to processing scripts for making the V.2 time series. F.-C.H. maintains the VIIRS data ingest and database used to facilitate the monthly product generation. J.T. participated in the project conceptualization and editing of the paper. All authors have read and agreed to the published version of the manuscript.
Funding
This research was funded in part by the Rockefeller Foundation and the NOAA Joint Polar Satellite System (JPSS) proving ground program. The Rockefeller Foundation project name is “Electricity Growth and Use in Developing Economies (E-GUIDE) Center”, grant number POW004. The JPSS project is titled “Interpretation of Nighttime Light Changes during the COVID-19 Pandemic”, with Steven Miller as the principal investigator.
Data Availability Statement
Acknowledgments
The new VIIRS nighttime lights time series relied on the large efforts of NASA and NOAA in generating the long record of nightly VIIRS DNB data and making the data available on an open access basis. Kimberly Baugh, University of Colorado, was the lead developer of the original VIIRS annual nighttime lights for 2015 and 2016.
Conflicts of Interest
The authors declare no conflict of interest. The funders had no role in the design of the study; in the collection, analyses, or interpretation of data; in the writing of the manuscript, or in the decision to publish the results.
References
- Levin, N.; Kyba, C.C.; Zhang, Q.; de Miguel, A.S.; Román, M.O.; Li, X.; Portnov, B.A.; Molthan, A.L.; Jechow, A.; Miller, S.D.; et al. Remote sensing of night lights: A review and an outlook for the future. Remote Sens. Environ. 2020, 237, 111443. [Google Scholar] [CrossRef]
- Elvidge, C.D.; Baugh, K.; Zhizhin, M.; Hsu, F.C.; Ghosh, T. VIIRS night-time lights. Int. J. Remote Sens. 2017, 38, 5860–5879. [Google Scholar] [CrossRef]
- Elvidge, C.D.; Imhoff, M.L.; Baugh, K.E.; Hobson, V.R.; Nelson, I.; Safran, J.; Dietz, J.B.; Tuttle, B.T. Night-time lights of the world: 1994–1995. ISPRS J. Photogramm. Remote Sens. 2001, 56, 81–99. [Google Scholar] [CrossRef]
| Publisher’s Note: MDPI stays neutral with regard to jurisdictional claims in published maps and institutional affiliations. |
© 2021 by the authors. Licensee MDPI, Basel, Switzerland. This article is an open access article distributed under the terms and conditions of the Creative Commons Attribution (CC BY) license (http://creativecommons.org/licenses/by/4.0/).


 ,
, 


