Next Issue
Volume 13, March-2
Previous Issue
Volume 13, February-2
 
 
remotesensing-logo

Journal Browser

Journal Browser

Remote Sens., Volume 13, Issue 5 (March-1 2021) – 214 articles

Cover Story (view full-size image): 
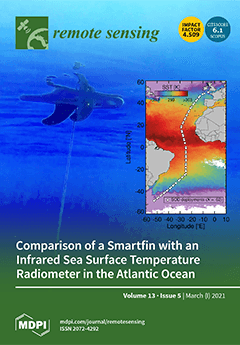
Sea surface temperature (SST) is a fundamental property of the ocean surface and one of the first ocean variables to be studied using satellites. Quantifying the accuracy and precision of satellite SST data requires comparing it with in-situ data. In nearshore coastal waters this is not well known, owing to a lack of in-situ data. Here, we compare a Smartfin, a surfboard fin designed to measure ocean temperature in the nearshore, with an infrared SST autonomous radiometer (ISAR) and an underway oceanographic temperature sensor (UOTS) on an expedition through the Atlantic Ocean. We found a mean absolute difference between Smartfin and UOTS of ­0.06 K and Smartfin and ISAR of 0.12 K. Differences were related to sampling depth and environmental variability. Results add confidence to the use of Smartfin as a tool for satellite validation. View this paper
  • Issues are regarded as officially published after their release is announced to the table of contents alert mailing list.
  • You may sign up for e-mail alerts to receive table of contents of newly released issues.
  • PDF is the official format for papers published in both, html and pdf forms. To view the papers in pdf format, click on the "PDF Full-text" link, and use the free Adobe Reader to open them.
Order results
Result details
Section
Select all
Export citation of selected articles as:
21 pages, 9309 KiB  
Article
Examining Relationships between Heat Requirement of Remotely Sensed Green-Up Date and Meteorological Indicators in the Hulun Buir Grassland
by Jian Guo, Xiuchun Yang, Fan Chen, Jianming Niu, Sha Luo, Min Zhang, Yunxiang Jin, Ge Shen, Ang Chen, Xiaoyu Xing, Dong Yang and Bin Xu
Remote Sens. 2021, 13(5), 1044; https://doi.org/10.3390/rs13051044 - 09 Mar 2021
Cited by 2 | Viewed by 2879
Abstract
The accumulation of heat and moderate precipitation are the primary factors that are used by grasslands to trigger a green-up date. The accumulated growing degree-days (AGDD) requirement over the preseason is an important indicator of the response of grassland spring phenology to climate [...] Read more.
The accumulation of heat and moderate precipitation are the primary factors that are used by grasslands to trigger a green-up date. The accumulated growing degree-days (AGDD) requirement over the preseason is an important indicator of the response of grassland spring phenology to climate change. This study adopted the Normalized Difference Phenology Index (NDPI), which derived from the Moderate Resolution Imaging Spectroradiometer (MODIS), to extract annual green-up dates in the Hulun Buir grassland in China between 2001–2015. Our analysis indicated that the range (standard deviation) and trend for the green-up date were DOY (day of year) 104 to DOY 144 (10.6 days) and −2.0 days per decade. Nine point two percent of the study area had significant (p < 0.05) changes in AGDD requirements. The partial correlations between the AGDD requirements and chilling days (67.04%, pixels proportion) were negative and significant (p < 0.05). The partial correlations between the AGDD requirement and precipitation (28.87%) were positive and significant (p < 0.05). Finally, the partial correlation between the AGDD requirement and insolation (97.65%) were positive and significant (p < 0.05). The results of this study could reveal the response of vegetation to climate warming and contribute to improving the phenological mechanism model of different grassland types in future research. Full article
(This article belongs to the Section Remote Sensing in Agriculture and Vegetation)
Show Figures

Figure 1

27 pages, 5648 KiB  
Article
Deriving Water Quality Parameters Using Sentinel-2 Imagery: A Case Study in the Sado Estuary, Portugal
by Giulia Sent, Beatriz Biguino, Luciane Favareto, Joana Cruz, Carolina Sá, Ana Inés Dogliotti, Carla Palma, Vanda Brotas and Ana C. Brito
Remote Sens. 2021, 13(5), 1043; https://doi.org/10.3390/rs13051043 - 09 Mar 2021
Cited by 38 | Viewed by 6373
Abstract
Monitoring water quality parameters and their ecological effects in transitional waters is usually performed through in situ sampling programs. These are expensive and time-consuming, and often do not represent the total area of interest. Remote sensing techniques offer enormous advantages by providing cost-effective [...] Read more.
Monitoring water quality parameters and their ecological effects in transitional waters is usually performed through in situ sampling programs. These are expensive and time-consuming, and often do not represent the total area of interest. Remote sensing techniques offer enormous advantages by providing cost-effective systematic observations of a large water system. This study evaluates the potential of water quality monitoring using Sentinel-2 observations for the period 2018–2020 for the Sado estuary (Portugal), through an algorithm intercomparison exercise and time-series analysis of different water quality parameters (i.e., colored dissolved organic matter (CDOM), chlorophyll-a (Chl-a), suspended particulate matter (SPM), and turbidity). Results suggest that Sentinel-2 is useful for monitoring these parameters in a highly dynamic system, however, with challenges in retrieving accurate data for some of the variables, such as Chl-a. Spatio-temporal variability results were consistent with historical data, presenting the highest values of CDOM, Chl-a, SPM and turbidity during Spring and Summer. This work is the first study providing annual and seasonal coverage with high spatial resolution (10 m) for the Sado estuary, being a key contribution for the definition of effective monitoring programs. Moreover, the potential of remote sensing methodologies for continuous water quality monitoring in transitional systems under the scope of the European Water Framework Directive is briefly discussed. Full article
Show Figures

Figure 1

22 pages, 5559 KiB  
Article
Advanced Dual-Satellite Method for Detection of Low Stratus and Fog near Japan at Dawn from FY-4A and Himawari-8
by Jung-Hyun Yang, Jung-Moon Yoo and Yong-Sang Choi
Remote Sens. 2021, 13(5), 1042; https://doi.org/10.3390/rs13051042 - 09 Mar 2021
Cited by 8 | Viewed by 2763
Abstract
The detection of low stratus and fog (LSF) at dawn remains limited because of their optical features and weak solar radiation. LSF could be better identified by simultaneous observations of two geostationary satellites from different viewing angles. The present study developed an advanced [...] Read more.
The detection of low stratus and fog (LSF) at dawn remains limited because of their optical features and weak solar radiation. LSF could be better identified by simultaneous observations of two geostationary satellites from different viewing angles. The present study developed an advanced dual-satellite method (DSM) using FY-4A and Himawari-8 for LSF detection at dawn in terms of probability indices. Optimal thresholds for identifying the LSF from the spectral tests in DSM were determined by the comparison with ground observations of fog and clear sky in/around Japan between April to November of 2018. Then the validation of these thresholds was carried out for the same months of 2019. The DSM essentially used two traditional single-satellite tests for daytime such as the 0.65-μm reflectance (R0.65), and the brightness temperature difference between 3.7 μm and 11 μm (BTD3.7-11); in addition to four more tests such as Himawari-8 R0.65 and BTD13.5-8.5, the dual-satellite stereoscopic difference in BTD3.7-11 (ΔBTD3.7-11), and that in the Normalized Difference Snow Index (ΔNDSI). The four were found to show very high skill scores (POD: 0.82 ± 0.04; FAR, 0.10 ± 0.04). The radiative transfer simulation supported optical characteristics of LSF in observations. The LSF probability indices (average POD: 0.83, FAR: 0.10) were constructed by a statistical combination of the four to derive the five-class probability values of LSF occurrence in a grid. The indices provided more details and useful results in LSF spatial distribution, compared to the single satellite observations (i.e., R0.65 and/or BTD3.7-11) of either LSF or no LSF. The present DSM could apply for remote sensing of environmental phenomena if the stereoscopic viewing angle between two satellites is appropriate. Full article
(This article belongs to the Section Atmospheric Remote Sensing)
Show Figures

Graphical abstract

15 pages, 5141 KiB  
Article
The Horizontal Distribution of Branch Biomass in European Beech: A Model Based on Measurements and TLS Based Proxies
by César Pérez-Cruzado, Christoph Kleinn, Paul Magdon, Juan Gabriel Álvarez-González, Steen Magnussen, Lutz Fehrmann and Nils Nölke
Remote Sens. 2021, 13(5), 1041; https://doi.org/10.3390/rs13051041 - 09 Mar 2021
Cited by 4 | Viewed by 2923
Abstract
Forest biomass is currently among the most important and most researched target variables in forest monitoring. The common approach of observing individual tree biomass in forest inventory is to assign the total tree biomass to the dimensionless point of the tree position. However, [...] Read more.
Forest biomass is currently among the most important and most researched target variables in forest monitoring. The common approach of observing individual tree biomass in forest inventory is to assign the total tree biomass to the dimensionless point of the tree position. However, the tree biomass, in particular in the crown, is horizontally distributed above the crown projection area. This horizontal distribution of individual tree biomass (HBD) has not attracted much attention—but if quantified, it can improve biomass estimation and help to better represent the spatial distribution of forest fuel. In this study, we derive a first empirical model of the branch HBD for individual trees of European beech (Fagus sylvatica L.). We destructively measured 23 beech trees to derive an empirical model for the branch HBD. We then applied Terrestrial Laser Scanning (TLS) to a subset of 17 trees to test a simple point cloud metric predicting the branch HBD. We observed similarities between a branch HBD and commonly applied taper functions, which inspired our HBD model formulations. The models performed well in representing the HBD both for the measured biomass, and the TLS-based metric. Our models may be used as first approximations to the HBD of individual trees—while our methodological approach may extend to trees of different sizes and species. Full article
(This article belongs to the Special Issue 3D Point Clouds in Forest Remote Sensing)
Show Figures

Graphical abstract

30 pages, 13124 KiB  
Article
Applying Close Range Non-Destructive Techniques for the Detection of Conservation Problems in Rock-Carved Cultural Heritage Sites
by William Frodella, Mikheil Elashvili, Daniele Spizzichino, Giovanni Gigli, Akaki Nadaraia, Giorgi Kirkitadze, Luka Adikashvili, Claudio Margottini, Nikoloz Antidze and Nicola Casagli
Remote Sens. 2021, 13(5), 1040; https://doi.org/10.3390/rs13051040 - 09 Mar 2021
Cited by 15 | Viewed by 4552
Abstract
Rock-carved cultural heritage sites are often developed in slopes formed by weak rocks, which due to their peculiar lithological, geotechnical, and morpho-structural features are characterized by excellent carvability, which at the same time makes them prone to weathering, deterioration, and slope instability issues. [...] Read more.
Rock-carved cultural heritage sites are often developed in slopes formed by weak rocks, which due to their peculiar lithological, geotechnical, and morpho-structural features are characterized by excellent carvability, which at the same time makes them prone to weathering, deterioration, and slope instability issues. In this context the use of advanced close-range nondestructive techniques, such as Infrared Thermography (IRT) and Unmanned Aerial vehicle-based Digital Photogrammetry (UAV-DP) can be profitably used for the rapid detection of conservation issues (e.g., open fractures, unstable ledges-niches, water seepage and moisture) that can lead to slope instability phenomena. These techniques, when combined with traditional methods (e.g., field surveys, laboratory analysis), can provide fundamental data (such as 3D maps of the kinematic mechanisms) to implement a site-specific and interdisciplinary approach for the sustainable protection and conservation of such fragile cultural heritage sites. In this paper some examples of conservation problems in several rupestrian sites characterized by different geological contexts, from the mountainous regions of Georgia to the ancient city of Petra in Jordan, are presented, with the aim of evaluating the potential of the proposed integrated approach. The final aim is to provide conservators, practitioners, and local authorities with a useful, versatile, and low-cost methodology, to be profitably used in the protection and conservation strategies of rock-carved sites. Full article
Show Figures

Graphical abstract

22 pages, 5217 KiB  
Article
Improvement of Spatial Interpolation of Precipitation Distribution Using Cokriging Incorporating Rain-Gauge and Satellite (SMOS) Soil Moisture Data
by Bogusław Usowicz, Jerzy Lipiec, Mateusz Łukowski and Jan Słomiński
Remote Sens. 2021, 13(5), 1039; https://doi.org/10.3390/rs13051039 - 09 Mar 2021
Cited by 12 | Viewed by 3382
Abstract
Precipitation data provide a crucial input for examining hydrological issues, including watershed management and mitigation of the effects of floods, drought, and landslides. However, they are collected frequently from the scarce and often insufficient network of ground-based rain-gauge stations to generate continuous precipitation [...] Read more.
Precipitation data provide a crucial input for examining hydrological issues, including watershed management and mitigation of the effects of floods, drought, and landslides. However, they are collected frequently from the scarce and often insufficient network of ground-based rain-gauge stations to generate continuous precipitation maps. Recently, precipitation maps derived from satellite data have not been sufficiently linked to ground-based rain gauges and satellite-derived soil moisture to improve the assessment of precipitation distribution using spatial statistics. Kriging methods are used to enhance the estimation of the spatial distribution of precipitations. The aim of this study was to assess two geostatistical methods, ordinary kriging (OK) and ordinary cokriging (OCK), and one deterministic method (i.e., inverse distance weighting (IDW)) for improved spatial interpolation of quarterly and monthly precipitations in Poland and near-border areas of the neighbouring countries (~325,000 or 800,000 km2). Quarterly precipitation data collected during a 5-year period (2010–2014) from 113–116 rain-gauge stations located in the study area were used. Additionally, monthly precipitations in the years 2014–2017 from over 400 rain-gauge stations located in Poland were used. The spatiotemporal data on soil moisture (SM) from the Soil Moisture and Ocean Salinity (SMOS) global satellite (launched in 2009) were used as an auxiliary variable in addition to precipitation for the OCK method. The predictive performance of the spatial distribution of precipitations was the best for OCK for all quarters, as indicated by the coefficient of determination (R2 = 0.944–0.992), and was less efficient (R2 = 0.039–0.634) for the OK and IDW methods. As for monthly precipitation, the performance of OCK was considerably higher than that of IDW and OK, similarly as with quarterly precipitation. The performance of all interpolation methods was better for monthly than for quarterly precipitations. The study indicates that SMOS data can be a valuable source of auxiliary data in the cokriging and/or other multivariate methods for better estimation of the spatial distribution of precipitations in various regions of the world. Full article
Show Figures

Graphical abstract

20 pages, 17023 KiB  
Article
The Effect of Forest Mask Quality in the Wall-to-Wall Estimation of Growing Stock Volume
by Elia Vangi, Giovanni D’Amico, Saverio Francini, Francesca Giannetti, Bruno Lasserre, Marco Marchetti, Ronald E. McRoberts and Gherardo Chirici
Remote Sens. 2021, 13(5), 1038; https://doi.org/10.3390/rs13051038 - 09 Mar 2021
Cited by 17 | Viewed by 3320
Abstract
Information about forest cover and its characteristics are essential in national and international forest inventories, monitoring programs, and reporting activities. Two of the most common forest variables needed to support sustainable forest management practices are forest cover area and growing stock volume (GSV [...] Read more.
Information about forest cover and its characteristics are essential in national and international forest inventories, monitoring programs, and reporting activities. Two of the most common forest variables needed to support sustainable forest management practices are forest cover area and growing stock volume (GSV m3 ha−1). Nowadays, national forest inventories (NFI) are complemented by wall-to-wall maps of forest variables which rely on models and auxiliary data. The spatially explicit prediction of GSV is useful for small-scale estimation by aggregating individual pixel predictions in a model-assisted framework. Spatial knowledge of the area of forest land is an essential prerequisite. This information is contained in a forest mask (FM). The number of FMs is increasing exponentially thanks to the wide availability of free auxiliary data, creating doubts about which is best-suited for specific purposes such as forest area and GSV estimation. We compared five FMs available for the entire area of Italy to examine their effects on the estimation of GSV and to clarify which product is best-suited for this purpose. The FMs considered were a mosaic of local forest maps produced by the Italian regional forest authorities; the FM produced from the Copernicus Land Monitoring System; the JAXA global FM; the hybrid global FM produced by Schepaschencko et al., and the FM estimated from the Corine Land Cover 2006. We used the five FMs to mask out non-forest pixels from a national wall-to-wall GSV map constructed using inventory and remotely sensed data. The accuracies of the FMs were first evaluated against an independent dataset of 1,202,818 NFI plots using four accuracy metrics. For each of the five masked GSV maps, the pixel-level predictions for the masked GSV map were used to calculate national and regional-level model-assisted estimates. The masked GSV maps were compared with respect to the coefficient of correlation (ρ) between the estimates of GSV they produced (both in terms of mean and total of GSV predictions within the national and regional boundaries) and the official NFI estimates. At the national and regional levels, the model-assisted GSV estimates based on the GSV map masked by the FM constructed as a mosaic of local forest maps were closest to the official NFI estimates with ρ = 0.986 and ρ = 0.972, for total and mean GSV, respectively. We found a negative correlation between the accuracies of the FMs and the differences between the model-assisted GSV estimates and the NFI estimate, demonstrating that the choice of the FM plays an important role in GSV estimation when using the model-assisted estimator. Full article
(This article belongs to the Section Forest Remote Sensing)
Show Figures

Graphical abstract

26 pages, 7972 KiB  
Article
A New Cycle-Slip Repair Method for Dual-Frequency BDS Against the Disturbances of Severe Ionospheric Variations and Pseudoranges with Large Errors
by Dehai Li, Yaming Dang, Yunbin Yuan and Jinzhong Mi
Remote Sens. 2021, 13(5), 1037; https://doi.org/10.3390/rs13051037 - 09 Mar 2021
Cited by 6 | Viewed by 1786
Abstract
Many Beidou navigation satellite system (BDS) receivers or boards provide dual-frequency measurements to conduct precise positioning and navigation for low-power consumption. Cycle-slip processing is a primary work to guarantee consistent, precise positioning with the phase data. However, the cycle-slip processing of BDS dual-frequency [...] Read more.
Many Beidou navigation satellite system (BDS) receivers or boards provide dual-frequency measurements to conduct precise positioning and navigation for low-power consumption. Cycle-slip processing is a primary work to guarantee consistent, precise positioning with the phase data. However, the cycle-slip processing of BDS dual-frequency phases still follows with those of existing GPS methods. For single-satellite data, cycle-slip detection (CSD) with the geometry-free phase (GF) is disturbed by severe ionospheric delay variations, while CSD or cycle-slip repair (CSR) with the Melbourne–Wubbena combination (MW) must face the risk of the tremendous disturbance from large pseudorange errors. To overcome the above limitations, a new cycle-slip repair method for BDS dual-frequency phases (BDCSR) is proposed: (1) An optimal model to minimize the variance of the cycle-slip calculation was established to the dual-frequency BDS, after correcting the ionospheric variation with a reasonable and feasible way. (2) Under the BDS dual-frequency condition, a discrimination function was built to exclude the adverse disturbance from the pseudorange errors on the CSR, according to the rankings of the absolute epoch-difference GFs calculated by the searched cycle-slip candidates after correcting the ionospheric variation. Subsequently, many compared CSR tests were implemented in conditions of low and medium elevations during strong geomagnetic storms. Comparisons from the results of different methods show that: (1) The variations of ionospheric delays are intolerable in the cycle-slip calculation during the geomagnetic storm, and the tremendous influence from the ionospheric variation should be corrected before calculating the cycle-slip combination with the BDS dual-frequency data. (2) Under the condition of real dual-frequency BDS data during the geomagnetic storm, the actual success rate of the conventional dual-frequency CSR (CDCSR) by employing the optimized combinations, but absenting from the discrimination function, is lower than that of BDCSR by about 2%; The actual success rate of the CSD with MW (MWCSD), is lower than that of BDCSR by about 2%. (3) After adding gross errors of 0.7 m to all real epoch-difference pseudoranges epoch-by-epoch, results of CDCSR and MWCSD showed many errors. However, BDCSR achieved a higher actual success rate than those of CDCSR and MWCSD, about 43% and 16%, respectively, and better performance of refraining the disturbance of large pseudorange error on the cycle-slip determination was achieved in the BDCSR methodology. Full article
(This article belongs to the Special Issue Positioning and Navigation in Remote Sensing)
Show Figures

Graphical abstract

20 pages, 4222 KiB  
Article
UAV-Based Estimate of Snow Cover Dynamics: Optimizing Semi-Arid Forest Structure for Snow Persistence
by Adam Belmonte, Temuulen Sankey, Joel Biederman, John Bradford, Scott Goetz and Thomas Kolb
Remote Sens. 2021, 13(5), 1036; https://doi.org/10.3390/rs13051036 - 09 Mar 2021
Cited by 10 | Viewed by 3457
Abstract
Seasonal snow cover in the dry forests of the American West provides essential water resources to both human and natural systems. The structure of trees and their arrangement across the landscape are important drivers of snow cover distribution across these forests, varying widely [...] Read more.
Seasonal snow cover in the dry forests of the American West provides essential water resources to both human and natural systems. The structure of trees and their arrangement across the landscape are important drivers of snow cover distribution across these forests, varying widely in both space and time. We used unmanned aerial vehicle (UAV) multispectral imagery and Structure-from-Motion (SfM) models to quantify rapidly melting snow cover dynamics and examine the effects of forest structure shading on persistent snow cover in a recently thinned ponderosa pine forest. Using repeat UAV multispectral imagery (n = 11 dates) across the 76 ha forest, we first developed a rapid and effective method for identifying persistent snow cover with 90.2% overall accuracy. The SfM model correctly identified 98% (n = 1280) of the trees, when compared with terrestrial laser scanner validation data. Using the SfM-derived forest structure variables, we then found that canopy shading associated with the vertical and horizontal metrics was a significant driver of persistent snow cover patches (R2 = 0.70). The results indicate that UAV image-derived forest structure metrics can be used to accurately predict snow patch size and persistence. Our results provide insight into the importance of forest structure, specifically canopy shading, in the amount and distribution of persistent seasonal snow cover in a typical dry forest environment. An operational understanding of forest structure effects on snow cover will help drive forest management that can target snow cover dynamics in addition to forest health. Full article
(This article belongs to the Special Issue Ecohydrological Remote Sensing)
Show Figures

Figure 1

20 pages, 5290 KiB  
Article
Remote Soil Moisture Measurement from Drone-Borne Reflectance Spectroscopy: Applications to Hydroperiod Measurement in Desert Playas
by Joseph S. Levy and Jessica T. E. Johnson
Remote Sens. 2021, 13(5), 1035; https://doi.org/10.3390/rs13051035 - 09 Mar 2021
Cited by 7 | Viewed by 3611
Abstract
The extent, timing, and magnitude of soil moisture in wetlands (the hydropattern) is a primary physical control on biogeochemical processes in desert environments. However, determining playa hydropatterns is challenged by the remoteness of desert basin sites and by the difficulty in determining soil [...] Read more.
The extent, timing, and magnitude of soil moisture in wetlands (the hydropattern) is a primary physical control on biogeochemical processes in desert environments. However, determining playa hydropatterns is challenged by the remoteness of desert basin sites and by the difficulty in determining soil moisture from remotely sensed data at fine spatial and temporal scales (hundreds of meters to kilometers, and hours to days). Therefore, we developed a new, reflectance-based soil moisture index (continuum-removed water index, or CRWI) that can be determined via hyperspectral imaging from drone-borne platforms. We compared its efficacy at remotely determining soil moisture content to existing hyperspectral and multispectral soil moisture indices. CRWI varies linearly with in situ soil moisture content (R2 = 0.89, p < 0.001) and is comparatively insensitive to soil clay content (R2 = 0.4, p = 0.01), soil salinity (R2 = 0.82, p < 0.001), and soil grain size distribution (R2 = 0.67, p < 0.001). CRWI is negatively correlated with clay content, indicating it is not sensitive to hydrated mineral absorption features. CRWI has stronger correlation with surface soil moisture than other hyperspectral and multispectral indices (R2 = 0.69, p < 0.001 for WISOIL at this site). Drone-borne reflectance measurements allow monitoring of soil moisture conditions at the Alvord Desert playa test site over hectare-scale soil plots at measurement cadences of minutes to hours. CRWI measurements can be used to determine surface soil moisture at a range of desert sites to inform management decisions and to better reveal ecosystem processes in water-limited environments. Full article
(This article belongs to the Special Issue Application of Hyperspectral Data in Ecological Environment)
Show Figures

Figure 1

18 pages, 2878 KiB  
Article
Dynamics of Vibrio cholerae in a Typical Tropical Lake and Estuarine System: Potential of Remote Sensing for Risk Mapping
by Abdulaziz Anas, Kiran Krishna, Syamkumar Vijayakumar, Grinson George, Nandini Menon, Gemma Kulk, Jasmin Chekidhenkuzhiyil, Angelo Ciambelli, Hridya Kuttiyilmemuriyil Vikraman, Balu Tharakan, Abdul Jaleel Koovapurath Useph, Elizabeth Goult, Jithin Vengalil, Trevor Platt and Shubha Sathyendranath
Remote Sens. 2021, 13(5), 1034; https://doi.org/10.3390/rs13051034 - 09 Mar 2021
Cited by 16 | Viewed by 4431
Abstract
Vibrio cholerae, the bacterium responsible for the disease cholera, is a naturally-occurring bacterium, commonly found in many natural tropical water bodies. In the context of the U.N. Sustainable Development Goals (SDG) targets on health (Goal 3), water quality (Goal 6), life under [...] Read more.
Vibrio cholerae, the bacterium responsible for the disease cholera, is a naturally-occurring bacterium, commonly found in many natural tropical water bodies. In the context of the U.N. Sustainable Development Goals (SDG) targets on health (Goal 3), water quality (Goal 6), life under water (Goal 14), and clean water and sanitation (Goal 6), which aim to “ensure availability and sustainable management of water and sanitation for all”, we investigated the environmental reservoirs of V. cholerae in Vembanad Lake, the largest lake in Kerala (India), where cholera is endemic. The response of environmental reservoirs of V. cholerae to variability in essential climate variables may play a pivotal role in determining the quality of natural water resources, and whether they might be safe for human consumption or not. The hydrodynamics of Vembanad Lake, and the man-made barrier that divides the lake, resulted in spatial and temporal variability in salinity (1–32 psu) and temperature (23 to 36 °C). The higher ends of this salinity and temperature ranges fall outside the preferred growth conditions for V. cholerae reported in the literature. The bacteria were associated with filtered water as well as with phyto- and zooplankton in the lake. Their association with benthic organisms and sediments was poor to nil. The prevalence of high laminarinase and chitinase enzyme expression (more than 50 µgmL−1 min−1) among V. cholerae could underlie their high association with phyto- and zooplankton. Furthermore, the diversity in the phytoplankton community in the lake, with dominance of genera such as Skeletonema sp., Microcystis sp., Aulacoseira sp., and Anabaena sp., which changed with location and season, and associated changes in the zooplankton community, could also have affected the dynamics of the bacteria in the lake. The probability of presence or absence of V. cholerae could be expressed as a function of chlorophyll concentration in the water, which suggests that risk maps for the entire lake can be generated using satellite-derived chlorophyll data. In situ observations and satellite-based extrapolations suggest that the risks from environmental V. cholerae in the lake can be quite high (with probability in the range of 0.5 to 1) everywhere in the lake, but higher values are encountered more frequently in the southern part of the lake. Remote sensing has an important role to play in meeting SDG goals related to health, water quality and life under water, as demonstrated in this example related to cholera. Full article
Show Figures

Graphical abstract

18 pages, 1723 KiB  
Article
Evaluating Multi-Sensors Spectral and Spatial Resolutions for Tree Species Diversity Prediction
by Enoch Gyamfi-Ampadu, Michael Gebreslasie and Alma Mendoza-Ponce
Remote Sens. 2021, 13(5), 1033; https://doi.org/10.3390/rs13051033 - 09 Mar 2021
Cited by 9 | Viewed by 3448
Abstract
Forests contribute significantly to terrestrial biodiversity conservation. Monitoring of tree species diversity is vital due to climate change factors. Remote sensing imagery is a means of data collection for predicting diversity of tree species. Since various sensors have different spectral and spatial resolutions, [...] Read more.
Forests contribute significantly to terrestrial biodiversity conservation. Monitoring of tree species diversity is vital due to climate change factors. Remote sensing imagery is a means of data collection for predicting diversity of tree species. Since various sensors have different spectral and spatial resolutions, it is worth comparing them to ascertain which could influence the accuracy of prediction of tree species diversity. Hence, this study evaluated the influence of the spectral and spatial resolutions of PlanetScope, RapidEye, Sentinel 2 and Landsat 8 images in diversity prediction based on the Shannon diversity index (H′), Simpson diversity Index (D1) and Species richness (S). The Random Forest regression was applied for the prediction using the spectral bands of the sensors as variables. The Sentinel 2 was the best image, producing the highest coefficient of determination (R2) under both the Shannon Index (R2 = 0.926) and the Species richness (R2 = 0.923). Both the Sentinel and RapidEye produced comparable higher accuracy for the Simpson Index (R2 = 0.917 and R2 = 0.915, respectively). The PlanetScope was the second-accurate for the Species richness (R2 = 0.90), whiles the Landsat 8 was the least accurate for the three diversity indices. The outcomes of this study suggest that both the spectral and spatial resolutions influence prediction accuracies of satellite imagery. Full article
(This article belongs to the Section Forest Remote Sensing)
Show Figures

Graphical abstract

23 pages, 23408 KiB  
Article
The Decrease in Lake Numbers and Areas in Central Asia Investigated Using a Landsat-Derived Water Dataset
by Xianghong Che, Min Feng, Qing Sun, Joseph O. Sexton, Saurabh Channan and Jiping Liu
Remote Sens. 2021, 13(5), 1032; https://doi.org/10.3390/rs13051032 - 09 Mar 2021
Cited by 14 | Viewed by 3384
Abstract
Although Central Asia has a strong continental climate with a constant moisture deficit and low relative humidity, it is covered by thousands of lakes that are critical to the sustainability of ecosystems and human welfare in the region. Vulnerability to climate change and [...] Read more.
Although Central Asia has a strong continental climate with a constant moisture deficit and low relative humidity, it is covered by thousands of lakes that are critical to the sustainability of ecosystems and human welfare in the region. Vulnerability to climate change and anthropogenic activities have contributed to dramatic inter-annual and seasonal changes of the lakes. In this study, we explored the high spatio–temporal dynamics of the lakes of Central Asia using the terraPulse™ monthly Landsat-derived surface water extent dataset from 2000 to 2015 and the HydroLAKES dataset. The results identified 9493 lakes and significant linear decreasing trends were identified for both the number (rate: −85 lakes/year, R2: 0.69) and area (rate: −1314.1 km2/year, R2: 0.84) of the lakes in Central Asia between 2000 and 2015. The decrease rate in lake area accounted for 1.41% of the total lake area. About 75% of the investigated lakes (7142 lakes), mainly located in the Kazakh steppe (especially in the north) and the Badghyz and Karabil semi-desert terrestrial ecological zones, experienced a decrease in the water area. Lakes with increasing water area were mainly distributed in the Northern Tibetan Plateau–Kunlun Mountains alpine desert and Qaidam Basin semi-desert zones in the east-south corner of Central Asia. The possible driving factors of lake decreases in Central Asia were explored for the Aral Sea and Tengiz Lake on yearly and monthly time scales. The Aral Sea showed the greatest decrease in the summer months because of increased evaporation and massive irrigation, while the largest decrease for Tengiz Lake was observed in early spring and was linked to decreasing snowmelt. Full article
Show Figures

Graphical abstract

18 pages, 753 KiB  
Article
Towards a Topographically-Accurate Reflection Point Prediction Algorithm for Operational Spaceborne GNSS Reflectometry—Development and Verification
by Lucinda King, Martin Unwin, Jonathan Rawlinson, Raffaella Guida and Craig Underwood
Remote Sens. 2021, 13(5), 1031; https://doi.org/10.3390/rs13051031 - 09 Mar 2021
Cited by 4 | Viewed by 3007
Abstract
GNSS Reflectometry (GNSS-R), a method of remote sensing using the reflections from satellite navigation systems, was initially envisaged for ocean wind speed sensing. In recent times there has been significant interest in the use of GNSS-R for sensing land parameters such as soil [...] Read more.
GNSS Reflectometry (GNSS-R), a method of remote sensing using the reflections from satellite navigation systems, was initially envisaged for ocean wind speed sensing. In recent times there has been significant interest in the use of GNSS-R for sensing land parameters such as soil moisture, which has been identified as an Essential Climate Variable (ECV). Monitoring objectives for ECVs set by the Global Climate Observing System (GCOS) organisation include a reduction in data gaps from spaceborne sources. GNSS-R can be implemented on small, relatively cheap platforms and can enable the launch of constellations, thus reducing such data gaps in these important datasets. However in order to realise operational land sensing with GNSS-R, adaptations are required to existing instrumentation. Spaceborne GNSS-R requires the reflection points to be predicted in advance, and for land sensing this means the effect of topography must be considered. This paper presents an algorithm for on-board prediction of reflection points over the land, allowing generation of DDMs on-board as well as compression and calibration. The algorithm is tested using real satellite data from TechDemoSat-1 in a software receiver with on-board constraints being considered. Three different resolutions of Digital Elevation Model are compared. The algorithm is shown to perform better against the operational requirements of sensing land parameters than existing methods and is ready to proceed to flight testing. Full article
(This article belongs to the Special Issue Applications of GNSS Reflectometry for Earth Observation)
Show Figures

Figure 1

16 pages, 4027 KiB  
Article
Sentinel-1 Polarimetry to Map Apple Orchard Damage after a Storm
by Samuele De Petris, Filippo Sarvia, Michele Gullino, Eufemia Tarantino and Enrico Borgogno-Mondino
Remote Sens. 2021, 13(5), 1030; https://doi.org/10.3390/rs13051030 - 09 Mar 2021
Cited by 16 | Viewed by 3364
Abstract
Climate change increases extreme whether events such as floods, hailstorms, or storms, which can affect agriculture, causing damages and economic loss within the agro-food sector. Optical remote sensing data have been successfully used in damage detections. Cloud conditions limit their potential, especially while [...] Read more.
Climate change increases extreme whether events such as floods, hailstorms, or storms, which can affect agriculture, causing damages and economic loss within the agro-food sector. Optical remote sensing data have been successfully used in damage detections. Cloud conditions limit their potential, especially while monitoring floods or storms that are usually related to cloudy situations. Conversely, data from the Polarimetric Synthetic Aperture Radar (PolSAR) are operational in all-weather conditions and are sensitive to the geometrical properties of crops. Apple orchards play a key role in the Italian agriculture sector, presenting a cultivation system that is very sensitive to high-wind events. In this work, the H-α-A polarimetric decomposition technique was adopted to map damaged apple orchards with reference to a stormy event that had occurred in the study area (NW Italy) on 12 August 2020. The results showed that damaged orchards have higher H (entropy) and α (alpha angle) values compared with undamaged ones taken as reference (Mann–Whitney one-tailed test U = 14,514, p < 0.001; U = 16604, p < 0.001 for H and α, respectively). By contrast, A (anisotropy) values were significantly lower for damaged orchards (Mann–Whitney one-tailed test U = 8616, p < 0.001). Based on this evidence, the authors generated a map of potentially storm-damaged orchards, assigning a probability value to each of them. This map is intended to support local funding restoration policies by insurance companies and local administrations. Full article
(This article belongs to the Special Issue Remote Sensing in Agriculture: State-of-the-Art)
Show Figures

Graphical abstract

11 pages, 2123 KiB  
Technical Note
The Temporal Variation of Optical Depth in the Candidate Landing Area of China’s Mars Mission (Tianwen-1)
by Zhencheng Tang, Jianjun Liu, Xing Wang, Xin Ren, Wei Yan and Wangli Chen
Remote Sens. 2021, 13(5), 1029; https://doi.org/10.3390/rs13051029 - 09 Mar 2021
Cited by 3 | Viewed by 2394
Abstract
The atmospheric dust is an important factor in the evolution of the Martian climate and has a major impact on the scientific exploration of the Martian lander or rover and its payload. This paper used remote sensing images to calculate atmospheric optical depth [...] Read more.
The atmospheric dust is an important factor in the evolution of the Martian climate and has a major impact on the scientific exploration of the Martian lander or rover and its payload. This paper used remote sensing images to calculate atmospheric optical depth that characterizes the spatial distribution of the atmospheric dust of Mars. The optical depth calculated by the images of the High Resolution Imaging Science Experiment (HiRISE) in the inspection area of the Spirit rover had a similar temporal variation to the optical depth directly measured by the Spirit rover from the sunlight decay. We also used the HiRISE images to acquire the seasonal variation of optical depths in the candidate landing area of China’s Mars Mission (Tianwen-1). The results have shown that the seasonal pattern of the optical depth in the candidate landing area is consistent with the dust storm sequences in this area. After Tianwen-1 enters the orbit around Mars, the images collected by the Moderate Resolution Imaging Camera (MoRIC), and the High Resolution Imaging Camera (HiRIC) can be used to study the atmospheric optical depth in the candidate landing area, providing reference for the safe landing and operation of the lander and rover. Full article
(This article belongs to the Special Issue Planetary Remote Sensing: Chang’E-4/5 and Mars Applications)
Show Figures

Graphical abstract

4 pages, 3528 KiB  
Reply
Reply to Comment on “Comparison of Cloud Cover Detection Algorithms on Sentinel–2 Images of the Amazon Tropical Forest”
by Alber Hamersson Sanchez, Michelle Cristina A. Picoli, Gilberto Camara, Pedro R. Andrade, Michel Eustaquio D. Chaves, Sarah Lechler, Anderson R. Soares, Rennan F. B. Marujo, Rolf Ezequiel O. Simões, Karine R. Ferreira and Gilberto R. Queiroz
Remote Sens. 2021, 13(5), 1028; https://doi.org/10.3390/rs13051028 - 09 Mar 2021
Viewed by 1984
Abstract
In their comments about our paper, the authors remark on two issues regarding our results relating to the MACCS-ATCOR Joint Algorithm (MAJA). The first relates to the sub-optimal performance of this algorithm under the conditions of our tests, while the second corresponds to [...] Read more.
In their comments about our paper, the authors remark on two issues regarding our results relating to the MACCS-ATCOR Joint Algorithm (MAJA). The first relates to the sub-optimal performance of this algorithm under the conditions of our tests, while the second corresponds to an error in our interpretation of MAJA’s bit mask. To answer the first issue, we acknowledge MAJA’s capacity to improve its performance as the number of images increases with time. However, in our paper, we used the images we had available at the time we wrote our paper. Regarding the second issue, we misread the MAJA’s bit mask and mistakenly labelled shadows as clouds. We regret our error and here we present the updated tables and images. We corrected our estimation and, consequently, there is an increment in MAJA’s accuracy in the detection of clouds and cloud shadows. However, these increments are not enough to change the conclusion of our original paper. Full article
Show Figures

Figure 1

15 pages, 4355 KiB  
Technical Note
Measuring the Service Capacity of Public Facilities Based on a Dynamic Voronoi Diagram
by Haifu Cui, Liang Wu, Sheng Hu and Rujuan Lu
Remote Sens. 2021, 13(5), 1027; https://doi.org/10.3390/rs13051027 - 09 Mar 2021
Cited by 5 | Viewed by 2681
Abstract
The supply–demand relationship of urban public service facilities is the key to measuring a city’s service level and quality, and a balanced supply–demand relationship is an important indicator that reflects the optimal allocation of resources. To address the problem presented by the unbalanced [...] Read more.
The supply–demand relationship of urban public service facilities is the key to measuring a city’s service level and quality, and a balanced supply–demand relationship is an important indicator that reflects the optimal allocation of resources. To address the problem presented by the unbalanced distribution of educational resources, this paper proposes a dynamic Voronoi diagram algorithm with conditional constraints (CCDV). The CCDV method uses the Voronoi diagram to divide the plane so that the distance from any position in each polygon to the point is shorter than the distance from the polygon to the other points. In addition, it can overcome the disadvantage presented by the Voronoi diagram’s inability to use the nonspatial attributes of the point set to precisely constrain the boundary range; the CCDV method can dynamically plan and allocate according to the school’s capacity and the number of students in the coverage area to maintain a balance between supply and demand and achieve the optimal distribution effect. By taking the division of school districts in the Bao’an District, Shenzhen, as an example, the method is used to obtain a school district that matches the capacity of each school, and the relative error between supply and demand fluctuates only from −0.1~0.15. According to the spatial distribution relationship between schools and residential areas in the division results, the schools in the Bao’an District currently have an unbalanced distribution in some areas. A comparison with the existing school district division results shows that the school district division method proposed in this paper has advantages. Through a comprehensive analysis of the accessibility of public facilities and of the balance of supply and demand, it is shown that school districts based on the CCDV method can provide a reference for the optimal layout of schools and school districts. Full article
Show Figures

Graphical abstract

16 pages, 17744 KiB  
Article
Meridional Changes in Satellite Chlorophyll and Fluorescence in Optically-Complex Coastal Waters of Northern Patagonia
by Sebastián I. Vásquez, María Belén de la Torre, Gonzalo S. Saldías and Aldo Montecinos
Remote Sens. 2021, 13(5), 1026; https://doi.org/10.3390/rs13051026 - 09 Mar 2021
Cited by 4 | Viewed by 2494
Abstract
Northern Patagonia is one of the largest estuarine systems worldwide. It is characterized by complex geography, including islands, peninsulas, channels, and fjords. Here, the Inner Sea of Chiloé (ISC) is the largest estuarine system extending about 230 km in the meridional direction. Phytoplankton’s [...] Read more.
Northern Patagonia is one of the largest estuarine systems worldwide. It is characterized by complex geography, including islands, peninsulas, channels, and fjords. Here, the Inner Sea of Chiloé (ISC) is the largest estuarine system extending about 230 km in the meridional direction. Phytoplankton’s long-term dynamics and the main physical drivers of their variability are not well understood yet. Time-space fluctuations of Chlorophyll-a (Chl-a) and Chlorophyll fluorescence (nFLH) within the ISC and their association with meteorological and oceanographic processes were analyzed using high resolution (1000 m) satellite data (2003–2019). Our results revealed a meridional Chl-a and nFLH gradient along the ISC, with higher concentrations north of the Desertores islands where the topography promotes a semi-closed system with estuarine characteristics yearlong. Satellite Chl-a and nFLH were characterized by asynchronous seasonal cycles (nFLH peaks in fall) that differed from the southern ISC where the maximum Chl-a and nFLH occurs in spring-summer. The adjacent coastal ocean influences the southern ISC, and thus, the Chl-a and nFLH variability correlated well with the seasonal variation of meridional winds. The northern ISC was clearly influenced by river discharges, which can bias the Chl-a retrievals, decoupling the annual cycles of Chl-a and nFLH. In situ data from a buoy in Seno Reloncaví reaffirmed this bias in satellite Chl-a and a higher correlation with nFLH, by which the construction of a local Chl-a algorithm for northern Patagonia is essential. Full article
(This article belongs to the Special Issue Remote Sensing of Inland Waters and Their Catchments)
Show Figures

Graphical abstract

23 pages, 2945 KiB  
Article
Bio-Inspired Hybridization of Artificial Neural Networks: An Application for Mapping the Spatial Distribution of Soil Texture Fractions
by Ruhollah Taghizadeh-Mehrjardi, Mostafa Emadi, Ali Cherati, Brandon Heung, Amir Mosavi and Thomas Scholten
Remote Sens. 2021, 13(5), 1025; https://doi.org/10.3390/rs13051025 - 08 Mar 2021
Cited by 36 | Viewed by 3620
Abstract
Soil texture and particle size fractions (PSFs) are a critical characteristic of soil that influences most physical, chemical, and biological properties of soil; furthermore, reliable spatial predictions of PSFs are crucial for agro-ecological modeling. Here, series of hybridized artificial neural network (ANN) models [...] Read more.
Soil texture and particle size fractions (PSFs) are a critical characteristic of soil that influences most physical, chemical, and biological properties of soil; furthermore, reliable spatial predictions of PSFs are crucial for agro-ecological modeling. Here, series of hybridized artificial neural network (ANN) models with bio-inspired metaheuristic optimization algorithms such as a genetic algorithm (GA-ANN), particle swarm optimization (PSO-ANN), bat (BAT-ANN), and monarch butterfly optimization (MBO-ANN) algorithms, were built for predicting PSFs for the Mazandaran Province of northern Iran. In total, 1595 composite surficial soil samples were collected, and 64 environmental covariates derived from terrain, climatic, remotely sensed, and categorical datasets were used as predictors. Models were tested using a repeated 10-fold nested cross-validation approach. The results indicate that the hybridized ANN methods were far superior to the reference approach using ANN with a backpropagation training algorithm (BP-ANN). Furthermore, the MBO-ANN approach was consistently determined to be the best approach and yielded the lowest error and uncertainty. The MBO-ANN model improved the predictions in terms of RMSE by 20% for clay, 10% for silt, and 24% for sand when compared to BP-ANN. The physiographical units, soil types, geology maps, rainfall, and temperature were the most important predictors of PSFs, followed by the terrain and remotely sensed data. This study demonstrates the effectiveness of bio-inspired algorithms for improving ANN models. The outputs of this study will support and inform sustainable soil management practices, agro-ecological modeling, and hydrological modeling for the Mazandaran Province of Iran. Full article
(This article belongs to the Special Issue Remote Sensing for Soil Mapping and Monitoring)
Show Figures

Graphical abstract

23 pages, 7492 KiB  
Article
Bottom Detection from Backscatter Data of Conventional Side Scan Sonars through 1D-UNet
by Jun Yan, Junxia Meng and Jianhu Zhao
Remote Sens. 2021, 13(5), 1024; https://doi.org/10.3390/rs13051024 - 08 Mar 2021
Cited by 18 | Viewed by 3468
Abstract
As widely applicated in many underwater research fields, conventional side-scan sonars require the sonar height to be at the seabed for geocoding seabed images. However, many interference factors, including compensation with unknown gains, suspended matters, etc., would bring difficulties in bottom detection. Existing [...] Read more.
As widely applicated in many underwater research fields, conventional side-scan sonars require the sonar height to be at the seabed for geocoding seabed images. However, many interference factors, including compensation with unknown gains, suspended matters, etc., would bring difficulties in bottom detection. Existing methods need manual parameter setups or to use postprocessing methods, which limits automatic and real-time processing in complex situations. To solve this problem, a one-dimensional U-Net (1D-UNet) model for sea bottom detection of side-scan data and the bottom detection and tracking method based on 1D-UNet are proposed in this work. First, the basic theory of sonar bottom detection and the interference factors is introduced, which indicates that deep learning of the bottom is a feasible solution. Then, a 1D-UNet model for detecting the sea bottom position from the side-scan backscatter strength sequences is proposed, and the structure and implementation of this model are illustrated in detail. Finally, the bottom detection and tracking algorithms of a single ping and continuous pings are presented on the basis of the proposed model. The measured side-scan sonar data in Meizhou Bay and Bayuquan District were selected in the experiments to verify the model and methods. The 1D-UNet model was first trained and applied with the side-scan data in Meizhou Bay. The training and validation accuracies were 99.92% and 99.77%, respectively, and the sea bottom detection accuracy of the training survey line was 99.88%. The 1D-UNet model showed good robustness to the interference factors of bottom detection and fully real-time performance in comparison with other methods. Moreover, the trained 1D-UNet model is used to process the data in the Bayuquan District for proving model generality. The proposed 1D-UNet model for bottom detection has been proven effective for side-scan sonar data and also has great potentials in wider applications on other types of sonars. Full article
(This article belongs to the Special Issue Deep Learning for Radar and Sonar Image Processing)
Show Figures

Graphical abstract

3 pages, 4851 KiB  
Comment
Comment on “Comparison of Cloud Cover Detection Algorithms on Sentinel-2 Images of the Amazon Tropical Forest”
by Olivier Hagolle and Jerome Colin
Remote Sens. 2021, 13(5), 1023; https://doi.org/10.3390/rs13051023 - 08 Mar 2021
Cited by 3 | Viewed by 2210
Abstract
In their recent study, Sanchez et al. compared various cloud detection methods applied to Sentinel-2, specifically on images acquired over the Amazonian region, known for its frequent cloud cover. Comparison of cloud screening methods for optical satellite images is a complex task, which [...] Read more.
In their recent study, Sanchez et al. compared various cloud detection methods applied to Sentinel-2, specifically on images acquired over the Amazonian region, known for its frequent cloud cover. Comparison of cloud screening methods for optical satellite images is a complex task, which must take several parameters into account, such as the definition of a cloud, which can differ according to the methods, the different coding of the cloud and shadow masks, the possible dilation of masks, and also the way the method must be used to perform in nominal conditions. We found that the otherwise serious and useful comparison of cloud masks by Sanchez et al. is not fair to the real performances of MAJA cloud detection, for two reasons: (i) two thirds of the images used in the comparison were acquired before the launch of Sentinel-2B satellite, when the revisit of the Sentinel-2 mission was 20 days instead of five days for the nominal conditions of the mission, and (ii) there is an error in the understanding of how MAJA cloud masks are coded which also probably artificially degraded the results of MAJA as compared to the other methods. Full article
Show Figures

Figure 1

18 pages, 2839 KiB  
Article
Accuracy Analysis of GNSS Hourly Ultra-Rapid Orbit and Clock Products from SHAO AC of iGMAS
by Qinming Chen, Shuli Song and Weili Zhou
Remote Sens. 2021, 13(5), 1022; https://doi.org/10.3390/rs13051022 - 08 Mar 2021
Cited by 17 | Viewed by 2287
Abstract
With the development of the global navigation satellite system(GNSS), the hourly ultra-rapid products of GNSS are attracting more attention due to their low latency and high accuracy. A new strategy and method was applied by the Shanghai Astronomical Observatory (SHAO) Analysis Center (AC) [...] Read more.
With the development of the global navigation satellite system(GNSS), the hourly ultra-rapid products of GNSS are attracting more attention due to their low latency and high accuracy. A new strategy and method was applied by the Shanghai Astronomical Observatory (SHAO) Analysis Center (AC) of the international GNSS Monitoring and Assessment Service (iGMAS) for generating 6-hourly and 1-hourly GNSS products, which mainly include the American Global Positioning System (GPS), the Russian Global’naya Navigatsionnaya Sputnikova Sistema (GLONASS), the European Union’s Galileo, and the Chinese BeiDou navigation satellite system (BDS). The 6-hourly and 1-hourly GNSS orbit and clock ultra-rapid products included a 24-h observation session which is determined by 24-h observation data from global tracking stations, and a 24-h prediction session which is predicted from the observation session. The accuracy of the 1-hourly orbit product improved about 1%, 31%, 13%, 11%, 23%, and 9% for the observation session and 18%, 43%, 45%, 34%, 53%, and 15% for the prediction session of GPS, GLONASS, Galileo, BDS Medium Earth Orbit (MEO), Inclined Geosynchronous Orbit (IGSO), and GEO orbit, when compared with reference products with high accuracy from the International GNSS service (IGS).The precision of the 1-hourly clock products can also be seen better than the 6-hourly clock products. The accuracy and precision of the 6-hourly and 1-hourly orbit and clock verify the availability and reliability of the hourly ultra-rapid products, which can be used for real-time or near-real-time applications, and show encouraging prospects. Full article
Show Figures

Figure 1

18 pages, 8636 KiB  
Article
Evaluation of Three Different Machine Learning Methods for Object-Based Artificial Terrace Mapping—A Case Study of the Loess Plateau, China
by Hu Ding, Jiaming Na, Shangjing Jiang, Jie Zhu, Kai Liu, Yingchun Fu and Fayuan Li
Remote Sens. 2021, 13(5), 1021; https://doi.org/10.3390/rs13051021 - 08 Mar 2021
Cited by 18 | Viewed by 2697
Abstract
Artificial terraces are of great importance for agricultural production and soil and water conservation. Automatic high-accuracy mapping of artificial terraces is the basis of monitoring and related studies. Previous research achieved artificial terrace mapping based on high-resolution digital elevation models (DEMs) or imagery. [...] Read more.
Artificial terraces are of great importance for agricultural production and soil and water conservation. Automatic high-accuracy mapping of artificial terraces is the basis of monitoring and related studies. Previous research achieved artificial terrace mapping based on high-resolution digital elevation models (DEMs) or imagery. As a result of the importance of the contextual information for terrace mapping, object-based image analysis (OBIA) combined with machine learning (ML) technologies are widely used. However, the selection of an appropriate classifier is of great importance for the terrace mapping task. In this study, the performance of an integrated framework using OBIA and ML for terrace mapping was tested. A catchment, Zhifanggou, in the Loess Plateau, China, was used as the study area. First, optimized image segmentation was conducted. Then, features from the DEMs and imagery were extracted, and the correlations between the features were analyzed and ranked for classification. Finally, three different commonly-used ML classifiers, namely, extreme gradient boosting (XGBoost), random forest (RF), and k-nearest neighbor (KNN), were used for terrace mapping. The comparison with the ground truth, as delineated by field survey, indicated that random forest performed best, with a 95.60% overall accuracy (followed by 94.16% and 92.33% for XGBoost and KNN, respectively). The influence of class imbalance and feature selection is discussed. This work provides a credible framework for mapping artificial terraces. Full article
Show Figures

Graphical abstract

28 pages, 86897 KiB  
Article
Hydrocarbon Pollution Detection and Mapping Based on the Combination of Various Hyperspectral Imaging Processing Tools
by Véronique Achard, Pierre-Yves Foucher and Dominique Dubucq
Remote Sens. 2021, 13(5), 1020; https://doi.org/10.3390/rs13051020 - 08 Mar 2021
Cited by 10 | Viewed by 3922
Abstract
Oil extraction and transportation may lead to small or large scale accidental spills, whether at sea or on land. Detecting these spills is a major problem that can be addressed by means of hyperspectral images and specific processing methods. In this work, several [...] Read more.
Oil extraction and transportation may lead to small or large scale accidental spills, whether at sea or on land. Detecting these spills is a major problem that can be addressed by means of hyperspectral images and specific processing methods. In this work, several cases of onshore oil spills are studied. First, a controlled experiment was carried out: four boxes containing soil or sand mixed with crude oil or gasoil were deployed on the ONERA site near Fauga, France, and were overflown by HySpex hyperspectral cameras. Owing to this controlled experiment, different detection strategies were developed and tested, with a particular focus on the most automated methods requiring the least supervision. The methods developed were then applied to two very different cases: mapping of the shoreline contaminated due to the explosion of the Deepwater Horizon (DWH) platform based on AVIRIS images (AVIRIS: Airborne Visible/InfraRed Imaging Spectrometer), and detection of a tar pit on a former oil exploration site. The detection strategy depends on the type of oil, light or heavy, recently or formerly spilled, and on the substrate. In the first case (controlled experiment), the proposed methods included spectral index calculations, anomaly detection and spectral unmixing. In the case of DWH, spectral indices were computed and the unmixing method was tested. Finally, to detect the tar pit, a strategy based on anomaly detection and spectral indices was applied. In all the cases studied, the proposed methods were successful in detecting and mapping the oil pollution. Full article
(This article belongs to the Special Issue Monitoring Soil Contamination by Remote Sensors)
Show Figures

Graphical abstract

18 pages, 33199 KiB  
Article
Exploring the Variation Trend of Urban Expansion, Land Surface Temperature, and Ecological Quality and Their Interrelationships in Guangzhou, China, from 1987 to 2019
by Jianhui Xu, Yi Zhao, Caige Sun, Hanbin Liang, Ji Yang, Kaiwen Zhong, Yong Li and Xulong Liu
Remote Sens. 2021, 13(5), 1019; https://doi.org/10.3390/rs13051019 - 08 Mar 2021
Cited by 21 | Viewed by 2604
Abstract
This study explored the model of urban impervious surface (IS) density, land surface temperature (LST), and comprehensive ecological evaluation index (CEEI) from urban centers to suburbs. The interrelationships between these parameters in Guangzhou from 1987 to 2019 were analyzed using time-series Landsat-5 TM [...] Read more.
This study explored the model of urban impervious surface (IS) density, land surface temperature (LST), and comprehensive ecological evaluation index (CEEI) from urban centers to suburbs. The interrelationships between these parameters in Guangzhou from 1987 to 2019 were analyzed using time-series Landsat-5 TM (Thematic Mapper), Landsat-8 OLI (Operational Land Imager), and TIRS (Thermal Infrared Sensor) images. The urban IS densities were calculated in concentric rings using time-series IS fractions, which were used to construct an inverse S-shaped urban IS density function to depict changes in urban form and the spatio-temporal dynamics of urban expansion from the urban center to the suburbs. The results indicated that Guangzhou experienced expansive urban growth, with the patterns of urban spatial structure changing from a single-center to a multi-center structure over the past 32 years. Next, the normalized LST and CEEI in each concentric ring were calculated, and their variation trends from the urban center to the suburbs were modeled using linear and nonlinear functions, respectively. The results showed that the normalized LST had a gradual decreasing trend from the urban center to the suburbs, while the CEEI showed a significant increasing trend. During the 32-year rapid urban development, the normalized LST difference between the urban center and suburbs increased gradually with time, and the CEEI significantly decreased. This indicated that rapid urbanization significantly expanded the impervious surface areas in Guangzhou, leading to an increase in the LST difference between urban centers and suburbs and a deterioration in ecological quality. Finally, the potential interrelationships among urban IS density, normalized LST, and CEEI were also explored using different models. This study revealed that rapid urbanization has produced geographical convergence between several ISs, which may increase the risk of the urban heat island effect and degradation of ecological quality. Full article
(This article belongs to the Special Issue Understanding Urban Systems Using Remote Sensing)
Show Figures

Graphical abstract

25 pages, 23534 KiB  
Article
Performance Comparison of Machine Learning Models for Annual Precipitation Prediction Using Different Decomposition Methods
by Chao Song and Xiaohong Chen
Remote Sens. 2021, 13(5), 1018; https://doi.org/10.3390/rs13051018 - 08 Mar 2021
Cited by 13 | Viewed by 2789
Abstract
It has become increasingly difficult in recent years to predict precipitation scientifically and accurately due to the dual effects of human activities and climatic conditions. This paper focuses on four aspects to improve precipitation prediction accuracy. Five decomposition methods (time-varying filter-based empirical mode [...] Read more.
It has become increasingly difficult in recent years to predict precipitation scientifically and accurately due to the dual effects of human activities and climatic conditions. This paper focuses on four aspects to improve precipitation prediction accuracy. Five decomposition methods (time-varying filter-based empirical mode decomposition (TVF-EMD), robust empirical mode decomposition (REMD), complementary ensemble empirical mode decomposition (CEEMD), wavelet transform (WT), and extreme-point symmetric mode decomposition (ESMD) combined with the Elman neural network (ENN)) are used to construct five prediction models, i.e., TVF-EMD-ENN, REMD-ENN, CEEMD-ENN, WT-ENN, and ESMD-ENN. The variance contribution rate (VCR) and Pearson correlation coefficient (PCC) are utilized to compare the performances of the five decomposition methods. The wavelet transform coherence (WTC) is used to determine the reason for the poor prediction performance of machine learning algorithms in individual years and the relationship with climate indicators. A secondary decomposition of the TVF-EMD is used to improve the prediction accuracy of the models. The proposed methods are used to predict the annual precipitation in Guangzhou. The subcomponents obtained from the TVF-EMD are the most stable among the four decomposition methods, and the North Atlantic Oscillation (NAO) index, the Nino 3.4 index, and sunspots have a smaller influence on the first subcomponent (Sc-1) than the other subcomponents. The TVF-EMD-ENN model has the best prediction performance and outperforms traditional machine learning models. The secondary decomposition of the Sc-1 of the TVF-EMD model significantly improves the prediction accuracy. Full article
(This article belongs to the Special Issue Artificial Intelligence in Remote Sensing of Atmospheric Environment)
Show Figures

Figure 1

27 pages, 17831 KiB  
Article
Spatiotemporal Variability of Mesoscale Eddies in the Indonesian Seas
by Zhanjiu Hao, Zhenhua Xu, Ming Feng, Qun Li and Baoshu Yin
Remote Sens. 2021, 13(5), 1017; https://doi.org/10.3390/rs13051017 - 08 Mar 2021
Cited by 12 | Viewed by 2710
Abstract
Mesoscale eddies are ubiquitous in the world ocean and well researched both globally and regionally, while their properties and distributions across the whole Indonesian Seas are not yet fully understood. This study investigates for the first time the spatiotemporal variations and generation mechanisms [...] Read more.
Mesoscale eddies are ubiquitous in the world ocean and well researched both globally and regionally, while their properties and distributions across the whole Indonesian Seas are not yet fully understood. This study investigates for the first time the spatiotemporal variations and generation mechanisms of mesoscale eddies across the whole Indonesian Seas. Eddies are detected from altimetry sea level anomalies by an automatic identification algorithm. The Sulu Sea, Sulawesi Sea, Maluku Sea and Banda Sea are the main eddy generation regions. More than 80% of eddies are short-lived with a lifetime below 30 days. The properties of eddies exhibit high spatial inhomogeneity, with the typical amplitudes and radiuses of 2–6 cm and 50–160 km, respectively. The most energetic eddies are observed in the Sulawesi Sea and Seram Sea. Eddies feature different seasonal cycles between anticyclonic and cyclonic eddies in each basin, especially given that the average latitude of the eddy centroid has inverse seasonal variations. About 48% of eddies in the Sulawesi Sea are highly nonlinear, which is the case for less than 30% in the Sulu Sea and Banda Sea. Instability analysis is performed using high-resolution model outputs from Bluelink Reanalysis to assess mechanisms of eddy generation. Barotropic instability of the mean flow dominates eddy generation in the Sulu Sea and Sulawesi Sea, while baroclinic instability is slightly more in the Maluku Sea and Banda Sea. Full article
(This article belongs to the Special Issue Remote Sensing Applications in Ocean Observation)
Show Figures

Graphical abstract

18 pages, 35894 KiB  
Article
Improving the Estimation of Weighted Mean Temperature in China Using Machine Learning Methods
by Zhangyu Sun, Bao Zhang and Yibin Yao
Remote Sens. 2021, 13(5), 1016; https://doi.org/10.3390/rs13051016 - 08 Mar 2021
Cited by 31 | Viewed by 2861
Abstract
As a crucial parameter in estimating precipitable water vapor from tropospheric delay, the weighted mean temperature (Tm) plays an important role in Global Navigation Satellite System (GNSS)-based water vapor monitoring techniques. However, the rigorous calculation of Tm requires vertical [...] Read more.
As a crucial parameter in estimating precipitable water vapor from tropospheric delay, the weighted mean temperature (Tm) plays an important role in Global Navigation Satellite System (GNSS)-based water vapor monitoring techniques. However, the rigorous calculation of Tm requires vertical profiles of temperature and water vapor pressure that are difficult to acquire in practice. As a result, empirical models are widely used but have limited accuracy. In this study, we use three machine learning methods, i.e., random forest (RF), backpropagation neural network (BPNN), and generalized regression neural network (GRNN), to improve the estimation of empirical Tm in China. The basic idea is to use the high-quality radiosonde observations estimated Tm to calibrate and optimize the empirical Tm through machine learning methods. Validating results show that the three machine learning methods improve the Tm accuracy by 37.2%, 32.6%, and 34.9% compared with the global pressure and temperature model 3 (GPT3). In addition to the overall accuracy improvement, the proposed methods also mitigate the accuracy variations in space and time, guaranteeing evenly high accuracy. This study provides a new idea to estimate Tm, which could potentially contribute to the GNSS meteorology. Full article
(This article belongs to the Special Issue Remote Sensing of Land Surface and Earth System Modelling)
Show Figures

Graphical abstract

23 pages, 5469 KiB  
Article
Integration of Sentinel-3 OLCI Land Products and MERRA2 Meteorology Data into Light Use Efficiency and Vegetation Index-Driven Models for Modeling Gross Primary Production
by Fengji Zhang, Zhijiang Zhang, Yi Long and Ling Zhang
Remote Sens. 2021, 13(5), 1015; https://doi.org/10.3390/rs13051015 - 08 Mar 2021
Cited by 1 | Viewed by 2354
Abstract
Accurately and reliably estimating total terrestrial gross primary production (GPP) on a large scale is of great significance for monitoring the carbon cycle process. The Sentinel-3 satellite provides the OLCI FAPAR and OTCI products, which possess a higher spatial and temporal resolution than [...] Read more.
Accurately and reliably estimating total terrestrial gross primary production (GPP) on a large scale is of great significance for monitoring the carbon cycle process. The Sentinel-3 satellite provides the OLCI FAPAR and OTCI products, which possess a higher spatial and temporal resolution than MODIS products. However, few studies have focused on using LUE models and VI-driven models based on the Sentinel-3 satellites to estimate GPP on a large scale. The purpose of this study is to evaluate the performance of Sentinel-3 OLCI FAPAR and OTCI products combined with meteorology reanalysis data in estimating GPP at site and regional scale. Firstly, we integrated OLCI FAPAR and meteorology reanalysis data into the MODIS GPP algorithm and eddy covariance light use efficiency (EC-LUE) model (GPPMODIS-GPP and GPPEC-LUE, respectively). Then, we combined OTCI and meteorology reanalysis data with the greenness and radiation (GR) model and vegetation index (VI) model (GPPGR and GPPVI, respectively). Lastly, GPPMODIS-GPP, GPPEC-LUE, GPPGR, and GPPVI were evaluated against the eddy covariance flux data (GPPEC) at the site scale and MODIS GPP products (GPPMOD17) at the regional scale. The results showed that, at the site scale, GPPMODIS-GPP and GPPEC-LUE agreed well with GPPEC for the US-Ton site, with R2 = 0.73 and 0.74, respectively. The performance of GPPGR and GPPVI varied across different biome types. Strong correlations were obtained across deciduous broadleaf forests, mixed forests, grasslands, and croplands. At the same time, there are overestimations and underestimations in croplands, evergreen needleleaf forests and deciduous broadleaf forests. At the regional scale, the annual mean and maximum daily GPPMODIS-GPP and GPPEC-LUE agreed well with GPPMOD17 in 2017 and 2018, with R2 > 0.75. Overall, the above findings demonstrate the feasibility of using Sentinel-3 OLCI FAPAR and OTCI products combined with meteorology reanalysis data through LUE and VI-driven models to estimate GPP, and fill in the gaps for the large-scale evaluation of GPP via Sentinel-3 satellites. Full article
Show Figures

Graphical abstract

Previous Issue
Next Issue
Back to TopTop