Article

Satellite Monitoring of Environmental Solar Ultraviolet A (UVA) Exposure and Irradiance: A Review of OMI and GOME-2

1
Centre for Applied Climate Sciences, University of Southern Queensland, Toowoomba 4350, Australia
2
Faculty of Health, Engineering and Sciences, University of Southern Queensland, Toowoomba 4350, Australia
3
Physics Department, Faculty of Sciences, University of Thi-Qar, Thi Qar 64001, Iraq
*
Author to whom correspondence should be addressed.
Remote Sens. 2021, 13(4), 752; https://doi.org/10.3390/rs13040752
Submission received: 15 December 2020 / Revised: 12 February 2021 / Accepted: 16 February 2021 / Published: 18 February 2021
(This article belongs to the Collection Feature Papers for Section Environmental Remote Sensing)

Abstract

:
Excessive exposure to solar ultraviolet (UV) radiation has damaging effects on life on Earth. High-energy short-wavelength ultraviolet B (UVB) is biologically effective, influencing a range of dermal processes, including the potentially beneficial production of vitamin D. In addition to the damaging effects of UVB, the longer wavelength and more abundant ultraviolet A (UVA) has been shown to be linked to an increased risk of skin cancer. To evaluate this risk requires the monitoring of the solar UVA globally on a time repetitive basis in order to provide an understanding of the environmental solar UVA irradiance and resulting exposures that humans may receive during their normal daily activities. Satellite-based platforms, with the appropriate validation against ground-based instrumentation, can provide global monitoring of the solar UVA environment. Two satellite platforms that currently provide data on the terrestrial UVA environment are the ozone monitoring instrument (OMI) and the global ozone monitoring experiment (GOME-2). The objectives of this review are to provide a summary of the OMI and GOME-2 satellite-based platforms for monitoring the terrestrial UVA environment and to compare the remotely sensed UVA data from these platforms to that from ground-based instrumentation.

1. Introduction

1.1. Satellite Platforms

The global monitoring of solar ultraviolet (UV) radiation on a time repetitive basis is an important component for the quantification of both the magnitude and fluctuations in the solar UV irradiance and resulting exposures to humans during normal daily activities. This is necessary to establish global trends and for research on the influences of the UVA and the UVB wavebands on the risk of skin cancer, sun-related eye diseases and vitamin D deficiency-related ailments, as well as the influence of solar UV on plants and animals and materials on the earth [1]. Additionally, solar radiation at wavelengths longer than 400 nm is essential for the survival of life on Earth, the photosynthetic process of plant life and photovoltaic energy generation [2,3,4]. The solar radiation and the UV radiation irradiances have been modeled by previous researchers [2,3,4,5]. Nevertheless, data measured by ground-based monitoring stations comprise an essential component of datasets of solar UV irradiance and exposures. However, these measuring facilities are limited in number at only certain locations due to the cost of these facilities and the need for skilled personnel to maintain these facilities and so provide datasets only at the measurement sites.
In addition to the ground-based measurements, evaluation of the UV irradiances and exposures using satellite-based platforms provide long-term global UV climatologies on a time repetitive basis [3]. UV data series from satellite-based platforms have been initially provided by the total ozone monitoring spectrometer (TOMS) [6,7,8]. The TOMS instrument provided a data series for the erythemal UV from November 1978, with the TOMS Nimbus-7 having provided daily erythemal UV irradiance at solar noon from November 1978 to May 1993 with a spatial resolution of 1° × 1.25° [9]. Similarly, the TOMS earth-probe provided solar noon erythemal UV irradiances data between July 1996 and December 2005 [9].
The instrumentation that replaced TOMS is the ozone monitoring instrument (OMI) [10] on a satellite with a sun-synchronous polar orbit, and that has been providing UV data since October 2004 on the solar noon spectral irradiance at 305 nm, 310 nm, 324 nm and 380 nm. The solar noon erythemal (sunburning) irradiance and total daily exposure (cumulative) are provided [10,11]. This solar noon data are calculated from information collected at the overpass time. The accuracy of the OMI evaluation of the ground-based UV is of the order of 7% to 30% [10]. Another platform is the global ozone monitoring experiment (GOME) with the currently operational GOME-2 instrumentation on the three sun-synchronous polar-orbiting satellites MetOp-A, MetOp-B and MetOp-C with respective launches in October 2006, September 2012 and November 2018 [12]. Comparison with ground-based data has shown the GOME-2 daily erythema UV exposures generally higher by 10%–20% [13].
A number of research papers have reported on the monitoring, validation and comparison of the erythemal UV, the UV index, ozone and at specific wavelengths in the UVB waveband from satellite-based instrumentation (for example, [14,15]). Similarly, a comparison of total column ozone from satellite and ground-based instrumentation of a Bentham spectroradiometer at Granada, Spain, found mean absolute differences of less than 3% [16]. However, as outlined in the next section, information on the irradiance and exposures due to the UVA waveband is also essential in assessing the damage to humans and the biosphere.

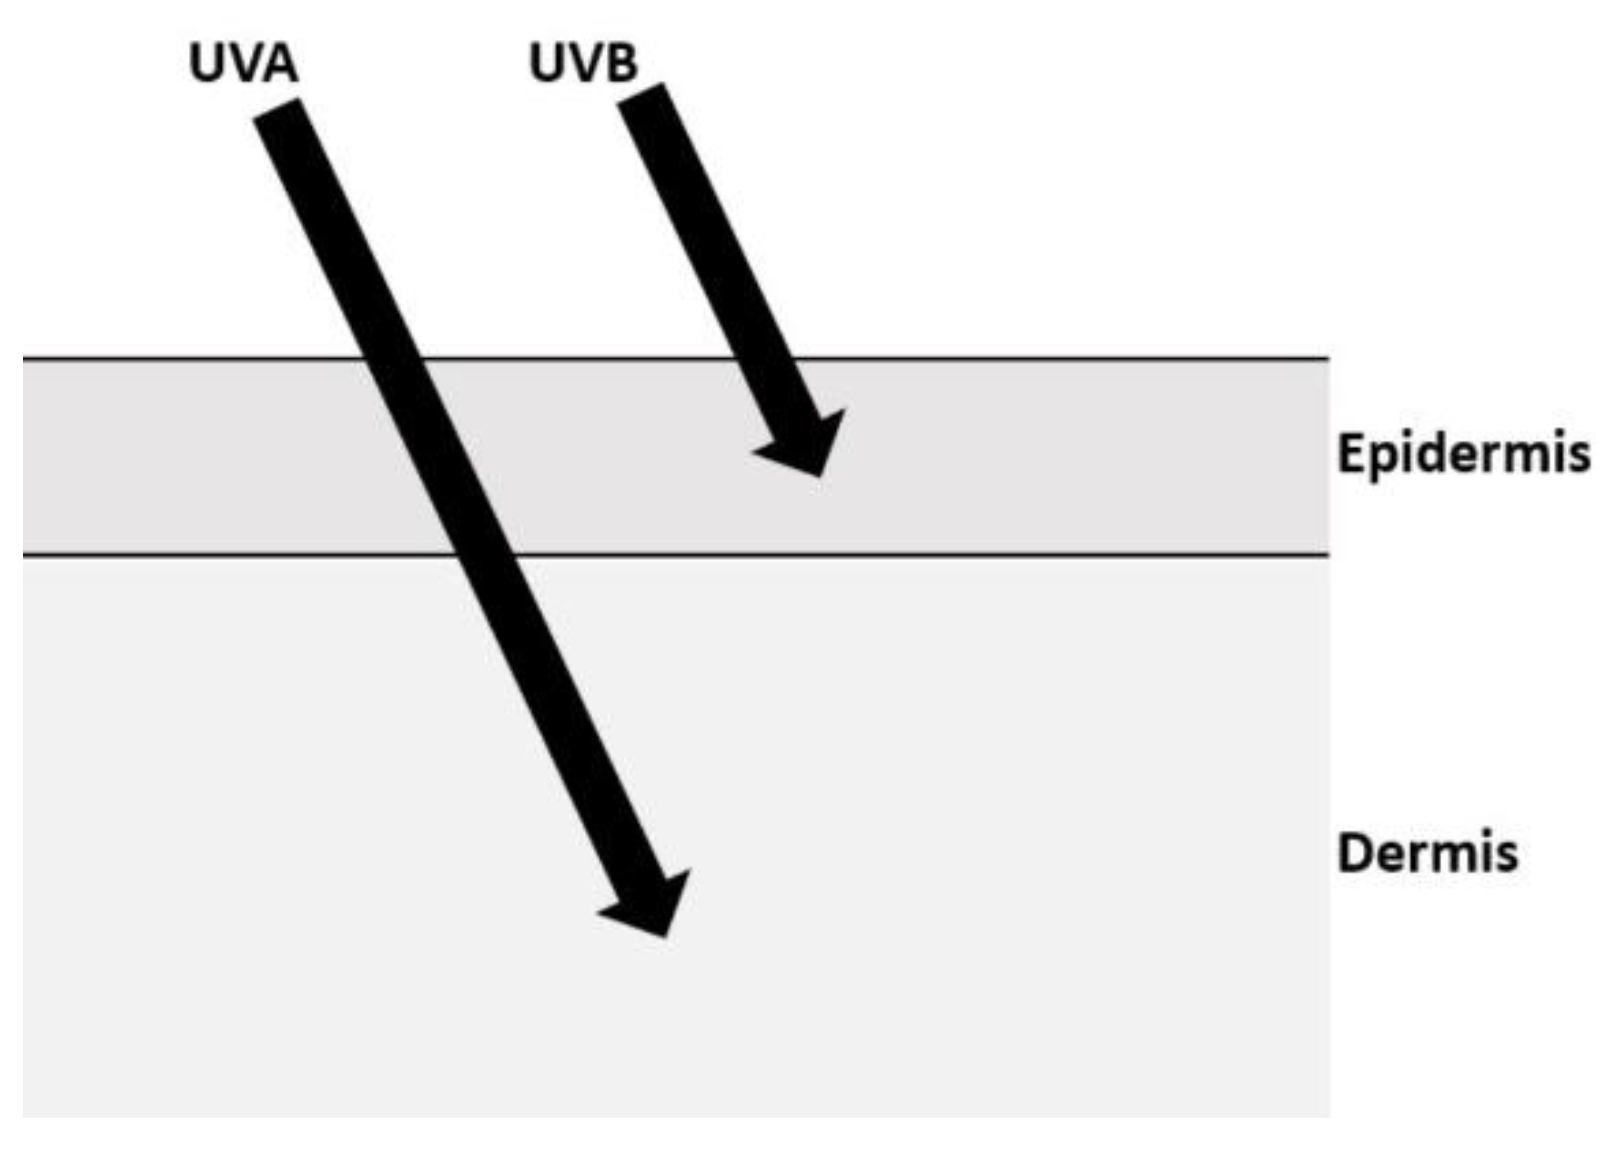
1.2. Solar UVA Radiation

Ultraviolet radiation describes a waveband in the electromagnetic spectrum between 100 nm, the boundary of ionizing and non-ionizing radiation, up to the boundary with the visible spectrum at 400 nm [17]. Wavelengths above approximately 290 nm can reach the earth’s surface; lower wavelengths are absorbed by atmospheric ozone and oxygen [17,18,19]. The boundary between the UVA and the higher energy UVB is taken as either 315 nm [20] or 320 nm [21]. Photobiological and photodermatological studies generally employ a boundary at 320 nm [18,21,22,23,24,25,26,27,28].
Approximately 5% of incoming sunlight is in the UV waveband [19,22], of which up to 95% is in the UVA waveband [18,22,23,24,25,26,27]. UVA is further subdivided into UVA 1 (340 nm to 400 nm) and UVA 2 (320 nm to 340 nm) [22,28,29]. Up to 75% of the UV irradiance is within the UVA 1 waveband [26,27]; however, none of the UV measured by satellite platforms differentiates between UVA 1 and UVA 2. The actual intensity and the spectral quality of solar UVA irradiance is affected by factors such as atmospheric aerosols, clouds, solar zenith angle, altitude, seasonality, and albedo [24,25]. Human exposure to any UV, including UVA, comes from direct, scattered, and filtered sources [17], with the relative scattering of the UVA waveband being considerably less than that of the UVB waveband. This is due to the lower relative proportion of Rayleigh scattering at the longer wavelengths, as it is inversely proportional to the fourth power of the wavelength.
The UVA wavelengths are also damaging to human tissue as UVA penetrates through the epidermis and into the dermis [19,25] (see Figure 1) and is found to cause DNA damage to basal cell layers and associated cellular responses in humans [23,26,27,29,30]. Research also has shown the UVA penetrates the cornea and the first layer of the iris [29]. Prolonged UVA exposure impairs the removal of UV photoproducts and can result in premature and accelerated aging and photoimmunosuppression [19,23,25,26]. UVA (320–400 nm) has been attributed as a cause of DNA damage and an increased risk of skin cancer [19,23,28]. There is a suggestion in the literature that UVA 1 (340–400 nm), even in sub-erythemal doses, may cause DNA damage [28]. However, the UVA waveband does not have the positive effect of initiating the production of vitamin D3 as the action spectrum for this is zero at wavelengths of 330 nm and higher [31].
Furthermore, the UVA waveband is transmitted through glass, whereas the UVB waveband is severely attenuated through a glass [32]. Humans can undergo exposure to glass transmitted UVA in a number of environments during normal daily occupational and recreational activities. The amount of UVA transmission depends on the type of glass and the thickness of the glass [32].
Despite the damaging effects of UVA radiation, there have not been as many reports on the satellite-based platforms for monitoring the terrestrial UVA environment. The objectives of this review are to provide a summary of the OMI and GOME-2 satellite-based platforms for monitoring the terrestrial UVA environment and to review the comparisons of the remotely sensed UVA data from these platforms to that from ground-based instrumentation. The literature was sourced through the use of keywords such as “UVA”, “OMI”, “GOME-2”, “satellite,” and other similar search keywords in databases, such as Google Scholar and other web searches.

2. GOME-2 UVA Data

The GOME-2 instrumentation is on board the three Metop sun-synchronous polar-orbiting satellites of Metop-A, Metop-B and Metop-C in orbits with an altitude of 800 to 850 km and locally overpasses at approximately 0930 local solar times [33]. The satellites provide the backscattered radiance data and the extraterrestrial solar radiance data for the visible and ultraviolet wavebands from 240 nm to 790 nm [34] (see Table 1). The instrument on the Metop-B has a pixel size of 80 km × 40 km at nadir and a swath width of 1920 km. The GOME-2 instrument provides UV data products as well as information on atmospheric trace gases. The data are provided on a latitude and longitude grid, with total daily UVA (315–400 nm) exposure and the maximum UVA irradiance for each day provided since June 2009, along with information on atmospheric gases [35]. The predecessor to this instrumentation was GOME, which was launched in April 1995 and no longer operational. It provided data on atmospheric trace gases, for example, total ozone, nitrogen dioxide and others, along with cloud information [36]. The advantages of GOME-2 for the UV irradiances and exposures compared with its predecessor GOME is that GOME-2 provides data on UV irradiances and exposures for the UVA and UVB wavebands and for the various action spectra, whereas GOME did not provide any UV data products.
The GOME-2 satellites provide the maximum daily UVA irradiance and the total daily exposures as offline surface ultraviolet radiation products (OUVs) [34]. The daily maximum UVA (315–400 nm) irradiance at solar noon in units of mW m−2 and the total daily UVA exposure (cumulative over a day) in units of kJ m−2 for each day have been available from the GOME-2 instrument since June 2009. Additional products in the surface UV series are the total daily exposures for the erythemal, DNA damage, plant response and vitamin D action spectra and the unweighted UVB, the daily maximum irradiance at solar noon for the erythemal, DNA damage, plant response and vitamin D action spectra and the unweighted UVB [37]. Additionally, the ozone and nitrogen dioxide photolysis rates and the solar noon UV index are provided [37]. The GOME-2 data from the Metop-B satellite has been available since 1 March 2014 [35] and has now become the prime operational satellite in a polar orbit for Europe’s meteorological satellite agency, EUMETSAT [34,38]. Metop-A continues to fly in the same orbit as Metop-B with a separation of 48.93 min [38].
The algorithm for the GOME-2 data employs a radiative transfer model to calculate the clear sky UVA at 30 min intervals for the relevant solar zenith angle with the values for aerosols and albedo derived from climatological values [35]. The total ozone column is provided with an algorithm using differential optical absorption spectroscopy (DOAS). Further description of the algorithm is provided in [35]. The algorithm for the data was version 1.2 until 29 February 2020; it is currently version 2.2 since 1 March 2020 [37]. The updates in version 2.2 are new climatologies for surface pressure, albedo and aerosol input, calculation of uncertainties and the total ozone gaps at low latitudes from Metop-B being filled with Metop-C data, with the ozone data not applicable for the UVA waveband.
These OUV products for the GOME-2 are generally available between 2 to 15 days after collection through the EUMETSAT atmospheric composition monitoring (AC SAF) website [37] and following the links of Data Access, Offline Products and Surface UV. At this point, it is necessary for first-time users of the FMI data server to register. Once registered, the use of a username and password will allow selection of the product type required. The “Surface UV time-series” option provides the data in a text file format for the user-specified time period, and the “Surface UV” option provides the data in an HDF file format. For the UVA waveband, the total daily dose or exposure and the maximum daily dose rate or irradiance are selected from the variables available via the checkboxes. The entry of the latitude and longitude coordinates of interest in decimal format and clicking “Proceed to order form” allows progression to the next page where the user details are entered, followed by placement of the order for the data. An order number is now provided, and once the data file is ready, an email will be sent to the user-specified email address. Additionally, the GOME-2 global spatial distribution of erythemal UV and UVA data for a given time can be plotted via the EUMETSAT AC SAF website [37].
The GOME-2 daily erythema UV exposures are generally 10%–20% higher than the data from ground-based instruments at the corresponding locations [13]. The differences in the maximum daily irradiances also have a positive bias. The error sources in the GOME-2 data are predominantly due to absorbing aerosols, variations over the size of a pixel in the cloud, ozone, albedo, and aerosols, as well as variations in the cloud between the satellite overpass time and solar noon and diurnal variations in the cloud for the daily exposures [39].

3. OMI UVA Data

The OMI is nadir viewing and onboard a NASA EOS Aura spacecraft flying in a sun-synchronous polar orbit [1]. The instrument has a swath width of 2600 km and a spatial resolution at the nadir of 13 km × 24 km and measures the reflected and backscattered radiation in the 270 nm to 500 nm waveband [10] (see Table 1). The OMI spectral irradiance data at solar noon in the UVA waveband at 324 nm and 380 nm is provided, as well as in the UVB waveband at 305 nm and 310 nm and the solar noon daily erythemal irradiance, the solar noon UV index and the erythemal daily exposure [10]. The OMI-based evaluation is of the order of 7% to 30% higher than the ground measured data [10]. This positive bias is due to absorbing aerosols in the boundary layer not being taken into account. Additional error sources are changes in the cloud cover between the satellite overpass time and solar noon, variations over the size of a pixel, diurnal variations in the cloud cover for the calculation of daily exposures and variations in albedo and aerosols [10].
The OMI spectral irradiance data at solar noon in the UVA waveband at 324 nm and 380 nm, as well as in the UVB waveband at 305 nm and 310 nm, are available from the NASA GES-DISC interactive online visualization and analysis infrastructure (GIOVANNI) website [9] where GES-DISC is the Goddard Earth Sciences Data and Information Services Center. The GIOVANNI website allows access to a wide range of NASA data from a range of satellite platforms and instruments that the user selects for a user-defined date range and a latitude and longitude bounding region for the data, as well as a user-defined display format [9].
For first-time users of the GIOVANNI site, it is necessary to register with a username and password, and these are employed in future access to the site. For the information required in the “Select Plot” entry, select the “Time Series, Area-Averaged” option for the provision of a time-stamped data series in an ASCII format for the variable or variables selected that are spatially averaged over the user-selected area. The “Select Date Range” requires the specification of the date and time range. The “Select Region” requires the display of the world map using the left-most icon in that box, followed by the selection of the rectangular shape icon to allow selection of a latitude and longitude range. The latitude and longitude range can be refined with manual adjustment of the latitude and longitude. The “Select Variables” allows the selection of the variable or variables of interest. For the UV spectral irradiance, select “Irradiance” from the “Measurements” drop-down menu. This allows the selection of the UV spectral irradiance of interest for local solar noon in units of mW m−2 nm−1. The selection of the “Plot Data” icon now retrieves the data. Once the plot is produced on the screen, the selection of the “Downloads” option on the left allows the file to be downloaded in a.csv format to allow further analysis with user-selected software. Additionally, the OMI global spatial distribution of the erythemal UV and the irradiances at 305 nm, 310 nm, 324 nm and 380 nm data for a given time can be plotted via the GIOVANNI website [9].
This UV spectral irradiance data are available from October 2004 with the solar noon spectral irradiance on a 1° × 1° grid and calculated from the data collected at the satellite overpass time of approximately 1345 local solar time [11]. The OMI measured data, and the climatological aerosol and ozone data are provided as the inputs to a radiative transfer model for a clear sky [10]. The OMI algorithm is based on the TOMS surface UV algorithm [10,40] with accuracies for a clear sky with snow and aerosol free cases of 7% and of the order of 10% at 380 nm at 305 nm, respectively. The OMI algorithm [40] employs the measured data at the satellite overpass time and lookup tables for the evaluation of the irradiance values at local solar noon.
A comparison of the UV data from the OMI and the GOME-2 satellites over the date range of 1 June 2009 to 1 February 2021 is provided in Figure 2. The total daily erythemal UV exposure and the daily erythemal maximum UV irradiance are provided as a comparison. The erythemal UV was selected for the comparison as the daily maximum irradiance, and the total daily exposures are provided by both satellite platforms, whereas there is not a UVA product that is provided by both satellites to allow a comparison of a product in the UVA waveband. The R2 is 0.98 in both cases. Some of the scatter in the data may be due to the changes in the cloud cover where the cloud cover for the OMI data are determined at the afternoon time of the OMI satellite, and the cloud cover for the GOME-2 data are determined from satellite overpasses in the morning and in the afternoon as detailed in the next section.

4. Cloud and Aerosol Data Used for GOME-2 and OMI UVA

For a given solar zenith angle, variation between ground measured UV irradiance data and OMI or GOME-2 determined UV irradiance data are most commonly due to ozone, altitude, clouds and aerosols [41]. As ozone has little influence on UVA irradiance, the main factors influencing satellite UVA irradiance measurements after the solar zenith angle are clouds and aerosols. The algorithms for the OMI and the GOME-2 thus take into account these influencing factors.

4.1. OMI

The OMI does not cover the boundary layer of the atmosphere [42], which is the bottom layer of the troposphere. It, therefore, cannot account for absorbing aerosols, such as smoke and dust [43], thus resulting in a systematic overestimation of surface UV irradiance [44]. The OMI surface algorithm was derived from the TOMS UV algorithm [10], and it can correct for aerosols when absorbing effects can be estimated, and there is no significant cloudiness [10]. The process as described in the OMI Algorithm Theoretical Basis document [45] uses lookup tables and either: “cloud/non-absorbing aerosol correction or absorbing aerosol correction”. The correction used for absorbing aerosols is dependent on the threshold values of the aerosol index (AI) at two specific wavelengths (331 nm and 360 nm) for a known altitude, while the correction for the cloud/non-absorbing aerosols is dependent on the Lambertian equivalent reflectivity (LER) at 360 nm [45]. The use of wavelengths in the UVA spectrum for aerosol and cloud correction means that the algorithm will work over “bright areas” of surface reflectivity (areas of highly visible and infrared surface reflectivity) as the reflectivity in the UVA spectrum will generally be lower for terrestrial surfaces [44]. The threshold values of AI must be 0.5 in order for the OMI to apply a correction and when the LER is less than 0.15 [10]. Errors in UV irradiance determination from the OMI algorithm occur because OMI does not distinguish between non-absorbing aerosols and thin clouds [10], resulting in overestimation. At the same time absorbing aerosols in the boundary layer attenuate UV irradiance. Because the OMI does not reach the boundary layer, this results in cloud correction underestimating the corresponding attenuation of the surface UV irradiance [10]. A number of researchers have applied a correction procedure on the collected data that employs the aerosol absorption optical depth to reduce the bias due to absorbing aerosols in the boundary layer [6,46,47,48]. It should be noted that the algorithm discussed above relates only to the UV surface product algorithm and does not include a discussion of the separate aerosol algorithms that OMI also uses to monitor aerosols (OMAERUV and OMAERO). The presence of clouds is corrected for using a radiative transfer calculation. The cloud optical thickness is modeled using surface albedo and cloud albedo [45], and lookup tables are used to fit measured radiance at 360 nm, accounting for solar zenith angle, surface pressure and surface albedo.

4.2. GOME-2

Like the OMI, the GOME-2 provides multiple products for users [49]. Therefore, it is important to check what product is relevant to the desired data to be collected. Tilstra et al. [50] report on the algorithm for the absorbing aerosol index. Kujanpää and Kalakoski [49] provide a recent report on the operating algorithm, with additional information from the published user documents [39]. The key calculations for the UV surface product are performed offline [35,39,51]. Overall, the algorithm starts with initial measurements that are adjusted first by the radiative transfer models, then applies both a number of calculated weighted action spectra and cloud optical depth before incorporating the various climatologies. The cloud optical depth (COD) requires information from both the morning and afternoon measurements due to the rapid changes in clouds over any location and is calculated through reflectance measurements at 630 nm.
The cloud information for the GOME-2 data is provided twice a day, with one in the morning at about 0930 local times and one in the afternoon at about 1430 local time [49]. The morning time cloud information is from the 3rd advanced very high-resolution radiometer (AVHRR/3) on the Metop satellite [51]. The afternoon time cloud information is from the National Oceanic and Atmospheric Administration (NOAA) polar-orbiting environmental satellites (POES), representing a data exchange between EUMETSAT and the NOAA.
The process to incorporate aerosols is reported as the aerosol optical depth (AOD) at 550 nm and is found by combining various satellite AOD products for this particular climatology [49]. The near real-time UV Index measurements are calculated within the model and adjusted for cloud and the various climatologies, with validation measurements performed at six different locations [34]. However, as reported in the user documents, the UV product is prone to error due to cloud and AOD. The cloud optical thickness accuracy decreases due to increasing albedo while increasing aerosols are associated with an increasing error.

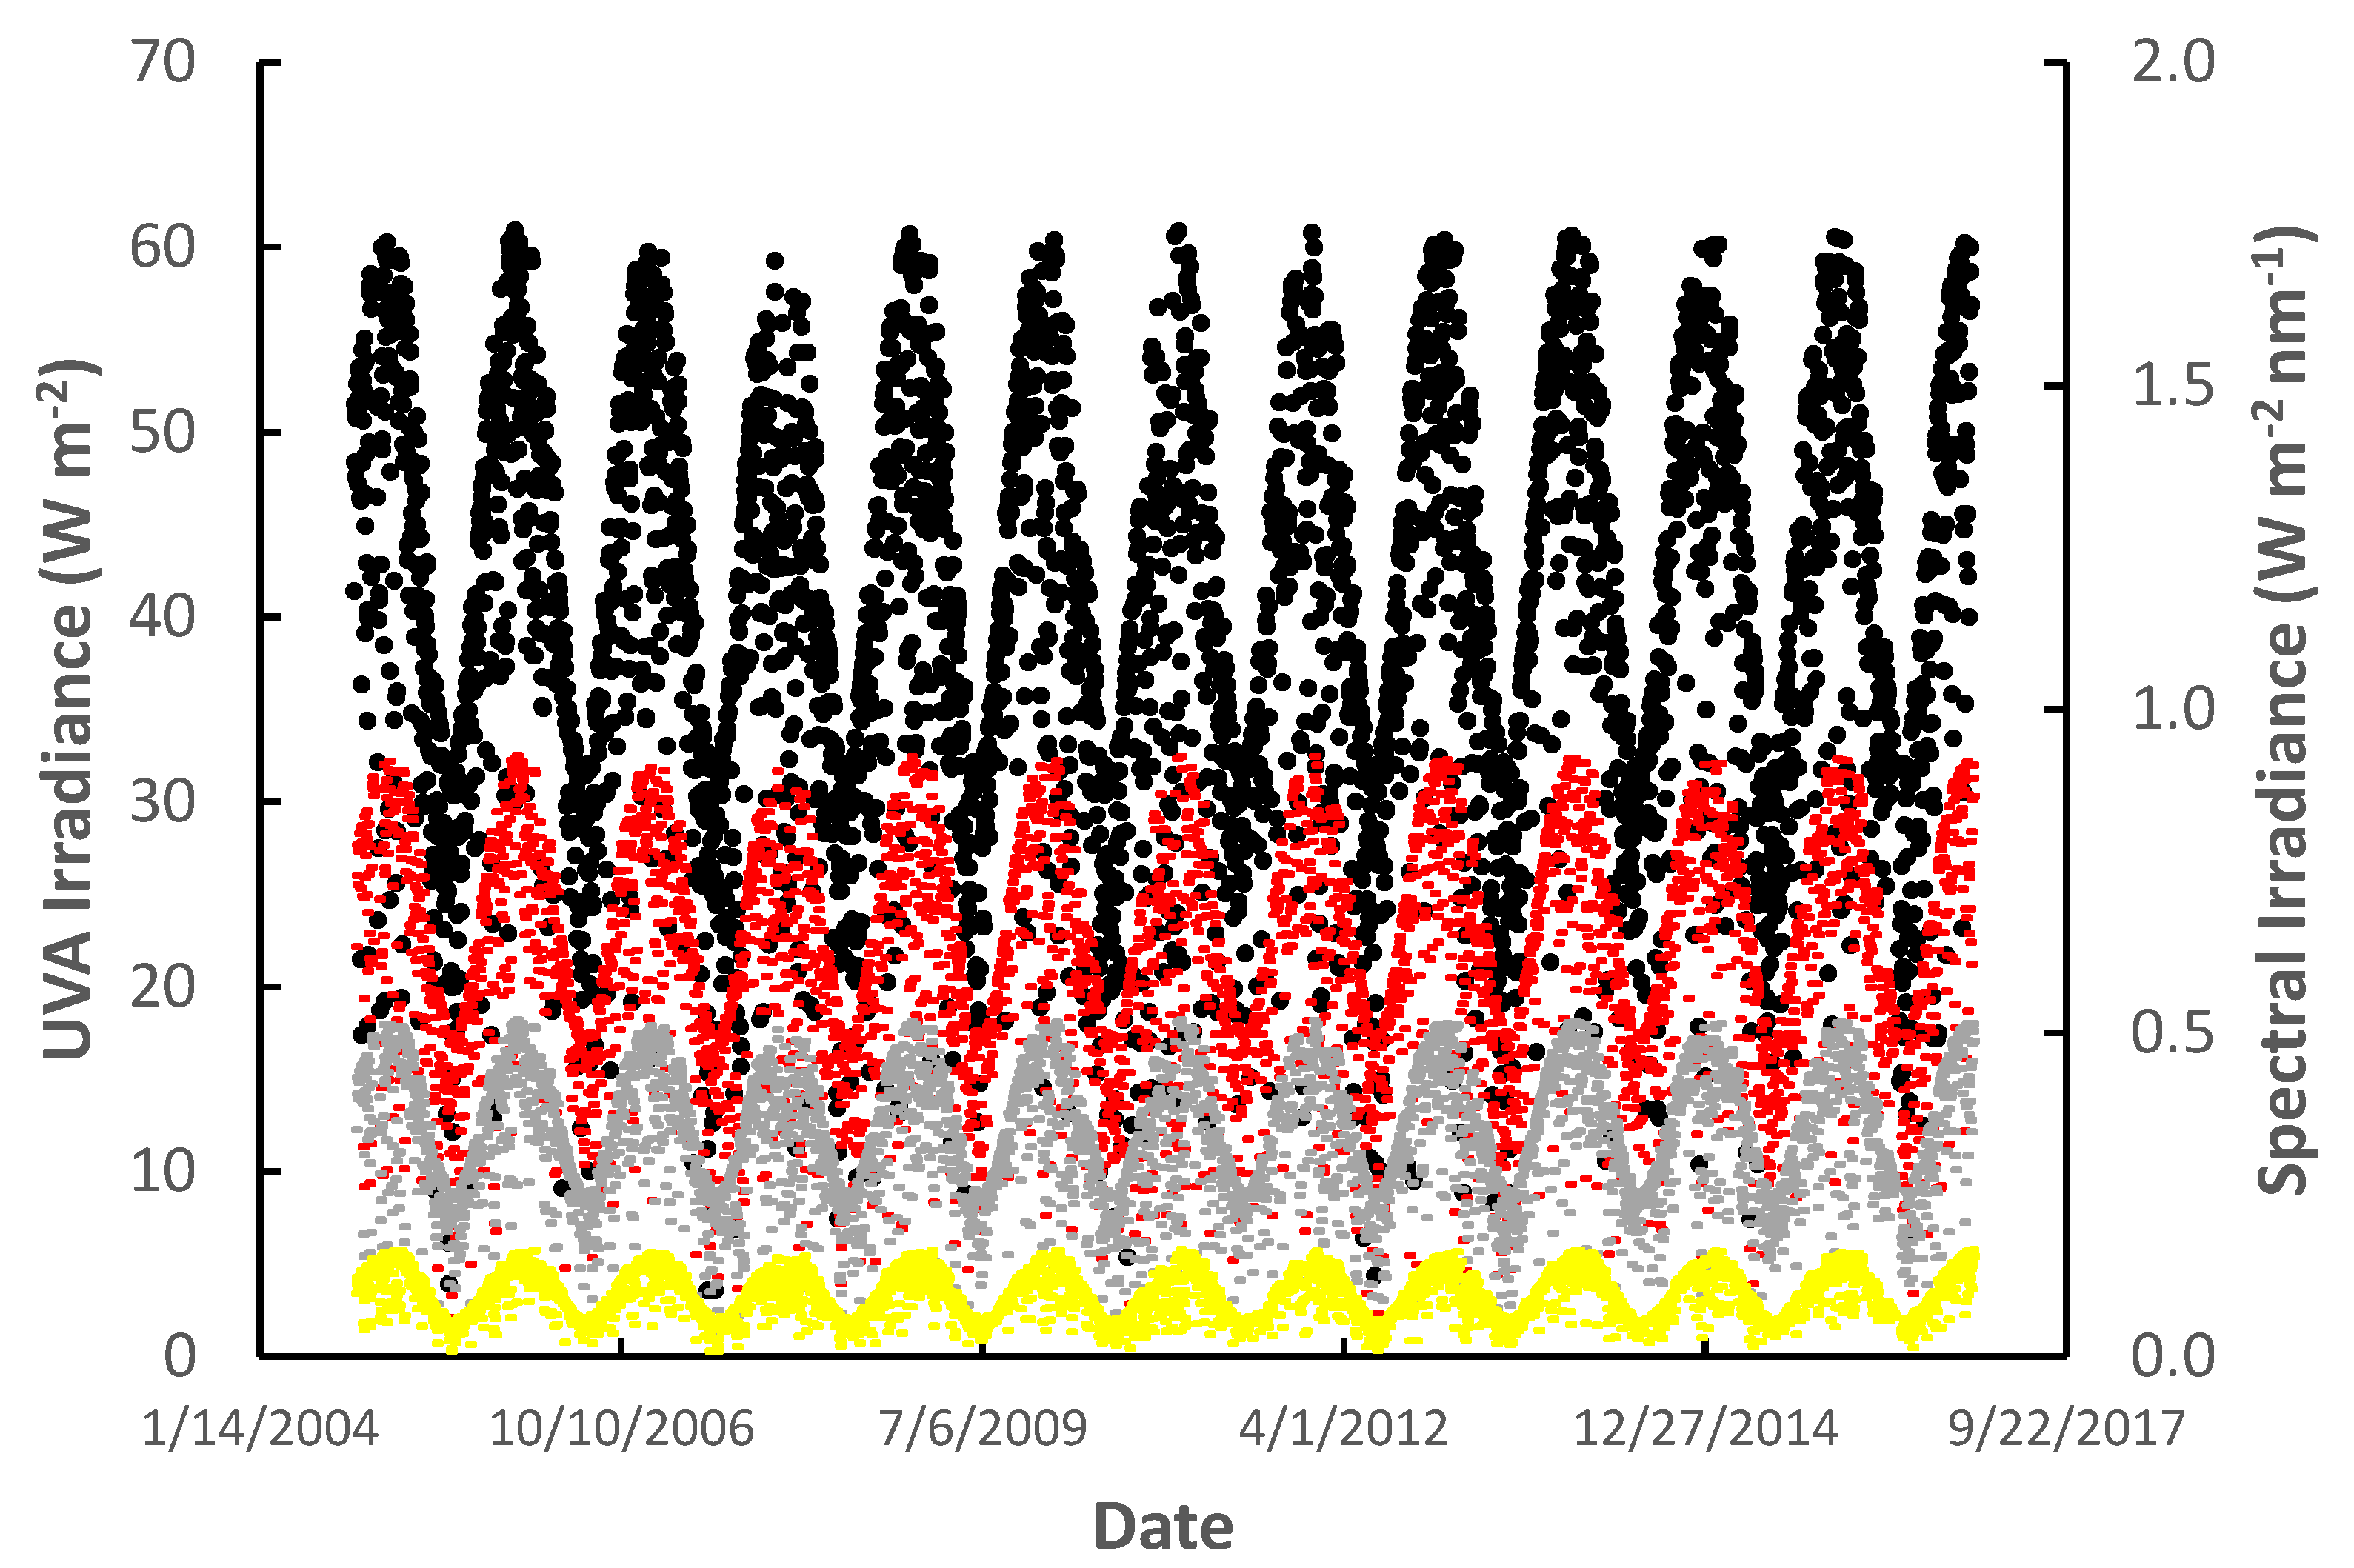
5. Broadband UVA Irradiance and Exposures from OMI Data

5.1. Reconstruction of Broadband UVA Irradiance

OMI UV satellite data products include discreet spectral irradiance measurements recorded as the satellite passes at a given site on the earth’s surface once per day [11,52] with the algorithm extrapolating to derive the local solar noon information. This daily data product is available to users at 305 nm, 310 nm, 324 nm and 380 nm. The OMI algorithm also derives the local UV index and the daily erythemally weighted UV exposure [53]. Many studies have therefore utilized the OMI spectral irradiance and ozone data to derive erythemally effective exposures and global surface UV index for a range of marine and surface sites at both high and low altitudes [14,54,55,56].
Isolated spectral data products derived from the OMI solar noon time data may also be used to reconstruct the unweighted local surface UV irradiance in W m−2 (295 to 400 nm), the unweighted surface UVB irradiance in W m−2 (295 to 320 nm), or the surface UVA in W m−2 (320 to 400 nm). Previous research [41] reconstructed the unweighted surface UVA irradiance at solar noon from the OMI 310 nm, 324 nm and 380 nm data products. This reconstruction technique utilized a numerical integration of the spectral irradiance whereby the OMI local spectral irradiance, I(310), I(324) and I(380) in units of W m−2 at 310 nm, 324 nm and 380 nm, respectively, were used to approximate the irradiance function at each given UV wavelength of the irradiance integral, EUV according to a trapezoidal approximation (Equation (1)).
In this equation, I(0) and I(n) are the starting and ending spectral irradiance in the desired integral, and I( λ i ) is the spectral irradiance evaluated at intermediate points within the numerical integral of step size h, which is often set to 1 nm. In calculating the integral, I(0) and I(n) are not typically one of the OMI spectral irradiance data products I(305), I(310), I(324) or I(380), but rather a limiting point defining the desired UV waveband as in the case of previous research [41] where I(0) was set at I(320) and I(n) at I(400). In this case, for the UVA irradiance from 320 to 400 nm, EUVA, Equation (1) reduces to the sum of three terms in Equation (2).
For this case, the coefficients a, b and c represent the geometric length or the sum of two half interval widths between successive spectral irradiance values in the range 320 to 400 nm. For an integral of step size of 1 nm, the coefficient c is (380 − 324)/2 + 20, representing half the geometric width of the increasing linear irradiance function interval between 324 and 380 nm added to another twenty (1 nm widths) after 380 and up to 400 nm. In this approximation, the integral is assumed to not increase between 380 and 400 nm and the starting point I(320) is estimated as the linear function value of I( λ i ) 10 nm from the OMI spectral irradiance I(310), which provides Equation (3).
E U V   h 2 ( I ( 0 ) + I ( n ) + 2 I ( λ i ) )                   W   m 2
E U V A = a × I ( 310 ) + b × I ( 324 ) +   c × I ( 380 )   W   m 2
E U V A 0.57 × I ( 310 ) + 31.429 × I ( 324 ) + 48 × I ( 380 ) W   m 2
Thus, EUV may represent the total UV irradiance integral, the UVB integral, or, as shown in Equation (3), the UVA integral depending on the choice of I(0) or I(n) and the corresponding values of the coefficients a, b and c. In deriving the total irradiance, I( λ i ) is evaluated assuming the irradiance interval varies linearly between the choice of I(0) and I(n) or each intermediary OMI spectral irradiance.
Anav et al. [57] first applied this technique to reconstruct the ultraviolet irradiance integral using discreet spectral irradiance measurements obtained from surface Brewer spectrophotometers at 305, 320, 340 and 380 nm. Here, the area under the curve was approximated by Anav et al. [57] according to Equation (4) for wavelengths up to and, including 305 nm, Equation (5) for wavelengths between 305 to 324 nm, Equation (6) for wavelengths between 324 to 380 nm and Equation (7) from 380 to 400 nm, depending upon the spectral irradiance range, as follows:
I ( λ i ) = I ( 305 ) e K ×   ( λ i 305 )
I ( λ i ) =   I ( 305 ) +   I ( 324 ) I ( 305 ) 324 305
I ( λ i ) =   I ( 324 ) +   I ( 380 ) I ( 324 ) 380 324
I ( λ i ) = I ( 380 )
Such an approximation assumes the influence of dips and rises in the spectral integral are minimal when approximated over a sufficient wavelength range. Anav et al. [57] determined the difference between the numerically approximated integral and the same integral calculated as the summation of each wavelength in the UV waveband to have a relative deviation of ±2%. A similar reconstructive technique was implemented [58] using discreet UVA surface radiometer measurements. Similar reconstructive spectral techniques have also been implemented by Grant and Slusser [59] and Piervitali et al. [60].

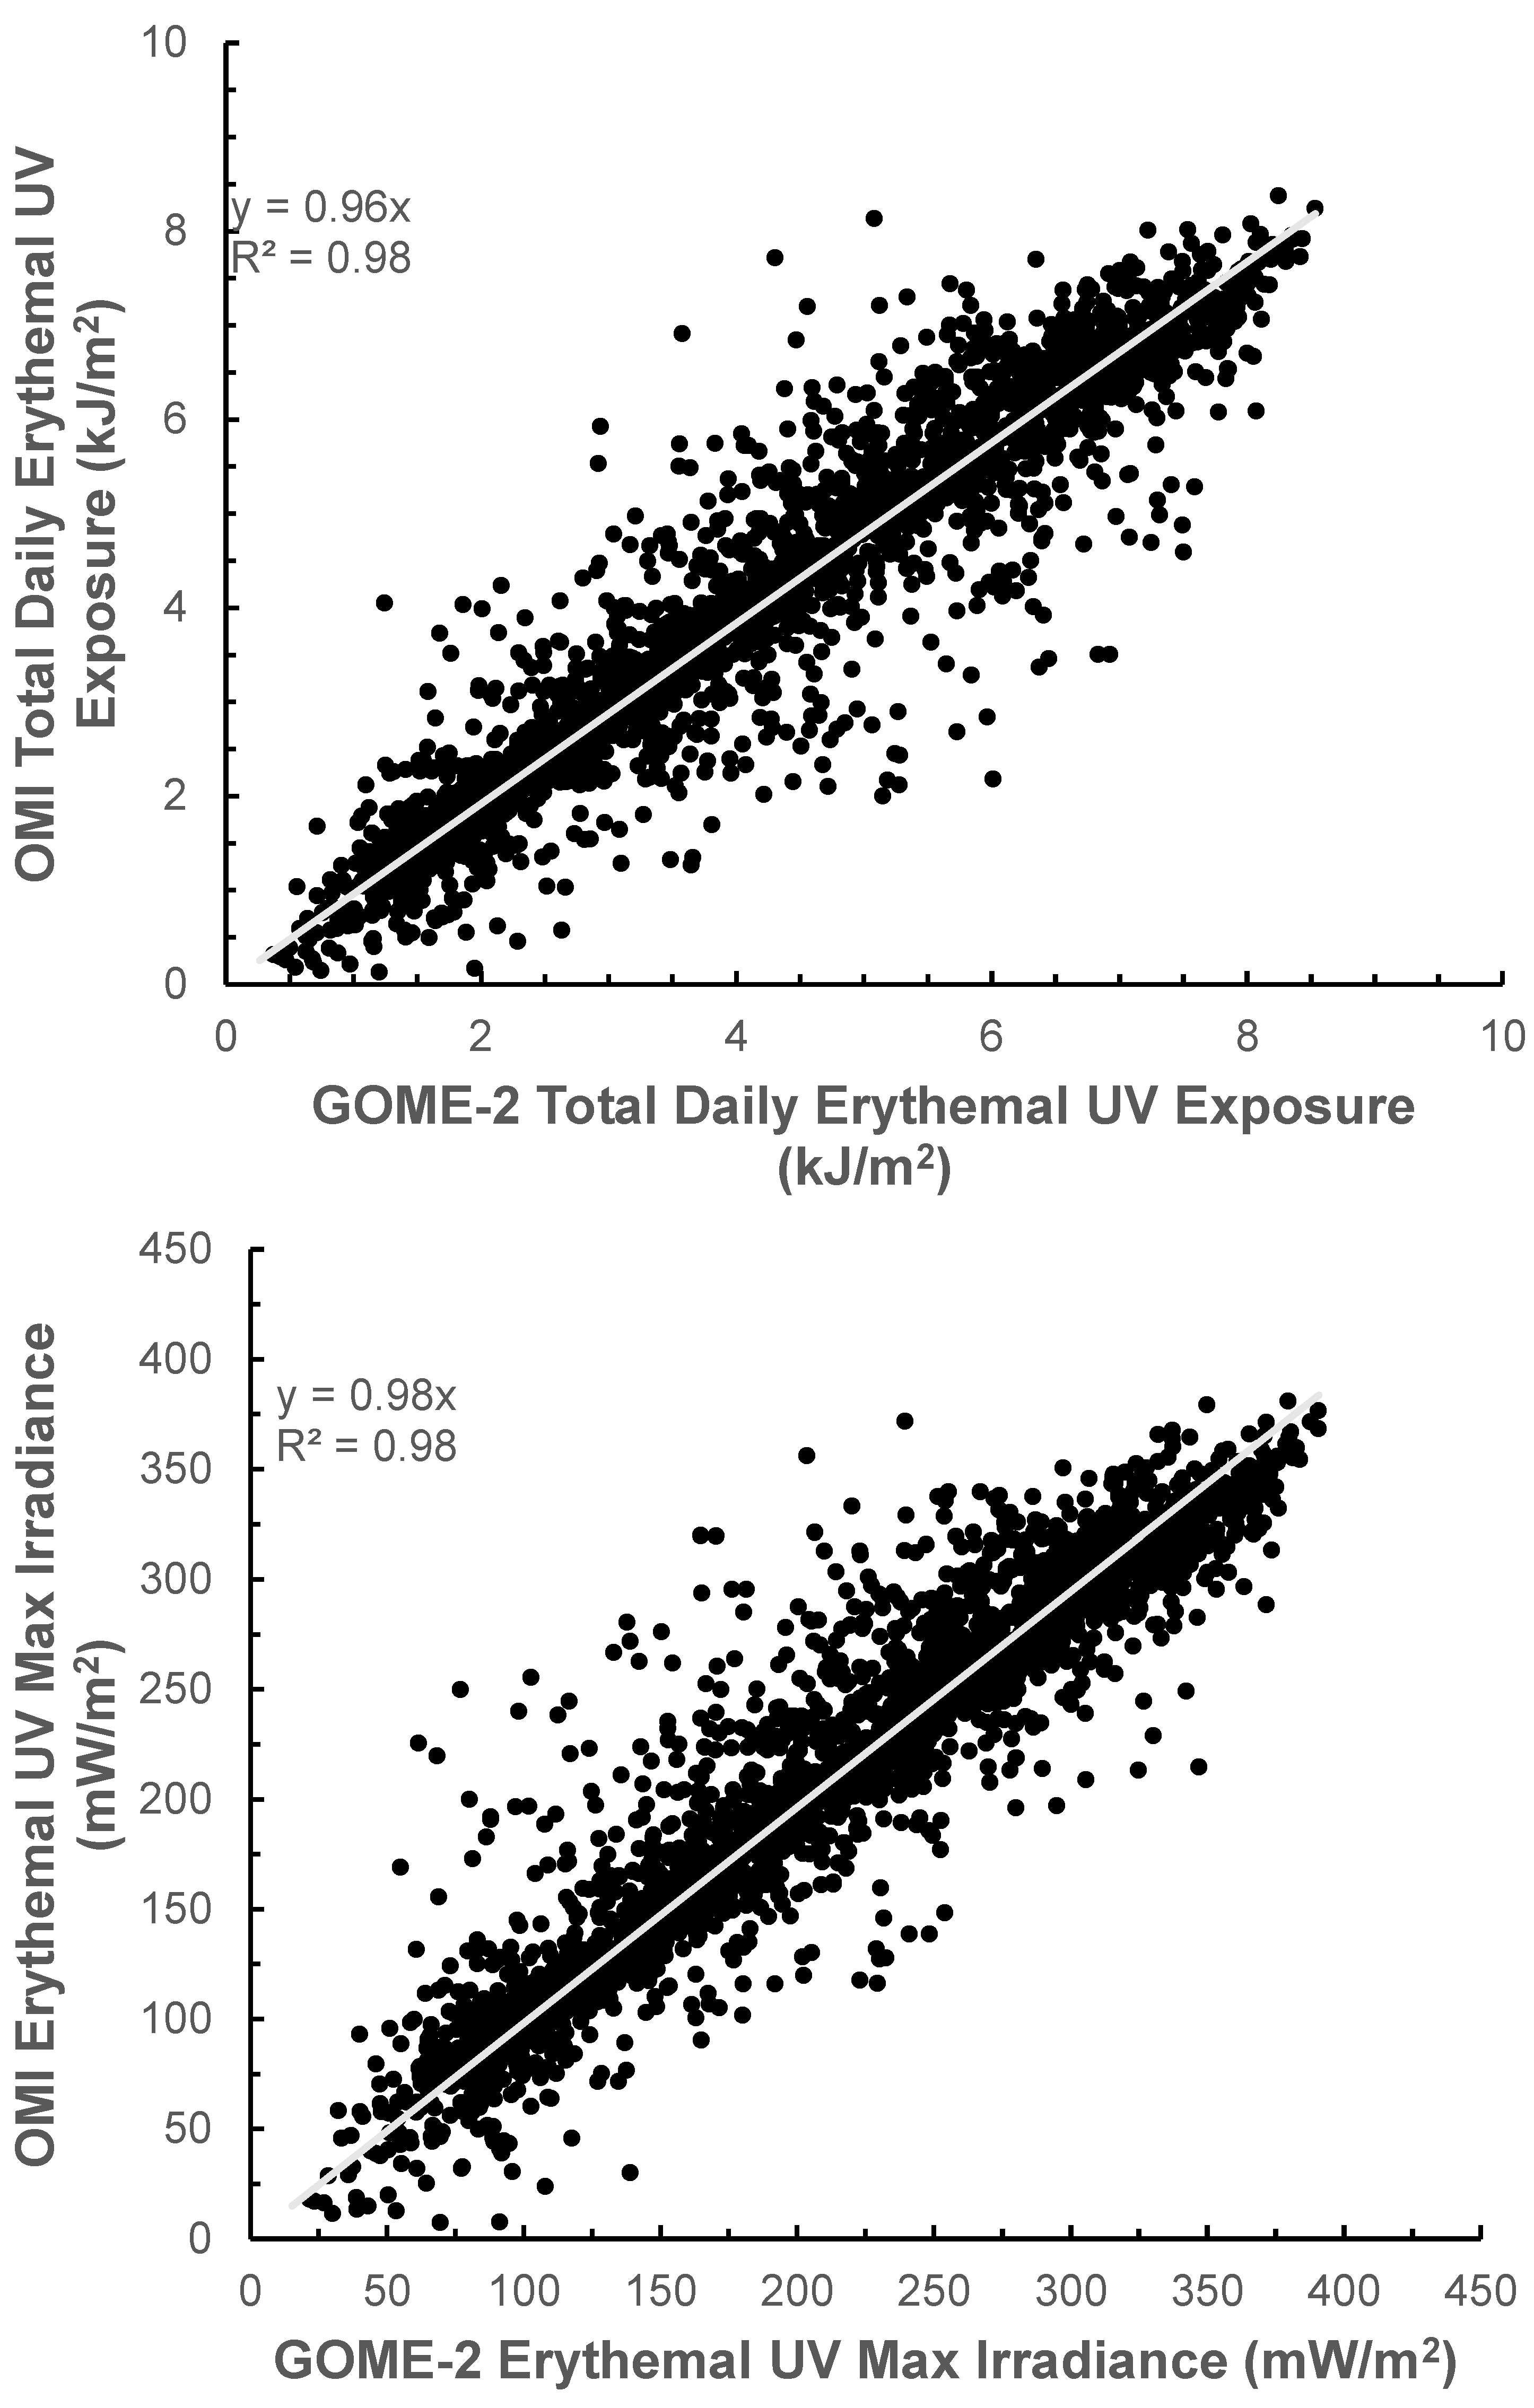
5.2. Evaluation of Total Daily UVA Exposures

The OMI total daily erythemal exposure [10,11] is calculated from the information at the single satellite pass time and assumes the daily irradiance distribution follows a normal trend with no temporal variation in the sampled cloud cover fraction from the cloud cover measurement times. A similar technique has recently been applied to determine the total daily UVA exposure in kJ m−2 under cloud-free atmospheric conditions using the daily OMI spectral irradiance data product [61]. This research initially reconstructed the solar noon (maximum daily) UVA irradiance (320 to 400 nm) from the OMI spectral irradiance I(310), I(324) and I(380) as described in the previous section to derive the daily surface UVA exposure integral assuming a normally distributed exposure profile between sunrise and sunset. Here, the total daily UVA surface exposure, UVATOT, is derived according to:
U V A T O T   E U V A × 3600 × H × 0.55 1000                     k J   m 2
where EUVA is the noontime, UVA irradiance in W m−2 and H is the number of hours from sunrise to sunset. The constant 3600 is included to convert the noon UVA irradiance to an exposure per hour in J m−2, and the constant 0.55 represents the area under a cloud-free normalized daily UVA irradiance profile. The normalized UVA integral of 0.55 was derived by previous research [62] from 186 completely cloud-free normalized daily surface irradiance profiles where each normalized profile ranges in time from 0 to 1 and in irradiance from 0 to 1. Importantly, this research showed this normalized integral of 0.55 to be consistent for cloud-free surface UVA irradiance profiles measured across all seasons for each month in the year at a subtropical latitude. The result that the normalized integral is consistent for the UVA irradiance (derived from 320 to 400 nm) is due to the longer UVA surface wavelengths under cloud-free conditions being independent of total column ozone.
Diffey [63] showed how a similar technique could be used to estimate the total daily erythemally effective exposure integral from the noontime erythemal UVB irradiance, UVery and a normalized exposure integral assuming a normally distributed Gaussian irradiance profile under cloud-free skies where,
U V e r y   U V I 40 × ( 3600 × H ) 2 π 5 / 100                   S E D
In Equation (9), the daily erythema exposure integral is expressed in standard erythema dose (SED) units, the equivalent of 100 J m−2 [64]. This daily exposure is dependent on the maximum noon time erythema UVB expressed in W m−2 (UVI/40), where the UVI is the erythema UVB expressed as a standard UV index. The same constant of 3600 is included as in Equation (8) to convert the noontime irradiance into J m−2 per hour, and again for the entire day where H is the number of daylight hours for a given location on earth. Here, however, the normalized exposure integral is represented by the factor 2 π 5 0.50 where the integral of a Gaussian distribution is a 2 π and a is set to 1/5, accounting for ±2.5 standard deviations over a normal Gaussian domain. It is noteworthy that the effective normalized integral for the daily UVB of 0.50 is less than that derived previously [62] for the UVA cloud-free daily exposure of 0.55. This is because the longer wavelength UVA is less sensitive to Rayleigh’s criterion at low solar elevations and absorption by ozone, which has the effect of tapering the normalized exposure distribution in the UVB at high SZA. As the total available UVA (320 to 400 nm) at the earth’s surface is 20 times greater than the available UVB [65], daily UVA exposure integrals evaluated from the OMI spectral noon time irradiance are much higher than the spectrally weighted erythema UV.

6. Comparison of GOME-2 UVA with Ground-Based Data

An example of the time-series over a year from 1 January 2019 to 31 December 2019 for GOME-2 data [37] of the total daily UVA exposures and the daily maximum UVA irradiance are provided in Figure 3. The x-axis scale with the day number starts at 1 for the 1 January 2019, and the site is the southern hemisphere relatively unpolluted, the subtropical inland regional city of Toowoomba, Australia at 27.6°S, 151.9°E. The cloud-free envelope is evident in both data sets, with any drops below this envelope predominantly due to the cloud.
In contrast to the erythemal UV and the UV index GOME-2 data, a limited number of studies have been reported on validating the GOME-2 UVA irradiance and the UVA exposure data to ground-based measurements. Previous research [66] has compared the UVA data from the GOME-2 satellite over three years to the corresponding ground-based spectroradiometer data for a subtropical southern hemisphere site at Toowoomba, Australia (27.6°S) under all-sky and cloud-free conditions. The study found a strong linear relationship between the maximum daily UVA irradiance and daily total UVA exposures estimated from satellite data and ground-based observations for 98.4% of cloud-free days with an R2 of 0.93 for both sets. The R2 value is also known as the coefficient of determination and was calculated using the trendline function available in the plotting of data using the Microsoft Excel software. It is a number that ranges from 0 to 1, with a trendline being the most reliable fit to the data, the closer the R2 value is to 1. In agreement with previous studies for GOME-2 erythemal UV data [13], there was an overestimation for both daily UVA irradiance and daily UVA exposures compared to ground-based measurements with a relative root-mean-square error (rRMSE) of 0.08 and 0.1, respectively. Similarly, the comparison of all-sky conditions data showed a linear correlation with an R2 of 0.7 and 0.86 for the maximum daily UVA irradiance and total daily UVA exposures, respectively, compared to ground-based measurements [66]. There was also a positive bias for all-sky conditions data as the GOME-2 data were higher than ground-based observations with rRMSE of 0.08 and 0.1 for the maximum daily irradiance and total daily exposures, respectively.
In South Africa, du Preez et al. [67] evaluated satellite UVA and ground-based UVA over a shorter dataset of a one-year period at four sites of Irene (25.91°S), De Aar (30.67°S), Upington (28.48°S) and Stellenbosch (33.93°S). The comparison showed a strong linear correlation in the four sites between the GOME-2 and ground-based data of total daily UVA exposure and daily maximum UVA irradiance. However, the GOME-2 data for both daily UVA exposure and daily maximum UVA irradiance underestimated surface measurements at Irene, De Aar and Upington [67]. The researchers attributed the negative bias of GOME-2 data to factors, such as the resolution of satellite data, The climatologies in the satellite algorithm for aerosols and albedo and the influence of altitude and topography changes. On the other hand, the comparison at the Stellenbosch site was consistent with previous studies for erythemal UV and showed a tendency toward positive bias results in an overestimation of GOME-2 data compared to ground-based radiometer data.
In addition to these comparisons at southern hemisphere sites, a comparison at a high latitude northern hemisphere site of GOME-2 UVA irradiance and exposure data to ground-based measurements were reported at Sodankylä, Finland (67.37°N) [13]. The relative root-mean-square error for the total daily UVA exposures at Sodankylä was 0.24 [34].

7. Comparison of OMI UVA with Ground-Based Data

A series of research papers have reported on the comparison of the OMI-derived atmospheric ozone and the erythemal UV with ground-based measurements (for example, [68,69]). The research that has compared the UVA spectral irradiance from the OMI platform to ground-based spectral measurements is for the OMI-measured UVB wavelengths of 324 nm and 380 nm [6]. Generally, the OMI data have a positive bias compared to the ground-based data at these wavelengths. This positive bias is attributed to the influence of aerosol absorption not taken into account by the OMI algorithm [6]. In an urban environment, the OMI spectral UVA irradiance at 324 nm and 380 nm were compared with the ground-based measurements from a Brewer spectrophotometer [6]. In this research, the OMI values overestimate the ground-based data by 17% and 13%, respectively. Other researchers have compared the OMI UVA irradiance at 324 nm with that from a Brewer spectroradiometer with an OMI-positive bias of 8.7% for cloud-free days [70,71].
In the UVA, previous research [42] has compared the 2009 OMI spectral solar noon UVA satellite data for 324 and 380 nm as well as at the UVB wavelength of 310 nm with the ground-based measurements for a southern hemisphere relatively unpolluted subtropical site. These comparisons were done for cloud-free days and for days with all-sky conditions with an R2 of 0.89 or better for cloud-free days at each wavelength. A comparison at a southern hemisphere site (27.6°S) of the broadband UVA irradiance evaluated for cloud-free days in 2009 from the OMI data at 310 nm, 324 nm and 380 nm to the ground-based UVA radiometer data provided an R2 of 0.86 [42].
This research was then extended to a 12 year period from 2004 to 2016 to evaluate and compare the UVA broadband irradiance evaluated from the 310 nm, 324 nm and 380 nm OMI spectral irradiance to the ground-based UVA radiometer measurements for a subtropical site [41]. This was undertaken for all cloud conditions with cloud in the categories of 0 to 2 octas, > 2 to 4 octas, > 4 to 6 octas and > 6 to 8 octas for the case of the sun not obscured and for the cloud categories of > 2 to 4 octas, > 4 to 6 octas and > 6 to 8 octas the case of the sun obscured. The amount of cloud cover was determined with a ground-based total sky imager (model TSI440, Yankee Environmental Systems, PA, USA) that employs a 160° field of view image of the sky with image analysis to provide the percentage of the sky covered in cloud. The relative mean square errors between the evaluated solar noon UVA irradiance and the corresponding ground-based irradiance for the sun not obscured cases were 18%, 16%, 53% and 25% for the cloud categories of 0 to 2 octas, > 2 to 4 octas, > 4 to 6 octas and > 6 to 8 octas, respectively [41]. Similarly, the rRMSE of the comparisons for the sun obscured cloud categories of > 2 to 4 octas, > 4 to 6 octas and > 6 to 8 octas were 41%, 79% and 68%, respectively. The results show that the UVA solar noon irradiance can be evaluated with an rRMSE of 18% or less from the OMI spectral irradiance at 310 nm, 324 nm and 380 nm for the sun-unobscured cases of up to 4 octa clouds.
The time-series from 1 October 2004 to 31 December 2016 of the solar noon UVA OMI spectral irradiance at 310 nm, 324 nm and 380 nm is plotted on the right-hand axis in Figure 4. The seasonal cycle is evident in these data, along with the influence of the cloud. The data are for a southern hemisphere site at 27.6°S, 151.9°E. The broadband UVA irradiance [41] evaluated from these three sets of spectral irradiance are plotted on the left-hand axis.
The risk of the development of skin cancer and sun-related eye disease is related to cumulative UV exposure. Consequently, the evaluation of total daily UVA exposures is a useful application of the OMI data. Previous research [61] has provided this application of the OMI data employing the method described in Section 5 to evaluate the total daily UVA exposures for the cloud categories of 0 to 2 octas, >2 to 4 octas, >4 to 6 octas and >6 to 8 octas for the case of the sun not obscured and for the cloud categories of >2 to 4 octas, >4 to 6 octas and >6 to 8 octas the case of the sun obscured. Comparison between the total daily UVA exposure evaluated from the OMI spectral irradiance and ground-based instruments at a southern hemisphere site over 2015 and 2016 provided a mean absolute error (MAE) of 84.2 kJ m−2 (10%) for the sun not obscured cloudy days, and 138.8 kJ m−2 (30%) for the sun obscured cloudy days [61]. This methodology allows evaluation of the total daily UVA exposures for all cloud conditions to provide a long-term data series of daily total UVA exposures.

8. Discussion

UV exposure, including the UVA waveband, is a balancing act between the beneficial aspects of these wavebands, and sunlight in general, and exposures that can potentially cause long-term harm. Both cases necessitate a need for a comprehensive understanding and long-term measurement of solar UV [18]. Even though UVA has less potency as a mutagen than UVB, natural sunlight contains considerably more UVA, particularly UVA 1, resulting in an increased dose [18]. However, the precise mechanisms for UVA and UVB pathogenesis are not clearly defined [23]. It is essential to improve the understanding of the solar UVA environment and educate the general public regarding UVA photoprotection [18,19,30], considering the major public health issue involving skin cancer rates [18,19,23].
The instrumentation on satellite platforms measuring in the UVA waveband has been providing solar noon spectral irradiance data at 324 nm and 380 nm since October 2004. This narrowband irradiance data set from OMI has been employed to evaluate the broadband solar noon UVA irradiance, along with the calculation of the UVA waveband total daily exposures. The GOME-2 UVA data are available from June 2009 in the form of the daily maximum irradiance and the total daily exposure. These long-term data sets are vital for research on the health effects of solar UVA radiation on humans and all other forms of life on earth, as well as being necessary for the investigation of any trends due to atmospheric changes and climatological changes.
To facilitate further research and monitoring of the effects of the solar UVA waveband in a range of different environments, it is becoming more important to maintain effective and timely access to accurate observational data. Ground-based observations and measurements have the advantage of providing a greater spatial and temporal resolution of UVA measurements that can be performed relatively inexpensively, such as with the use of smartphones, but these techniques are still in development [72]. However, ground-based measurement and observation instrumentation can become an expense in time and cost [73] that potentially limits the uptake and maintenance of these devices by researchers and research organizations, thus decreasing the potential widespread recording of UVA data at the ground-level. It is therefore imperative for satellite UVA observations to be as accurate and as spatially and temporally resolved as for ground-based measurements to provide complementary UVA exposure data.

9. Conclusions

The unique strength of the OMI and GOME-2 satellite data is the provision of long-term data series on a global scale that are generally on a daily basis provided the satellite instrumentation is operational. The advantage of the OMI data is that it provides a longer-term UV data series dating back to October 2004, whereas the GOME-2 data series dates back to June 2009. Additionally, the OMI data provides the spectral irradiances at two UVA wavelengths and two UVB wavelengths. Potentially, this can allow postprocessing of the data to allow reconstruction of the UV spectrum to allow weighting with the relevant action spectrum to determine the UV irradiance for a particular biological effect. The advantage of the GOME-2 data for the UVA waveband is that it provides additional information on the daily maximum UVA irradiance at solar noon and the total daily UVA exposure. Although not precisely in the UVA waveband, the GOME-2 also provides the daily maximum irradiance and the total daily exposures for the additional action spectra of DNA damage, plant response and vitamin D synthesis and the unweighted UVB. The provision of the total daily UVA exposures and the daily maximum irradiance is a significant advantage as it provides the opportunity for further research on the damaging influences on UVA exposure to humans and plants and animals both on land and in the oceans, as well as to different materials. Furthermore, the GOME-2 data incorporates the cloud data at two times of the day, namely from a satellite morning overpass and a satellite afternoon overpass, whereas the OMI algorithm uses the cloud information from a single satellite overpass. This can improve the accuracy of the cloud data that is used in the calculation to incorporate the influence of the cloud.
Both the OMI and GOME-2 data are freely available for downloading provided there is acknowledgment in any resulting works of the source of the data. The shortcoming of these data is the necessity for validation of the satellite data to ground measured data in order to take into account as far as practical the influencing factors. Additionally, the satellite irradiance data are calculated for solar noon from the information at the time of the satellite overpass, and the incorporation of cloud data in the calculation of the irradiance is the cloud cover recorded at the time of the satellite overpass. Similarly, the calculation of the total daily UVA exposures employs the cloud data from one time of the day and at best two times of the day.
This review has highlighted the necessity for ground-based stations with instrumentation calibrated to national standards in order to provide the data to validate and calibrate the broadband irradiance, the irradiance at specific wavelengths and the total daily exposures. In order to increase the suitability of the data for different applications, future satellite platforms require the availability of the broadband UV irradiance for both the UVB and the UVA wavebands as well as for the erythemal UV waveband and for a number of narrow wavebands. Similarly, the total daily exposures need to be available for these wavebands. In order to improve the accuracy of the satellite-based data, the influence of absorbing aerosols in the boundary layer needs to be taken into account. Furthermore, the accuracy of the total daily exposure data can be improved through the incorporation of more cloud information than is currently employed. The source of this additional cloud information can be either satellite-based or from ground-based platforms. For ground-based platforms, possible sources of regular information are from automated cloud cameras, such as the total sky imagers [74] or whole sky imagers [74]. Although these are only at limited ground sites, expansion of the network of ground-based sky cameras and the provision of the data in real time to the processing of the UVA data from the satellite platform has the capacity to improve the accuracy of total daily exposure data. Additional cloud data from other satellite platforms can also be made available to the processing phase of the UVA instrumentation on satellite platforms. The incorporation of these two cloud data sets will improve the accuracy of the UVA data, particularly for the calculation of the total daily UVA exposures.

Author Contributions

Conceptualization, A.V.P., N.J.D., J.T., D.I. and M.A.A.J.; methodology, A.V.P., D.I., N.J.D., J.T., A.A. and M.A.A.J.; validation, A.V.P., N.J.D., J.T., D.I. and M.A.A.J.; investigation, A.V.P., D.I., N.J.D., J.T., A.A. and M.A.A.J.; resources, A.V.P., N.J.D. and J.T.; writing—original draft preparation, A.V.P., D.I., N.J.D., J.T., A.A. and M.A.A.J.; writing—review and editing, A.V.P., D.I., N.J.D., J.T., A.A. and M.A.A.J.; supervision, A.V.P., N.J.D. and J.T.; project administration, A.V.P. All authors have read and agreed to the published version of the manuscript.

Funding

This research received no external funding.

Institutional Review Board Statement

Not applicable.

Informed Consent Statement

Not applicable.

Data Availability Statement

No new data were created in this study. Data sharing is not applicable to this article.

Acknowledgments

The authors acknowledge the OMI mission scientists and associated NASA personnel for the production of the data used in this research effort. The GOME-2 data were provided by the O3M SAF project of the EUMETSAT.

Conflicts of Interest

The authors declare no conflict of interest.

References

  1. Ialongo, I.; Arola, A.; Kujanpää, J.; Tamminen, J. Use of satellite erythemal UV products in analysing the global UV changes. Atmos. Chem. Phys. 2011, 11, 9649–9658. [Google Scholar] [CrossRef] [Green Version]
  2. Gueymard, C. REST2: High-performance solar radiation model for cloudless-sky irradiance, illuminance, and photosynthetically active radiation–Validation with a benchmark dataset. Sol. Energy 2008, 82, 272–285. [Google Scholar] [CrossRef]
  3. Qin, W.; Wang, L.; Lin, A.; Zhang, M.; Xia, X.; Hu, B.; Niu, Z. Comparison of deterministic and data-driven models for solar radiation estimation in China. Renew. Sustain. Energy Rev. 2018, 81, 579–594. [Google Scholar] [CrossRef]
  4. Qin, W.; Wang, L.; Wei, J.; Hu, B.; Liang, X. A novel efficient broadband model to derive daily surface solar Ultraviolet radiation (0.280–0.400 μm). Sci. Total Environ. 2020, 735, 139513. [Google Scholar] [CrossRef]
  5. Qin, W.; Wang, L.; Gueymard, C.A.; Bilal, M.; Lin, A.; Wei, J.; Zhang, M.; Yang, X. Constructing a gridded direct normal irradiance dataset in China during 1981–2014. Renew. Sustain. Energy Rev. 2020, 131, 110004. [Google Scholar] [CrossRef]
  6. Kazadzis, S.; Bais, A.; Arola, A.; Krotkov, N.; Kouremeti, N.; Meleti, C. Ozone Monitoring Instrument spectral UV irradiance products: Comparison with ground-based instruments at an urban environment. Atmos. Chem. Phys. 2009, 9, 585–594. [Google Scholar] [CrossRef] [Green Version]
  7. Herman, J.R.; Krotkov, N.; Celarier, E.; Larko, D.; Labow, G. Distribution of UV radiation at the Earth’s surface from TOMS-measured UV-backscattered radiances. J. Geophys. Res. 1999, 104, 12059–12076. [Google Scholar] [CrossRef]
  8. Udelhofen, P.M.; Gies, P.; Roy, C.; Randel, W.J. Surface UV radiation over Australia, 1979-1992: Effects of ozone and cloud cover changes on variations of UV radiation. J. Geophys. Res. 1999, 104, 19135–19159. [Google Scholar] [CrossRef]
  9. Earthdata, GIOVANNI. Available online: https://giovanni.gsfc.nasa.gov/giovanni/ (accessed on 21 September 2020).
  10. Tanskanen, A.; Krotkov, N.; Herman, J.; Arola, A. Surface ultraviolet irradiance from OMI. IEEE Trans. Geosci. Remote Sens. 2006, 44, 1267–1271. [Google Scholar] [CrossRef]
  11. Tanskanen, A.; Lindfors, A.; Määttä, A.; Krotkov, N.; Herman, J.; Kaurola, J.; Koskela, T.; Lakkala, K.; Fioletov, V.; Bernhard, G.; et al. Validation of daily erythemal doses from Ozone Monitoring Instrument with ground-based UV measurement data. J. Geophys. Res. 2007, 112, D24S44. [Google Scholar] [CrossRef] [Green Version]
  12. GOME-2/MetOp. Available online: https://atmos.eoc.dlr.de/app/missions/gome2 (accessed on 12 December 2020).
  13. Kalakoski, N. O3M SAF Validation Report. Available online: http://o3msaf.fmi.fi/docs/vr/Validation_Report_OUV_Feb_2009.pdf (accessed on 16 September 2020).
  14. Mateos, D.; Bilbao, J.; Kudish, A.; Parisi, A.V.; Carbajal, G.; di Sarra, A.; Román, R.; de Miguel, A. Validation of OMI satellite erythemal daily dose retrievals using ground-based measurements from fourteen stations. Remote Sens. Environ. 2013, 128, 1–10. [Google Scholar] [CrossRef] [Green Version]
  15. Bernhard, G.; Arola, A.; Dahlback, A.; Fioletov, V.; Heikkilä, A.; Johnsen, B.; Koskela, T.; Lakkala, K.; Svendby, T.; Tamminen, J. Comparison of OMI UV observations with ground-based measurements at high northern latitudes. Atmos. Chem. Phys. 2015, 15, 7391–7412. [Google Scholar] [CrossRef] [Green Version]
  16. Antón, M.; Román, R.; Valenzuela, A.; Olmo, F.J.; Alados-Arboledas, L. Direct-sun total ozone data from a Bentham spectroradiometer: Methodology and comparison with satellite observations. Atmos. Chem. Tech. Discuss. 2012, 5, 8131–8160. [Google Scholar] [CrossRef]
  17. Parisi, A.V.; Sabburg, J.; Kimlin, M.G. Scattered and Filtered Solar UV Measurements; Kluwer Academic Publishers: Dordrecht, The Netherlands, 2004. [Google Scholar]
  18. Coelho, S.G.; Rua, D.; Miller, S.A.; Agrawal, A. Suboptimal UVA attenuation by broad spectrum sunscreens under outdoor solar conditions contributes to lifetime UVA burden. Photodermatol. Photoimmunol. Photomed. 2020, 36, 42–52. [Google Scholar] [CrossRef] [PubMed]
  19. Holick, M.F. Biological effects of sunlight, ultraviolet radiation, visible light, infrared radiation and vitamin D for health. Anticancer Res. 2016, 36, 1345–1356. [Google Scholar]
  20. CIE (International Commission on Illumination). Standardization of the terms UV-A1, UV-A2 and UV-B. CIE collection in Photobiology and Photochemistry. 1999. CIE TC 6-26. Available online: http://cie.co.at/publications/cie-collection-photobiology-photochemistry-1999 (accessed on 18 February 2021).
  21. Diffey, B. What is light? Photodermatol. Photoimmunol. Photomed. 2002, 18, 68–74. [Google Scholar] [CrossRef] [PubMed]
  22. Garnacho Saucedo, G.M.; Vellejo, R.S.; Giménez, J.C.M. Effects of solar radiation and an update on photoprotection. Anales de Pediatría 2020, 92, 377-e1. [Google Scholar]
  23. Khan, A.Q.; Travers, J.B.; Kemp, M.G. Roles of UVA radiation and DNA damage responses in melanoma pathogenesis. Environ. Mol. Mutagen. 2018, 59, 438–460. [Google Scholar] [CrossRef] [PubMed]
  24. Igoe, D.; Parisi, A.V. Evaluation of a smartphone sensor to broadband and narrowband ultraviolet A radiation. Instrum. Sci. Techol. 2015, 43, 283–289. [Google Scholar] [CrossRef]
  25. Kammayer, A.; Luiten, R.M. Oxidation events and skin aging. Ageing Res. Rev. 2015, 21, 16–29. [Google Scholar] [CrossRef]
  26. Marrionet, C.; Pierrard, C.; Golebiewski, C.; Bernerd, F. Diversity of biological effects induced by longwave UVA rays (UVA1) in reconstructed skin. PLoS ONE. 2014, 9, e105263. [Google Scholar] [CrossRef] [Green Version]
  27. Tewari, A.; Grage, M.M.L.; Harrison, G.I.; Sarkany, R.; Young, A.R. UVA1 is skin deep: Molecular and clinical implications. Photochem. Photobiol. Sci. 2013, 12, 95–103. [Google Scholar] [CrossRef]
  28. Edstrom, D.; Porwit, A.; Ros, A. Effects on human skin of repetitive ultraviolet A1 (UVA1) irradiation and visible light. Photodermatol. Photoimmunol. Photomed. 2001, 17, 66–70. [Google Scholar] [CrossRef] [PubMed]
  29. Mallet, J.D.; Rochette, P.J. Wavelength-dependent ultraviolet inductions of cyclobutene pyrimidine dimers in the human cornea. Photochem. Photobiol. Sci. 2013, 12, 1310–1318. [Google Scholar] [CrossRef] [PubMed]
  30. Agar, N.S.; Halliday, G.M.; Barnetson, R.; Ananthaswamy, H.N.; Wheeler, M.; Jones, A.M. The basal layer in human squamous tumors harbours more UVA than UVB fingerprint mutations: A role for UVA in skin carcinogenesis. Proc. Nat. Acad. Sci. USA 2004, 101, 4954–4959. [Google Scholar] [CrossRef] [Green Version]
  31. CIE (International Commission on Illumination). Action Spectrum for the Production of Previtamin D3 in Human Skin. 2006. CIE 174:2006. Available online: http://cie.co.at/publications/action-spectrum-production-previtamin-d3-human-skin (accessed on 18 February 2021).
  32. Parisi, A.V.; Turnbull, D.J.; Kimlin, M.G. Dosimetric and spectroradiometric investigations of glass filtered solar UV. Photochem Photobiol. 2007, 83, 777–781. [Google Scholar] [CrossRef]
  33. EUMETSAT, Metop, Available online:. Available online: https://www.eumetsat.int/metop (accessed on 13 December 2020).
  34. Hassinen, S.; Hovila, J.; Kalakoski, N.; Kauppi, A.; Kujanpää, J.; Tamminen, J.; Stammes, P.; Tilstra, L.; Balis, D.; Koukouli, M. Overview of the O3M SAF GOME-2 operational atmospheric composition and UV radiation data products and data availability. Atmos. Meas. Tech. 2016, 9, 383–407. [Google Scholar] [CrossRef] [Green Version]
  35. Kujanpää, J.; Kalakoski, N. Surface UV product from GOME-2 and AVHRR/3. Atmos. Meas. Tech. Discuss. 2015, 8, 4537–4580. [Google Scholar] [CrossRef]
  36. ESA Earth Online. GOME Instrument. Available online: https://earth.esa.int/web/guest/missions/esa-operational-eo-missions/ers/instruments/gome (accessed on 21 September 2020).
  37. EUMETSAT AC SAF (Atmospheric Composition Monitoring). Welcome to AC SAF/FMI Ordering Server. Available online: https://safserver.fmi.fi) (accessed on 6 February 2021).
  38. Munro, R.; Lang, R.; Klaes, D.; Poli, G.; Retscher, C.; Lindstrot, R.; Huckle, R.; Lacan, A.; Grzegorski, M.; Holdak, A.; et al. The GOME-2 instrument on the Metop series of satellites: Instrument design, calibration, and level 1 data processing—An overview. Atmos. Meas. Tech. 2016, 9, 1279–1301. [Google Scholar] [CrossRef] [Green Version]
  39. Kujanpää, J. Algorithm Theoretical Basis Document, Offline UV (OUV) Products. Available online: http://o3msaf.fmi.fi/docs/atbd/Algorithm_Theoretical_Basis_Document_OUV_Jun_2013.pdf (accessed on 2 December 2020).
  40. Stammes, P. OMI Algorithm Theoretical Basis Document Volume III Clouds, Aerosols and Surface UV Irradiance. Available online: https://eospso.gsfc.nasa.gov/sites/default/files/atbd/ATBD-OMI-03.pdf (accessed on 1 November 2020).
  41. Jebar, M.A.A.; Parisi, A.V.; Downs, N.J.; Turner, J. Evaluated UVA irradiances over a twelve year period at a sub-tropical site from Ozone Monitoring Instrument data including the influence of cloud. Photochem. Photobiol. 2018, 94, 1281–1288. [Google Scholar] [CrossRef] [PubMed]
  42. Jebar, M.A.A.; Parisi, A.V.; Downs, N.J.; Turner, J. Validation of Ozone Monitoring Instrument UV satellite data using spectral and broadband surface based measurements at a Queensland site. Photochem. Photobiol. 2017, 93, 1289–1293. [Google Scholar] [CrossRef] [PubMed] [Green Version]
  43. Krotkov, N.; Bhartia, P.; Herman, J.; Fioletov, V.; Kerr, J. Satellite estimation of spectral surface UV irradiance in the presence of tropospheric aerosols: 1. Cloud-free case. J. Geophys. Res. Atmos. 1998, 103, 8779–8793. [Google Scholar] [CrossRef] [Green Version]
  44. Torres, O.; Tanskanen, A.; Veihelmann, B.; Ahn, C.; Braak, R.; Bhartia, P.K.; Veefkind, P.; Levelt, P. Aerosols and surface UV products from Ozone Monitoring Instrument observations: An overview. J. Geophys. Res. Atmos. 2007, 112. [Google Scholar] [CrossRef] [Green Version]
  45. Krotkov, N.; Herman, J.; Bhartia, P.K.; Seftor, C.; Arola, A.; Kaurola, J.; Taalas, P.; Vasilkov, A. OMI Surface Irradiance Algorithm. In OMI Algorithm Theoretical Basis Document Volume III; Stammes, P., Ed.; 2002; pp. 72–108. Available online: https//projects.knmi.nl/omi/documents/data/OMI_ATBD_Volume_3_V2.pdf (accessed on 1 December 2020).
  46. Krotkov, N.A.; Barthia, P.K.; Herman, J.R.; Slusser, J.; Scott, G.; Labow, G.; Vasilkov, A.P.; Eck, T.F.; Dubovik, O.; Holben, B.N. Aerosol ultraviolet absorption experiment (2000 to 2004), part 2: Absorption optical thickness, refractive index, and single scattering albedo. Opt. Eng. 2005, 44, 041005. [Google Scholar] [CrossRef]
  47. Arola, A.; Kazadzis, S.; Lindfors, A.; Krotkov, N.A.; Kujanpä, J.; Tamminen, J. A new approach to correct for absorbing aerosols in OMI UV. Geophys. Res. Lett. 2009, 36, L22805. [Google Scholar] [CrossRef]
  48. Antón, M.; Valenzuela, A.; Román, R.; Lyamani, H.; Krotkov, N.; Arola, A.; Olmo, F.J.; Alados-Arboledas, L. Influence of desert dust intrusions on ground-based and satellite-derived ultraviolet irradiance in southeastern Spain. J. Geophys. Res. 2012, 117, D19209. [Google Scholar] [CrossRef] [Green Version]
  49. Kujanpää, J.; Kalakoski, N. Operational surface UV radiation product from GOME-2 and AVHRR/3 data. Atmos. Meas. Tech. 2015, 8, 4399–4414. [Google Scholar] [CrossRef] [Green Version]
  50. Tilstra, L.G.; Tuinder, O.N.; Stammes, P. GOME-2 Absorbing Aerosol Index: Statistical analysis, comparison to GOME-1 and impact of instrument degradation. In Proceedings of the 2010 EUMETSAT Meteorological Satellite Conference, Cordoba, Spain, 20–23 September 2010; p. 57. [Google Scholar]
  51. Kujanpää, J. Algorithm Theoretical Basis Document, Offline UV Products and Data Record R1. Available online: https://acsaf.org/docs/atbd/Algorithm_Theoretical_Basis_Document_OUV_May_2019.pdf (accessed on 1 October 2020).
  52. Levelt, P.F.; Hilsenrath, E.; Leppelmeier, G.W.; van den Oord, G.H.J.; Bhartia, P.K.; Tamminen, J.; de Haan, J.F.; Veefkind, J.P. Science objectives of the Ozone Monitoring Instrument. IEEE Trans. Geosci. Remote Sens. 2006, 44, 1199–1208. [Google Scholar] [CrossRef]
  53. Den Outer, P.N.; van Dijk, A.; Slaper, H.; Validation of Ultraviolet Radiation Budgets Using Satellite Observations from the OMI Instrument. RIVM Report 610002002/008, Netherlands Agency for Aerospace Programmes (NIVR). Available online: https://rivm.openrepository.com/bitstream/handle/10029/257333/610002002.pdf?sequence=3 (accessed on 30 October 2020).
  54. Weihs, P.; Blumthaler, M.; Rieder, H.E.; Kreuter, A.; Simic, S.; Laube, W.; Schmalwieser, A.W.; Wagner, J.E.; Tanskanen, A. Measurement of UV irradiance within the area of one satellite pixel. Atmos. Chem. Phys. 2008, 8, 5615–5626. [Google Scholar] [CrossRef] [Green Version]
  55. Janjai, S.; Wisitsirikun, S.; Buntoung, S.; Pattarapanitchai, S.; Watten, R.; Masiri, I.; Bhattarai, B.K. Comparsion of UV index from Ozone Monitoring Instrument (OMI) with multi-channel filter radiometers at four sites in the tropics: Effects of aerosols and clouds. Int. J. Climatol. 2013, 32, 435–461. [Google Scholar] [CrossRef]
  56. Herman, J.; Cede, A.; Huang, L.; Ziemke, J.; Torres, O.; Krotkov, N.; Kowalewski, M.; Blank, K. Global distribution and 14-year changes in erythemal irradiance, UV atmospheric transmission, and total column ozone from 2005–2018 estimated form OMI and EPIC observations. Atmos. Chem. Phys. 2020, 20, 8351–8380. [Google Scholar] [CrossRef]
  57. Anav, A.; Rafanenlli, C.; Di Menno, I.; Di Menno, M. An algorithm to evaluate solar irradiance and effective dose rates using spectral UV irradiance at four selected wavelengths. Rad. Prot. Dos. 2004, 111, 239–250. [Google Scholar] [CrossRef]
  58. Igoe, D.P.; Parisi, A.V. Broadband direct UVA irradiance measurement for clear skies evaluated using a smartphone. Rad. Prot. Dos. 2015, 167, 485–489. [Google Scholar] [CrossRef] [Green Version]
  59. Grant, R.; Slusser, J.R. Estimation of UV-A irradiance from measurements of 368-nm spectral irradiance. J. Atmos. Ocean Technol. 2005, 22, 1853–1863. [Google Scholar] [CrossRef]
  60. Piervitali, E.; Benedetti, E.; Damini, A.; Rafanelli, C.; Di Menno, I.; Casu, G.; Malaspina, F.; Anav, A.; Di Menno, M. Evaluation of Environmental UV Doses by Empirical WL4UV Model and Multichannel Radiometer. In Proceedings of the SPIE 5886, Ultraviolet Ground- and Space-Based Measurements, Models and Effects; Bernhard, V.G., Slusser, J.R., Herman, J.R., Gao, W., Eds.; SPIE: Bellingham, WA, USA, 2005; pp. 251–259. [Google Scholar]
  61. Jebar, M.A.; Parisi, A.V.; Downs, N.J.; Turner, J. Influence of clouds on OMI satellite total daily UVA exposure over a 12-year period at a Southern Hemisphere site. Int. J. Remote Sensing. 2020, 41, 272–283. [Google Scholar] [CrossRef]
  62. Jebar, M.A. Development and Validation of a Novel Approach for Evaluation of Broadband UVA Irradiance and Total Daily UVA Exposures from ONI Satellite Data. PhD Thesis, University of Southern Queensland, Toowoomba, Australia, 2019. [Google Scholar]
  63. Diffey, B.L. A simple technique for estimating daily ambient erythemal ultraviolet from the ultraviolet index. Photodermatol. Photoimmunol. Photomed. 2009, 25, 227–229. [Google Scholar] [CrossRef] [PubMed]
  64. CIE (International Commission on Illumination). Erythema Reference Action Spectrum and Standard Erythema Dose. CIE S 007/E-1998, Vienna, Austria. Available online: http://cie.co.at/publications/erythema-reference-action-spectrum-and-standard-erythema-dose-0 (accessed on 18 February 2021).
  65. Kollias, N.; Ruvolo, E.; Sayre, R.M. The value of the ratio of UVA to UVB in sunlight. Photochem. Photobiol. 2011, 87, 1474–1475. [Google Scholar] [CrossRef] [PubMed]
  66. Parisi, A.V.; Downs, N.; Turner, J.; King, R. Comparison of GOME-2 UVA satellite data to ground-based spectroradiometer measurements at a sub-tropical site. IEEE Trans. Geosci. Remote Sens. 2017, 55, 3145–3149. [Google Scholar] [CrossRef]
  67. du Preez, D.J.; Parisi, A.V.; Millar, D.A.; Bencherif, H.; Wright, C.Y. Comparison of GOME-2 UVA satellite data to ground-based UVA measurements in South Africa. Photochem. Photobiol. 2020, 96, 1342–1349. [Google Scholar] [CrossRef] [PubMed]
  68. Zempila, M.M.; Fountoulakis, I.; Taylor, M.; Kazadzis, S.; Arola, A.; Koukouli, M.E.; Bais, A.; Meleti, C.; Balis, D. Validation of OMI erythemal doses with multi-sensor ground-based measurements in Thessaloniki, Greece. Atmos. Environ. 2018, 183, 106–121. [Google Scholar] [CrossRef] [Green Version]
  69. Silva, A.A. Local cloud cover, ground-based and satellite measurements of erythemal dose rate for an urban, tropical site in Southern Hemisphere. J. Atmos. Sol. Terr. Phys. 2011, 73, 2474–2481. [Google Scholar] [CrossRef]
  70. Antón, M.; Cachorro, V.E.; Vilaplana, J.M.; Toledano, C.; Krotkov, N.A.; Arola, A.; Serrano, A.; de la Morena, B. Comparison of UV irradiances from Aura/Ozone Monitoring Instrument (OMI) with Brewer measurements at El Arenosillo (Spain)—Part 1: Analysis of parameter influence. Atmos. Chem. Phys. 2010, 10, 5979–5989. [Google Scholar] [CrossRef] [Green Version]
  71. Cachorro, V.E.; Toledano, C.; Antón, M.; Berjon, A.; de Frutos, A.; Vilaplana, J.M.; Arola, A.; Krotkov, N.A. Comparison of UV irradiances from Aura/Ozone Monitoring Instrument (OMI) with Brewer measurements at El Arenosillo (Spain)—Part 2: Analysis of site aerosol influence. Atmos. Chem. Phys. 2010, 10, 16385–16423. [Google Scholar] [CrossRef]
  72. Turner, J.; Igoe, D.P.; Parisi, A.V.; McGonigle, A.J.; Amar, A.; Wainwright, L. A review on the ability of smartphones to detect ultraviolet (UV) radiation and their potential to be used in UV research and for public education purposes. Sci. Total Environ. 2020, 706, 135873. [Google Scholar] [CrossRef] [PubMed]
  73. Gies, P.; van Deventer, E.; Green, A.C.; Sinclair, C.; Tinker, R. Review of the Global Solar UV Index 2015 Workshop Report. Health Phys. 2018, 114, 84–90. [Google Scholar] [CrossRef] [Green Version]
  74. Long, C.N.; Sabburg, J.; Calbó, J.; Pagès, D. Retrieving cloud characteristics from ground-based daytime color all-sky images. J. Atmos. Ocean Technol. 2006, 23, 633–652. [Google Scholar] [CrossRef] [Green Version]
Figure 1. Simplified schematic of the solar ultraviolet (UV) penetration into human skin.
Remotesensing 13 00752 g001
Figure 2. Comparison of the UV data from the two satellites over the date range of 1 June 2009 to 1 February 2021. The top panel provides the comparison of the total daily erythemal UV exposures, and the bottom panel provides the comparison of the daily erythemal UV maximum irradiance.
Remotesensing 13 00752 g002
Figure 3. Example of the time-series for a year of GOME-2 data [37] at a southern hemisphere site (27.6°S, 151.9°E) for (a) the total daily UVA (315–400 nm) exposures and (b) the maximum UVA irradiances for each day. The range of the data is from 1 January 2019 to 31 December 2019.
Remotesensing 13 00752 g003
Figure 4. Time-series from 1 October 2004 to 31 December 2016 of the solar noon UVA OMI spectral irradiance at 310 nm (yellow points), 324 nm (gray points) and 380 nm (red points) plotted on the right-hand axis [41]. The data are for a southern hemisphere site (27.6°S, 151.9°E). These three sets of spectral irradiance were employed to evaluate the broadband UVA irradiance (black points) plotted on the left-hand axis.
Remotesensing 13 00752 g004
Table 1. Comparison of the ozone monitoring instrument (OMI) and global ozone monitoring experiment (GOME-2) satellite platforms and data products for the ultraviolet A (UVA) waveband [1,9,10,11,33,34,37].
OMIGOME-2
SatelliteNASA EOS Aura spacecraftMetop-A, Metop-B and Metop-C
Altitude705 km800 to 850 km
OrbitSun-synchronous polar orbitSun-synchronous polar orbit
Overpass time1.45 pm local time9.30 am local time
Pixel size at nadir13 km × 24 km80 km × 40 km
Swath width2600 km1920 for Metop-B
960 km for Metop-A
Measurement waveband270 nm to 500 nm240 nm to 790 nm
Data websiteNASA GIOVANNI [9]EUMETSAT AC SAF [37]
Data start dateOctober 2004June 2009
UVA spectral productsSolar noon 324 nm irradiance
Solar noon 380 nm irradiance
nil
UVA broadband productsnilTotal daily UVA (315–400 nm) exposure
Maximum UVA irradiance
Publisher’s Note: MDPI stays neutral with regard to jurisdictional claims in published maps and institutional affiliations.

