Article

Spatial Variability and Temporal Heterogeneity of Surface Urban Heat Island Patterns and the Suitability of Local Climate Zones for Land Surface Temperature Characterization

1
Centre for Climate-Resilient and Low-Carbon Cities, School of Architecture and Urban Planning, Chongqing University, Chongqing 400045, China
2
Key Laboratory of New Technology for Construction of Cities in Mountain Area, Ministry of Education, Chongqing University, Chongqing 400045, China
3
Institute of Atmospheric Environment, China Meteorological Administration, Shenyang 110166, China
4
Graduate School of Humanities and Social Science, Graduate School of Advances Science and Engineering, Network for Education and Research on Peace and Sustainability (NERPS), Hiroshima University, Higashi Hiroshima 739-8530, Japan
5
Institute of Applied Ecology, Chinese Academy Sciences, Shenyang 110016, China
*
Author to whom correspondence should be addressed.
Remote Sens. 2021, 13(21), 4338; https://doi.org/10.3390/rs13214338
Submission received: 26 September 2021 / Revised: 18 October 2021 / Accepted: 20 October 2021 / Published: 28 October 2021
(This article belongs to the Topic Climate Change and Environmental Sustainability)

Abstract

:
This study investigated monthly variations of surface urban heat island intensity (SUHII) and the applicability of the local climate zones (LCZ) scheme for land surface temperature (LST) differentiation within three spatial contexts, including urban, rural and their combination, in Shenyang, China, a city with a monsoon-influenced humid continental climate. The monthly SUHII and LST of Shenyang were obtained through 12 LST images, with one in each month (within the period between 2018 and 2020), retrieved from the Thermal InfraRed Sensor (TIRS) 10 in Landsat 8 based on a split window algorithm. Non-parametric analysis of Kruskal-Wallis H test and a multiple pairwise comparison were adopted to investigate the monthly LST differentiations with LCZs. Overall, the SUHII and the applicability of the LCZ scheme exhibited spatiotemporal variations. July and August were the two months when Shenyang underwent strong heat island effects. Shenyang underwent a longer period of cool than heat island effects, occurring from November to May. June and October were the transition months of cool–heat and heat–cool island phenomena, respectively. The SUHII analysis was dependent on the definition of urban and rural boundaries, where a smaller rural buffering zone resulted in a weaker SUHI or surface urban cool island (SUCI) phenomenon and a larger urban area corresponded to a weaker SUHI or SUCI phenomenon as well. The LST of LCZs did not follow a fixed order, where in July and August, the LCZ-10 (Heavy industry) had the highest mean LST, followed by LCZ-2 (Compact midrise) and then LCZ-7 (Lightweight low-rise). In comparison, LCZ-7, LCZ-8 (Large low-rise) and LCZ-9 (Sparsely built) had the highest LST from October to May. The LST of LCZs varied with urban and rural contexts, where LCZ-7, LCZ-8 and LCZ -10 were the three built LCZs that had the highest LST within urban context, while LCZ-2, LCZ-3 (Compact low-rise), LCZ-8, LCZ-9 and LCZ-10 were the five built LCZs that had the highest LST within rural context. The suitability of the LCZ scheme for temperature differentiation varied with the month, where from July to October, the LCZ scheme had the strongest capability and in May, it had the weakest capability. Urban context also made a difference to the suitability, where compared with the whole study area (the combination of urban and rural areas), the suitability of built LCZs in either urban or rural contexts weakened. Moreover, the built LCZs had a higher level of suitability in an urban context compared with a rural context, while the land-cover LCZs within rural had a higher level of suitability.

1. Introduction

Cities are already the main human settlements since global urban population exceeded rural population in 2007, and about 68% of the world population is projected to live in cities by 2050 [1]. The increasing urbanization trend has brought a variety of challenges to cities, such as urban climate change, limited access to open and public spaces, low-quality housing conditions and constrained access to public transport [2]. One of the most acknowledged urban climate change phenomena is the urban heat island (UHI) effect, referring to the fact that cities are warmer than their surrounding suburban or rural areas [3,4]. Addressing the UHI effect is critical considering its significant impacts on urban systems, citizens’ living and ecosystems [5]. Many studies have revealed that urban warming leads to an increase in energy and water consumption for cooling [6,7], deteriorates outdoor thermal comfort and air quality [8], and thereby results in an increase in mortality and morbidity [9]. What is worse, the heat-induced impacts can be more severe because of the interaction of UHI and heat waves that are getting more frequent, longer and more severe along with global warming [10,11].
An accurate measurement, assessment and identification of UHI effects is essential for the better communication of urban climate knowledge to urban planners and decision makers [12]. Understanding surface UHI (SUHI) effects based on land surface temperature (LST) and its associated drivers has been an important theme to achieve this, apart from studies on the canopy UHI effects [13]. Many studies have adopted SUHI intensity (SUHII), an important indicator that has significant implications for land use and land cover change changes [14,15], energy demand [16] and urban living suitability [17], to measure SUHI effects, and examined the drivers of SUHII variations. For instance, Peng, Piao [18] examined the UHII of 419 cities around the world, pointing out that average annual daytime SUHII was higher than the nighttime one and the driving factors for the daytime and nighttime ones were different. Li et al. [19] analyzed the SUHI effects of Berlin based on several hypothesized scenarios and pointed out that SUHII was affected by city size, urban density and compactness. Liu et al. [15] further analyzed the SUHI of 1288 urban clusters in China, concluding that the daytime SUHII was also more prominent than nighttime one and the SUHII was a function of urban size, shape, centrality and background conditions.
UHII calculation is a relative value of urban–rural/suburban temperature differences according to its original definition, implying that the UHII can be sensitive to the selection of urban and rural/suburban sites [20]. On the one hand, the LST in cities is strongly associated with land use/land cover (LULC), where LST of buildings and roads could be up to 10 °C higher than that of water bodies and grass land and the locations of different LULCs in both radial and circumferential directions influence the LST [21,22,23]. Moreover, urban artificial landscapes exhibit a high degree of heterogeneity, making it difficult to accurately choose urban sites for SUHI assessment. On the other hand, the determination of representative rural sites is also important considering the different ecosystems of the rural surface properties [24]. For instance, Peng et al. [18] assessed the sensitivity of UHII to the suburban areas in Beijing, suggesting that SUHII could have a similar magnitude when the suburban areas were 50%, 100% and 150% of the urban areas. These results may indicate that the suburban/rural sites should be at least at the suburban ring–buffer zone border of the 50% of the urban areas. Liu et al. [15] found that the sensitivity of SUHII to the rural sites decreased with the increase of ex-urban distance or area, implying that an arbitrary selection of rural sites could under-estimate SUHII magnitude [15,18].
To overcome such challenges in urban climate studies, the identification of the homogeneity and heterogeneity of local morphology has been prioritized as an important approach [25,26,27], among which, the local climate zones (LCZ) scheme was proposed by Stewart and Oke [20] to standardize surface structure and cover description and thereby standardize urban and suburban/rural sites for temperature comparisons. The LCZ scheme has been widely adopted as an objective framework to analyze intra-urban temperature differences in numerous cities such as Berlin [28], Dublin [29], Hong Kong [30], Nagpur [31], Nairobi [32], Olomouc [33], Shanghai [34], Vancouver [35] across various continents [36,37,38,39]. Overall, the LCZ scheme that is comprised of 10 built types and seven land cover types indicates that both air and surface temperatures reduce from compact to sparse built form and at the same time, from high-rise to low-rise built form [20]. Nevertheless, the responses of LST to the LCZ types can vary significantly because of the combination of different built-land cover types, geographical conditions, background climates and landscape effect (e.g., topography, distance from the sea) [31,37], making it significant to examine the suitability of the application of the LCZ scheme for SUHI studies. The work conducted by Eldesoky, Gil [40] confirmed that the LCZ scheme is applicable for tropical, temperate and cold climates, but not arid climates, with different levels of uncertainty.
Pending queries relevant to the LST responses to LCZ types include the seasonality or thermal anisotropy [41]. For instance, Du, Chen [42] analyzed LST variability of LCZ types in different seasons in Nanjing, China, concluding that the warmest or coolest zones varied with seasons, while the LST of built-up types increased with the reduction of building height. Geletič et al. [41] analyzed the seasonal LST variations of different LCZ types in Prague, Brno and Novi Sad, reporting that SUHII of a specific LCZ type exhibited the largest difference in summer and spring and the lowest in winter. Meanwhile, the dense built-up type and industrial type had the largest SUHII, and the sparse built-up types had the smallest. Some other studies have also examined the seasonal responses of LST or SUHII to LCZ types [43,44]. Nevertheless, the seasonal variation of SUHI to LCZ types has not been well understood, especially in different geographic and macroclimatic contexts. Given the seasonal variability, the applicability of the LCZ scheme to assess SUHI should be examined. Moreover, the impact of landscape effect on the SUHI responses to LCZ types should be further analyzed.
To address the above-mentioned challenges and expand the application of the LCZ scheme in urban planning and design, this study aims to detect monthly variations of LST responses to different LCZ types in the city of Shenyang, China. This study will analyze the impact of landscape effects on such variations through analyzing the variations of SUHII and the LST responses to LCZ types in urban (not fully urbanized) and rural landscapes. Built upon this, the applicability of the LCZ scheme to assess SUHI will be examined. This paper is structured as follows. Section 2 introduces the case study area and its urban heat challenges. Section 3 presents data sources and research methods. Section 4 analyzes the results in aspects of overall LST and SUHII variations, seasonal variations of SUHI responses to LCZ types and the applicability of LCZ schemes for SUHI studies. Following this, Section 5 discusses the results and Section 6 concludes this paper.

2. Study Area

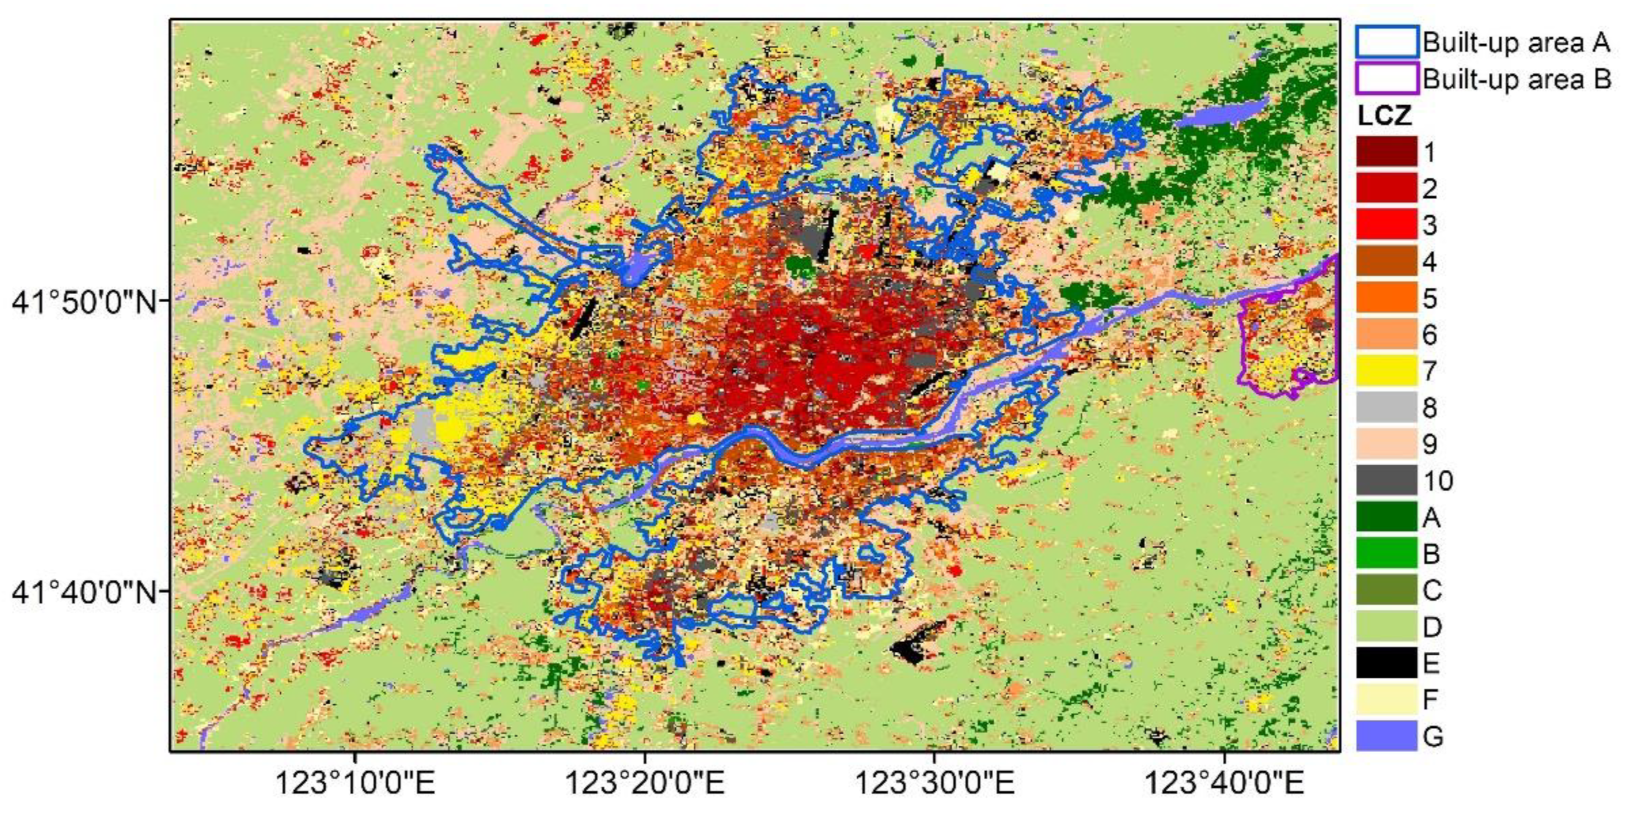
This study is conducted in Shenyang (41°11′51″ N–43°02′13″ N, 122°25′09″ E–123°48′24″ E), the capital city of Liaoning Province in the southern part of the Northeast China (Figure 1). The terrain of Shenyang is flat, gradually extending eastward into hilly areas, with an altitude of 5–441 m. Shenyang has a monsoon-influenced humid continental climate (Dwa), with four distinctive seasons. Summers are hot and humid, where July is the hottest month, with an average temperature of 24.6 °C. Winters are dry and cold, where January is the coldest month with the average temperature of −11.2 °C. The annual average temperature is 8.5 °C. Recently, subject to climate change, Shenyang is also undergoing extreme climatic conditions like many other cities, with the extreme temperature of 39.3 °C on 2 August 2018. South-dominant wind prevails in Spring, Summer and Autumn, while in winter the prevailing wind is north-dominant. The annual average wind speed is about 2.6 m/s, where the wind is the strongest in April and the weakest in August. The rainfall of Shenyang ranges between 600 and 800 mm, while the average annual rainfall of the central city (Figure 1) is about 716.2 mm. In addition, the annual average relative humidity of Shenyang is about 55.7% [45].
Shenyang is the geographic center of Northeast Asia. Economically, it is in the center of the Northeast Asia Economic Circle and the Bohai Rim Economic Circle. Being a major city of the Greater Shenyang Metropolitan Area, Shenyang covers an area of 12,948 km2, where the central city is about 3495 km2 [45]. The city has seen rapid population increase in the past 20 years from 7.20 million in 2000 to 9.07 million in 2020 [46]. Accordingly, Shenyang is now a megacity, the only one in Northeast China. Meanwhile, Shenyang is urbanizing rapidly with the urbanization ratio increasing from 70.33% in 2000 to 84.52% in 2020 [47]. More than 50% of the population and infrastructure are within the three-ring area (the core city, Figure 1), consisting of Heping, Shenhe, Dadong, Huanggu, Tiexi and some parts of other districts such as Dongling, Yuhong and Hunnan New District, with the area of about 455 km2. Within the three-ring area, the SUHII could reach 4–5 °C [23].
Along with the upward trend of urbanization, Shenyang is undergoing three trends including urban densification (inner city), urban sprawl (outer ring) and industrial structure change (China’s land use status remote sensing monitoring database, http://www.resdc.cn, accessed on 19 October 2021). First, the population within the three-ring area saw an upward trend from 2.998 million in 1985 to 3.772 million in 2015 [23]. Second, upon the three-ring area, the urbanized area of central city has been expanding towards different directions, forming a new urban pattern (built-up area A, 635.36 km2 in area in Figure 1). Third, Shenyang has traditionally been an old industrial base for heavy industry and manufacture, while such factories are relocating from the middle of Shenyang to the surrounding cities, counties and suburban areas to ensure environmental and living quality during urbanization. Fourth, to create the Greater Shenyang Metropolitan Area, some factories have been relocated to the middle of Shenyang and surrounding cities (e.g., Fushun), along which a new built-up area B (29.03 km2 in area) forms (Figure 1).

3. Data and Methodology

3.1. Data Pre-Processing and Date Selection

The LST information, as well as the information of SUHII of the study area was obtained through Landsat 8 images (at the path/row of 119/31). To investigate the monthly variation of LST and SUHII, 12 remotely sensed thermal-infrared images (resolution: 30 m) (Table 1) collected by the United States Geological Survey were downloaded from http://earthexplorer.usgs.gov, accessed on 25 September 2021. These images present the thermal information of 10:27 a.m. local Shenyang time with a cloud coverage below 0.1%. Other meteorological conditions at 10:00–11:00 a.m. (UTC +8) were obtained from the local Bureau of Meteorology (Table 1).

3.2. Retrieval of LST

The split window algorithm proposed by Qin, Karnieli [48] was used to retrieve LST from the only spectral band of Thermal InfraRed Sensor (TIRS) 10 in Landsat 8. In particular, the LST was obtained after the atmospheric correction of reflective and thermal bands. According to Equation (1), the digital number was converted to the spectral radiance L λ at the top of the atmosphere.
L λ = M L · D N + A L
where L λ is spectral radiance, W / m 2   sr   μ m , M L is the re-scaled gain corresponding to a specific band, W / m 2   sr   μ m and   A L is the re-scaled bias corresponding to a specific band, W / m 2   sr   μ m .
At-sensor brightness temperature T b (Unit: K) was calculated, based on Equation (2), from TIRS 10, corresponding to the OLI sensor.
T b = k 2 / ln k 1 / L λ + 1
where k 1 and k 2   are constants, with values of 774.89 (Unit:   W / m 2   sr   μ m ) and 1321.08 (Unit: W), respectively. Next, the LST was subsequently obtained after emissivity correction of ground radiance B(LST) (Unit: K) via mono window algorithm Equations (3)–(6).
B L S T = a 1 C D + b 1 1 C D + 1 T b D T a / C
C = ε τ
D = 1 ε 1 + 1 ε τ
LST =   B LST / ( ln ε   λ · B L S T / ρ + 1
where a and b are constants, ε and τ are the land surface emissivity and atmospheric transmittance of band i , respectively. T a is effective mean atmospheric temperature (Unit: K). λ is the wavelength of emitted radiance (11.5 μ m ).   ρ is a constant ( 1.438 × 10 2   m · K ), calculated by Planck’s constant, light velocity and Boltzmann’s constant.
The effective mean atmospheric temperature T a (Unit: K) was calculated based on the following empirical formula [48].
For   mid-latitude   summer : T a = 16.0110 + 0.92621   T 0 For   mid-latitude   winter : T a = 19.2704 + 0.91118   T 0
where T0 actual air temperature at the time when Landsat images are captured (Unit: K).

3.3. Local Climate Zone Classification

This study follows the LCZ classification scheme developed by Stewart and Oke [20] that consists of 10 types of built-up zones and seven types of land-cover areas to characterize the land surface properties of the study area. First, the training LCZ samples were selected based on the Google Earth image of 2 August 2018, without clouds and with 30 m resolution through visual interpretation. In general, 5–28 training samples were selected for the 17 types of LCZ types, respectively. Each training area should have an area of at least 1 km2 and the length/width should be at least 200 m. In addition, urban morphological characteristics should be homogeneous, so that small areas that may be heterogeneous or irregular could be excluded. A buffer zone between different LCZ training zones should have a width of at least 100 m to avoid fuzzy recognition of boundaries. Through the random forest algorithm on the SAGA GIS platform, the LCZ training samples were classified, during which the Landsat TM image (on 2 August 2018) was also used to generate the LCZ map. Through several rounds of iteration and verification, the LCZ map of the study area was generated, as shown in Figure 2. More statistics of the area of different LCZ types of the study area, built-up area and rural areas are presented in Table 2.

3.4. Data Analysis

This study presents the LST distribution and the SUHII of the study area, with the division of two pairs of ‘urban’ and ‘suburban/rural’ areas including (i) three-ring and suburban areas and (ii) built-up areas and rural areas (Figure 1d,e). The SUHII is the LST difference between ‘urban’ and ‘suburban/rural’ areas (Equation (8)), in which the definition of suburban/rural areas is critical. First, consistent with existing studies [15,18,49], rural/suburban areas are buffer zones which have an area of 50% or 100% of the core area (three-ring or built-up area), excluding water pixels. Moreover, the literal suburban/rural area was also defined by the whole area excluding the core area. Accordingly, there are three types of ‘suburban/rural’ areas in two pairs of ‘urban’ and ‘suburban/rural’ areas.
S U H I I = L S T u r b a n L S T s u b u r b a n / r u r a l
where L S T u r b a n is average land surface temperature in urban area and L S T s u b u r b a n / r u r a l is average land surface temperature of suburban/rural areas.
Furthermore, the monthly LST of different LCZs was analyzed within three contexts including the whole study area, the built-up areas and the rural areas (Figure 1e). The analysis was conducted in aspects of LST range and mean value, and departure of the average LST of a specific LCZ from the average LST of all LCZs was analyzed to examine their positive or negative contributions to the urban temperature. Moreover, the monthly suitability of LCZ scheme to indicate LST differentiation of the study area in Shenyang was also examined. The suitability was assessed by the significant difference between the LSTs of a pair of LCZs. Non-parametric analysis of Kruskal–Wallis H test was performed to determine the significance of differences between LSTs, since the LST dataset did not follow a normal distribution, after which a multiple pairwise-comparison between groups was conducted to examine which pairs of groups were different [5].

4. Results and Analysis

4.1. Monthly LST Variation

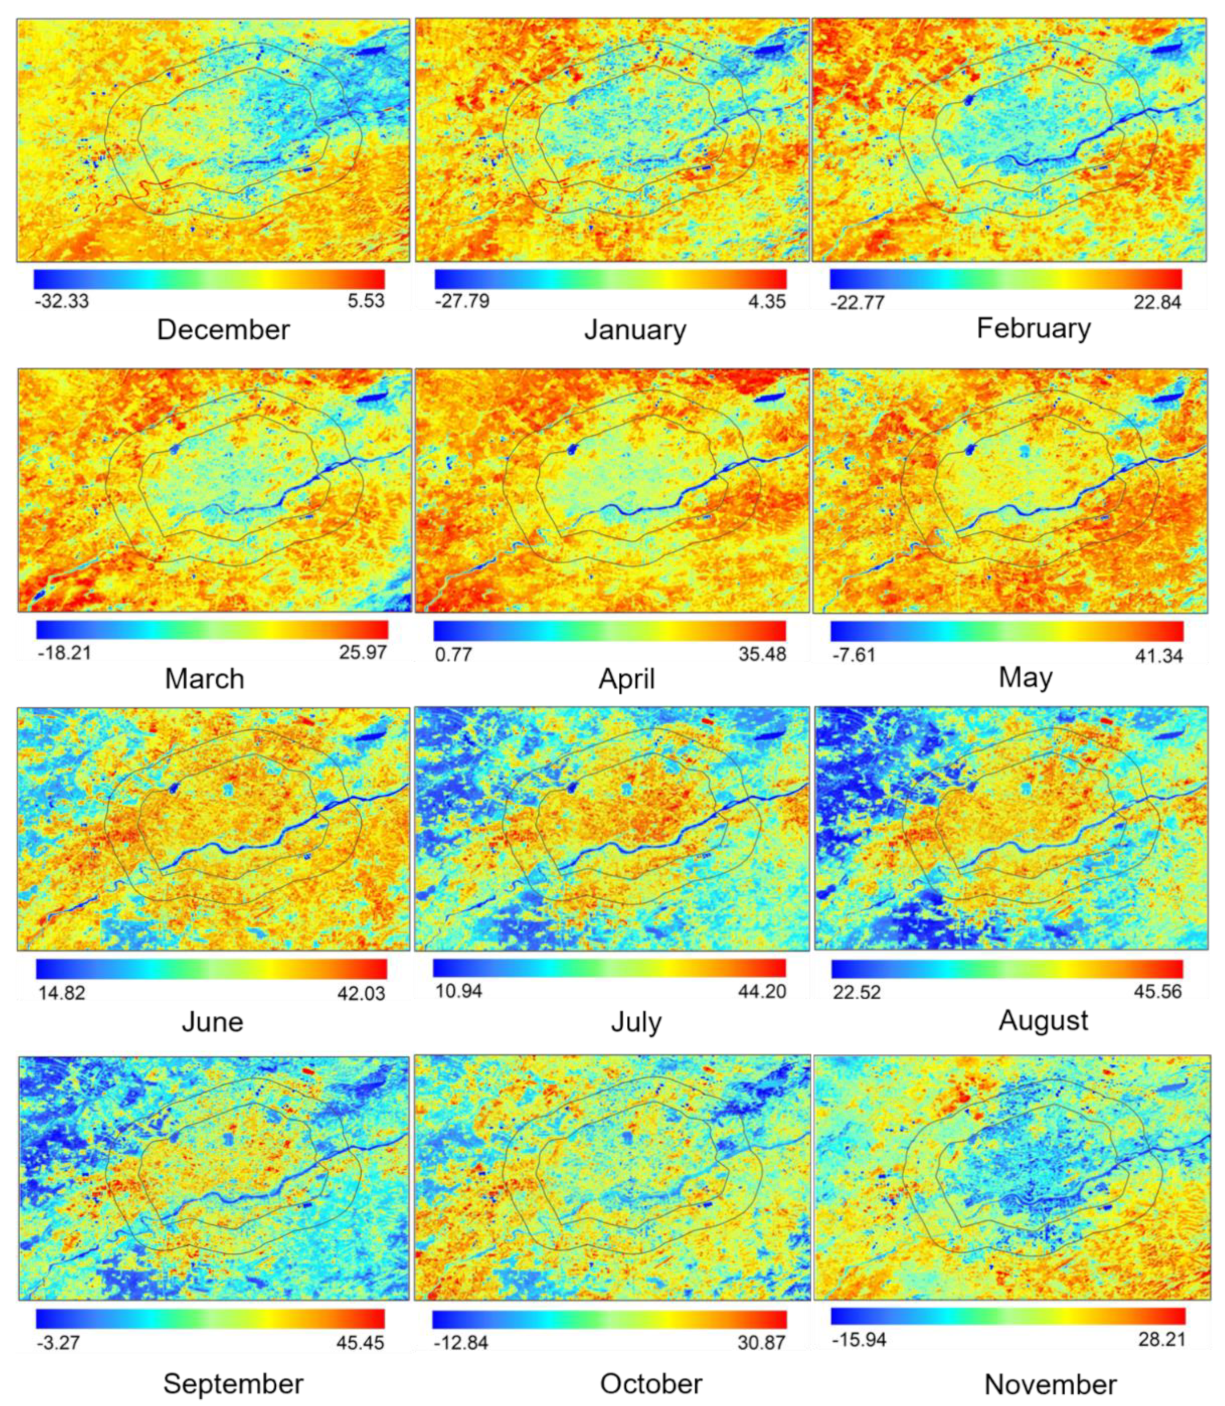
Figure 3 presents the monthly LST variation in the study area from 2018 to 2020, in which the three-ring area (inner circle) and 100% suburban area (outer circle) were marked to compare the urban–suburban–rural temperature for heat/cool island phenomenon. The results indicate an upward trend in the monthly maximum temperature from 4.35 °C in January to 45.56 °C in August and then a downward trend to 5.53 °C in December. The monthly minimum temperature increased from −32.33 °C in December to 22.52 °C in August and then decreased to −15.91 °C in November. December and January were the two coldest months of the year, with the lowest minimum and maximum temperatures, consistent with the lowest air and surface temperatures in Table 1.
August was the hottest month with the highest minimum and maximum temperatures, consistent with the data given in Table 1 as well. However, it should be noted that July has been statistically the hottest month of the year (Section 2). The disparity might be caused by air temperature differences in this study for 2019 compared to the climatological values, that August was hotter than July (Table 1). The similar scenario was applicable for the minimum temperatures in April and May.
Moreover, Shenyang is enduring a longer period of cool island phenomenon than heat island. The heat island phenomenon was obvious in July, August and September where urban–suburban temperature was generally higher than rural one. Along the urban–suburban–rural profile, there was an obvious gradient of LST reduction. In comparison, the cool island phenomenon was observed in November, December, January, February, March, April and May when rural temperature was generally higher. Along the urban–suburban–rural profile, there was a LST increase gradient, particularly in January, February, March, April and May. In both October and June, the LST distributed evenly within the study area and a clear pattern of cool/heat island phenomenon was not recognizable. Therefore, October was a month corresponding to the transition of heat island to cold island, while June was the transition month towards heat island from cold island.

4.2. Monthly Variation of Urban Heat/Cool Island Intensity

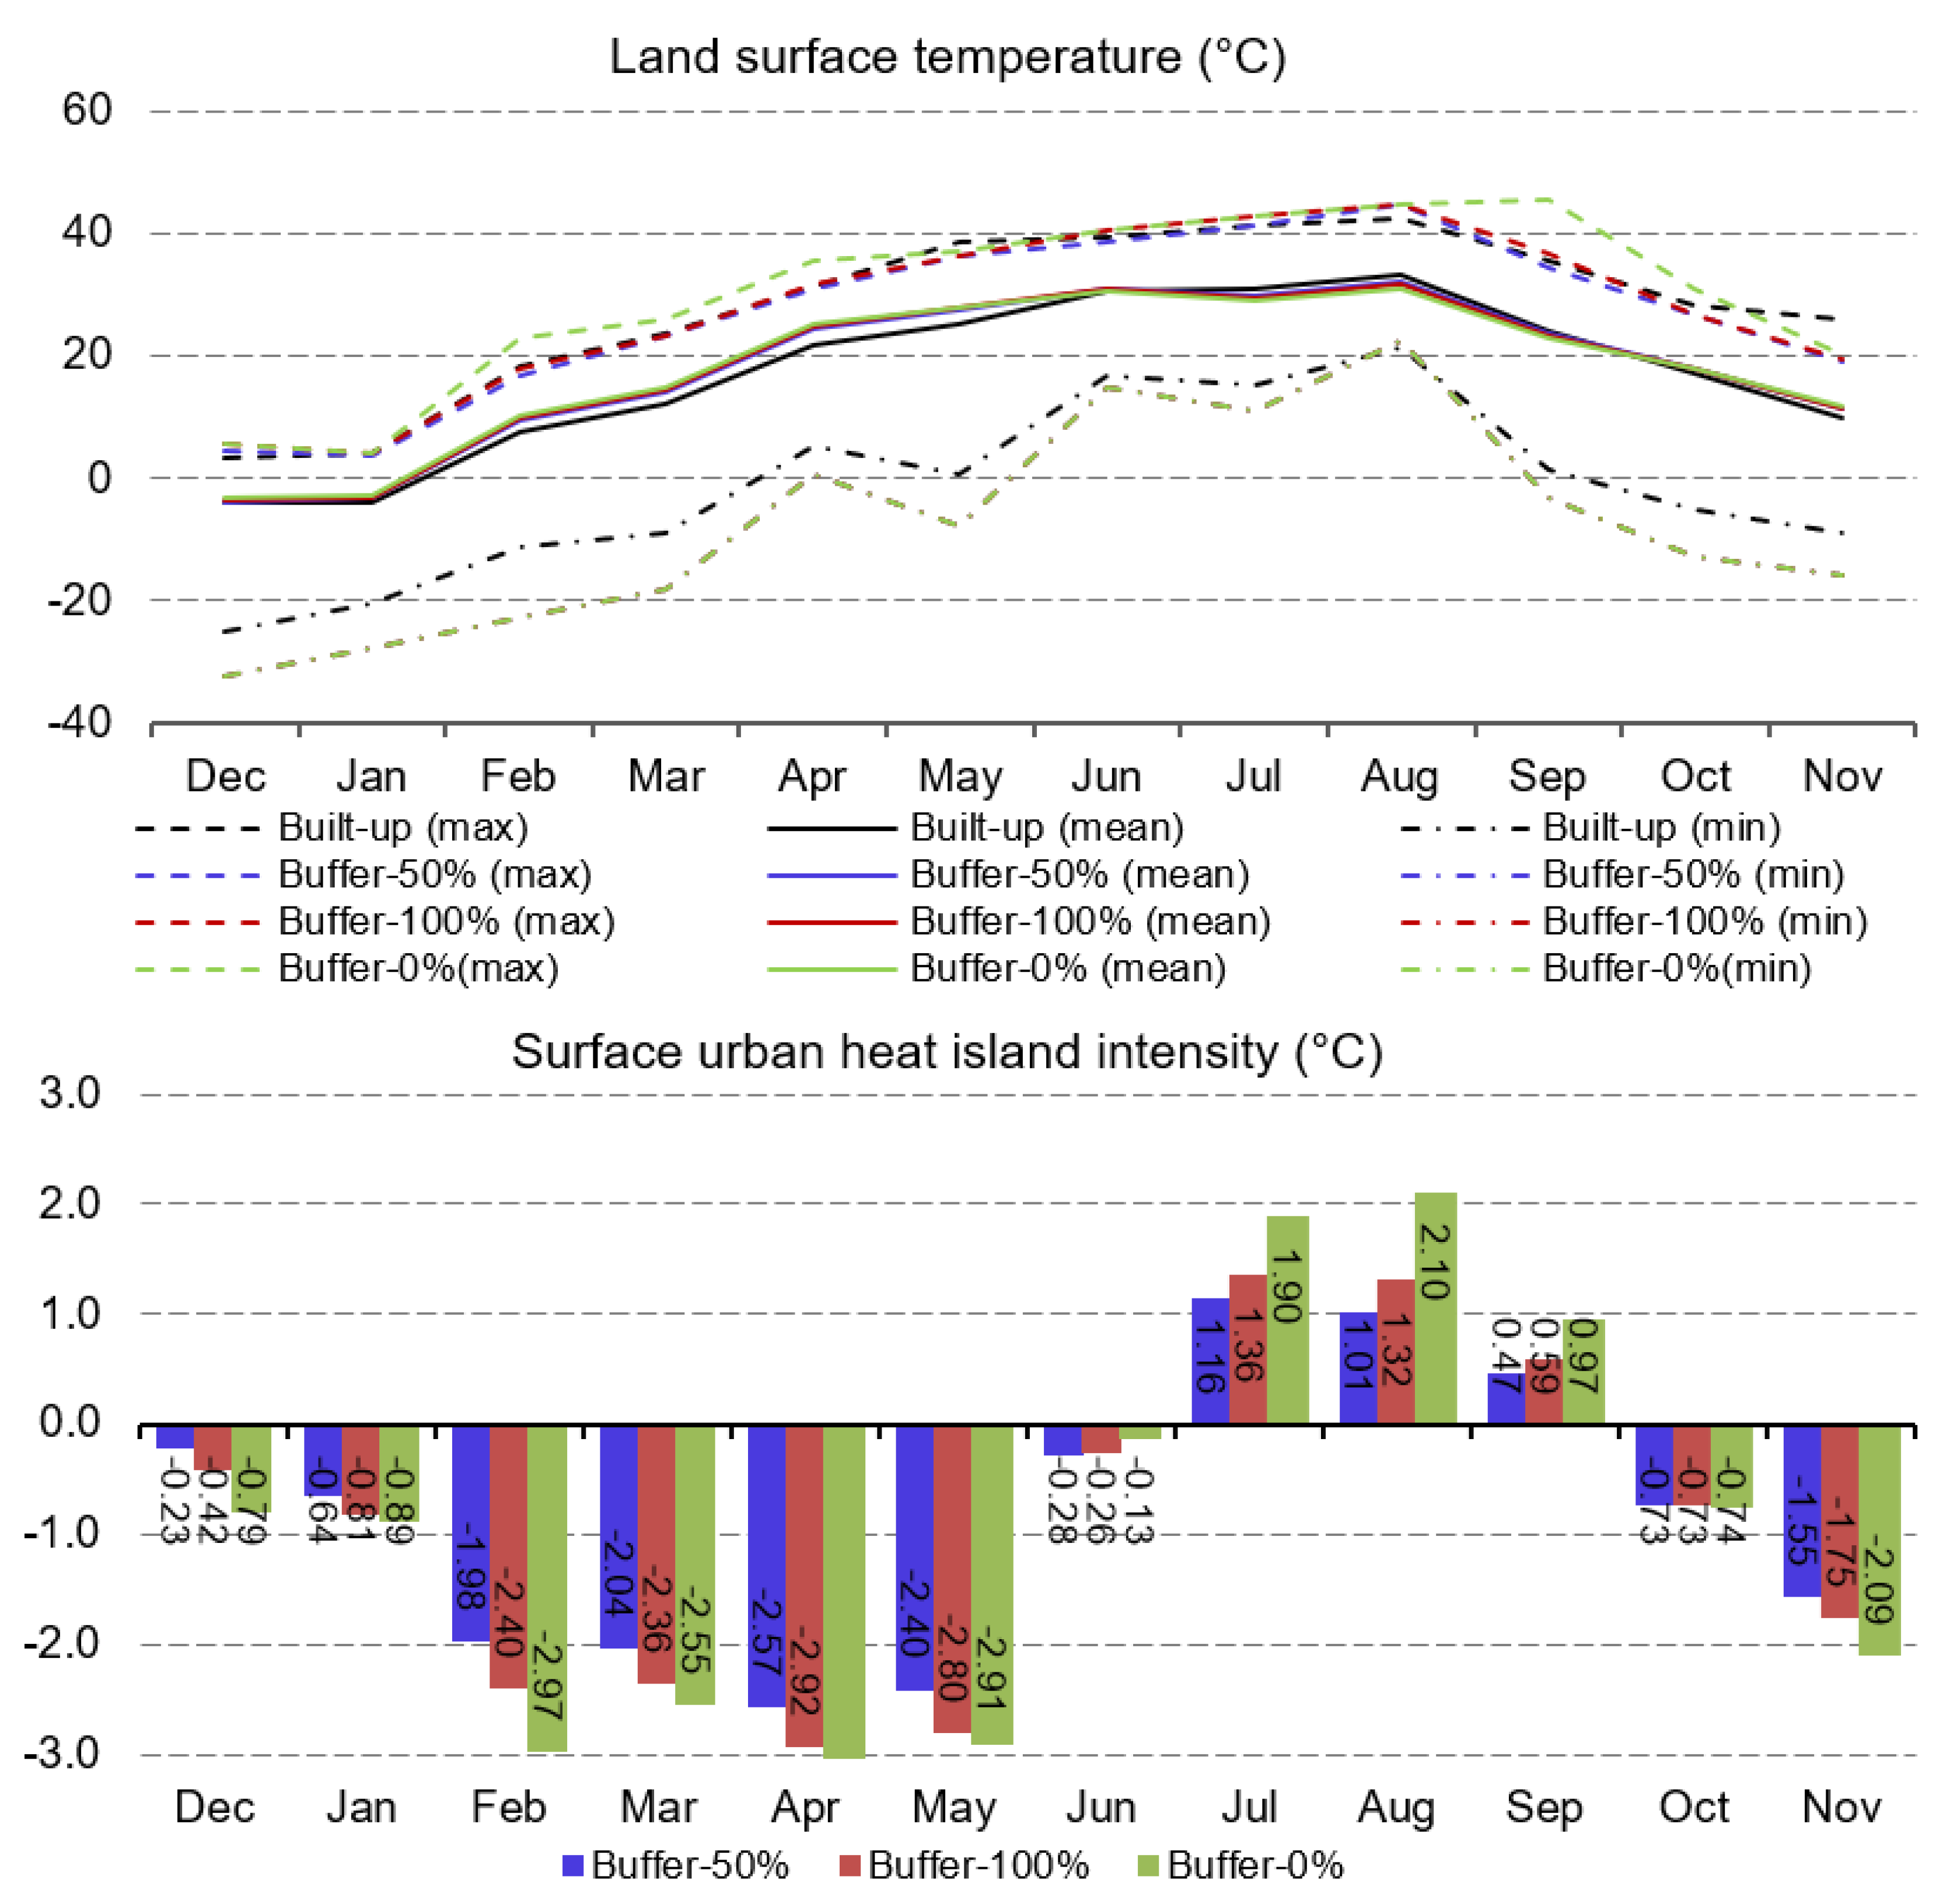
This section quantifies SUHII and analyses the monthly variation of SUHII of the study area. Figure 4 presents the monthly LST and SUHII variations of the three-ring, the Central city, in buffer 50%, buffer 100% and buffer 0% scenarios. Overall, the maximum, mean and minimum LSTs in the central city, suburban-50%, suburban-100% and rural scenarios exhibited similar patterns. Nevertheless, some differences were observed, and the extent of such differences was dependent on the month. For instance, mean LSTs of the Central city were lower than those of rural/suburban areas, indicating cool island phenomenon, from November to May. In comparison, mean LSTs of the Central city were higher, indicating heat island phenomenon, from July to September. There were small differences among rural/suburban LSTs and central city LST in June and October. Such results were consistent with the recognition of cool/heat island phenomenon and the transition months in Section 4.1.
Both maximum and minimum LSTs exhibited different patterns, in aspect of the temperature order of Central city, buffer 50%, buffer 100% and buffer 0% scenarios. Regarding the maximum LST, the Central city had the lowest value from February to October and the rural (buffer 0%) area had the highest value from January to October, compared with those of buffer 50% and buffer 100%. Nevertheless, the central city had the highest minimum LST throughout the year and the buffer 50%, buffer 100% and buffer 0% areas had the same LST. The minimum LST of Central city was about 2.86–13.72 °C higher than those of buffer 50%, buffer 100% and buffer 0% scenarios.
The SUHII varied seasonally and the SUHII was different depending on the definition of rural/suburban areas. The months of June, July, August and September underwent heat island phenomenon, in which the heat island phenomenon in July and August was the most intense with the highest SUHII of 2.86 and 3.06 °C according to the Buffer 0% scenario. The study area underwent cool island phenomenon from October to December, in which the cool island phenomenon was the most intense in February, March and April with an intensity of 2.78, 2.36 and 2.46 °C (Buffer 0% scenario), respectively. It should be noted that whilst June and October experienced heat and cool island phenomena, respectively, their intensities were very weak, further indicating that these two months were transition months. Furthermore, in the buffer 50% scenario, both SUHII and surface urban cool island intensities (SUCII) were the weakest, compared with those in both buffer 100% and buffer 0% scenarios. Such results indicate that a larger rural area corresponded to stronger SUHII or SUCII on the one hand, and it is important to define appropriate rural/suburban areas.
Figure 4 presents the monthly variation of temperature with respect to the three-ring area, while Figure 5 presents monthly variation of LST of the built-up areas and those of SUHII, in buffer 50%, buffer 100% and buffer 0% scenarios. Overall, the monthly variation of maximum, mean and minimum LSTs in the case of built-up area (Figure 5) were similar to those in the case of three-ring area (Figure 5). For instance, the urban area (built-up area) had the highest minimum LST and buffer 50%, buffer 100% and buffer 0% areas had the same LST. From July to September, the mean LSTs of the built-up area was much higher, while the ones of the built-up area were lower from October to June. SUHII based on the built-up area also exhibited a similar pattern to that based on a three-ring area. July and August underwent the highest SUHI effects, and February, March and April had the most intense cool island impacts. However, the cool island phenomenon in May was also obvious, with a SUHII of 2.91 °C (Buffer 0% scenario). June underwent cool island effects according to the built-up area (Figure 5), different from heat island effects according to the three-ring area (Figure 4). Under such conditions, June, September and October were the transition months with very weak heat island or cool island phenomenon. In addition, the SUHII in the buffer 0% scenario was the strongest, followed by the buffer 100% scenario and then buffer 50% scenario.
Moreover, the heat island phenomenon according to built-up area was less intense than that according to three-ring area, and the cool island phenomenon according to the built-up area was more intense. Overall, according to the results in Figure 4 and Figure 5, the definition of urban area also influences the SUHII, apart from the definition of rural/suburban area. A different definition of urban area could lead to diverse results in SUHII magnitude, cool/heat island phenomenon and transition months.

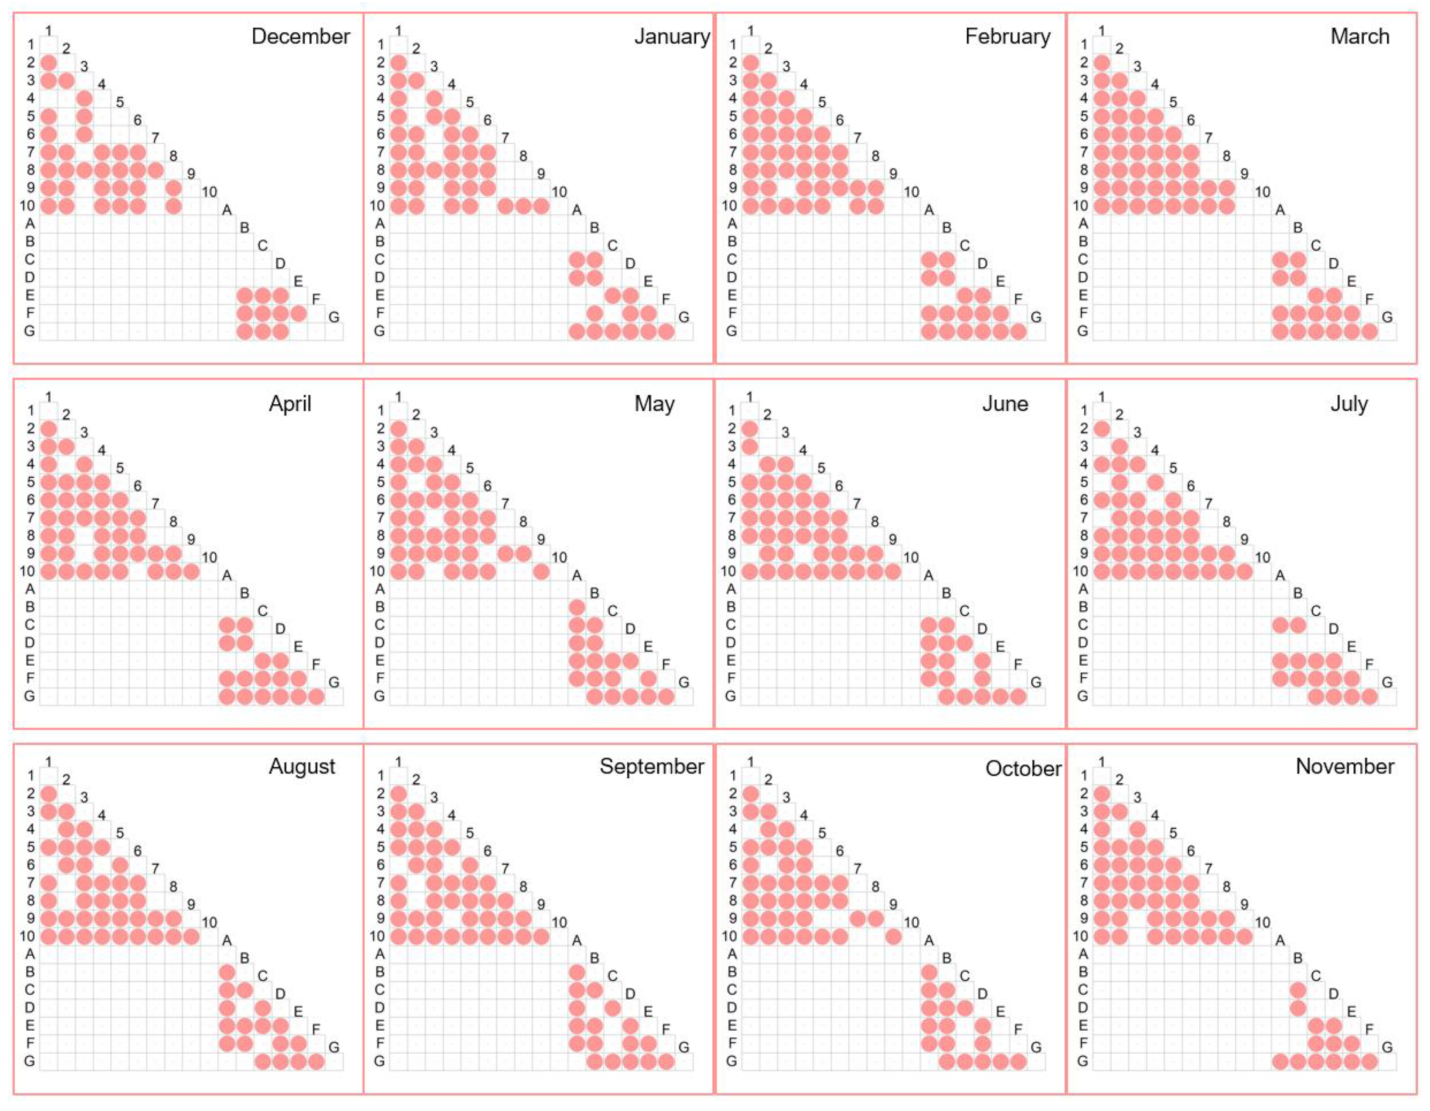
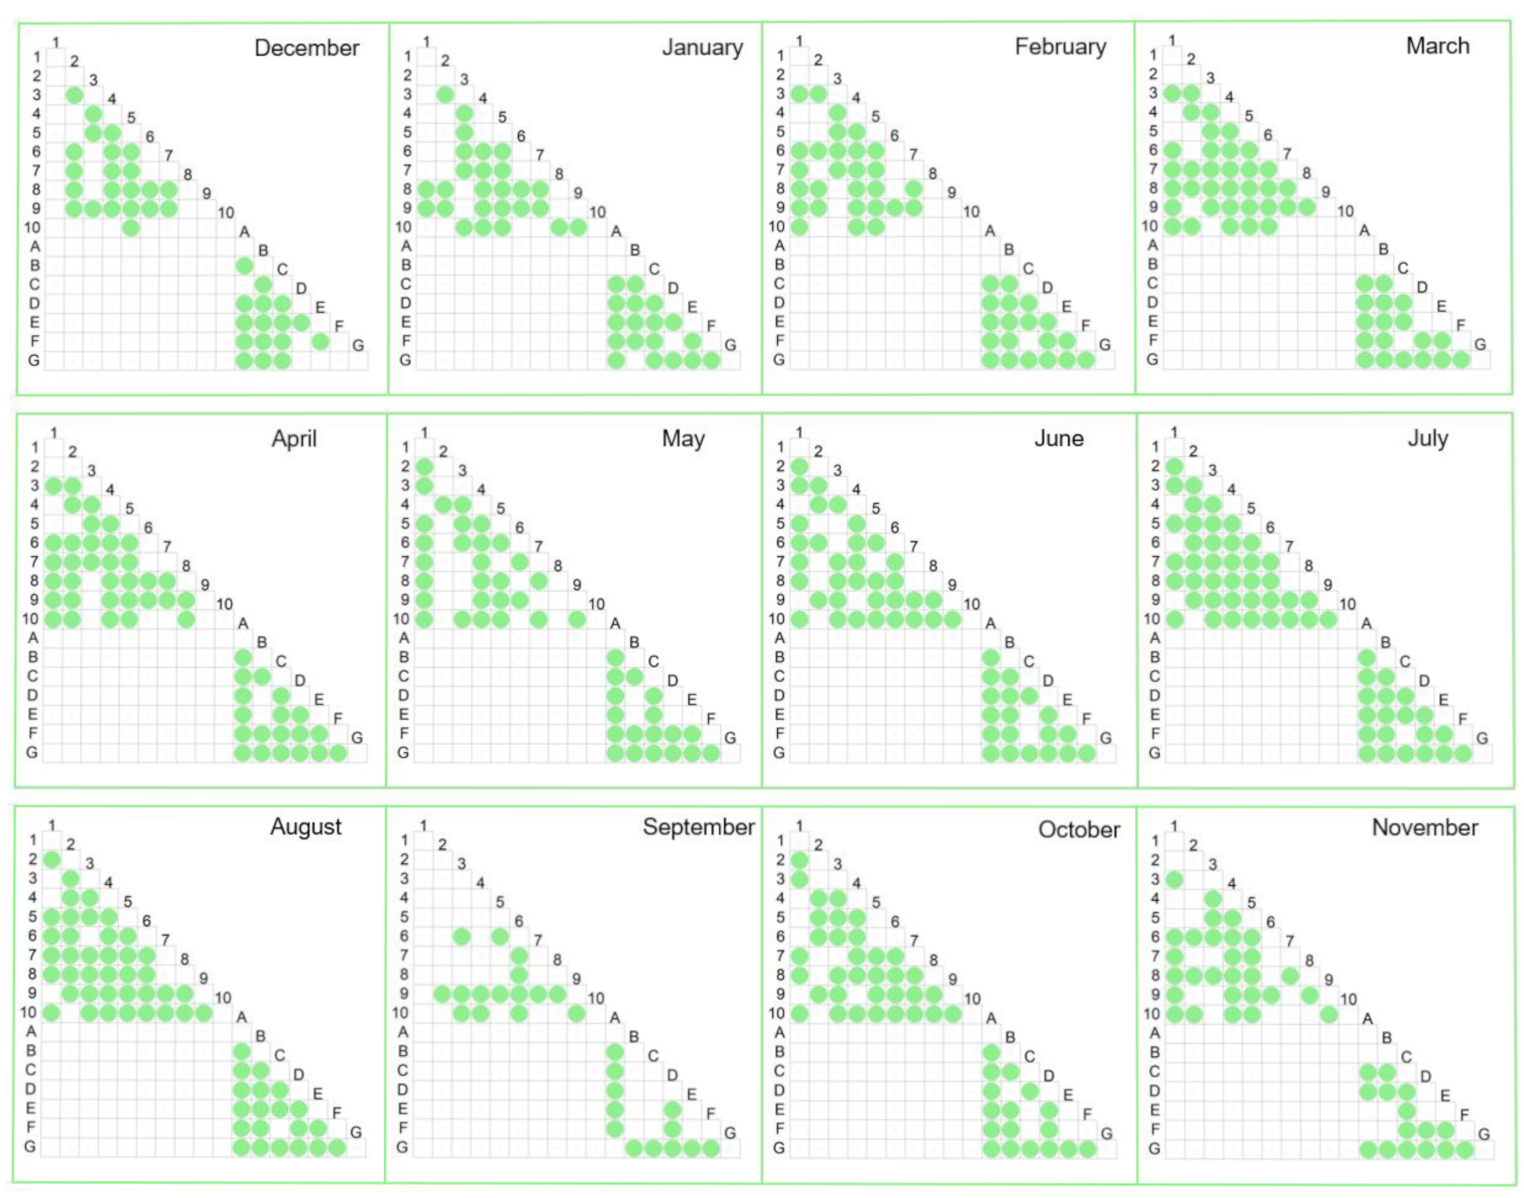
4.3. Temporal Variation of Land Surface Temperature with Local Climate Zones

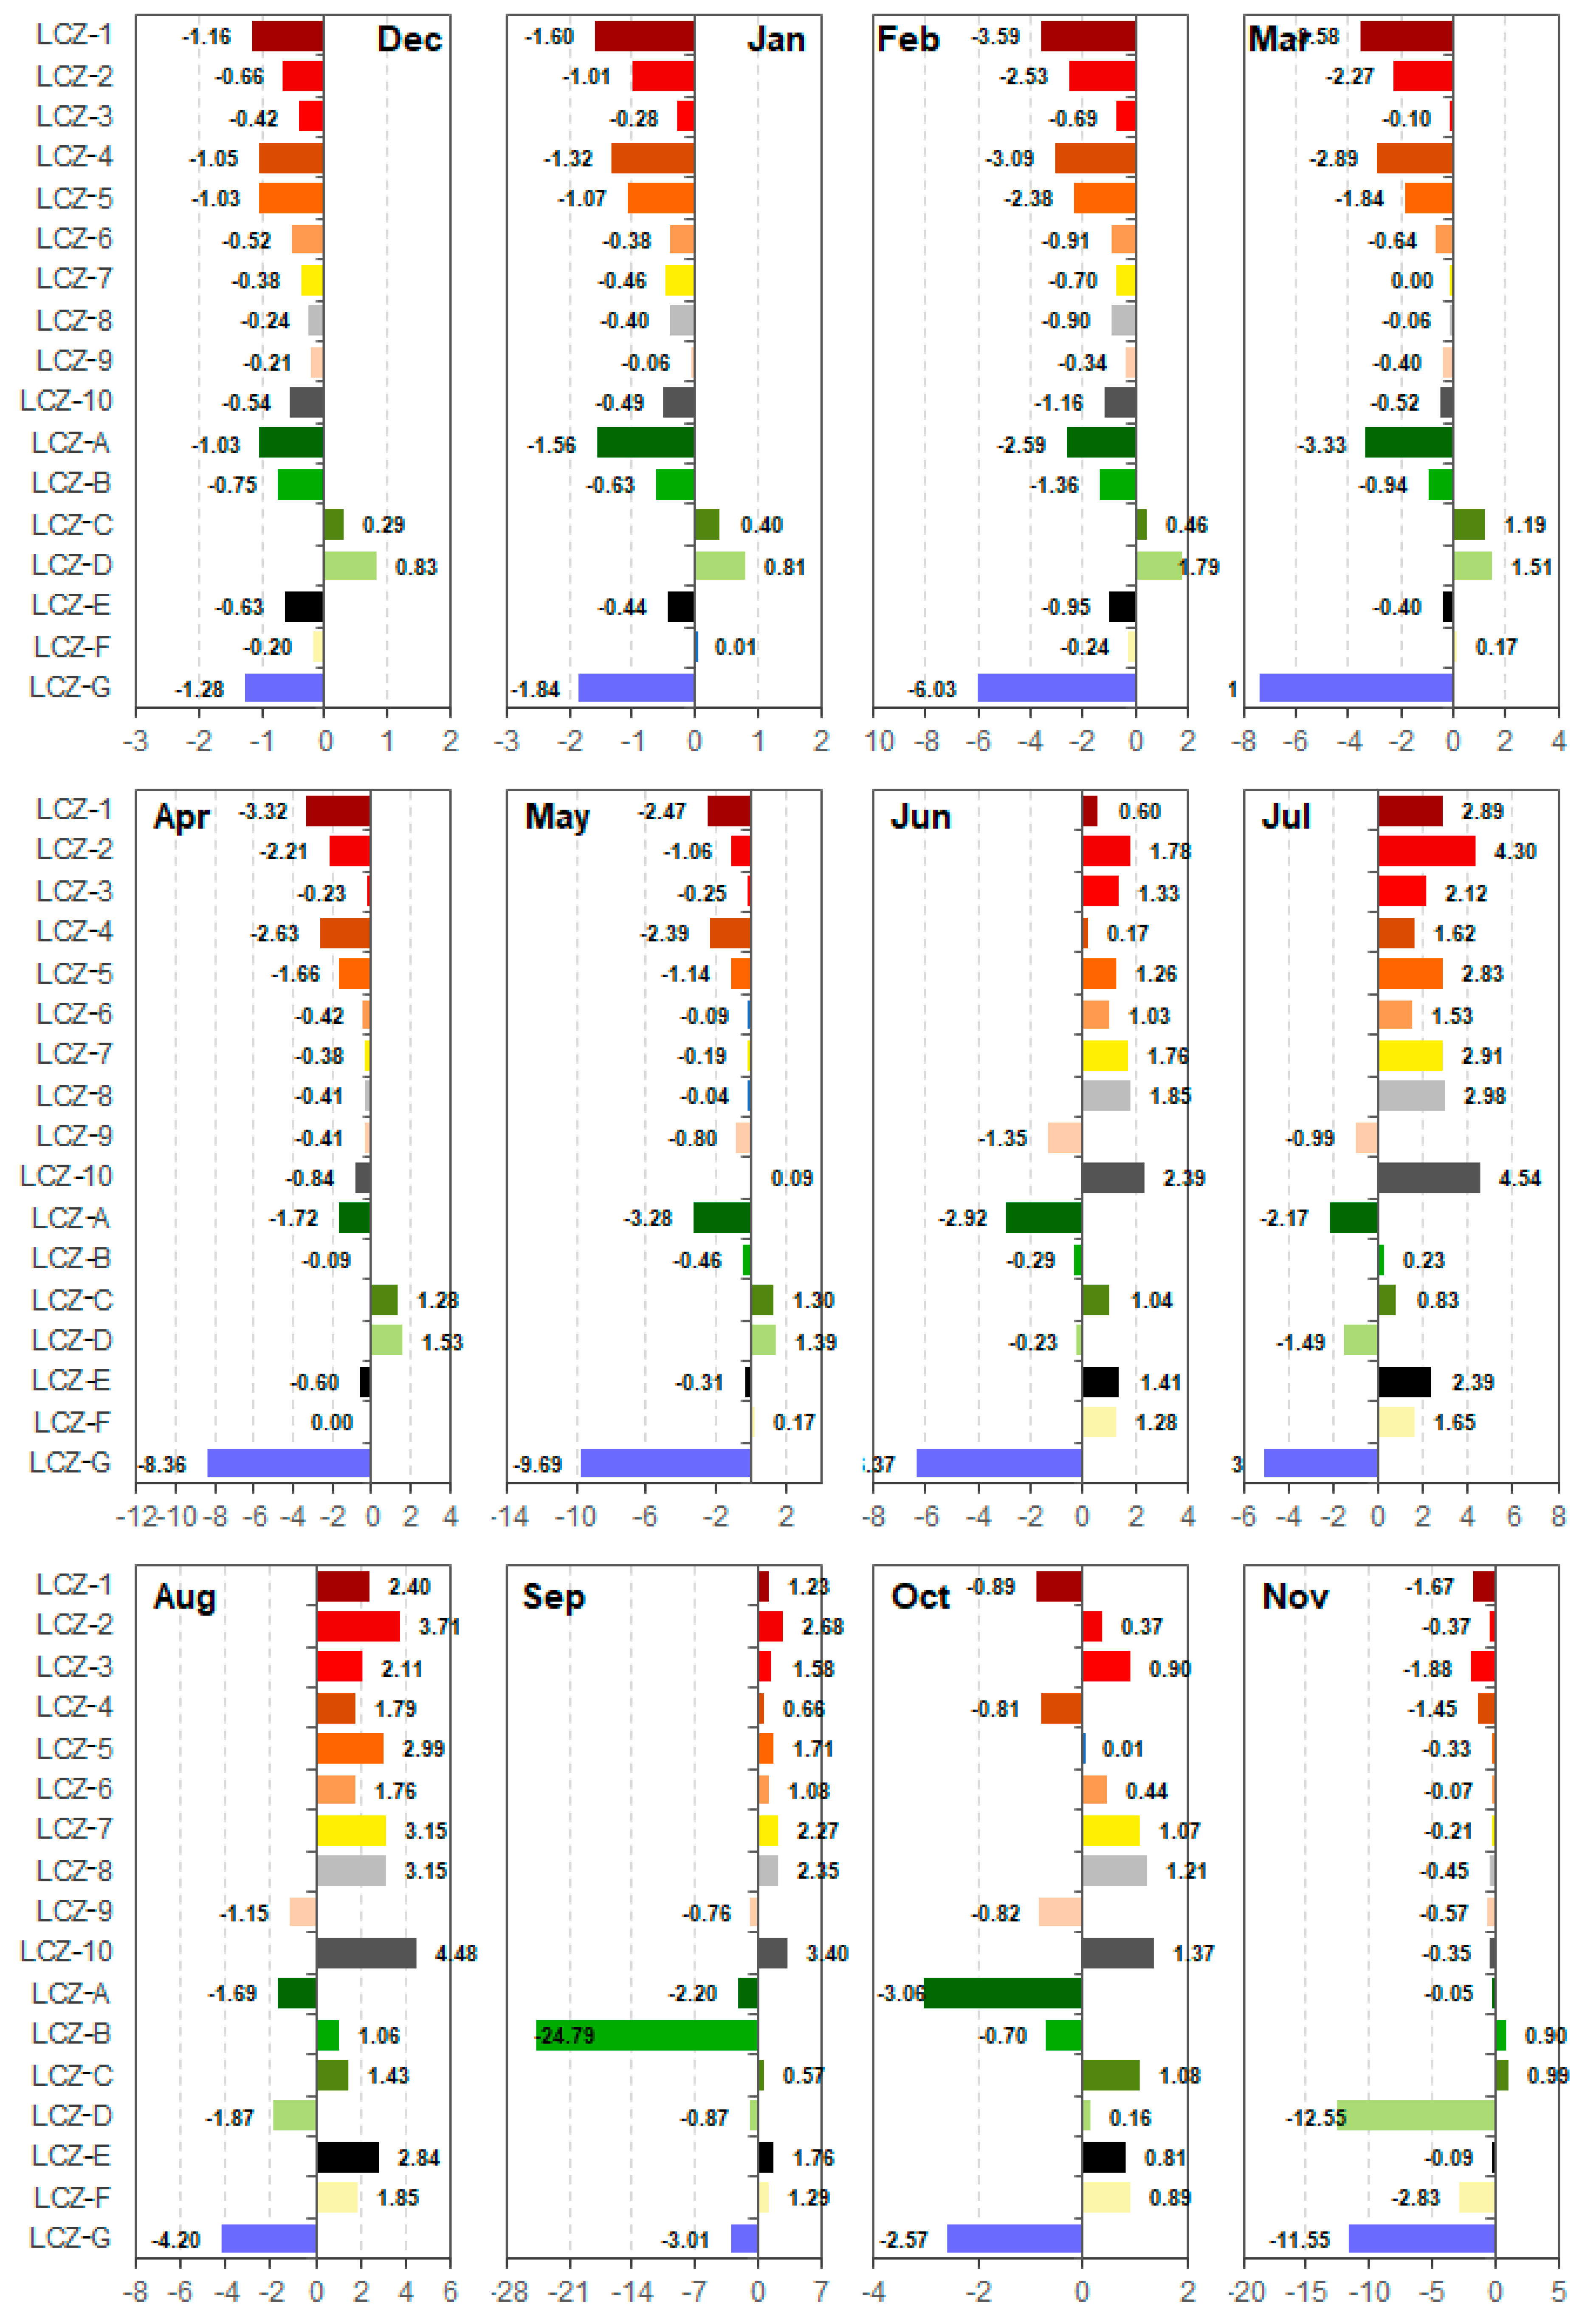
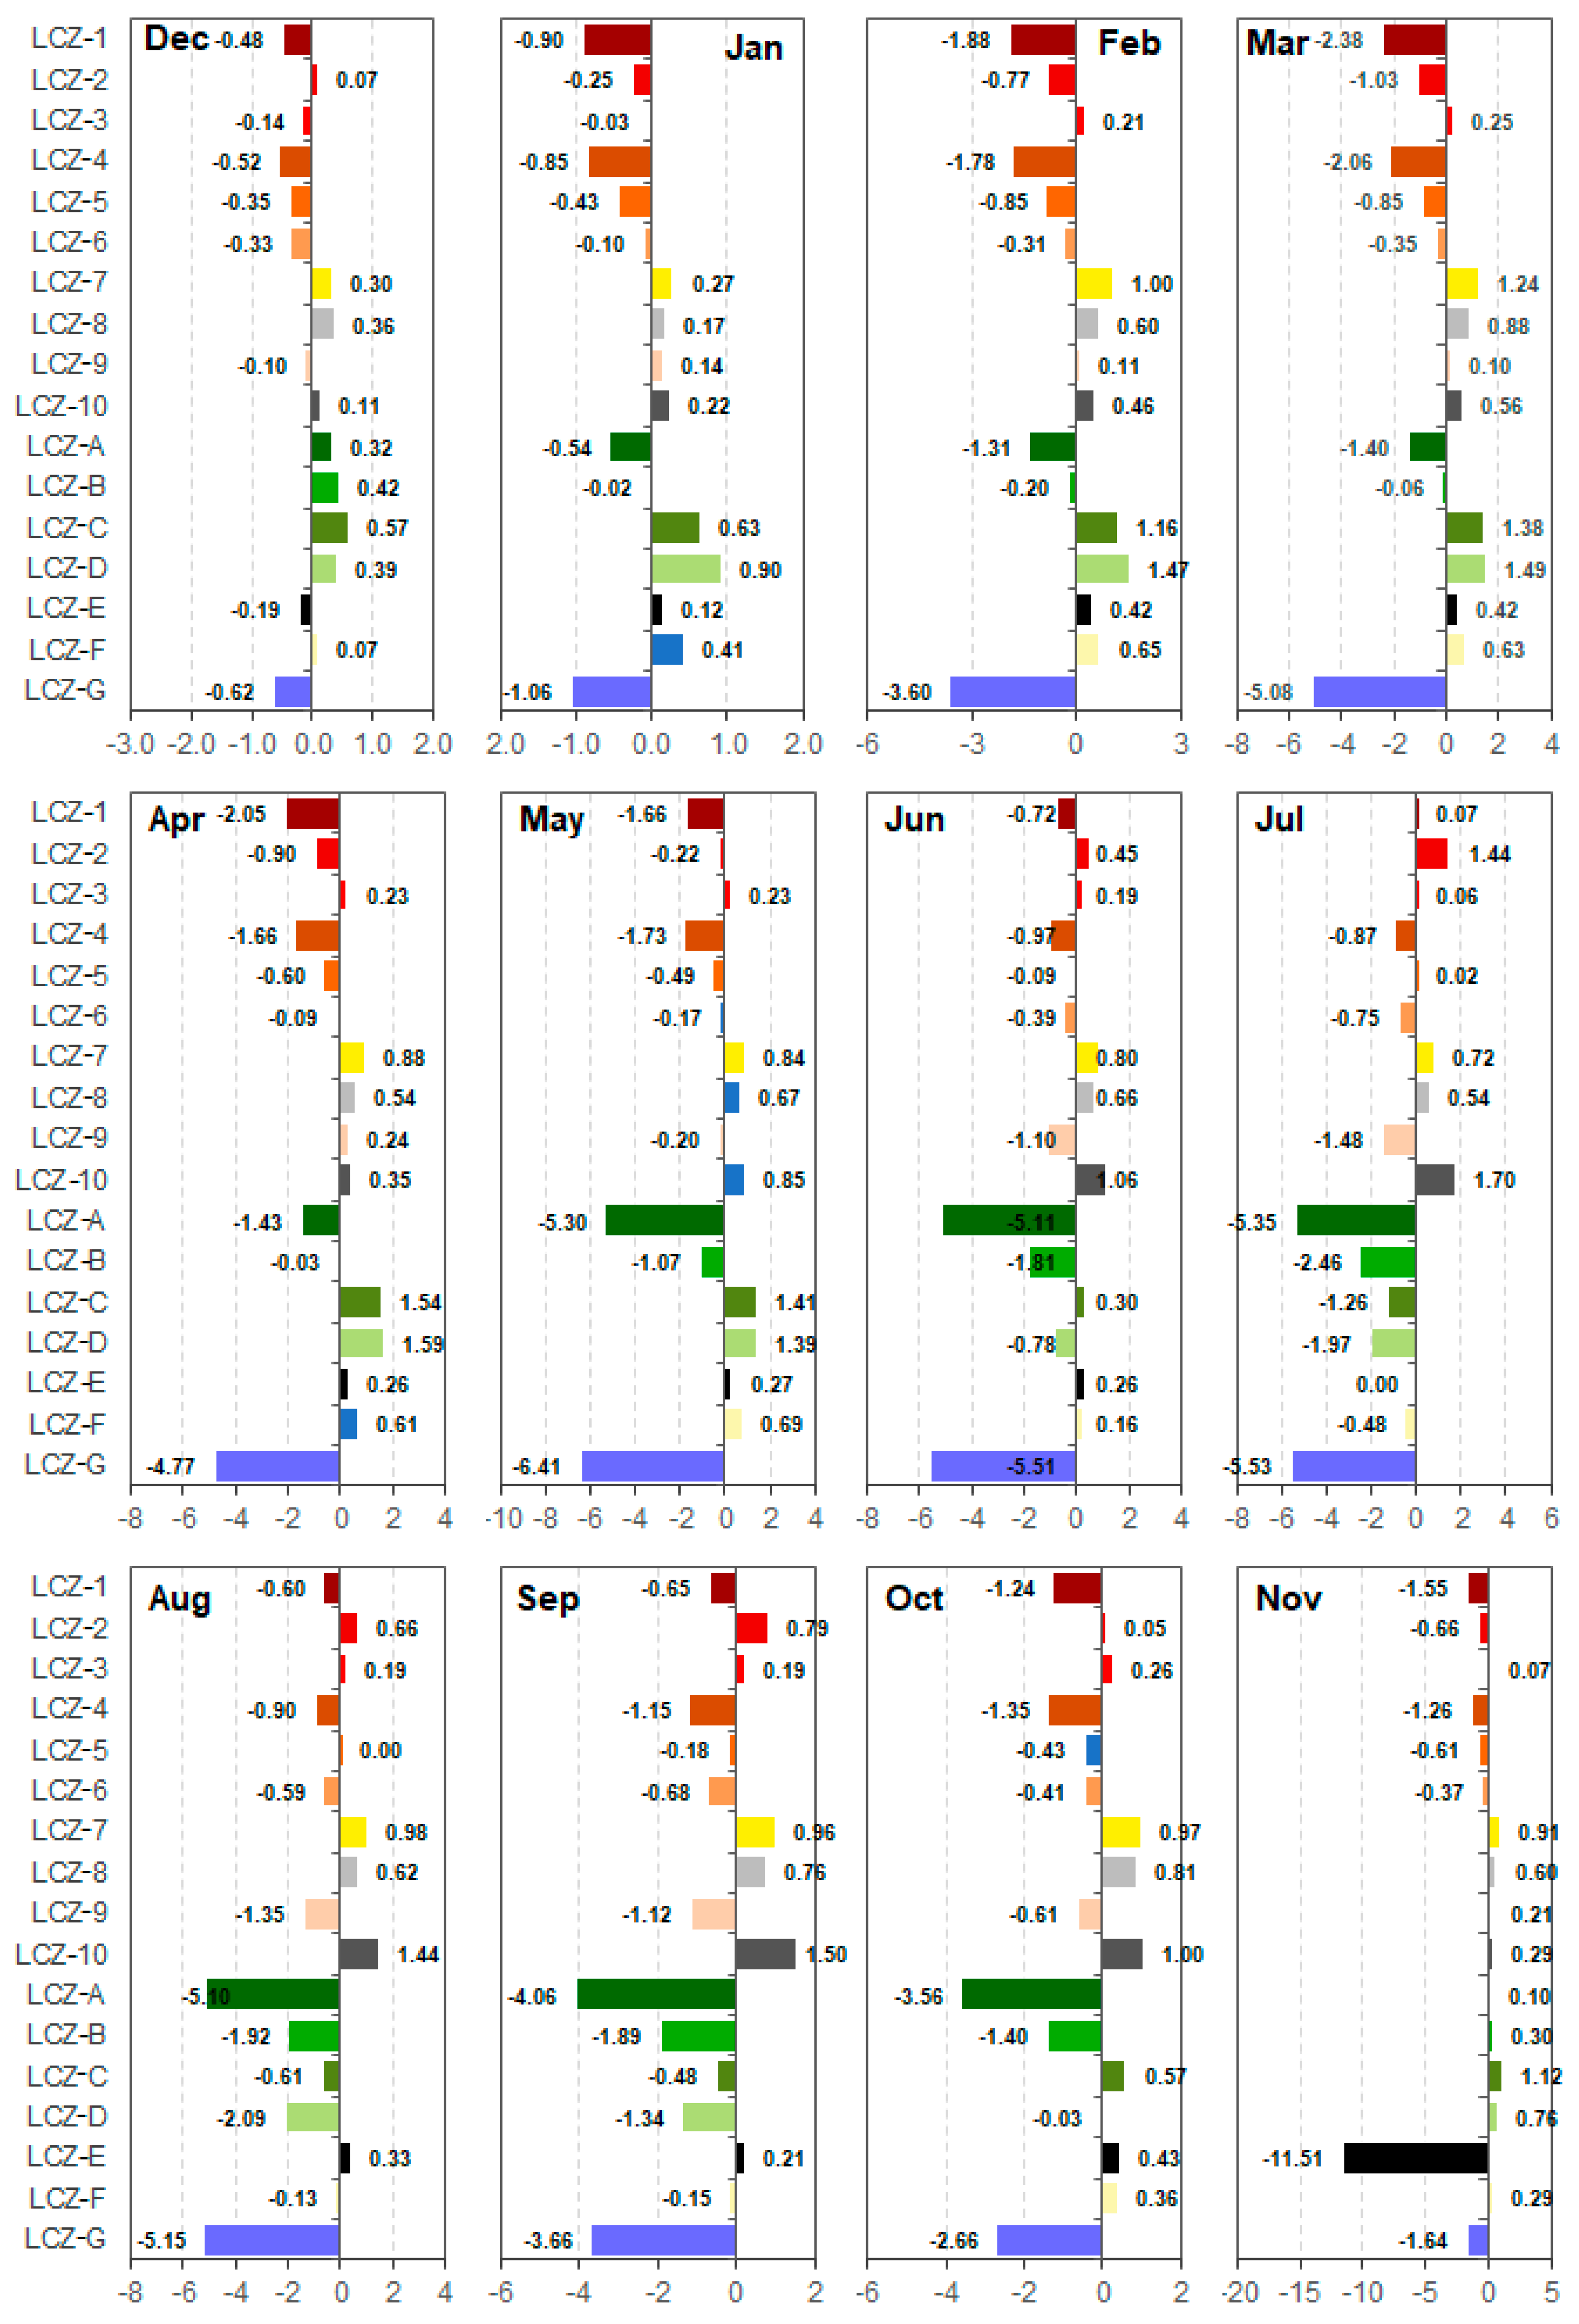
Table 3 presents the LST of different types of LCZs in 12 months. The results indicate that in July and August, when the SUHII was the strongest, Heavy industry areas (LCZ-10) had the highest mean LST of 34.58 and 36.87 °C, followed by Compact midrise (LCZ-2, 34.34 and 36.10 °C) and then Lightweight low-rise (LCZ-7). In comparison, the land cover of water was the strongest heat sink with the mean LST of 24.91 and 28.91 °C, respectively, in July and August. Both dense trees and low plants were also heat sinks with the second and third lowest LST.
In February and March, when the cool island phenomenon was the most obvious, the strongest heat sinks and sources were found in the land cover types of the LCZ scheme. The land cover of Low plants (LCZ-D) had the highest average LST of 11.59 and 15.82 °C, followed by Bush, scrub (LCZ-C) with the average LST of 10.26 and 15.50 °C, implying the strongest heat sources. Water (LCZ-G) exhibited the lowest average temperature of −5.04 and 6.90 °C, indicating the strongest heat sink. In addition, that built from Compact high-rise (LCZ-1) exhibited the lowest LST of 6.21 and 10.73 °C, followed by the Open high-rise (LCZ-4) with the average LST of 6.71 and 11.42 °C.
In June, a transition month from cool to heat island, the land cover of Water (LCZ-G) was the strong heat sink (24.83 °C), followed by Dense trees (LCZ-A, 28.28 °C), while Bare rock or paved was a strong heat source (LCZ-E, 32.61 °C), followed by Bush, scrub (LCZ-C, 32.24 °C) and Bare soil or sand (LCZ-F, 32.48 °C). For the built LCZs, the Sparsely built (LCZ-9) exhibited the lowest LST (29.85 °C), while the Heavy industry (LCZ-10) indicated the highest LST (33.59 °C). In October, a transition month from heat to cool island, the land cover of Bush, scrub (LCZ-C) had the highest average LST of 19.05 °C, followed by Bare soil or sand (LCZ-F, 18.86 °C), while dense trees had the lowest average LST of 14.91 °C and then the second lowest LST of Water (LCZ-G, 15.40 °C). The built LCZ of Heavy industry (LCZ-10) had the highest average LST (19.34 °C) while the Compact high-rise (LCZ-1) had the lowest LST of 17.08 °C.
Overall, LST of different types of LCZs varied temporally. In hot seasons (e.g., July, August), Heavy industry (LCZ-10) had the highest LST, forming the strongest heat sources among the built LCZs. Such results were relevant to the waste heat emissions during factory operation in hot seasons [50] and the strong solar radiation incidence due to large sky view factor [20]. Following this, the Compact midrise (LCZ-2), Lightweight low-rise (LCZ-7) and Large low-rise (LCZ-8) were also strong heat sources (Figure 6), which may be because of strong solar radiation incidence. In comparison, in cold seasons (from December to March), Sparsely built (LCZ-9) and Compact low-rise (LCZ-3) had the highest LST among all built LCZs, whilst the Compact high-rise (LCZ-1) had the lowest LST (Figure 6).
Temporal variation of LST to LCZs was also observed in land-cover LCZs. Whilst the Water had the lowest LST in almost all months, the Scattered trees (LCZ-B), Dense trees (LCZ-A) and Low plants (LCZ-D) exhibited the lowest average LST in September, October and November, respectively (Figure 6). Both Bush, scrub (LCZ-C) and Low plants (LCZ-D) had the highest average LST from December to May, which may be because of the dual impacts of the acceptance of solar radiation and vegetation. In comparison, the Bare-rock or paved (LCZ-E) and Bare soil or sand (LCZ-F) had the highest average LST from June to September, and the Bush, scrub (LCZ-C) had the highest LST in October and November (Figure 6).

4.4. Spatial Variation of the Responses of Land Surface Temperature to Local Climate Zones

Responses of LST to different types of LCZs within urban and rural areas is examined to analyze the impact of spatial context. The LSTs of different LCZs in urban and rural contexts are given in Appendix A and Appendix B. 
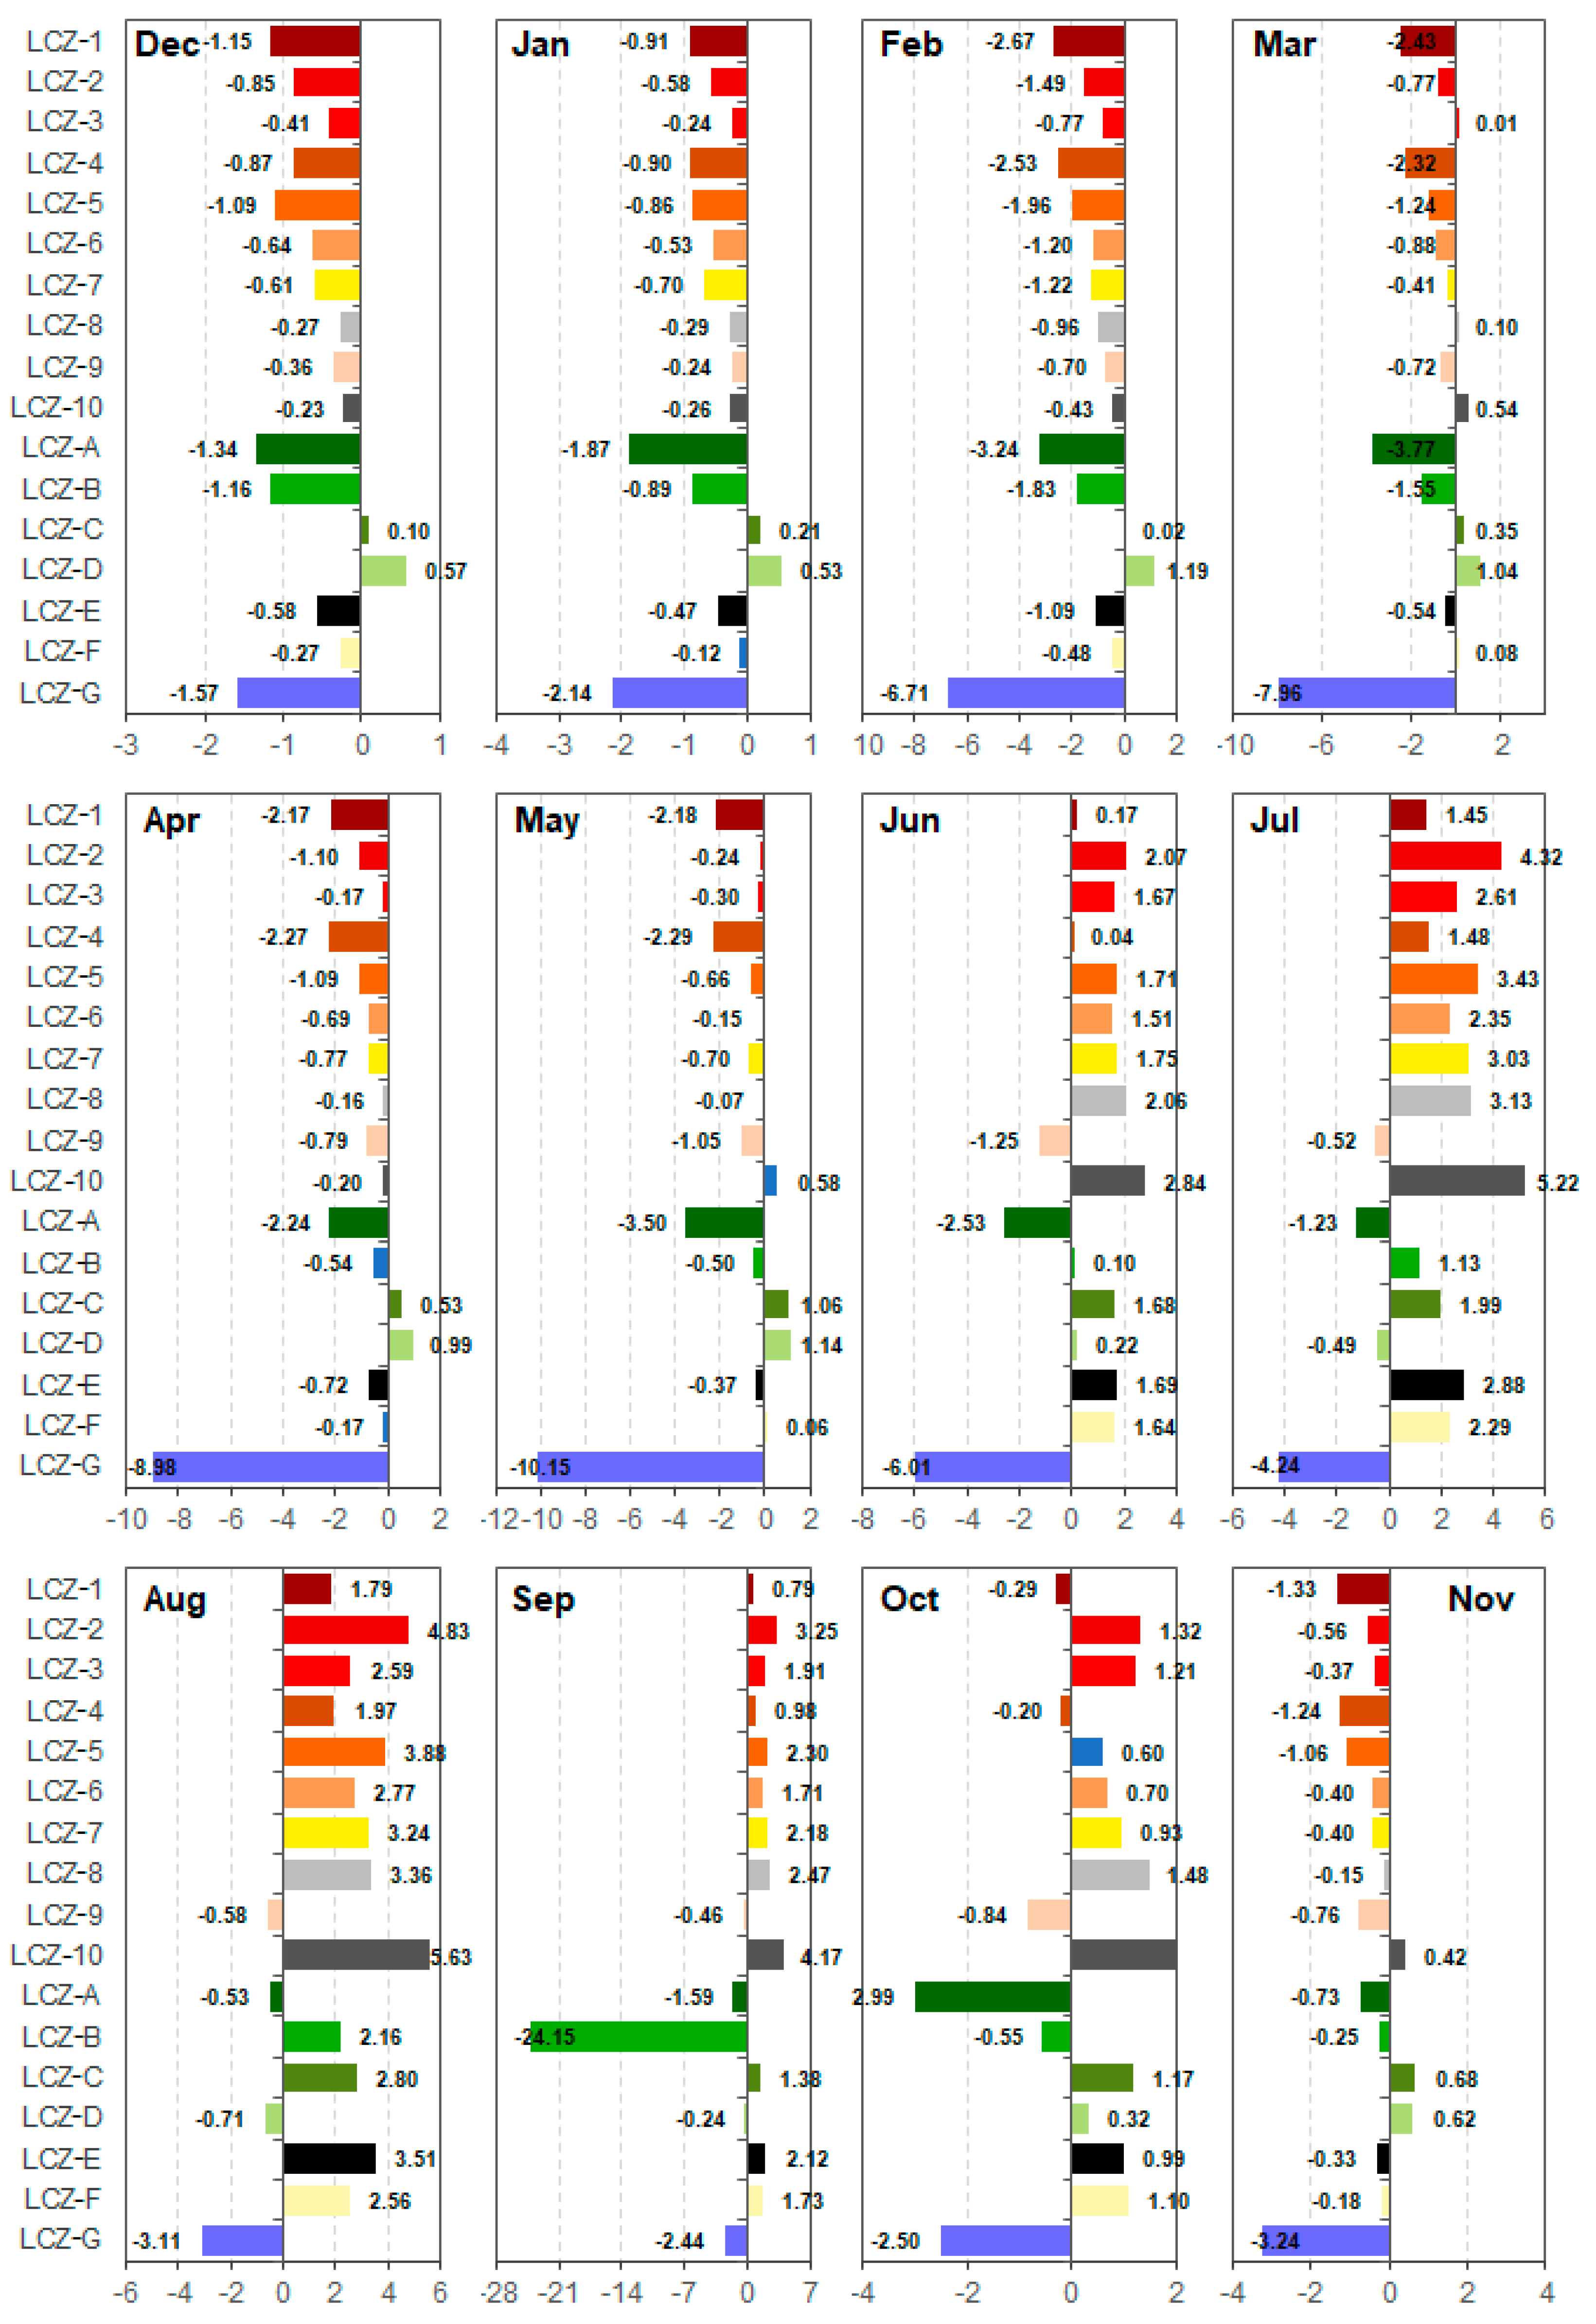
Table 4 presents the two maximum LSTs and two minimum LSTs within urban and rural areas in 12 months. Overall, there was an obvious difference between the LST patterns of urban and rural built LCZs. In urban area, LCZ-7 (Lightweight low-rise), LCZ-8 (Large low-rise) and LCZ-10 (Heavy industry) had the highest LSTs among ten built LCZs depending on months, while the LCZ-2 (Compact midrise), LCZ-3 (Compact low-rise), LCZ-8 (Large low-rise), LCZ-9 (Sparsely built) and LCZ-10 (Heavy industry) underwent the highest LSTs within rural context. The LCZ-10 (Heavy industry) within an urban context had the highest temperatures from May to October with the average temperature ranging between 19.27 and 36.88 °C, while the LCZ-10 (Heavy industry) within a rural context showed the highest temperature throughout the year, excluding two months of January and April, with average temperature ranging from −3.43 to 36.83 °C.
Apart from the LCZ-10 (Heavy industry), within the urban area, the LCZ-7 (Lightweight low-rise) and LCZ-8 experienced the top two highest temperature throughout the year excluding July (11 times), and LCZ-8 (Large low-rise) was prominent for five times. In comparison, within a rural context, apart from LCZ-10 (Heavy industry), the top two highest temperatures were observed in different built LCZs, including LCZ-2 (Compact midrise, 4 times), LCZ-3 (Compact low-rise, 2 times), LCZ-8 (Large low-rise, 6 times) and LCZ-9 (Sparsely built, 2 times). For the minimum temperature, LCZ-1 (Compact high-rise), LCZ-4 (Open high-rise) and LCZ-9 (Sparsely built) were the built LCZs undergoing the lowest temperature within an urban context. Likewise, it was such three built LCZs that experienced the lowest LST within a rural context. It should be noted that the built LCZs of Compact high-rise, Compact midrise and Compact low-rise were not the case with the highest temperatures, different from the situation of the whole study area (Figure 6), while the Compact high-rise underwent the lowest temperature.
Table 5 compares the LSTs of land-cover LCZs within urban and rural contexts. In both urban and rural contexts, LCZ-C (Bush, scrub), LCZ-D (Low plants) and LCZ-E (Bare rock or paved) had the highest temperature among seven land-cover LCZs. Moreover, the LCZs with peaked temperatures with urban and rural contexts were generally the same throughout a year excluding December, May and September. From January to April, LCZ-D (Low plants) had the highest temperature within both urban and rural contexts, LCZ-E (Bare rock or paved) had the highest temperature from July to September, and LCZ-C (Bush, scrub) had the highest temperature from October to November. Within urban area, the LCZ-G (Water) was a strong heat sink, where it had the lowest temperature from December to August, and it had the second lowest temperature from September to November. A similar case was observed in the rural context; LCZ-G (Water) had the lowest temperature from November to August, and it had the second lowest temperature in September and October. Likewise, the LCZ-A (Dense trees) had the minimum temperature within both urban and rural contexts.
Overall, the results indicate the urban context affected the responses of LST to LCZs. The highest temperature within built LCZs within an urban context exhibited a higher divergence compared with that within a rural context. Compared with built LCZs, the temperature of land-cover LCZs was more convergent. Moreover, there were limited differences between the land-cover LCZs with maximum (LCZ-C, -D, and -E) and minimum (LCZ-A, -G) temperatures within urban and rural contexts. Furthermore, the overall LST patterns in urban and rural contexts were different, as presented in Appendix C and Appendix D.

4.5. Land Surface Temperature Difference among Different Local Climate Zones

Given the spatiotemporal variations of the responses of LST to LCZs, the suitability of the LCZ scheme for LST differentiation was further examined, as shown in Figure 7. The results indicate that LSTs of different LCZ types were generally different throughout the year, while some types of LCZs failed to differentiate LST. For instance, there was no significant difference between the LST of LCZ 1 (Compact high-rise) and LCZ-2 (Compact midrise) in December. The same results were found among other pairs including LCZ-2 (Compact midrise) and LCZ-5 (Open midrise), LCZ-4 (Open high-rise) and LCZ-5 (Open midrise), LCZ 3 (Compact low-rise) and LCZ-6 (Open low-rise), LCZ-3 (Compact low-rise) and LCZ-7 (Lightweight low-rise), LCZ-6 (Open low-rise) and LCZ-7 (Lightweight low-rise), and LCZ-8 (Large low-rise) and LCZ-9 (Sparsely built) in December. Such results indicate the suitability of the LCZ scheme was compromised in differentiating urban temperatures. The insignificant difference occurred among the pairs with the same characteristics in terms of compactness (e.g., compact, open) and building height (e.g., low-rise).
The suitability of the LCZ scheme for surface temperature differentiation varied temporally. For instance, in July, there was no significant difference between the LST of LCZ-1 (Compact high-rise) and that of LCZ-5 (Open midrise). The same case was also found in the pairs of LCZ-1 (Compact high-rise) and LCZ-8 (Large low-rise), LCZ-5 (Open midrise) and LCZ-8 (Large low-rise), and LCZ-7 (Lightweight low-rise) and LCZ-8 (Large low-rise). In August, there was no significant difference in the three pairs including LCZ-6 (Open low-rise) and LCZ-4 (Open high-rise), LCZ-5 (Open midrise) and LCZ-8 (Large low-rise), and LCZ-7 (Lightweight low-rise) and LCZ-8 (Large low-rise). In July and August, the insignificant pairs including LCZ-5 and LCZ-8, and LCZ-7 and LCZ-8 were observed. However, two pairs of LCZ-1 and LCZ-5, and LCZ-1 and LCZ-8 were found in July, but not in August.
Suitability of LCZ scheme for LST differentiation was also compromised among land-cover LCZs and it exhibited temporal variations. In December, there was no significant difference between five pairs, including LCZ-A (Dense trees) and LCZ-C (Bush, scrub), LCZ-B (Scattered trees) and LCZ E (Bare rock or paved), LCZ-D (Low plants) and LCZ-F (Bare soil or sand), LCZ-D (Low plants) and LCZ G (Water), and LCZ-F (Bare soil or sand) and LCZ-G (Water). Only temperatures of LCZ-A (Dense trees) and LCZ-G (Water) did not have significant differences in July. The pair of LCZ-C (Bush, scrub) and LCZ-F (Bare soil or sand) did not have significant differences in their surface temperatures.
Table 6 assesses the capability of the LCZ scheme in differentiating LST in different months. It shows that for the built LCZs within the whole study area, the LCZ scheme could differentiate 93.9% of the LST in August, indicating the strongest capability. This was followed by that in January, March and October, with a proportion of 91.1%. In comparison, the LCZ scheme could only differentiate 80.0% of the LST in May, indicating the weakest capability. For land-cover LCZs, the LCZ scheme could differentiate 95.2% of the temperature in July, August and October. However, the capability was the lowest in December with a proportion of 76.2%.
Figure 8 and Figure 9 reveal the suitability of LCZ scheme in differentiating LST in urban and rural area, respectively. Compared with the whole study area, the suitability weakens within the purely urban area. For instance, in December, there were 13 pairs of LCZ types, indicating insignificant LST difference within the urban area, while there were only six pairs when analyzing the whole study area. Compared with the urban area, there were 23 pairs of LCZs indicating insignificant LST difference in December. Such results indicate the spatial variation of the suitability of LCZ scheme in dividing LST. In hot seasons when urban thermal environments were a critical problem, there were six pairs of LCZs, exhibiting insignificant LST difference in both July and August within the urban area.
In comparison, there were five and six pairs in such two months within the rural area. Nevertheless, the pairs were different. For instance, in July, the six pairs in the urban area were LCZ-1 (Compact high-rise) and LCZ-3 (Compact low-rise), LCZ-1 (Compact high-rise) and LCZ-5 (Open midrise), LCZ-1 (Compact high-rise) and LCZ-7 (Lightweight low-rise), LCZ-3 (Compact low-rise) and LCZ-5 (Open midrise), LCZ-4 (Open high-rise) and LCZ-6 (Open low-rise), LCZ-7 (Lightweight low-rise) and LCZ-8 (Large low-rise). In August, such six pairs in urban area were LCZ-1 (Compact high-rise) and LCZ-4 (Open high-rise), LCZ-1 (Compact high-rise) and LCZ-6 (Open low-rise), LCZ-2 (Compact midrise) and LCZ-7 (Lightweight low-rise), LCZ-2 (Compact midrise) and LCZ-8 (Large low-rise), LCZ-4 (Open high-rise) and LCZ-6 (Open low-rise), and LCZ-7 (Lightweight low-rise) and LCZ-8 (Large low-rise). In addition, the results indicate that many pairs of land-cover LCZs did not have significant differences in their average LSTs.
Table 6 also presents the capability of the LCZ scheme in differentiating urban temperatures of urban and rural areas. It is observed that the built LCZs had the strongest capability in March by differentiating 95.6% of the urban temperatures. Following this, in both February and November, the built LCZs could differentiate 91.1% of the urban temperatures. However, the weakest capability was observed in December where only 71.1% of the urban temperatures was distinct significantly. The capability of built LCZs was far weaker when differentiating rural temperatures, compared with urban temperature. The strongest capability of built LCZs in differentiating rural LSTs was found in July, with 89.9% of the temperature distinguishable. However, only 48.9% of the temperature was differentiated by built LCZs in December, indicating the weakest capability. Moreover, the land-cover LCZs, compared with built LCZs, showed a much weaker capability in differentiating LSTs. The strongest capability of land-cover LSTs was recognized in May, with 85.7% of (urban) LSTs differentiable, while the weakest, with only 47.6% of the (urban) LSTs distinguishable, was observed in December. In July and August, the rural land-cover LCZs exhibited the strongest capability (95.2%), while the lowest (57.1%) was found in September.

5. Discussion and Implications

5.1. Spatiotemporal Variations of Urban Thermal Environments and the Proper Month and Method Selection for Accurate Assessment

This study revealed that in July and August, Shenyang underwent the worst thermal environments with the highest LST, and both December and January were the coldest months throughout the year. Shenyang underwent an obvious heat island phenomenon in summertime, while it had a longer period of cool island phenomenon from November to May. In comparison, both June and October were transition months, implying cool–heat and heat–cool island alterations, respectively. Such results, on the one hand, indicate the dependency of LST and SUHII on month variations because of solar incidence, cooling performance and thermal inertia of vegetation and water bodies, aerodynamic properties and their interactions with urban form (e.g., materials, typology). On the other hand, LST and SUHII have been important indicators for the quantification and assessment of urban thermal environment and heat stress so that an appropriate selection of the month for study is essential, in order to avoid an underestimation of heat-related impacts and hazards. For instance, whilst June and September were also typical months in summer and autumn, the LST and SUHII were much lower than those in July and August.
Apart from temporal variations, the SUHII experienced spatial variations which is relevant to the definition of urban and suburban/rural boundaries. The adoption of economic (three-ring, Figure 4) and administrative (built-up area, Figure 5) border to screen urban and suburban/rural areas resulted in the upper limits of SUHII or SUCII. The definition of 50% and 100% buffering zones, adjacent to urban areas, as the suburban/rural areas, resulted in a lower SUHII or SUCII, and a smaller buffering zone corresponded to a weaker SUHI or SUCI phenomenon. This result was different from the findings, reported in a study by Peng et al. [18] which originally introduced the buffering method for quantifying the SUHI phenomenon, that the definition of 50%, 100% and 150% buffering zones as suburban/rural areas did not make differences to SUHII in Beijing. Our results indicate that such a hypothesis was not applicable to the case study city of Shenyang, where the SUHII based on a 100% buffering zone was 0.13–0.16 °C higher than that based on a 50% buffering zone in July and August. With a larger buffering zone, the SUHII went higher until the upper SUHII limits, about two times that based on the 50% buffering zone.
The definition of the urban area also made a difference to the SUHII or SUCII because of the variation of land use/land cover included in the study area. Our results indicate that the SUHI for the built-up (urban) area was weaker than that calculated for the three-ring (urban) area, while the SUCI for the built-up area was stronger. With the change of urban area, the months that underwent cool island or heat island phenomenon varied as well so that the transition months migrated. Such results further exhibited the significance of definition of urban/suburban/rural area and the importance of determining proper months for investigating urban thermal environment and assessing heat-induced impacts.
Overall, the same definition of urban/suburban/rural area resulting in distinct SUHII within different cities may be relevant to the fact that the SUHII formation is associated with urban form (e.g., urban size, shape, density, centrality) and urban macro climatic background [15,19,51,52]. Therefore, there is a need to seek for a flexible method for suburban/rural definition that could result in stable SUHII [15,24,53].

5.2. Spatiotemporal Variations of the Responses of Land Surface Temperature to Local Climate Zone

The LCZ scheme was developed to differentiate temperature across different urban zones and existing studies have indicated that Compact high-rise (LCZ-1), Compact midrise (LCZ-2), Large low-rise (LCZ-8) and Heavy industry (LCZ-10) could generally have the highest LST [20,54]. Nevertheless, our results revealed that the heat sinks/sources varied significantly with the month. In hot months (e.g., June, July, August), Compact midrise (LCZ-2), Heavy industry (LCZ-10), Open low-rise (LCZ-6) and Lightweight low-rise (LCZ-7) were the built LCZs with the highest LST. Such results were partially similar to the existing results [20,54]. However, this was not a fixed pattern. Lightweight low-rise (LCZ-7), Large low-rise (LCZ-8) and Sparsely built (LCZ-9) had the highest LST, while Compact high-rise (LCZ-1) and Open high-rise (LCZ-4) had the lowest LST among ten built LCZs from October to May. Urban greenery and water bodies and their relationship with built LCZs could show different cooling/heating influences due to thermal inertia, resulting in the change of temperature pattern of LCZs [45,55]. The inconsistent pattern of LST temperature of different built LCZs also indicate the variations of different combinations of heat sources and sinks, such as deciduous trees for shading and evapotranspiration (a lower urban greenery ratio in winter compared that in summer), the intermittent operation of factories, the use of heating/cooling system in cold/hot seasons and heat linkages, and the alternation of macro climate in hot–cold seasons.
For land-cover LCZs, the Water (LCZ-G) and Dense trees (LCZ-A) were the strong heat sinks throughout the year, while in other studies, the Water (LCZ-G) could be heat sources in winter because of its high inertia [42]. Such results were consistent with previous studies that water bodies and forestry land were conducive to lowering urban temperature [23]. Moreover, icing and snow, in combination with Water and Dense trees, fostered its lowest LST in winter. Nevertheless, the contribution of other land-cover LCZs varied temporally. The Bare rock and paved (LCZ-E) was a heat source in warm months (e.g., from June to October), while it was heat sinks from December to May (Figure 6). Such results may be relevant to the capability of heat absorption and storage of rock and paved materials (e.g., stone, concrete, asphalt) in summer, while in winter the higher radiative capacity, compared with other land-cover LCZS, made it have a lower temperature. Likewise, the Low plants (LCZ-D) made different contributions depending on cold or warm seasons, where it was a heat source from December to May and it was a heat sink from June to November. This result might be relevant to the growth cycle of low vegetation (e.g., rice with irrigation, grass), where in warm months vegetation grows and generates cooling performance, while it changes to the land with dry grasses (e.g., straw, detritus) contributing to heat sources in cold months. Such a result may imply a change of LCZ types in different months.
The response of LST to LCZs diversified with urban and rural contexts. For instance, Lightweight low-rise (LCZ-7), Large low-rise (LCZ-8) and Heavy industry (LCZ -10) were the three built LCZs that had the highest LST throughout the year within an urban context. Different from this, the Compact midrise (LCZ-2), Compact low-rise (LCZ-3), Large low-rise (LCZ-8), Sparsely built (LCZ-9) and Heavy industry (LCZ-10) were the five built LCZs that had the highest LST within rural context. Both the hottest built LCZs within urban and urban contexts were different from those within the whole study area. Nevertheless, the Compact high-rise (LCZ-1), Open high-rise (LCZ-4) and Sparsely built (LCZ-9) were the three built LCZs that had the lowest LST within both urban and rural contexts. Moreover, Bush, scrub (LCZ-C), Low plants (LCZ-D), Bare rock or paved (LCZ-E) and Bare soil or sand (LCZ-F) had the highest LST within urban contexts, which was consistent with that within rural context. Both Dense trees (LCZ-A) and Water (LCZ-G) had the lowest LST within both urban and rural areas. Overall, such results indicate that the responses of LST to LCZs was a function of the scope of area of interest, particularly the highest urban temperature. LCZ scheme have been thought of as an effective tool [12], to support climate-sensitive urban planning and design (e.g., outdoor thermal comfort, heat exposure, heat stress) [56,57,58]. The spatiotemporal change of the hottest LCZs in our study implies the consideration of only a month or an improper selection of study area for identifying heat stress may lead to inaccurate results and mislead actions of urban heat mitigation and adaptation.

5.3. Suitability of Local Climate Zone Scheme for Urban Temperature Differentiation

Existing studies have found that the suitability of the LCZ scheme for LST differentiation can be affected by macroclimate (e.g., tropical, arid, temperate and cold) [40] and seasons (e.g., spring, summer, autumn and winter) [42]. It has been indicated that the LCZ scheme had the weakest capability of differentiating LST within arid climates, and it had a moderate level of capability within cold climates [40]. The study area of Shenyang is in cold regions and the LCZ scheme could differentiate LST, with 80.0–93.3% and 76.2–95.2% of the urban and rural temperature being differentiated, respectively. Nevertheless, the capability was dependent on different months and urban context (e.g., urban and rural areas). The case study in Nanjing indicated the capability was about 86.1%, 93.1%, 77.88% and 82.0% in spring, summer, autumn and winter, respectively [42]. In comparison, our study indicated in hot months (from July to October), the LCZ scheme had the strongest capability (89.9-93.3%) and in May it had the weakest capability (80.0%). For land-cover LCZs, our study indicated that the LCZ scheme had the strongest capability from July to October (90.5–95.2%) and the lowest from November to February (76.2–85.7%).
Our study further added a new finding that the capability of the LCZ scheme in differentiating temperature is dependent on the urban context (e.g., urban and rural), apart from macroclimate, seasons and months. Compared with the whole study area (a combination of urban and rural areas), the capability of built LCZs in either urban or rural contexts weakened. From July to October, the built LCZs could differentiate less than 90% of the urban temperature and only 71.1% and 77.8% of the temperature were differentiated in December and January, respectively. Furthermore, in a rural context, apart from 86.7% and 88.9% in August and July, less than 80% of the urban temperature was differentiated in all other months and even peaked at 48.9% in December. Such results can indicate that built LCZs had a higher level of applicability in urban context (highly urbanized area) compared with rural context (barely urbanized area). However, land-cover LCZs indicated a different result from built LCZs that within rural context the land-cover LCZs had a higher level of capability compared with that within urban context. Overall, spatiotemporal suitability of LCZ scheme for differentiating LST implies that the adoption of LCZ in urban planning and design should be pre-examined to avoid misleading results. One-month (e.g., in summer) LCZ data within a specific urban/rural context cannot fully represent and identify heat-induced impacts such as outdoor thermal comfort, heat stress and heat exposure of a city. It is essential to document several-month data based on specific contexts to overall support urban planning and design.

6. Conclusions

An accurate quantification of urban thermal environments is the premise of mitigating and avoiding the several consequences of urban heat challenges which are experienced by many cities. LST and SUHII are two important indicators, and the LCZ scheme is an important tool to differentiate surface temperatures and intra-urban temperatures. However, the landscape effects on monthly variation of SUHII and the applicability of LCZ scheme are not well understood. This study investigated the variation of SUHI effects and the suitability of the LCZ scheme for LST differentiation in Shenyang, China. The findings indicated that both the SUHII and the suitability of the LCZ scheme exhibited spatiotemporal variations. An accurate analysis of SUHII should, therefore, properly define urban and rural contexts and specify the month, and one-month analysis cannot fully represent urban thermal environments of a season. The LST of both built and land-cover LCZs could not follow a fixed order, particularly for the highest temperature that varied significantly with both month and spatial boundary. Moreover, the suitability of LCZ scheme for LST differentiation depended on both urban context and the month. In hot months such as July and August, the LCZ scheme in aspects of both built types and land-cover types had a high level of suitability while in cold months such as November, December and January the suitability weakened. The built LCZs within urban areas could have a higher level of suitability than that within rural areas, while the land-cover LCZs exhibited a reverse pattern. Overall, this paper added new findings on spatial variability and temporal heterogeneity of urban temperature and the applicability of LCZ scheme for LST differentiation. It can also provide important implications for the assessment of heat-induced impacts and supports climate-sensitive planning and design.
This paper has some possible limitations and future studies are needed to reveal the spatiotemporal variations of LST distribution, responses of LST to LCZs and the suitability of the LCZ scheme. First, built upon the landscape in August, this study only applied one suite of the LCZ scheme, which as a result cannot respect the possible LCZ variation (e.g., changes of both built and land-cover LCZs with deciduous trees and vegetation death in cold seasons) throughout the year. Therefore, it is essential to reproduce seasonal and monthly LCZ images to further verify the results and conclusions. Second, the urban and rural contexts considered in this study were differentiated within a same city, which might be not capable of representing highly urbanized and barely urbanized cities. Therefore, future studies are needed to verify the results and conclusions relevant to the urban context with the selection of metropolitans and their surrounding satellite cities. Third, this study analyzed the monthly variation of LST distribution, responses of LST to LCZs and the suitability of LCZ scheme within only one city with Dwa in cold regions and it is wise to conduct further investigations in other cities with diverse climates to gain a better understanding of the dynamics of the LCZ–LST relationships. Fourth, this study analyzed the single-year LST responses to the LCZ scheme, while the multi-year analysis could be of interest to indicate the LCZ–LST relationships in a dynamic context along with urbanization and climate change.

Author Contributions

Z.Z.: formal analysis, investigation, methodology, software, validation, visualization, writing—review & editing; A.S.: conceptualization, funding acquisition, project administration, resources, writing—review & editing; X.D.: investigation, resources, software, visualization, writing—review & editing; L.S.: formal analysis, visualization, writing—review & editing; B.-J.H.: conceptualization, data curation, formal analysis, funding acquisition, investigation, methodology, project administration, resources, visualization, roles/writing—original draft, writing—review & editing. All authors have read and agreed to the published version of the manuscript.

Funding

This project is partially supported by JSPS KAKENHI Grant Number 19K20497. Many thanks go to the projects NO. 2021CDJQY-004 and NO. 2021CDJQY-023, supported by the Fundamental Research Funds for the Central Universities.

Data Availability Statement

The data presented in this study are available on request from the corresponding author.

Conflicts of Interest

The authors declare no conflict of interest.

Appendix A

Table A1. Land Surface Temperature of Different Local Climate Zones in Different Months within Urban Context.
LCZDecemberJanuaryFebruaryMarch
RangeMeanRangeMeanRangeMeanRangeMean
LCZ-1 (Compact high-rise)−20.28~1.63−4.69−16.26~−0.13−4.87−9.04~12.746.12−4.89~17.9510.65
LCZ-2 (Compact midrise)−18.43~2.81−4.15−14.45~1.46−4.22−6.30~16.347.23−1.08~21.1812.00
LCZ-3 (Compact low-rise)−24.17~3.74−4.36−20.47~3.72−4.01−11.48~15.198.22−9.37~21.7513.29
LCZ-4 (Open high-rise)−9.54~1.62−4.74−8.45~1.97−4.821.02~14.496.222.96~19.0510.97
LCZ-5 (Open midrise)−19.14~0.70−4.57−17.30~0.49−4.40−6.30~13.827.16−3.01~20.1112.18
LCZ-6 (Open low-rise)−9.28~1.02−4.55−8.38~0.54−4.071.21~14.217.695.30~19.3912.68
LCZ-7 (Lightweight low-rise)−21.00~3.56−3.92−18.69~4.35−3.70−8.51~18.419.00−3.57~25.0914.28
LCZ-8 (Large low-rise)−25.42~3.35−3.86−22.25~2.02−3.80−12.47~18.888.60−9.83~25.7113.91
LCZ-9 (Sparsely built)−26.81~1.58−4.32−21.74~2.07−3.83−12.69~16.748.11−9.58~20.1313.13
LCZ-10 (Heavy industry)−17.34~4.66−4.11−13.72~3.21−3.75−6.36~19.798.47−2.35~24.7413.60
LCZ-A (Dense trees)−7.35~−0.48−3.89−6.63~−1.41−4.512.41~12.196.695.06~17.5911.63
LCZ-B (Scattered trees)−9.43~0.08−3.80−7.99~0.26−3.992.32~14.367.806.77~19.9112.98
LCZ-C (Bush, scrub)−7.58~0.08−3.65−6.68~−0.74−3.344.41~13.729.168.64~18.5314.41
LCZ-D (Low plants)−27.50~0.45−3.83−21.84~0.84−3.08−12.18~15.679.47−9.23~21.1314.52
LCZ-E (Bare rock or paved)−18.09~3.12−4.41−14.37~3.36−3.85−3.10~15.188.42−0.09~20.3313.45
LCZ-F (Bare soil or sand)−19.68~1.34−4.15−17.41~1.03−3.56−8.43~15.178.65−3.24~20.4213.67
LCZ-G (Water)−8.57~−0.09−4.84−7.88~0.50−5.031.23~12.424.402.23~16.997.96
LCZAprilMayJuneJuly
RangeMeanRangeMeanRangeMeanRangeMean
LCZ-1 (Compact high-rise)11.87~27.5221.256.29~33.2325.3123.14~38.1931.8219.99~40.1333.00
LCZ-2 (Compact midrise)13.42~29.8822.4011.79~35.2026.7424.99~38.0432.9923.63~40.5934.37
LCZ-3 (Compact low-rise)7.93~28.9223.533.66~34.7327.2020.70~37.9332.7318.60~40.3932.99
LCZ-4 (Open high-rise)15.00~29.1721.6416.11~33.4625.2424.02~37.0831.5624.46~38.3132.06
LCZ-5 (Open midrise)12.31~29.5822.708.20~38.2526.4821.84~38.9932.4520.92~40.0632.95
LCZ-6 (Open low-rise)17.68~28.8923.2118.59~35.1826.8025.71~37.1732.1526.08~39.9832.17
LCZ-7 (Lightweight low-rise)7.83~33.6424.197.01~40.9927.8020.31~42.0333.3319.29~43.3433.65
LCZ-8 (Large low-rise)7.36~33.8123.851.84~41.3427.6318.91~41.7733.1917.36~43.1133.47
LCZ-9 (Sparsely built)6.20~29.5223.541.87~34.8326.7719.18~38.5531.4416.78~39.8331.44
LCZ-10 (Heavy industry)13.34~32.9623.669.81~40.4127.8224.54~41.6333.5922.68~44.2034.63
LCZ-A (Dense trees)16.01~29.2721.8716.93~33.9021.6624.71~34.9727.4225.15~35.3627.57
LCZ-B (Scattered trees)18.40~28.9823.2719.96~33.9825.9026.49~36.7530.7326.56~37.2030.47
LCZ-C (Bush, scrub)19.04~28.8324.8422.38~35.2728.3828.42~36.0732.8427.70~37.5831.67
LCZ-D (Low plants)5.15~29.7724.890.28~35.0428.3617.69~37.5831.7515.89~39.1530.96
LCZ-E (Bare rock or paved)12.91~29.3723.569.37~34.9627.2424.45~38.4632.8022.14~40.7632.93
LCZ-F (Bare soil or sand)12.54~29.5123.9210.62~34.1927.6622.82~38.3332.7020.79~39.1232.45
LCZ-G (Water)13.33~26.6118.5315.63~30.2620.5621.41~35.4127.0222.19~34.7827.40
LCZAugustSeptemberOctoberNovember
RangeMeanRangeMeanRangeMeanRangeMean
LCZ-1 (Compact high-rise)27.82~41.6934.848.41~32.2725.03−0.27~24.2517.04−3.36~14.728.96
LCZ-2 (Compact midrise)28.98~41.5536.1012.78~35.7126.482.93~26.1118.33−1.34~20.449.85
LCZ-3 (Compact low-rise)24.30~42.5235.636.48~33.7225.87−1.84~25.2918.53−5.47~18.1310.59
LCZ-4 (Open high-rise)27.80~41.3034.5415.51~31.6024.5411.36~23.6316.932.33~15.539.26
LCZ-5 (Open midrise)26.77~41.7835.449.04~32.9525.501.97~24.5317.84−2.71~16.559.90
LCZ-6 (Open low-rise)27.92~41.7934.8519.75~32.8925.0112.14~24.1217.865.50~15.7110.15
LCZ-7 (Lightweight low-rise)24.00~45.4836.424.48~37.9526.65−0.49~30.1619.25−6.05~20.6211.43
LCZ-8 (Large low-rise)23.64~45.1936.064.12~37.8626.44−4.09~30.3619.09−7.54~20.5511.11
LCZ-9 (Sparsely built)22.64~42.1234.091.49~33.6624.57−5.79~26.1717.67−8.97~16.4410.73
LCZ-10 (Heavy industry)28.86~45.5636.8812.26~37.4327.183.03~29.8119.27−1.50~22.3910.81
LCZ-A (Dense trees)26.98~36.7030.3420.13~27.1521.6213.00~20.8014.716.84~14.4110.61
LCZ-B (Scattered trees)29.66~38.8133.5220.38~29.6123.7912.89~23.5116.885.92~15.9110.82
LCZ-C (Bush, scrub)30.65~40.3634.8322.39~29.2725.2014.55~22.8918.847.11~17.6411.63
LCZ-D (Low plants)22.52~41.1533.351.04~31.6924.34−6.11~24.6718.25−10.03~16.8011.28
LCZ-E (Bare rock or paved)27.49~42.4035.7710.50~33.2525.902.70~25.4318.71−0.90~28.21−1.00
LCZ-F (Bare soil or sand)25.76~41.4435.319.67~32.6025.541.02~25.3118.64−2.33~16.7310.80
LCZ-G (Water)26.93~37.5830.2919.64~28.2722.0213.09~20.9015.616.17~13.778.87

Appendix B

Table A2. Land Surface Temperature of Different Local Climate Zones in Different Months within Rural Context.
LCZDecemberJanuaryFebruaryMarch
RangeMeanRangeMeanRangeMeanRangeMean
LCZ-1 (Compact high-rise)−9.25~1.00−4.35−8.58~−0.05−3.810.45~13.137.795.10~18.7812.36
LCZ-2 (Compact midrise)−8.62~1.39−4.05−8.10~0.99−3.481.23~14.728.972.53~21.0214.02
LCZ-3 (Compact low-rise)−20.21~2.08−3.61−16.59~2.62−3.14−5.83~15.009.69−1.77~22.6714.80
LCZ-4 (Open high-rise)−20.80~4.43−4.07−19.65~3.86−3.80−6.54~15.527.93−3.09~21.6512.47
LCZ-5 (Open midrise)−17.00~4.03−4.29−14.46~2.98−3.76−1.76~15.368.502.00~20.9213.55
LCZ-6 (Open low-rise)−13.75~2.17−3.84−12.38~1.82−3.43−0.97~16.059.26−1.48~21.6113.91
LCZ-7 (Lightweight low-rise)−25.58~2.88−3.81−24.72~2.83−3.60−12.77~16.789.24−7.00~23.2614.38
LCZ-8 (Large low-rise)−16.87~1.96−3.47−16.28~2.50−3.19−5.57~16.559.501.56~22.8914.89
LCZ-9 (Sparsely built)−17.26~4.36−3.56−15.85~3.88−3.14−4.97~18.139.76−3.19~24.5514.07
LCZ-10 (Heavy industry)−15.81~2.86−3.43−13.74~3.35−3.16−2.03~16.7710.032.86~23.1115.33
LCZ-A (Dense trees)−9.26~4.50−4.54−9.22~3.26−4.770.35~15.757.22−1.90~20.8011.02
LCZ-B (Scattered trees)−9.62~2.35−4.36−9.17~1.59−3.790.77~15.208.633.79~20.0713.24
LCZ-C (Bush, scrub)−7.03~3.10−3.10−5.71~3.78−2.693.95~15.5610.486.71~20.6615.14
LCZ-D (Low plants)−21.72~2.93−2.63−19.35~3.95−2.37−9.85~22.8411.65−9.00~25.9715.83
LCZ-E (Bare rock or paved)−28.64~4.05−3.78−22.09~3.98−3.37−16.53~16.049.37−13.12~21.7114.25
LCZ-F (Bare soil or sand)−32.33~2.76−3.47−27.79~2.42−3.02−22.77~16.629.98−18.21~23.0914.87
LCZ-G (Water)−8.88~5.53−4.77−9.30~4.16−5.04−0.89~14.783.75−2.30~19.056.83
LCZAprilMayJuneJuly
RangeMeanRangeMeanRangeMeanRangeMean
LCZ-1 (Compact high-rise)15.15~29.6222.9717.42~34.1525.9724.96~36.6330.9125.77~37.5030.49
LCZ-2 (Compact midrise)13.23~30.0924.0414.95~33.9427.9123.58~36.4732.8123.23~38.2733.36
LCZ-3 (Compact low-rise)9.70~30.3224.975.45~35.4527.8521.00~37.7932.4118.51~37.9031.65
LCZ-4 (Open high-rise)10.62~29.5422.876.88~35.5025.8620.72~37.7830.7819.37~37.9630.52
LCZ-5 (Open midrise)13.71~29.7824.0510.71~34.1627.4922.12~40.0232.4521.18~39.9532.47
LCZ-6 (Open low-rise)13.34~30.6124.4515.06~35.3628.0024.23~37.1632.2521.68~38.4331.39
LCZ-7 (Lightweight low-rise)6.56~30.6024.373.36~35.5327.4519.28~40.5132.4916.28~40.6232.07
LCZ-8 (Large low-rise)12.73~30.7624.989.56~34.8628.0821.88~38.2932.8021.64~40.3232.17
LCZ-9 (Sparsely built)11.72~31.2324.359.75~36.4627.1021.15~37.7829.4921.55~39.4928.52
LCZ-10 (Heavy industry)14.29~30.8124.9413.89~35.2928.7323.43~40.8033.5824.18~42.8834.26
LCZ-A (Dense trees)13.35~31.6422.9015.07~37.0524.6521.25~36.9228.2122.22~36.8927.81
LCZ-B (Scattered trees)15.44~30.2824.6016.35~35.0327.6523.98~37.7330.8423.88~38.6130.17
LCZ-C (Bush, scrub)18.40~29.3925.6720.36~35.3329.2127.29~38.8432.4225.62~37.0931.03
LCZ-D (Low plants)7.48~35.4826.131.81~37.0029.2915.70~39.6630.9616.66~38.7328.55
LCZ-E (Bare rock or paved)5.00~31.1924.42−2.81~35.0827.7817.85~39.0432.4313.85~38.8031.92
LCZ-F (Bare soil or sand)0.77~31.0424.97−7.61~35.4328.2114.82~39.0832.3810.94~40.3331.33
LCZ-G (Water)10.36~29.2716.1612.34~34.9018.0020.71~36.0624.7320.76~35.0524.80
LCZAugustSeptemberOctoberNovember
RangeMeanRangeMeanRangeMeanRangeMean
LCZ-1 (Compact high-rise)28.10~39.9232.9919.38~30.5423.9411.86~23.1317.584.62~17.4110.62
LCZ-2 (Compact midrise)27.15~40.4436.0319.90~33.6926.4014.43~26.5519.197.31~17.7811.39
LCZ-3 (Compact low-rise)25.10~40.6033.796.42~32.8225.062.21~26.1019.08−4.64~17.5411.58
LCZ-4 (Open high-rise)24.31~42.2133.175.07~33.0624.131.26~26.1917.67−3.45~16.7810.71
LCZ-5 (Open midrise)26.81~42.5235.089.18~34.4925.453.10~28.3518.47−0.74~18.4910.89
LCZ-6 (Open low-rise)26.30~41.2533.9713.76~32.1624.866.58~24.9618.571.61~17.7411.55
LCZ-7 (Lightweight low-rise)22.62~44.5934.442.24~37.6425.33−5.15~30.8718.80−7.07~19.8511.55
LCZ-8 (Large low-rise)26.15~44.2334.5610.33~34.0425.624.29~26.2819.35−2.23~19.0511.80
LCZ-9 (Sparsely built)25.22~42.2330.629.11~33.2522.692.55~24.8917.03−2.73~18.0911.19
LCZ-10 (Heavy industry)28.90~45.0136.8313.17~36.6627.326.06~30.2819.921.21~19.4712.37
LCZ-A (Dense trees)25.09~39.1330.6718.93~29.1121.5611.17~23.9214.885.92~18.1211.22
LCZ-B (Scattered trees)27.09~41.8233.3619.24~32.62−1.0011.34~24.6517.324.99~17.2811.70
LCZ-C (Bush, scrub)28.23~41.8934.0021.18~30.5124.5314.78~23.4619.046.90~20.2812.63
LCZ-D (Low plants)23.88~41.7130.492.05~45.4522.91−3.64~27.0918.19−8.46~20.0612.57
LCZ-E (Bare rock or paved)24.10~42.9334.710.05~33.2325.27−6.37~25.6418.86−11.45~20.2611.62
LCZ-F (Bare soil or sand)22.59~43.6133.76−3.27~35.9624.88−12.84~29.0318.97−15.94~19.6311.77
LCZ-G (Water)25.72~40.0928.0918.57~28.9720.7112.31~22.7115.375.38~17.938.71

Appendix C

Figure A1. Deviation of the LST of Different Types of LCZs from the Average LST within an Urban Context (°C).
Remotesensing 13 04338 g0a1

Appendix D

Figure A2. Deviation of the LST of Different Types of LCZs from the Average LST within a Rural Context (°C).
Remotesensing 13 04338 g0a2

References

  1. United Nations. 68% of the World Population Projected to Live in Urban Areas by 2050. In 2018 Revision of World Urbanization Prospects; United Nations: New York, NY, USA, 2018. [Google Scholar]
  2. Department of Economic and Social Affairs, Sustainable Development, United Nations. Goal 11: Make Cities and Human Settlements Inclusive, Safe, Resilient and Sustainable. 2021; Available online: https://sdgs.un.org/goals/goal11 (accessed on 19 October 2021).
  3. Howard, L. The Climate of London: Deduced from Meteorological Observations Made in the Metropolis and at Various Places Around It; Darton, J.H., Longman, A.A., Highley, S.H., Hunter, R., Eds.; Joseph Rickerby: London, UK, 1833; Volume 3, Available online: https://books.google.co.jp/books?id=-yllMDVOz1IC&printsec=frontcover&hl=zh-CN&source=gbs_ge_summary_r&cad=0#v=onepage&q&f=false (accessed on 19 October 2021).
  4. Oke, T.R. The energetic basis of the urban heat island. Q. J. R. Meteorol. Soc. 1982, 108, 1–24. [Google Scholar] [CrossRef]
  5. He, B.-J.; Zhao, D.; Xiong, K.; Qi, J.; Ulpiani, G.; Pignatta, G.; Prasad, D.; Jones, P. A framework for addressing urban heat challenges and associated adaptive behavior by the public and the issue of willingness to pay for heat resilient infrastructure in Chongqing, China. Sustain. Cities Soc. 2021, 75, 103361. [Google Scholar] [CrossRef]
  6. Santamouris, M. On the energy impact of urban heat island and global warming on buildings. Energy Build. 2014, 82, 100–113. [Google Scholar] [CrossRef]
  7. Guhathakurta, S.; Gober, P. The Impact of the Phoenix Urban Heat Island on Residential Water Use. J. Am. Plan. Assoc. 2007, 73, 317–329. [Google Scholar] [CrossRef]
  8. Santamouris, M.; Kolokotsa, D. Urban Climate Mitigation Techniques; Routledge: Oxfordshire, UK, 2016. [Google Scholar]
  9. Lowe, S.A. An energy and mortality impact assessment of the urban heat island in the US. Environ. Impact Assess. Rev. 2016, 56, 139–144. [Google Scholar] [CrossRef]
  10. Meehl, G.A.; Tebaldi, C. More Intense, More Frequent, and Longer Lasting Heat Waves in the 21st Century. Science 2004, 305, 994. [Google Scholar] [CrossRef] [Green Version]
  11. He, B.-J.; Wang, J.; Liu, H.; Ulpiani, G. Localized synergies between heat waves and urban heat islands: Implications on human thermal comfort and urban heat management. Environ. Res. 2021, 193, 110584. [Google Scholar] [CrossRef]
  12. Perera, N.G.R.; Emmanuel, R. A “Local Climate Zone” based approach to urban planning in Colombo, Sri Lanka. Urban Clim. 2018, 23, 188–203. [Google Scholar] [CrossRef] [Green Version]
  13. Oke, T.R.; Mills, G.; Christen, A.; Voogt, J.A. Urban Climates; Cambridge University Press: Cambridge, UK, 2017. [Google Scholar]
  14. Derdouri, A.; Wang, R.; Murayama, Y.; Osaragi, T. Understanding the Links between LULC Changes and SUHI in Cities: Insights from Two-Decadal Studies (2001–2020). Remote Sens. 2021, 13, 3654. [Google Scholar] [CrossRef]
  15. Liu, H.; Huang, B.; Zhan, Q.; Gao, S.; Li, R.; Fan, Z. The influence of urban form on surface urban heat island and its planning implications: Evidence from 1288 urban clusters in China. Sustain. Cities Soc. 2021, 71, 102987. [Google Scholar] [CrossRef]
  16. Yang, J.; Wang, Y.; Xue, B.; Li, Y.; Xiao, X.; Xia, J.; He, B. Contribution of urban ventilation to the thermal environment and urban energy demand: Different climate background perspectives. Sci. Total. Environ. 2021, 795, 148791. [Google Scholar] [CrossRef] [PubMed]
  17. Luo, X.; Yang, J.; Sun, W.; He, B. Suitability of human settlements in mountainous areas from the perspective of ventilation: A case study of the main urban area of Chongqing. J. Clean. Prod. 2021, 310, 127467. [Google Scholar] [CrossRef]
  18. Peng, S.; Piao, S.; Ciais, P.; Friedlingstein, P.; Ottle, C.; Bréon, F.-M.; Nan, H.; Zhou, L.; Myneni, R.B. Surface Urban Heat Island Across 419 Global Big Cities. Environ. Sci. Technol. 2012, 46, 696–703. [Google Scholar] [CrossRef] [PubMed]
  19. Li, Y.; Schubert, S.; Kropp, J.P.; Rybski, D. On the influence of density and morphology on the Urban Heat Island intensity. Nat. Commun. 2020, 11, 2647. [Google Scholar] [CrossRef]
  20. Stewart, I.D.; Oke, T.R. Local Climate Zones for Urban Temperature Studies. Bull. Am. Meteorol. Soc. 2012, 93, 1879–1900. [Google Scholar] [CrossRef]
  21. Pal, S.; Ziaul, S. Detection of land use and land cover change and land surface temperature in English Bazar urban centre. Egypt. J. Remote. Sens. Space Sci. 2017, 20. [Google Scholar] [CrossRef] [Green Version]
  22. Amiri, R.; Weng, Q.; Alimohammadi, A.; Alavipanah, S.K. Spatial–temporal dynamics of land surface temperature in relation to fractional vegetation cover and land use/cover in the Tabriz urban area, Iran. Remote Sens. Environ. 2009, 113, 2606–2617. [Google Scholar] [CrossRef]
  23. Zhao, Z.-Q.; He, B.-J.; Li, L.-G.; Wang, H.-B.; Darko, A. Profile and concentric zonal analysis of relationships between land use/land cover and land surface temperature: Case study of Shenyang, China. Energy Build. 2017, 155, 282–295. [Google Scholar] [CrossRef]
  24. Li, H.; Zhou, Y.; Li, X.; Meng, L.; Wang, X.; Wu, S.; Sodoudi, S. A new method to quantify surface urban heat island intensity. Sci. Total Environ. 2018, 624, 262–272. [Google Scholar] [CrossRef] [PubMed]
  25. Adolphe, L. A Simplified Model of Urban Morphology: Application to an Analysis of the Environmental Performance of Cities. Environ. Plan. B Plan. Des. 2001, 28, 183–200. [Google Scholar] [CrossRef]
  26. Osmond, P. The urban structural unit: Towards a descriptive framework to support urban analysis and planning. Urban Morphol. 2010, 14, 5–20. [Google Scholar]
  27. He, B.-J.; Ding, L.; Prasad, D. Enhancing urban ventilation performance through the development of precinct ventilation zones: A case study based on the Greater Sydney, Australia. Sustain. Cities Soc. 2019, 47, 101472. [Google Scholar] [CrossRef]
  28. Fenner, D.; Meier, F.; Bechtel, B.; Otto, M.; Scherer, D. Intra and inter ‘local climate zone’ variability of air temperature as observed by crowdsourced citizen weather stations in Berlin, Germany. Meteorol. Z. 2017, 26, 525–547. [Google Scholar] [CrossRef]
  29. Alexander, P.J.; Mills, G. Local Climate Classification and Dublin’s Urban Heat Island. Atmosphere 2014, 5, 755. [Google Scholar] [CrossRef] [Green Version]
  30. Lau, K.K.-L.; Chung, S.C.; Ren, C. Outdoor thermal comfort in different urban settings of sub-tropical high-density cities: An approach of adopting local climate zone (LCZ) classification. Build. Environ. 2019, 154, 227–238. [Google Scholar] [CrossRef]
  31. Kotharkar, R.; Bagade, A. Evaluating urban heat island in the critical local climate zones of an Indian city. Landsc. Urban Plan. 2018, 169, 92–104. [Google Scholar] [CrossRef]
  32. Ochola, E.M.; Fakharizadehshirazi, E.; Adimo, A.O.; Mukundi, J.B.; Wesonga, J.M.; Sodoudi, S. Inter-local climate zone differentiation of land surface temperatures for Management of Urban Heat in Nairobi City, Kenya. Urban Clim. 2020, 31, 100540. [Google Scholar] [CrossRef]
  33. Lehnert, M.; Geletič, J.; Husák, J.; Vysoudil, M. Urban field classification by “local climate zones” in a medium-sized Central European city: The case of Olomouc (Czech Republic). Theor. Appl. Climatol. 2015, 122, 531–541. [Google Scholar] [CrossRef]
  34. Yang, J.; Jin, S.; Xiao, X.; Jin, C.; Xia, J.; Li, X.; Wang, S. Local climate zone ventilation and urban land surface temperatures: Towards a performance-based and wind-sensitive planning proposal in megacities. Sustain. Cities Soc. 2019, 47, 101487. [Google Scholar] [CrossRef]
  35. Stewart, I.D.; Oke, T.R.; Krayenhoff, E.S. Evaluation of the ‘local climate zone’ scheme using temperature observations and model simulations. Int. J. Climatol. 2014, 34, 1062–1080. [Google Scholar] [CrossRef]
  36. Bechtel, B.; Demuzere, M.; Mills, G.; Zhan, W.; Sismanidis, P.; Small, C.; Voogt, J. SUHI analysis using Local Climate Zones—A comparison of 50 cities. Urban Clim. 2019, 28, 100451. [Google Scholar] [CrossRef]
  37. Chen, X.; Yang, J.; Ren, C.; Jeong, S.; Shi, Y. Standardizing thermal contrast among local climate zones at a continental scale: Implications for cool neighborhoods. Build. Environ. 2021, 197, 107878. [Google Scholar] [CrossRef]
  38. Brousse, O.; Georganos, S.; Demuzere, M.; Vanhuysse, S.; Wouters, H.; Wolff, E.; Linard, C.; van Lipzig, N.P.M.; Dujardin, S. Using Local Climate Zones in Sub-Saharan Africa to tackle urban health issues. Urban Clim. 2019, 27, 227–242. [Google Scholar] [CrossRef] [Green Version]
  39. Demuzere, M.; Bechtel, B.; Middel, A.; Mills, G. Mapping Europe into local climate zones. PLoS ONE 2019, 14, e0214474. [Google Scholar] [CrossRef] [PubMed] [Green Version]
  40. Eldesoky, A.H.M.; Gil, J.; Pont, M.B. The suitability of the urban local climate zone classification scheme for surface temperature studies in distinct macroclimate regions. Urban Clim. 2021, 37, 100823. [Google Scholar] [CrossRef]
  41. Geletič, J.; Lehnert, M.; Savić, S.; Milošević, D. Inter-/intra-zonal seasonal variability of the surface urban heat island based on local climate zones in three central European cities. Build. Environ. 2019, 156, 21–32. [Google Scholar] [CrossRef]
  42. Du, P.; Chen, J.; Bai, X.; Han, W. Understanding the seasonal variations of land surface temperature in Nanjing urban area based on local climate zone. Urban Clim. 2020, 33, 100657. [Google Scholar] [CrossRef]
  43. Gémes, O.; Tobak, Z.; Leeuwen, B.V. Satellite Based Analysis of Surface Urban Heat Island Intensity. J. Environ. Geogr. 2016, 9, 23–30. [Google Scholar] [CrossRef] [Green Version]
  44. Ziaul, S.; Pal, S. Analyzing control of respiratory particulate matter on Land Surface Temperature in local climatic zones of English Bazar Municipality and Surroundings. Urban Clim. 2018, 24, 34–50. [Google Scholar] [CrossRef]
  45. He, B.-J.; Zhao, Z.-Q.; Shen, L.-D.; Wang, H.-B.; Li, L.-G. An approach to examining performances of cool/hot sources in mitigating/enhancing land surface temperature under different temperature backgrounds based on landsat 8 image. Sustain. Cities Soc. 2019, 44, 416–427. [Google Scholar] [CrossRef]
  46. Shenyang Statistics Bureau. Bulletin No.1, Shenyang Seventh National Census. 2021-06-01; Shenyang Statistics Bureau: Shenyang, China, 2021.
  47. Shenyang Statistics Bureau. Bulletin No.6, Shenyang Seventh National Census. 2021-06-01; Shenyang Statistics Bureau: Shenyang, China, 2021.
  48. Qin, Z.; Karnieli, A.; Berliner, P. A mono-window algorithm for retrieving land surface temperature from Landsat TM data and its application to the Israel-Egypt border region. Int. J. Remote. Sens. 2001, 22, 3719–3746. [Google Scholar] [CrossRef]
  49. Zhou, D.; Zhao, S.; Liu, S.; Zhang, L.; Zhu, C. Surface urban heat island in China’s 32 major cities: Spatial patterns and drivers. Remote Sens. Environ. 2014, 152, 51–61. [Google Scholar] [CrossRef]
  50. Zhang, L.; Meng, Q.; Sun, Z.; Sun, Y. Spatial and Temporal Analysis of the Mitigating Effects of Industrial Relocation on the Surface Urban Heat Island over China. ISPRS Int. J. Geo-Inf. 2017, 6, 121. [Google Scholar] [CrossRef] [Green Version]
  51. Debbage, N.; Shepherd, J.M. The urban heat island effect and city contiguity. Comput. Environ. Urban Syst. 2015, 54, 181–194. [Google Scholar] [CrossRef]
  52. Yue, W.; Liu, X.; Zhou, Y.; Liu, Y. Impacts of urban configuration on urban heat island: An empirical study in China mega-cities. Sci. Total Environ. 2019, 671, 1036–1046. [Google Scholar] [CrossRef]
  53. Imhoff, M.L.; Zhang, P.; Wolfe, R.E.; Bounoua, L. Remote sensing of the urban heat island effect across biomes in the continental USA. Remote Sens. Environ. 2010, 114, 504–513. [Google Scholar] [CrossRef] [Green Version]
  54. Wang, R.; Cai, M.; Ren, C.; Bechtel, B.; Xu, Y.; Ng, E. Detecting multi-temporal land cover change and land surface temperature in Pearl River Delta by adopting local climate zone. Urban Clim. 2019, 28, 100455. [Google Scholar] [CrossRef]
  55. Wang, Y.; Ouyang, W. Investigating the heterogeneity of water cooling effect for cooler cities. Sustain. Cities Soc. 2021, 75, 103281. [Google Scholar] [CrossRef]
  56. Geletič, J.; Lehnert, M.; Savić, S.; Milošević, D. Modelled spatiotemporal variability of outdoor thermal comfort in local climate zones of the city of Brno, Czech Republic. Sci. Total Environ. 2018, 624, 385–395. [Google Scholar] [CrossRef] [PubMed]
  57. Kotharkar, R.; Ghosh, A.; Kotharkar, V. Estimating summertime heat stress in a tropical Indian city using Local Climate Zone (LCZ) framework. Urban Clim. 2021, 36, 100784. [Google Scholar] [CrossRef]
  58. Gilabert, J.; Deluca, A.; Lauwaet, D.; Ballester, J.; Corbera, J.; Llasat, M.C. Assessing heat exposure to extreme temperatures in urban areas using the Local Climate Zone classification. Nat. Hazards Earth Syst. Sci. 2021, 21, 375–391. [Google Scholar] [CrossRef]
Figure 1. Location of study area and its composition according to China’s land use status remote sensing monitoring database (http://www.resdc.cn, accessed on 19 October 2021).
Remotesensing 13 04338 g001
Figure 2. Distribution of local climate zones in the study area.
Remotesensing 13 04338 g002
Figure 3. Monthly (instantaneous) land surface temperature variations and the identification of heat/cool island phenomenon from 2018 to 2020.
Remotesensing 13 04338 g003
Figure 4. Monthly LST and SUHII variations of the three-ring area in buffer 50%, buffer 100% and buffer 0% scenarios from 2018 to 2020.
Remotesensing 13 04338 g004
Figure 5. Monthly LST and SUHII variations of the built-up area in buffer 50%, buffer 100% and buffer 0% scenarios from 2018 to 2020.
Remotesensing 13 04338 g005
Figure 6. Deviation of the LST of different types of LCZs from the average LST of whole study area from 2018 to 2020 (°C).
Remotesensing 13 04338 g006
Figure 7. Difference of land surface temperatures of local climate zone types within the whole study area (Circle denotes significant difference at p < 0.05 level, blank demotes no significant difference).
Remotesensing 13 04338 g007
Figure 8. Difference of land surface temperatures of local climate zone types within an urban context (Circle denotes significant difference at p < 0.05 level, blank demotes no significant difference).
Remotesensing 13 04338 g008
Figure 9. Difference of land surface temperatures of local climate zone types within a rural context (Circle denotes significant difference at p < 0.05 level, blank demotes no significant difference).
Remotesensing 13 04338 g009
Table 1. Date list and weather conditions in different months corresponding to 12 thermal-infrared imageries.
DateAir Temperature/°CRelative Humidity/%Wind Speed/m·s–1Surface Temperature/°C
24 December 2018−7.1590.9−9.5
25 January 2019−6.9352.6−3.5
26 February 20191.5361.96.9
14 March 20194.8372.113.9
15 April 201918.9214.030.4
1 May 201916.7244.234.2
20 June 202029.4445.449.9
4 July 201928.5474.648.5
2 August 201833.2384.040.5
22 September 201920.4465.233.7
8 October 201911.4308.024.6
9 November 20197.5471.318.7
Table 2. The area of different LCZ types in the study area, built-up area and rural areas.
LCZ TypesStudy Area /km2Built-Up Area (A and B) /km2 (%)Rural Area/km2 (%)
LCZ 1 (Compact high-rise)22.0221.34 (96.9%)0.67 (3.1%)
LCZ 2 (Compact midrise)63.1961.87 (97.9%)1.37 (2.1%)
LCZ 3 (Compact low-rise)77.8430.6 (39.3%)47.24 (60.7%)
LCZ 4 (Open high-rise)73.2553.69 (73.3%)19.79 (26.7%)
LCZ 5 (Open midrise)93.8975.79 (80.7%)17.97 (19.3%)
LCZ 6 (Open low-rise)103.4924.54 (23.7%)78.93 (76.3%)
LCZ 7 (Lightweight low-rise)160.9390.64 (56.3%)70.25 (43.7%)
LCZ 8 (Large low-rise)77.5350.77 (65.5%)26.94 (34.5%)
LCZ 9 (Sparsely built)359.8865.26 (18.1%)294.71 (81.9%)
LCZ 10 (Heavy industry)77.9868.55 (87.9%)8.98 (12.1%)
LCZ A (Dense trees)75.292.13 (2.8%)73.17 (97.2%)
LCZ B (Scattered trees)16.213.58 (22.1%)12.59 (77.9%)
LCZ C (Bush, scrub)4.530.77 (17.0%)3.76 (83.0%)
LCZ D (Low plants)1132.6830.28 (2.7%)1102.25 (97.3%)
LCZ E (Bare rock or paved)77.0142.55 (55.3%)34.4 (44.7%)
LCZ F (Bare soil or sand)125.3840.16 (32.0%)85.28 (68.0%)
LCZ G (Water)39.091.32 (3.4%)37.74 (96.6%)
Table 3. Land surface temperature of different local climate zones in different months from 2018 to 2020 (°C).
LCZDecemberJanuaryFebruaryMarch
RangeMeanRangeMeanRangeMeanRangeMean
LCZ-1 (Compact high-rise)−20.28~1.63−4.65−16.26~−0.05−4.80−9.04~13.136.21−4.89~18.7810.73
LCZ-2 (Compact midrise)−18.43~2.81−4.15−14.45~1.46−4.21−6.30~16.347.27−1.08~21.1812.04
LCZ-3 (Compact low-rise)−26.15~3.74−3.91−22.25~4.35−3.48−12.47~15.199.11−9.83~23.3714.21
LCZ-4 (Open high-rise)−20.80~4.43−4.54−19.65~3.86−4.52−6.54~15.526.71−3.09~21.6511.42
LCZ-5 (Open midrise)−23.72~4.03−4.52−18.91~2.98−4.27−8.72~15.367.42−3.01~23.3012.47
LCZ-6 (Open low-rise)−13.75~2.17−4.01−12.38~1.82−3.58−0.97~16.058.89−1.19~21.6113.67
LCZ-7 (Lightweight low-rise)−25.58~3.32−3.87−24.72~3.36−3.66−12.77~18.419.10−7.00~24.2614.31
LCZ-8 (Large low-rise)−27.04~3.35−3.73−22.01~2.50−3.60−11.93~18.608.90−9.09~25.7114.25
LCZ-9 (Sparsely built)−26.81~4.36−3.70−21.74~3.88−3.26−12.69~18.139.46−9.58~24.5513.91
LCZ-10 (Heavy industry)−17.34~4.66−4.03−13.74~3.35−3.69−6.36~19.798.64−2.35~26.6413.79
LCZ-A (Dense trees)−9.26~4.50−4.52−9.22~3.26−4.760.35~15.757.21−4.75~20.8010.98
LCZ-B (Scattered trees)−9.62~2.35−4.24−9.17~1.59−3.830.77~15.208.443.79~20.4113.37
LCZ-C (Bush, scrub)−7.58~3.10−3.20−6.76~3.78−2.803.95~15.5610.267.33~20.6615.50
LCZ-D (Low plants)−27.50~2.93−2.66−21.34~3.95−2.39−12.18~22.8411.59−9.23~25.9715.82
LCZ-E (Bare rock or paved)−28.64~4.05−4.12−22.09~3.98−3.64−16.53~16.048.85−13.12~25.1513.91
LCZ-F (Bare soil or sand)−32.33~2.76−3.69−27.79~2.42−3.19−22.77~16.629.56−18.21~23.0914.48
LCZ-G (Water)−8.97~5.53−4.77−9.30~4.16−5.04−0.89~14.783.77−4.82~19.096.90
LCZAprilMayJuneJuly
RangeMeanRangeMeanRangeMeanRangeMean
LCZ-1 (Compact high-rise)11.87~29.6221.336.29~34.1525.3623.14~38.1931.8019.99~40.0932.93
LCZ-2 (Compact midrise)13.23~30.0922.4411.79~35.2026.7723.58~38.0432.9823.23~40.5934.34
LCZ-3 (Compact low-rise)7.36~31.8624.421.84~35.4527.5819.21~41.4632.5317.36~40.9232.16
LCZ-4 (Open high-rise)10.62~30.1822.026.88~35.5025.4420.72~39.0531.3719.37~38.3131.66
LCZ-5 (Open midrise)12.31~31.1122.998.20~38.2526.6921.84~41.4632.4620.92~40.0632.87
LCZ-6 (Open low-rise)13.34~30.6124.2315.06~35.3627.7424.23~37.1732.2321.68~39.9831.57
LCZ-7 (Lightweight low-rise)6.56~33.0824.273.36~39.6327.6419.28~41.8232.9616.28~42.9532.95
LCZ-8 (Large low-rise)7.24~33.8124.241.91~41.3427.7918.91~42.0333.0517.24~43.3433.02
LCZ-9 (Sparsely built)6.20~32.1824.241.87~36.4627.0319.18~38.5529.8516.78~39.8329.05
LCZ-10 (Heavy industry)13.34~32.5723.819.81~39.2927.9223.43~42.6033.5922.68~44.2034.58
LCZ-A (Dense trees)13.35~31.6422.9315.07~37.0524.5521.25~38.3028.2822.22~36.8927.87
LCZ-B (Scattered trees)15.22~32.9224.5616.35~35.0327.3723.56~37.7330.9123.88~38.6130.27
LCZ-C (Bush, scrub)18.62~31.2225.9320.52~35.3329.1326.59~38.8432.2425.62~37.5830.87
LCZ-D (Low plants)5.15~35.4826.180.28~37.4529.2215.70~39.8630.9715.89~39.7228.55
LCZ-E (Bare rock or paved)5.00~31.3624.05−2.75~38.2927.5217.85~41.9732.6113.85~40.7732.43
LCZ-F (Bare soil or sand)0.77~31.1924.65−7.61~35.4328.0014.82~42.1532.4810.94~41.5231.69
LCZ-G (Water)10.36~29.2716.2912.34~34.9018.1420.71~36.0624.8320.76~36.3924.91
LCZAugustSeptemberOctoberNovember
RangeMeanRangeMeanRangeMeanRangeMean
LCZ-1 (Compact high-rise)27.82~41.6934.798.41~32.2725.02−0.27~23.8917.08−3.36~17.419.04
LCZ-2 (Compact midrise)27.15~41.5536.1012.78~35.7126.472.93~26.5518.34−1.34~20.449.88
LCZ-3 (Compact low-rise)23.64~42.6534.504.33~34.0425.37−4.09~26.4218.87−8.29~18.1311.18
LCZ-4 (Open high-rise)24.31~42.2134.185.07~33.0624.451.26~25.9417.16−3.45~16.789.67
LCZ-5 (Open midrise)26.77~42.9935.389.04~37.7625.501.97~28.3517.98−6.92~18.4910.10
LCZ-6 (Open low-rise)26.30~41.7934.1513.76~32.8924.876.58~24.9618.411.61~17.7411.22
LCZ-7 (Lightweight low-rise)22.62~45.4835.542.24~37.6426.06−5.15~30.8719.04−7.07~19.8511.48
LCZ-8 (Large low-rise)23.93~45.1935.544.09~38.0226.14−3.99~30.3619.18−9.97~20.5511.34
LCZ-9 (Sparsely built)22.64~42.2931.241.49~33.6623.03−5.79~26.2617.15−8.97~18.0911.10
LCZ-10 (Heavy industry)28.86~45.5636.8712.26~37.8527.193.03~30.2819.34−1.50~22.3910.98
LCZ-A (Dense trees)25.09~39.1330.7018.93~28.9621.5911.05~25.1114.915.92~18.1211.20
LCZ-B (Scattered trees)26.89~41.8233.4519.24~32.62−1.0011.48~24.6517.274.99~17.2811.50
LCZ-C (Bush, scrub)28.21~41.8933.8221.18~30.5124.3614.55~23.5919.056.90~20.2812.45
LCZ-D (Low plants)22.52~41.7130.521.04~45.4522.92−6.11~27.0918.13−10.03~20.0612.54
LCZ-E (Bare rock or paved)24.32~42.9335.230.05~38.2325.55−5.98~29.5118.78−11.45~28.21−1.00
LCZ-F (Bare soil or sand)22.59~43.6134.24−3.27~35.9625.08−12.84~29.0318.86−15.94~19.6311.46
LCZ-G (Water)25.72~40.0928.1918.57~28.9720.7811.95~22.7115.405.38~17.938.72
Table 4. The maximum and minimum temperatures in different months and corresponding built local climate zones within urban and rural contexts (°C).
UrbanRuralUrbanRural
Max-1Max-2Max-1Max-2Min-1Min-2Min-1Min-2
DecemberLCZ-8 (–3.86)LCZ-7 (–3.92)LCZ-10 (–3.43)LCZ-8 (–3.47)LCZ-4 (–4.74)LCZ-1 (–4.69)LCZ-1 (–4.35)LCZ-5 (–4.29)
JanuaryLCZ-7 (–3.70)LCZ-10 (–3.75)LCZ-3 (–3.14)LCZ-9 (–3.14)LCZ-1 (–4.87)LCZ-4 (–4.82)LCZ-1 (–3.81)LCZ-4 (–3.80)
FebruaryLCZ-7 (9.00)LCZ-8 (8.60)LCZ-10 (10.03)LCZ-9 (9.76)LCZ-1 (6.12)LCZ-4 (6.22)LCZ-1 (7.79)LCZ-4 (7.93)
MarchLCZ-7 (14.28)LCZ-8 (13.91)LCZ-10 (15.33)LCZ-8 (14.89)LCZ-1 (10.65)LCZ-4 (10.97)LCZ-1 (12.36)LCZ-4 (12.47)
AprilLCZ-7 (24.19)LCZ-8 (23.85)LCZ-8 (24.98)LCZ-3 (24.97)LCZ-1 (21.25)LCZ-4 (21.64)LCZ-4 (22.87)LCZ-1 (22.97)
MayLCZ-10 (27.82)LCZ-7 (27.80)LCZ-10 (28.73)LCZ-8 (28.08)LCZ-4 (25.24)LCZ-1 (25.31)LCZ-4 (25.86)LCZ-1 (25.97)
JuneLCZ-10 (33.59)LCZ-7 (33.33)LCZ-10 (33.58)LCZ-2 (32.81)LCZ-9 (31.44)LCZ-4 (31.56)LCZ-9 (29.49)LCZ-4 (30.78)
JulyLCZ-10 (34.63)LCZ-2 (34.37)LCZ-10 (34.26)LCZ-2 (33.36)LCZ-9 (31.44)LCZ-4 (32.06)LCZ-9 (28.52)LCZ-1 (30.49)
AugustLCZ-10 (36.88)LCZ-7 (36.42)LCZ-10 (36.83)LCZ-2 (36.03)LCZ-9 (34.09)LCZ-4 (34.54)LCZ-9 (30.62)LCZ-1 (32.99)
SeptemberLCZ-10 (27.18)LCZ-7 (26.65)LCZ-10 (27.32)LCZ-2 (26.40)LCZ-4 (24.54)LCZ-9 (24.57)LCZ-9 (22.69)LCZ-1 (23.94)
OctoberLCZ-10 (19.27)LCZ-7 (19.25)LCZ-10 (19.92)LCZ-8(19.35)LCZ-4 (16.93)LCZ-1 (17.04)LCZ-9 (17.03)LCZ-1 (17.58)
NovemberLCZ-7 (11.43)LCZ-8 (11.11)LCZ-10 (12.37)LCZ-8 (11.80)LCZ-1 (8.96)LCZ-4 (9.26)LCZ-1 (10.62)LCZ-4 (10.71)
Note: Max-1 means the highest temperature and Max-2 means the second highest temperature. Min-1 means the lowest temperature and Min-2 means the second lowest temperature. LCZ-1, Compact high-rise; LCZ-2, Compact midrise; LCZ-3, Compact low-rise; LCZ-4, Open high-rise; LCZ-5, Open midrise; LCZ-7, Lightweight low-rise; LCZ-8, Large low-rise; LCZ-9, Sparsely built; LCZ-10, Heavy industry.
Table 5. The maximum and minimum temperatures in different months and corresponding land-cover local climate zones within urban and rural contexts (°C).
UrbanRuralUrbanRural
Max-1Max-2Max-1Max-2Min-1Min-2Min-1Min-2
DecemberLCZ-C (−3.65)LCZ-B (−3.80)LCZ-D (−2.63)LCZ-C (−3.10)LCZ-G (−4.84)LCZ-E (−4.41)LCZ-G (−4.77)LCZ-A (−4.54)
JanuaryLCZ-D (−3.08)LCZ-C (−3.34)LCZ-D (−2.37)LCZ-C (−2.69)LCZ-G (−5.03)LCZ-A (−4.51)LCZ-G (−5.04)LCZ-A (−4.77)
FebruaryLCZ-D (9.47)LCZ-C (9.16)LCZ-D (11.65)LCZ-C (10.48)LCZ-G (4.40)LCZ-A (6.69)LCZ-G (3.75)LCZ-A (7.22)
MarchLCZ-D (14.52)LCZ-C (14.41)LCZ-D (15.83)LCZ-C (15.14)LCZ-G (7.96)LCZ-A (11.63)LCZ-G (6.83)LCZ-A (11.02)
AprilLCZ-D (24.89)LCZ-C (24.84)LCZ-D (26.13)LCZ-C (25.67)LCZ-G (18.53)LCZ-A (21.87)LCZ-G (16.16)LCZ-A (22.90)
MayLCZ-C (28.38)LCZ-D (28.36)LCZ-D (29.29)LCZ-C (29.21)LCZ-G (20.56)LCZ-A (21.66)LCZ-G (18.00)LCZ-A (24.65)
JuneLCZ-C (32.84)LCZ-E (32.80)LCZ-E (32.43)LCZ-C (32.42)LCZ-G (27.02)LCZ-A (27.42)LCZ-G (24.73)LCZ-A (28.21)
JulyLCZ-E (32.93)LCZ-F (32.45)LCZ-E (31.92)LCZ-F (31.33)LCZ-G (27.40)LCZ-A (27.57)LCZ-G (24.80)LCZ-A (27.81)
AugustLCZ-E (35.77)LCZ-F (35.31)LCZ-E (34.71)LCZ-C (34.00)LCZ-G (30.29)LCZ-A (30.34)LCZ-G (28.09)LCZ-D (30.49)
SeptemberLCZ-E (25.90)LCZ-F (25.54)LCZ-E (25.27)LCZ-F (24.88)LCZ-A (21.62)LCZ-G (22.02)LCZ-B (-1.00)LCZ-G (20.71)
OctoberLCZ-C (18.84)LCZ-E (18.71)LCZ-C (19.04)LCZ-F (18.97)LCZ-A (14.71)LCZ-G (15.61)LCZ-A (14.88)LCZ-G (15.37)
NovemberLCZ-C (11.63)LCZ-D (11.28)LCZ-C (12.63)LCZ-D (12.57)LCZ-E (−1.00)LCZ-G (8.87)LCZ-G (8.71)LCZ-A (11.22)
Note: Max-1 means the highest temperature and Max-2 means the second highest temperature. Min-1 means the lowest temperature and Min-2 means the second lowest temperature. LCZ-A, Dense trees; LCZ-B, Scattered trees; LCZ-C, Bush, scrub; LCZ-D, Low plants; LCZ-E, Bare rock or paved; LCZ-F, Bare soil or sand; LCZ-G, Water.
Table 6. An assessment of the capability of local climate zone scheme in differentiating land surface temperatures.
Whole Study AreaUrban (Built-Up) AreaRural Area
Built LCZsLand-Cover LCZsBuilt LCZsLand-Cover LCZsBuilt LCZsLand-Cover LCZs
December86.7%76.2%71.1%47.6%48.9%76.2%
January91.1%85.7%77.8%71.4%57.8%85.7%
February84.4%81.0%91.1%81.0%62.2%85.7%
March91.1%90.5%95.6%81.0%77.8%85.7%
April88.9%90.5%88.9%81.0%75.6%90.5%
May80.0%90.5%84.4%85.7%62.2%85.7%
June88.9%85.7%88.9%76.2%75.6%90.5%
July91.1%95.2%86.7%71.4%88.9%95.2%
August93.3%95.2%86.7%81.0%86.7%95.2%
September88.9%90.5%88.9%81.0%33.3%57.1%
October91.1%95.2%82.2%81.0%75.6%81.0%
November84.4%81.0%91.1%61.9%62.2%71.4%
Publisher’s Note: MDPI stays neutral with regard to jurisdictional claims in published maps and institutional affiliations.

