Impacts of the Tropical Cyclone Idai in Mozambique: A Multi-Temporal Landsat Satellite Imagery Analysis

 ,
,  ,
, 
Abstract
:1. Introduction
2. Materials and Methods
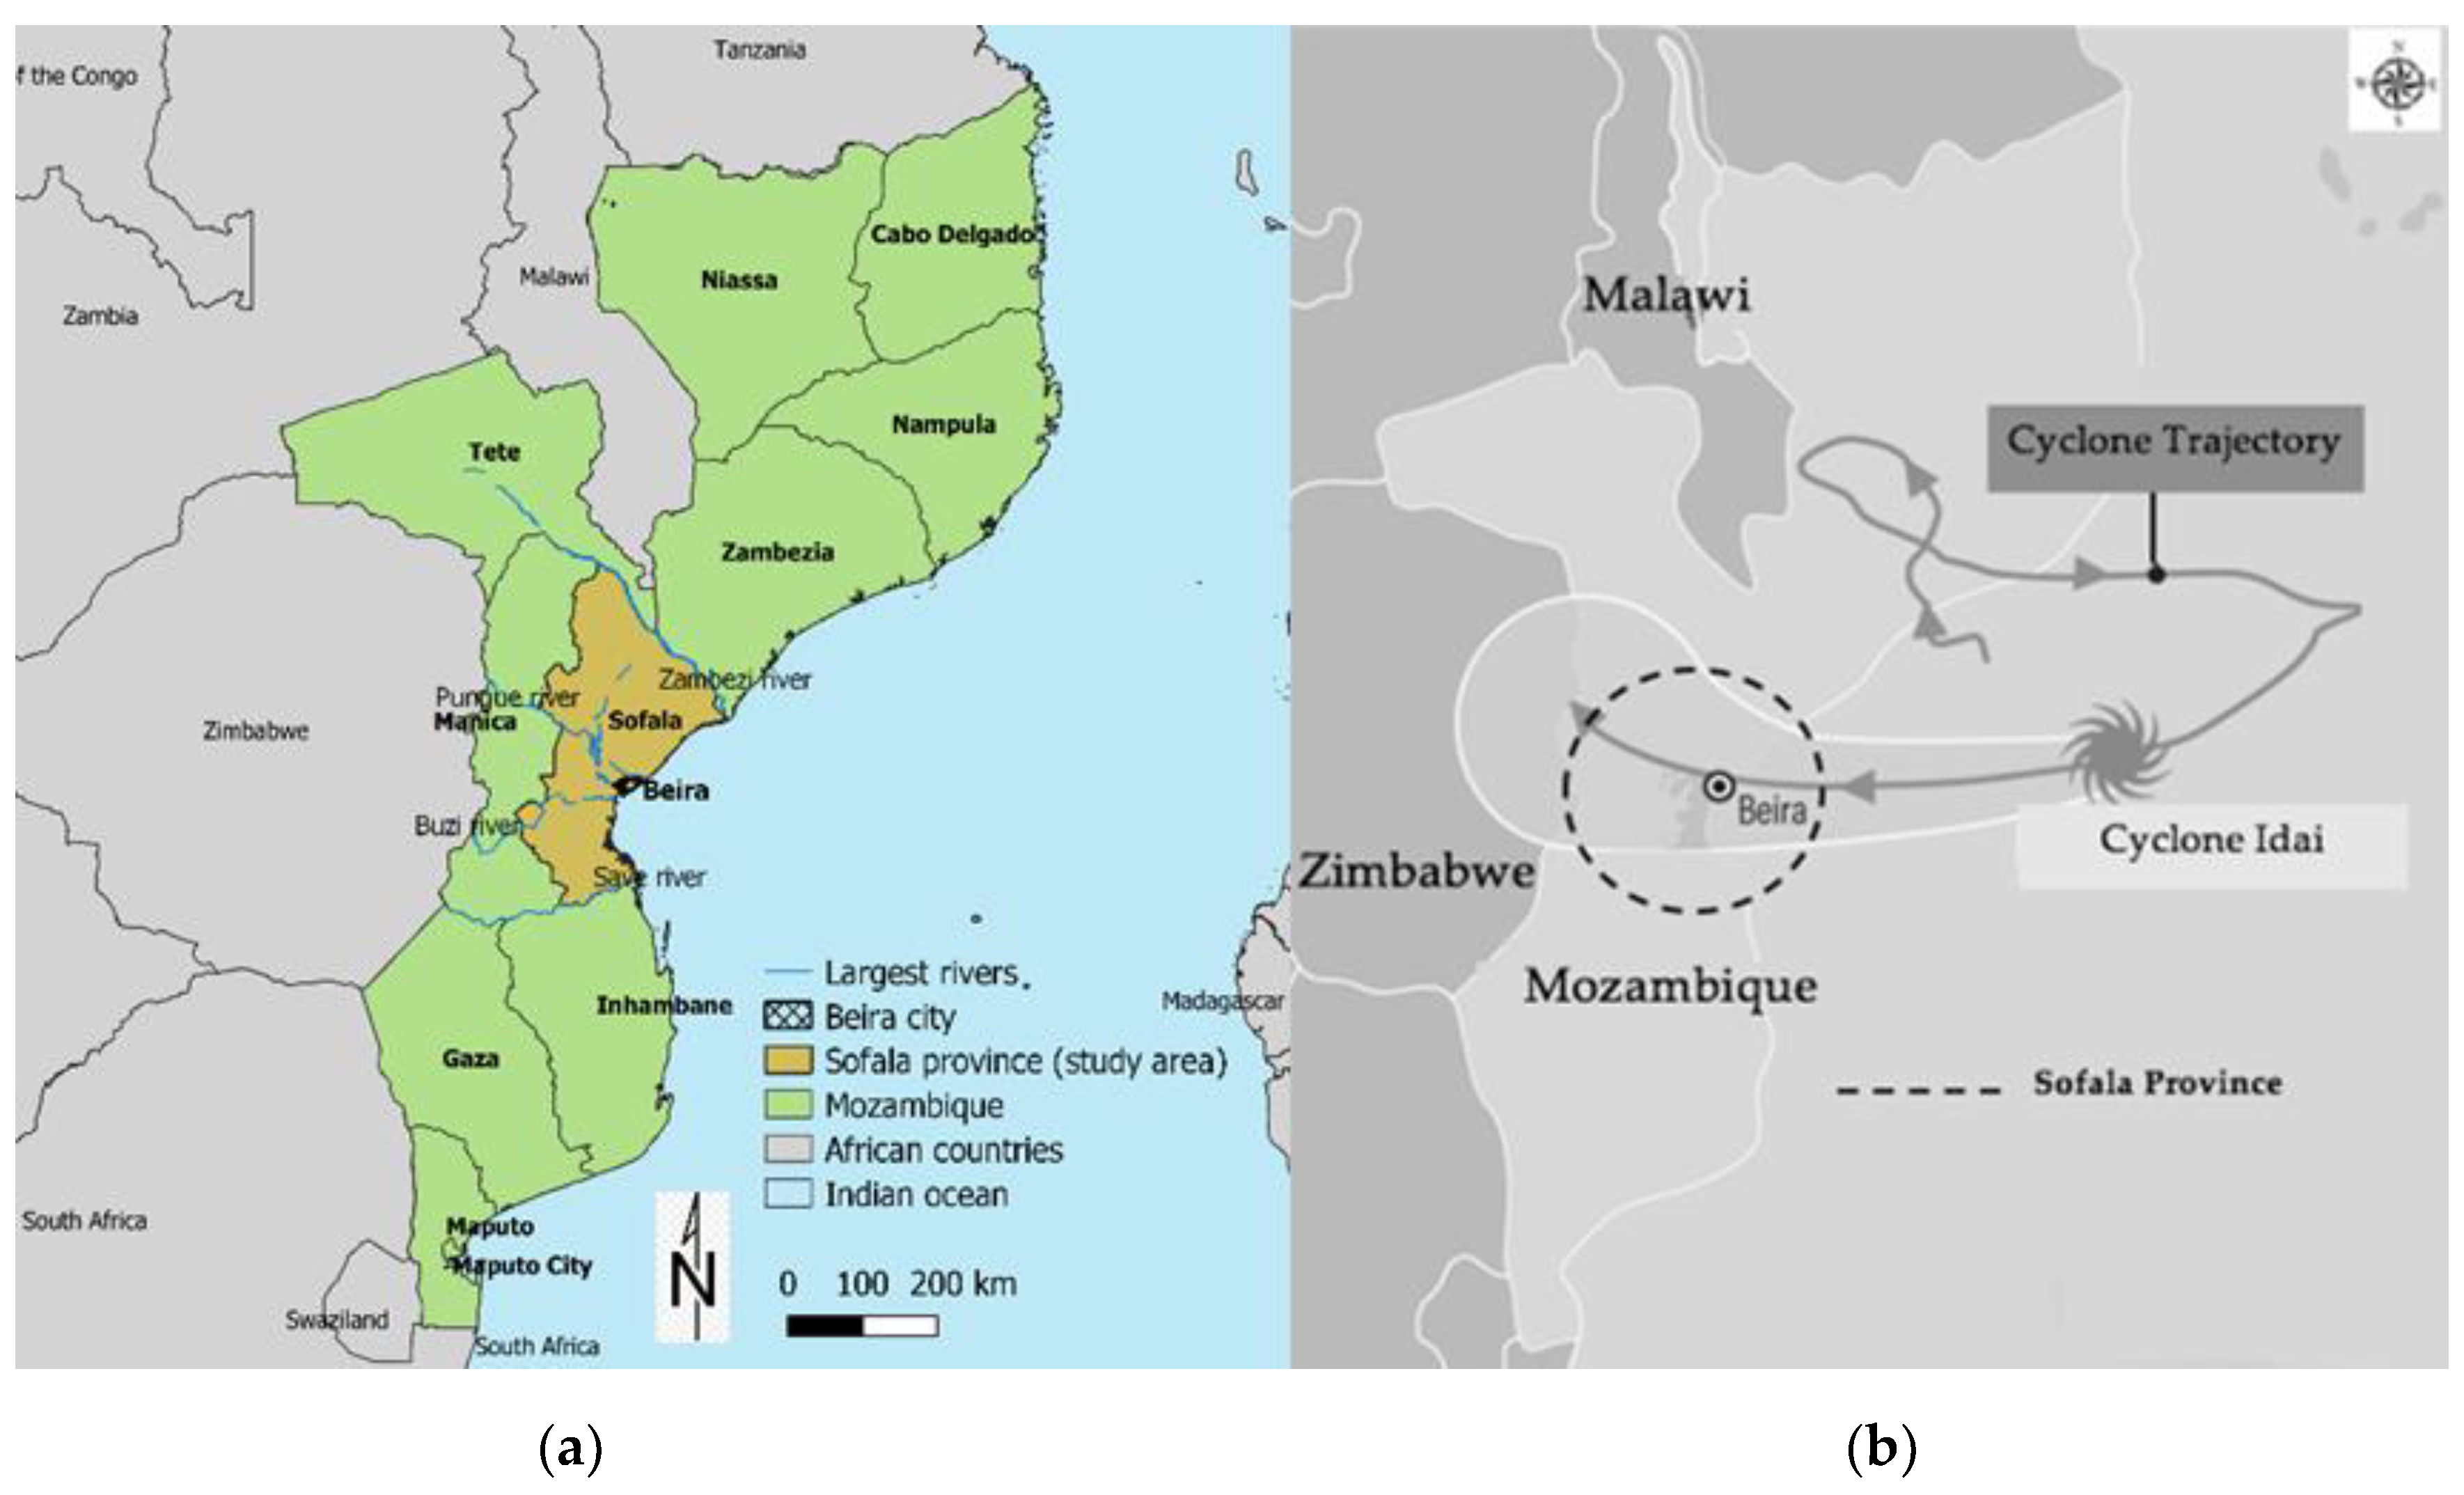
2.1. Study Area
2.2. The Cyclone IDAI
2.3. Data
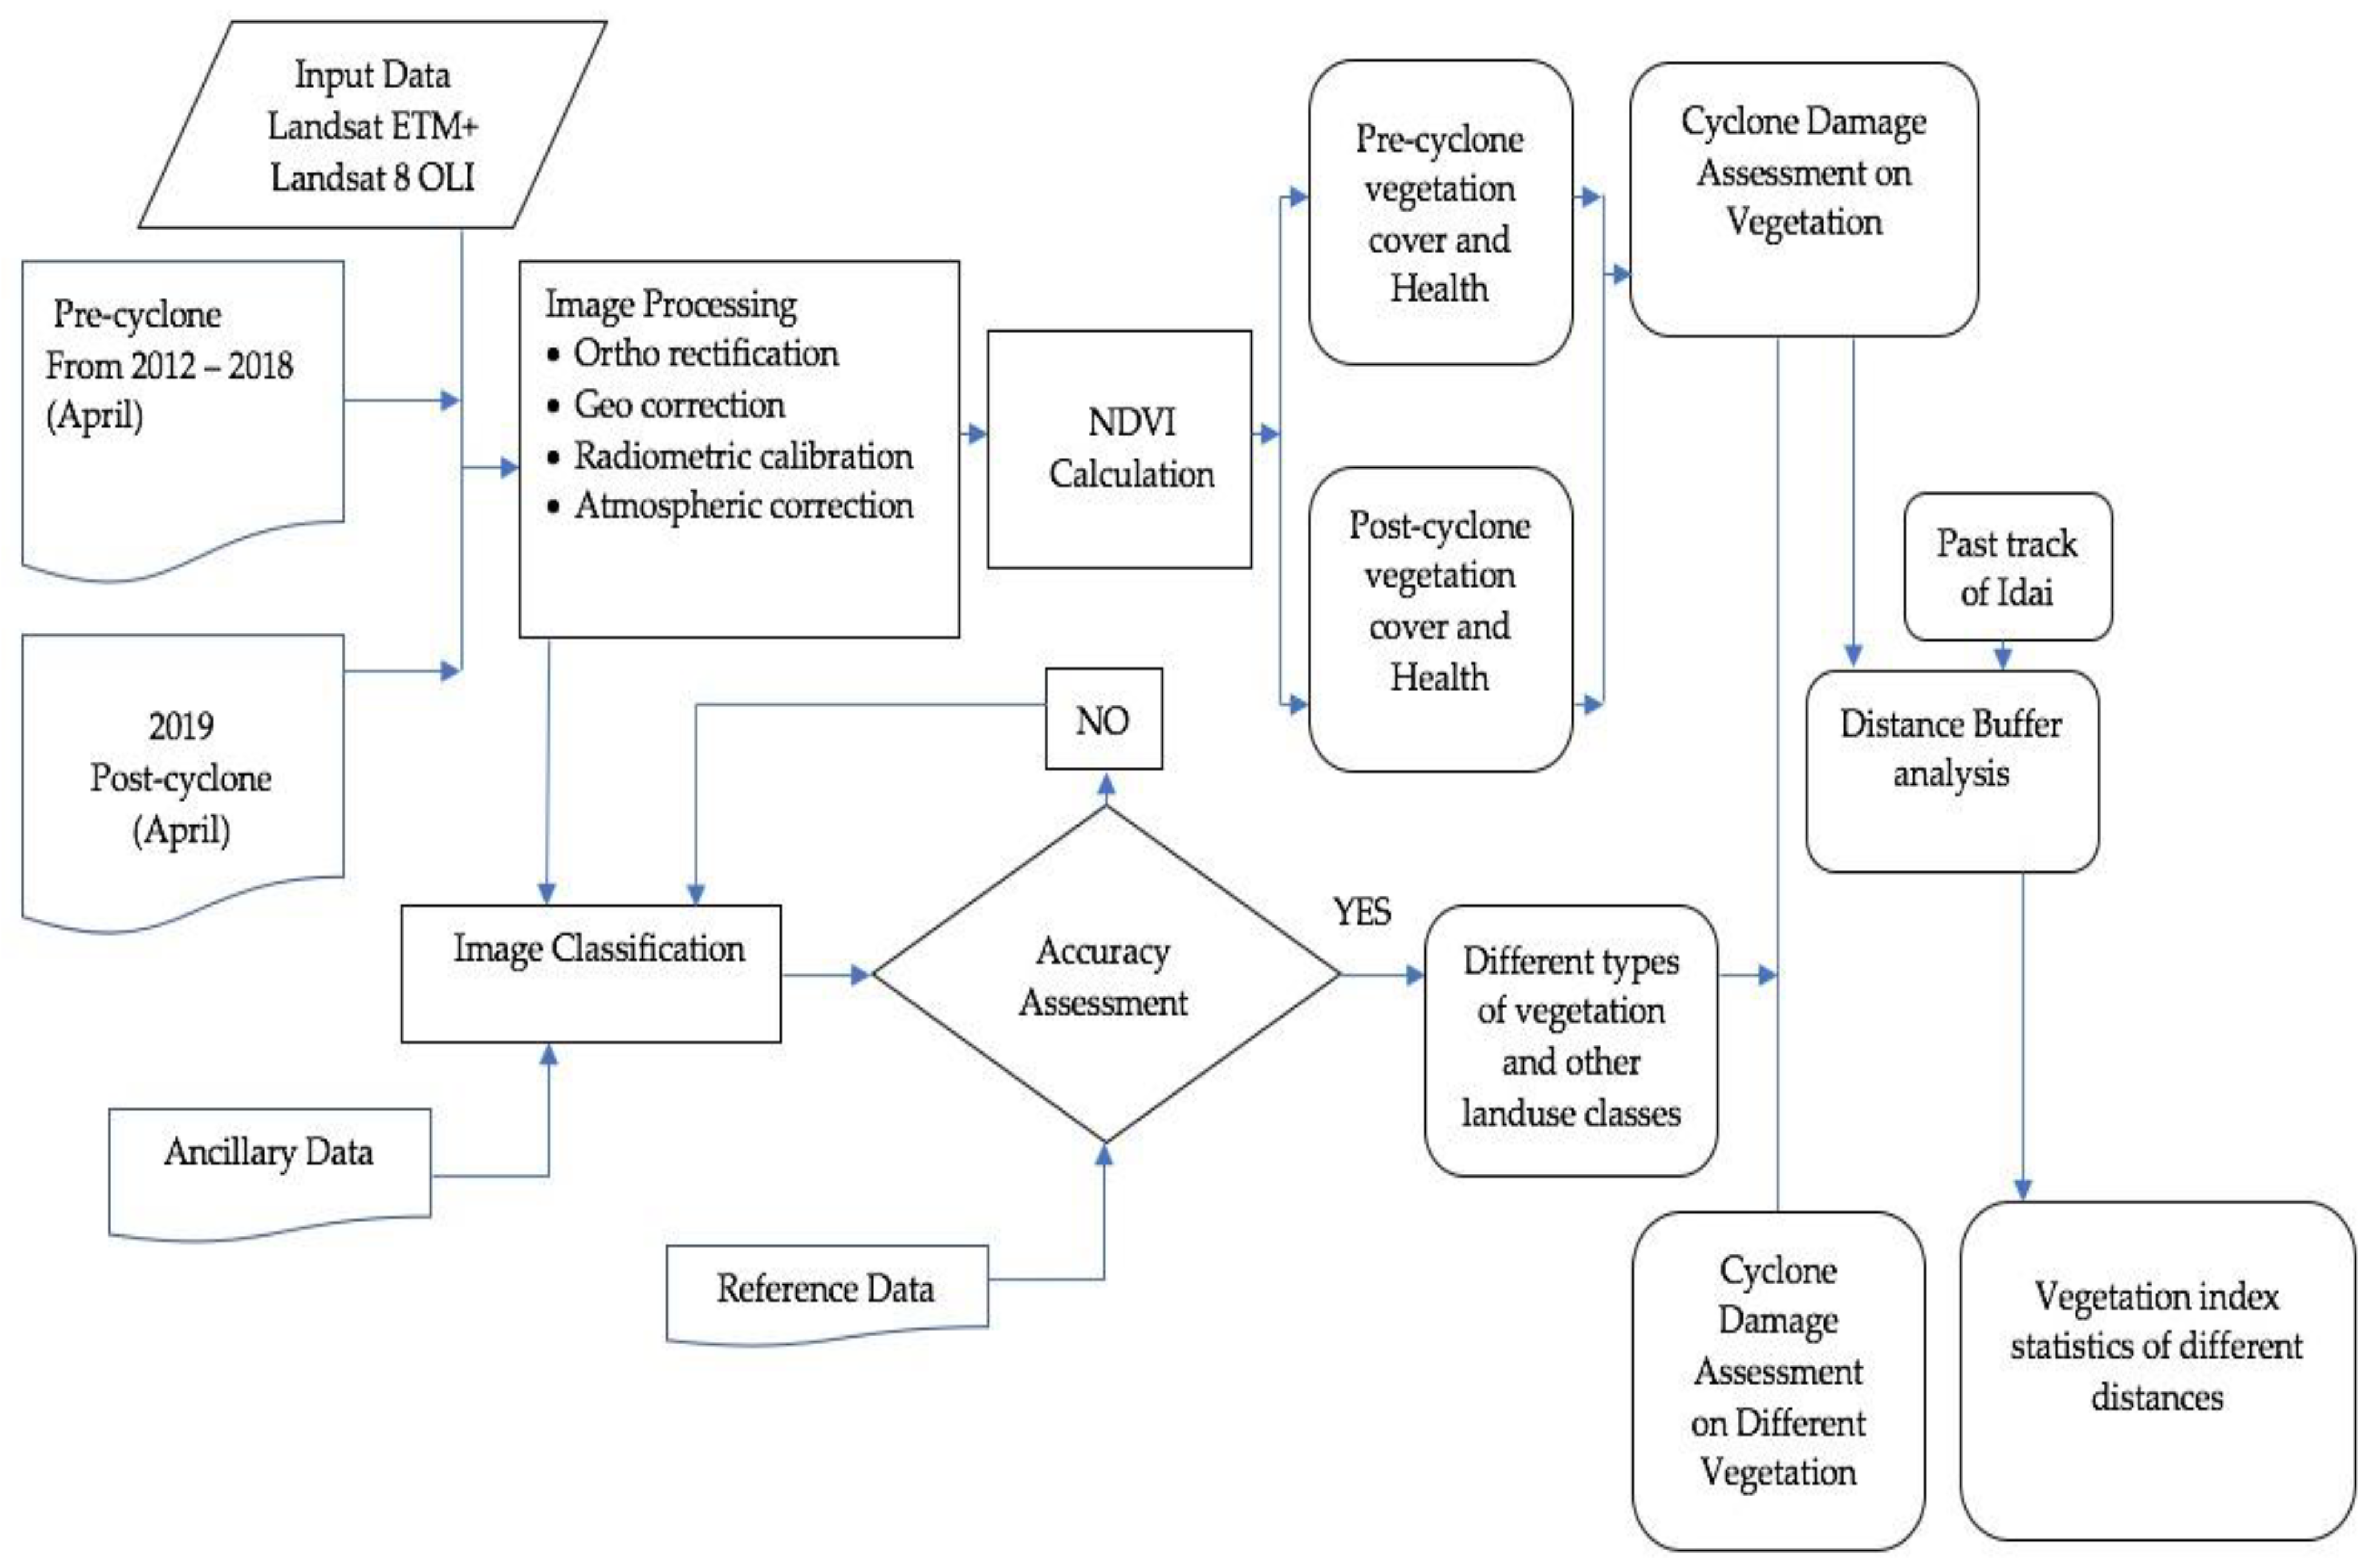
2.4. Methods
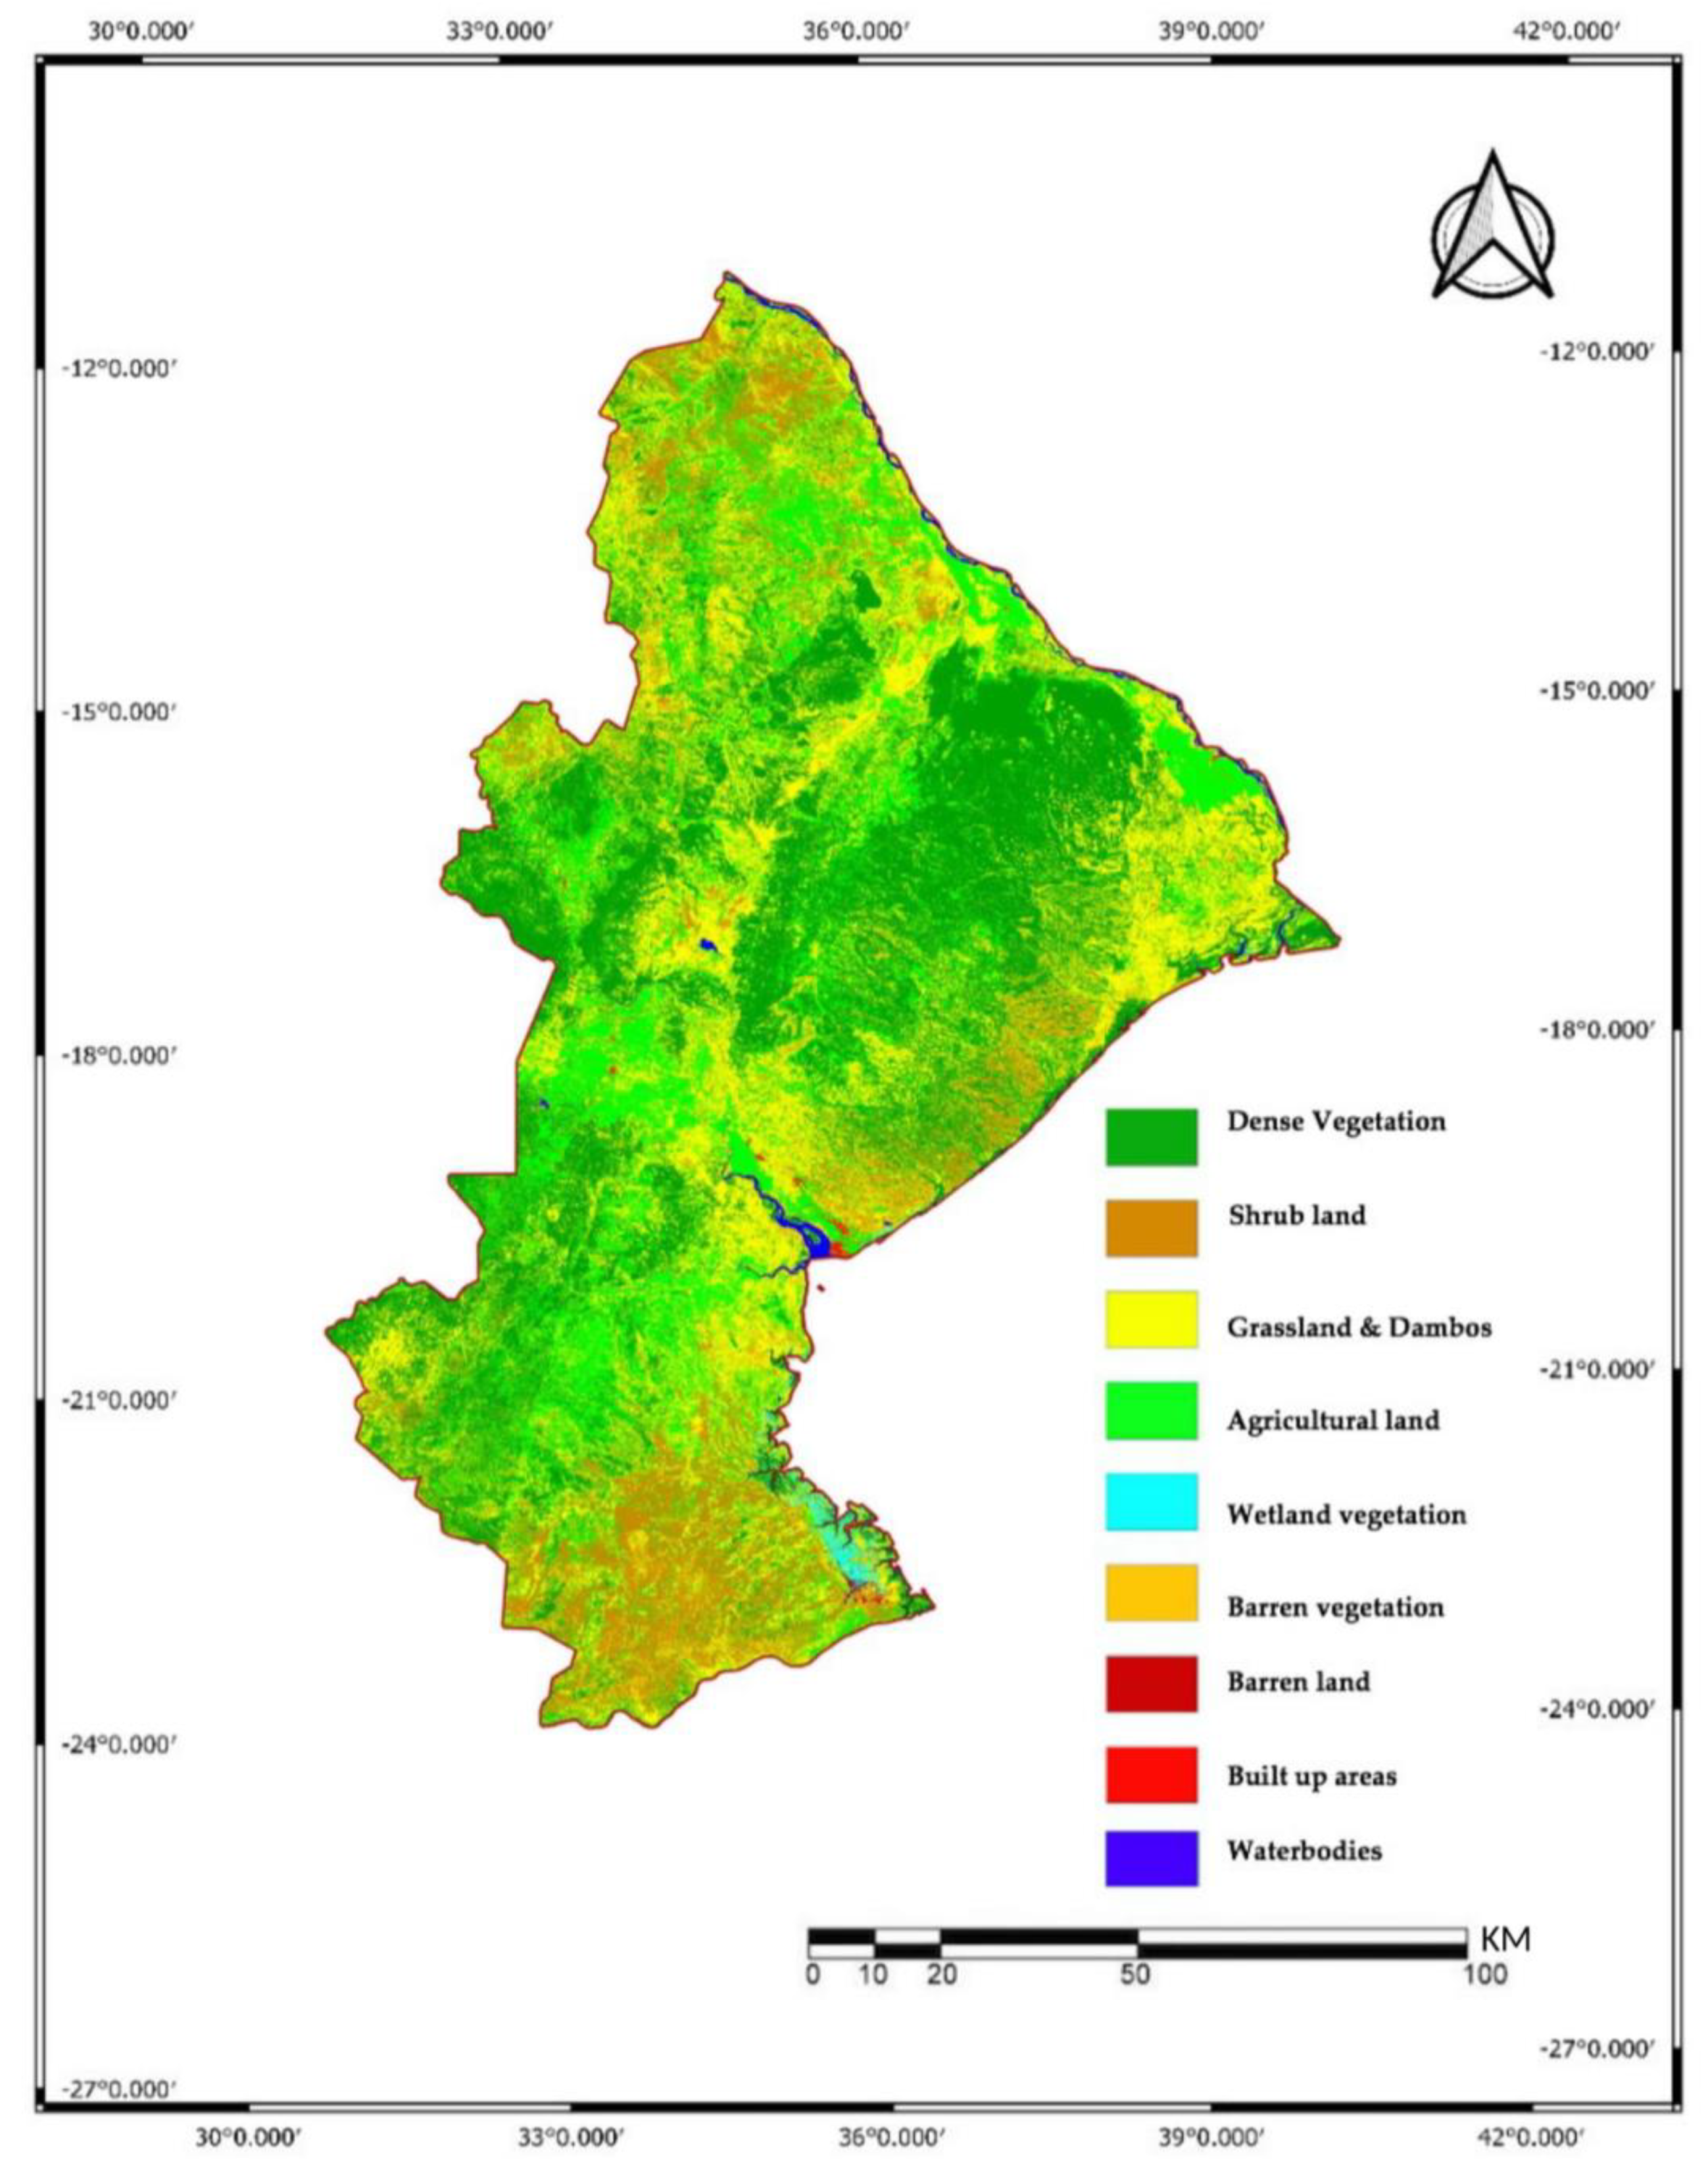
2.5. Land Use and Land Cover Classification
- Produces n-tree bootstrap model from the raster data;
- Runs an unpruned classification grown for all bootstrap models according to the DN values;
- Produces N number of polygons in line with the DN raster values;
- Chooses the number of classifications of the LULC classes; and
- Illustrates LULC classification.
2.6. Accuracy Assessment
2.7. Vegetation Indices
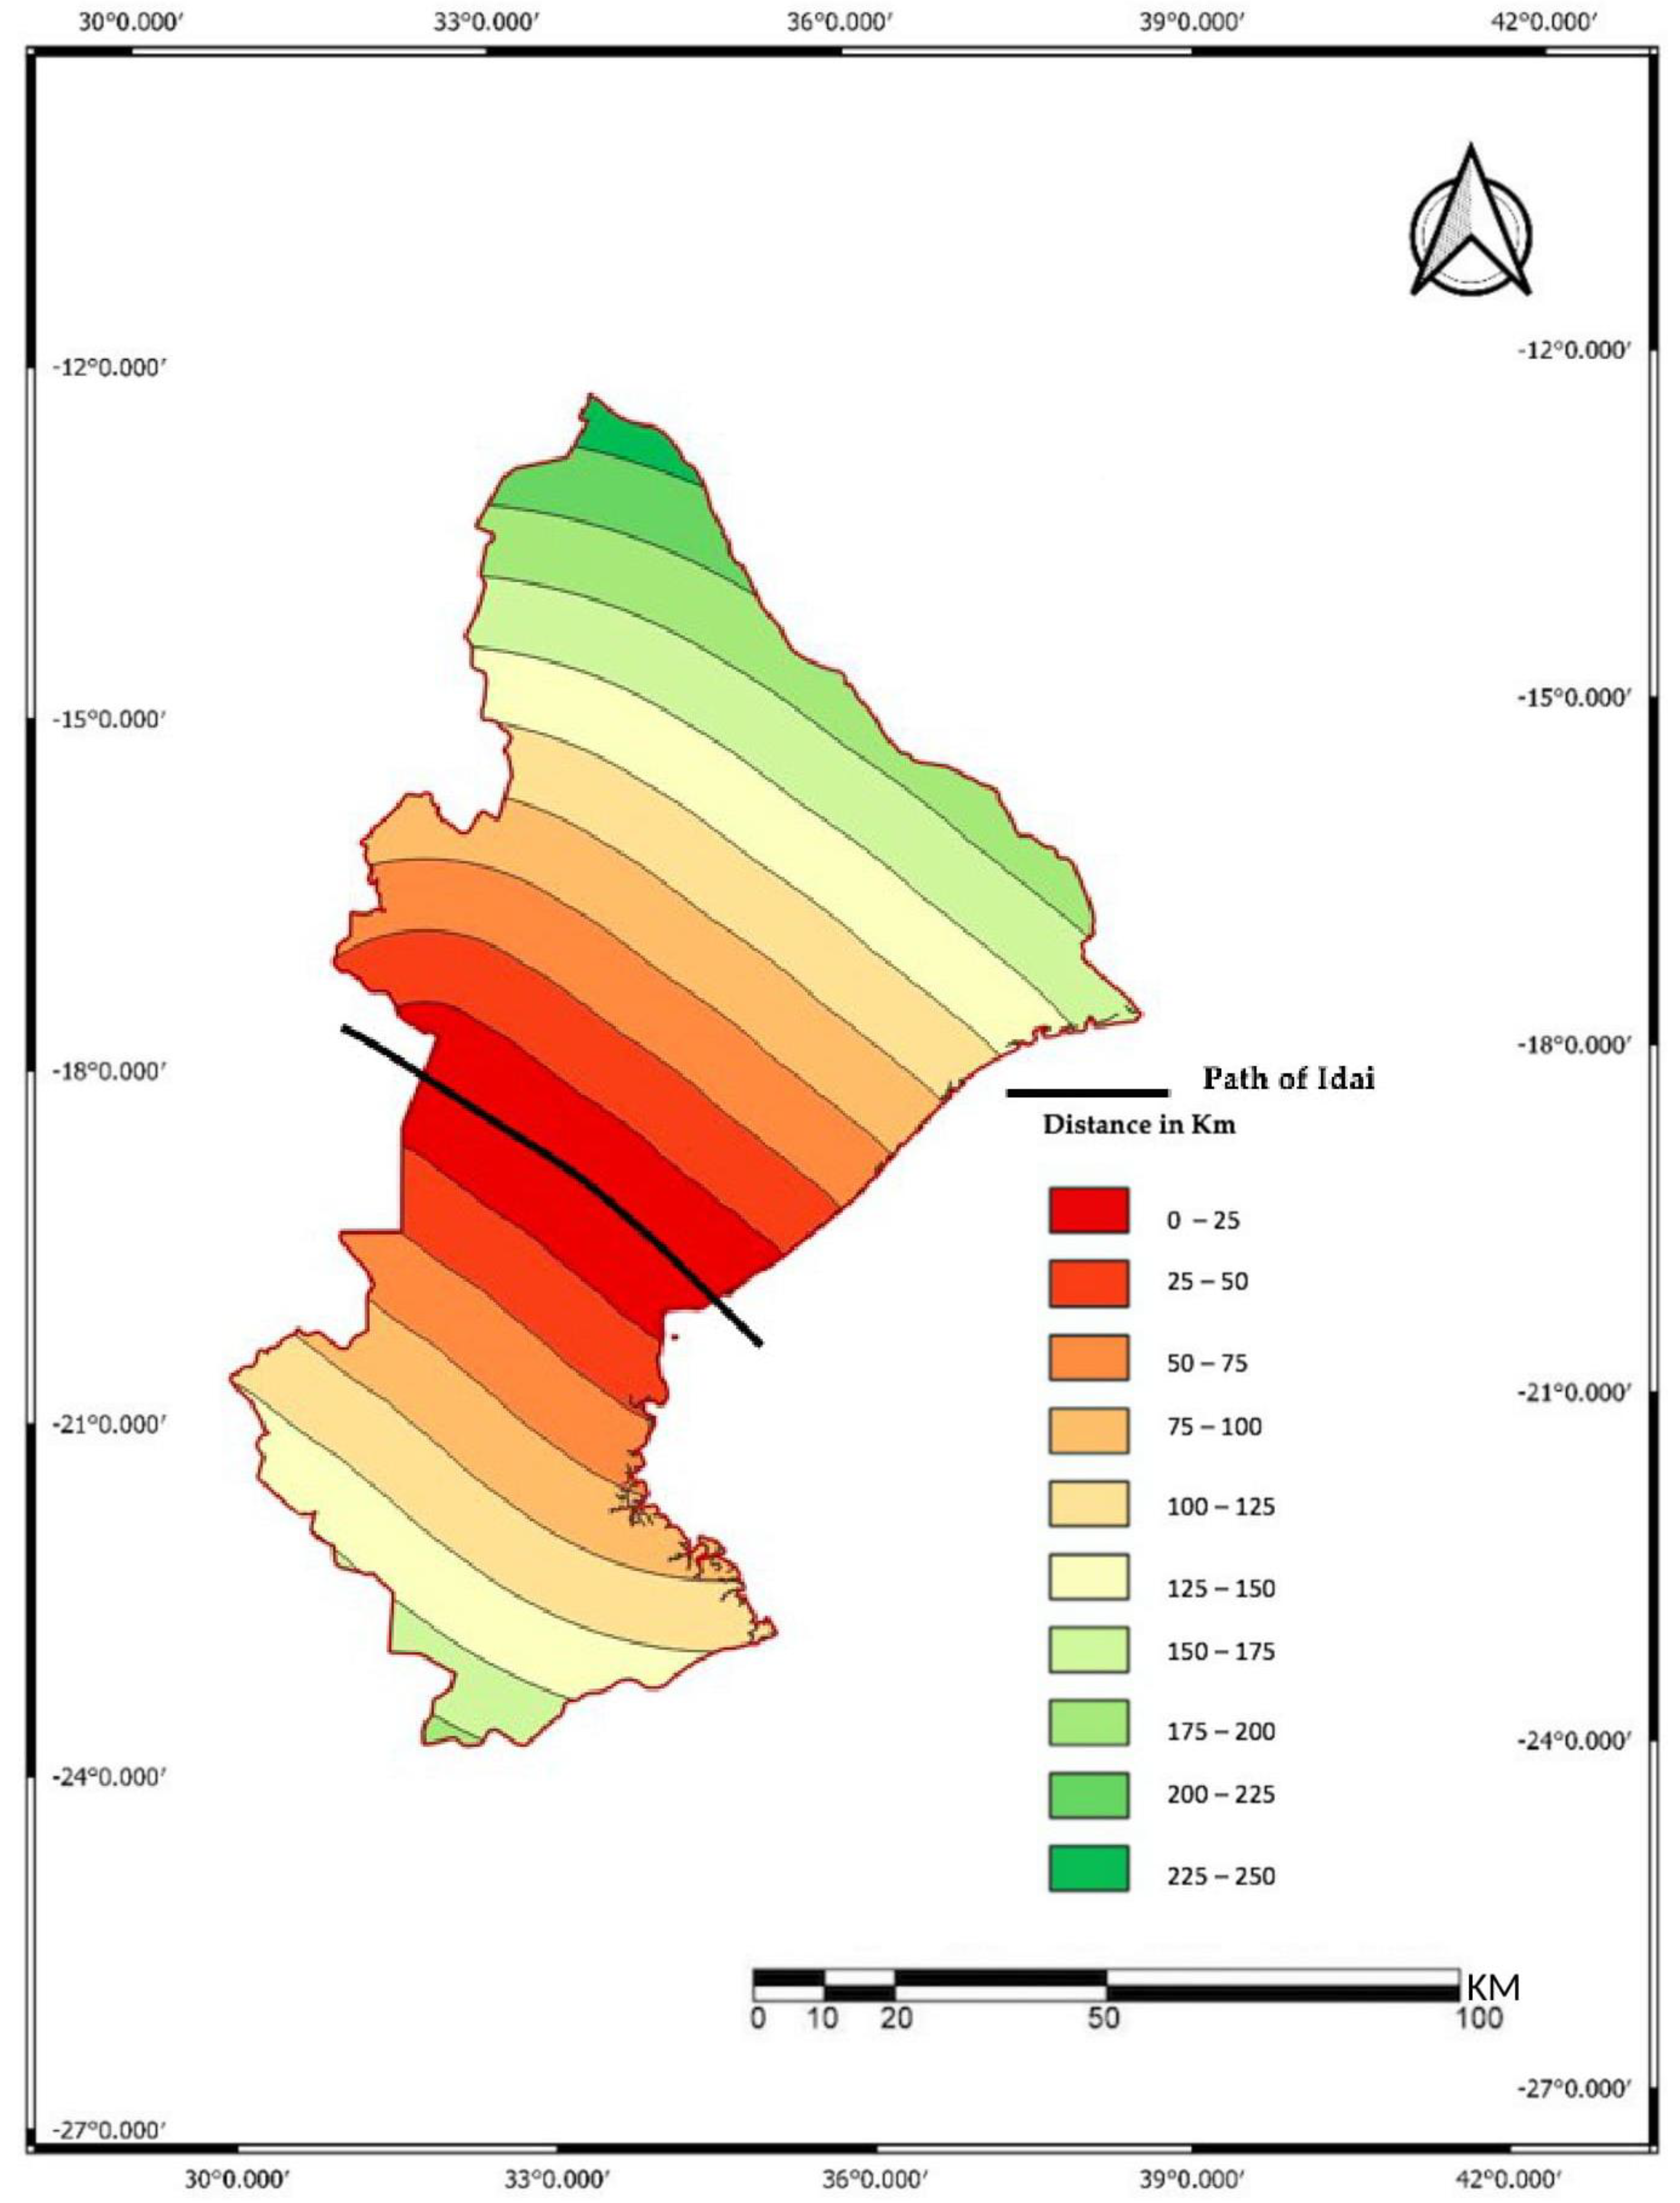
2.8. Distance to the Cyclone Trajectory
2.9. Correlation Analysis
3. Results
3.1. Land Use and Land Cover
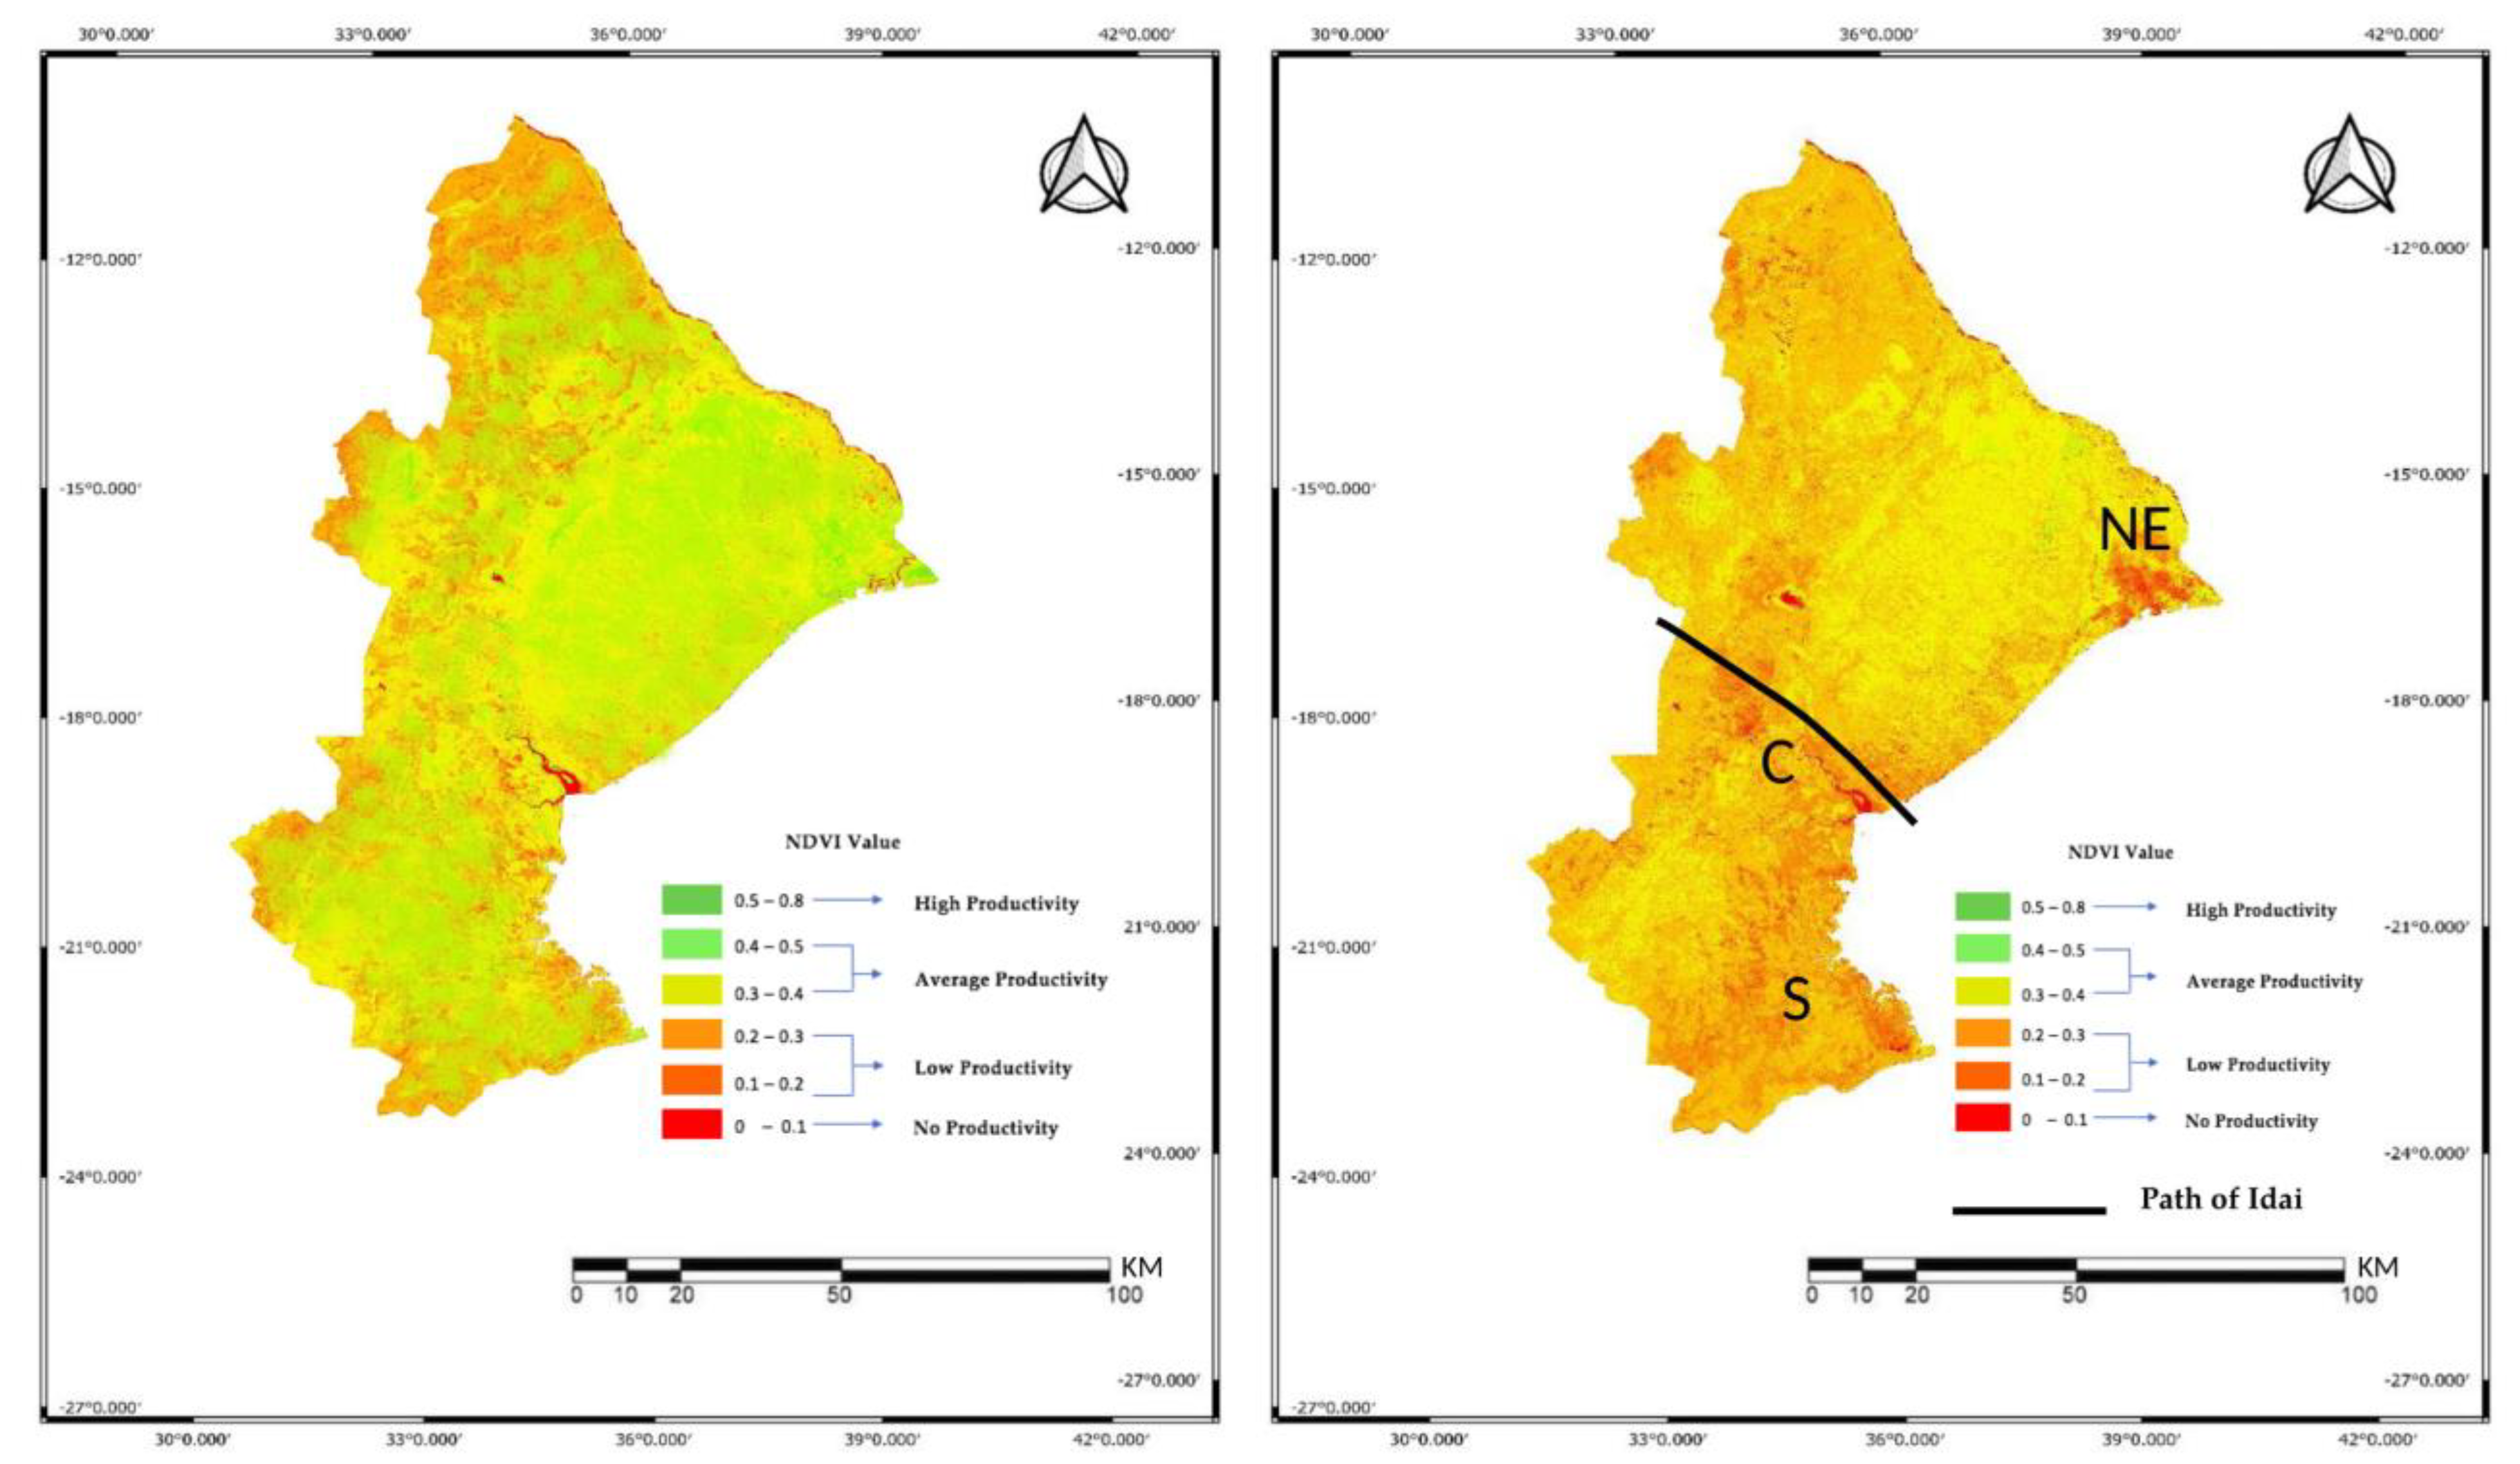
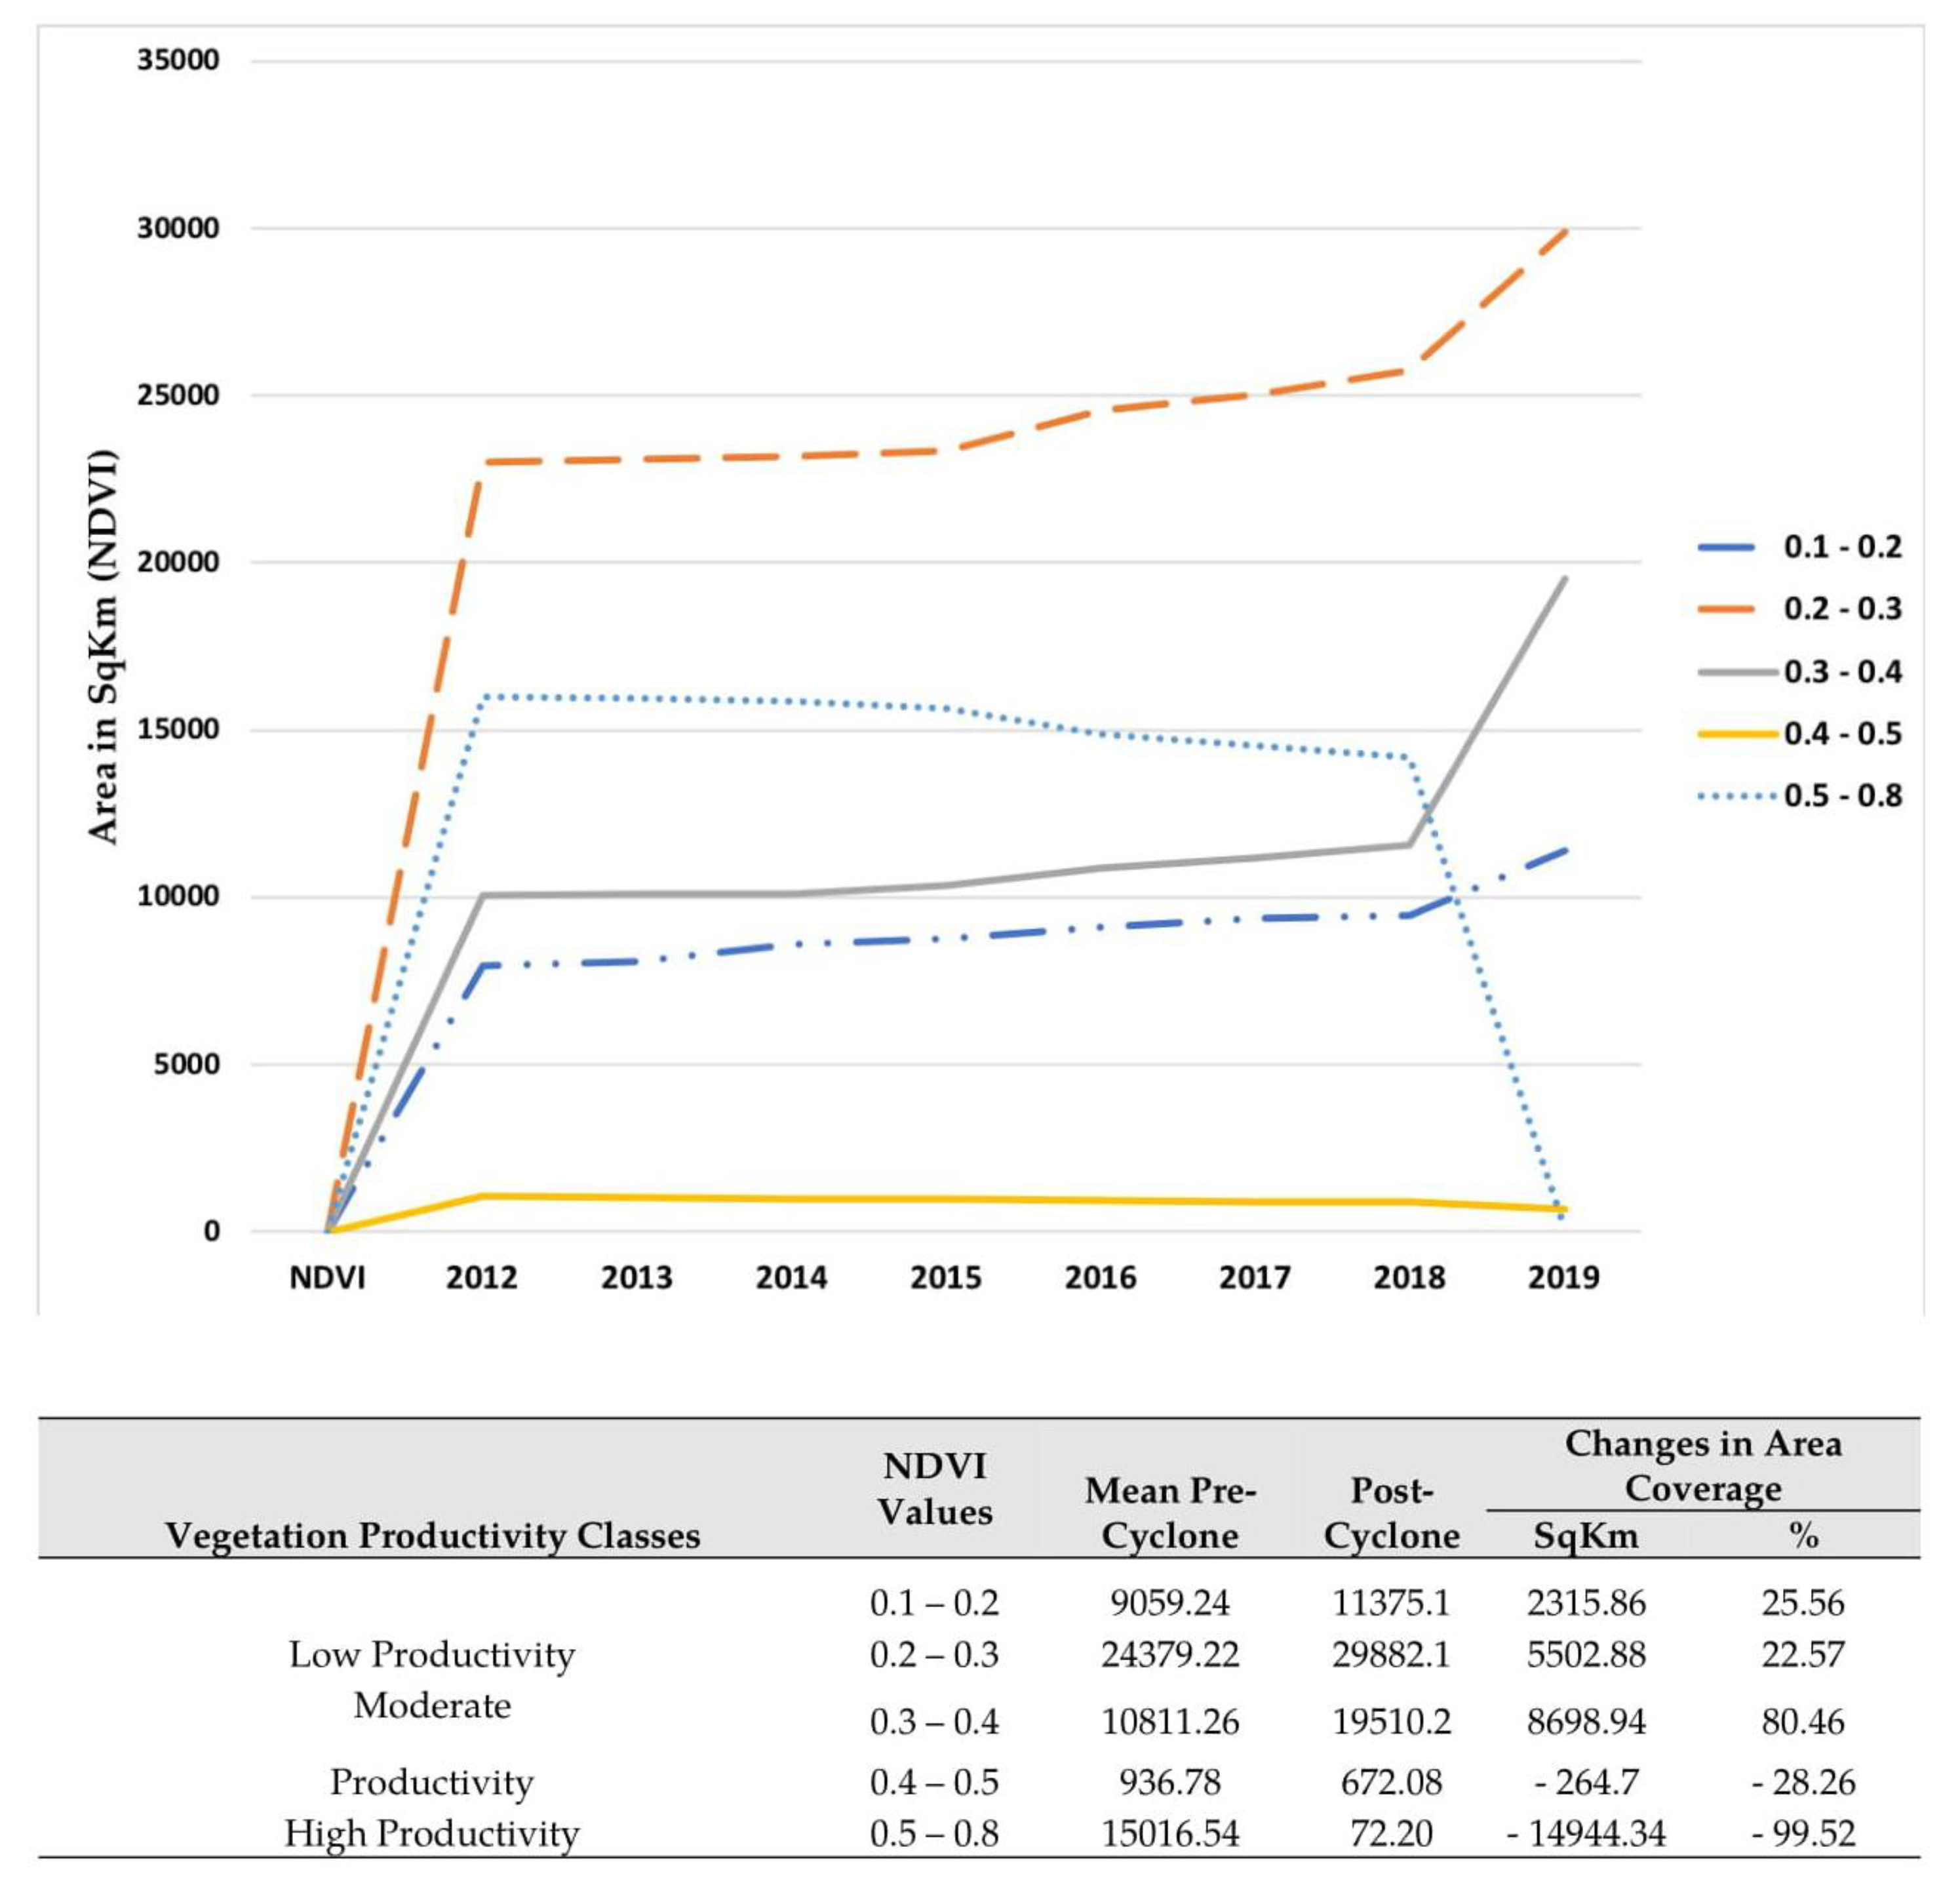
3.2. NDVI
3.3. Influence of the Distance to the Cyclone Trajectory
4. Discussion
4.1. The Changes in NDVI
4.2. Effects of Idai on Different LULC
4.3. The Influence of Distance on Damage
5. Conclusions
Author Contributions
Funding
Data Availability Statement
Acknowledgments
Conflicts of Interest
References
- Alam, E.; Dominey-Howes, D. A new catalogue of tropical cyclones of the northern Bay of Bengal and the distribution and effects of selected landfalling events in Bangladesh. Int. J. Clim. 2015, 35, 801–835. [Google Scholar] [CrossRef]
- Tonkin, H.; Landsea, C.; Holland, G.J.; Li, S. Tropical cyclones and climate change: A preliminary assessment. In Assessing Climate Change: Results from the Model Evaluation Consortium for Climate Assessment; Howe, W., Henderson-Sellers, A., Eds.; Gordon and Breach: London, UK, 1997; pp. 327–360. [Google Scholar]
- Lee, J.; Im, J.; Cha, D.H.; Park, H.; Sim, S. Tropical cyclone intensity estimation using multi-dimensional convolutional neural networks from geostationary satellite data. Remote Sens. 2020, 12, 108. [Google Scholar] [CrossRef] [Green Version]
- Gray, W.M. Global View of the Origin of Tropical Disturbances and Storms. Mon. Weather Rev. 1968, 96, 669–700. [Google Scholar] [CrossRef]
- Henderson-Sellers, A.; Zhang, H.; Berz, G.; Emanuel, K.; Gray, W.; Landsea, C.; Holland, G.; Lighthill, J.; Shieh, S.-L.; Webster, P.; et al. Tropical Cyclones and Global Climate Change: A Post-IPCC Assessment. Bull. Am. Meteorol. Soc. 1998, 79, 19–38. [Google Scholar] [CrossRef] [Green Version]
- MICOA. Avaliação da Vulnerabilidade as Mudanças Climáticas e Estratégias de Adaptação; Ministry of Environment, Government of Mozambique: Maputo, Mozambique, 2005.
- Consultec. Estudo Ambiental Simplificado da Dragagem do Canal de Acesso ao Porto da Beira; Consultec Consultores Associados Ltd.: Maputo, Mozambique, 2007. [Google Scholar]
- Mavume, A.; Rydberg, L.; Rouault, M.; Lutjeharms, J. Climatology and Landfall of Tropical Cyclones in the South- West Indian Ocean. West. Indian Ocean J. Mar. Sci. 2009, 8, 15–36. [Google Scholar] [CrossRef] [Green Version]
- Asante, K.; Brito, R.; Brundrit, G.; Epstein, P.; Fernandes, A.; Marques, M.R.; Mavume, A.; Metzger, M.; Nussbaumer, P.; Patt, A.; et al. National Institute for Disaster Management Study on the Impact of Climate Change on Disaster Risk in Mozambique: Synthesis Report Acknowledgements; Ministery of State Administration, Government of Mozambique: Maputo, Mozambique, 2009.
- Charrua, A.B.; Bandeira, S.O.; Catarino, S.; Cabral, P.; Romeiras, M.M. Assessment of the vulnerability of coastal mangrove ecosystems in Mozambique. Ocean Coast. Manag. 2020, 189, 105145. [Google Scholar] [CrossRef]
- Cabral, P.; Augusto, G.; Akande, A.; Costa, A.; Amade, N.; Niquisse, S.; Atumane, A.; Cuna, A.; Kazemi, K.; Mlucasse, R.; et al. Assessing Mozambique’s exposure to coastal climate hazards and erosion. Int. J. Disaster Risk Reduct. 2017, 23, 45–52. [Google Scholar] [CrossRef]
- Post Cyclone Idai Cabinet for Reconstruction. Mozambique Cyclone Idai Post Disaster Needs Assessment; Government of Mozambique: Beira, Mozambique, 2019.
- UEM; FEWS; INGC. Atlas For Deaster Preparedness and Response in the Limpopo Basin; Government of Mozambique: Maputo, Mozambique, 2003.
- Kolstad, E.W. Prediction and precursors of Idai and 38 other tropical cyclones and storms in the Mozambique Channel. Q. J. R. Meteorol. Soc. 2020, 1–13. [Google Scholar] [CrossRef]
- Salih, A.A.M.; Baraibar, M.; Mwangi, K.K.; Artan, G. Climate change and locust outbreak in East Africa. Nat. Clim. Chang. 2020, 10, 584–585. [Google Scholar] [CrossRef]
- Zhang, C.; Durgan, S.D.; Lagomasino, D. Modeling risk of mangroves to tropical cyclones: A case study of Hurricane Irma. Estuar. Coast. Shelf Sci. 2019, 224, 108–116. [Google Scholar] [CrossRef]
- Taillie, P.J.; Roman-Cuesta, R.; Lagomasino, D.; Cifuentes-Jara, M.; Fatoyinbo, T.; Ott, L.E.; Poulter, B. Widespread mangrove damage resulting from the 2017 Atlantic mega hurricane season. Environ. Res. Lett. 2020, 15. [Google Scholar] [CrossRef]
- Paling, E.I.; Kobryn, H.T.; Humphreys, G. Assessing the extent of mangrove change caused by Cyclone Vance in the eastern Exmouth Gulf, northwestern Australia. Estuar. Coast. Shelf Sci. 2008, 77, 603–613. [Google Scholar] [CrossRef]
- Bhowmik, A.K.; Cabral, P. Cyclone Sidr impacts on the Sundarbans floristic diversity. Earth Sci. Res. 2013, 2, 62–79. [Google Scholar] [CrossRef] [Green Version]
- Macamo, C.C.F.; Massuanganhe, E.; Nicolau, D.K.; Bandeira, S.O.; Adams, J.B. Mangrove’s response to cyclone Eline (2000): What is happening 14 years later. Aquat. Bot. 2016, 134, 10–17. [Google Scholar] [CrossRef]
- Massuanganhe, E.A.; Macamo, C.; Westerberg, L.O.; Bandeira, S.; Mavume, A.; Ribeiro, E. Deltaic coasts under climate-relate catastrophic events—Insights from the Save River delta, Mozambique. Ocean Coast. Manag. 2015, 116, 331–340. [Google Scholar] [CrossRef]
- Hoque, A.-A.M.; Phinn, S.; Roelfsema, C.; Childs, I.R. Assessing tropical cyclone impacts using object-based moderate spatial resolution image analysis: A case study in Bangladesh. Int. J. Remote Sens. 2016, 37, 5320–5343. [Google Scholar] [CrossRef]
- Hu, T.; Smith, R.S. The Impact of Hurricane Maria on the Vegetation of Dominica and Puerto Rico Using Multispectral Remote Sensing. Remote Sens. 2018, 10, 827. [Google Scholar] [CrossRef] [Green Version]
- Zhang, X.; Wang, Y.; Jiang, H.; Wang, X. Remote-sensing assessment of forest damage by Typhoon Saomai and its related factors at landscape scale. Int. J. Remote Sens. 2013, 34, 7874–7886. [Google Scholar] [CrossRef]
- Ballanti, L.; Byrd, K.B.; Woo, I.; Ellings, C. Remote sensing for wetland mapping and historical change detection at the Nisqually River Delta. Sustainability 2017, 9, 1919. [Google Scholar] [CrossRef] [Green Version]
- Li, D.; Lu, D.; Wu, M.; Shao, X.; Wei, J. Examining land cover and greenness dynamics in Hangzhou Bay in 1985–2016 using Landsat time-series data. Remote Sens. 2018, 10, 32. [Google Scholar] [CrossRef] [Green Version]
- Hu, L.; Li, W.; Xu, B. Monitoring mangrove forest change in China from 1990 to 2015 using Landsat-derived spectral-temporal variability metrics. Int. J. Appl. Earth Obs. Geoinf. 2018, 73, 88–98. [Google Scholar] [CrossRef]
- Schneibel, A.; Stellmes, M.; Röder, A.; Frantz, D.; Kowalski, B.; Haß, E.; Hill, J. Assessment of spatio-temporal changes of smallholder cultivation patterns in the Angolan Miombo belt using segmentation of Landsat time series. Remote Sens. Environ. 2017, 195, 118–129. [Google Scholar] [CrossRef] [Green Version]
- He, Y.; Yang, J.; Guo, X. Green Vegetation Cover Dynamics in a Heterogeneous Grassland: Spectral Unmixing of Landsat Time Series from 1999 to 2014. Remote Sens. 2020, 12, 3826. [Google Scholar] [CrossRef]
- Millennium Ecosystem Assessment. Ecosystems and Human Well-Being: Synthesis; Island Press: Washington, DC, USA, 2005. [Google Scholar]
- INE. IV Recenceamento Geral da População e Habitação 2017—Resultados Definitivos; National Institute of Statistics, Government of Mozambique: Maputo, Mozambique, 2019.
- Hoguane, A.M. Perfil Diagnóstico da Zona Costeira de Moçambique. Rev. Gest. Costeira Integr. 2007, 7, 69–82. [Google Scholar] [CrossRef]
- Marzoli, A. Avaliação Integrada de Florestas em Moçambique—Inventário Florestal Nacional; Ministery of Agriculture, Government of Mozambique: Maputo, Mozambique, 2007.
- Macamo, C.; Bandeira, S.; Muando, S.; Abreu, D.; Mabilana, H. Mangroves of Mozambique. In Mangroves of the Western Indian Ocean: Status and Management; Bosire, J.O., Mangora, M.M., Bandeira, S.O., Rajkaran, A., Appadoo, C., Kairo, J.G., Eds.; WIOMSA: Zanzibar Town, Tanzania, 2016; pp. 51–73. ISBN 9987955940. [Google Scholar]
- Jensen, J.R. Introductory Digital Image Processing: A Remote Sensing Perspective, 2nd ed.; Prentice Hall: Upper Saddle River, NJ, USA, 2005. [Google Scholar]
- Padmanaban, R.; Bhowmik, A.K.; Cabral, P. A remote sensing approach to environmental monitoring in a reclaimed mine area. ISPRS Int. J. Geo Inf. 2017, 6, 401. [Google Scholar] [CrossRef] [Green Version]
- Chen, J.; Zhu, X.; Vogelmann, J.E.; Gao, F.; Jin, S. A simple and effective method for filling gaps in Landsat ETM+ SLC-off images. Remote Sens. Environ. 2011, 115, 1053–1064. [Google Scholar] [CrossRef]
- Goslee, S.C. Analyzing Remote Sensing Data in R: The landsat Package. J. Stat. Softw. 2011, 43, 1–25. [Google Scholar] [CrossRef] [Green Version]
- Hossain, M.S.; Bujang, J.S.; Zakaria, M.H.; Hashim, M. Assessment of Landsat 7 Scan Line Corrector-off data gap-filling methods for seagrass distribution mapping. Int. J. Remote Sens. 2015, 36, 1188–1215. [Google Scholar] [CrossRef]
- USGS. Preliminary Assessment of the Value of Landsat 7 ETM+ SLC-off Data. Available online: https://www.usgs.gov/media/files/preliminary-assessment-value-landsat-7-etm-slc-data (accessed on 25 November 2020).
- USGS. Phase 2 Gap-Fill Algorithm: SLC-Off Gap-Filled Products Gap-Fill Algorithm Methodology. Available online: https://landsat.usgs.gov/sites/default/files/documents/L7SLCGapFilledMethod.pdf (accessed on 19 September 2020).
- Chander, G.; Markham, B.L.; Helder, D.L. Summary of current radiometric calibration coefficients for Landsat MSS, TM, ETM+, and EO-1 ALI sensors. Remote Sens. Environ. 2009, 113, 893–903. [Google Scholar] [CrossRef]
- Gupta, K.; Mukhopadhyay, A.; Giri, S.; Chanda, A.; Datta Majumdar, S.; Samanta, S.; Mitra, D.; Samal, R.N.; Pattnaik, A.K.; Hazra, S. An index for discrimination of mangroves from non-mangroves using LANDSAT 8 OLI imagery. MethodsX 2018, 5, 1129–1139. [Google Scholar] [CrossRef]
- Pathak, V.N.; Patel, K.D.; Trevedi, H.J. Development of an Atmospheric Correction Method for Retrieval of Surface Reflectance from Satellite Data; Sardar Patel University: Gujarat, India, 2016. [Google Scholar]
- Leutner, B.; Horning, N.; Schwalb-Willmann, J. Stoolbox: Tools for Remote Sensing Data Analysis. R Package Version 0.2.6. Available online: https://cran.r-project.org/web/packages/RStoolbox/index.html (accessed on 18 September 2020).
- Li, W.; El-askary, H.; Qurban, M.A.; Li, J.; Manikandan, K.P.; Piechota, T. Using multi-indices approach to quantify mangrove changes over the Western Arabian Gulf along Saudi Arabia coast. Ecol. Indic. 2019, 102, 734–745. [Google Scholar] [CrossRef]
- Louarn, M.L.; Clergeau, P.; Briche, E.; Deschamps-Cottin, M. “Kill two birds with one stone”: Urban tree species classification using Bi-Temporal pléiades images to study nesting preferences of an invasive bird. Remote Sens. 2017, 9, 916. [Google Scholar] [CrossRef] [Green Version]
- Padmanaban, R.; Bhowmik, A.K.; Cabral, P.; Zamyatin, A.; Almegdadi, O.; Wang, S. Modelling urban sprawl using remotely sensed data: A case study of Chennai city, Tamilnadu. Entropy 2017, 19, 163. [Google Scholar] [CrossRef] [Green Version]
- Liaw, A.; Wiener, M. Classification and regression by randomForest. R News 2002, 2, 18–22. [Google Scholar]
- R Core Team. A Language and Environment for Statistical Computing: R Foundation for Statistical Computing, Viena, Austria. Available online: https://rstudio.com/products/rstudio/ (accessed on 16 September 2020).
- Bivand, R.S.; Pebesma, E.J.; Gómez-Rubio, V. Applied Spatial Data Analysis with R; Springer International Publishing: Berlin, Germany, 2008; Volume 65, ISBN 978-0-387-78170-9. [Google Scholar]
- Hijmans, R.J. Raster: Geographic Data Analysis and Modeling: R Package Version 3.3-13. Available online: https://cran.r-project.org/web/packages/raster/index.html (accessed on 16 September 2020).
- Bivand, R.; Keitt, T.H.; Rowlingson, B. Rgdal: Bindings for the Geospatial Data Abstraction Library. R Package Version 1.5-16. Available online: http://cran.r-project.org/%0Apackage=rgdal (accessed on 25 September 2020).
- Assal, T.J.; Anderson, P.J.; Sibold, J. Mapping forest functional type in a forest-shrubland ecotone using SPOT imagery and predictive habitat distribution modelling. Remote Sens. Lett. 2015, 6, 755–764. [Google Scholar] [CrossRef]
- Walston, L.J.; Cantwell, B.L.; Krummel, J.R. Quantifying spatiotemporal changes in a sagebrush ecosystem in relation to energy development. Ecography 2009, 32, 943–952. [Google Scholar] [CrossRef]
- Cakir, H.I.; Khorram, S.; Nelson, S.A.C. Correspondence analysis for detecting land cover change. Remote Sens. Environ. 2006, 102, 306–317. [Google Scholar] [CrossRef]
- Naimi, B. rts: Raster Time Series Analysis: R Package Version 1.0-49. Available online: https://cran.r-project.org/web/packages/rts/index.html (accessed on 9 October 2020).
- Zhu, Z.; Woodcock, C.E. Continuous change detection and classification of land cover using all available Landsat data. Remote Sens. Environ. 2014, 144, 152–171. [Google Scholar] [CrossRef] [Green Version]
- Amone-Mabuto, M.; Bandeira, S.; Silva, A. Long-term changes in seagrass coverage and potential links to climate-related factors: The case of Inhambane Bay, southern Mozambique. WIO J. Mar. Sci. 2017, 16, 13–25. [Google Scholar]
- Silva, J.A.; Sedano, F.; Flanagan, S.; Ombe, Z.A.; Machoco, R.; Meque, C.H.; Sitoe, A.; Ribeiro, N.; Anderson, K.; Baule, S.; et al. Charcoal-related forest degradation dynamics in dry African woodlands: Evidence from Mozambique. Appl. Geogr. 2019, 107, 72–81. [Google Scholar] [CrossRef]
- Devi, S. Cyclone Idai: 1 month later, devastation persists. Lancet 2019, 393, 1585. [Google Scholar] [CrossRef]
- Li, Z.; Wang, S.; Song, S.; Wang, Y.; Musakwa, W. Detecting land degradation in Southern Africa using Time Series Segment and Residual Trend (TSS-RESTREND). J. Arid Environ. 2021, 184. [Google Scholar] [CrossRef]
- Couto, A.; Bonate, P.; Simango, Y. Inventário de Terras Húmidas em Moçambique: Identificação de Áreas com 500 Hectares ou Mais; WWF and Biofund: Maputo, Mozambique, 2019. [Google Scholar]
- Ramsar. Mozambique’s Zambezi Delta Extended to Cover 3000 Square Kilometres. Available online: https://www.ramsar.org/news/mozambiques-zambezi-delta-extended-to-cover-3000-square-kilometres (accessed on 3 November 2020).
- Chabwela, H.N. Wetlands: A Conservation Programme for Southern Africa. A Report Document. In Proceedings of the IUCN, Wetlands Conservation Programme Southern African Development Coordination Conference, Gaborone, Botswana, 3–5 June 1991. [Google Scholar]
- Saket, M. Report on the Updating of the Exploratory National Forest Inventory; Government of Mozambique: Maputo, Mozambique, 1994.
- Gardiner, B.; Byrne, K.; Hale, S.; Kamimura, K.; Mitchell, S.J.; Peltola, H.; Ruel, J.C. A Review of Mechanistic Modeling of Wind Damage Risk to Forests. Forestry 2008, 81, 447–463. [Google Scholar] [CrossRef] [Green Version]
- Lanquaye-Opoku, N.; Mitchell, S.J. Portability of Stand-Level Empirical Windthrow Risk Models. For. Ecol. Manag. 2005, 216, 134–148. [Google Scholar] [CrossRef]
- Macisaac, D.A.; Krygier, R. Development and Long-Term Evaluation of Harvesting Patterns to Reduce Windthrow Risk of Understorey Spruce in Aspen-White Spruce Mixed Wood Stands in Alberta, Canada. Forestry 2009, 82, 323–342. [Google Scholar] [CrossRef] [Green Version]
- Everham, E.M.; Brokaw, N.V. Forest damage and recovery from catastrophic wind. Bot. Rev. 1996, 62, 113–185. [Google Scholar] [CrossRef]
- Zimmerman, J.K.; Everham, E.M., III; Waide, R.B.; Lodge, D.J.; Taylor, C.M.; Brokaw, N.V.L. Responses of Tree Species to Hurricane Winds in Subtropical Wet Forest in Puerto Rico: Implications for Tropical Tree Life Histories. J. Ecol. 1994, 82, 911–922. [Google Scholar] [CrossRef]
- Lin, T.C.; Hogan, J.A.; Chang, C.-T. Tropical Cyclone Ecology: A Scale-Link Perspective. Trends Ecol. Evol. 2020, 35, 594–604. [Google Scholar] [CrossRef] [Green Version]
- Doyle, T.W.; Smith III, T.J.; Robblee, M.B. Wind damage effects of Hurricane Andrew on mangrove communities along the southwest coast of Florida, USA. J. Coast. Res. 1995, 21, 159–168. Available online: https://www.jstor.org/stable/25736006 (accessed on 7 January 2021).
- Rossi, E.; Rogan, J.; Schneider, L. Mapping forest damage in northern Nicaragua after Hurricane Felix (2007) using MODIS enhanced vegetation index data. GIScience Remote Sens. 2013, 50, 385–399. [Google Scholar] [CrossRef]
- Doyle, T.W.; Girod, G.F.; Books, M.A. Modeling mangrove forest migration along the southwest coast of Florida under climate change. In Integrated Assessment of the Climate Change Impacts on the Gulf Coast Region; Ning, Z.H., Turner, R.E., Doyle, T.W., Abdollahi, K., Eds.; GCRCC: Baton Rouge, LA, USA, 2003; pp. 211–221. [Google Scholar]
- Foster, D.R.; Boose, E.R. Patterns of Forest Damage Resulting From Catastrophic Wind in Central New England, USA. J. Ecol. 1992, 80, 79–98. [Google Scholar] [CrossRef]
- Chamberlain, D.; Phinn, S.; Possingham, H. Remote sensing of mangroves and estuarine communities in central Queensland, Australia. Remote Sens. 2020, 12, 197. [Google Scholar] [CrossRef] [Green Version]


| Date | Sensor | Path Row |
|---|---|---|
| 12 April 2012 | Landsat 7 ETM+ | 166/73 |
| 19 April 2012 | Landsat 7 ETM+ | 167/72, 73, 74, 75 |
| 28 April 2012 | Landsat 7 ETM+ | 168/72, 73, 74 |
| 13 April 2013 | Landsat 7 ETM+ | 166/73 |
| 15 April 2013 | Landsat 7 ETM+ | 167/72, 73, 74, 75 |
| 22 April 2013 | Landsat 7 ETM+ | 168/72, 73, 74 |
| 2 April 2014 | Landsat 7 ETM+ | 166/73 |
| 16 April 2014 | Landsat 7 ETM+ | 167/72, 73, 74, 75 |
| 18 April 2014 | Landsat 7 ETM+ | 168/72, 73, 74 |
| 12 April 2015 | Landsat 7 ETM+ | 166/73 |
| 12 April 2015 | Landsat 7 ETM+ | 167/72, 73, 74, 75 |
| 19 April 2015 | Landsat 7 ETM+ | 168/72, 73, 74 |
| 6 April 2016 | Landsat 8 OLI | 166/73 |
| 13 April 2016 | Landsat 8 OLI | 167/72, 73, 74, 75 |
| 29 April 2016 | Landsat 8 OLI | 168/72, 73, 74 |
| 9 April 2017 | Landsat 8 OLI | 166/73 |
| 16 April 2017 | Landsat 8 OLI | 167/72, 73, 74, 75 |
| 25 April 2017 | Landsat 8 OLI | 168/72, 73, 74 |
| 12 April 2018 | Landsat 8 OLI | 166/73 |
| 19 April 2018 | Landsat 8 OLI | 167/72, 73, 74, 75 |
| 28 April 2018 | Landsat 8 OLI | 168/72, 73, 74 |
| 6 April 2019 | Landsat 8 OLI | 166/73 |
| 15 April 2019 | Landsat 8 OLI | 167/72, 73, 74, 75 |
| 22 April 2019 | Landsat 8 OLI | 168/72, 73, 74 |
| ID | Land Use and Land Cover Types | Description |
|---|---|---|
| 1 | Dense Vegetation | Woodland and forest |
| 2 | Shrub land | Brush, scrubland, shrubs and bush |
| 3 | Grassland and dambos | Grasses, rush and sedge |
| 4 | Agricultural land | Pasture, crop cultivation area, hay and other fruit plants |
| 5 | Wetland vegetation | Coastal and marine ecosystems including swamps, saltmarshes, and mangroves |
| 6 | Barren vegetation | Stunted, sparse and limited vegetation form/structure |
| 7 | Barren land | Sand, rocks, dry salt flats (including salt pans), mines, gravel pits and quarries |
| 8 | Built-up areas | Settlements, roads, bridges, urban and other infrastructures |
| 9 | Waterbodies | River, open water, lakes, streams, estuaries and ponds |
| LULC Types | Producer Accuracy | User Accuracy |
|---|---|---|
| Dense vegetation | 83.6 | 91.6 |
| Shrub land | 81.2 | 83.6 |
| Grassland and dambos | 89.9 | 92.7 |
| Agriculture land | 87.1 | 89.3 |
| Wetland vegetation | 88.3 | 92.4 |
| Barren vegetation | 92.5 | 94.1 |
| Barren land | 87.7 | 89.3 |
| Built-up areas | 80.6 | 84.2 |
| Waterbodies | 86.4 | 86.4 |
| Land Cover Types | Counts (Pixels) | Total Area (SqKm) | Mean NDVI Pre-Cyclone | Mean NDVI Post-Cyclone | ∆NDVI | NDVI% |
|---|---|---|---|---|---|---|
| Dense vegetation | 45,393,777 | 40,854.4 | 0.78 | 0.32 | −0.46 | −58.9 |
| Shrub land | 1,1070,577 | 9963.52 | 0.63 | 0.28 | −0.35 | −55.5 |
| Grassland and dambos | 3,980,911 | 3582.82 | 0.59 | 0.43 | −0.16 | −27.1 |
| Agriculture land | 5,705,377 | 5134.84 | 0.66 | 0.45 | −0.21 | −31.8 |
| Wetland vegetation | 8,104,666 | 7294.20 | 0.54 | 0.23 | −0.31 | −57.4 |
| Barren vegetation | 23,711 | 21.34 | 0.52 | 0.38 | −0.14 | −26.9 |
| Barren land | 399,033 | 359.13 | 0.31 | 0.24 | −0.07 | −22.5 |
| Built-up areas | 42,977 | 38.68 | 0.28 | 0.19 | −0.09 | −32.1 |
| Distance (km) | Counts (Pixels) | ∆NDVI | NDVI% |
|---|---|---|---|
| 0–25 | 7,516,910 | −0.38 | −55.07 |
| 25–50 | 8,079,493 | −0.32 | −53.3 |
| 50–75 | 8,605,728 | −0.36 | −52.9 |
| 75–100 | 8,768,752 | −0.25 | −45.4 |
| 100–125 | 10,234,104 | −0.19 | −30.1 |
| 125–150 | 10,724,540 | −0.13 | −26.5 |
| 150–175 | 8,988,106 | −0.15 | −26.3 |
| 175–200 | 5,451,298 | −0.13 | −25.01 |
| 200–225 | 3,909,496 | −0.11 | −21.5 |
| 225–250 | 3,003,413 | −0.12 | −18.4 |
Publisher’s Note: MDPI stays neutral with regard to jurisdictional claims in published maps and institutional affiliations. |
© 2021 by the authors. Licensee MDPI, Basel, Switzerland. This article is an open access article distributed under the terms and conditions of the Creative Commons Attribution (CC BY) license (http://creativecommons.org/licenses/by/4.0/).
Share and Cite
Charrua, A.B.; Padmanaban, R.; Cabral, P.; Bandeira, S.; Romeiras, M.M. Impacts of the Tropical Cyclone Idai in Mozambique: A Multi-Temporal Landsat Satellite Imagery Analysis. Remote Sens. 2021, 13, 201. https://doi.org/10.3390/rs13020201
Charrua AB, Padmanaban R, Cabral P, Bandeira S, Romeiras MM. Impacts of the Tropical Cyclone Idai in Mozambique: A Multi-Temporal Landsat Satellite Imagery Analysis. Remote Sensing. 2021; 13(2):201. https://doi.org/10.3390/rs13020201
Chicago/Turabian StyleCharrua, Alberto Bento, Rajchandar Padmanaban, Pedro Cabral, Salomão Bandeira, and Maria M. Romeiras. 2021. "Impacts of the Tropical Cyclone Idai in Mozambique: A Multi-Temporal Landsat Satellite Imagery Analysis" Remote Sensing 13, no. 2: 201. https://doi.org/10.3390/rs13020201