Article

A Wheat Spike Detection Method in UAV Images Based on Improved YOLOv5

1
National Engineering and Technology Center for Information Agriculture, Nanjing Agricultural University, Nanjing 210095, China
2
Key Laboratory for Crop System Analysis and Decision Making, Ministry of Agriculture and Rural Affairs, Nanjing 210095, China
3
Jiangsu Collaborative Innovation Center for Modern Crop Production, Nanjing 210095, China
4
Jiangsu Key Laboratory for Information Agriculture, Nanjing 210095, China
*
Author to whom correspondence should be addressed.
Remote Sens. 2021, 13(16), 3095; https://doi.org/10.3390/rs13163095
Submission received: 29 June 2021 / Revised: 31 July 2021 / Accepted: 1 August 2021 / Published: 5 August 2021
(This article belongs to the Special Issue Remote Sensing for Smart Agriculture Management)

Abstract

:
Deep-learning-based object detection algorithms have significantly improved the performance of wheat spike detection. However, UAV images crowned with small-sized, highly dense, and overlapping spikes cause the accuracy to decrease for detection. This paper proposes an improved YOLOv5 (You Look Only Once)-based method to detect wheat spikes accurately in UAV images and solve spike error detection and miss detection caused by occlusion conditions. The proposed method introduces data cleaning and data augmentation to improve the generalization ability of the detection network. The network is rebuilt by adding a microscale detection layer, setting prior anchor boxes, and adapting the confidence loss function of the detection layer based on the IoU (Intersection over Union). These refinements improve the feature extraction for small-sized wheat spikes and lead to better detection accuracy. With the confidence weights, the detection boxes in multiresolution images are fused to increase the accuracy under occlusion conditions. The result shows that the proposed method is better than the existing object detection algorithms, such as Faster RCNN, Single Shot MultiBox Detector (SSD), RetinaNet, and standard YOLOv5. The average accuracy (AP) of wheat spike detection in UAV images is 94.1%, which is 10.8% higher than the standard YOLOv5. Thus, the proposed method is a practical way to handle the spike detection in complex field scenarios and provide technical references for field-level wheat phenotype monitoring.

Graphical Abstract

1. Introduction

Wheat is an important food crop in the world, with an annual global yield of about 730 million tons. Wheat is the foundation of world food security [1]. However, biological and abiotic adversities have often occurred in the wheat production process in recent years, introducing many uncertainties to wheat yield formation. Therefore, using remote sensing to monitor the wheat growth process and predict yield has become a meaningful way to stabilize yield and optimize production management [2,3]. Moreover, assessing the production of wheat spikes as the grain-bearing organ is a valuable and practical measure of wheat yield [4,5]. Thus, detecting wheat spikes from remote sensing images has received increased interest recently.
Considering the cost and observation limitations of satellite and ground remote sensing [6], UAVs have the advantages of low-altitude flight capability and efficient operation. As a result, UAVs can easily and quickly obtain large-scale high-spatial-resolution images of wheat fields [7] and successfully assess large-scale wheat spikes by equipping with visible light, multispectral, and thermal infrared cameras [8,9,10]. Meanwhile, because researchers can freely customize UAV flights according to their needs and field environments [11], UAVs significantly improve the efficiency of the wheat spike survey.
Wheat spike monitoring in UAV images mainly uses object detection methods to obtain the number and geometric pattern of wheat spikes in the image. The existing detection methods are mainly divided into two categories: concrete-feature-based methods and abstract-feature-based methods. Concrete-feature-based methods realize the segmentation and detection of wheat spikes by manually selecting features. Researchers integrate color, geometric, and texture features to analyze and classify the features based on non-neural approaches (e.g., Bayesian, support vector machine, and random forest) [12,13,14,15,16,17,18]. However, concrete-feature-based methods have disadvantages of complex feature design, weak migration, and cumbersome manual design [19]. They cannot be well adapted to scenes with dense wheat spike distribution and severe occlusion in the field [20]. Deep learning based on convolutional neural networks (CNNs) in computer vision has been well developed with the advancement of computer performance and improved availability of numerous labeled images [21,22]. Methods based on abstract features realize the segmentation and detection of wheat spikes through various abstract features. These abstract features are extracted by a convolutional neural network [23] without manual intervention. The performance of abstract-feature-based methods is better than that of methods based on specific features [19]. The one-stage and two-stage detection algorithms are the two main groups of abstract-feature-based methods and have received extensive attention in wheat spike detection research studies. Two-stage detection algorithms are based on region proposals, mainly including SPP-Net [24], Fast R-CNN [25], and Faster R-CNN [26]. The detection happens in two stages: region proposal generation and detection for these proposals [27]. The main one-stage detection algorithms are the SSD [28] and YOLO (You Look Only Once) family, which include YOLO [29], YOLO9000 [30], YOLOv3 [31], YOLOv4 [32], and YOLOv5 [33]. As a regression-based object detection method, the one-stage detection algorithm does not require the step of proposal generation. By directly obtaining the location and category information of the object, the one-stage detection algorithm significantly improves the detection speed. However, the detection accuracy is lower than that of the two-stage detection algorithm.
State-of-the-art deep learning object detection algorithms have made significant progress in wheat spike detection in images [34,35]. The success of the wheat spike detection led to the high accuracy of in-field spike counting in former works [36,37,38,39]. However, small-sized, highly dense, and overlapping wheat spikes in UAV images can easily lead to error detection and miss detection. Meanwhile, the complex background of UAV images in fields and the substantial morphological differences between individual wheat spikes will increase the difficulty of the detection. These problems lead to the low accuracy of wheat spike detection in UAV images and make it impossible to forecast and evaluate yield.
In order to solve the issues mentioned above, this paper proposes a method based on improved YOLOv5 to detect wheat spikes accurately in UAV images. This method improves the generalization capability of the network and the accuracy of detecting small-sized wheat spikes in UAV images. The detection process is refined by adding a microscale detection layer, setting prior anchor boxes, and adapting the confidence loss function of the detection layer based on the IoU (Intersection over Union). Moreover, we fuse predicted boxes on multiresolution images to increase the wheat spike detection accuracy in complex field scenes. The proposed method improves the applicability of the YOLO algorithm in complex field environments, which can accurately detect multisized wheat spikes, especially small-sized wheat spikes, and better solve the occlusion and overlap problem of wheat spikes.

2. Materials and Methods

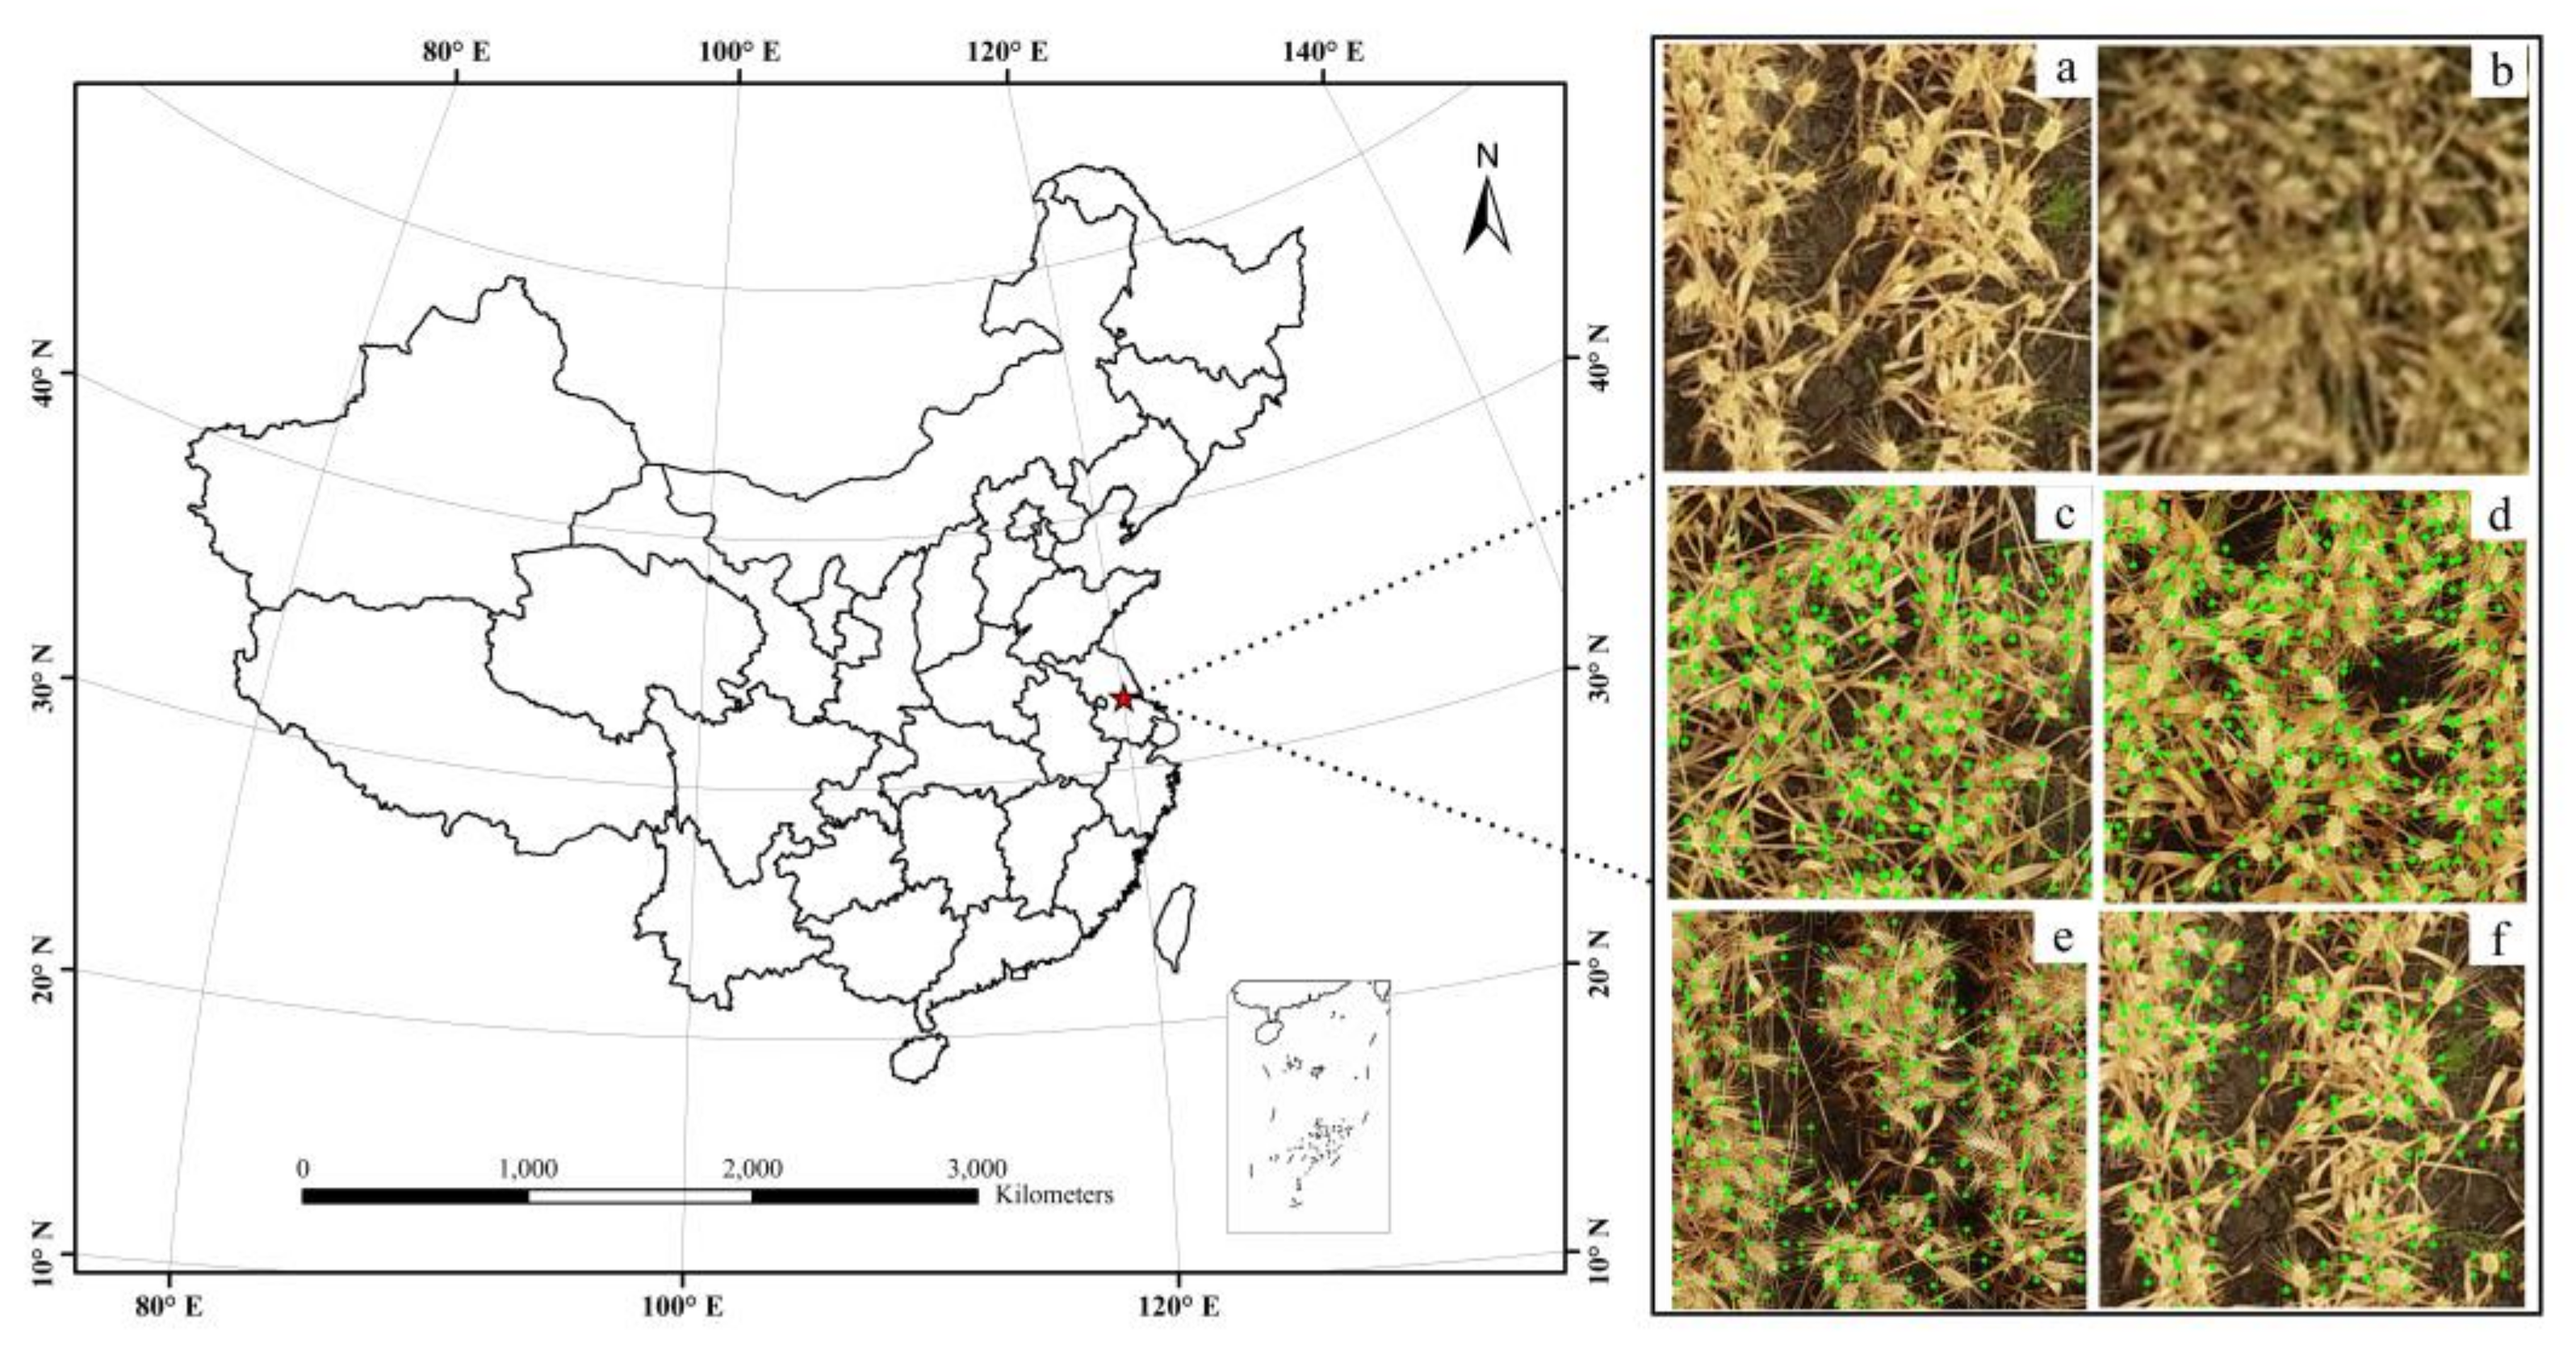
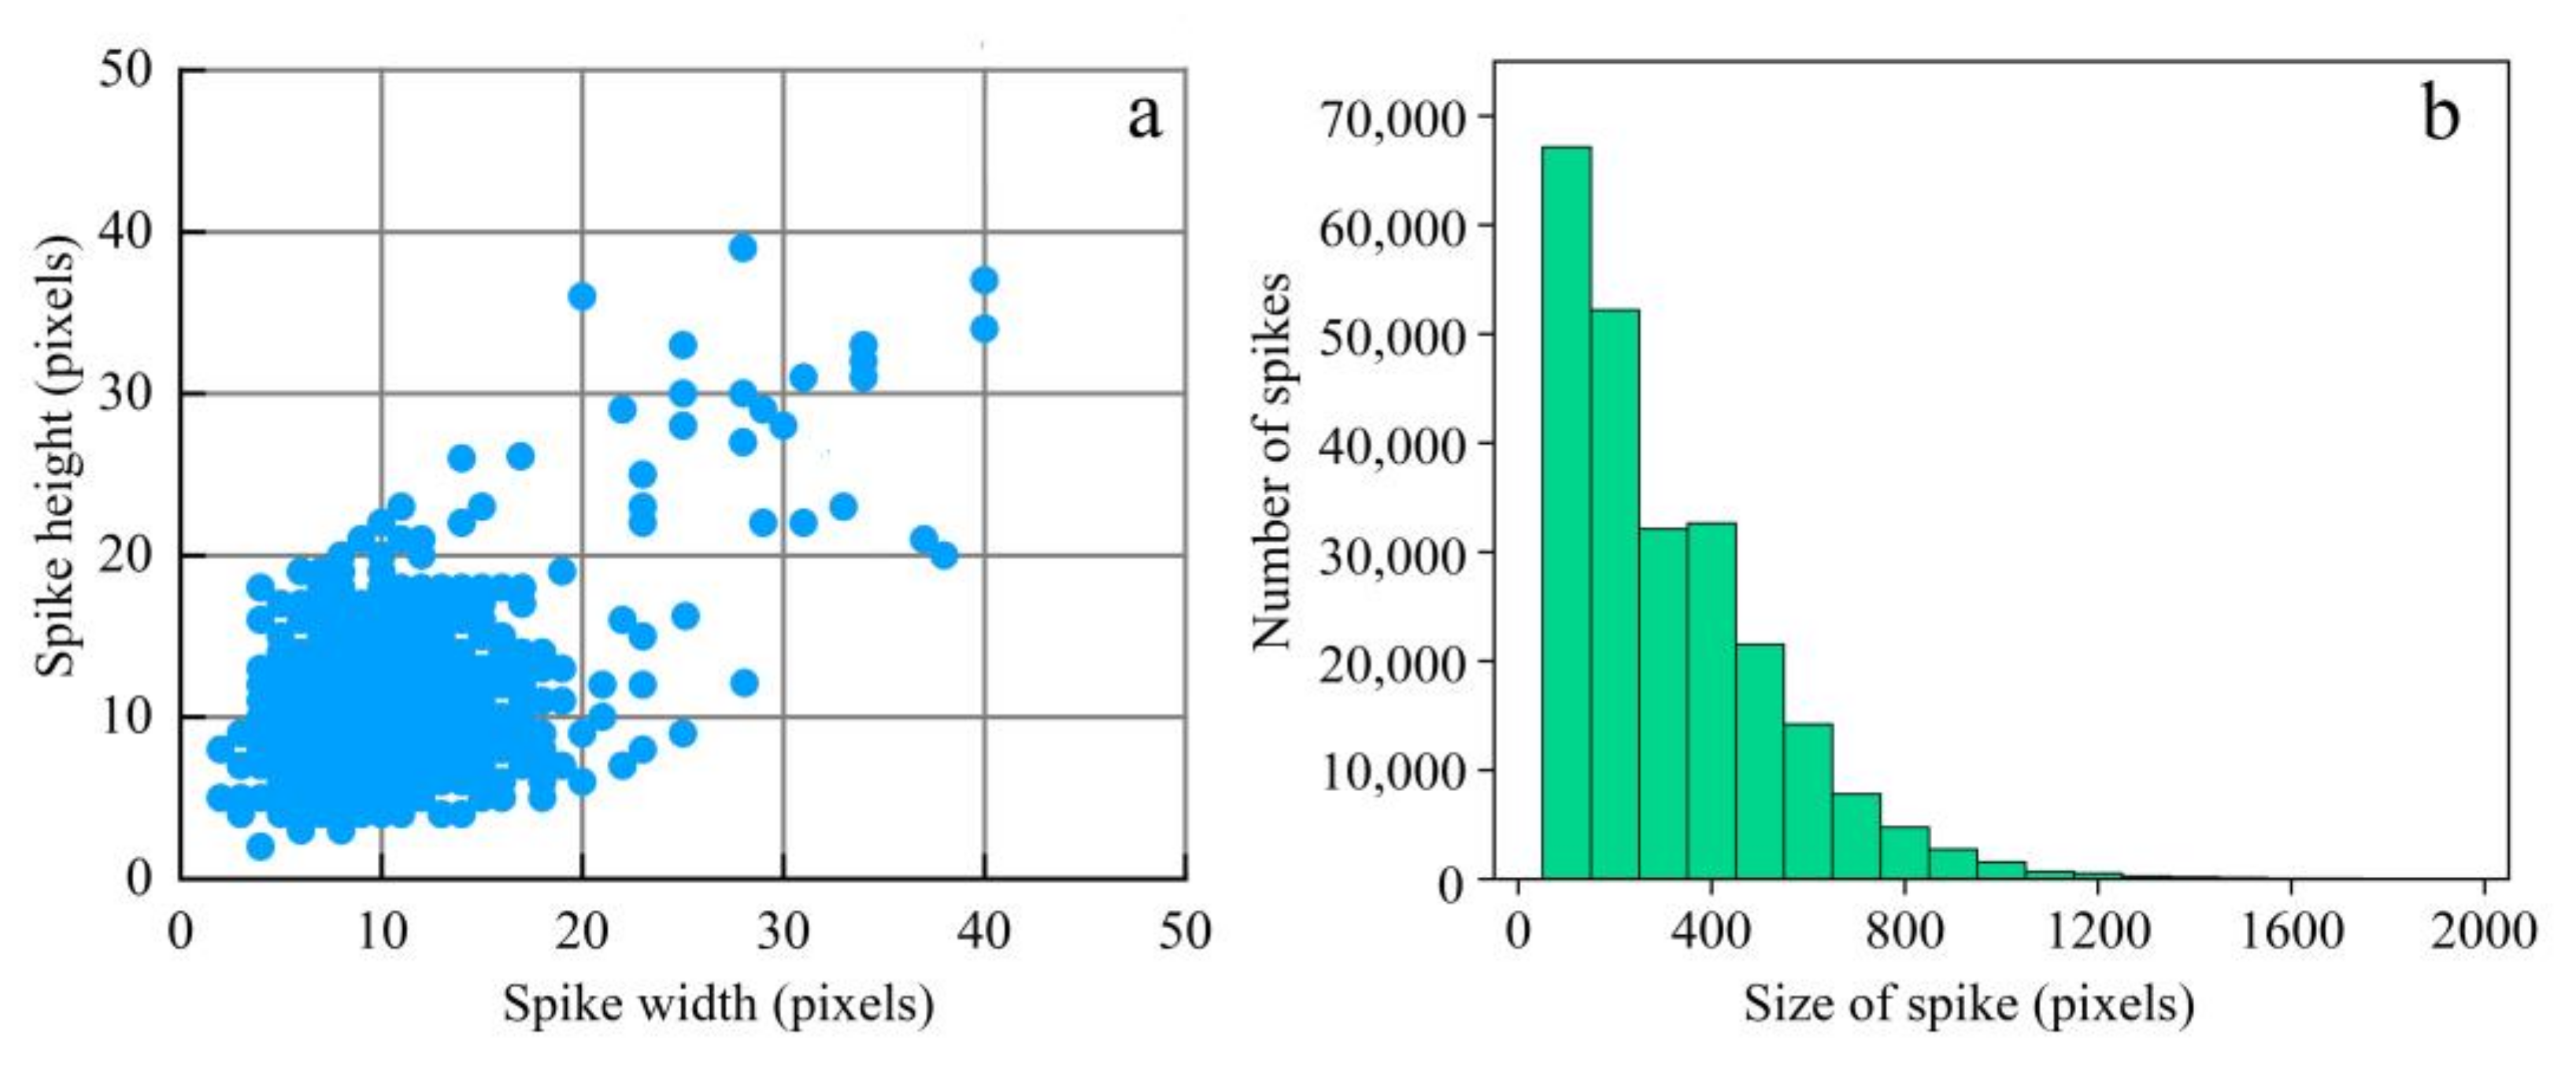
2.1. UAV Wheat Spike Images

High-quality in-field images were taken by a DJITM MatriceTM 210 drone equipped with a DJITM ZenmuseTM X4S camera at three different heights of 7, 10, and 15 m during the ripening stage. The experimental field was located in Xinghua, Jiangsu Province, China (119.90°E, 33.07°N) (Figure 1). Original 5472 × 3648 pixel images were cropped into 150 × 150 pixel pictures (Figure 1a) to reduce data processing time, highlight wheat characteristics, and avoid loss of image information. Moreover, some obtained images were blurry due to the unstable situations of UAV flights (Figure 1b), so we applied the Laplace transform to remove blurred images and get clear images [40]. In addition, an image annotation tool (LabelImg) was used to label wheat spikes in clear images [41] (Figure 1c–f).

2.2. Wheat Spike Detection Method

This research proposes a wheat spike detection method in UAV images based on improved YOLOv5. The method consists of data preprocessing, network training, and model inference (Figure 2). First, all the images are cleaned, augmented, and labeled. Then, with the network improvements, the detection models are trained and used on multiresolution images. Finally, the wheat spike detection results are achieved by fusing detection boxes derived from multiresolution images. Moreover, the YOLOv5 network is mainly improved by adding a microscale detection layer, setting prior anchor boxes, and adapting the confidence loss function of the detection layer based on the IoU.
The method consists of three critical parts: data processing, network training, and model inference. The improvements proposed in this method (in orange color) include refining network structure and fusing detection boxes.

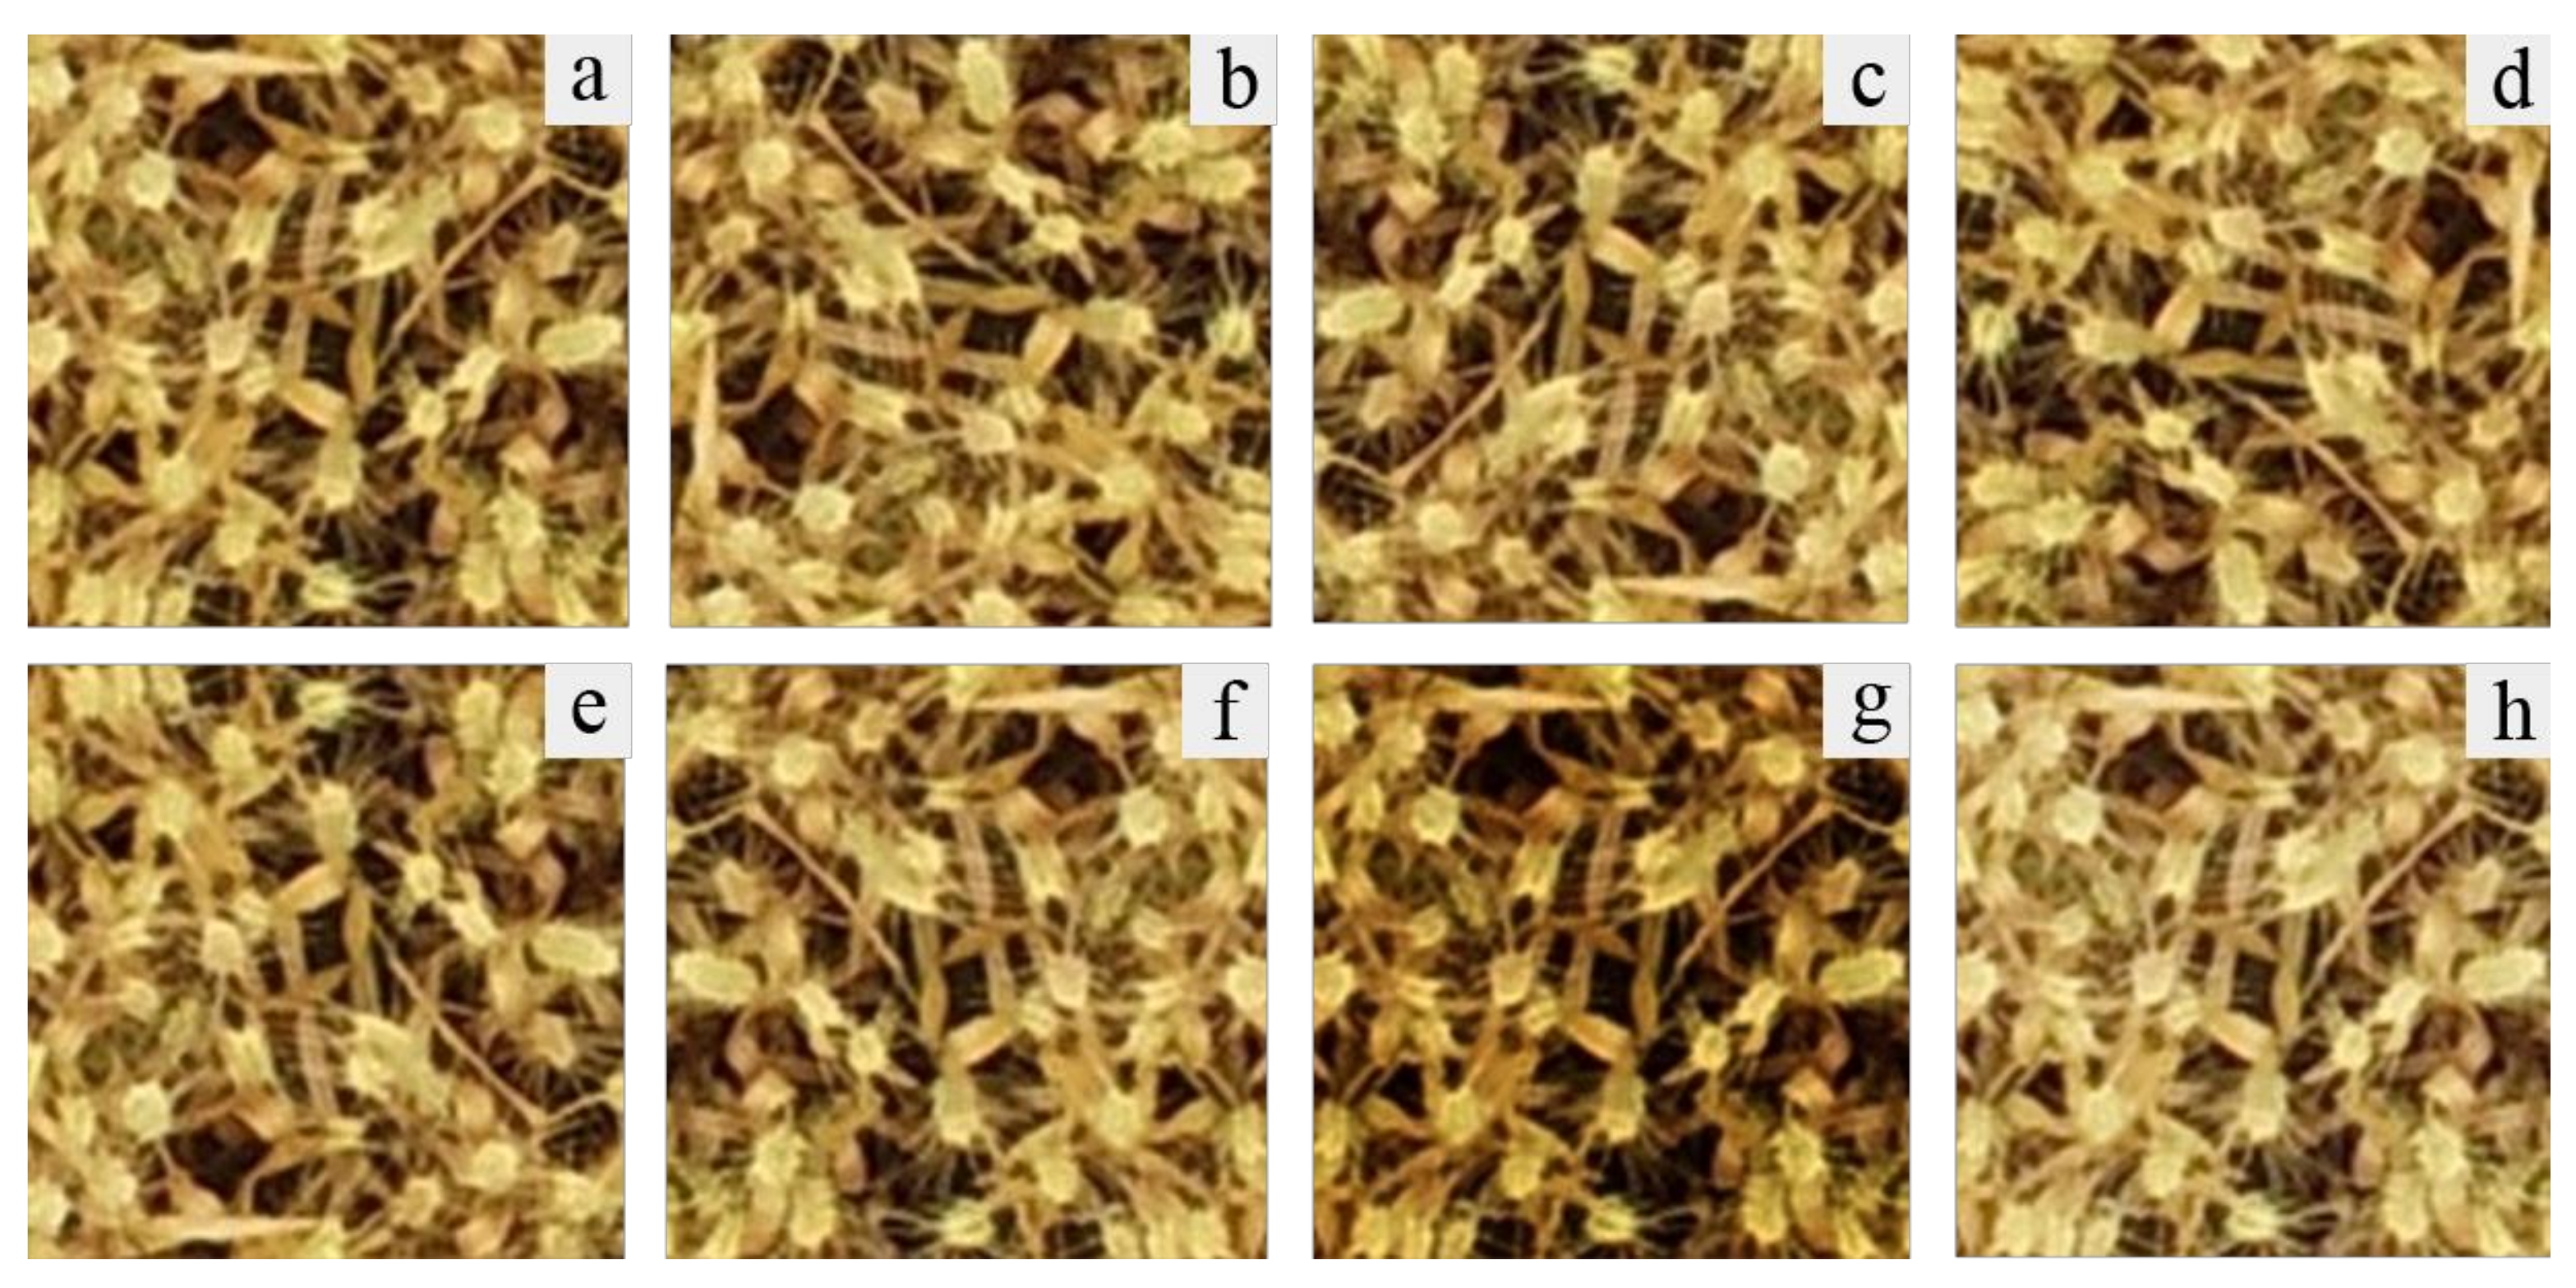
2.3. Data Augmentation

This research used data augmentation to improve network learning and enhance the generalization capability of the network model [19]. We mainly chose image rotation, image flip, and luminance balance as the data augmentation methods (Figure 3). Rotated and flipped images can improve the detection performance and robustness of the network. Meanwhile, the luminance balance can eliminate the impacts of the brightness deviation on network performance caused by the environmental lighting changes and sensor differences [42,43]. After data augmentation, a total of 12,000 images were obtained and divided into a training dataset, validation dataset, and test dataset according to a ratio of 7:2:1.

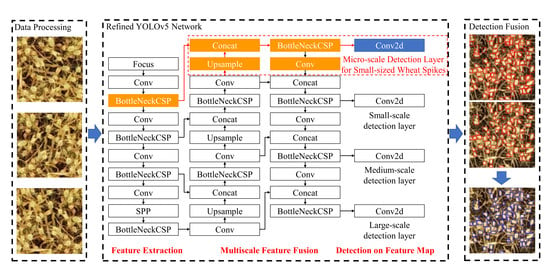
2.4. YOLOv5 Network Structure and Refinements

Glenn Jocher released YOLOv5 in 2020. Its network structure is mainly divided into the backbone module, neck module, and head module [33]. The backbone module extracts features from the input image based on Focus, Bottleneck CSP (Cross Stage Partial Networks), and SPP (Spatial Pyramid Pooling) and transmits them to the neck module. The neck module generates a feature pyramid based on the PANet (Path Aggregation Network). It enhances the ability to detect objects with different scales by fusing low-level spatial features and high-level semantic features bidirectionally. The head module generates detection boxes, indicating the category, coordinates, and confidence by applying anchor boxes to multiscale feature maps from the neck module.

2.4.1. Microscale Detection Layer

YOLOv5 makes detection at three scales, which are precisely given by downsampling the input image dimensions by 32, 16, and 8, respectively. In this research, we detect spikes of different sizes at different scales. However, some wheat spikes are tiny in size and densely distributed in UAV images, and the small-scale detection layer of YOLOv5 has poor applicability to these wheat spikes. Thus, we added a new microscale detection layer, which was given by downsampling the input image dimensions by four. This microscale layer generates a feature map by extracting lower spatial features and fusing them with deep semantic features. The new microscale detection layer makes a broader and more detailed detection network structure (Figure 4), which is applicable in detecting the tiny, crowded wheat spikes in UAV images.

2.4.2. Hierarchical Setting of Anchor Box Size Based on k-Means

Faster RCNN first proposed the concept of the anchor box to detect multiple objects in a grid unit [26]. YOLO uses anchor boxes to match objects better [30,31]. Since customizing the anchor boxes depends on the prior knowledge of the dataset, the anchor box autolearning based on the entire dataset used in previous research studies had an excellent performance on a single-scale dataset. However, there are significant differences in the size of wheat spikes in UAV images, and the number of samples of different sizes is unbalanced. As a result, the anchor boxes based on the whole dataset clustering only focus on the wheat spike sizes with a large number and cannot effectively cover all the wheat spike sizes. This research classified all wheat spikes into four categories G i = G i = 1 4 according to their size based on four detection layers. For all wheat spikes g t j i x j , y j , w j , h j , j 1 , M , i 1 , N in each class G i , the distance metric between the ground truth box and the anchor box can be defined as
d ( g t , b b o x ) = 1 IoU ( g t , b b o x )
and
IoU ( g t , b b o x ) = a r e a ( g t b b o x ) a r e a ( g t b b o x )
where gt is the ground truth of the wheat spike bounding box, and bbox denotes the anchor box. The larger the IoU value between gt and bbox is, the smaller the distance metric is, which means the anchor box can precisely describe the wheat spike bounding box. This study introduced five different sizes of anchor boxes, and this strategy makes it possible to detect wheat spikes of different sizes in UAV images. The process of clustering is shown in Algorithm 1.
Algorithm 1. The procedure for setting sizes of anchors
Input: ground truth boxes G i
Output: anchor boxes Y i
1: Select S cluster center points of anchor boxes Y i
2: repeat
3:  Step:
4:    Calculate the distance between Y i and G i by Equations (1) and (2)
5:    Recalculate the cluster center of S by Equations (3) and (4)
6: until clusters converge
W i O + 1 = 1 N i W i O
H i O + 1 = 1 N i H i O
where W i O + 1 and H i O + 1 are new clustering centers to calculate new distance metrics.

2.4.3. Improvement of Confidence Loss Function of Detection Layer Based on IoU

Neural networks usually use loss function to minimize network errors, and the value calculated by the loss function is referred to as “loss” [44]. This research utilizes location loss ed, classification loss es, and confidence loss ei to define the network loss l as [31]:
l = e d + e s + e i
The network loss is the difference between predicted and observed values. Since the uncertainty in samples will affect the network accuracy, weights of loss function should be set according to the quality and quantity of samples [45,46]. Hence, we adopt a new method of setting the confidence loss function of the detection layer based on the IoU (Intersection over Union). We get positive anchor boxes p for each wheat spike bounding box. Among positive anchor boxes p, we also get positive anchor boxes q, which have the maximum IoU. Suppose all anchor boxes in the grid where q falls are the positive anchor boxes qm with max IoU. Calculate the number of positive anchor boxes pi and q i m in each detection layer Di. The weight of the confidence loss function of the detection layer can be set (Formulas (7) and (8)). The calculation formula of IoU between the spike bounding box and the anchor box is as follows:
IoU = a r e a a r t r a r e a a r t r
where ar represents the positive anchor box, and tr represents the wheat spike bounding box. The process of setting the weight of the confidence loss ei of the detection layer is shown in Algorithm 2.
Algorithm 2. The procedure of setting weights for confidence loss ei
Input: a set of UAV images I
Output: weights λ i i = 1 4 of detection layers
1: Input the images I into the network for training
2: repeat
3:  Step:
4:    Calculate p and qm for detection layers
5: until training epochs reach K
6: Calculate pi and q i m for each detection layers Di
7: Normalize final weights λ i i = 1 4 of detection layers D i i = 1 4 by Equations (7) and (8)
The network is initialized with image set I, then trained K times, and yields positive anchor boxes p i i = 1 4 for each detection layer. Count the number of positive samples q i m i = 1 4 with max IoU in each detection layer, and get the weight of the confidence loss function λ i i = 1 4 of each layer as follows:
λ i i = 1 4 = j i i = 1 4 min j i i = 1 4 max j i i = 1 4 min j i i = 1 4 + α
where j i i = 1 4 denotes the ratio between pi and q i m in each detection layer. j i i = 1 4 is defined as follows:
j i i = 1 4 = q i m i = 1 4 p i i = 1 4
where λ i i = 1 4 is the weight of the confidence loss function of each detection layer after normalization. α equals 0.1. The improved confidence loss function weight concerns the variety of spike sizes and the anchor size of the output layer. Thus, the method can increase the number of positive anchor boxes and reduce the negative impacts of low-quality anchor boxes on the network. As a consequence of using this improvement, the network will learn enough high-quality positive anchor boxes and improve the capability for detecting small-sized wheat spikes.

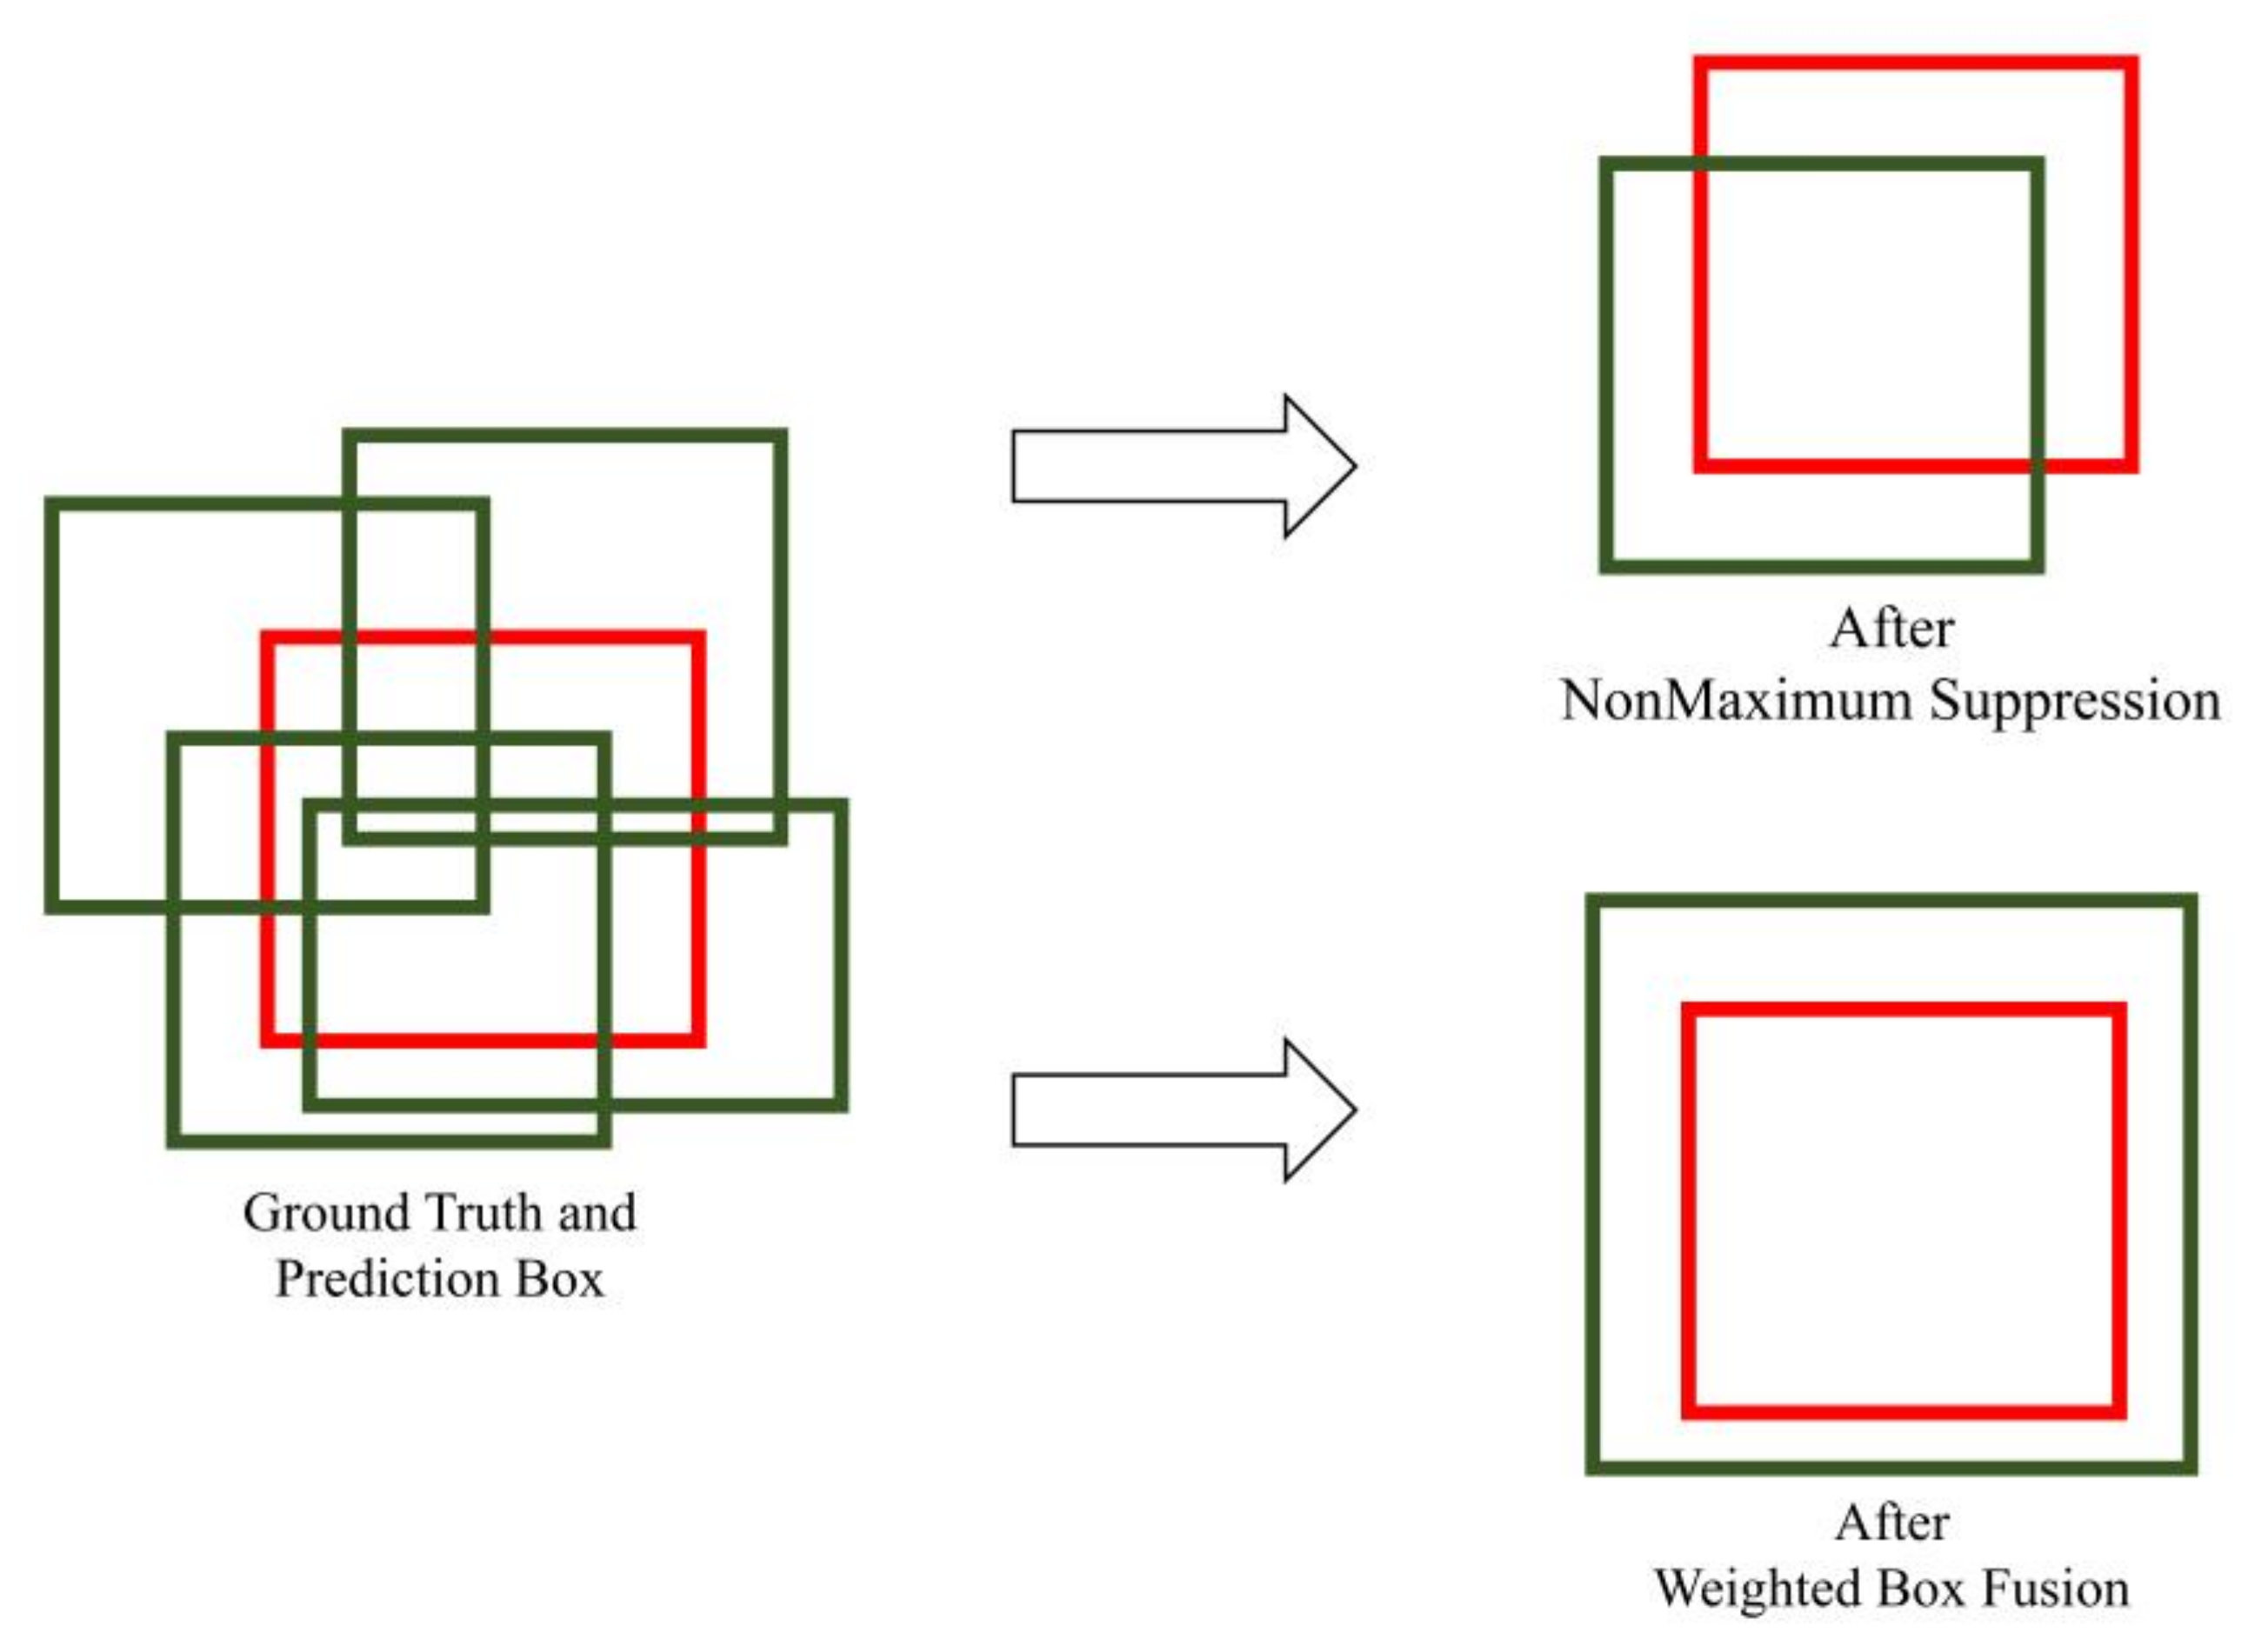
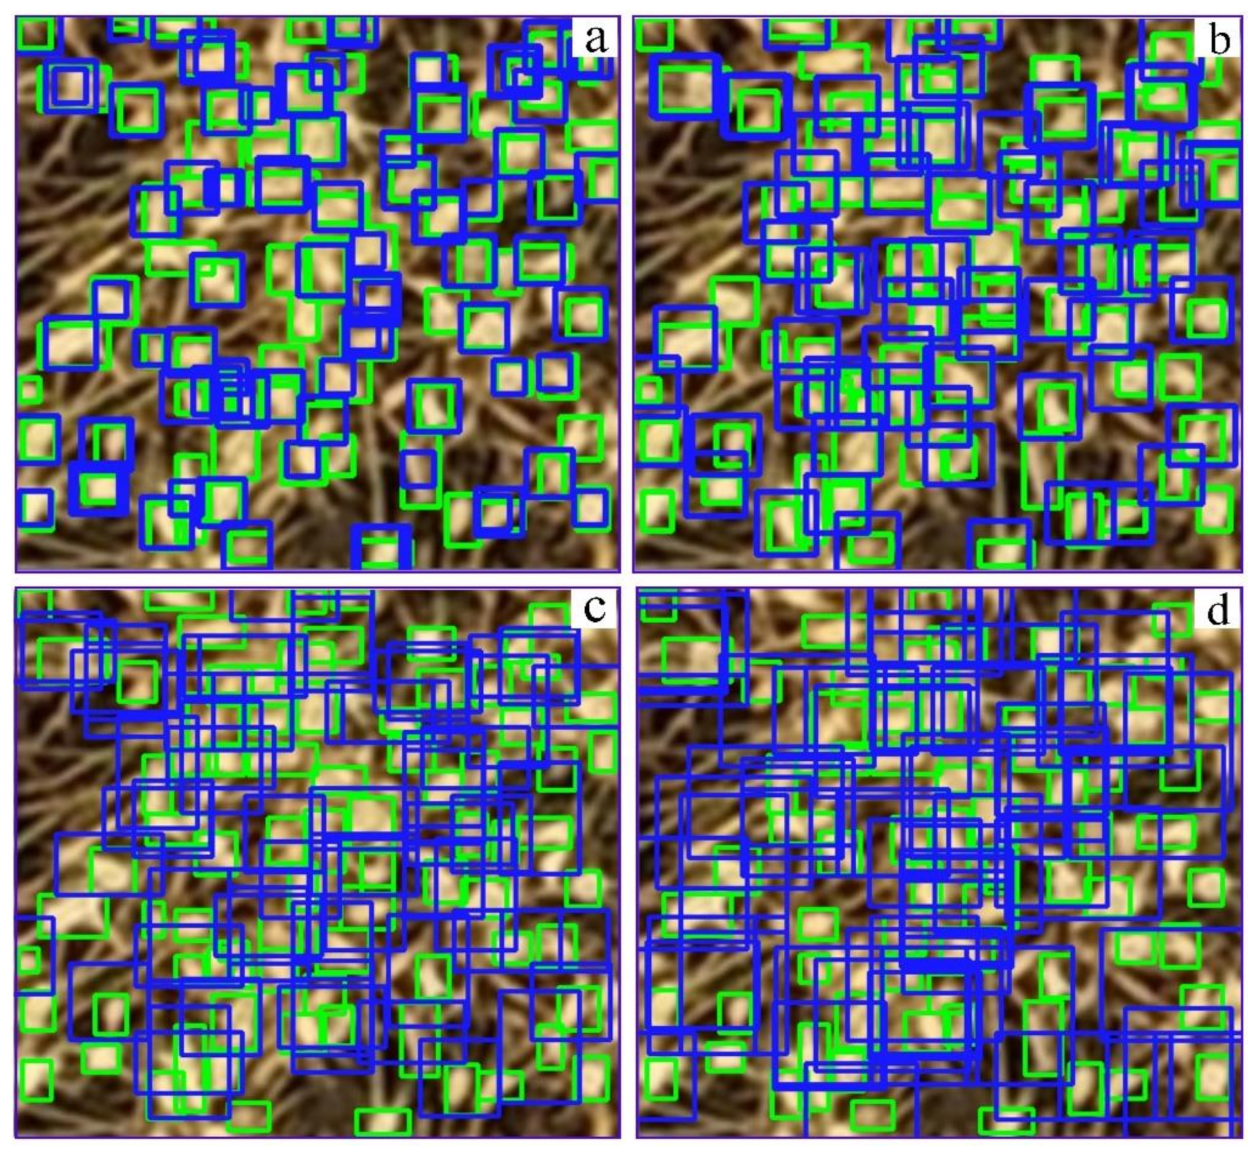
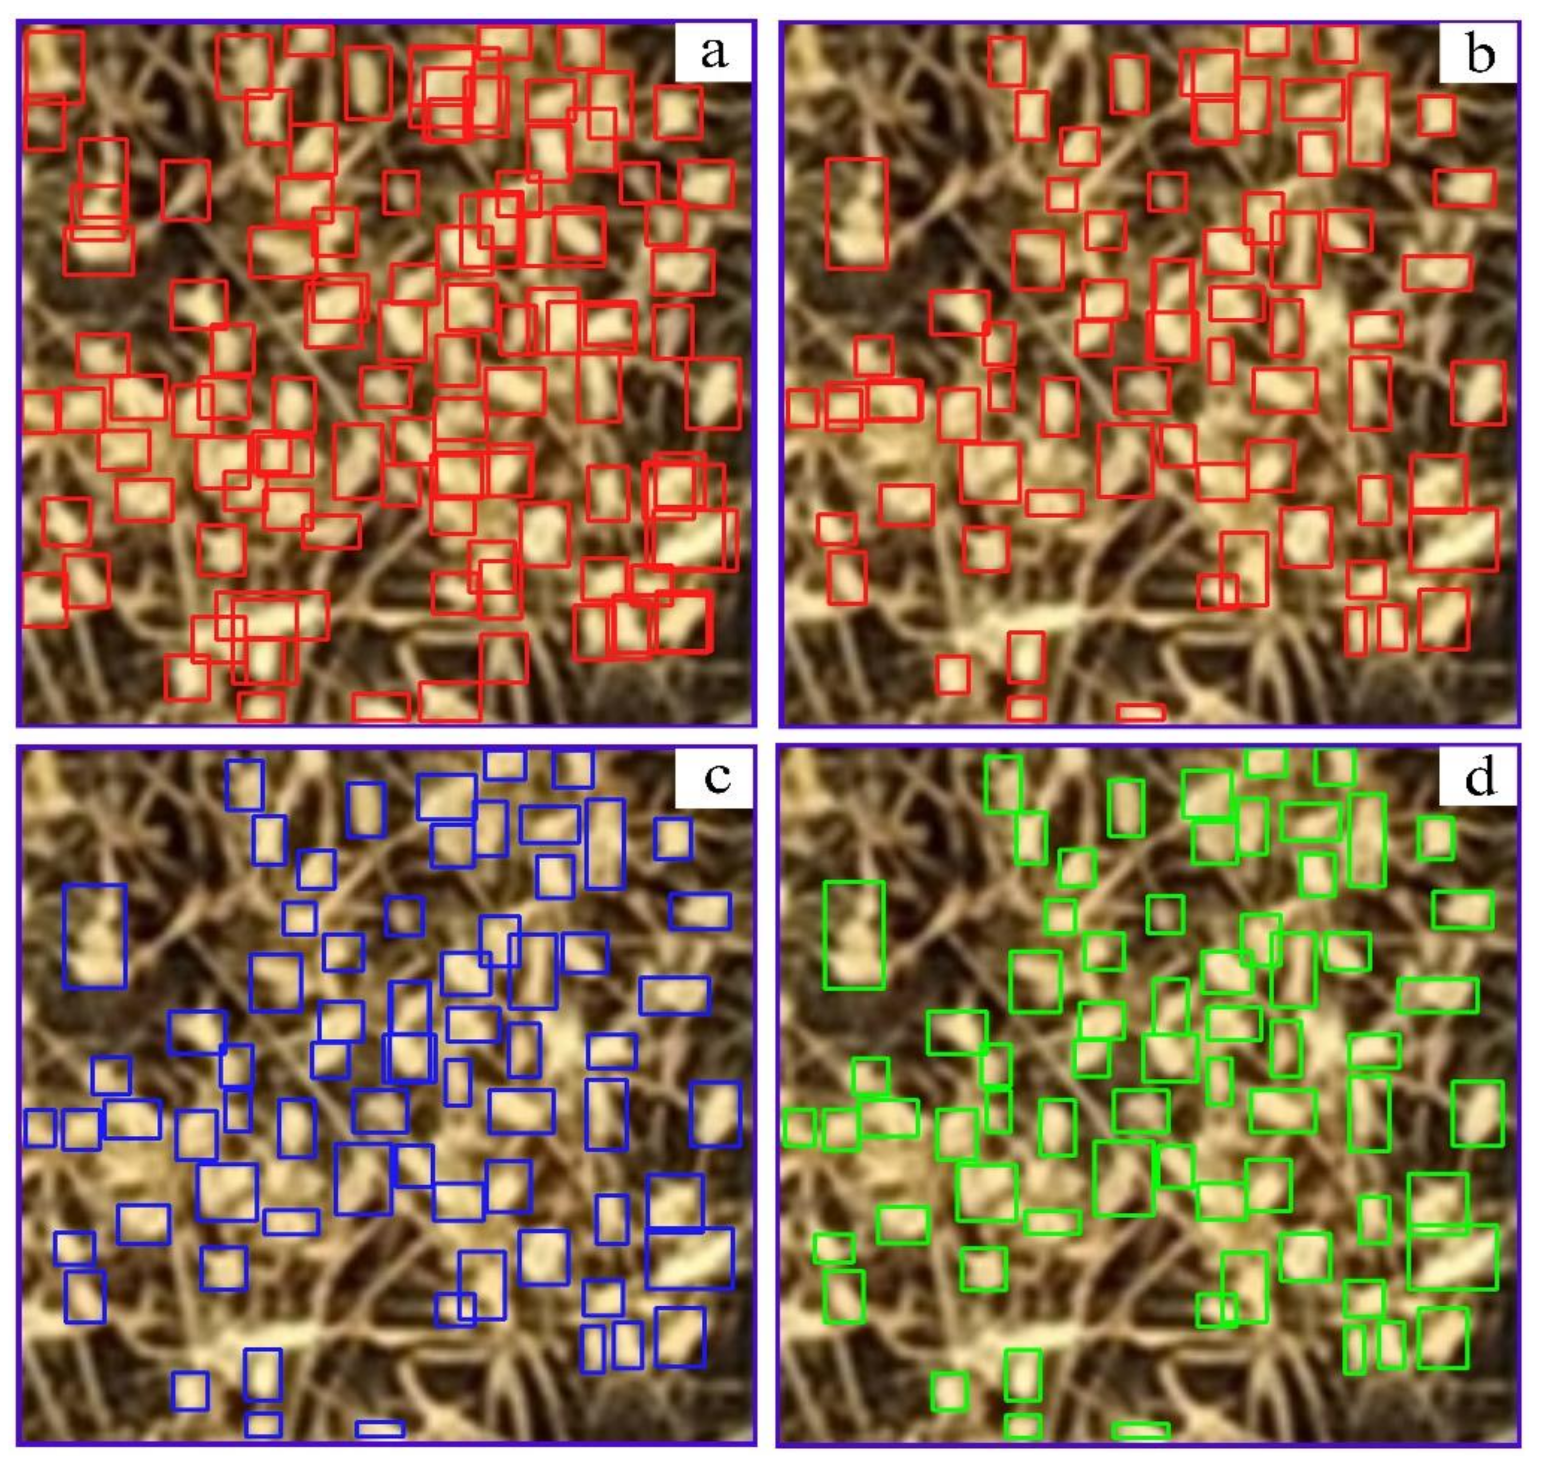
2.4.4. Detection Box Fusion Based on Confidence Weight

The UAV wheat spikes in images are crowded. Due to the occlusion of wheat spikes, the accuracy of wheat spike detection is low. For multiple wheat spike detection boxes, Figure 5 which is modified after [47] shows that the commonly used nonmaximum suppression (NMS) method will only select a single detection box as a result. NMS cannot be adapted to wheat spike detection in UAV images. With this problem, this paper uses the WBF (weighted boxes fusion) algorithm [47] to calculate the fusion weight based on the confidence of the wheat spike detection boxes generated by different networks. The fused box is taken as the final result of wheat spike bounding, and it improves the detection accuracy caused by overlapping and occlusion (Figure 5).
The detection box fusion first finds the wheat spike detection boxes responsible for this box in all networks for each wheat spike bounding box. Then the fused box is generated based on the confidence of each wheat spike detection box as follows:
X a = i = 1 Z C i × X a i i = 1 Z C i , Y a = i = 1 Z C i × Y a i i = 1 Z C i
X b = i = 1 Z C i × X b i i = 1 Z C i , Y b = i = 1 Z C i × Y b i i = 1 Z C i
C = i = 1 Z C i Z
In the formula, Xa, Ya, Xb, and Yb are separately the coordinates of top-left and bottom-right vertexes of the fused box, and C is the confidence of the fusion box. Xai, Yai, Xbi, and Ybi are the coordinates of top-left and bottom-right vertexes of wheat spike detection boxes involved in the calculation. Ci is the corresponding confidence. Z is the number of wheat spike detection boxes involved in the calculation.

3. Experimental Setup and Results

3.1. Multiresolution Image Training

Compared with previous studies that only trained images with a single resolution [48,49], the proposed method resamples images into multiple resolutions and sends them to the network for training. The images are resampled into four resolutions: 150 × 150, 300 × 300, 450 × 450, and 600 × 600.
The experiment was performed on a workstation equipped with an Intel® Xeon® processor, NVIDIA Titan V graphics processor (12 GB memory), and 500 GB memory. The operating system was Ubuntu 16.06. We set the corresponding initial learning rate and batch size for the resolution of input images. The SGD (stochastic gradient descent) method is used to optimize the learning rate in the training process, the weight decay is set to 1 × 10⁻⁴, and the momentum is set to 0.9. The specific settings of hyperparameters of the network training are shown in Table 1.

3.2. Network Performance Evaluation

This research evaluates the network performance by the metrics of detection accuracy and speed. FPS (frames per second) is used as an indicator of detection speed. Denoting the boxes as spike or nonspike can yield four potential predictions: true positive (TP), false positive (FP), true negative (TN), and false negative (FN). If the IoU between the detection box and the wheat spike bounding box is greater than 0.5, the detection box is marked as TP. Otherwise, the detection box is marked as FP. If the wheat spike bounding box does not have a matching detection box, it is marked as FN. TN is not required in this binary classification problem, where the foreground is always determined for spike detection. TP and FP are separately the number of wheat spikes detected correctly and incorrectly, and FN is the number of undetected wheat spikes. Precision rate (Pr) and recall rate (Re) are defined as:
P r = T P F P + T P
R e = T P F N + T P
Pr and Re affect each other and cannot be used directly to evaluate the detection accuracy. Therefore, we introduced the average precision (AP) to indicate the detection accuracy (Formula (14)). AP refers to the average recall rate of the spike detection in the range of 0 to 1. Therefore, higher AP means higher accuracy of the network.
AP = 0 1 P r ( R e ) d R e

3.3. Experimental Results

Compared with standard YOLOv5 and other general object detection methods, the proposed method based on improved YOLOv5 achieves the highest accuracy, with an AP of 94.1% (Table 2). The accuracy is 10.8% higher than that of the standard YOLOv5, and the speed is 30 FPS, thus realizing the accurate detection of wheat spikes in UAV images. We find that the resolution of trained images has significant impacts on detection accuracy. The detection accuracy is higher when the resolution of input images is higher. After refining the network by adding the microscale detection layer, setting the prior anchor box, and adapting the confidence loss function of the detection layer, the detection accuracy of the rebuilt network is 91.9% when the resolution is 600 × 600 of input images. The accuracy is 8.6% higher than that of the standard YOLOv5 network (Figure 6, Table 3). Moreover, the fusion strategy leads to the best detection accuracy of 94.1%.

4. Discussion

Adding a microscale detection layer and adapting the confidence loss function of the detection layer based on the IoU can realize the small-sized wheat spike detection by concerning small-sized and high-quality positive anchor boxes to the network. For data-driven deep neural networks, there are usually far more negative anchor boxes than positive anchor boxes. Too many negative anchor boxes will cause an imbalance, leading to negative anchor boxes dominating the network’s training [27,50]. The wheat spike sizes in UAV images are generally distributed in 25 to 400 pixels, accounting for about 80% of all spikes (Figure 7). The positive anchor boxes of the standard YOLOv5 concern few small-sized wheat spikes (Figure 8b–d). It means that with the standard three detection layers, the network cannot learn the characteristics of small-sized wheat spikes. In this case, the network will mistake wheat spikes for the background, resulting in many missed detection errors. After adding a microscale detection layer for small-sized wheat spikes, the network acquires more small-sized positive anchor boxes (Figure 8a), which improves the detection accuracy of small-sized wheat spikes. The results of the ablation study test of components of the proposed method with 600 × 600 input images also reveal that adding a microscale detection layer is the most critical improvement (Table 4).
Focusing on high-quality positive anchor boxes benefits the detection accuracy of convolutional networks [51]. Standard YOLOv5 cannot accurately describe and fit the actual position of wheat spikes (Figure 8b–d) because few positive anchor boxes are enrolled in the standard YOLOv5 layer’s training. A larger detection layer with a higher downsampling rate enlarges the difference between the detection bounding box and the ground truth. The positive anchor boxes of the microscale detection layer are closer to the actual position of the wheat spike bounding boxes and can be more helpful for the network (Figure 8a). Besides, adapting the confidence loss function of the detection layer pays more attention to high-quality positive anchor boxes. It improves the contribution of the microscale detection layer to the network. Hence, the network can have a good wheat spike detection accuracy in UAV images with a microscale detection layer.
The results show that the network with the ideal anchor box setting outperforms the network using the default anchor box configuration (Table 4, Figure 9a,b). The number of miss-detected wheat spikes reduced from 17 to 9 (Figure 9b). Anchor box configuration is a critical issue in spike detection. The default anchor box settings are not applicable when spikes have significantly different sizes in one scene [52]. Thus, anchor boxes with multiple sizes and shapes should be developed for various datasets [53,54]. These anchors can concern the characteristics of objects in the images and can improve detection accuracy.
The wheat spike detection accuracy is successfully improved by using a multiresolution image training strategy and generating fusion results based on the confidence weight of the detection boxes. The input image resolution can affect the detection results, so using a multiresolution image training strategy becomes an effective method to detect small-sized objects [55,56,57]. In the research, the detection accuracy is higher when the resolution of input images is higher, which is consistent with the results of other studies tested on general datasets [58]. Considering factors such as individual characteristics of wheat, monitoring platforms, and computational resource consumption, the wheat spike detection research based on the convolutional neural network often selects the most suitable resolution manually [8,59,60]. However, wheat spike occlusion and overlapping are typical in UAV images. The detection results of the network trained by single-resolution images exist in the miss detection and error detection, and the adaptability to occlusion and overlapping conditions is poor (Figure 10a,b). Compared with single-resolution image training, multiresolution image training can cover more widely and generate detection results more accurately [61]. The research integrates detection results from different resolutions and successfully generates more accurate results. The accuracy of the fusion results is 94.1%, which illustrates that spike occlusion and overlapping are solved (Figure 10c, Table 4).

5. Conclusions

We developed a wheat spike detection method based on the improved YOLOv5 for UAV images. The method consists of three critical steps: data preprocess for the UAV wheat spike images, network refinement by adding a microscale detection layer, setting the anchor prior size, adapting the confidence loss function, and multiresolution detection result fusion. We can well detect wheat spikes in UAV images under occlusion and overlapping conditions with the proposed method. The average accuracy (AP) of 94.1% increases by 10.8% compared with the standard YOLOv5. Therefore, the proposed method improves the applicability of the YOLO algorithm in complex field environments and provides technical reference for agricultural wheat phenotype monitoring and yield prediction. With the development of deep learning, researchers are not satisfied with just using a convolutional neural network in wheat spike detection. In future work, we will gradually dissect the constructed network structure, explain the semantics of the network, illustrate how individual hidden units of a deep convolutional neural network teach the network to solve a wheat spike detection task, and further optimize the structure of the wheat spike detection network to achieve better wheat detection performance.

Author Contributions

Conceptualization, J.Z. and X.Z.; methodology, J.Z.; software, J.Z. and X.Q.; validation, J.Y.; formal analysis, X.Z.; investigation, J.Z., J.Y. and X.Z.; writing—original draft preparation, J.Z. and J.Y.; writing—review and editing, X.Z.; visualization, J.Z. and J.Y.; supervision, Y.T. and Y.Z.; project administration, W.C.; funding acquisition, X.Z. and X.Y. All authors have read and agreed to the published version of the manuscript.

Funding

This research was supported by grants from the Key Projects (Advanced Technology) of Jiangsu Province (BE 2019383) and the earmarked fund for Jiangsu Agricultural Industry Technology System (JATS[2020]135, JATS[2020]415).

Institutional Review Board Statement

Not applicable.

Informed Consent Statement

Not applicable.

Data Availability Statement

The datasets generated and/or analyzed during the current study are available from the corresponding author on reasonable request.

Conflicts of Interest

The authors declare no conflict of interest.

References

  1. FAOSTAT. Available online: http://www.fao.org/faostat/en/ (accessed on 22 June 2021).
  2. Diacono, M.; Rubino, P.; Montemurro, F. Precision nitrogen management of wheat: A review. Agron. Sustain. Dev. 2013, 33, 219–241. [Google Scholar] [CrossRef]
  3. Weiss, M.; Jacob, F.; Duveiller, G. Remote sensing for agricultural applications: A meta-review. Remote Sens. Environ. 2020, 236, 111402. [Google Scholar] [CrossRef]
  4. Rawson, H.M. Spikelet number, its control and relation to yield per ear in wheat. Aust. J. Biol. Sci. 1970, 23, 1–16. [Google Scholar] [CrossRef]
  5. Li, Y.; Cui, Z.; Ni, Y.; Zheng, M.; Yang, D.; Jin, M.; Chen, J.; Wang, Z.; Yin, Y. Plant density effect on grain number and weight of two winter wheat cultivars at different spikelet and grain positions. PLoS ONE 2016, 11, e0155351. [Google Scholar] [CrossRef] [PubMed]
  6. Radoglou-Grammatikis, P.; Sarigiannidis, P.; Lagkas, T.; Moscholios, I. A compilation of UAV applications for precision agriculture. Comput. Netw. 2020, 172, 107148. [Google Scholar] [CrossRef]
  7. Araus, J.L.; Cairns, J.E. Field high-throughput phenotyping: The new crop breeding frontier. Trends Plant Sci. 2014, 19, 52–61. [Google Scholar] [CrossRef]
  8. Schirrmann, M.; Giebel, A.; Gleiniger, F.; Pflanz, M.; Lentschke, J.; Dammer, K.H. Monitoring agronomic parameters of winter wheat crops with low-cost UAV imagery. Remote Sens. 2016, 8, 706. [Google Scholar] [CrossRef] [Green Version]
  9. Hassan, M.A.; Yang, M.; Rasheed, A.; Yang, G.; Reynolds, M.; Xia, X.; Xiao, Y.; He, Z. A rapid monitoring of NDVI across the wheat growth cycle for grain yield prediction using a multi-spectral UAV platform. Plant Sci. 2019, 282, 95–103. [Google Scholar] [CrossRef]
  10. Perich, G.; Hund, A.; Anderegg, J.; Roth, L.; Boer, M.P.; Walter, A.; Liebisch, F.; Aasen, H. Assessment of multi-image UAV based high-throughput field phenotyping of canopy temperature. Front. Plant Sci. 2020, 11, 150. [Google Scholar] [CrossRef] [PubMed]
  11. Tsouros, D.C.; Bibi, S.; Sarigiannidis, P.G. A review on UAV-based applications for precision agriculture. Information 2019, 10, 349. [Google Scholar] [CrossRef] [Green Version]
  12. Zhu, Y.; Cao, Z.; Lu, H.; Li, Y.; Xiao, Y. In-field automatic observation of wheat heading stage using computer vision. Biosyst. Eng. 2016, 143, 28–41. [Google Scholar] [CrossRef]
  13. Genaev, M.A.; Komyshev, E.G.; Smirnov, N.V.; Kruchinina, Y.V.; Goncharov, N.P.; Afonnikov, D.A. Morphometry of the wheat spike by analyzing 2D images. Agronomy 2019, 9, 390. [Google Scholar] [CrossRef] [Green Version]
  14. Grillo, O.; Blangiforti, S.; Venora, G. Wheat landraces identification through glumes image analysis. Comput. Electron. Agric. 2017, 141, 223–231. [Google Scholar] [CrossRef]
  15. Su, J.; Yi, D.; Su, B.; Mi, Z.; Liu, C.; Hu, X.; Xu, X.; Guo, L.; Chen, W.H. Aerial visual perception in smart farming: Field study of wheat yellow rust monitoring. IEEE Trans. Ind. Inform. 2020, 17, 2242–2249. [Google Scholar] [CrossRef] [Green Version]
  16. Jin, X.; Liu, S.; Baret, F.; Hemerlé, M.; Comar, A. Estimates of plant density of wheat crops at emergence from very low altitude UAV imagery. Remote Sens. Environ. 2017, 198, 105–114. [Google Scholar] [CrossRef] [Green Version]
  17. Fernandez-Gallego, J.A.; Kefauver, S.C.; Gutierrez, N.A.; Nieto-Taladriz, M.T.; Araus, J.L. Wheat ear counting in-field conditions: High throughput and low-cost approach using RGB images. Plant Methods 2018, 14, 1–12. [Google Scholar] [CrossRef] [Green Version]
  18. Zhou, C.; Liang, D.; Yang, X.; Yang, H.; Yue, J.; Yang, G. Wheat ears counting in field conditions based on multi-feature optimization and TWSVM. Front. Plant Sci. 2018, 9, 1024. [Google Scholar] [CrossRef] [PubMed]
  19. Kamilaris, A.; Prenafeta-Boldú, F.X. Deep learning in agriculture: A survey. Comput. Electron. Agric. 2018, 147, 70–90. [Google Scholar] [CrossRef] [Green Version]
  20. Zhang, Q.; Liu, Y.; Gong, C.; Chen, Y.; Yu, H. Applications of deep learning for dense scenes analysis in agriculture: A review. Sensors 2020, 20, 1520. [Google Scholar] [CrossRef] [Green Version]
  21. Lecun, Y.; Bengio, Y.; Hinton, G. Deep learning. Nature 2015, 521, 436–444. [Google Scholar] [CrossRef] [PubMed]
  22. Krizhevsky, A.; Sutskever, I.; Hinton, G. Imagenet classification with deep convolutional neural networks. Commun. ACM 2017, 60, 84–90. [Google Scholar] [CrossRef]
  23. Zeiler, M.D.; Fergus, R. Visualizing and understanding convolutional networks. In Proceedings of the European Conference on Computer Vision (ECCV 2014), Zurich, Switzerland, 6–12 September 2014; pp. 818–833. [Google Scholar] [CrossRef] [Green Version]
  24. He, K.; Zhang, X.; Ren, S.; Sun, J. Spatial pyramid pooling in deep convolutional networks for visual recognition. IEEE Trans. Pattern Anal. Mach. Intell. 2015, 37, 1904–1916. [Google Scholar] [CrossRef] [Green Version]
  25. Girshick, R. Fast R-CNN. In Proceedings of the IEEE Conference on Computer Vision (ICCV 2015), Santiago, Chile, 7–13 December 2015; pp. 1440–1448. [Google Scholar] [CrossRef]
  26. Ren, S.; He, K.; Girshick, R.; Sun, J. Faster R-CNN: Towards real-time object detection with region proposal networks. IEEE Trans. Pattern Anal. Mach. Intell. 2016, 39, 1137–1149. [Google Scholar] [CrossRef] [Green Version]
  27. Wu, X.; Sahoo, D.; Hoi, S.C.H. Recent advances in deep learning for object detection. Neurocomputing 2020, 396, 39–64. [Google Scholar] [CrossRef] [Green Version]
  28. Liu, W.; Anguelov, D.; Erhan, D.; Szegedy, C.; Reed, S.; Fu, C.Y.; Berg, A.C. SSD: Single shot multibox detector. In Proceedings of the European Conference on Computer Vision (ECCV 2016), Amsterdam, The Netherlands, 11–14 October 2016; pp. 21–37. [Google Scholar] [CrossRef] [Green Version]
  29. Redmon, J.; Divvala, S.; Girshick, R.; Farhadi, A. You only look once: Unified, real-time object detection. In Proceedings of the IEEE Conference on Computer Vision and Pattern Recognition (CVPR 2016), Las Vegas, NV, USA, 26 June–1 July 2016; pp. 779–788. [Google Scholar] [CrossRef] [Green Version]
  30. Redmon, J.; Farhadi, A. YOLO9000: Better, faster, stronger. In Proceedings of the IEEE Conference on Computer Vision and Pattern Recognition (CVPR 2017), Honolulu, HI, USA, 21–26 July 2017; pp. 7263–7271. [Google Scholar] [CrossRef] [Green Version]
  31. Redmon, J.; Farhadi, A. Yolov3: An incremental improvement. arXiv 2018, arXiv:1804.02767. Available online: https://arxiv.org/abs/1804.02767 (accessed on 8 April 2018).
  32. Bochkovskiy, A.; Wang, C.Y.; Liao, H.Y.M. Yolov4: Optimal speed and accuracy of object detection. arXiv 2020, arXiv:2004.10934. Available online: https://arxiv.org/abs/2004.10934 (accessed on 23 April 2020).
  33. Ultralytics. YOLOv5. Available online: https://github.com/ultralytics/yolov5 (accessed on 1 November 2020).
  34. Madec, S.; Jin, X.; Lu, H.; De Solan, B.; Liu, S.; Duyme, F.; Heritier, E.; Baret, F. Ear density estimation from high resolution RGB imagery using deep learning technique. Agric. For. Meteorol. 2019, 264, 225–234. [Google Scholar] [CrossRef]
  35. He, M.X.; Hao, P.; Xin, Y.Z. A robust method for wheatear detection using UAV in natural scenes. IEEE Access 2020, 8, 189043–189053. [Google Scholar] [CrossRef]
  36. Khoroshevsky, F.; Khoroshevsky, S.; Bar-Hillel, A. Parts-per-Object Count in Agricultural Images: Solving Phenotyping Problems via a Single Deep Neural Network. Remote Sens. 2021, 13, 2496. [Google Scholar] [CrossRef]
  37. Zhou, C.; Liang, D.; Yang, X.; Xu, B.; Yang, G. Recognition of Wheat Spike from Field Based Phenotype Platform Using Multi-Sensor Fusion and Improved Maximum Entropy Segmentation Algorithms. Remote Sens. 2018, 10, 246. [Google Scholar] [CrossRef] [Green Version]
  38. Lu, H.; Liu, L.; Li, Y.N.; Zhao, X.M.; Wang, X.Q.; Cao, Z.G. TasselNetV3: Explainable Plant Counting With Guided Upsampling and Background Suppression. IEEE Trans. Geosci. Remote Sens. 2021, 1–15. [Google Scholar] [CrossRef]
  39. Wang, D.; Zhang, D.; Yang, G.; Xu, B.; Luo, Y.; Yang, X. SSRNet: In-field counting wheat ears using multi-stage convolutional neural network. IEEE Trans. Geosci. Remote Sens. 2021, 1–11. [Google Scholar] [CrossRef]
  40. Pech-Pacheco, J.L.; Cristóbal, G.; Chamorro-Martinez, J.; Fernandez-Valdivia, J. Diatom autofocusing in brightfield microscopy: A comparative study. In Proceedings of the 15th International Conference on Pattern Recognition (ICPR 2000), Troy, NY, USA, 3–7 September 2000; Volume 3, pp. 314–317. [Google Scholar] [CrossRef]
  41. Tzutalin. LabelImg. Available online: https://github.com/tzutalin/labelImg (accessed on 3 December 2018).
  42. Ma, J.; Li, Y.; Chen, Y.; Du, K.; Zheng, F.; Zhang, L.; Sun, Z. Estimating above ground biomass of winter wheat at early growth stages using digital images and deep convolutional neural network. Eur. J. Agron. 2019, 103, 117–129. [Google Scholar] [CrossRef]
  43. Tian, Y.; Yang, G.; Wang, Z.; Wang, H.; Li, E.; Liang, Z. Apple detection during different growth stages in orchards using the improved YOLO-V3 model. Comput. Electron. Agric. 2019, 157, 417–426. [Google Scholar] [CrossRef]
  44. Goodfellow, I.; Bengio, Y.; Courville, A.; Bengio, Y. Deep Learning; The MIT Press: Cambridge, MA, USA, 2016; p. 82. [Google Scholar]
  45. Kendall, A.; Gal, Y.; Cipolla, R. Multi-task learning using uncertainty to weigh losses for scene geometry and semantics. In Proceedings of the IEEE Conference on Computer Vision and Pattern Recognition (CVPR 2018), Salt Lake City, UT, USA, 18–23 June 2018; pp. 7482–7491. [Google Scholar] [CrossRef] [Green Version]
  46. Cai, Q.; Pan, Y.; Wang, Y.; Liu, J.; Yao, T.; Mei, T. Learning a unified sample weighting network for object detection. In Proceedings of the IEEE Conference on Computer Vision and Pattern Recognition (CVPR 2020), Seattle, WA, USA, 14–19 June 2020; pp. 14173–14182. [Google Scholar] [CrossRef]
  47. Solovyev, R.; Wang, W.; Gabruseva, T. Weighted boxes fusion: Ensembling boxes from different object detection models. Image Vis. Comput. 2021, 107, 104117. [Google Scholar] [CrossRef]
  48. Pound, M.P.; Atkinson, J.A.; Wells, D.M.; Pridmore, T.P.; French, A.P. Deep learning for multi-task plant phenotyping. In Proceedings of the IEEE International Conference on Computer Vision (ICCV 2017), Venice, Italy, 22–29 October 2017; pp. 2055–2063. [Google Scholar] [CrossRef] [Green Version]
  49. Jiang, Y.; Li, C.; Xu, R.; Sun, S.; Robertson, J.S.; Paterson, A.H. DeepFlower: A deep learning-based approach to characterize flowering patterns of cotton plants in the field. Plant Methods 2020, 16, 156. [Google Scholar] [CrossRef]
  50. Lin, T.Y.; Goyal, P.; Girshick, R.; He, K.; Dollár, P. Focal loss for dense object detection. In Proceedings of the IEEE International Conference on Computer Vision (ICCV 2017), Venice, Italy, 22–29 October 2017; pp. 2980–2988. [Google Scholar] [CrossRef] [Green Version]
  51. Cao, Y.; Chen, K.; Loy, C.C.; Lin, D. Prime sample attention in object detection. In Proceedings of the IEEE Conference on Computer Vision and Pattern Recognition (CVPR 2020), Seattle, WA, USA, 14–19 June 2020; pp. 11583–11591. [Google Scholar]
  52. Zou, Z.; Shi, Z.; Guo, Y.; Ye, J. Object detection in 20 years: A survey. arXiv 2019, arXiv:1905.05055. Available online: https://arxiv.org/abs/1905.05055 (accessed on 13 May 2019).
  53. Ren, Y.; Zhu, C.; Xiao, S. Small object detection in optical remote sensing images via modified Faster R-CNN. Appl. Sci. 2018, 8, 813. [Google Scholar] [CrossRef] [Green Version]
  54. Liu, Y.; Cen, C.; Che, Y.; Ke, R.; Ma, Y.; Ma, Y. Detection of maize tassels from UAV RGB imagery with faster R-CNN. Remote Sens. 2020, 12, 338. [Google Scholar] [CrossRef] [Green Version]
  55. He, K.; Zhang, X.; Ren, S.; Sun, J. Deep residual learning for image recognition. In Proceedings of the IEEE Conference on Computer Vision and Pattern Recognition (CVPR 2016), Las Vegas, NV, USA, 26 June–1 July 2016; pp. 770–778. [Google Scholar] [CrossRef] [Green Version]
  56. Dai, J.; Qi, H.; Xiong, Y.; Li, Y.; Zhang, G.; Hu, H.; Wei, Y. Deformable convolutional networks. In Proceedings of the IEEE International Conference on Computer Vision (ICCV 2017), Venice, Italy, 22–29 October 2017; pp. 764–773. [Google Scholar] [CrossRef] [Green Version]
  57. Tong, K.; Wu, Y.; Zhou, F. Recent advances in small object detection based on deep learning: A review. Image Vis. Comput. 2020, 97, 103910. [Google Scholar] [CrossRef]
  58. Singh, B.; Najibi, M.; Davis, L.S. Sniper: Efficient multi-scale training. arXiv 2018, arXiv:1805.09300. Available online: https://arxiv.org/abs/1805.09300 (accessed on 23 May 2018).
  59. Hasan, M.M.; Chopin, J.P.; Laga, H.; Miklavcic, S.J. Detection and analysis of wheat spikes using convolutional neural networks. Plant Methods 2018, 14, 100. [Google Scholar] [CrossRef] [PubMed] [Green Version]
  60. Li, Q.; Cai, J.; Berger, B.; Okamoto, M.; Miklavcic, S.J. Detecting spikes of wheat plants using neural networks with Laws texture energy. Plant Methods 2017, 13, 83. [Google Scholar] [CrossRef] [Green Version]
  61. Okun, O.; Valentini, G.; Re, M. Ensembles in Machine Learning Applications; Springer Science & Business Media: Berlin, Germany, 2011. [Google Scholar] [CrossRef]
Figure 1. Experimental site and UAV wheat spike images: (a) clear image, (b) blurred image, (cf) manually labeled images.
Remotesensing 13 03095 g001
Figure 2. Diagram of applying improved YOLOv5 for UAV image wheat spike detection.
Remotesensing 13 03095 g002
Figure 3. Data augmentations: (a) original image, (b) rotate 90°, (c) rotate 180°, (d) rotate 270°, (e) vertical flip, (f) horizontal flip, (g) and (h) luminance balance.
Remotesensing 13 03095 g003
Figure 4. Refined YOLOv5 network structure. The red box is the branch of the microscale detection layer. The microscale detection layer is generated by acquiring lower spatial features and fusing them with high-level semantic features.
Remotesensing 13 03095 g004
Figure 5. Schematic diagram of nonmaximum suppression (NMS) and weighted boxes fusion (WBF) modified after [47]. Green boxes represent detection boxes, and red boxes represent ground truth boxes.
Remotesensing 13 03095 g005
Figure 6. The precision and recall curves of wheat spike detection. Refined YOLOv5 is based on the refined network, including adding a microscale detection layer, setting prior anchor boxes, and adapting the confidence loss function of the detection layer based on the IoU (Intersection over Union).
Remotesensing 13 03095 g006
Figure 7. The size distribution of wheat spikes in UAV images. The size distribution of spike length and width (a). The number distribution of spikes with different sizes (b).
Remotesensing 13 03095 g007
Figure 8. Positive bounding boxes and wheat spike bounding boxes of microscale detection layer (a), small-scale detection layer (b), medium-scale detection layer (c), and large-scale detection layer (d). Positive sample bounding box (blue). Wheat spike bounding box (green).
Remotesensing 13 03095 g008
Figure 9. Detection results using the default anchor setting (a) and the prior anchor setting by k-means cluster (b). Blue boxes represent the correct-detected wheat spikes, red boxes represent the error-detected wheat spikes, and green boxes represent the undetected wheat spikes.
Remotesensing 13 03095 g009
Figure 10. Detection results after fusing multiresolution detection boxes using the WBF algorithm. Detection boxes on 150 × 150 images (a), detection boxes on 600 × 600 images (b), fused boxes based on the WBF (c), ground truth of wheat spike bounding boxes (d).
Remotesensing 13 03095 g010
Table 1. Hyperparameter settings of network training.
Input ResolutionBatch SizeLearning RateTraining EpochsMomentumWeight Decay
150 × 150320.0212000.90.0001
300 × 300160.0112000.90.0001
450 × 45080.00512000.90.0001
600 × 60040.002512000.90.0001
Table 2. Comparison between the proposed method and object detection methods.
MethodAP (%)FPS
Proposed94.130
Faster RCNN36.915
RetinaNet53.618
SSD55.335
YOLOv353.435
YOLOv583.330
Table 3. Performance comparison with different resolution images of refined YOLOv5 network and standard YOLOv5 network.
Input ResolutionMethodAP (%)FPS
150 × 150Refined YOLOv564.045
Standard YOLOv543.6 45
300 × 300Refined YOLOv577.537
Standard YOLOv5 61.6 37
450 × 450Refined YOLOv588.132
Standard YOLOv5 80.2 32
600 × 600Refined YOLOv591.930
Standard YOLOv5 83.3 30
Table 4. Ablation study of components of the proposed method with 600 × 600 input images.
Microscale Detection Layer CreationAnchor Prior Size SettingConfidence Loss Function AdaptionMultiresolution Detection
Results Fusion
AP (%)
83.3
87.1
89.6
91.9
94.1
Publisher’s Note: MDPI stays neutral with regard to jurisdictional claims in published maps and institutional affiliations.

