Article

Identification of Phyllosilicates in the Antarctic Environment Using ASTER Satellite Data: Case Study from the Mesa Range, Campbell and Priestley Glaciers, Northern Victoria Land

1
Institute of Oceanography and Environment (INOS), Universiti Malaysia Terengganu (UMT), Kuala Nerus 21030, Terengganu, Malaysia
2
Department of Mining Engineering, Shahid Bahonar University of Kerman, Kerman 7616913439, Iran
3
Department of Natural Resources Engineering and Management, School of Science and Engineering, University of Kurdistan Hewlêr (UKH), Erbil 44001, Kurdistan Region, Iraq
4
Dipartimento di Scienze della Terra dell’Ambiente e della Vita (DISTAV), University of Genova, Corso Europa, 26, I-16132 Genova, Italy
5
Federal Institute for Geosciences and Natural Resources (BGR), Stilleweg 2, 30655 Hannover, Germany
6
Korea Polar Research Institute (KOPRI), Songdomirae-ro, Yeonsu-gu, Incheon 21990, Korea
7
Centre for Advanced Modelling & Geospatial Information Systems (CAMGIS), Faculty of Engineering and Information Technology, University of Technology Sydney, New South Wales 2007, Australia
8
Department of Energy and Mineral Resources Engineering, Sejong University, Choongmu-gwan, 209 Neungdong-ro Gwangjin-gu, Seoul 05006, Korea
9
Center of Excellence for Climate Change Research, King Abdulaziz University, Jeddah 21589, Saudi Arabia
10
Earth Observation Center, Institute of Climate Change, Universiti Kebangsaan Malaysia (UKM), Bangi 43600, Selangor, Malaysia
11
Geoscience and Digital Earth Centre (INSTeG), Research Institute for Sustainable Environment, Universiti Teknologi Malaysia (UTM), Johor Bahru, Skudai 81310, Malaysia
12
Department of Electrical and Electronic Engineering, Faculty of Science and Engineering, University of Nottingham Malaysia, Jalan Broga, Semenyih 43500, Selangor, Malaysia
*
Author to whom correspondence should be addressed.
Remote Sens. 2021, 13(1), 38; https://doi.org/10.3390/rs13010038
Submission received: 10 November 2020 / Revised: 20 December 2020 / Accepted: 22 December 2020 / Published: 24 December 2020

Abstract

:
In Antarctica, spectral mapping of altered minerals is very challenging due to the remoteness and inaccessibility of poorly exposed outcrops. This investigation evaluates the capability of Advanced Spaceborne Thermal Emission and Reflection Radiometer (ASTER) satellite remote sensing imagery for mapping and discrimination of phyllosilicate mineral groups in the Antarctic environment of northern Victoria Land. The Mixture-Tuned Matched-Filtering (MTMF) and Constrained Energy Minimization (CEM) algorithms were used to detect the sub-pixel abundance of Al-rich, Fe3+-rich, Fe2+-rich and Mg-rich phyllosilicates using the visible and near-infrared (VNIR), short-wave infrared (SWIR) and thermal-infrared (TIR) bands of ASTER. Results indicate that Al-rich phyllosilicates are strongly detected in the exposed outcrops of the Granite Harbour granitoids, Wilson Metamorphic Complex and the Beacon Supergroup. The presence of the smectite mineral group derived from the Jurassic basaltic rocks (Ferrar Dolerite and Kirkpatrick Basalts) by weathering and decomposition processes implicates Fe3+-rich and Fe2+-rich phyllosilicates. Biotite (Fe2+-rich phyllosilicate) is detected associated with the Granite Harbour granitoids, Wilson Metamorphic Complex and Melbourne Volcanics. Mg-rich phyllosilicates are mostly mapped in the scree, glacial drift, moraine and crevasse fields derived from weathering and decomposition of the Kirkpatrick Basalt and Ferrar Dolerite. Chlorite (Mg-rich phyllosilicate) was generally mapped in the exposures of Granite Harbour granodiorite and granite and partially identified in the Ferrar Dolerite, the Kirkpatrick Basalt, the Priestley Formation and Priestley Schist and the scree, glacial drift and moraine. Statistical results indicate that Al-rich phyllosilicates class pixels are strongly discriminated, while the pixels attributed to Fe3+-rich class, Fe2+-rich and Mg-rich phyllosilicates classes contain some spectral mixing due to their subtle spectral differences in the VNIR+SWIR bands of ASTER. Results derived from TIR bands of ASTER show that a high level of confusion is associated with mafic phyllosilicates pixels (Fe3+-rich, Fe2+-rich and Mg-rich classes), whereas felsic phyllosilicates (Al-rich class) pixels are well mapped. Ground truth with detailed geological data, petrographic study and X-ray diffraction (XRD) analysis verified the remote sensing results. Consequently, ASTER image-map of phyllosilicate minerals is generated for the Mesa Range, Campbell and Priestley Glaciers, northern Victoria Land of Antarctica.

Graphical Abstract

1. Introduction

Phyllosilicates (sheet silicates) are one of the important families of extremely altered mineral groups [1,2]. Phyllosilicates include the clay minerals group, mica group, chlorite group, and serpentine subgroup. They form parallel sheets of silicate tetrahedra with Si2O5 and either H2O or OH groups attached [3,4]. Phyllosilicates are an essential indicator of weathering processes and form under various alteration conditions [4,5,6,7,8]. The spectral characterization of phyllosilicate minerals are diagnostic of chemical composition and crystal structure [9,10,11,12].
Detection and identification of phyllosilicates using remote sensing techniques can be accomplished due to the OH combination bands in the short-wave infrared (SWIR) region (especially from 2.2 to 2.5 μm) and the tetrahedral SiO4 vibrations in the thermal-infrared (TIR) (particularly from ~8.8 to 12 μm) [13,14,15,16]. Furthermore, spectral features due to Fe electronic transitions in the visible and near-infrared (VNIR) (crystal-field and charge-transfer bands from 0.4 to 1.2 μm) can be considered [17,18]. Al-rich phyllosilicates show OH spectral features about 2.2 μm, while the features at 2.29–2.31 μm, 2.33–2.34 μm and 2.35–2.37 μm are attributed to Fe3+-rich, Mg-rich and Fe2+-rich phyllosilicates, respectively [11,12]. Moreover, the tetrahedral SiO4 vibrations are affected by the substitution of the octahedral cations (Al, Fe3+, Fe2+ and Mg) for Si; therefore Al-rich, Fe-rich and Mg-rich phyllosilicates can be distinguished in emissivity spectra because of indicative positions of the stretching and bending features [12].
In the Antarctic environment, the spectral discrimination of phyllosilicates can help with analyzing the weathering processes (the chemistry and formation conditions of soils) and identify the parent lithologies in poorly exposed zones. However, this is challenging due to the remoteness and inaccessibility of many exposed zones in Antarctica. Using satellite remote sensing data with adequate spectral, spatial and radiometric resolutions is a practical target technique. The Advanced Spaceborne Thermal Emission and Reflection Radiometer (ASTER) sensor is one of the most applicable multispectral satellite sensors for remote sensing mineralogical investigations [19,20,21,22,23,24,25,26,27,28,29,30,31,32]. It has three bands in the VNIR (0.52–0.86 μm; 15-m pixel size) for mapping iron oxide/hydroxide minerals, six bands in the SWIR (1.6 to 2.43 μm; 30-m pixel size) for detecting and discrimination of OH-bearing and carbonate minerals and five bands in the TIR (8.0–14.0 μm; 90-m pixel size) for differentiating silicate mineralogical-lithological groups [23,33,34,35,36]. Various image processing algorithms are applicable to ASTER bands for mapping and detection of alteration mineral assemblages [20]. Application of shape-fitting-based and partial unmixing algorithms such as Spectral Angle Mapper (SAM), Matched-Filter (MF), Mixture-Tuned Matched-Filtering (MTMF), Linear Spectral Unmixing (LSU) and Constrained Energy Minimization (CEM) is established by comparing image reflectance spectra with library spectra of endmember minerals or reference spectra extracted directly from the image [20,26,27]. The spectra of endmember minerals for implementing the algorithms can be freely obtained from the available spectral libraries [20]. Therefore, detecting the phyllosilicates in the remote and inaccessible zones of Antarctica using ASTER remote sensing dataset is viable.
Recently, some satellite-based remote sensing studies have been conducted in northern Victoria Land (NVL) of Antarctica and north-eastern Graham Land, Antarctic Peninsula, which demonstrate the applicability of remote sensing data for detailed mineralogical study in the Antarctic environment [24,27,28,37,38,39,40]. This study evaluates the capability of ASTER imagery for mapping and discrimination of phyllosilicate mineral groups in Antarctic environments. So far, there is no remote sensing study available for the Mesa Range, Campbell and Priestley Glaciers of NVL (Figure 1). Therefore, this study presents the first attempt of remote mineralogical analysis for exposed lithologies and alterations in the Mesa Range, Campbell and Priestley Glaciers using ASTER remote sensing imagery and ground truth with detailed geological data. The main purposes of this investigation are: (i) to evaluate VNIR+SWIR and TIR bands of ASTER for mapping and discriminating phyllosilicate minerals in Antarctic environments using sub-pixel image processing techniques such as MTMF and CEM algorithms; (ii) to differentiate phyllosilicate mineral groups based on spectral differences derived from the parent lithologies; and (iii) to verify the image processing results by comparison with the existing geology maps and available field data.

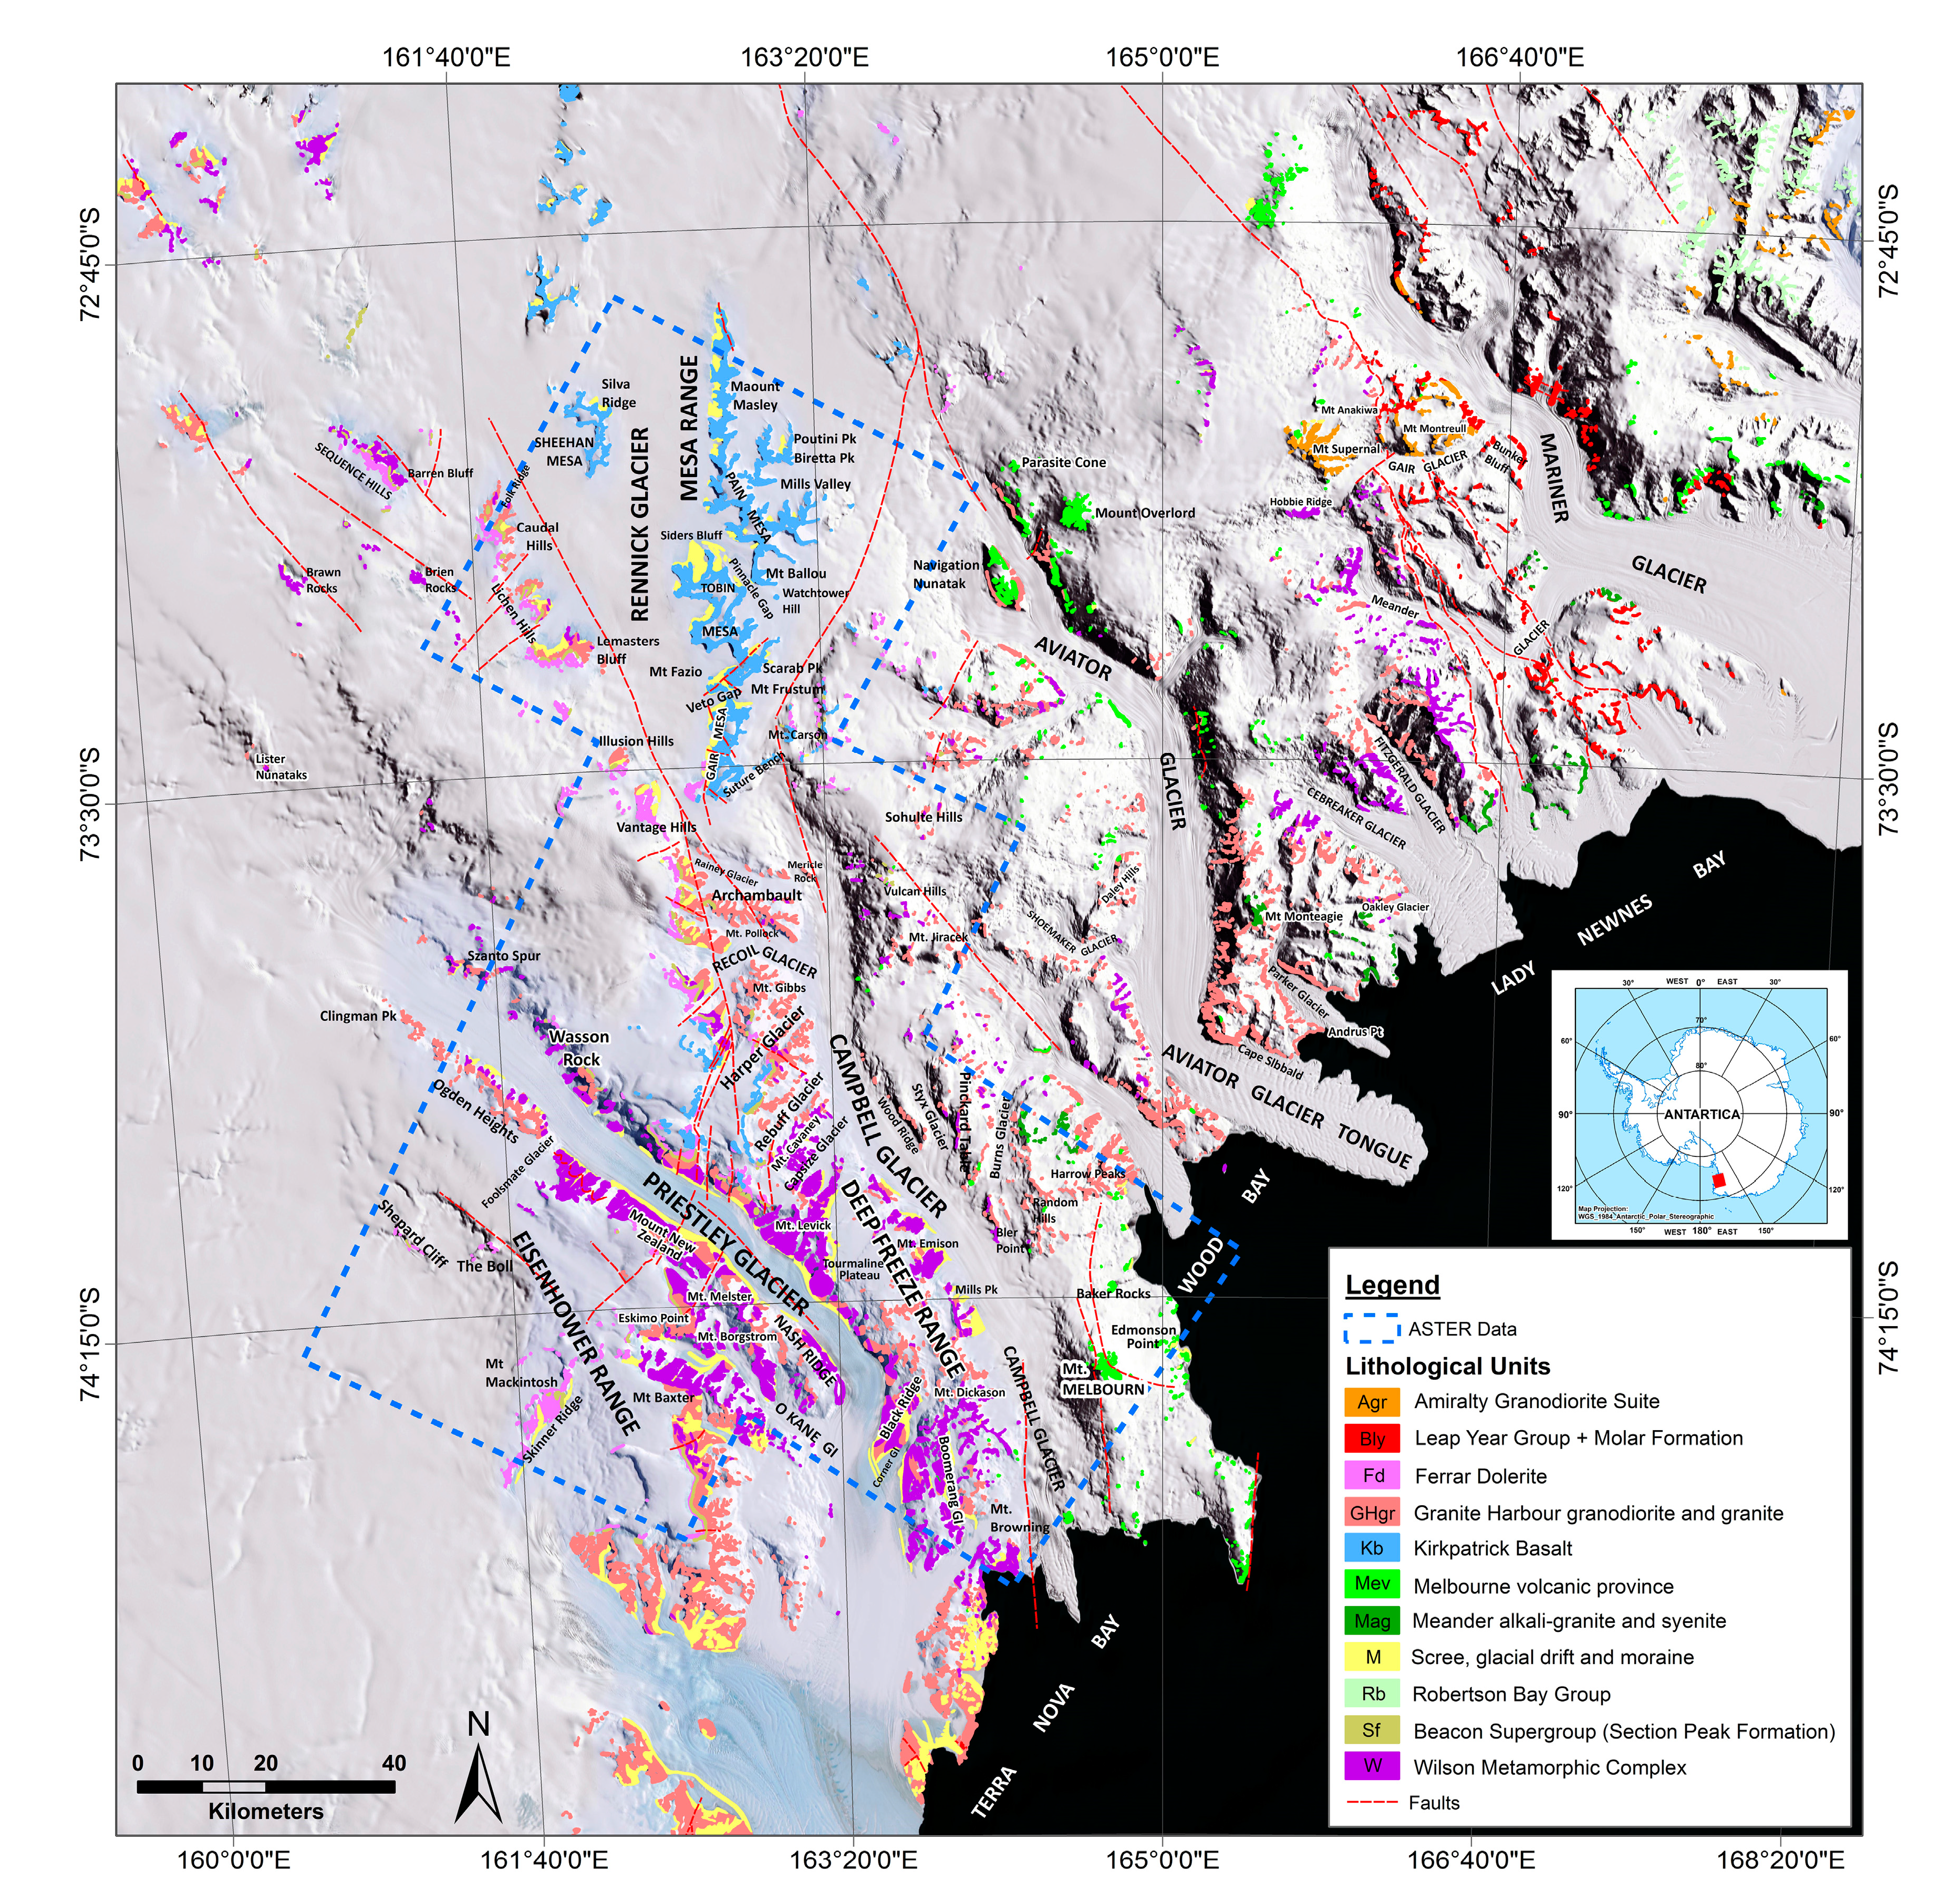
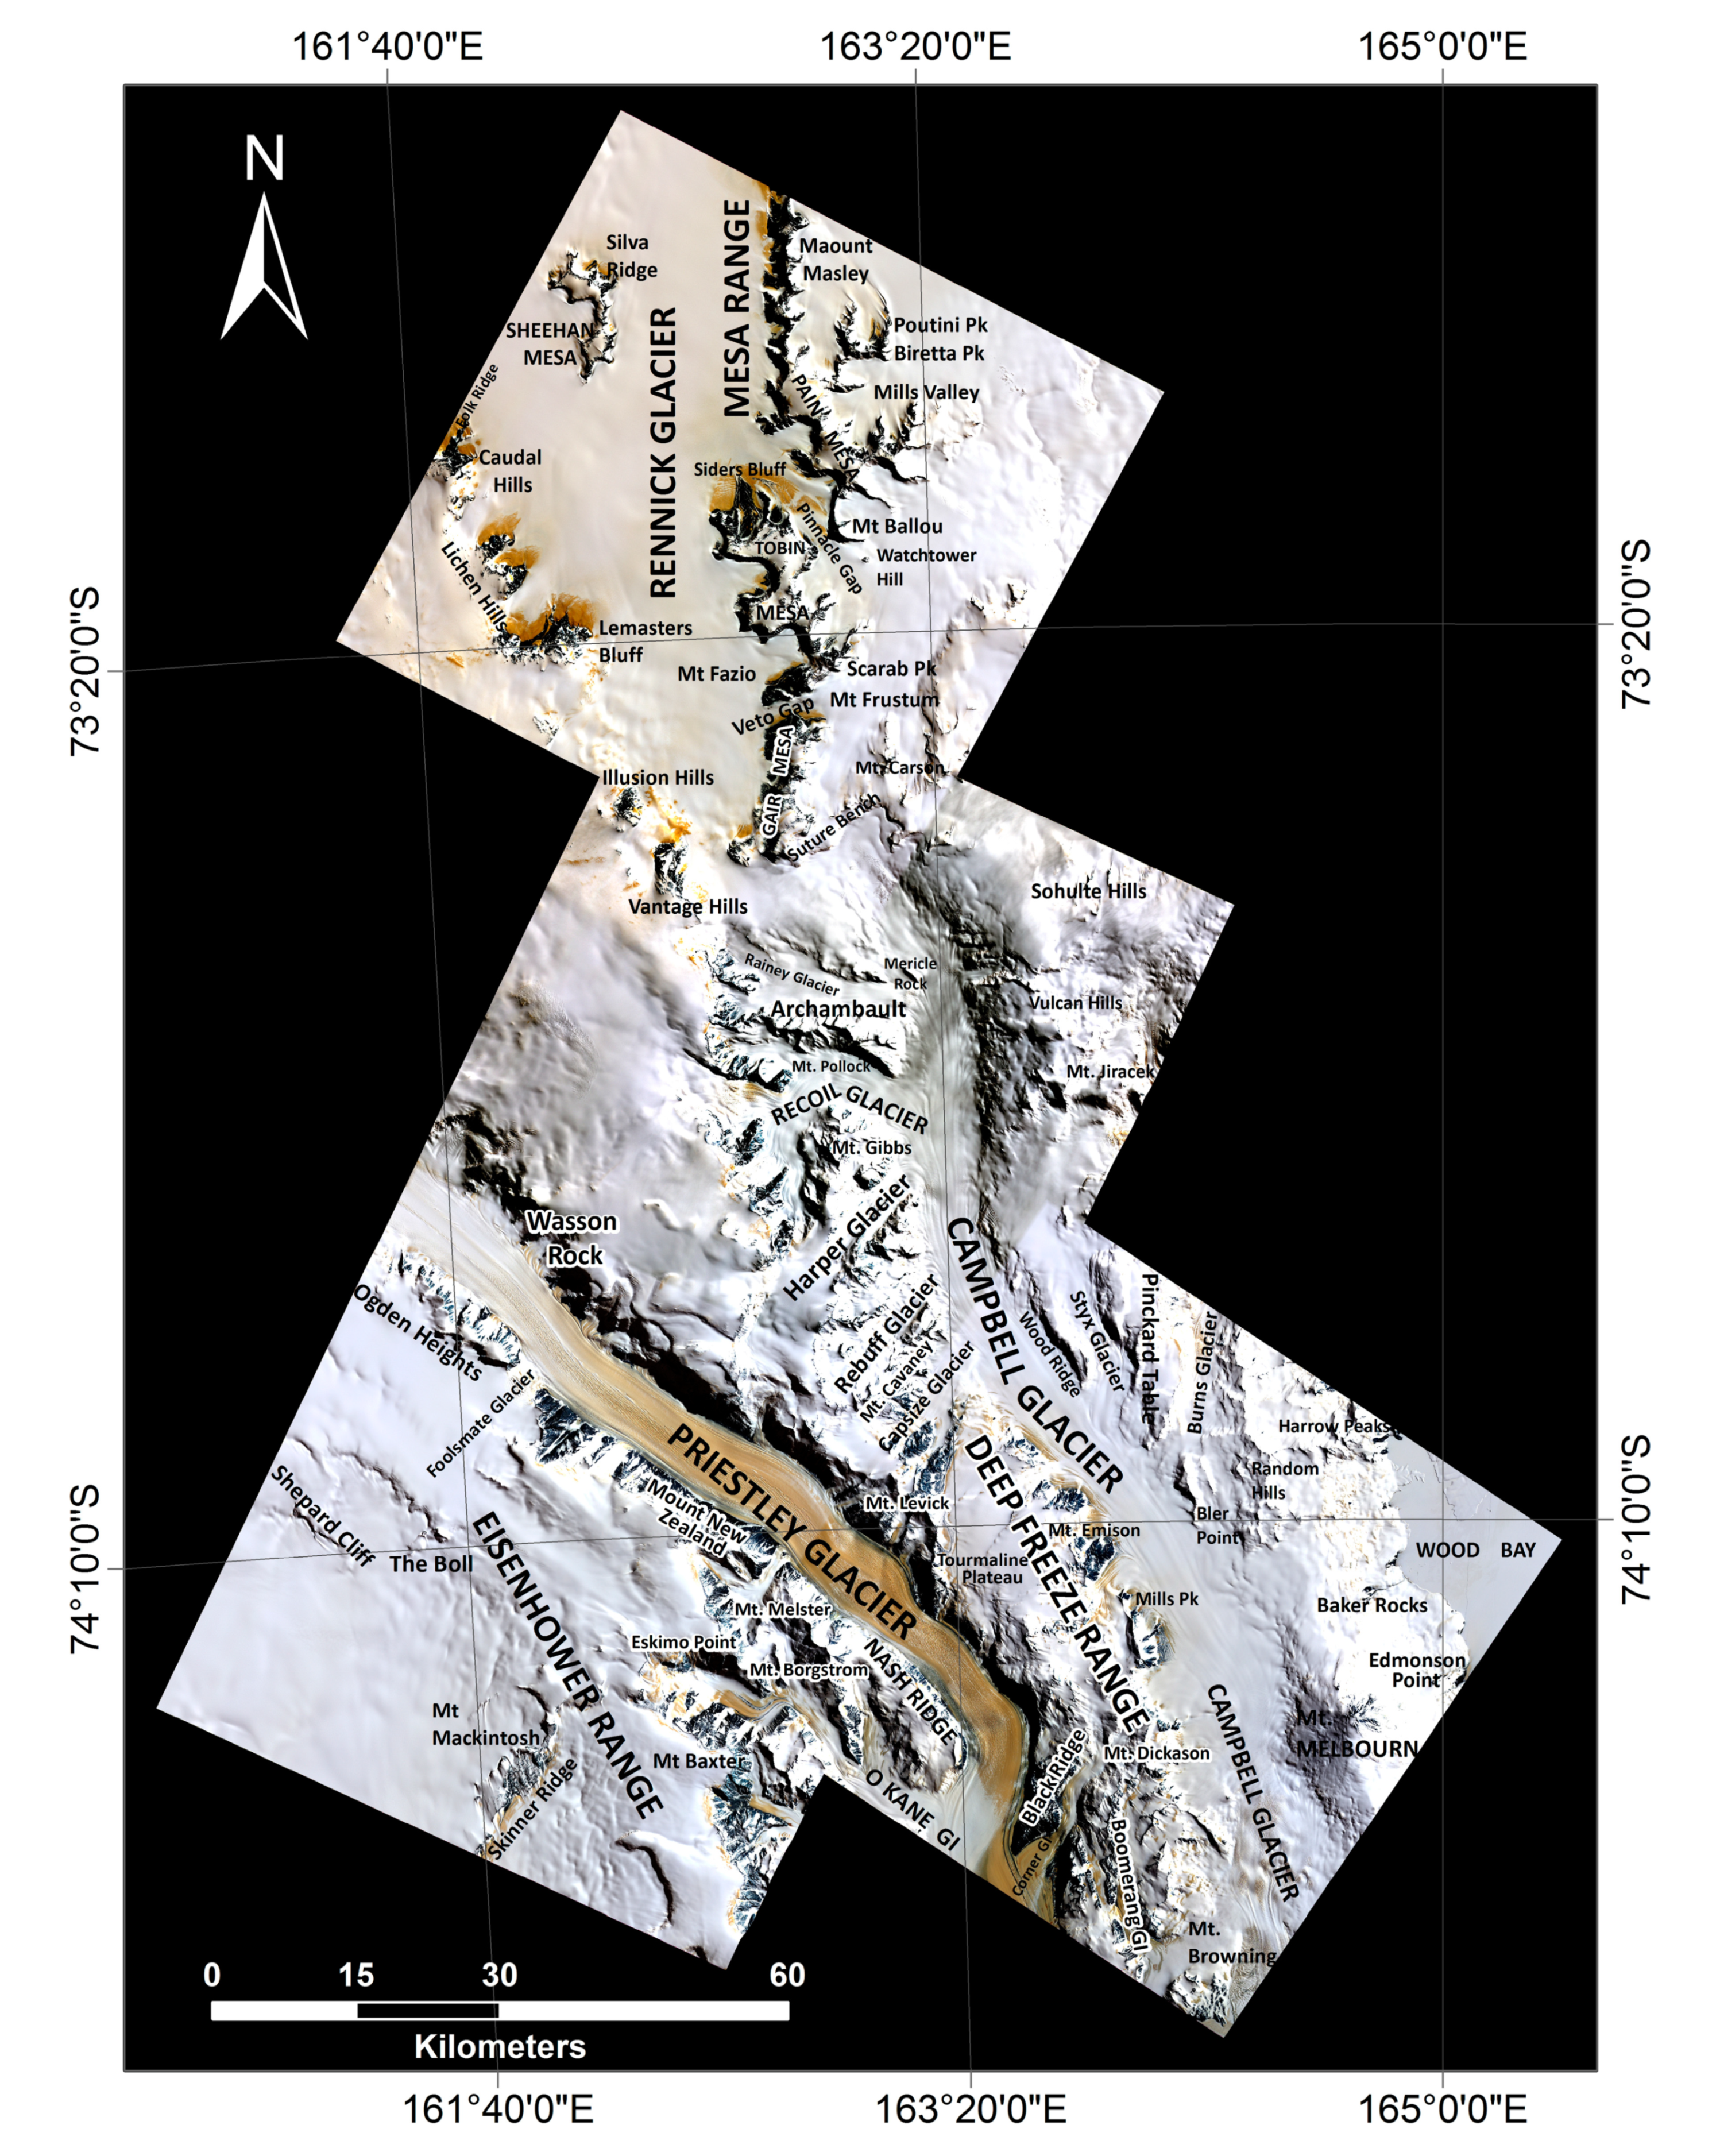
2. Geologic Setting of the Study Area

NVL is located at the Pacific end of the Transantarctic Mountains (TAM), a high-elevation mountain range spanning the entire Antarctic continent from the Weddell to the Ross Sea. Its basement rocks structurally belong to the late Ediacaran-Ordovician Ross Orogeny [41,42,43,44,45,46]. This basement is constituted by three NW-trending litho-tectonic units [47,48] (Figure 1), including (i) the Wilson Terrane (WT) with polydeformed low- to high- grade metasedimentary sequences intruded by the Granite Harbour Igneous Complex [49,50], (ii) the Bowers Terrane (BT) with very low-grade to low-grade metavolcanic and metasedimentary rocks [51,52,53], and (iii) the Robertson Bay Terrane (RBT) with a very low- to low- grade turbidite sequence [54,55,56]. The Ross-age basement is intruded by mid-Paleozoic magmatic rocks of the Admiralty Intrusives and Gallipoli Volcanics. It is unconformably covered by the sedimentary sequence of the Beacon and Ferrar Supergroups of Permo-Carboniferous to Jurassic age [41]. Cenozoic magmatic rocks of the McMurdo Group are related to West Antarctic rifting and occur along the entire Ross Sea margin of NVL (e.g., [57]).
The Mesa Range (centered at 73°11’S and 162°55’E) in NVL is an extended range of N-S trending mesas (Figure 1), which mainly consist of lava flows of the Kirkpatrick Basalt Group and comagmatic Ferrar Dolerite sills (Figure 1) [58,59]. The basement rocks in this region belong to the WT and comprise a metamorphic complex intruded by granitoid plutons and dykes [60,61]. After the Ross Orogeny, the basement was eroded to a paleosurface of low relief on which Triassic to early Jurassic quartzose sandstones of the Beacon Supergroup were deposited [62,63,64,65]. Scattered small outcrops of volcaniclastic deposits show that a phase of explosive volcanic activity preceded the lava pile’s eruption.
The Priestley Glacier is a major valley glacier located southeast of the Mesa Range separating the Deep Freeze Range in the north and the Eisenhower Ranges in the south and entering the northern end of the Nansen Ice Sheet (Figure 1). Greenschist- to amphibolite-facies metasedimentary and metavolcanic rocks (Priestley Formation and Priestley Schist), migmatitic and partly granulitic high-grade metamorphic rocks and widespread magmatic rocks of the Granite Harbour Intrusives constitute the basement units in the Deep Freeze Range between the Priestley and Campbell glaciers and in the Nash Ridge-O’Kane Glacier area of the Eisenhower Range [41,66,67] (Figure 1). The Beacon Supergroup unconformably overlies the deeply eroded crystalline basement and is, in turn, intruded and overlain by the Ferrar Dolerite and the Kirkpatrick basalts, respectively ([68]; Figure 1). Cenozoic effusive and intrusive rocks of the McMurdo Igneous Complex are mainly exposed in the coastal zones of this region [57,69,70].

3. Materials and Methods

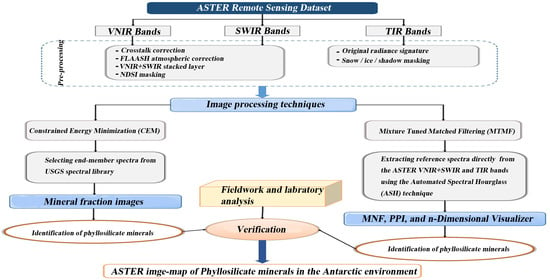
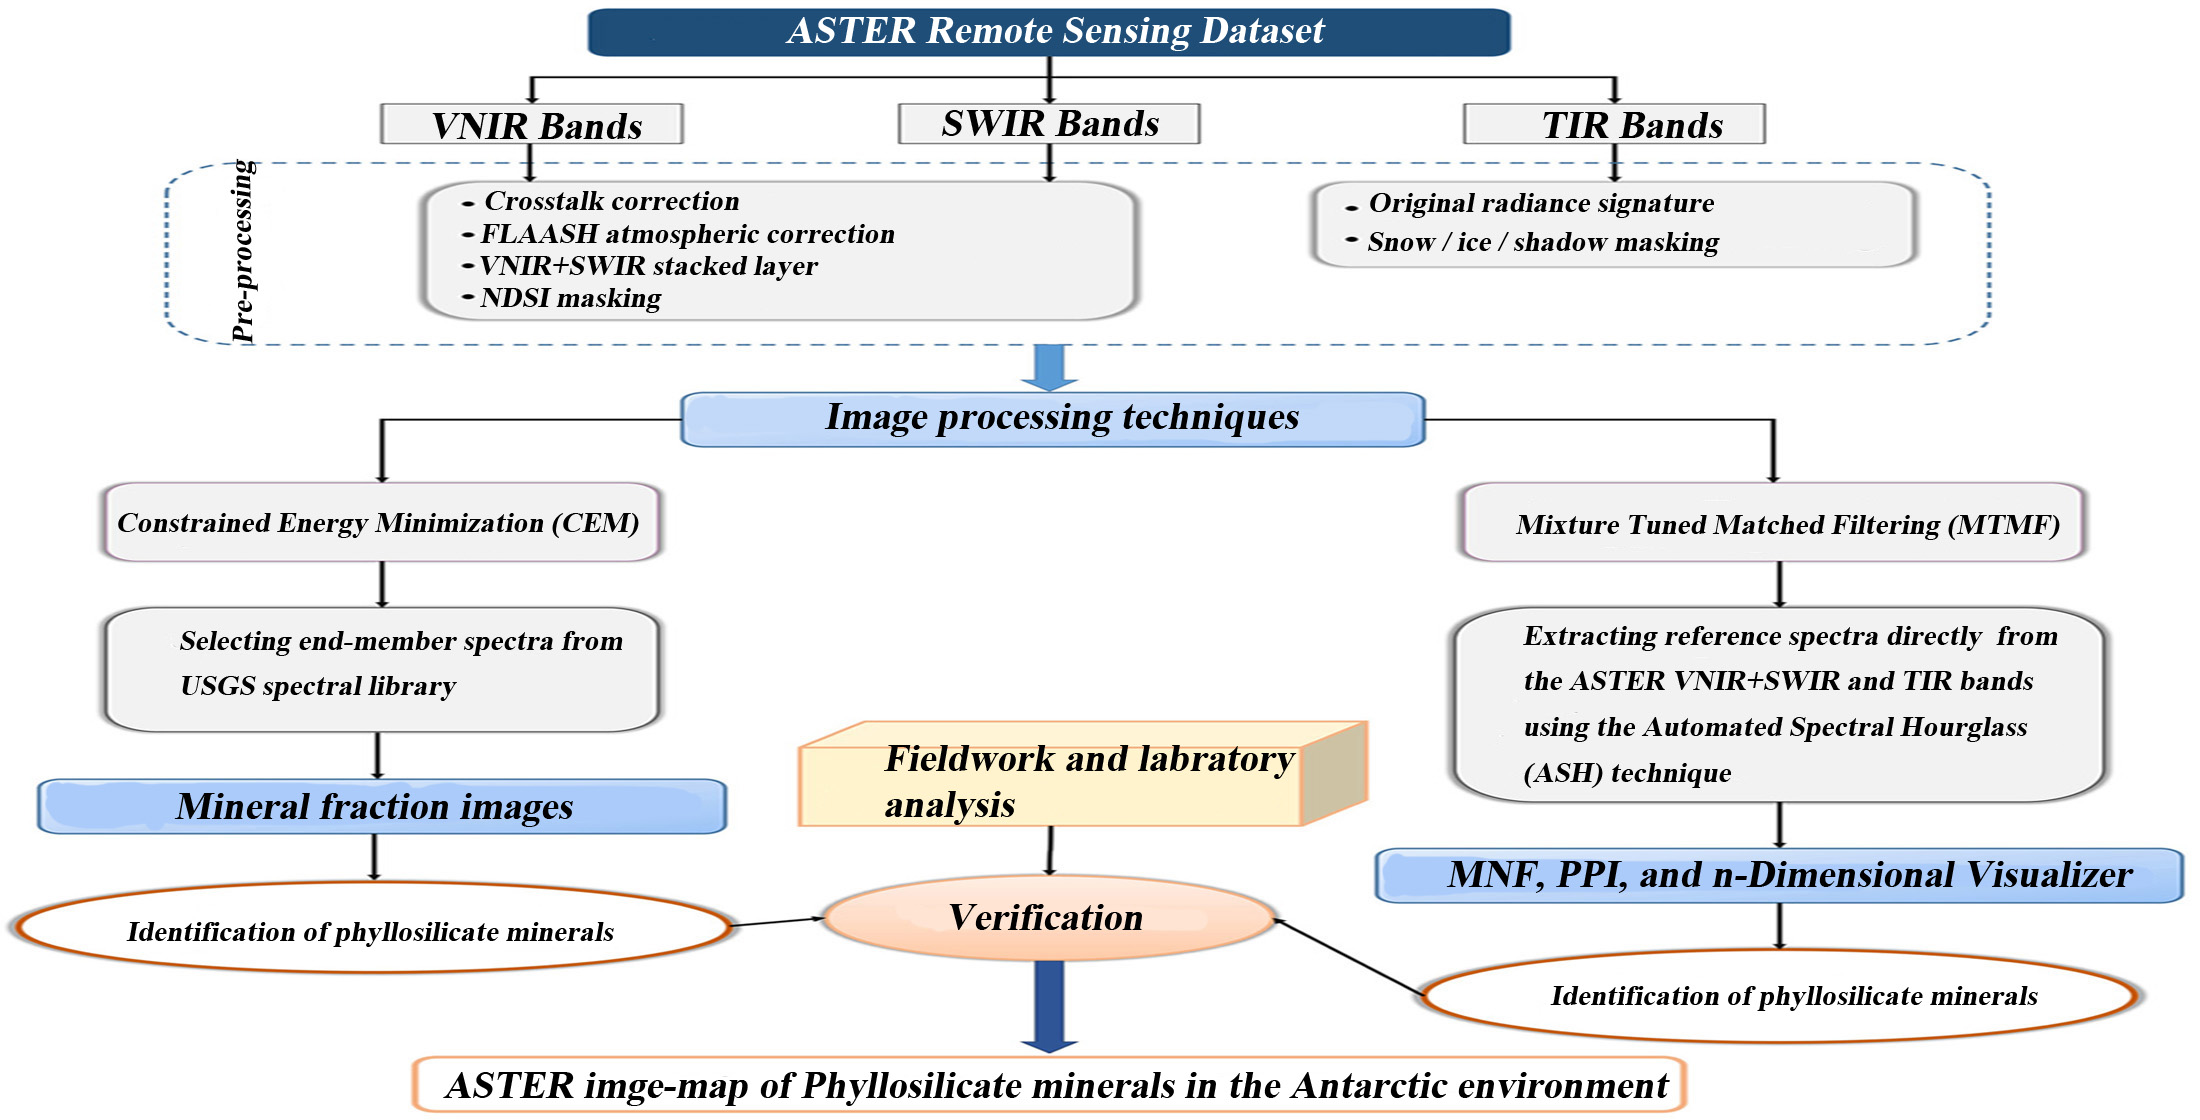
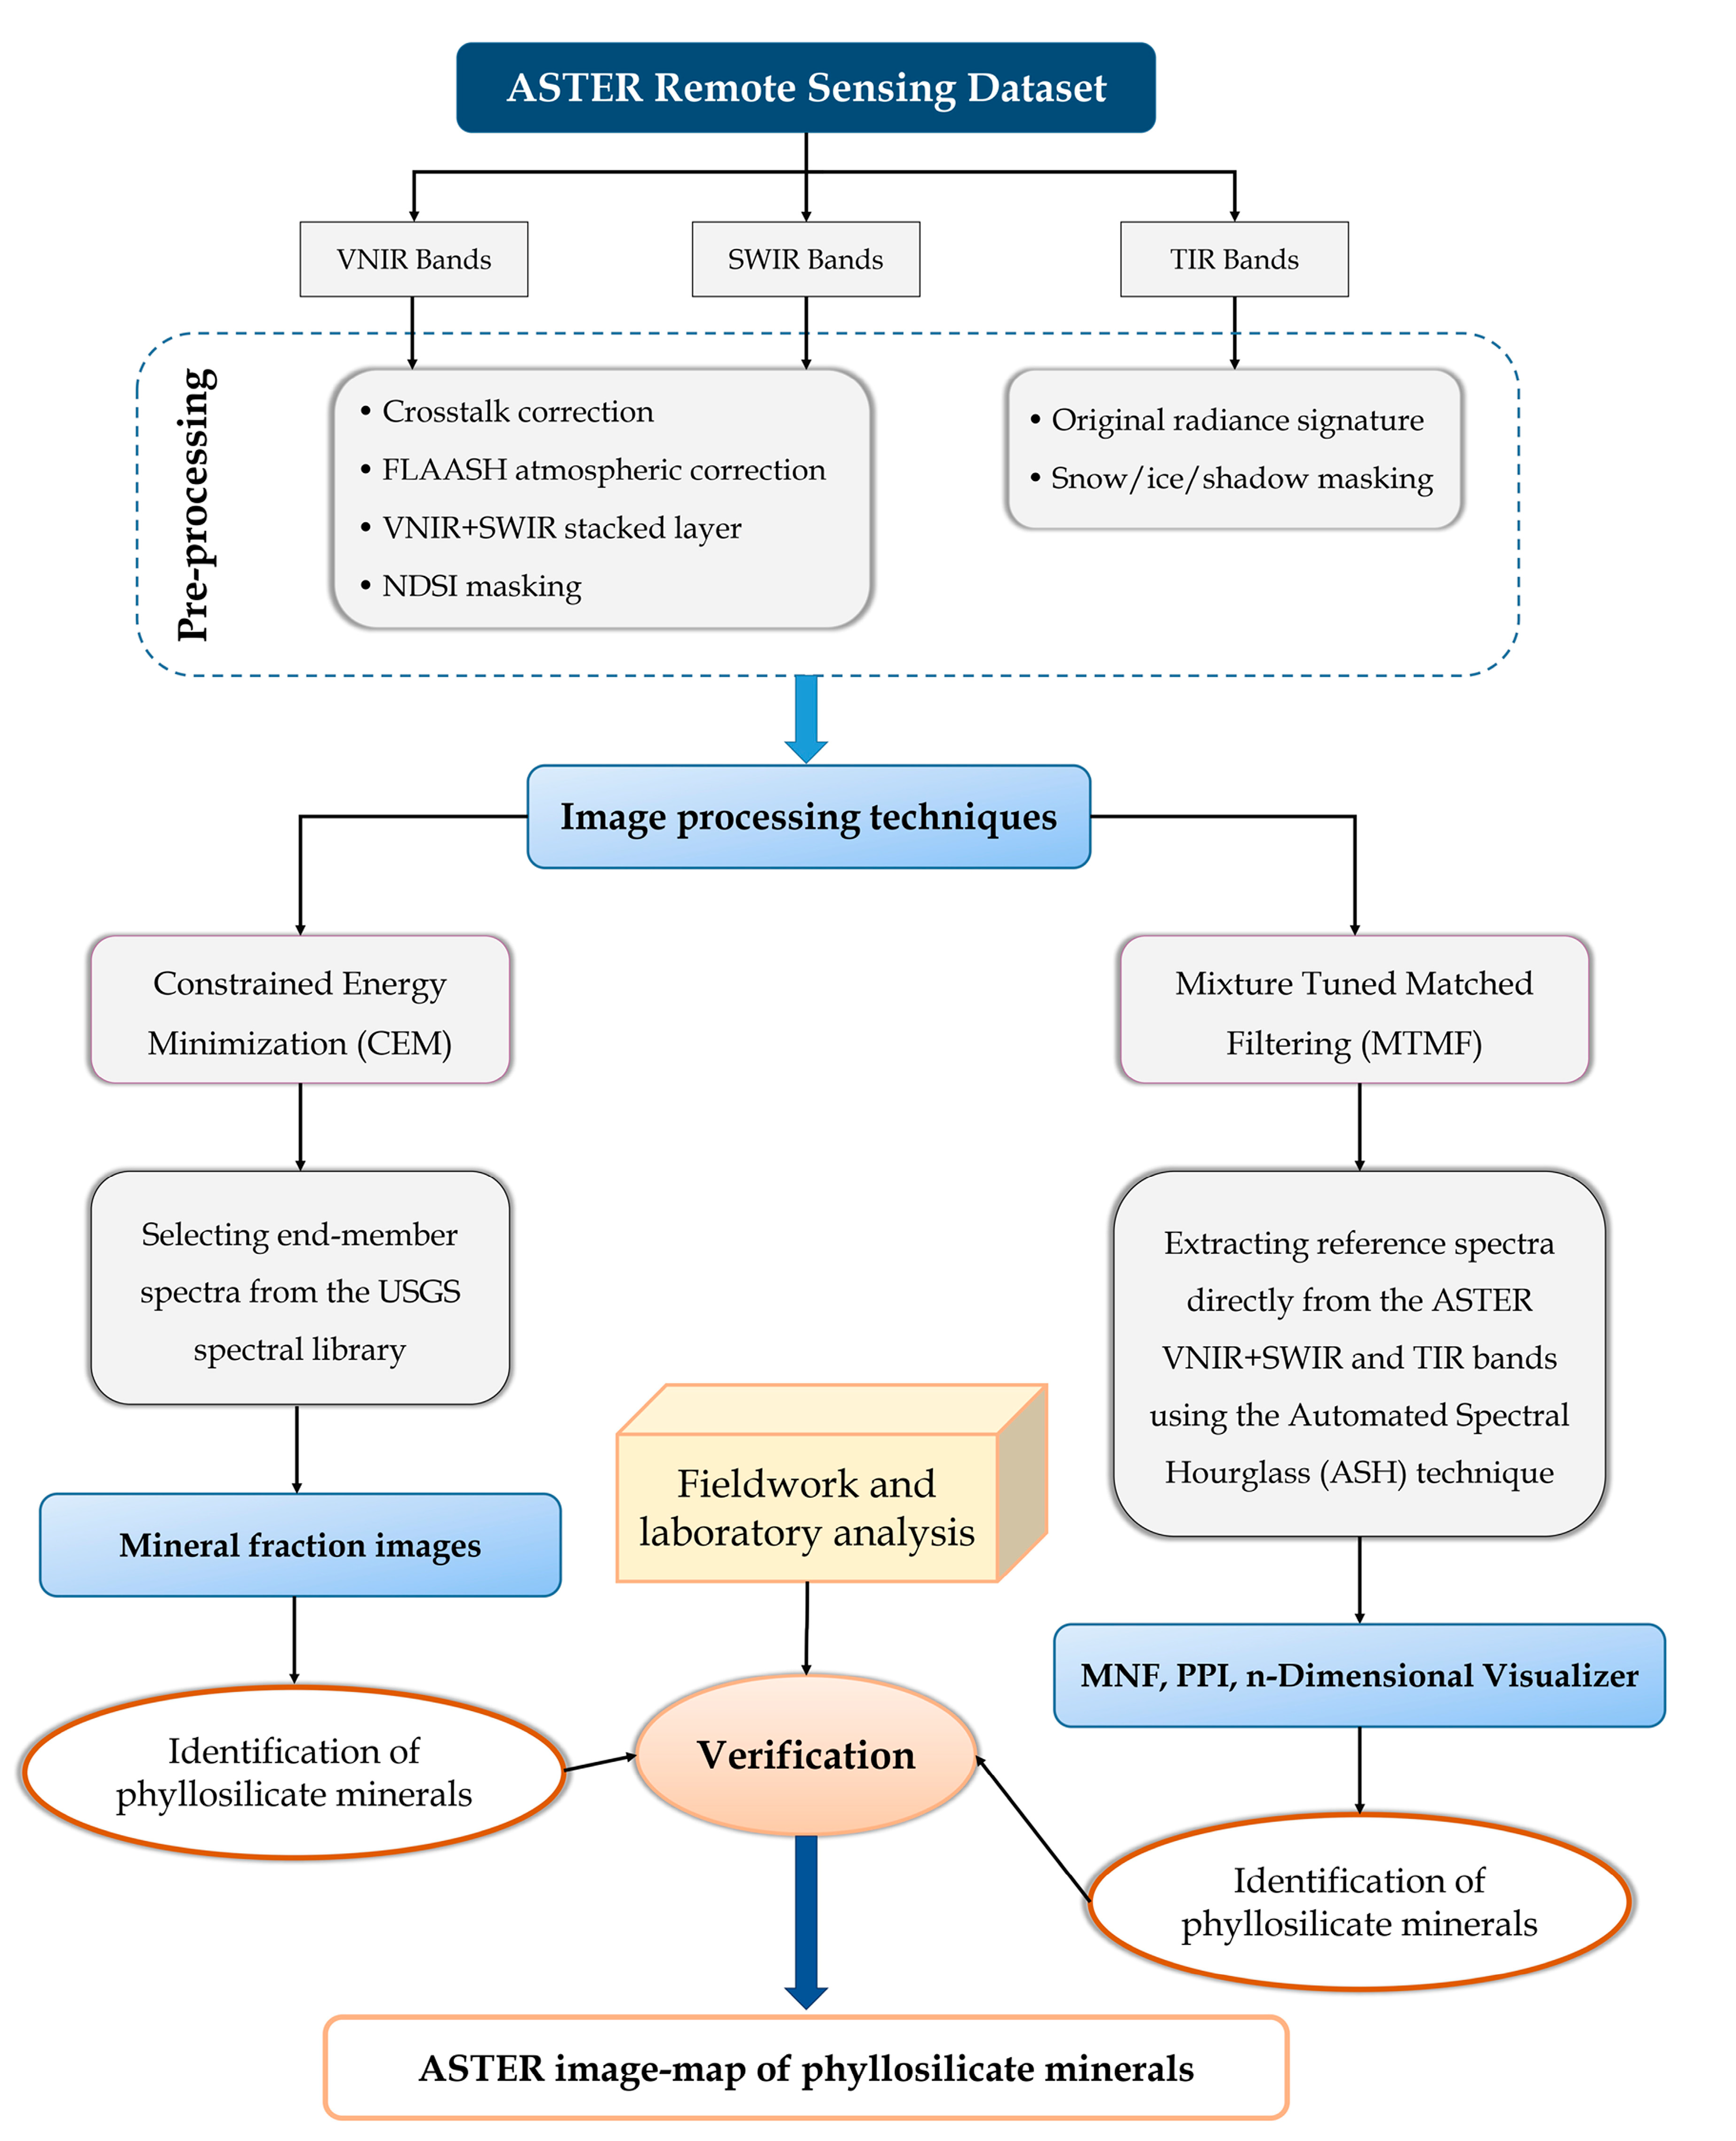
3.1. ASTER Data Characteristics and Pre-Processing

ASTER satellite sensor is chiefly designed for geological studies through a collaborative work among the Japanese Ministry of Economic Trade and Industry (METI) and National Aeronautics and Space Administration (NASA). It was launched on NASA’s Earth Observing System (EOS) polar-orbiting spacecraft in December 1999 [33,73]. ASTER bands were adequately constructed for detecting a wide variety of mineral groups in three separate sensor subsystems covering the VNIR, SWIR and TIR regions [34]. The technical characteristics of ASTER sensor subsystems are shown in Table 1. Each scene of ASTER has 60 × 60 km coverage, which is appropriate for regional lithological-mineralogical mapping.
In this study, four ASTER level 1T (Precision Terrain Corrected Registered At-Sensor Radiance) scenes covering the Mesa Range, Campbell and Priestley Glaciers were acquired from U.S. Geological EROS [75] (http://glovis.usgs.gov/). Table 2 shows the dataset attributes of the ASTER scenes. Figure 2 shows a mosaic of ASTER scenes covering the study zones, including Mesa Range, Campbell and Priestley Glaciers. Using the WGS-84 datum, the data were pre-georeferenced to UTM zone 58 South projection. Due to the consequences of energy overflow from band 4 into bands 5 and 9 for ASTER spectral bands [76], Crosstalk correction was performed to the data used in this study. The Fast Line-of-sight Atmospheric Analysis of Spectral Hypercube (FLAASH) algorithm was applied using Sub-Arctic Summer (SAS) atmospheric and the Maritime aerosol models for atmospheric correction herein [77,78,79]. For supplying a stacked layer of VNIR+SWIR bands for image processing analysis, the 30-m-resolution SWIR bands were re-sampled to 15 m spatial dimensions, which is equivalent to the 15-m resolution VNIR bands. For eliminating the effects of snow/ice, cloud and shadow, a masking procedure was implemented using the Normalized Difference Snow Index (NDSI) [80,81,82].

3.2. Image Processing Techniques

For detecting phyllosilicate minerals, the MTMF and CEM algorithms were executed to extract spectral information at sub-pixel level. The MTMF was implemented to VNIR+SWIR and TIR bands of ASTER using reference spectra directly extracted from the image. The CEM was applied for detailed detection of phyllosilicate minerals in exposed lithologies using the reference spectra of phyllosilicate minerals selected from the USGS spectral library. Figure 3 shows an overview of the methodological flowchart used in this study.

3.2.1. The Implementation of the MTMF Algorithm

The MTMF algorithm is a hybrid method based on the MF method with physical constraints imposed by mixing theory [83,84,85]. This method uses linear spectral mixing theory to constrain the result to feasible mixtures and reduce false alarm rates [79,83]. Two sets of images are presented as MTMF results, including (i) MF score images (values from 0 to 1.0) assess the relative degree of match to the reference spectrum and approximate sub-pixel abundance (where 1.0 is a perfect match) and (ii) Infeasibility images, where highly infeasible numbers show that mixing between the composite background and the target is not feasible. The greatest match to a target is acquired when the MF score is high (near 1) and the infeasibility score is low (near 0) [79].
For extracting reference spectra directly from the ASTER VNIR+SWIR and TIR bands the Automated Spectral Hourglass (ASH) technique was adopted in this analysis [79,86,87]. This technique contains three main steps, including (i) the Minimum Noise Fraction (MNF) [88,89]; (ii) the Pixel Purity Index (PPI) [90]; and (iii) automatic endmember prediction from the n-Dimensional Visualizer [89,91]. Additionally, the continuum-removal process [12,92,93] was performed on the extracted endmembers to isolate their spectral features and strategic spectral identification of phyllosilicate minerals compared to the USGS spectral library. The reference spectra of phyllosilicate minerals (Al-rich, Fe3+-rich, Fe2+-rich and Mg-rich phyllosilicates) were selected from the USGS spectral library (version 7.0; [94]) and the ECOSTRESS spectral library (version 1.0; [95]) (Figure 4A,B). Endmember spectra of kaolinite, muscovite, dickite, pyrophyllite, illite, glauconite, nontronite, biotite, antigorite, vermiculite, serpentine, talc, chlorite, and phlogopite were selected and convolved to response functions of ASTER VNIR+SWIR and TIR bands, respectively (Figure 4A,B).
Four ASTER scenes covering the Mesa Range, Campbell and Priestley Glaciers, namely the Mesa Range, the Campbell Glacier (I), the Priestley Glacier and the Campbell Glacier (II) were processed using the MTMF algorithm. The endmember spectra extracted from VNIR+SWIR bands and TIR bands and the MF score images were separately analyzed for each scene. The relative absorption and emissivity intensities of the endmember spectra and their similarity to the selected endmember reflectance spectra of phyllosilicates from the USGS spectral library (re-sampled to response functions of ASTER VNIR+SWIR bands and TIR bands) were considered (Figure 4A,B). Characterization and discrimination of phyllosilicates can be obtained using unique spectral signatures of Al-rich, Fe3+-rich, Fe2+-rich and Mg-rich phyllosilicates due to OH combination bands in the VNIR+SWIR region and diagnostic emissivity spectra of Al-rich, Fe-rich, Mg-rich phyllosilicates attribute to tetrahedral SiO4 vibrations in the TIR region [12]. Additionally, other alteration minerals such as iron oxide/hydroxides, carbonates and sulfates that contain Fe2+, Fe3+, Fe-OH, CO3 and S-O spectral absorption features [92] should be considered. Consequently, the extracted endmember spectra for the study regions can be categorized as (i) phyllosilicate minerals, (ii) iron oxide/hydroxide minerals, (iii) carbonate minerals, and (iv) sulfate minerals.

3.2.2. The Implementation of the CEM Algorithm

The CEM is a target signature-constrained algorithm that restrains the desired target signature with a particular attain, minimizing effects made by other unknown signatures derived from the background [96,97,98,99]. For implementing this algorithm, just preceding information about the preferred target signature is necessary. It accomplishes a partial unmixing of spectra to determine the abundance of endmember (user-defined) for several reference spectra from image or laboratory spectra [97]. The CEM algorithm uses a finite impulse response (FIR) filter to pass through the desired target while minimizing its output energy from a background other than the desired targets [96,100,101]. Fraction images of the selected endmember spectra from the USGS spectral library (Figure 4A,B), including kaolinite, muscovite, dickite, pyrophyllite, illite, glauconite, nontronite, biotite, antigorite, vermiculite, serpentine, talc, chlorite, and phlogopite were generated using the CEM algorithm for the Mesa Range, the Campbell Glacier (I), the Priestley Glacier and the Campbell Glacier (II) scenes. ASTER VNIR+SWIR and TIR bands were independently used to generate fraction images of the selected endmember spectra in this analysis.

3.3. Fieldwork Data and Laboratory Analysis

Geological in situ inspection was carried out during several Italian (PNRA) and German Scientific Expeditions (GANOVEX) in NVL and was mainly conducted at some major exposure sites in the Mesa Range, the Vantage Hills, the Archambault Ridge, the Recoil Glacier, the Deep Freeze Range, the Eisenhower Range along both margins of the Priestley Glacier and in the Mount New Zealand area. Several Global Positioning System (GPS) points were recorded for sampling locations using GPS plus GLONASS with an average accuracy of 5 m. A comprehensive field photography was undertaken of exposed lithologies during most recent expeditions (2015–2016, 2016–2017 and 2018–2019 summer seasons). Available rock petrographic descriptions implemented by observations of new and archived thin sections were provided from rock samples of main lithological units exposed in the study zones. X-ray diffraction (XRD) analysis was applied by a PANalytical MPD Pro XRD machine and Seifert XRD 3003 TT at the Federal Institute for Geosciences and Natural Resources (BGR), Hanover, Germany. MPD Pro uses Co radiation and contains a scientific X‘Cellerator” as second detector, which is special for phyllosilicate minerals analysis. Furthermore, error matrix (confusion matrix) and Kappa Coefficient were assessed for remote sensing results versus the GPS sampling locations.

4. Results

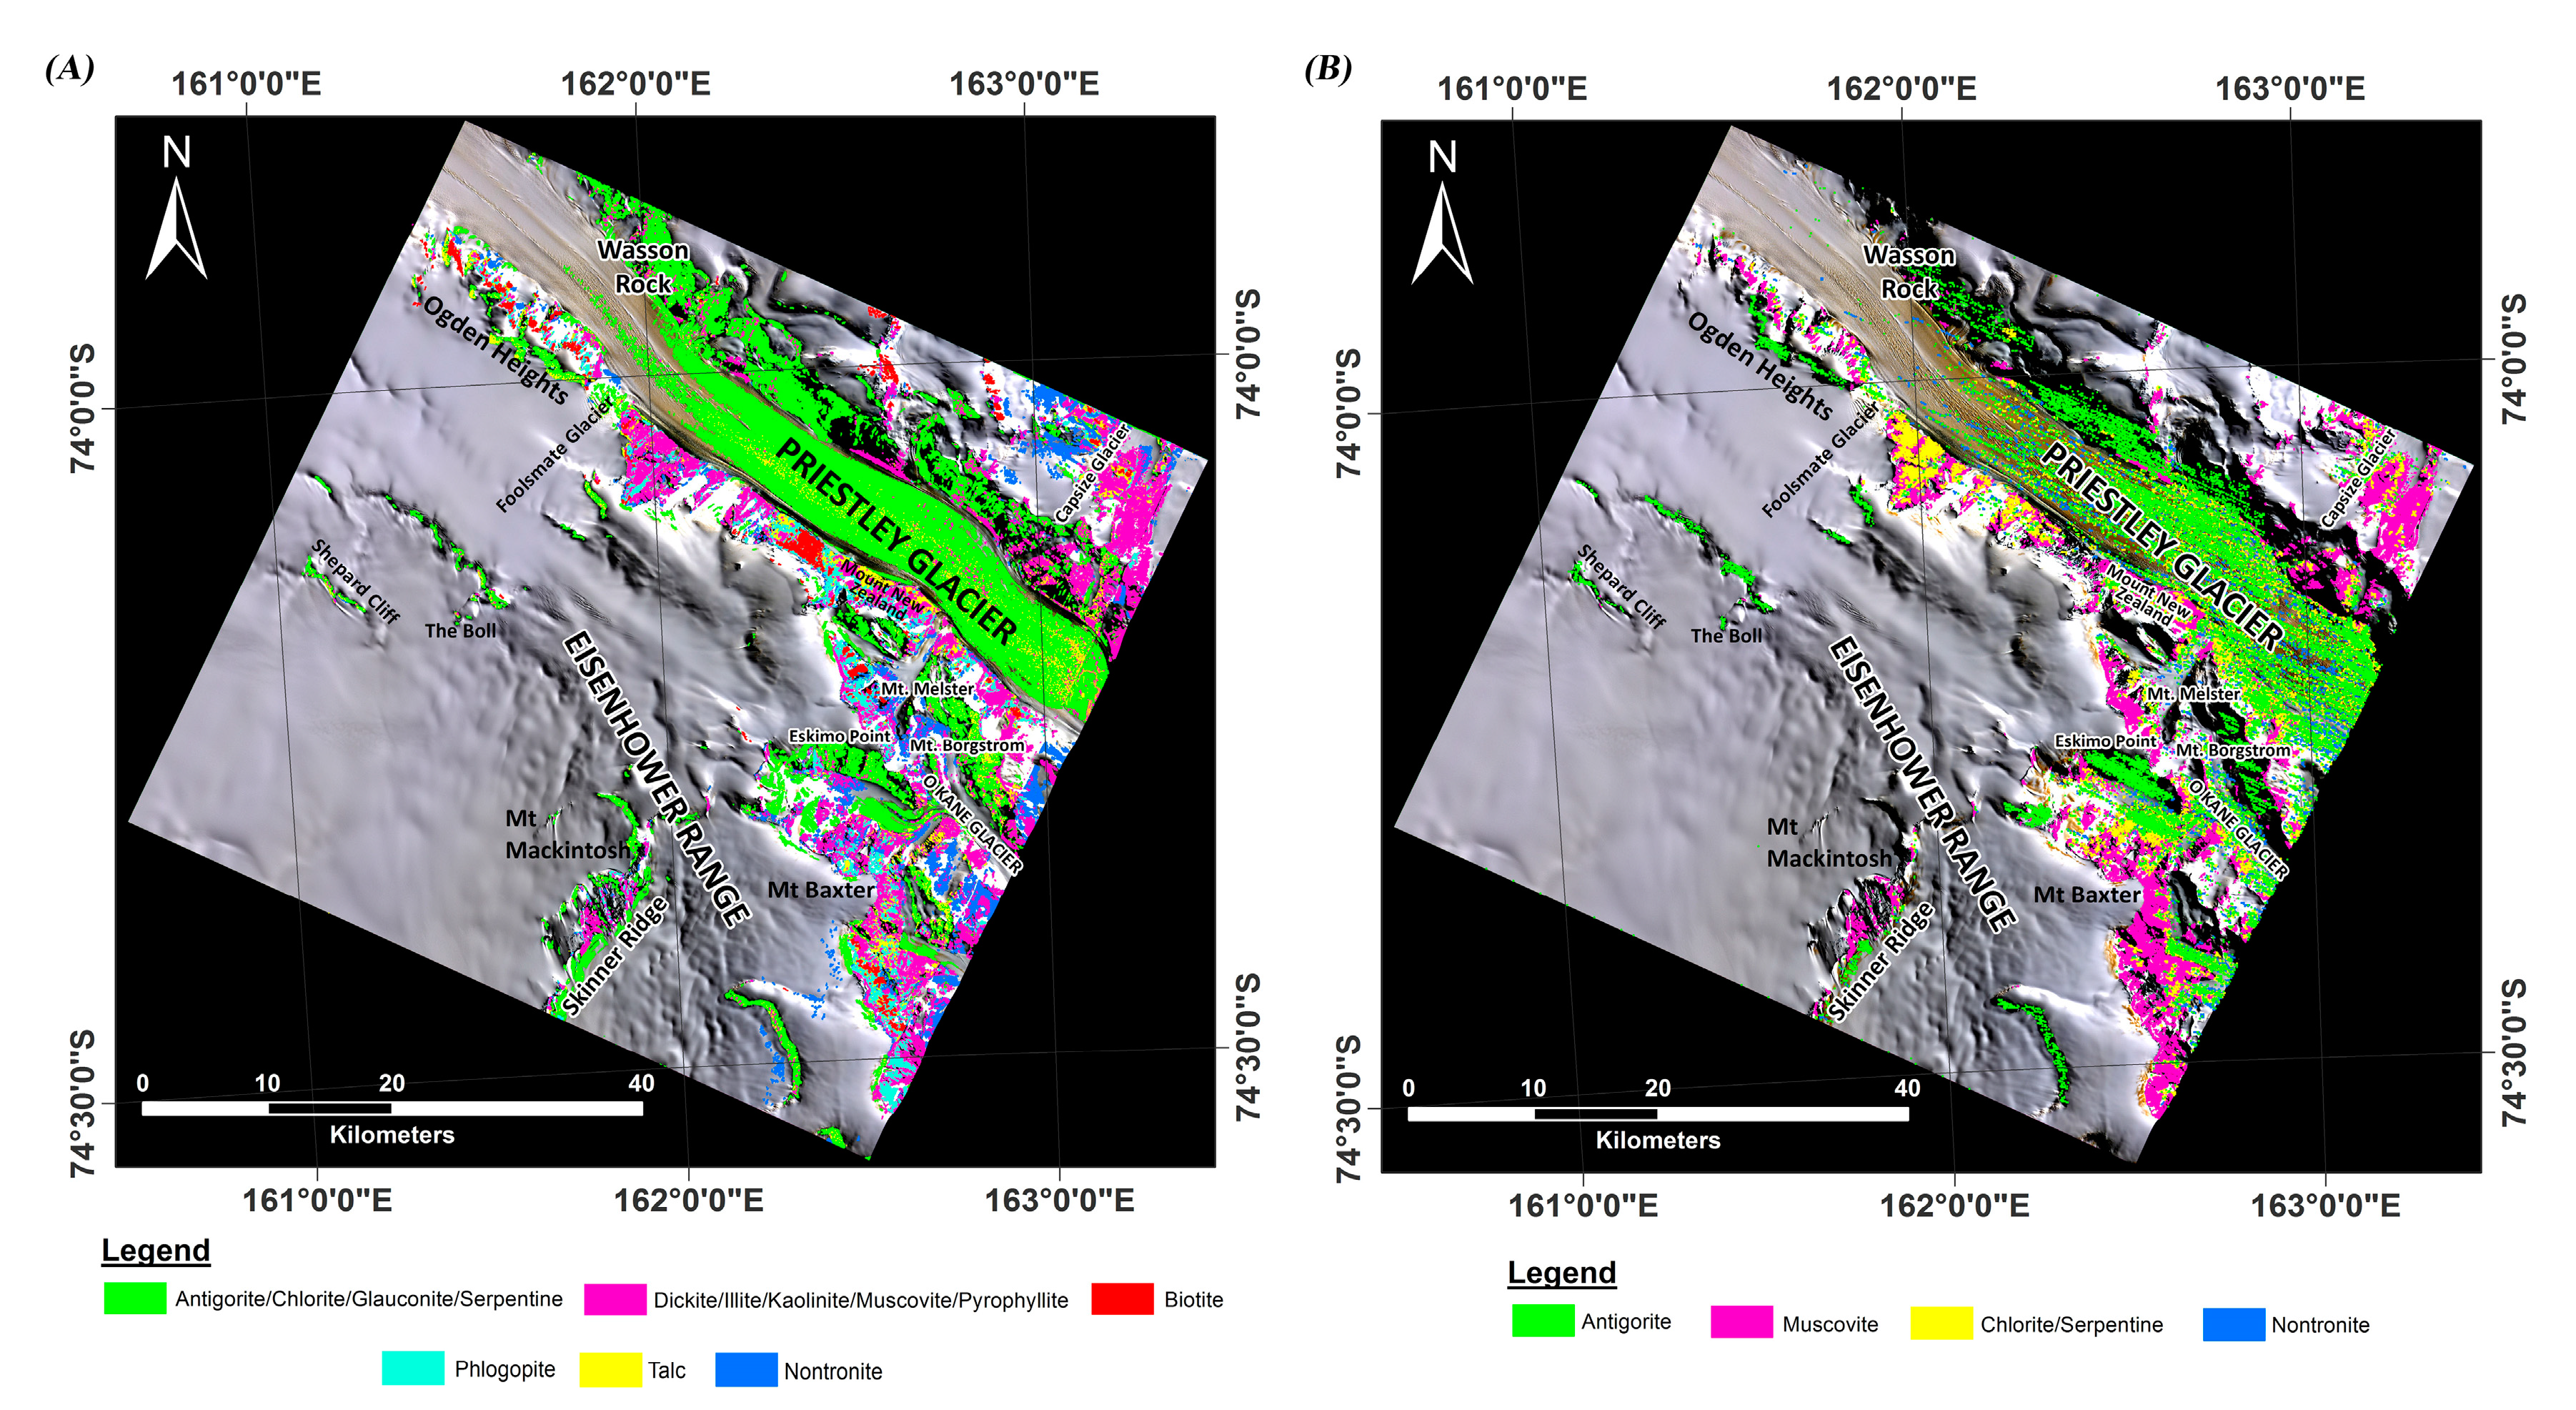
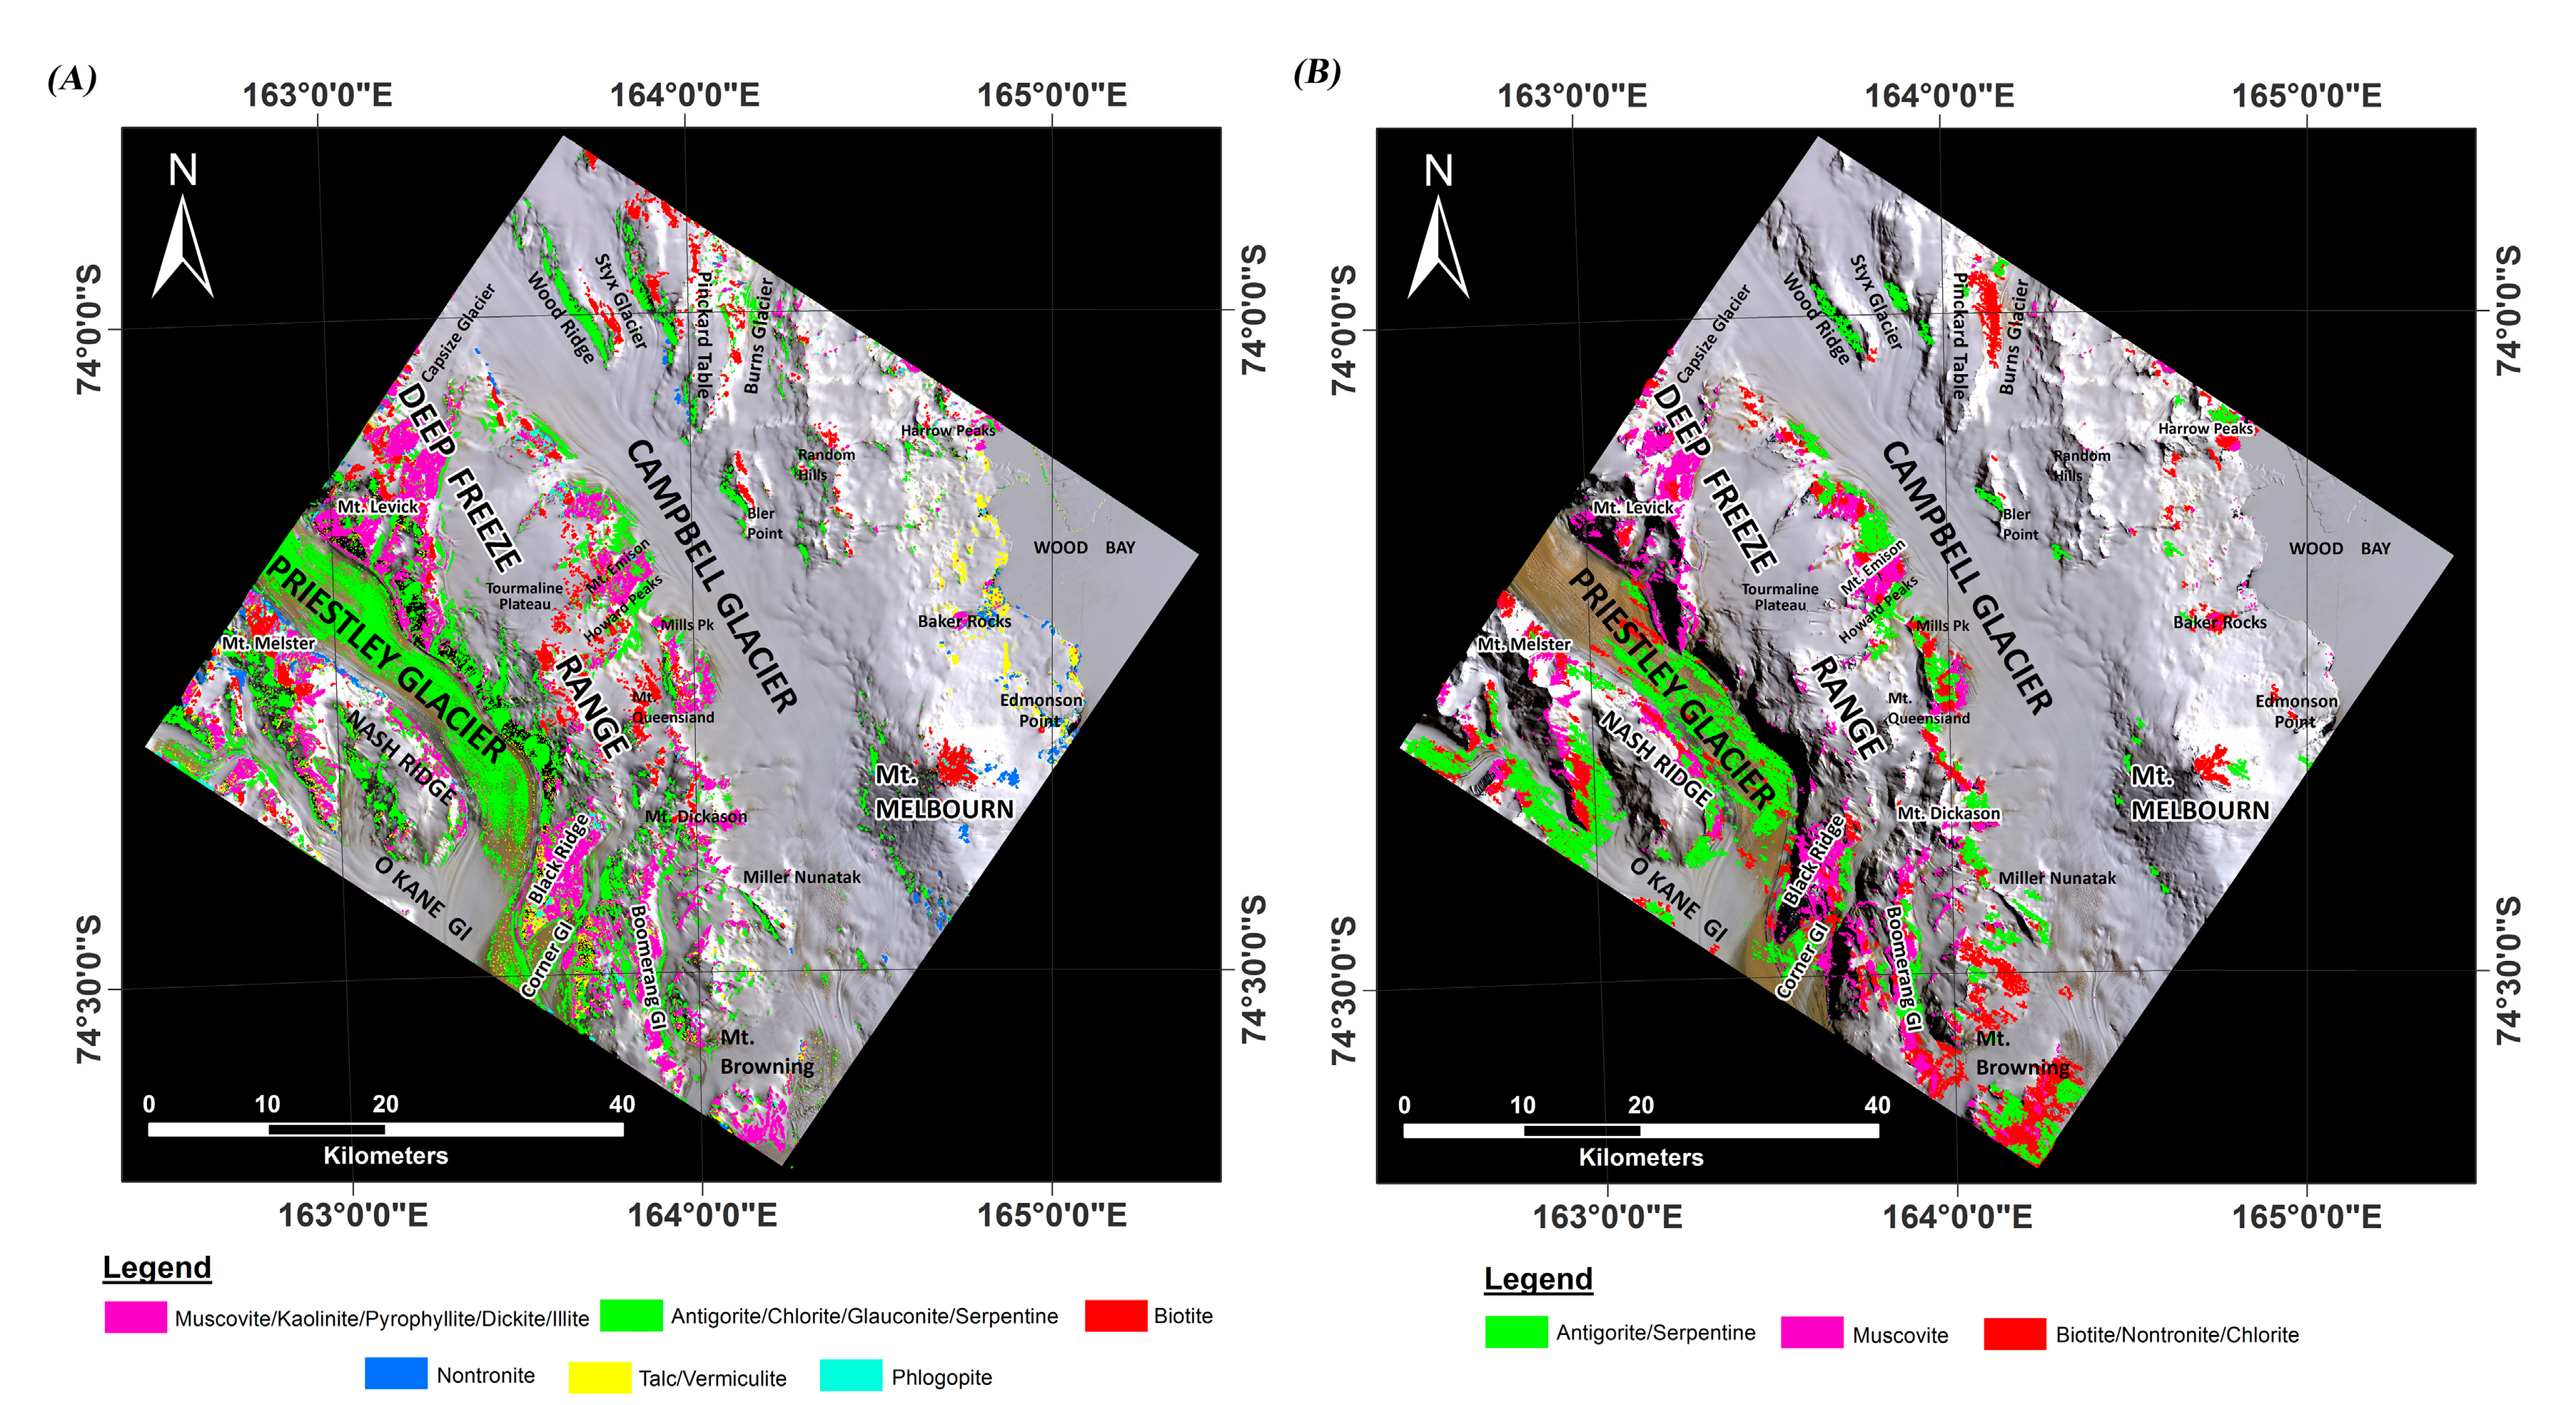
4.1. Detection of Phyllosilicates Using the MTMF Algorithm

The extracted endmember spectra from VNIR+SWIR bands for the Mesa Range is shown in Figure 5A. Distinctive spectral characteristics of iron oxide/hydroxide minerals and phyllosilicate minerals are distinguishable. However, some of the endmember spectra can be considered unknown materials/minerals because of uncharacterized spectral features. n-D class #1 shows weak Fe3+ and Fe-OH absorption features equivalent to bands 1, 3 and 7 of ASTER about 0.48 μm, 0.83–0.97 μm and 2.27 μm, which can be considered for hematite/goethite. n-D class #2, n-D class #6 and n-D class #10 do not contain recognizable relative absorption intensities. n-D class #3 typically represents slight Fe3+ and strong Mg-OH absorption features near 0.50 μm and 2.35 μm correspond with bands 2 and 8 of ASTER, respectively. With reference to Figure 4A, these spectral characteristics might match the admixture of glauconite and nontronite (Fe-bearing smectite). Dioctahedral micas such as glauconite and nontronite contain Fe3+ and substitution of octahedral Mg cations. Moreover, absorption features centered near 0.50 μm, 0.65 μm and 0.95 μm are reported for nontronite [12].
n-D class #4 shows strong Mg-OH absorption features about 2.35 μm coincident with bands 7 and 8 of ASTER. Moreover, it shows strong Fe3+/Fe2+ absorption features (0.48 to 0.97 μm) due to the presence of iron oxide/hydroxides. Regarding Figure 4A, the spectral characteristics might be considered for serpentine. n-D class #5 exhibits strong Fe3+/Fe2+ absorption features about 0.65 to 1.2 μm and Mg-OH absorption features around 2.35 μm, which are equivalent to bands 3, 7 and 8 of ASTER. These spectral characteristics are almost like antigorite (see Figure 4A and Figure 5A) [102,103]. n-D class #7 represents a major Fe,Mg-OH absorption features at 2.30–2.365 μm, which is matched to band 8 of ASTER. Moreover, a slight iron absorption at 0.85–0.97 μm (corresponding to bands 2 and 3 of ASTER) is recognizable. Hence, n-D class #7 characterizes the spectral properties attributable to chlorite [12,14]. n-D class #8 shows a major Al-OH absorption feature around 2.20 μm equal to band 6 of ASTER, which can be attributed to muscovite [104]. Although Fe2+ absorption features in n-D class #8 can be attributed to a slight combination of muscovite with biotite or jarosite. n-D class #9 displays strong Fe3+ and Fe-OH/S-O absorption features at 0.50–0.90 μm (bands 2 and 3 of ASTER) and 2.27 μm (band 7 of ASTER), which can be considered for jarosite (Figure 5A).
The MF score images (VNIR+SWIR bands) resulting from the MTMF algorithm represent several greyscale images for each extracted endmember. High MF score values (near 1: a perfect match) in the greyscale image appear as bright pixels, which depict the sub-pixel abundance of the target mineral and its location in each pixel. Concerning the resultant MF score for the Mesa Range, the main detected minerals are antigorite, chlorite, jarosite, muscovite, serpentine, glauconite/nontronite, hematite and goethite. Subsequently, the MF score images of detected minerals were classified. Different colors were assigned to the MF score images for depicting the spatial distribution of the alteration minerals in the Mesa Range. Please note that the MF score images with an identical spatial distribution of certain minerals or mineral groups were allocated to the only one-color class. Figure 5B shows the MTMF classification map (VNIR+SWIR bands) for the Mesa Range scene. Antigorite, chlorite, jarosite and muscovite are dominant alteration minerals, whereas, serpentine, glauconite/nontronite, hematite and goethite show lower spatial distribution. Comparison with the geological map of the study area (see Figure 1), antigorite, serpentine, glauconite/nontronite are mostly identified in the scree, glacial drift and moraine unit. Serpentine, glauconite/nontronite are also detected with the Ferrar Dolerite. Chlorite is mapped associated with the Kirkpatrick Basalt and the Granite Harbour granitoids units (Figure 5B). Jarosite, hematite/goethite and muscovite are typically detected in the Kirkpatrick Basalt unit. On the other hand, they are also found with the Granite Harbour granitoids, the Ferrar Dolerite, the amphibolite-facies metasedimentary rocks and the Beacon Supergroup units (Figure 5B).
Figure 5C shows the endmember spectra extracted from ASTER TIR bands for the Mesa Range. For detecting phyllosilicates in the TIR region, Si-O stretching vibrations is the strongest features that result from the tetrahedral sheet Si(Al,Fe,Mg)O4 vibrations [105]. However, the SiO4 vibrations are not exclusive to phyllosilicates and must be joined with other characteristics for decisive identification of phyllosilicates. Increasing the amount of Al, Fe and Mg and decreasing Si (substitution for Si in the tetrahedral sites) in phyllosilicates generate a shift in the emissivity minimum near 9–10 μm toward longer wavelengths [1,2,15]. Moreover, the emissivity minimum shifts to a longer wavelength for silicate rocks from felsic to mafic as the SiO2 content decreases [15]. n-D class #1 and n-D class #3 exhibit emission minima about 9 μm and 10.15 μm centered on bands 12 and 13 of ASTER (Figure 5C). These emission features are attributed to lithologies that have intermediate to mafic compositions and Mg-rich phyllosilicates. The Kirkpatrick Basalt (KB), the Ferrar Dolerite (FD) and Granite Harbour granitoids (Ghgr) lithologies and chlorite/serpentine can be considered for n-D class #1 and n-D class #3. A strong Si-O bond emission features can be seen in n-D class #2, which is around 8.7 μm and centered on band 11 of ASTER. Therefore, felsic lithologies comprising quartz and feldspars such as Granite Harbour granitoids and quartzose sandstones of the Beacon Supergroup can be characterized. n-D class #4 shows emission minima at 8.7 μm and 10.15 μm matched with bands 11 and 13 of ASTER (Figure 5C). These emission features can be related to Fe and Mg-rich phyllosilicates and intermediate lithologies, which can be considered for antigorite and the scree, glacial drift and moraine unit. n-D class #5 represents emission minima at 8.7 μm and 9 μm centered on bands 11 and 12 of ASTER. Al-rich phyllosilicates correlate with these emission features [12]. Thus, muscovite/kaolinite/illite can be expected for n-D class #5. There are no distinctive emission features in n-D class #6 (Figure 5C).
The TIR MTMF classification map for the Mesa Range is shown in Figure 5D. Chlorite/serpentine, muscovite/kaolinite and antigorite are widely mapped in the study region. However, quartz and feldspars have very low surface distribution. Referencing the geology map of the study area, chlorite/serpentine is identified in the Kirkpatrick Basalt, the Ferrar Dolerite and Granite Harbour granitoids lithologies. Muscovite/kaolinite is typically mapped in the Kirkpatrick Basalt. On the other hand, muscovite/kaolinite can be seen in most lithological units exposed in the study area (Figure 5D). Antigorite is broadly detected in the scree, glacial drift and moraine unit. Quartz and feldspars are mostly identified in the Granite Harbour granitoids and the Beacon Supergroup.
The extracted endmember spectra from VNIR+SWIR bands for the Campbell Glacier (I) is shown in Figure 6A. n-D class #1 does not show any characterized spectral features related to alteration minerals. n-D class #2 contains Mg-OH absorption features (around 2.35 μm) corresponding to bands 7 and 8 of ASTER, which might be considered talc. n-D class #3 exhibits strong Al-OH absorption features at 2.145 μm to 2.225 μm [92], which coincide with bands 5 and 6 of ASTER. Muscovite, kaolinite, dickite, pyrophyllite and illite can be expected for these spectral signatures. n-D class #4 represents spectral characteristics such as glauconite/nontronite. n-D class #5 shows Fe3+ absorption at 0.50 to 0.97 μm (bands 2 and 3 of ASTER), which can be attributed to hematite and goethite. n-D class #6 has antigorite spectral signatures. n-D class #7 is characterized by serpentine spectral features. n-D class #8 shows chlorite spectral characteristics. n-D class #9 can be considered for jarosite. n-D class #10 represents Al-OH absorption properties (2.145 μm to 2.225 μm) that slightly combined with Fe-OH absorption features (0.48 μm and 2.27 μm). Hence, it may contain muscovite/kaolinite/dickite/pyrophyllite/illite mixed with jarosite/hematite/goethite.
The MTMF classification map (VNIR+SWIR bands) for the Campbell Glacier (I) scene is shown in Figure 6B. The Mg,Fe-OH minerals (antigorite, serpentine, talc, glauconite/nontronite and chlorite) are spectrally and spatially dominant in the study zone. However, Al-OH minerals and jarosite, hematite and goethite are considerably distributed in some parts of the study area. Referring to the geological map of the study area (Figure 1; [41]), the occurrence of the antigorite/serpentine/talc mineral group broadly overlaps with areas occupied by the scree, glacial drift and moraine unit. Moreover, this mineral group is detected in the crevasse fields adjacent to the Vantage Hills, Rainy Glacier and Recoil Glacier. Jarosite is typically identified in the Kirkpatrick Basalt and the Ferrar Dolerite especially in the Gair Mesa and Vantage Hills (Figure 6B). However, it can be partially seen in the Granite Harbour granitoids at Archambault Ridge and Mt. Gibbs. The Al-OH minerals are identified associated with the Beacon Supergroup, Granite Harbour granitoids and Wilson Metamorphic Complex in the Illusion Hills, Mt. Pollock and in the vicinity of the Recoil Glacier and Harper Glacier. Glauconite/nontronite is mainly mapped in the southeastern part of the study area consisting of the Granite Harbour granitoids and Wilson Metamorphic Complex. Chlorite is partially distributed in the Ferrar Dolerite and Granite Harbour granitoids. Hematite and goethite are found associated with most of the exposed lithologies in the study zone (Figure 6B).
Endmember spectra extracted from ASTER TIR bands for the Campbell Glacier (I) is displayed in Figure 6C. n-D class #1 and n-D class #4 show strong Si-O emission features about 9 μm matched with band 12 of ASTER. This emission minimum can be attributed to felsic lithologies containing quartz and feldspars (the Granite Harbour granitoids) and Al and Fe-rich phyllosilicates (muscovite/kaolinite/pyrophyllite and illite/nontronite/glauconite). n-D class #2 contains emission minima at 8.7 μm and 10.60 μm corresponding to bands 11 and 13 of ASTER. A lithology dominated by quartz (the Beacon Supergroup) and Mg-rich phyllosilicates (chlorite, serpentine, talc) might be considered for n-D class #2. Emission minima around 8.7 μm and 9 μm (bands 11 and 12 of ASTER) are displayed in n-D class #3, which may be related to intermediate lithologies (e.g., the Wilson Metamorphic Complex) and the Al, Fe, Mg-rich phyllosilicates such as illite/nontronite/glauconite. n-D class #5 represents basic/mafic lithologies and Mg-rich phyllosilicates due to strong emission features about 10.60 μm (band 13 of ASTER). The Kirkpatrick Basalt and the Ferrar Dolerite units and antigorite can be predicted for n-D class #5. Distinct emission attributes could not be seen in n-D class #6 (Figure 6C).
Figure 6D shows the TIR MTMF classification map for the Campbell Glacier (I) scene. Surface distribution of antigorite, muscovite/kaolinite/pyrophyllite and illite/nontronite/ glauconite is high and can be seen with the most of exposed lithologies. Chlorite and quartz/feldspars are mostly distributed in the Granite Harbour granitoids, the Beacon Supergroup and some parts of the Wilson Metamorphic Complex. Antigorite is found with the scree, glacial drift and moraine, the Kirkpatrick Basalt and the Ferrar Dolerite and some part of the Granite Harbour granitoids. Muscovite/kaolinite/pyrophyllite group is mapped associated with the Beacon Supergroup and some parts of the Kirkpatrick Basalt, the Ferrar Dolerite and the Granite Harbour granitoids and the Wilson Metamorphic Complex. Illite/nontronite/glauconite group is identified in the Granite Harbour granitoids and the Wilson Metamorphic Complex (Figure 6D).
The extracted endmember spectra from VNIR+SWIR bands for the Priestley Glacier is shown in Figure 7A. n-D class #1 shows Mg-OH spectral features about 2.35 μm (equal to bands 7 and 8 of ASTER), which may consider for serpentine/talc. n-D class #2 does not show any recognizable spectral properties related to alteration minerals. n-D class #3 represents Al-OH spectral features attributed to muscovite (band 6 of ASTER). Iron oxide/hydroxide absorption features are observable in n-D class #4. Biotite can be considered for n-D class #5 due to slight Fe2+(Mg)-OH at 2.30 μm [12]. n-D class #6 exhibits antigorite spectral characteristics. Characterized spectral features are not distinguishable in n-D class #7. The combination of Al-OH and Mg-Fe-OH spectral features can be seen in n-D class #8 because of slight Fe3+ absorption features centered on band 2 (0.63–0.69 μm), Al-OH absorption features matched with band 6 (2.185–2.225 μm) and Mg-Fe-OH absorption features corresponding to bands 7 and 8 (2.235 to 2.365 μm) of ASTER (Figure 7A). n-D class #9 may contain iron oxide/hydroxide absorption features. n-D class #10 does not include identifiable absorption intensities related to alteration minerals.
The MTMF classification map (VNIR+SWIR bands) for the Priestley Glacier scene is displayed in Figure 7B. Spatial distribution of antigorite/serpentine/talc, muscovite, biotite, hematite/goethite/jarosite, illite/nontronite and glauconite/chlorite were detected associated with exposed lithologies. Comparison with the geological map of the area (Figure 1; [41]), the antigorite/serpentine/talc mineral group is mostly detected in the Priestley Glacier moraines. However, this mineral group is also identified in the Kirkpatrick Basalt, the Ferrar Dolerite, the Beacon Supergroup and the low-grade metasedimentary Priestley Formation in the Eisenhower Range and the Deep Freeze Range in the northern part of Priestley Glacier (Figure 7B). Muscovite is broadly mapped associated with the Wilson Metamorphic Complex consisting here of the Priestley Formation and Priestley Schist (quartzite, biotite schist and garnet-biotite paragneiss). Moreover, muscovite is partially mapped in the Granite Harbour granitoids, the Wilson high-grade metamorphics (gneiss and migmatite) and the Beacon Supergroup that are exposed near Mount New Zealand, Mt. Meister and Capsize Glacier. Biotite is mostly found associated with the Granite Harbour granitoids and the Priestley Schist. Iron oxide/hydroxides (hematite/goethite/jarosite) are associated with the Granite Harbour granitoids, the Kirkpatrick Basalt, the Ferrar Dolerite and the Priestley Schist. Illite/nontronite and glauconite/chlorite mineral group are readily observable in scree and glacial drift (Figure 7B).
n-D class #2 and n-D class #6 extracted from ASTER TIR bands do not show distinctive emission features for the Priestley Glacier (Figure 7C). n-D class #1 and n-D class #4 exhibit emission features at 8.7 μm and 9.1 μm centered on bands 11 and 12, which can be attributed to intermediate lithologies and Fe and Mg-OH phyllosilicates (biotite, chlorite, nontronite and glauconite). n-D class #3 displays two emission minima at 8.7 μm and 10.6 μm centered on bands 11 and 13. Intermediate to mafic lithologies and Mg-OH phyllosilicates (antigorite/serpentine/talc) might be related to the emission features. n-D class #5 represents typical emission features about 8.7 μm coincident with band 11, which are attributed to strongly felsic lithologies consisting of quartz, feldspars and Al-OH phyllosilicates (muscovite). Figure 7D shows the TIR MTMF classification map for the Priestley Glacier scene. The Mg-OH phyllosilicates (antigorite/serpentine/talc) are generally mapped associated with scree, glacial drift and moraines. The Fe and Mg-OH phyllosilicates (biotite, nontronite, glauconite and chlorite) are mostly identified in the Granite Harbour granitoids. Although this mineral group was also partially detected in the Kirkpatrick Basalt, the Ferrar Dolerite, the Priestley Formation and the Priestley Schist. The quartz, feldspars and Al-OH phyllosilicates (muscovite) mineral group is mainly mapped in the Priestley Formation and the Beacon Supergroup (Figure 7D).
Figure 8A displays the extracted endmember spectra from VNIR+SWIR bands for the Campbell Glacier (II). n-D class #1 and n-D class #4 show Mg-OH absorption features, which might relate to serpentine/talc. n-D class #2, n-D class #8 and n-D class #10 do not show recognizable absorption features attributed to alteration minerals. Glauconite/vermiculite, biotite/nontronite and chlorite are characterized in n-D class #3, n-D class #5 and n-D class #6, respectively. The Al-OH minerals such as kaolinite, muscovite, dickite, pyrophyllite and illite can be identified in n-D class #7. n-D class #9 represents absorption features related to antigorite. The MTMF classification map (VNIR+SWIR bands) for the Campbell Glacier (II) shows that Mg-OH minerals such as antigorite and serpentine/talc are mostly mapped in moraines and crevasse fields (Figure 8B). The Al-OH minerals are broadly detected in the Wilson Metamorphic Complexes (the Priestley Formation, the Priestley Schist and migmatite gneiss) especially in the Mt. Emison, Mt. Levick and Black Ridge areas. Biotite/nontronite is typically mapped in the Mt. Melbourne region associated with the Melbourne Volcanics (alkali-basalt to trachyte-rhyolite) of the McMurdo Igneous Complex. However, this mineral group (biotite/nontronite) is also moderately detected with the Granite Harbour granodiorite and granite, the Priestley Schist and migmatite gneiss. Chlorite is mainly identified with the Granite Harbour granodiorite and granite exposures. Glauconite/vermiculite is mapped in the scree and glacial drift (Figure 8B).
Endmember spectra extracted from ASTER TIR bands for the Campbell Glacier (II) is presented in Figure 8C. n-D class #1 exhibits emission features at 8.7 μm (equivalent to band 11), which can be attributed to strong Si-O bond and Al-OH phyllosilicates. This characteristic coincides with the mapped occurrences of the Priestley Formation, the Priestley Schist and the migmatite gneisses (Wilson Metamorphic Complex) and some parts of Granite Harbour granodiorite and granite (Figure 8D). n-D class #2 shows strong emission features about 9 μm that centered on band 12 (see Figure 8C). Felsic lithologies consisting quartz, feldspars and Al and Fe-OH phyllosilicates such as the Granite Harbour granodiorite and granite and the Wilson Metamorphic Complex can be considered for n-D class #2. n-D class #3 represents emission minima at 8.7 μm and 10.15 μm (equal to bands 11 and 13), which can be attributed to intermediate to mafic lithologies and Fe, Mg-rich phyllosilicates (see Figure 8C). Accordingly, the Melbourne alkali-basalt to trachyte-rhyolite exposures and biotite/nontronite/chlorite are identified. However, the Granite Harbour granodiorite and granite is also fairly mapped (Figure 8D). n-D class #4 shows strong emission features about 10.60 μm (centered on band 13), which are attributed to basic/mafic lithologies and Mg-rich phyllosilicates. Hence, antigorite/serpentine/talc/glauconite/vermiculite can be considered for this class, which are mapped associated with moraines, crevasse fields, scree and glacial drift (Figure 8D). n-D class #5 displays emission minima at 8.7 μm and 10.6 μm equal to bands 11 and 13. Intermediate to mafic and lithologies and Al-OH and Mg-OH phyllosilicates could be correlated with the emission features. As a result, the Granite Harbour granodiorite and granite and the Wilson Metamorphic Complex and some parts of the Melbourne Volcanics are mapped (Figure 8D). n-D class #6 does not show any emission feature (see Figure 8C).

4.2. Identification of Phyllosilicates Using the CEM Algorithm

The CEM classification mineral map for the Mesa Range scene derived from VNIR+SWIR and TIR bands is shown in Figure 9A,B, respectively. Please note that the CEM fraction images giving the same spatial distribution of certain minerals or mineral groups were assigned to the only one-color class. Antigorite, glauconite and serpentine are mapped in the scree, glacial drift and moraine (Figure 9A). Chlorite and biotite are broadly identified in the Granite Harbour granodiorite and granite exposures. Muscovite and kaolinite are mainly mapped associated with the Kirkpatrick Basalt and the Ferrar Dolerite (Figure 9A). Illite, dickite, pyrophyllite, nontronite, phlogopite and talc are slightly detected in poorly exposed lithologies especially in the north-eastern part of the scene (Figure 9A). Figure 9B shows the strong spatial distribution of muscovite, chlorite and serpentine in the Harbour granodiorite and granite, the Kirkpatrick Basalt and the Ferrar Dolerite. Antigorite and nontronite are mainly identified associated with the scree, glacial drift and moraine in the Mesa Range (Figure 9B).
Figure 10A displays the CEM classification mineral map for the Campbell Glacier (I) scene derived from VNIR+SWIR bands. Antigorite, chlorite and serpentine are found in the scree, glacial drift, moraine and crevasse fields. Muscovite, kaolinite, pyrophyllite and dickite are mostly mapped in the areas consisting of Kirkpatrick Basalt, Ferrar Dolerite and the Beacon Supergroup. However, they can be partially seen in the Granite Harbour granodiorite and granite and the Wilson Metamorphic Complex. Biotite is identified in some exposures of the Kirkpatrick Basalt and the Ferrar Dolerite. Glauconite/illite/nontronite/phlogopite is detected in the Granite Harbour granodiorite and granite exposures especially at Archambault Ridge and adjacent to the Recoil and Harper Glaciers. Talc is found with the Wilson Metamorphic Complex and some parts of the Kirkpatrick Basalt and the Ferrar Dolerite (Figure 10 A). The CEM classification mineral map for the Campbell Glacier (I) scene derived from TIR bands (Figure 10B) shows antigorite and serpentine in the scree, glacial drift, moraine and crevasse fields, muscovite and chlorite in the Kirkpatrick Basalt, the Ferrar Dolerite and the Granite Harbour granodiorite and granite (Figure 10B). Spatial distribution of nontronite is very low and can be seen in most lithological units exposed in the Campbell Glacier (I) region.
The CEM classification mineral map derived from VNIR+SWIR bands for the Priestley Glacier is shown in Figure 11A. Antigorite, chlorite, glauconite and serpentine are mapped in the Priestley Glacier moraine, the Kirkpatrick Basalt, the Ferrar Dolerite, and the Priestley Formation. Illite, dickite, kaolinite, muscovite, pyrophyllite and phlogopite and nontronite are mostly mapped associated with the Priestley Formation and Priestley Schist. Biotite is strongly identified in the Granite Harbour granodiorite and granite. Talc is found with the Priestley Glacier moraine and glacial drift (Figure 11A). In the CEM classification mineral map derived from TIR bands, antigorite is identified in the Priestley Glacier moraine, and muscovite, chlorite and serpentine are found with the Granite Harbour granodiorite and granite, the Priestley Formation and Priestley Schist and the Kirkpatrick Basalt, the Ferrar Dolerite (Figure 11B). Nontronite is weakly detected in the Priestley Glacier moraine.
For the Campbell Glacier (II), the CEM classification mineral map derived from VNIR+SWIR bands (Figure 12A) shows the presence of antigorite, chlorite, glauconite and serpentine with moraines of the Priestley Glacier and the Campbell Glacier and crevasse fields. Muscovite, kaolinite, pyrophyllite, illite, dickite are mapped associated with the Priestley Formation, the Priestley Schist and migmatite gneiss. Biotite is typically detected in the Granite Harbour granodiorite and granite exposures and in the Melbourne Volcanics especially in the Mt. Melbourne region. Nontronite is mostly found with the Melbourne Volcanics exposures. Talc and vermiculite are identified in the Melbourne Volcanics particularly near Wood Bay and in the scree and glacial drift adjacent to the Granite Harbour granodiorite and granite. Phlogopite is mapped associated with the Harbour granodiorite and granite and the Melbourne Volcanics exposures (Figure 12A). The CEM classification mineral map derived from TIR bands (Figure 12B) indicates that antigorite and serpentine in the moraines and crevasse fields, muscovite with the Wilson Metamorphic Complex and the Granite Harbour granodiorite and granite and biotite, nontronite and chlorite associated with the Melbourne Volcanics and the Granite Harbour granodiorite and granite.

4.3. Evaluation of the Mineralogical Content Derived from Image Analysis

In this study, the error matrix (confusion matrix) and Kappa Coefficient are computed for evaluating the results (mineralogical content) derived from the MTMF classification mineral maps versus detected pixel spectra/emission by the CEM algorithm. Al-rich (kaolinite, muscovite, dickite, pyrophyllite and illite), Fe3+-rich (glauconite and nontronite), Fe2+-rich (biotite and vermiculite) and Mg-rich (antigorite, chlorite, serpentine, talc and phlogopite) phyllosilicates are considered to be four main classes herein. Pixels with high MF score (MTMF outputs) and high fractional abundance (CEM outputs) attributable to the main classes of phyllosilicates are allocated to calculate error matrix and Kappa Coefficient. For each class, 100 pixels derived from VNIR+SWIR and TIR bands of ASTER are carefully chosen and evaluated, respectively (Table 3 and Table 4).
Table 3 shows the error matrix for the MF score images versus the CEM fraction images derived from VNIR+SWIR bands of ASTER. The overall accuracy of 61% and the Kappa Coefficient of 0.48 are calculated. The producer’s accuracy of 78% and user’s accuracy of 83% are recorded for the Al-rich phyllosilicates, which are the highest among the other classes. Conversely, the lowest producer’s accuracy (47%) and user’s accuracy (49%) are assessed for the Fe3+-rich phyllosilicates class. The Fe2+-rich class shows the producer’s accuracy of 54% and user’s accuracy of 60%. The producer’s accuracy and user’s accuracy for Mg-rich class are 65% and 54%, respectively (Table 3). The statistical results indicate that the spectral mixing and confusion between Fe3+-rich, Fe2+-rich and Mg-rich phyllosilicates are higher than Al-rich phyllosilicates using VNIR+SWIR bands of ASTER. Accordingly, Al-rich phyllosilicates class pixels are strongly discriminated by the MTMF and CEM algorithms. The pixels attributed to Fe3+-rich class, Fe2+-rich and Mg-rich phyllosilicates classes contain some spectral mixing due to their subtle spectral differences in the VNIR+SWIR bands of ASTER, particularly for the Fe3+-rich and Mg-rich classes. In fact, moderate rate of overall accuracy (61%) and Kappa Coefficient (0.48) are obtained using VNIR+SWIR bands of ASTER because of resembling spectral signatures of mafic phyllosilicates (Fe3+-rich, Fe2+-rich and Mg-rich classes).
The overall accuracy and Kappa Coefficient assessed for TIR bands of ASTER are 64% and 0.52, respectively (Table 4). The Al-rich phyllosilicates class contains the highest producer’s accuracy (86%) and user’s accuracy (91%). The Mg-rich phyllosilicates class has the lowest producer’s accuracy (50%) and the Fe3+-rich class shows the lowest user’s accuracy (55%). The producer’s accuracy of 66% and 54% are calculated for Fe3+-rich class and Fe2+-rich class, respectively. The user’s accuracy of 56% is evaluated for both classes of Mg-rich and Fe2+-rich phyllosilicates (Table 4). Analyzing the results show that a high level of confusion is associated with mafic phyllosilicates pixels (Fe3+-rich, Fe2+-rich and Mg-rich classes). However, felsic phyllosilicates (Al-rich class) pixels are well mapped. The higher overall accuracy and Kappa Coefficient computed for TIR bands than VNIR+SWIR bands indicates more robust discrimination of felsic phyllosilicates and mafic phyllosilicates using TIR bands of ASTER. However, a robust spectral mixing effect between mafic phyllosilicate classes is obviously acquired for TIR bands.

4.4. Field Occurrences and Mineralogy of the Exposed Bedrock in the Study Area

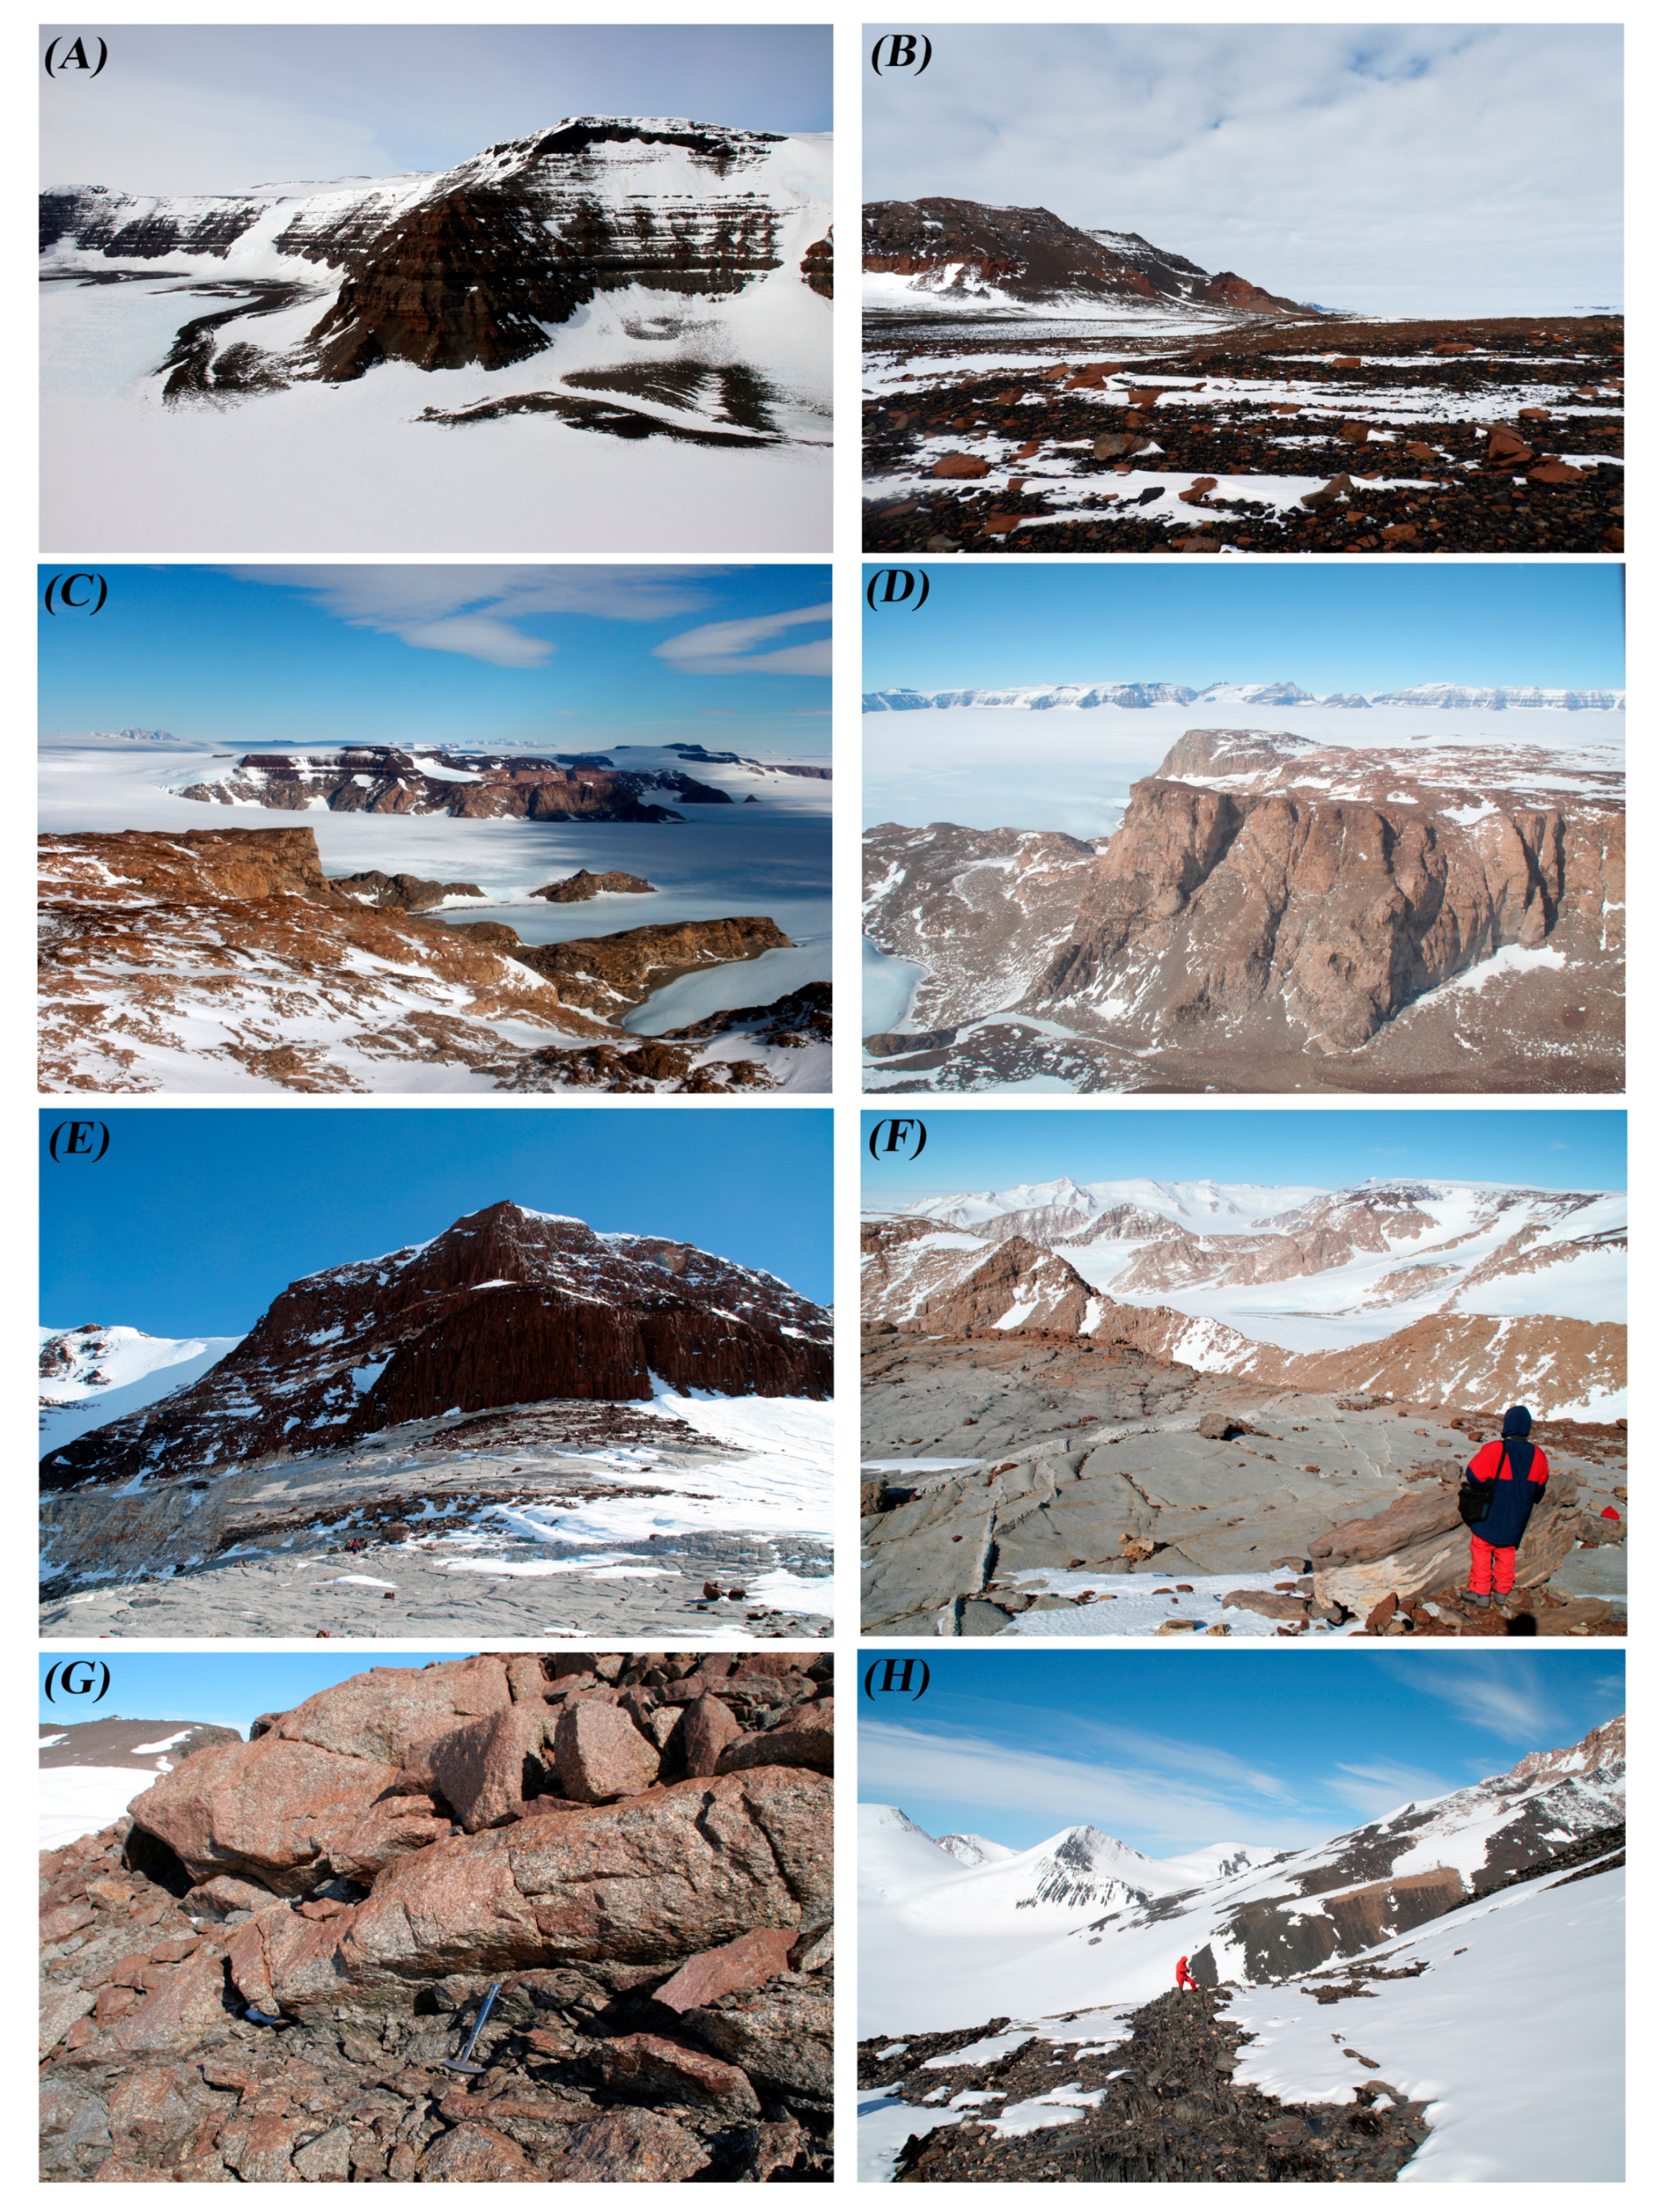
4.4.1. Field Occurrences

The “Mesa Range area” is situated at the head of the Rennick Galcier and the Campbell Glacier. It is composed of a group of flat mesas (with the main Pain and Tobin Mesas; see Figure 1) and to the west by the Illusion Hills, the Vantage Hills and the Lichen Hills with a steep escarpment facing to the NE (see [106] for a thorough geomorphological description of the area). The bedrock geology in the Mesa Range is characterized by decameter thick sequences of basaltic lavas (Kirkpatrick Basalt Group and Ferrar Dolerite sills) including pillows, lava flows, sills and layers of breccias (Figure 13A). The Tobin Mesa and Gair Mesa are surrounded by large (2–5 km) fields of glacial deposits (e.g., scree, debris, till and moraine), which originated mainly from the surrounding lithologies and show various degrees of hydrothermal alteration, deuteric alteration and weathering (Figure 13B). The Lichen Hills are composed of basaltic rocks (Kirkpatrick Basalt and Ferrar Dolerite) associated with flat-lying continental or nearshore sedimentary rocks of the Beacon Supergroup on top of peneplained outcrops of Granite Harbour granitoids including rafts of Priestley Schists of the Wilson Metamorphic Complex (Figure 13C). On the top tabular summit of Lichen Hills, erratic blocks of granite occur on top of weathered basalts and dolerite (see also [106]) (Figure 13D).
The “Campbell area” (see Figure 1) comprehends the northern portion of the 110 km long Campbell Glacier that cuts into large and massive mountains mainly consisting of Granite Harbour granitoids, including minor septa of Priestley schists. The Paleozoic rocks are topped by flat-lying sedimentary rocks of the Beacon Supergroup and lavas of both Kirkpatrick Basalt Group and Ferrar Dolerite (Figure 13E,F). The Campbell Galcier stream is characterized mainly by snow drift. The “Priestley area” (see Figure 1) contains the Priestley Glacier, one of the major and most prominent glaciers of northern Victoria Land (ca. 96 km long and 8 km wide) and the southern part of the Campbell Glacier. The Priestley Glacier cuts through mountains mainly consisting of Granite Harbour granitoids and Wilson Metamorphic Complex metasedimentary rocks, unconformably topped by Ferrar Dolerite and Beacon sedimentary rocks (Figure 13 G,H). The granitoids of the Granite Harbour Intrusives frequently contain mafic endmembers (e.g., tonalite and diorite) (see Figure 13G). The southern Campbell Glacier cuts through various lithologies of the Wilson Metamorphic Complex (see Figure 13H). On the western shoulder of the glacier, the main lithologies are low- to high- grade schists, migmatite, charnockite and granitoids. On the eastern shoulder to the north, lithologies are dominantly granitoids and subordinate metamorphic units, and to the south, Cenozoic lavas and tephra of the McMurdo Volcanics. The Priestley Glacier stream contains numerous crevasses and large areas with blue ice as it is frequently subjected to strong katabatic winds from the Polar Plateau; till deposits and debris are mainly located at the border of the glacier as lateral moraines.

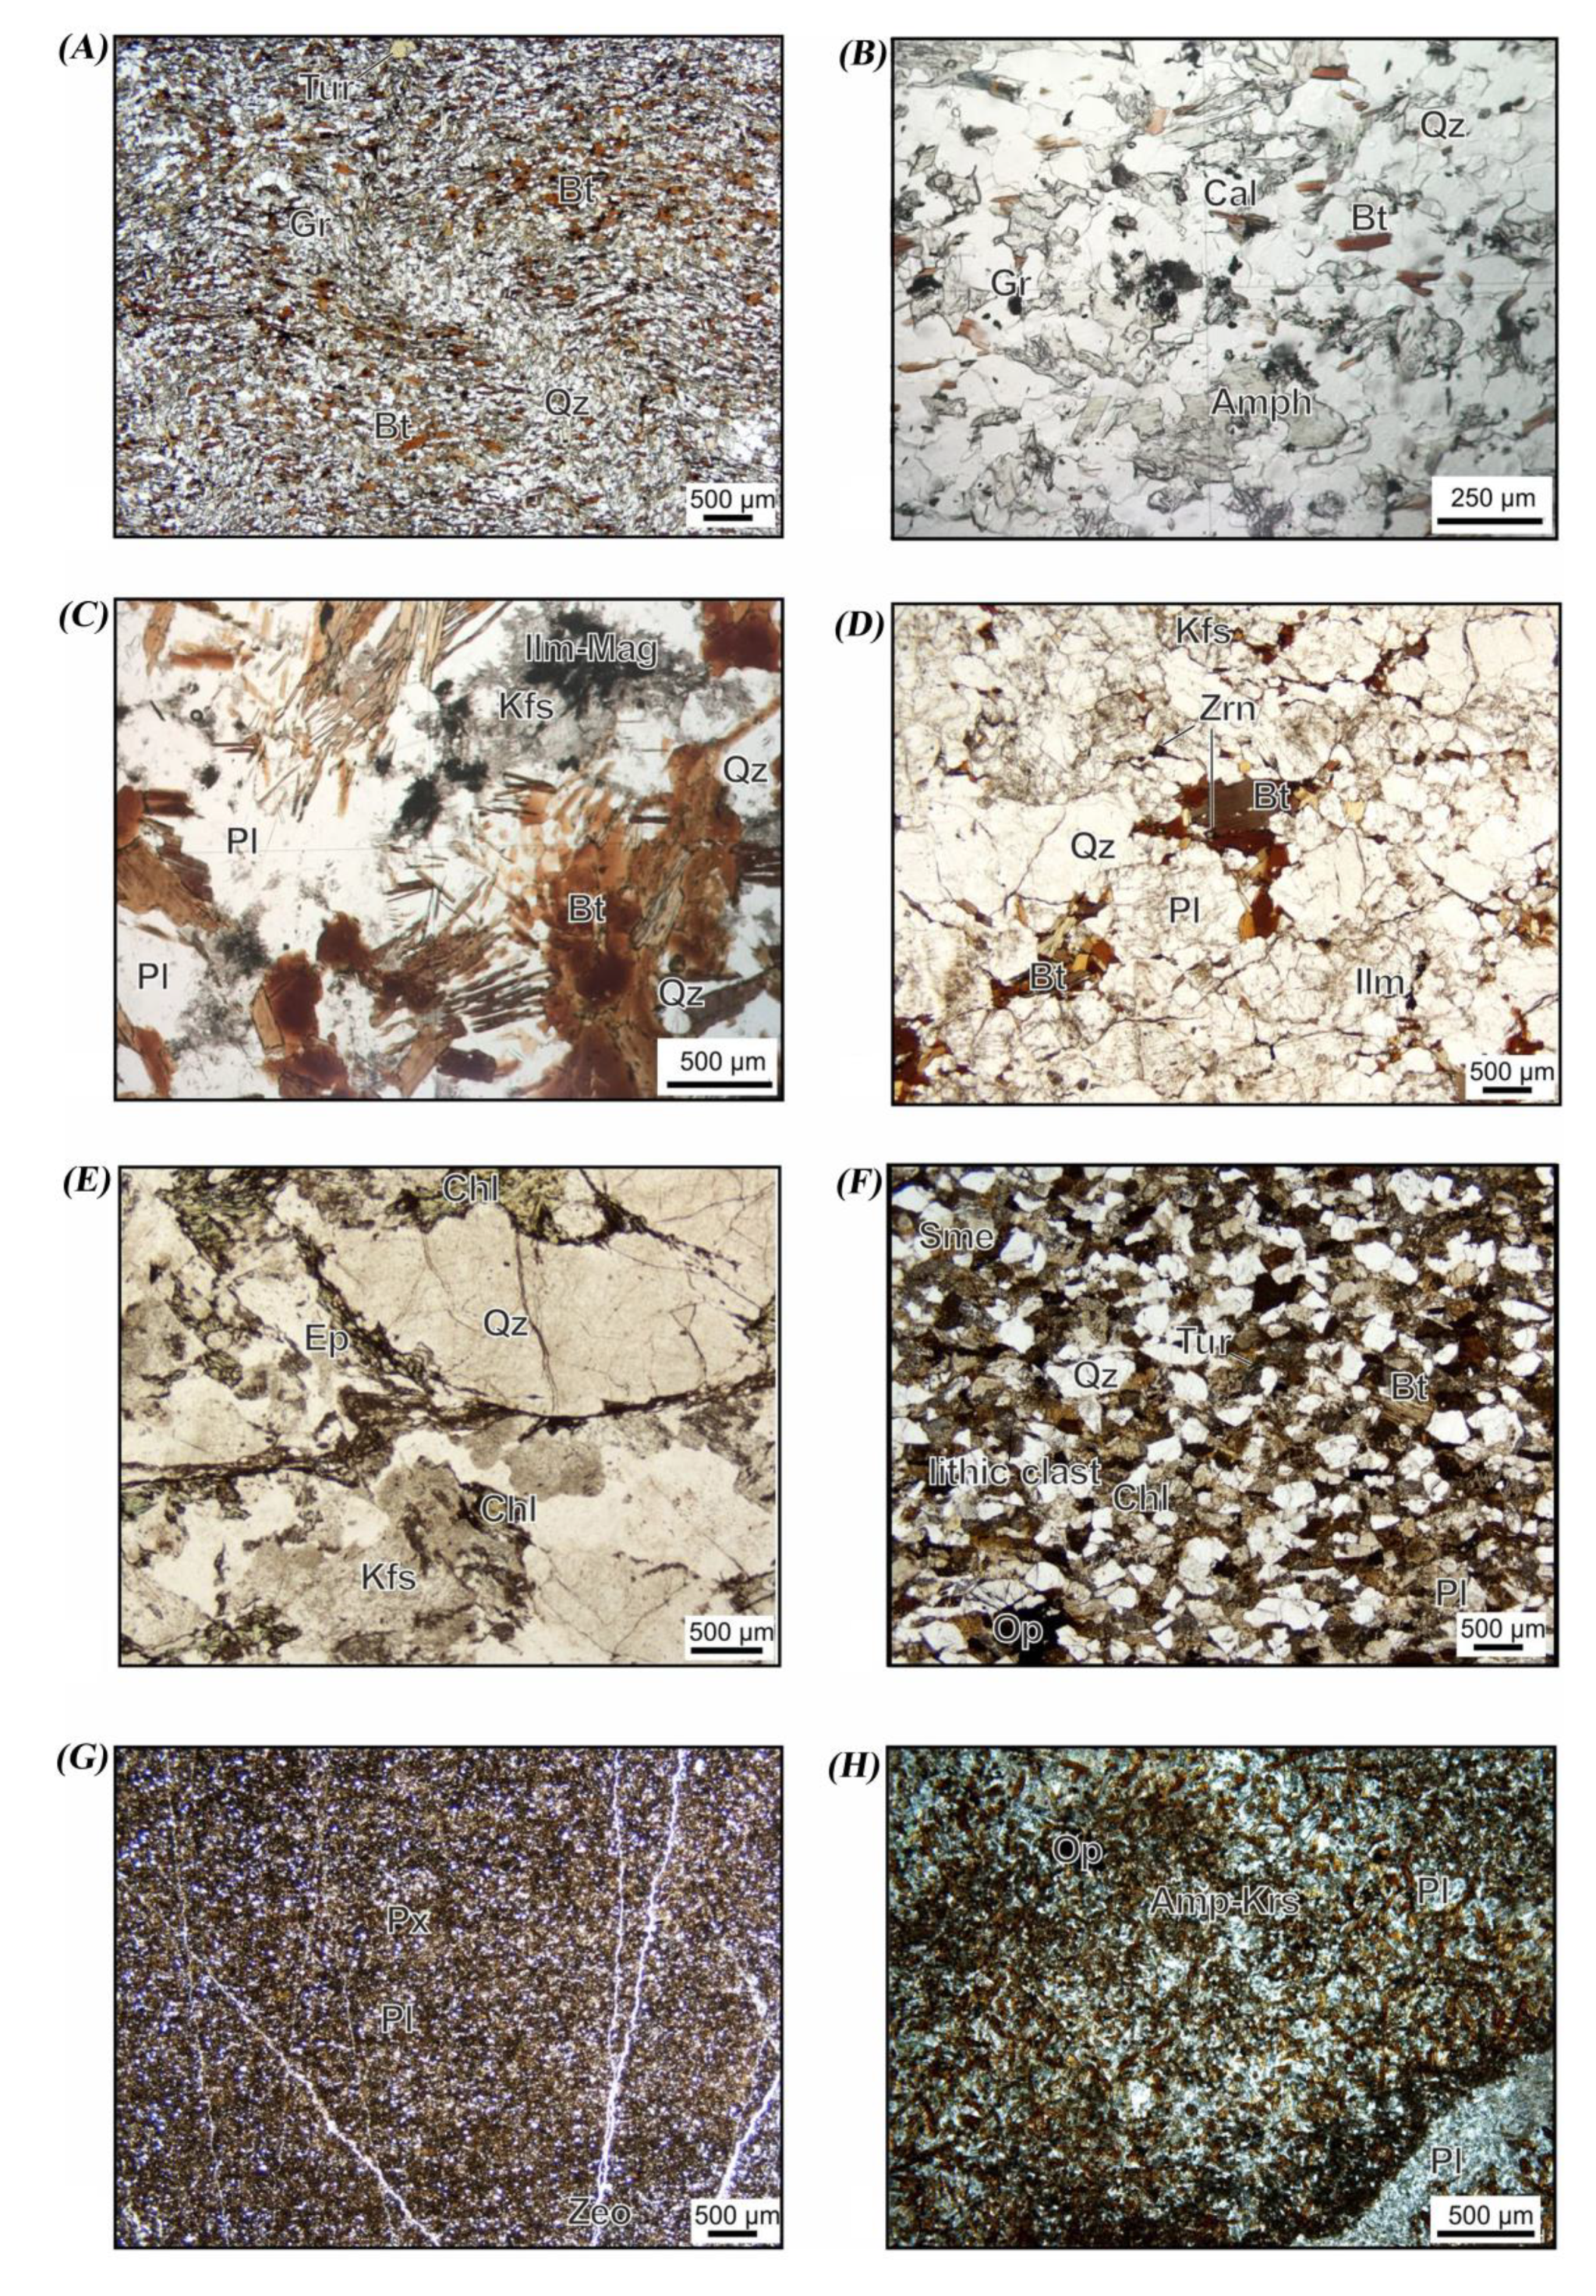
4.4.2. Mineralogy of the Exposed Rocks

The main mineralogical assemblages of the rocks in the survey areas are described herein. Petrographic study of thin sections and XRD analysis indicate the transformation of primary minerals such as alkali feldspars, plagioclase feldspars, pyroxenes, olivines, micas, and amphiboles to secondary altered minerals such iron oxide/hydroxides, sericite, chlorite, kaolinite, illite, smectite, epidote, zeolites, talc, rutile, calcite, ankerite, siderite, pinite, green biotite and hornblendes. Table 5 shows some selected GPS points and mineral components derived from XRD analysis for representative altered rock samples. Figure 14A–H shows thin sections of main lithological units exposed in the study zones.

Wilson Metamorphic Complex

The Wilson Metamorphic Complex covers wide areas on both sides of the Priestley Glacier and in the Priestley-Campbell Glacier divide, minor bodies are in the basement in the Mesa Range region. It is subdivided into (i) the greenschist-facies Priestley Formation (ii) the amphibolite-facies Priestley Schist and (iii) often retrogressed high-grade migmatitic to granulitic gneisses [68]. The Priestley Formation occurs particularly on the south-western side of the upper Priestley Glacier, and some scattered outcrops exist east of the Campbell Glacier between Vulcan Hills and Styx Glacier in the Southern Cross Mountains further north (see Figure 1). The Priestley Schist occupy wide areas of the Deep Freeze Range along the whole north-eastern margin of the Priestley Glacier far south as Browning Pass as well as on its southern margin south-east of Mt. Baxter-Eskimo Point (see Figure 1).
The Priestley Formation comprises low-grade metamorphic calcareous and siliciclastic silt- and sandstones and greywackes and black-colored, graphite- and pyrite-bearing pelitic argillites, intercalated by marble and quartzite (for further explanation see also: [47,107]). The most common metapelites varieties contain dominantly quartz, biotite and muscovite with variable amounts of plagioclase, chlorite, minor garnet, cordierite and carbonate, sulfide (pyrite), and the accessories tourmaline, zircon, apatite, opaque minerals and allanite (see also [107]). Schistose quartzites contain dominantly quartz and minor amounts of plagioclase, k-feldspar, muscovite, chlorite, biotite and accessory zircon, tourmaline, apatite, and opaque minerals (Figure 14A). Fe-rich carbonates (e.g., ankerite, siderite) may occur in bands and veins or secondary minerals.
The Priestley Schist comprise predominantly hornblende and garnet-bearing biotite mica-schist (Figure 14B) and quartz-biotite paragneiss (Figure 14C) with intercalations of quartzites, marble (with scapolite, epidote, diopside and chondridite), calc-silicates and amphibolites (see also [68]). The mineral assemblages of the schists contain quartz, biotite, muscovite, plagioclase, k-feldspar, minor garnet, cordierite, andalusite, sillimanite and staurolite; accessories are zircon, apatite, tourmaline, allanite, rutile and opaque minerals (including magnetite, graphite and sulfide minerals). Intercalated amphibolites consist of clinoamphibole, diopside and minor garnet and biotite, all in a fine-grained groundmass of sometimes sericitized plagioclase and minor quartz, and in places calcite and chlorite; accessories are sphene, apatite, rare allanite and opaque minerals (see also [107]). Minor quartzites, carbonate schists and calcsilicate rocks, which are intercalated with the schists, consist of variable amounts of quartz, plagioclase, calcite, biotite and muscovite as well as calcsilicate minerals (diopside, garnet, amphibole, sphene, clinozoisite) in the carbonate schists. Migmatitic to subordinate agmatitic gneisses and hornblende gneisses with locally preserved granulitic relicts and alternating with biotite schist and gneiss, amphibolite and calcsilicate rocks occur in the target areas along the western margin of Campbell Glacier. The rocks contain biotite, quartz and plagioclase varying amounts of k-feldspar, garnet, cordierite, sillimanite; zircon, apatite, monazite, ilmenite, pyrrhotine and graphite as accessories. Secondary alteration products usually are chlorite, rutile, muscovite, pinite and green biotite (see also [66]).

Granite Harbour Intrusives

The Granite Harbour Intrusives represent a calc-alkaline suite of granites, granodiorites, diorite, tonalites and subordinate gabbros, which intrude metamorphic basement and can contain abundant metasedimentary rafts and different dykes of variable thicknesses like, aplites, pegmatites and leucogranites or lamprophyres (e.g., [57,109]). In the survey area, granodiorites and granites are the main plutonic rocks (see Figure 1 and Figure 13 C–G). Foliated synkinematically emplaced gabbro-tonalite-diorite-granodiorite rocks occur in the Boomerang Glacier region in the Priestley-Campbell Glacier divide as well as on the southern margin of Priestley Glacier, e.g., at Nash Ridge and Simpson Craggs in the Eisenhower Range.
The Granite Harbour granitoids contains variable amounts of k-feldspar, plagioclase and quartz, the main mafic phases are biotite, dominant, and hornblende (Figure 14D). Peraluminous felsic types contains two micas (e.g., biotite and muscovite) with occasionally garnet, tourmaline and chlorite. Common accessory minerals are zircons and epidote (allanite); chlorite, epidote and sericite are mostly present as secondary phases in altered or deformed zones (Figure 14E).

Beacon Supergroup

The main lithologies of the Beacon Supergroup comprise fluvial-lacustrine conglomerates and quartz-rich, arkosic and litharenitic sandstones with intercalations of siltstones, claystones and coal and locally glacial diamictites at the base (e.g., [110,111]). Apart from the basal diamictites, the mineralogy of the sandstones (Figure 14F) comprises quartz, k-feldspar, plagioclase, lithic rock fragments (including altered, illite-rich grains), muscovite, biotite (some completely altered to halloysite or kaolinite), chlorite (often as secondary hydrothermal-diagenetic alteration product of biotite) and heavy minerals (dominated by zircon, apatite, garnet and tourmaline) (Figure 14F). Authigenic minerals include quartz, calcite and zeolite (e.g., laumonite and heulandite) cements, feldspar overgrowths, clay minerals (kaolinite, illite, illite-smectite mixed phases) and chlorite in the basal diamictites were also documented [112,113]. The stratigraphically highest part of the Beacon Supergroup consists of up to 50 m thick fluvially reworked tuffaceous sandstones and siltstones with abundant silicic glass shards, quartz and feldspar [63]. These rocks occur primarily in the Deep Freeze Range, Southern Cross Mountains north of the Priestley Glacier and Mesa Range.

Ferrar Supergroup

The Jurassic Ferrar Supergroup comprises basaltic-andesitic lava flows (Kirkpatrick Basalts) and intrusive rocks (Ferrar Dolerite) with minor sedimentary and volcanogenic interstratifications (see also [114] and references therein). The Kirkpatrick Basalts are particularly well exposed in the Mesa Range, represent a sequence of up to 1000 m thick multiple lava flows that are locally underlain by epiclastic to volcaniclastic deposits and crosscut by volcaniclastic diatremes formed by phreatomagmatic events (see also [113,114]). These silicic tuffites contain mostly silicic shards, quartz, feldspar, orange glass (sideromelane and palgonitized sideromelane), and scattered broken grains of pyroxene, amphibole, chlorite, zircon and apatite and tuffitic/basaltic megaclasts (Figure 14G). Fine to very fine-grained secondary clay minerals are present as well (e.g., smectite and illite). Secondary alteration minerals are present in amygdales, vesicles and cavities in the Kirkpatrick Basalts and mainly represented by zeolite (such as apophyllite, stilbite, mesolite, heulandite, scolecite), micro- to cryptocrystalline varieties of quartz, calcite, chlorite, smectite and chlorite-smectite mixtures (e.g., see also [114]). Iron oxides/hydroxide are common secondary alteration minerals within fractures or in samples from tills and soils.
The Ferrar Dolerite appear in the field as some tens to a few hundred meters thick massive sills and subordinate dykes, usually intruding the sedimentary rocks of the Beacon Supergroup and the upper levels of the granitic basement (see Figure 13E). The Ferrar volcanic rocks show a common tholeiitic mineralogical composition of predominantly various pyroxenes (e.g., orthopyroxene, pigeonite, augite), plagioclase, opaque minerals (mostly magnetite-ilmenite) and occasionally (often altered) olivine embedded in a fine-grained matrix of plagioclase, pyroxene and/or glassy groundmass. Intergrowths of feldspar and quartz are present particularly in coarser-crystalline varieties. Recent studies of Ferrar Dolerite (Beacon Valley, Antarctica) revealed the occurrence of oxidative weathering processes that affect the surface of the dolerite [39].

McMurdo Igneous Complex

In the survey area, the McMurdo Igneous Complex is represented by basic dykes of the Meander Intrusives and the more widely distributed products (lavas, dykes, pyroclastics and tephra) of the Melbourne Volcanics, particularly in the vicinity of the Mt. Melbourne eruption center or the Southern Cross volcanic field (e.g., see also [57]). Meander dykes and dyke swarms of bimodal composition (mainly alkaline-basalt-hawaiite-tephrite, subordinate trachyte-rhyolite) with thicknesses of <1 m to 5 m and locally 10 m (felsic varieties up to 50 m) crosscut the basement rocks particularly along Campbell Glacier up to Navigator Nunatak and Random Hills. The mafic varieties contain phenocrysts of olivine, calcic titanium bearing hornblend (kaersutite) and plagioclase in a groundmass of plagioclase, Ti-hornblende, magnetite and minor biotite and sanidine. Alteration products are mainly calcite, sericite, chlorite and actinolite (Figure 14H). The felsic dykes consist of phenocrysts of sanidine or anorthoclase, quartz, biotite and Na-rich amphibole in a silicic fine-grained matrix with talc and possibly jarosite as secondary products (e.g., [57]). The strongly differentiated rocks of the Mt. Melbourne volcanic field are represented mainly by represent alkali basalts that have abundant phenocrysts of plagioclase and variable amounts of olivine and Ti-augite, and plagioclase-free basanites consist of olivine, Ti-augite phenocrysts and occasionally kaersutitic hornblende and contain abundant xenoliths of gabbronoritic composition. Intermediate rocks are relatively poor in phenocrysts and may contain olivine, plagioclase, clinopyroxene and magnetite (see also [115]).

5. Discussion

The main lithological units in the study area represent igneous and various metamorphic basement rocks of the Granite Harbour Intrusives (granites, granodiorites, diorite, tonalite and gabbro) and the Wilson Metamorphic Complex (metasedimentary rocks, amphibolites, gneisses and migmatites), continental sedimentary cover rocks of the Beacon Supergroup (sandstones, siltstones and orthoquartzites), the Jurassic and Cenozoic volcanic rocks of Ferrar Supergroup and Melbourne Volcanics and the Neogene glacial deposits [41,57,66,67,68]. The alteration of these lithological units has resulted in mineralogical variations associated with exposed outcrops and scree/till/moraine materials and particularly influenced the formation and distribution of phyllosilicates in the Antarctic environment. The phyllosilicates such as illite and chlorite are the most common phyllosilicate types in the hyper-arid conditions of cold environments (e.g., the Antarctic, Arctic and Mars), and can directly be related to parent lithologies in the region [12]. Furthermore, the oxidation of Fe2+ to Fe3+ produce alteration products in response to the oxidizing Antarctic environment [39,40].
The presence of four groups of phyllosilicates (Al-rich, Fe3+-rich, Fe2+-rich and Mg-rich) associated with lithological units in the study zones was evaluated using VNIR+SWIR and TIR bands of ASTER satellite data in this investigation. Al-rich (kaolinite, muscovite, dickite, pyrophyllite and illite) phyllosilicates were mostly detected in exposed outcrops of the Granite Harbour granitoids, Wilson Metamorphic Complex, Kirkpatrick Basalt, Ferrar Dolerite and Beacon Supergroup. The alteration products of primary feldspars within the Granite Harbour granitoids and Wilson Metamorphic Complex and detrital clay minerals within the Beacon Supergroup can be considered for the spectral properties related to Al-rich phyllosilicates. For the Kirkpatrick Basalt and Ferrar Dolerite, the spectral confusion between Fe-OH (jarosite as alteration products of iron-rich minerals such as pyroxenes) and Al-OH absorption features might be pondered. Hence, high content of detrital clay minerals (Al-rich phyllosilicates) can be mapped in this zone.
Fe3+-rich (glauconite and nontronite) and Fe2+-rich (biotite and vermiculite) phyllosilicates were typically mapped associated with the Granite Harbour granitoids, Wilson Metamorphic Complex, Ferrar Dolerite and Melbourne Volcanics. Furthermore, these phyllosilicates were also occasionally detected in the Kirkpatrick Basalt and the scree, glacial drift and moraine. However, there is no report of glauconite in any of the rocks constituting in the geology of the study area primarily owing to their petrogenesis, metamorphic grades or sedimentary paleoenvironments. Glauconite is a low weathering resistance mineral, which usually forms and almost exclusively in marine environments. It easily alters to biotite-rich deposits or layers containing kaolinite, Fe hydroxides and silica [12]. During very low-grade metamorphism, it may be transferred to biotite. Glauconitic illite and glauconitic smectite may also occur as a replacement of clayey marls and claystones in non-marine and epithermal hypersaline-lacustrine environments, where they possibly developed as a result of the alteration of detrital illite-montmorillonite clay (e.g., [116]). In fact, lacustrine environments are described for the Beacon Supergroup [63]. Glauconite-Fe-illite-Fe-smectite mixed-layer minerals can also form by diffusion processes during sedimentation, compaction and cementation during burial of the rocks and over a considerable amount of time [117].
Furthermore, authigenic smectite formation within diamictites is documented in the Cape Roberts Drill Core recovered from the Ross Sea, where the material derived from the Ferrar volcanic sources [118]. Accordingly, a mixture of chemically variable layers of phyllosilicates or other altered minerals with compositions that resemble the spectral characteristic of glauconite can be considered to be a possible explanation for glauconite-specific spectra. This again supports the presence of mixed-layer phyllosilicate minerals such as muscovite/biotite with or without chlorite or the corresponding clay minerals illite, smectite or kaolinite and their characterization as glauconite/illite and or smectite that received a higher input of Fe3+ from alteration and decomposition of the bedrock. Nontronite, for instance, is an Fe-rich smectite, which can be found associated with altered basalt and basaltic glass [12]. Hence, the smectite group would be a more likely candidate for these detected spectra in the Antarctic environment of northern Victoria Land, because it fits well the surrounding geology and generally derives from weathering and decomposition of volcanic/igneous rocks that are in fact abundantly present in the area.
Biotite can be found in different geological environments and various lithological units for instance granite, granodiorite, diorite and norite [12]. Vermiculite is an irregular mixed-layer phyllosilicate, which normally forms in temperate-humid climates associated with poorly crystalline smectite [12]. In northern Victoria Land, the presence of biotite is reported the exposed outcrops of the Granite Harbour granitoids, Wilson Metamorphic Complex and Melbourne Volcanics. Mg-bearing smectites are produced by weathering of rocks of mafic composition, while Al- and Fe-bearing smectites form by alteration of acidic and Fe-rich basaltic rocks [12]. Alteration of tuffs and volcanic ash (in the presence of Mg) and basic feldspathic rocks (rich in Ca and Na) produce montmorillonite [12]. For that reason, vermiculite detected in the Campbell Glacier (II) might be montmorillonite or a mixture of poorly crystalline smectites.
Mg-rich (antigorite, chlorite, serpentine, talc and phlogopite) phyllosilicates were broadly identified in the scree, glacial drift, moraine and crevasse fields. Serpentines form in altered ultrabasic rocks comprising pyroxene and forsterite during hydrothermal alteration or sedimentary processes [12]. Hydrothermal alteration or low-temperature metamorphic product of olivine or Mg pyroxenes in saturated and ultramafic rocks can be antigorite/chrysotile [119]. Hydrothermal alteration and thermal metamorphism of the Kirkpatrick Basalt coinciding with the separation of Australia from Antarctica during the Cretaceous is documented [61]. Given that, the presence of antigorite, serpentine and talc could be feasible through weathering and decomposition of the Kirkpatrick Basalt and Ferrar Dolerite. Chlorite was generally mapped with the exposed outcrops of Granite Harbour granodiorite and granite and partially detected in the Ferrar Dolerite, the Kirkpatrick Basalt and the Priestley Formation and Priestley Schist. Contact hydrothermal and regional metamorphism of mafic (ferromagnesian) minerals produce chlorite in igneous rocks. Chlorite can also be formed in sedimentary environments through the destabilization of smectite and kaolinite under reducing conditions [120]. Consequently, the alteration products of mafic minerals within the Granite Harbour granodiorite and granite, the Kirkpatrick Basalt and the Ferrar Dolerite can be deliberated for chlorite. Sedimentary environments (reduction conditions) contain smectite and kaolinite and consequence alteration might be the source of chlorite in the Priestley Formation and Priestley Schist. Finally, the spatial distribution of Al-rich, Fe3+-rich, Fe2+-rich and Mg-rich phyllosilicates in the study zones is depicted in ASTER mosaic image-maps. Figure 15 shows mosaic phyllosilicates image-map of the Mesa Range, Campbell and Priestley Glaciers derived from VNIR+SWIR and TIR bands of ASTER. Evaluation of the remote sensing results with field data using an error matrix (confusion matrix) approach and Kappa Coefficient shows a very good match, which indicates the overall accuracy of 78.33% and the Kappa Coefficient of 0.71, respectively (Table 6).

6. Conclusions

The ASTER data processing results in this investigation demonstrated that phyllosilicates could be spectrally detected in the remote and inaccessible exposed lithologies in the Antarctic environment of northern Victoria Land. Four main phyllosilicate groups, namely (1) Al-rich such as kaolinite, muscovite, dickite, pyrophyllite and illite, (2) Fe3+-rich, for example, glauconite and nontronite, (3) Fe2+-rich as biotite and vermiculite and (4) Mg-rich, for instance, antigorite, chlorite, serpentine, talc and phlogopite were particularly targeted in the of the Mesa Range, Campbell and Priestley Glaciers in northern Victoria Land of Antarctica. The spectral characteristics and emissivity features of the Al-rich phyllosilicates particularly at VNIR+SWIR and TIR bands of ASTER enabled the identification of the Granite Harbour granitoids, Wilson Metamorphic Complex and the Beacon Supergroup. Differentiating of Fe3+-rich and Fe2+-rich phyllosilicates was less successful due to their subtle spectral and emissivity differences in the VNIR+SWIR and TIR bands of ASTER. Nevertheless, smectites and biotite were detected in the Ferrar Dolerite, Kirkpatrick Basalts, Granite Harbour granitoids, Wilson Metamorphic Complex and Melbourne Volcanics. Mapping of the Mg-rich phyllosilicates in the scree, glacial drift, moraine and crevasse fields was irregular because of spectral features resembling Fe,Mg-OH in the VNIR+SWIR and TIR bands of ASTER and generally inadequate exposed rock outcrops. Weathering and decomposing of the Kirkpatrick Basalt and Ferrar Dolerite or other lithological units might be the source for the detected spectral/emissivity features. Conversely, it seems a possible link to the reflectance/emission equivalent to Fe,Mg-OH, or an “artifact” rather than a response to the altered minerals’ chemical composition. Chlorite (Mg-rich phyllosilicate) was mostly mapped in the exposures of Granite Harbour granodiorite and granite and partly detected in the Ferrar Dolerite, the Kirkpatrick Basalt, the Priestley Formation and Priestley Schist and the scree, glacial drift and moraine, which can be derived from the alteration of mafic minerals. This investigation has highlighted the capability of ASTER imagery for mapping and differentiating phyllosilicates, which can be extrapolated to poorly mapped or unmapped areas in the northern Victoria Land and other exposed regions of Antarctica.

Author Contributions

A.B.P. writing, preparation, software and analysis, validation; M.S. and O.R. editing, graphic and software; L.C. and A.L. writing, editing, performed experiments and field data collection and interpretation; Y.P. and J.K.H. supervision and satellite data; B.P. and M.H. editing; A.M.M. and M.S.H. and K.M. image processing analysis. All authors have read and agreed to the published version of the manuscript.

Funding

Publication fees has been waived by Remote Sensing for the Editorial Board of Remote Sensing, who is the first author (A.B.P.) of this manuscript.

Data Availability Statement

The data presented in this study are available on request from the corresponding author. The data are not publicly available due to their containing information that could compromise the privacy of research participants.

Acknowledgments

This work was supported by the Higher Institution Centre of Excellence (HICoE) Research Grant (Vote Number: 66928), awarded to the Institute of Oceanography and Environment (INOS), Universiti Malaysia Terengganu (UMT). We are also thankful to the Korea Polar Research Institute (KOPRI) research grant PE20230. We acknowledge the logistic support of the Italian National Antarctic Research Programme (PNRA), and the German GANOVEX (German Antarctic North Victoria Land Expedition) research programme of the Federal Institute for Geosciences and Natural Resources (BGR). L.C. acknowledges the financial support of the Italian PNRA2016_00040-REGGAE project. Solveig Estrada from BGR is acknowledged who kindly provided unpublished XRD data.

Conflicts of Interest

The authors declare no conflict of interest.

References

  1. Farmer, V.C. The layer silicates. In The Infrared Spectra of Minerals; Mineralogical Society: London, UK, 1974; pp. 331–363. [Google Scholar]
  2. Farmer, V.C.; Palmieri, F. The characterization of soil minerals by infrared spectroscopy. In Soil Components; Springer: Berlin/Heidelberg, Germany, 1975; pp. 573–670. [Google Scholar]
  3. Bailey, S.W. Structures of layer silicates. In Crystal Structures of Clay Minerals and Their X-ray Identification; Mineralogical Society: London, UK, 1980; pp. 1–124. [Google Scholar]
  4. Howie, R.A.; Zussman, J.; Deer, W. An Introduction to the Rock-Forming Minerals; Longman: London, UK, 1992; p. 696. [Google Scholar]
  5. Chamley, H. Clay Sedimentology; Springer: New York, NY, USA, 1989. [Google Scholar]
  6. Jackson, M.L. Frequency distribution of clay minerals in major soil groups as related to factors of soil formation. Clays Clay Miner. 1959, 6, 133–143. [Google Scholar] [CrossRef]
  7. Nagy, K.L. Dissolution and precipitation kinetics of sheet silicates. In Chemical Weathering Rates of Silicate Minerals; De Gruyter: Berlin, Germany, 1995; pp. 173–233. [Google Scholar]
  8. Velde, B. Clay Minerals: A Physico-Chemical Explanation of Their Occurrence; Elsevier: Amsterdam, The Netherlands, 1985. [Google Scholar]
  9. Bishop, J.L.; Pieters, C.M.; Edwards, J.O. Infrared spectroscopic analyses on the nature of water in montmorillonite. Clays Clay Miner. 1994, 42, 701–715. [Google Scholar] [CrossRef]
  10. Bishop, J.L.; Murad, E.; Dyar, M.D. The influence of octahedral and tetrahedral cation substitution on the structure of smectites and serpentines as observed through infrared spectroscopy. Clay Miner. 2002, 37, 617–628. [Google Scholar] [CrossRef]
  11. Bishop, J.L.; Madejova’, J.; Komadel, P.; Froeschl, H. The influence of structural Fe, Al and Mg on the infrared OH bands in spectra of dioctahedral smectites. Clay Miner. 2002, 37, 607–616. [Google Scholar] [CrossRef]
  12. Bishop, J.L.; Lane, M.D.; Dyar, M.D.; Brwon, A.J. Reflectance and emission spectroscopy study of four groups of phyllosilicates: Smectites, kaolinite-serpentines, chlorites and micas. Clay Miner. 2008, 43, 35–54. [Google Scholar] [CrossRef]
  13. Clark, R.N.; King, T.V.V.; Klejwa, M.; Swayze, G.A. High spectral resolution reflectance spectroscopy of minerals. J. Geophys. Res. 1990, 95, 12653–12680. [Google Scholar] [CrossRef] [Green Version]
  14. Hunt, G.R.; Ashley, R.P. Spectra of altered rocks in the visible and near-infrared. Econ. Geol. 1979, 74, 1613–1629. [Google Scholar] [CrossRef]
  15. Salisbury, J.W.; Walter, L.S.; Vergo, N.; D’Aria, D.M. Infrared (2.1–25 μm) Spectra of Minerals; Johns Hopkins University Press: Baltimore, MD, USA, 1991. [Google Scholar]
  16. Salisbury, J.W.; D’Aria, D.M. Infrared (8–14 gm) Remote Sensing of Soil Particle Size. Remote Sens. Environ. 1992, 42, 157–165. [Google Scholar] [CrossRef]
  17. Hunt, G.R.; Salisbury, J.W. Visible and near-infrared spectra of minerals and rocks, I, Silicate minerals. Mod. Geol. 1970, 1, 283–300. [Google Scholar]
  18. Burns, R.G. Mineralogical Applications of Crystal Field Theory; Cambridge University Press: Cambridge, UK, 1993. [Google Scholar]
  19. Mars, J.C.; Rowan, L.C. Spectral assessment of new ASTER SWIR surface reflectance data products for spectroscopic mapping of rocks and minerals. Remote Sens. Environ. 2010, 114, 2011–2025. [Google Scholar] [CrossRef]
  20. Pour, B.A.; Hashim, M. The application of ASTER remote sensing data to porphyry copper and epithermal gold deposits. Ore Geol. Rev. 2012, 44, 1–9. [Google Scholar] [CrossRef] [Green Version]
  21. Rajendran, S.; Nasir, S. ASTER capability in mapping of mineral resources of arid region: A review on mapping of mineral resources of the Sultanate of Oman. Ore Geol. Rev. 2019, 108, 33–53. [Google Scholar] [CrossRef]
  22. Noori, L.; Pour, B.A.; Askari, G.; Taghipour, N.; Pradhan, B.; Lee, C.-W.; Honarmand, M. Comparison of Different Algorithms to Map Hydrothermal Alteration Zones Using ASTER Remote Sensing Data for Polymetallic Vein-Type Ore Exploration: Toroud–Chahshirin Magmatic Belt (TCMB), North Iran. Remote Sens. 2019, 11, 495. [Google Scholar] [CrossRef] [Green Version]
  23. Ninomiya, Y.; Fu, B. Thermal infrared multispectral remote sensing of lithology and mineralogy based on spectral properties of materials. Ore Geol. Rev. 2019, 108, 54–72. [Google Scholar] [CrossRef]
  24. Pour, A.B.; Park, Y.; Park, T.S.; Hong, J.K.; Hashim, M.; Woo, J.; Ayoobi, I. Regional geology mapping using satellite-based remote sensing approach in Northern Victoria Land, Antarctica. Polar Sci. 2018, 16, 23–46. [Google Scholar] [CrossRef]
  25. Pour, A.B.; Hashim, M.; Park, Y.; Hong, J.K. Mapping alteration mineral zones and lithological units in Antarctic regions using spectral bands of ASTER remote sensing data. Geocarto Int. 2018, 33, 1281–1306. [Google Scholar] [CrossRef]
  26. Pour, A.B.; Park, T.S.; Park, Y.; Hong, J.K.; Zoheir, B.; Pradhan, B.; Ayoobi, I.; Hashim, M. Application of multi-sensor satellite data for exploration of Zn-Pb sulfide mineralization in the Franklinian Basin, North Greenland. Remote Sens. 2018, 10, 1186. [Google Scholar] [CrossRef] [Green Version]
  27. Pour, A.B.; Hashim, M.; Hong, J.K.; Park, Y. Lithological and alteration mineral mapping in poorly exposed lithologies using Landsat-8 and ASTER satellite data: North-eastern Graham Land, Antarctic Peninsula. Ore Geol. Rev. 2019, 108, 112–133. [Google Scholar] [CrossRef]
  28. Pour, A.B.; Park, Y.; Park, T.S.; Hong, J.K.; Hashim, M.; Woo, J.; Ayoobi, I. Evaluation of ICA and CEM algorithms with Landsat-8/ASTER data for geological mapping in inaccessible regions. Geocarto Int. 2019, 34, 785–816. [Google Scholar] [CrossRef]
  29. Pour, A.B.; Park, Y.; Crispini, L.; Läufer, A.; Kuk Hong, J.; Park, T.-Y.S.; Zoheir, B.; Pradhan, B.; Muslim, A.M.; Hossain, M.S.; et al. Mapping Listvenite Occurrences in the Damage Zones of Northern Victoria Land, Antarctica Using ASTER Satellite Remote Sensing Data. Remote Sens. 2019, 11, 1408. [Google Scholar] [CrossRef] [Green Version]
  30. Pour, A.B.; Park, T.-Y.; Park, Y.; Hong, J.K.; Muslim, A.M.; Läufer, A.; Crispini, L.; Pradhan, B.; Zoheir, B.; Rahmani, O.; et al. Landsat-8, Advanced Spaceborne Thermal Emission and Reflection Radiometer, and WorldView-3 Multispectral Satellite Imagery for Prospecting Copper-Gold Mineralization in the Northeastern Inglefield Mobile Belt (IMB), Northwest Greenland. Remote Sens. 2019, 11, 2430. [Google Scholar] [CrossRef] [Green Version]
  31. Bolouki, S.M.; Ramazi, H.R.; Maghsoudi, A.; Beiranvand Pour, A.; Sohrabi, G. A Remote Sensing-Based Application of Bayesian Networks for Epithermal Gold Potential Mapping in Ahar-Arasbaran Area, NW Iran. Remote Sens. 2020, 12, 105. [Google Scholar] [CrossRef] [Green Version]
  32. Sekandari, M.; Masoumi, I.; Beiranvand Pour, A.; M Muslim, A.; Rahmani, O.; Hashim, M.; Zoheir, B.; Pradhan, B.; Misra, A.; Aminpour, S.M. Application of Landsat-8, Sentinel-2, ASTER and WorldView-3 Spectral Imagery for Exploration of Carbonate-Hosted Pb-Zn Deposits in the Central Iranian Terrane (CIT). Remote Sens. 2020, 12, 1239. [Google Scholar] [CrossRef] [Green Version]
  33. Abrams, M. The Advanced Spaceborne Thermal Emission and Reflection Radiometer (ASTER): Data products for the high spatial resolution imager on NASA‘s Terra platform. Int. J. Remote Sens. 2000, 21, 847–859. [Google Scholar] [CrossRef]
  34. Abrams, M.; Tsu, H.; Hulley, G.; Iwao, K.; Pieri, D.; Cudahy, T.; Kargel, J. The Advanced Spaceborne Thermal Emission and Reflection Radiometer (ASTER) after fifteen years: Review of global products. Int. J. Appl. Earth Obs. Geoinf. 2015, 38, 292–301. [Google Scholar] [CrossRef]
  35. Ninomiya, Y.; Fu, B.; Cudahy, T.J. Detecting lithology with Advanced Spaceborne Thermal Emission and Reflection Radiometer (ASTER) multispectral thermal infrared radiance-at-sensor data. Remote Sens. Environ. 2005, 99, 127–139. [Google Scholar] [CrossRef]
  36. Ninomiya, Y.; Fu, B. Regional lithological mapping using ASTER-TIR data: Case study for the Tibetan Plateau and the surrounding area. Geosciences 2016, 6, 39. [Google Scholar] [CrossRef] [Green Version]
  37. Haselwimmer, C.E.; Riley, T.R.; Liu, J.G. Assessing the potential of multispectral remote sensing for lithological mapping on the Antarctic Peninsula: Case study from eastern Adelaide Island, Graham Land. Antarct. Sci. 2010, 22, 299–318. [Google Scholar] [CrossRef] [Green Version]
  38. Haselwimmer, C.E.; Riley, T.R.; Liu, J.G. Lithologic mapping in the Oscar II Coast area, Graham Land, Antarctic Peninsula using ASTER data. Int. J. Remote Sens. 2011, 32, 2013–2035. [Google Scholar] [CrossRef]
  39. Salvatore, M.R.; Mustard, J.F.; Head, J.W.; Cooper, R.F.; Marchant, D.R.; Wyatt, M.B. Development of alteration rinds by oxidative weathering processes in Beacon Valley, Antarctica, and implications for Mars. Geochim. Cosmochim. Acta 2013, 115, 137–161. [Google Scholar] [CrossRef]
  40. Salvatore, M.R.; Mustard, J.F.; Head, J.W.; Marchant, D.R.; Wyatt, M.B. Characterization of spectral and geochemical variability within the Ferrar Dolerite of the McMurdo Dry Valleys, Antarctica: Weathering, alteration, and magmatic processes. Antarct. Sci. 2013, 1–20. [Google Scholar] [CrossRef] [Green Version]
  41. GANOVEX Team. Geological map of North Victoria Land, Antarctica, 1:500,000—Explanatory notes. Geol. Jahrb. B 1987, 66, 7–79. [Google Scholar]
  42. Salvi, S.; Mazzarini, F.; Doumaz, F.; Lombardo, V.; Tolomei, C. Spectral reflectance measurments of geological materials in Northern Victoria Land, Antarctica. Aitinforma-Riv. Ital. Telerilevamento 2001, 23, 45–54. [Google Scholar]
  43. Veevers, J.J. Gondwanaland from 650–500 Ma assembly through 320 Ma merger in Pangea to 185–100 Ma breakup: Supercontinental tectonics via stratigraphy and radiometric dating. Earth Sci. Rev. 2004, 68, 1–132. [Google Scholar] [CrossRef]
  44. Veevers, J.J. Edge tectonics (Trench rollback, terrane export) of Gondwanaland–Pangea synchronized by supercontinental heat. Gondwana Res. 2005, 8, 449–456. [Google Scholar] [CrossRef]
  45. Goodge, J.W.; Fanning, C.M.; Norman, M.D.; Bennet, V. Temporal, Isotopic and Spatial Relations of Early Paleozoic Gondwana-Margin Arc Magmatism, Central Transantarctic Mountains, Antarctica. J. Petrol. 2012, 53, 2027–2065. [Google Scholar] [CrossRef] [Green Version]
  46. Estrada, S.; Läufer, A.; Eckelmann, K.; Hofmann, M.; Gärtner, A.; Linnemann, U. Continuous Neoproterozoic to Ordovician sedimentation at the East Gondwana margin—Implications from detrital zircons of the Ross Orogen in northern Victoria Land, Antarctica. Gondwana Res. 2016, 37, 426–448. [Google Scholar] [CrossRef]
  47. Federico, L.; Capponi, G.; Crispini, L. The Ross orogeny of the Transantarctic Mountains: A northern Victoria Land perspective. Int. J. Earth Sci. 2006, 95, 759–770. [Google Scholar] [CrossRef]
  48. Federico, L.; Crispini, L.; Capponi, G.; Bradshaw, J.D. The Cambrian Ross Orogeny in northern Victoria Land (Antarctica) and New Zealand: A synthesis. Gondwana Res. 2009, 15, 188–196. [Google Scholar] [CrossRef]
  49. Paulsen, T.; Deering, C.; Sliwinski, J.; Bachmann, O.; Guillong, M. A continental arc tempo discovered in the Pacific-Gondwana margin mudpile? Geology 2016, 44, 915–918. [Google Scholar] [CrossRef]
  50. Menneken, M.; John, T.; Läufer, A.; Giese, J. Zircons from the Granite Harbour Intrusives, northern Victora Land, Antarctica. In Proceedings of the POLAR 2018 Open Science Conference, Davos, Switzerland, 19–23 June 2018; pp. 19–23. [Google Scholar]
  51. Jordan, H.; Findlay, R.; Mortimer, G.; Schmidt-Thome, M.; Crawford, A.; Muller, P. Geology of the northern Bowers Mountains, North Victoria Land, Antarctica. Geol. Jahrb. B 1984, 60, 57–81. [Google Scholar]
  52. Rocchi, S.; Capponi, G.; Crispini, L.; Di Vincenzo, G.; Ghezzo, C.; Meccheri, M.; Palmeri, R. Mafic rocks at the WilsoneBowers terrane boundary and within the Bowers Terrane: Clues to the Ross geodynamics in northern Victoria Land, Antarctica. In Proceedings of the Abstract of the 9th International Symposium on Antarctic Earth Sciences, Potsdam, Germany, 8–12 September 2003. [Google Scholar]
  53. Crispini, L.; Vincenzo, G.D.; Palmeri, R. Petrology and 40Ar–39Ar dating of shear zones in the Lanterman Range (northern Victoria Land, Antarctica): Implications for metamorphic and temporal evolution at terrane boundaries. Mineral. Petrol. 2007, 89, 217–249. [Google Scholar] [CrossRef]
  54. Roland, N.W.; Läufer, A.L.; Rossetti, F. Revision of the Terrane Model of Northern Victoria Land (Antarctica). Terra Antart. 2004, 11, 55–65. [Google Scholar]
  55. Rossetti, F.; Tecce, F.; Aldega, L.; Brilli, M.; Faccenna, C. Deformation and fluid flow during orogeny at the palaeo-Pacific active margin of Gondwana: The Early Palaeozoic Robertson Bay accretionary complex (North Victoria Land, Antarctica). J. Metamorph. Geol. 2006, 24, 33–53. [Google Scholar] [CrossRef]
  56. Goodge, J.W. Metamorphism in the Ross orogen and its bearing on Gondwana margin tectonics. Spec. Pap.-Geol. Soc. Am. 2007, 419, 185–203. [Google Scholar]
  57. Rocchi, S.; Armienti, P.; D’Orazio, M.; Tonarini, S.; Wijbrans, J.; Di Vincenzo, G. Cenozoic magmatism in the western Ross Embayment: Role of mantle plume vs. plate dynamics in the development of the West Antarctic Rift System. J. Geophys. Res. 2002, 107, 2195. [Google Scholar] [CrossRef] [Green Version]
  58. Grindley, G.W. The geology of the Queen Alexandra Range, Beardmore Glacier, Ross Dependency, Antarctica; with notes on the correlation of Gondwana sequences. N. Z. J. Geol. Geophys. 1963, 6, 307–347. [Google Scholar] [CrossRef] [Green Version]
  59. Siders, M.A.; Elliot, D.H. Major and trace element geochemistry of the Kirkpatrick Basalt, Mesa Range, Antarctica. Earth Planet. Sci. Lett. 1985, 72, 54–64. [Google Scholar] [CrossRef]
  60. Faure, G.; Mensing, T.M. K-Ar dates and paleomagnetic evidence for Cretaceous alteration of Mesozoic basaltic lava flows, Mesa Range, northern Victoria Land, Antarctica. Chem. Geol. 1993, 109, 305–315. [Google Scholar] [CrossRef]
  61. Faure, G.; Mensing, T.M. Cretaceous alteration of Jurassic volcanic rocks, Pain Mesa, northern Victoria Land, Antarctica. Chem. Geol. 1996, 129, 153–161. [Google Scholar]
  62. Barrett, P.J.; Grindley, G.W.; Webb, P.N. The Beacon Supergroup of East Antarctica. Antarct. Geol. Geophys. 1972, 319, 332. [Google Scholar]
  63. Schöner, R.; Viereck-Götte, L.; Schneider, J.; Bomfleur, B. Triassic–Jurassic sediments and multiple volcanic events in North Victoria Land, Antarctica: A revised stratigraphic model. In Antarctica: A Keystone in a Changing World–Online Proceedings of the 10th ISAES; Cooper, A.K., Raymond, C.R., Eds.; USGS Open-File Report; National Academies Press: Washington, DC, USA, 2007; Volume 1047. [Google Scholar]
  64. Schöner, R.; Bomfleur, B.; Schneider, J.; Viereck-Götte, L. A systematic description of the Triassic to Lower Jurassic Section Peak Formation in north Victoria Land (Antarctica). Polarforschung 2011, 80, 71–87. [Google Scholar]
  65. Elsner, M.; Schöner, R.; Gerdes, A.; Gaupp, R. Reconstruction of the early Mesozoic plate margin of Gondwana by U–Pb ages of detrital zircons from northern Victoria Land, Antarctica. Geol. Soc. Lond. Spec. Publ. 2013, 383, 211–232. [Google Scholar] [CrossRef]
  66. Palmeri, R. P-T paths and migmatite formation: An example from Deep Freeze Range, northern Victoria Land, Antarctica. Lithos 1997, 42, 47–66. [Google Scholar] [CrossRef]
  67. Pertusati, P.C.; Musumeci, G.; Carosi, R.; Meccheri, M.; Baroni, C.; Capponi, G.; Carmignani, L.; Castelli, D.; Colombo, F.; Crispini, L.; et al. Antarctic Geological 1:250000 Map Series, Mount Melbourne Quadrangle (Victoria Land); GIGAMAP—German-Italian Geological Antarctic Map Program. 2012. [Google Scholar]
  68. Kyle, P.R.; Elliot, D.H.; Sutter, J.F. Jurassic Ferrar Supergroup Tholeiites from the Transantarctic Mountains, Antarctica, and Their Relationship to the Initial Fragmentation of Gondwana; Pascal: Vendin-lès-Béthune, France, 1981; pp. 283–287. [Google Scholar]
  69. Kyle, P.R.; Cole, J.W. Structural controls of volcanism in the McMurdo Volcanic Group, McMurdo Sound, Antarctica. Bull. Volcanol. 1974, 38, 16–35. [Google Scholar] [CrossRef]
  70. Storti, F.; Rossetti, F.; Salvini, F. Structural architecture and displacement accommodation mechanisms at the termination of the Priestley Fault, northern Victoria Land, Antarctica. Tectonophysics 2001, 341, 141–161. [Google Scholar] [CrossRef]
  71. Pertusati, P.C.; Ricci, C.A.; Tessensohn, F. German-Italian Geological Antarctic Map Programme—The Italian Contribution. Introd. Notes Map Case. Terra Antart. Rep 2016, 15, 1–15. [Google Scholar]
  72. The Scientific Committee on Antarctic Research (SCAR), Geological Mapping Update of Antarctica (GEOMAP). Available online: https://www.scar.org/science/geomap/ (accessed on 26 September 2019).
  73. Yamaguchi, Y.I.; Fujisada, H.; Kahle, A.B.; Tsu, H.; Kato, M.; Watanabe, H.; Sato, I.; Kudoh, M. ASTER instrument performance, operation status, and application to Earth sciences. IEEE Trans. Geosci. Remote Sens. 2001, 3, 1215–1216. [Google Scholar]
  74. Fujisada, H. Design and performance of ASTER instrument. Proc. SpeiInt. Soc. Opt. Eng. 1995, 2583, 16–25. [Google Scholar]
  75. U.S. Geological Survey Earth Resources Observation and Science Center (EROS). Available online: https://glovis.usgs.gov/ (accessed on 2 September 2017).
  76. Iwasaki, A.; Tonooka, H. Validation of a crosstalk correction algorithm for ASTER/SWIR. IEEE Trans. Geosci. Remote Sens. 2005, 43, 2747–2751. [Google Scholar] [CrossRef]
  77. Cooley, T.; Anderson, G.P.; Felde, G.W.; Hoke, M.L.; Ratkowski, A.J.; Chetwynd, J.H.; Gardner, J.A.; Adler-Golden, S.M.; Matthew, M.W.; Berk, A.; et al. FLAASH, a MODTRAN4-based atmospheric correction algorithm, its application and validation. Proceedings of the Geoscience and Remote Sensing Symposium. IEEE Int. 2002, 3, 1414–1418. [Google Scholar]
  78. Kruse, F.A. Comparison of ATREM, ACORN, and FLAASH Atmospheric Corrections using Low-Altitude AVIRIS Data of Boulder, Colorado. In Proceedings of the Summaries of 13th JPL Airborne Geoscience Workshop, Jet Propulsion Lab, Pasadena, CA, USA, 7 May 2004. [Google Scholar]
  79. Research Systems, Inc. 2008 ENVI Tutorials; Research Systems, Inc.: Boulder, CO, USA, 2008. [Google Scholar]
  80. Hall, D.K.; Riggs, G.A.; Salomonson, V.V. Development of methods for mapping global snow cover using moderate resolution imaging spectroradiometer data. Remote Sens. Environ. 1995, 54, 127–140. [Google Scholar] [CrossRef]
  81. Hall, D.K.; Riggs, G.A.; Salomonson, V.V.; DiGirolamo, N.E.; Bayr, K.J. MODIS snow-cover products. Remote Sens. Environ. 2002, 83, 181–1194. [Google Scholar] [CrossRef] [Green Version]
  82. Gupta, R.P.; Haritashya, U.K.; Singh, P. Mapping dry/wet snow cover in the Indian Himalayas using IRS multispectral imagery. Remote Sens. Environ. 2005, 97, 458–469. [Google Scholar] [CrossRef]
  83. Boardman, J.W. Leveraging the high dimensionality of AVIRIS data for improved sub-pixel target unmixing and rejection of false positives: Mixture tuned matched filtering. Summ. Seventh JPL Airborne Geosci. Workshop JPL Publ. 1998, 97, 55–56. [Google Scholar]
  84. Chang, C.I. Hyperspectral Imaging: Techniques for Spectral Detection and Classification; Springer Science & Business Media: Berlin, Germany, 2003; p. 1. [Google Scholar]
  85. Boardman, J.W.; Kruse, F.A. Analysis of imaging spectrometer data using N-dimensional geometry and a mixture-tuned matched filtering approach. IEEE Trans. Geosci. Remote Sens. 2011, 49, 4138–4152. [Google Scholar] [CrossRef] [Green Version]
  86. Kruse, F.A.; Perry, S.L. Regional mineral mapping by extending hyperspectral signatures using multispectral data. IEEE Trans. Geosci. Remote Sens. 2007, 4, 1–14. [Google Scholar]
  87. Kruse, F.A.; Bordman, J.W.; Huntington, J.F. Comparison of airborne hyperspectral data and EO-1 Hyperion for mineral mapping. IEEE Trans. Geosci. Remote Sens. 2003, 41, 1388–1400. [Google Scholar] [CrossRef] [Green Version]
  88. Green, A.A.; Berman, M.; Switzer, P.; Craig, M.D. A transformation for ordering multispectral data in terms of image quality with implications for noise removal. IEEE Trans. Geosci. Remote Sens. 1988, 26, 65–74. [Google Scholar] [CrossRef] [Green Version]
  89. Boardman, J.W.; Kruse, F.A. Automated spectral analysis: A geologic example using AVIRIS data, north Grapevine Mountains, Nevada. In Proceedings of the Tenth Thematic Conference on Geologic Remote Sensing, Environmental Research Institute of Michigan, Ann Arbor, MI, USA, 9–12 May 1994; pp. I-407–I-418. [Google Scholar]
  90. Boardman, J.W.; Kruse, F.A.; Green, R.O. Mapping target signatures via partial unmixing of AVIRIS data. Fifth JPL Airborne Earth Sci. Workshop JPL Publ. 1995, 23–26. [Google Scholar]
  91. Boardman, J.W. Automated spectral unmixing of AVIRIS data using convex geometry concepts. Fourth JPL Airborne Geosci. Workshop JPL Publ. 1993, 11–14. [Google Scholar]
  92. Clark, R.N. Spectroscopy of rocks and minerals, and principles of spectroscopy. Man. Remote Sens. 1999, 3, 3–58. [Google Scholar]
  93. Milliken, R.E.; Mustard, J.F. Estimating the water content of hydrated minerals using reflectance spectroscopy I. Effects of darkening agents and low-albedo materials. Icarus 2007, 189, 550–573. [Google Scholar] [CrossRef]
  94. Kokaly, R.F.; Clark, R.N.; Swayze, G.A.; Livo, K.E.; Hoefen, T.M.; Pearson, N.C.; Klein, A.J. USGS Spectral Library Version 7 (No. 1035); US Geological Survey: Reston, VA, USA, 2017. [Google Scholar]
  95. Meerdink, S.K.; Hook, S.J.; Roberts, D.A.; Abbott, E.A. The ECOSTRESS spectral library version 1.0. Remote Sens. Environ. 2019, 230, 1–8. [Google Scholar] [CrossRef]
  96. Harsanyi, J.C. Detection and Classification of Subpixel Spectral Signatures in Hyperspectral Image Sequences. Ph.D. Thesis, University of Maryland, College Park, MD, USA, 1993. [Google Scholar]
  97. Chang, C.I.; Heinz, D.C. Constrained subpixel target detection for remotely sensed imagery. IEEE Trans. Geosci. Remote Sens. 2000, 38, 1144–1159. [Google Scholar] [CrossRef] [Green Version]
  98. Chang, C.I.; Liu, J.M.; Chieu, B.C.; Ren, H.; Wang, C.M.; Lo, C.S.; Chung, P.C.; Yang, C.W.; Ma, D.J. Generalized constrained energy minimization approach to subpixel target detection for multispectral imagery. Opt. Eng. 2000, 39, 1275–1281. [Google Scholar]
  99. Jiao, X.; Chang, C.I. Kernel-based constrained energy minimization (K-CEM). In Proceedings of the Algorithms and Technologies for Multispectral, Hyperspectral, and Ultraspectral Imagery XIV, Orlando, FL, USA, 16–20 March 2008; Volume 6966, p. 69661S, International Society for Optics and Photonics. [Google Scholar]
  100. Harsanyi, J.C.; Farrand, W.H.; Chang, C.I. Detection of subpixel signatures in hyperspectral image sequences. In Proceedings of the American Society for Photogrammetry and Remote Sensing (ASPRS) Annual Meeting, Reno, NV, USA, 14 October 1994; pp. 236–247. [Google Scholar]
  101. Johnson, S. Constrained energy minimization and the target-constrained interference-minimized filter. Opt. Eng. 2003, 42, 1850–1854. [Google Scholar] [CrossRef]
  102. Hunt, G.R.; Evarts, R.C. The use of near-infrared spectroscopy to determine the degree of serpentinization of ultramafic rocks. Geophysics 1980, 46, 316–321. [Google Scholar] [CrossRef]
  103. King, T.V.V.; Clark, R.N. Spectral characteristics of chlorites and Mg-serpentines using high-resolution reflectance spectroscopy. J. Geophys. Res. 1989, 94, 13997–14008. [Google Scholar] [CrossRef]
  104. Mars, J.C.; Rowan, L.C. ASTER spectral analysis and lithologic mapping of the Khanneshin carbonate volcano, Afghanistan. Geosphere 2011, 7, 276–289. [Google Scholar] [CrossRef] [Green Version]
  105. Michalski, J.R.; Kraft, M.D.; Sharp, T.G.; Williams, L.B.; Christensen, P.R. Emission spectroscopy of clay minerals and evidence for poorly crystalline aluminosilicates on Mars from Thermal Emission Spectrometer data. J. Geophys. Res. 2006, 111, E03004. [Google Scholar] [CrossRef]
  106. Meneghel, M.; Bondesan, A.; Salvatore, M.; Orombelli, G. A model of the glacial retreat of upper Rennick Glacier, Victoria Land, Antarctica. Ann. Glaciol. 1999, 29, 225–230. [Google Scholar] [CrossRef] [Green Version]
  107. Estrada, S. Amphibolites in the Priestley Formation, northern Victoria Land, Antarctica. Geol. Jahrb. 2003, 95, 153–181. [Google Scholar]
  108. Whitney, D.L.; Evans, B.W. Abbreviations for names of rock-forming minerals. Am. Mineral. 2010, 95, 185–187. [Google Scholar] [CrossRef]
  109. Rocchi, S.; Di Vincenzo, G.; Ghezzo, C. The Terra Nova Intrusive Complex (Victoria Land, Antarctica). Terra Antart. Rep. 2004, 10, 1–49. [Google Scholar]
  110. Elliot, D.H. The geological and tectonic evolution of the Transantarctic Mountains: A review. Geol. Soc. Lond. Spec. Publ. 2013, 381, 7–35. [Google Scholar] [CrossRef]
  111. Schöner, R.; John, N. Sedimentological field investigations on the Takrouna Formation (Permian, Beacon Supergroup) in northern Victoria Land, Antarctica. Polarforschung 2014, 84, 49–58. [Google Scholar]
  112. John, N. Sedimentology and Composition of the Takrouna Formation, Northern Victoria Land, Antarctica. Provenance, and Depositional Evolution of a Permian Gondwana Basin. Ph.D. Thesis, University of Jena, Jena, Germany, 2014. [Google Scholar]
  113. Bomfleur, B.; Mörs, T.; Unverfährt, J.; Läufer, A.; Castillo, P.; Oh, C.; Park, T.-Y.S.; Woo, J.; Liu, F.; Crispini, L. New Permian-Jurassic deposits in the far north of Victoria Land, East Antarctica. J. Geol. Soc. 2020. [Google Scholar] [CrossRef]
  114. Viereck-Goette, L.; Schöner, R.; Bomfleur, B.; Schneider, J. Multiple shallow level sill intrusions coupled with hydromagmatic explosive eruptions marked the initial phase of Ferrar Magmatism in northern Victoria Land, Antarctica. In Antarctica: A Keystone in a Changing World–Online Proceedings of the 10th ISAES; Cooper, A.K., Raymond, C.R., Eds.; USGS Open-File Report; National Academies Press: Washington, DC, USA, 2007. [Google Scholar]
  115. Wörner, G.; Viereck, L.; Hertogen, J.; Niephaus, H. The Mt. Melboune Volcanic Field (Victoria Land, Antarctica)—II. Geochemistry and magma genesis. Geol. Jahrb. 1989, E38, 395–433. [Google Scholar]
  116. Porrenga, D.H. Non-marine glauconitic illite in the lower Oligocene of Aardeburg, Belgium. Clay Miner. 1968, 7, 421–430. [Google Scholar] [CrossRef]
  117. Meunier, A.; El Albani, A. The glauconite-Fe-illite-Fe-smectite problem: A critical review. Terra Nova 2007, 19, 95–104. [Google Scholar] [CrossRef]
  118. Priestas, A.M.; Wise, S.W. Distribution and origin of authigenic smectite clays in Cape Roberts Project Core 3, Victoria Land Basin, Antarctica. In Proceedings of the 10th International Symposium on Antarctic Earth Sciences, University of California, Santa Barbara, USA, 26 August–1 September 2007. [Google Scholar]
  119. Stoops, G.; Mees, F. Groundmass Composition and Fabric. In Interpretation of Micromorphological Features of Soils and Regoliths, 2nd ed.; Elsevier: Amsterdam, The Netherlands, 2018; Chapter 5; pp. 73–125. [Google Scholar] [CrossRef] [Green Version]
  120. Sparks, D.L. Inorganic Soil Components. In Environmental Soil Chemistry, 2nd ed.; Elsevier: Amsterdam, The Netherlands, 2003; Chapter 2; pp. 43–73. [Google Scholar] [CrossRef]
Figure 1. Geological map of the Mesa Range, Campbell and Priestley Glaciers and surrounding areas. Modified based on the GIGAMAP series and © SCAR GeoMAP 2019, adopted from Storti et al. [71] and Pertusati et al. [72].
Remotesensing 13 00038 g001
Figure 2. ASTER mosaic of the Mesa Range, Campbell and Priestley Glaciers derived from bands 1, 2 and 3 VNIR as RGB color composite.
Remotesensing 13 00038 g002
Figure 3. An overview of methodological flowchart used in this study.
Remotesensing 13 00038 g003
Figure 4. Laboratory reflectance spectra of the selected phyllosilicate minerals re-sampled to response functions of ASTER VINR+SWIR and TIR bands. (A) ASTER VINR+SWIR bands; (B) ASTER TIR bands. Cubes indicate the location of the ASTER VINR+SWIR and TIR bands.
Remotesensing 13 00038 g004
Figure 5. (A) Endmember spectra extracted from ASTER VINR+SWIR bands using the n-Dimensional analysis technique for the Mesa Range. (B) MTMF classification mineral maps derived from MF score images (VINR+SWIR bands) for the Mesa Range scene. (C) Endmember spectra extracted from ASTER TIR bands using the n-Dimensional analysis technique for the Mesa Range. (D) MTMF classification mineral maps derived from MF score images (TIR bands) for the Mesa Range scene.
Remotesensing 13 00038 g005
Figure 6. (A) Endmember spectra extracted from ASTER VINR+SWIR bands using the n-Dimensional analysis technique for the Campbell Glacier (I). (B) MTMF classification mineral maps derived from MF score images (VINR+SWIR bands) for the Campbell Glacier (I) scene. (C) Endmember spectra extracted from ASTER TIR bands using the n-Dimensional analysis technique for the Campbell Glacier (I). (D) MTMF classification mineral maps derived from MF score images (TIR bands) for the Campbell Glacier (I) scene.
Remotesensing 13 00038 g006
Figure 7. (A) Endmember spectra extracted from ASTER VINR+SWIR bands using the n-Dimensional analysis technique for the Priestley Glacier. (B) MTMF classification mineral maps derived from MF score images (VINR+SWIR bands) for the Priestley Glacier scene. (C) Endmember spectra extracted from ASTER TIR bands using the n-Dimensional analysis technique for the Priestley Glacier. (D) MTMF classification mineral maps derived from MF score images (TIR bands) for the Priestley Glacier scene.
Remotesensing 13 00038 g007
Figure 8. (A) Endmember spectra extracted from ASTER VINR+SWIR bands using the n-Dimensional analysis technique for the Campbell Glacier (II). (B) MTMF classification mineral maps derived from MF score images (VINR+SWIR bands) for the Campbell Glacier (II) scene. (C) Endmember spectra extracted from ASTER TIR bands using the n-Dimensional analysis technique for the Campbell Glacier (II). (D) MTMF classification mineral maps derived from MF score images (TIR bands) for the Campbell Glacier (II) scene.
Remotesensing 13 00038 g008
Figure 9. (A) CEM classification mineral map for the Mesa Range scene derived from fraction images of the selected endmember minerals using ASTER VINR+SWIR bands. (B) CEM classification mineral map for the Mesa Range scene derived from fraction images of the selected endmember minerals using ASTER TIR bands.
Remotesensing 13 00038 g009
Figure 10. (A) CEM classification mineral map for the Campbell Glacier (I) scene derived from fraction images of the selected endmember minerals using ASTER VINR+SWIR bands. (B) CEM classification mineral map for the Campbell Glacier (I) scene derived from fraction images of the selected endmember minerals using ASTER TIR bands.
Remotesensing 13 00038 g010
Figure 11. (A) CEM classification mineral map for the Priestley Glacier scene derived from fraction images of the selected endmember minerals using ASTER VINR+SWIR bands. (B) CEM classification mineral map for the Priestley Glacier scene derived from fraction images of the selected endmember minerals using ASTER TIR bands.
Remotesensing 13 00038 g011
Figure 12. (A) CEM classification mineral map for the Campbell Glacier (II) scene derived from fraction images of the selected endmember minerals using ASTER VINR+SWIR bands. (B) CEM classification mineral map for the Campbell Glacier (II) scene derived from fraction images of the selected endmember minerals using ASTER TIR bands.
Remotesensing 13 00038 g012
Figure 13. Field photographs of the bedrock lithologies. (A) Helicopter view of Kirkpatrick Basalts (series of lava flows) in the western flank of Tobin Mesa, southern Mesa Range; (B) Regional view of glacial deposits and debris composed of Kirkpatrick Basalts and Ferrar Dolerite associated with zeolite-bearing volcanoclastic and sandstone in southern Mesa Range; (C) Regional view of the exposures of sheeted leucogranite of the Granite Harbour Intrusives and schists of the Wilson Metamorphic Complex and sandstone of the Beacon Supergroup, Lichen Hills, Mesa Range area; (D) Helicopter view of flat hills with steep escarpments of Granite Harbour Intrusives and schists of the Wilson Metamorphic Complex, which is partly covered by weathered erratic and tills on top and debris at the foot of steep slopes, Lichen Hills, Mesa Range area; (E) View of Granite Harbour Intrusives that is unconformably covered by sub-horizontal sandstones of the Beacon Supergroup and Ferrar Dolerite, central Archambault Ridge, Campbell Glacier area; (F) Regional view of granitic terrain along the western margin of Campbell Glacier (reddish color due to weathering/alteration of feldspars and mafic minerals), central Archambault Ridge towards east, Campbell Glacier area; (G) Close view of altered/weathered granitoids with coarse k-feldspar porphyroclasts (Granite Harbour Intrusives), Black Ridge, Priestley Glacier area; (H) Regional view of low-grade metamorphic siliciclastic rocks (Priestley Formation) that is highly foliated and tightly folded, NW of Eskimo Point, western side of Priestley Glacier area.
Remotesensing 13 00038 g013
Figure 14. Microphotographs of typical lithological units in the study area. (A) Microphotograph of fine graded biotite-rich quartzitic schist from the low-grade-Priestley Formation, Eisenhower Range; main minerals along the folded foliation are biotite and quartz with minor tourmaline, graphite and white mica. (B) Microphotograph of banded biotite quartzitic schist from the low-medium-grade Priestley Schist, Boomerang Glacier, Priestley Glacier area; main minerals are represented by quartz, biotite, amphibole with minor k-feldspar, plagioclase, white mica, graphite and secondary calcite. (C) Microphotograph of coarse-grained banded biotite-gneiss from migmatitic gneisses, Mt. Dickason, western Priestley Glacier area; typical mineralogy includes quartz, plagioclase, k-feldspar (occasionally saussuritic), large biotite laths and opaque minerals. (D) Microphotograph of medium to fine-grained granite-granodiorite from the Granite Harbour Intrusives, Mt. Baxter, Priestley Glacier area; main minerals are biotite, quartz, plagioclase and minor k-feldspar, opaque minerals. (E) Microphotograph of partially recrystallized and deformed coarse-grained granite from the Granite Harbour Intrusives, Priestley Glacier area; main minerals are quartz, saussurritic k-feldspar, chlorite and minor epidote. (F) Microphotograph of coarse-grained subarkose to lithic subarkose from the Beacon Supergroup, Deep Freeze Range, Mt. Levick, Priestley Glacier area; main components are quartz, feldspars, micas, chlorite, lithic grains, opaque minerals and secondary smectite. (G) Microphotograph of tuffaceous siltstone with volcanic ashes, plagioclse, lithic fragments, oxide and altered glass, Mesa Range area; veinlets are filled by zeolites. (H) Microphotograph of alkaline-basalt from dykes swarm from the McMurdo Igneous Complex, Priestley Glacier area; main minerals are brown amphibole (kaesrutitic), plagioclase (microphenocrystals) and minor opaque (magnetite) and olivine. Abbreviation: Tur = tourmaline, Gr = graphite, Bt = biotite, Qz = quartz, Cal = calcite, Amph = amphibole, Kfs = k-feldspar, Ilm-mag: Ilmenite-magnetite, Pl = plagioclase, Zrn = zircon, Ilm = Ilmenite, Ep = epidote, Chl = chlorite, Sme = smectite, Op = opaque minerals, Px = pyroxene, Zeo = zeolite, Amp-Krs = amphibole kaesrutitic (adapted from Whitney and Evans [108]).
Remotesensing 13 00038 g014
Figure 15. Mosaic phyllosilicates image-map of the Mesa Range, Campbell and Priestley Glaciers derived from VNIR+SWIR and TIR bands of ASTER. The use of “/” means as “and” for mineral components.
Remotesensing 13 00038 g015
Table 1. The technical characteristics of ASTER data [33,73,74].
ASTER SubsystemBand NumberSpectral Range (μm)Ground Resolution (m)Swath Width (km)
VNIR10.52–0.601560
20.63–0.69
3N *0.78–0.86
3B *0.78–0.86
SWIR41.600–1.70030
52.145–2.185
62.185–2.225
72.235–2.285
82.295–2.365
92.360–2.430
TIR108.125–8.47590
118.475–8.825
128.925–9.275
1310.25–10.95
1410.95–11.65
* Band number 3N refers to the nadir pointing view, whereas 3B designates the backward pointing view. The visible near-infrared (VNIR), the short-wave infrared (SWIR) and the thermal-infrared (TIR) are abbreviated.
Table 2. The dataset attributes of ASTER images used in this study.
Granule IDDate and Time of AcquisitionsPath/RowCloud CoverageSun AzimuthSun Elevation
AST_L1T_0031228200321452728 December 2003, 21:45:2765/1126%58.34833.033
AST_L1T_0030116200621550816 January 2006, 21:55:0864/1124%57.06930.462
AST_L1T_0030116200621551716 January 2006, 21:55:1764/1135%57.65329.882
AST_L1T_003120220042118502 December 2004, 21:18:5063/1135%60.56930.616
Table 3. Error matrix for the MF score images versus the CEM fraction images derived from VNIR+SWIR bands of ASTER.
High MF Score Pixels (MTMF)High Fractional Abundance Pixels (CEM)
Al-Rich PhyllosilicatesFe3+-Rich PhyllosilicateFe2+-Rich PhyllosilicateMg-Rich PhyllosilicateTotalsUser’s Accuracy
Al-rich phyllosilicates787369483%
Fe3+-rich phyllosilicate84724179649%
Fe2+-rich phyllosilicate32154129060%
Mg-rich phyllosilicate1125196512054%
Totals100100100100400
Producer’s Accuracy78%47%54%65%
Overall accuracy = 61%Kappa Coefficient = 0.48
Table 4. Error matrix for the MF score images versus the CEM fraction images derived from TIR bands of ASTER.
High MF Score Pixels (MTMF)High Fractional Abundance Pixels (CEM)
Al-Rich PhyllosilicatesFe3+-Rich PhyllosilicateFe2+-Rich PhyllosilicateMg-Rich PhyllosilicateTotalsUser’s Accuracy
Al-rich phyllosilicates866129591%
Fe3+-rich phyllosilicate966212311955%
Fe2+-rich phyllosilicate21654259756%
Mg-rich phyllosilicate31224508956%
Totals100100100100400
Producer’s Accuracy86%66%54%50%
Overall accuracy = 64%Kappa Coefficient = 0.52
Table 5. Location of selected GPS points and mineral components derived from XRD analysis for representative altered rock samples.
CoordinateLocationMineralogy
LatLon(Formation/Lithology)(XRD Analysis)
74°18′00′′162°22′00′′O’Kane Canyon
(Priestley Schist/Garnet-mica-schist)
Quartz, mica, feldspar, chlorite
74°21′14′′162°31′31′′Eisenhower Range
(Priestley Formation/Biotite-rich quartzitic schist)
Biotite, quartz with minor tourmaline, graphite and with mica
74°37′00′′164°10′00′′Gondwana Station Area
(Snowy Point Gneiss Complex/Amphibolite)
Mica, hornblende, feldspar, stilbite, chlorite
74°10′00′′163°04′00′′SW Mt. Levick
(Priestley Schist/Amphibolite)
Hornblende, feldspar, ±chlorite, quartz, ±mica
74°22′00′′163°25′00′′Lowry Bluff
(Priestley Schist/Sillimanite-cordierite schist)
Quartz, hornblende, mica, feldspar
74°26′42′′162°32′23′′Mt. Baxter, Eisenhower Range
(Granite Harbour Intrusives/Granite-Granodiorite)
Biotite, quartz, plagioclase, minor k-feldspar, opaques
74°03′00′′162°00′00′′SE Foolsmate Glacier
(Priestley Formation/Calcareous quartzitic schist)
Quartz, feldspar, calcite, mica
74°22′00′′163°25′00′′Lowry Bluff
(Priestley Schist/Amphibolite)
Hornblende, ±augite, quartz, feldspar, ±chlorite
74°23′00′′164°05′59′′Mt. Dickason, Deep Freeze Range
(Migmatite Gneiss/Banded biotite-gneiss, migmatitic)
Quartz, plagioclase, k-feldspar (saussuritic), biotite, opaques (ilmenite-magnetite)
74°10′00′′163°01′00′′SW Mt. Levick
(Priestley Schist/Amphibolite)
Hornblende, feldspar, quartz, mica, ± chlorite
74°18′00′′162°22′00′′O’Kane Canyon
(Priestley Schist/Quartzite)
Quartz, feldspar, ±mica, ±chlorite
74°06′57′′162°55′39′′Mt. Levick, Deep Freeze Range
(Beacon Supergroup/Subarkosic)
Quartz, feldspar, mica, chlorite, lithic grains, opaques, smectite (secondary)
74°29′00′′164°00′00′′Pt. 1300 m, N Mt. Keinath
(Priestley Schist/Andalusite schist)
Quartz, mica, feldspar
74°09′00′′163°03′00′′SW Mt. Levick
(Priestley Schist/Quartzitic garnet-mica-schist)
Quartz, mica, feldspar, ±chlorite
74°03′00′′162°00′00′′SE Foolsmate Glacier
(Priestley Formation/Sericite-Chlorite-Schist)
Quartz, feldspar, mica, chlorite
74°41′57′′164°05′48′′Mario Zucchelli Station
(McMurdo Igneous Complex/Mafic dyke)
Feldspar, biotite, quartz, chlorite, talc, Ti-augite, Ti-amphibole, ±olivine, jarosite?
74°09′00′′163°03′00′′SW Mt. Levick
(Priestley Schist /Dolomite)
Dolomite, chlorite, calcite, hornblende, mica
74°18′00′′162°22′00′′O’Kane Canyon
(Priestley Schist/Mica-schist)
Quartz, mica, ±feldspar, chlorite
73°22′41′′162°50′46′′Mesa Range
(Ferrar Supergroup/Tuffaceous siltstone)
Plagioclase, lithic fragments, oxide, altered glass
74°09′00′′163°03′00′′SW Mt. Levick
(Priestley Schist/Biotite schist, garnet-biotite schist)
Quartz, mica, feldspar, ±hornblende, ±chlorite
74°29′00′′164°00′00′′Pt. 1300 m, N Mt. Keinath
(Priestley Schist/Andalusite-sillimanite schist)
Quartz, mica, feldspar
74°09′00′′163°03′00′′SW Mt. Levick
(Priestley Schist/Amphibolite, garnet amphibolite)
Hornblende, feldspar, quartz, ±chlorite, ±calcite, ±mica, ±augite
74°26′43′′162°35′39′′Priestley Glacier, Eisenhower Range
(Granite Harbour Intrusives/Granite)
Quartz, k-feldspar, chlorite, minor epidote
74°22′00′′163°25′00′′Lowry Bluff
(Priestley Schist/Sillimanite-cordierite schist)
Quartz, hornblende, mica, feldspar
74°24′59′′162°52′28′′Boomerang Glacier, Deep Freeze Range
(Priestley Schist/Quartzitic biotite schist)
Quartz, biotite, amphibole with minor k-feldspar, plagioclase, white mica, graphite, secondary calcite
74°03′00′′162°00′00′′SE Foolsmate Glacier
(Priestley Formation/Sericite-Chlorite-Biotite-Schist)
Quartz, chlorite, feldspar, mica
74°37′00′′164°10′00′′Gondwana Station area
(Snowy Point Gneiss Complex/Biotite-gneiss)
Quartz, mica, feldspar
74°10′00′′163°04′00′′SW Mt. Levick
(Priestley Schist/Garnet-biotite schist)
Mica, feldspar, quartz, chlorite
74°18′00′′162°22′00′′O’Kane Canyon
(Priestley Schist/Calcareous quartzitic schist)
Quartz, mica, calcite, feldspar
74°03′00′′162°00′00′′SE Foolsmate Glacier
(Priestley Formation/Quartzitic schist)
Quartz, feldspar, chlorite, mica
Table 6. Error matrix (confusion matrix) and Kappa Coefficient for remote sensing mineral maps versus field GPS survey.
Remote Sensing Mineral Map GPS Survey
Al-Rich PhyllosilicatesFe3+-Rich PhyllosilicateFe2+-Rich PhyllosilicateMg-Rich PhyllosilicateTotalsUser’s Accuracy
Al-rich phyllosilicates261103086.66%
Fe3+-rich phyllosilicate222423268.75%
Fe2+-rich phyllosilicate242243073.33%
Mg-rich phyllosilicate033242885.71%
Totals30303030120
Producer’s Accuracy86.66%73.33%73.33%80%
Overall accuracy = 78.33%Kappa Coefficient = 0.71
Publisher’s Note: MDPI stays neutral with regard to jurisdictional claims in published maps and institutional affiliations.

