Determination of Phycocyanin from Space—A Bibliometric Analysis


Leibniz-Institute of Freshwater Ecology and Inland Fisheries, 16775 Stechlin, OT Neuglobsow, Germany
Remote Sens. 2020, 12(3), 567; https://doi.org/10.3390/rs12030567
Submission received: 17 January 2020
/
Revised: 28 January 2020
/
Accepted: 1 February 2020
/
Published: 8 February 2020
(This article belongs to the Collection Feature Papers for Section Environmental Remote Sensing)
Abstract
:Over the past few decades, there has been an increase in the number of studies about the estimation of phycocyanin derived from remote sensing techniques. Since phycocyanin is a unique pigment of inland water cyanobacteria, the quantification of its concentration from earth observation data is important for water quality monitoring - once some species can produce toxins. Because of the growth of this field in the past decade, several reviews and studies comparing algorithms have been published. Thus, instead of focusing on algorithms comparison or description, the goal of the present study is to systematically analyze and visualize the evolution of publications. Using the Web of Science database this study analyzed the existing publications on remote sensing of phycocyanin decade-by-decade for the period 1991–2020. The bibliometric analysis showed how research topics evolved from measuring pigments to the quantification of optical properties and from laboratory experiments to measuring entire temperate and tropical aquatic systems. This study provides the status quo and development trend of the field and points out what could be the direction for future research.
1. Introduction
Cyanobacteria harmful algal blooms (CHABs), in freshwater systems, have been a major concern for environmental and public health authorities worldwide. In general, algal blooms come with the loss of aesthetic conditions, the increase of taste and odor of water supply sources, the growth of a thick scum on the surface of lakes and reservoirs as well as the lack of water clarity [1]. In addition, other environmental effects can be associated with CHABs such as the decomposition of dying blooms which may lead to oxygen depletion (hypoxia and anoxia) for aquatic life [2]. These are common environmental health concerns of algal bloom occurrence in inland waters; however, the main concern is related to the production of toxic secondary metabolites by some species of cyanobacteria also known as blue-green (BG) algae. These metabolites can cause serious health issues in mammals (including humans) and wildlife (bird and fishes) affecting several systems such as the hepatopancreatic, digestive, endocrine, dermal, and nervous systems [3,4].
Cyanobacteria have been observed in lentic freshwater systems worldwide [2,5,6,7,8]. The presence of cyanobacteria has been associated with favorable ecophysiological conditions - especially nutrient over-enrichment and hydrologic alterations to ecosystems [9,10,11]. Management of cyanobacteria traditionally focuses on in situ water sampling to monitor cell counts and chlorophyll-a (chl-a) concentration as biomass indicators. However, these methods are expensive, time-consuming [12], and usually limited in spatial and temporal extents [13].
Remote sensing has been used to monitor CHABs worldwide [5,6,7,8]. Advantages of using remote sensing are: (1) the synoptic view of remote sensing imagery allows the acquisition of data for the entire aquatic system, (2) the capability of acquiring information from remote and sometimes inaccessible regions, and (3) the availability of historical data which allows the extraction of information from archived remote sensing imagery [14]. Accordingly, Gons [13] observed that the use of remote sensing techniques was time-saving, cost-effective, and a scientifically rewarding alternative.
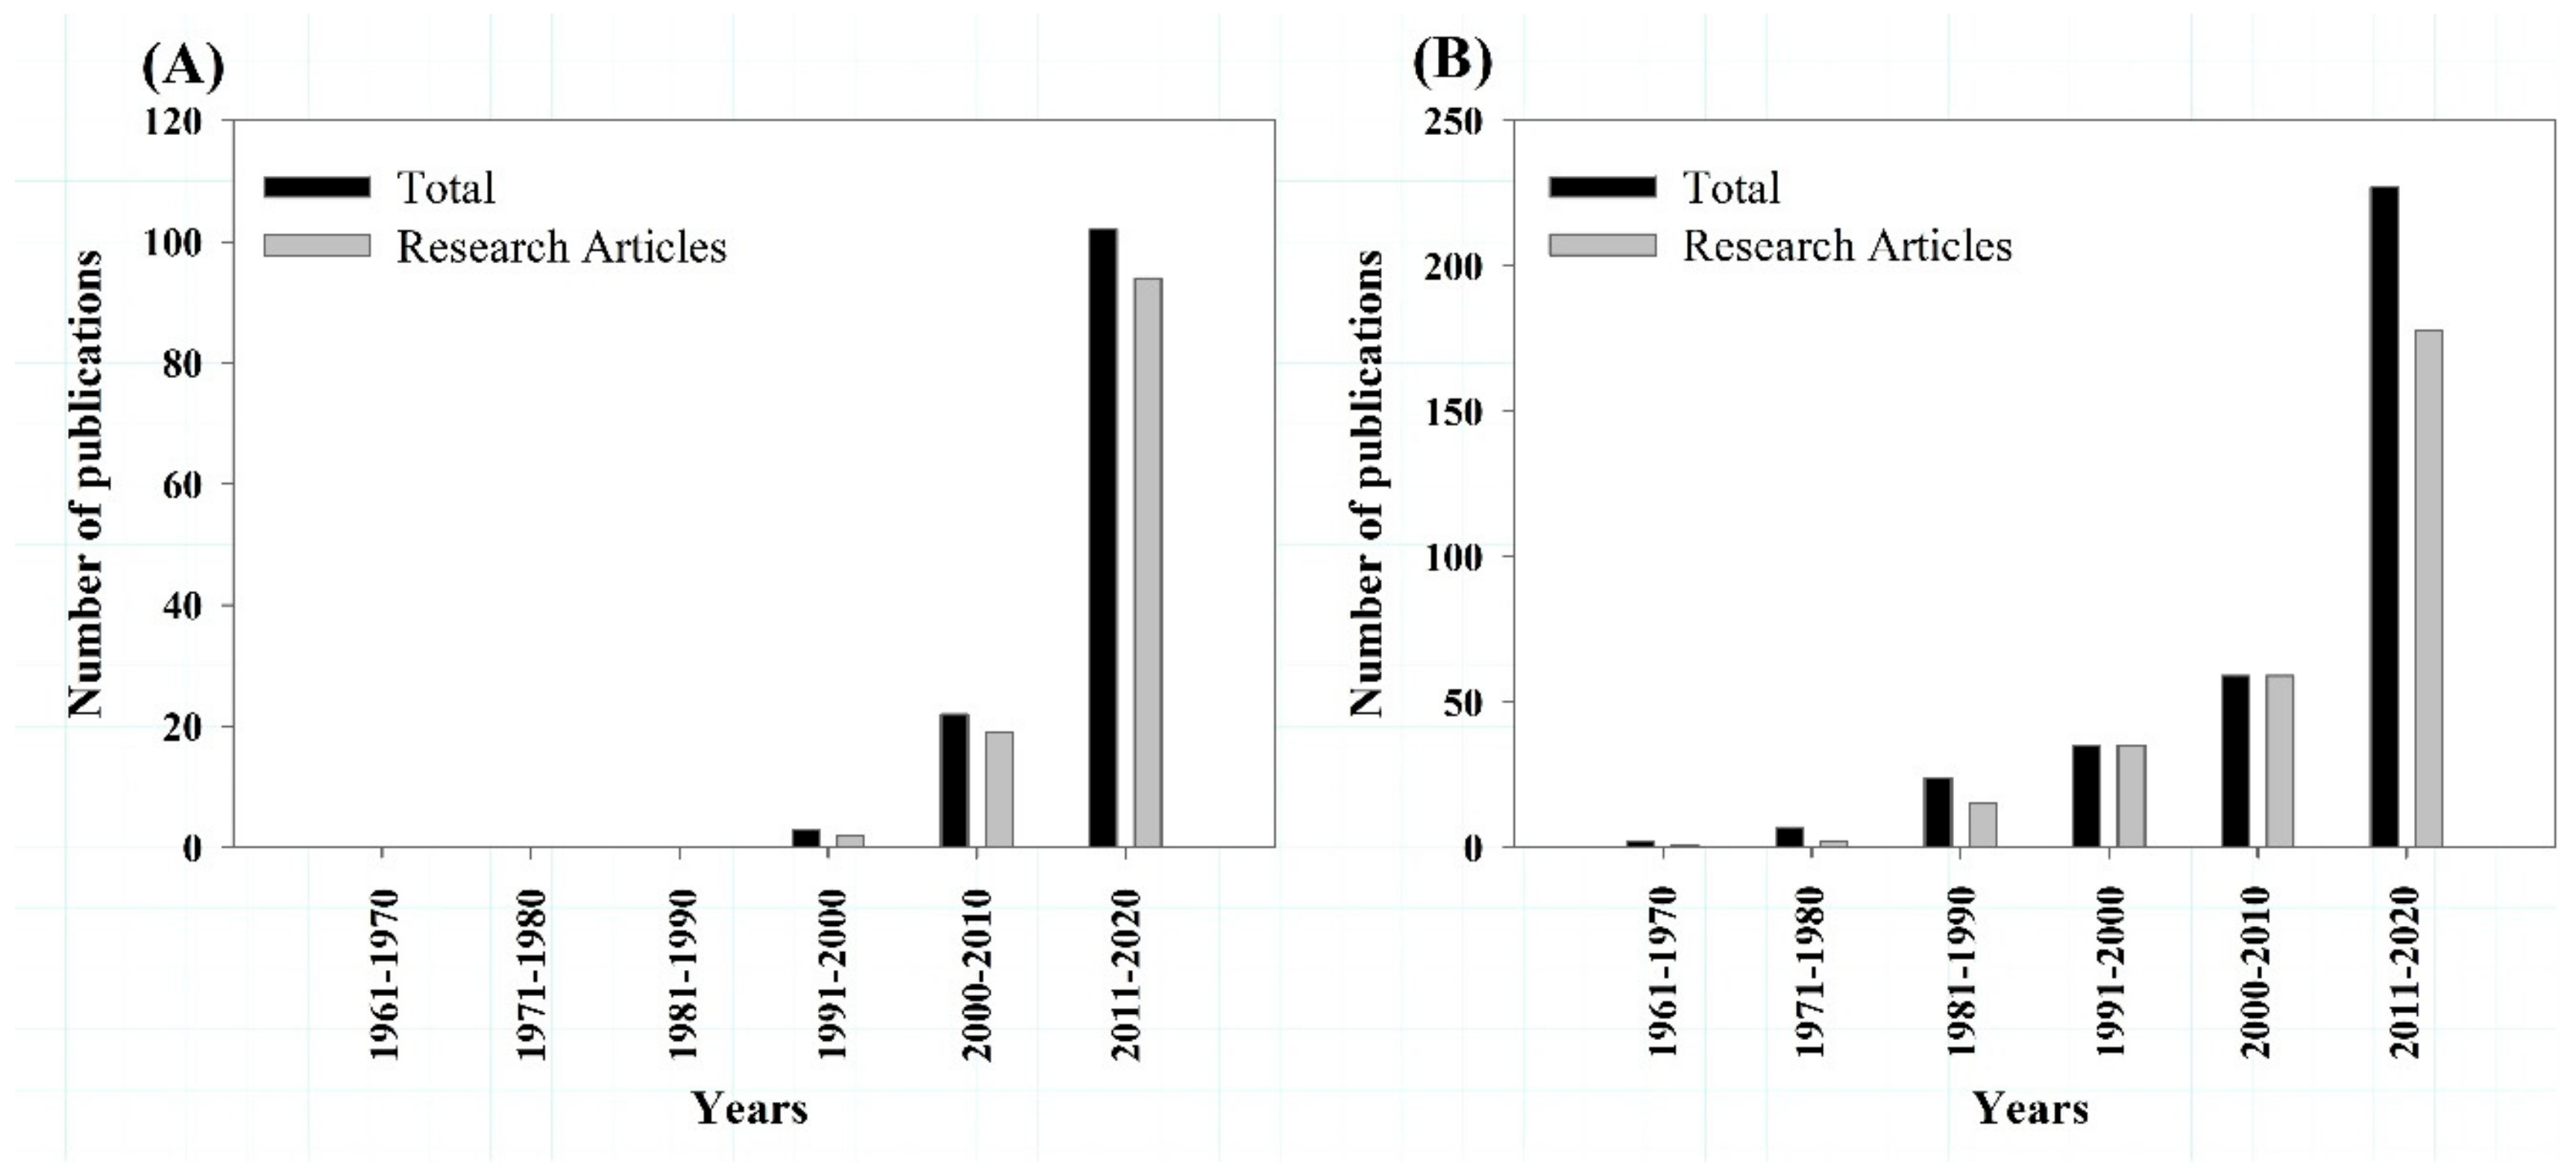
Initially, cyanobacterial biomass was remotely estimated using chl-a concentration as a proxy, since it is the primary and dominant photosynthetic pigment in BG algae [15]. However, chl-a is not an accurate estimator of cyanobacterial biomass because it is a common pigment to almost all phytoplankton groups [16]. Therefore, remote sensing studies have evaluated the use of phycocyanin (PC) to remotely estimate its concentration and consequently cyanobacteria [5,6,7,8,17,18,19]. Figure 1 shows the number of published studies in two different databases: Web of Science (webofknowledge.com, Figure 1A) and Science Direct (www.sciencedirect.com, Figure 1B). The reference search was based on the following terms: “remote”+”sensing”+”phycocyanin”. Publications were divided into a total number of publications (considering book chapters, research articles, and protocols) and only research articles. Although Science Direct presented a higher number of research articles, some of the publications were not exactly on the topic of remote sensing of PC. Instead they covered other topics, such as continuous electrophoresis of amino-acids, cyanobacterial genome, cell counting, and other articles related to PC as a photosynthetic pigment and not with remote sensing. Nevertheless, a trend was observed in both databases: Most of the studies using remote sensing techniques to monitor PC were produced in the last three decades.
Since the use of optical remote sensing for the monitoring of PC concentration (and consequently cyanobacteria) has evolved in the last years, this technique has been implemented for water quality monitoring purposes. The “Experimental Lake Erie Harmful Algal Bloom Bulletin” developed by the National Oceanic and Atmospheric Administration (NOAA) is one example of the use of remote sensing imagery to assess HABs. This program has the goal to monitor algal blooms and to forecast the spreading of HABs in the West part of Lake Erie, USA [20]. Another project that is currently under implementation in the US is the “CYAN Project”, led by United States National Aeronautics and Space Administration (NASA), NOAA, Environmental Protection Agency (EPA) and United States Geological Survey [21]. This project has as its main goal the development of an early warning indicator system using historical and current satellite data of United States freshwater systems. In a global scale, the United Nations Educational, Scientific and Cultural Organization (UNESCO), through its International Initiative on Water Quality (IIWQ) launched the first comprehensive worldwide water quality online portal for freshwater systems, lakes, and rivers, retrieved from earth observation data. In this portal, the UNESCO/IIWQ is enabling the public to access earth observation’s derived water quality data [22].
Because of the growing relevance of the monitoring of cyanobacteria using remote sensing techniques, several articles compared bio-optical algorithms for the estimation of PC concentration [19,23,24,25,26,27]. However, most of the previous reviews used limited numbers of bio-optical algorithms, expert-based judgments for algorithm comparison and suggested directions for future research. Therefore, the goal of this study is to conduct a bibliometric analysis and to highlight the gap and the evolution of this research field based on published work. To do that, this review is based on a quantitative approach to analyze research articles collected from the Web of Science (WoS) Core Collection database in the past 30 years (from 1991 to 2020). Compared with existing reviews on remote sensing estimation of PC, the present study will not focus on the description and comparison of remote sensing algorithms. Instead, the quantitative approach provides a comprehensive portrayal of the knowledge structure of this research field in the last three decades.
2. Materials and Methods
2.1. Previous Reviews on Remote Sensing of Phycocyanin
Several articles have evaluated bio-optical algorithms for the estimation of phycocyanin [19,23,24,25,26,27]. The first two review articles were published in 2008 and 2013 by Ruiz-Verdu et al. [23] and Ogashawara et al. [19]. Ruiz-Verdu et al. [23] compared the performance of empirical, semi-empirical, and semi-analytical algorithms in Spanish and Dutch lakes and concluded that the semi-analytical algorithm proposed by Simis et al. [5] and the algorithm proposed by Schalles and Yacobi [28] showed the best performances. Ogashawara et al. [19] assessed semi-empirical algorithms for Funil hydroelectric reservoir (Brazil) and catfish ponds in Mississippi (USA) and concluded that the algorithms proposed by Simis et al. [5] and Mishra et al. [18] had the best performances for the estimation of PC, and there were less sensitive to the interference of chl-a. Both studies showed that future research should focus on the removal of the effect of chl-a on PC estimation.
Later, in 2017, Beck et al. [24] using simulated satellite images from an airborne hyperspectral image compared the application of different PC bio-optical algorithms (see Table 1). This study showed that, for the ocean and land colour instrument (OLCI), Simis et al. [5] and Mishra et al. [18] algorithms got the best performances. These findings agree with the ones presented by Ogashawara et al. [19]. Recently, Riddick et al. [26] published a comprehensive comparison of PC bio-optical algorithms applied to MEdium Resolution Imaging Spectrometer (MERIS) imagery from Lake Balaton, Hungary (see algorithms in Table 1). This comparison showed that lower error metrics were observed in the application of algorithms from Simis et al. [5], Mishra et al. [29], and Li et al. [30]. Interestingly, these results suggest that semi-analytical and quasi-analytical algorithms for PC retrieval are more appropriate, especially if applied for lakes with high concentrations of suspended inorganic particles.
While these reviews compared performances of bio-optical algorithms based on in situ hyperspectral spectra and airborne and satellite images, two other reviews were published based on the description of algorithms and an evaluation of the challenges and future perspectives for the field [25,27]. Yan et [25] described several bio-optical algorithms for PC estimation (see Table 1) and highlighted the atmospheric correction and lack of orbital sensors as the main challenges of this research field. The authors also suggested that more validation studies are needed for the use of OLCI for the monitoring of PC concentrations. Shi et al. [27] also provided a comprehensive descriptive review of bio-optical algorithms for chl-a and PC concentration estimation (see Table 1). As well as Yan et al. [25], this study also showed that OLCI is the main sensor for the monitoring of PC due its spectral band centered at 620 nm. The main challenges for this research field are the development of a universal algorithm for PC retrieval and the estimation of PC in oligotrophic waters [27].
2.2. Data Acquisition
In this research, publications from 1991 to 2020 were analyzed from the Web of Science database. Data acquisition was based on the search for the terms “remote” + “sensing” + “phycocyanin” in the titles, keywords, and abstracts. The type of research was defined to be articles and reviews which resulted in a dataset contained 115 publications published between January 1991 and January 2020 (see Supplementary Table S1 for the full list of publications). As shown in Figure 1, there is a clear fast increase in the number of research papers published in this field in the last two decades. From 1991 to 2000 there were only 2 articles fitting the selection criteria, about 1.73% of the total amount of publications within the period (1991–2020). A decade later (2001–2010), it increased to 19 published articles representing a 16.52% of the total original articles within the period (1991–2020). From 2011 to 2020, the number of publications grew to 94 published articles, to be 81.73% of all the publications within the entire period (1991–2020).
2.3. Methodology
For the bibliometric analysis of the dataset, the present study uses CiteSpace (v.5.6 R2) (http://cluster.cis.drexel.edu/~{}cchen/citespace/, Accessed 08 January 2020) which is a Java-based application for the visualization and analysis of trends and patterns in the scientific literature [47,48]. This software is one of the most used tools for bibliometric analysis due to its capabilities of bibliographic coupling, cluster maps, and dual-map overlays (Pan et al. 2018).
This study takes the advantages of the capabilities of CiteSpace (v.5.6 R2) to perform (1) the co-citation analysis and (2) the bibliometric mapping. The dataset presented in Section 2.2 was analyzed using document co-citation analysis. This is based on a network of co-cited references that reveals underlying intellectual structures based on how two research articles may be linked. The connection between two publications is based on the number of times that they have been cited together. If the frequency of co-citation between the two publications is high, the idea presented in both works is strongly linked.
In this study, the bibliometric analysis was defined for the entire period of the publications (from 1991 to 2020) and for each decade. Each dataset was analyzed to evaluate the evolution of the relationships between key ideas in a field for each period [49]. Citations clusters were computed for all periods by clustering algorithms implemented in CiteSpace [48]. The labeling of each cluster was extracted from article titles, using both the latent semantic indexing (LSI) and Log-Likelihood Ratio (LLR).
3. Results
3.1. 30 Years of Remote Sensing of Phycocianin
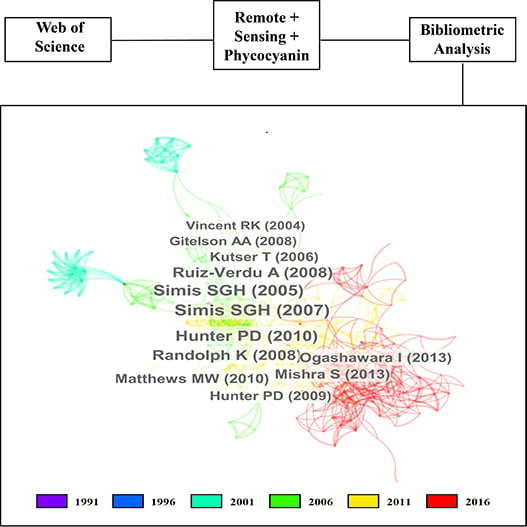
Figure 2 shows the co-citation network structure over the 30-year period created with CiteSpace (v.5.6 R2). The software generated a co-citation network of 301 nodes and 1062 links. In this network, each node represents a cited publication within the core dataset and the size of the node represents the frequency of citations. The link between two nodes represents a co-citation relationship and colors represent the year of the publication. Overlaying the co-citation network structure are the top 10 most cited publications – the font size of each reference indicates the frequency of citation (see Appendix A for the list of the publications). The position of each reference is related to the position of their respective node. Therefore, it was observed that most of the most cited publications are between 2005 to 2013.
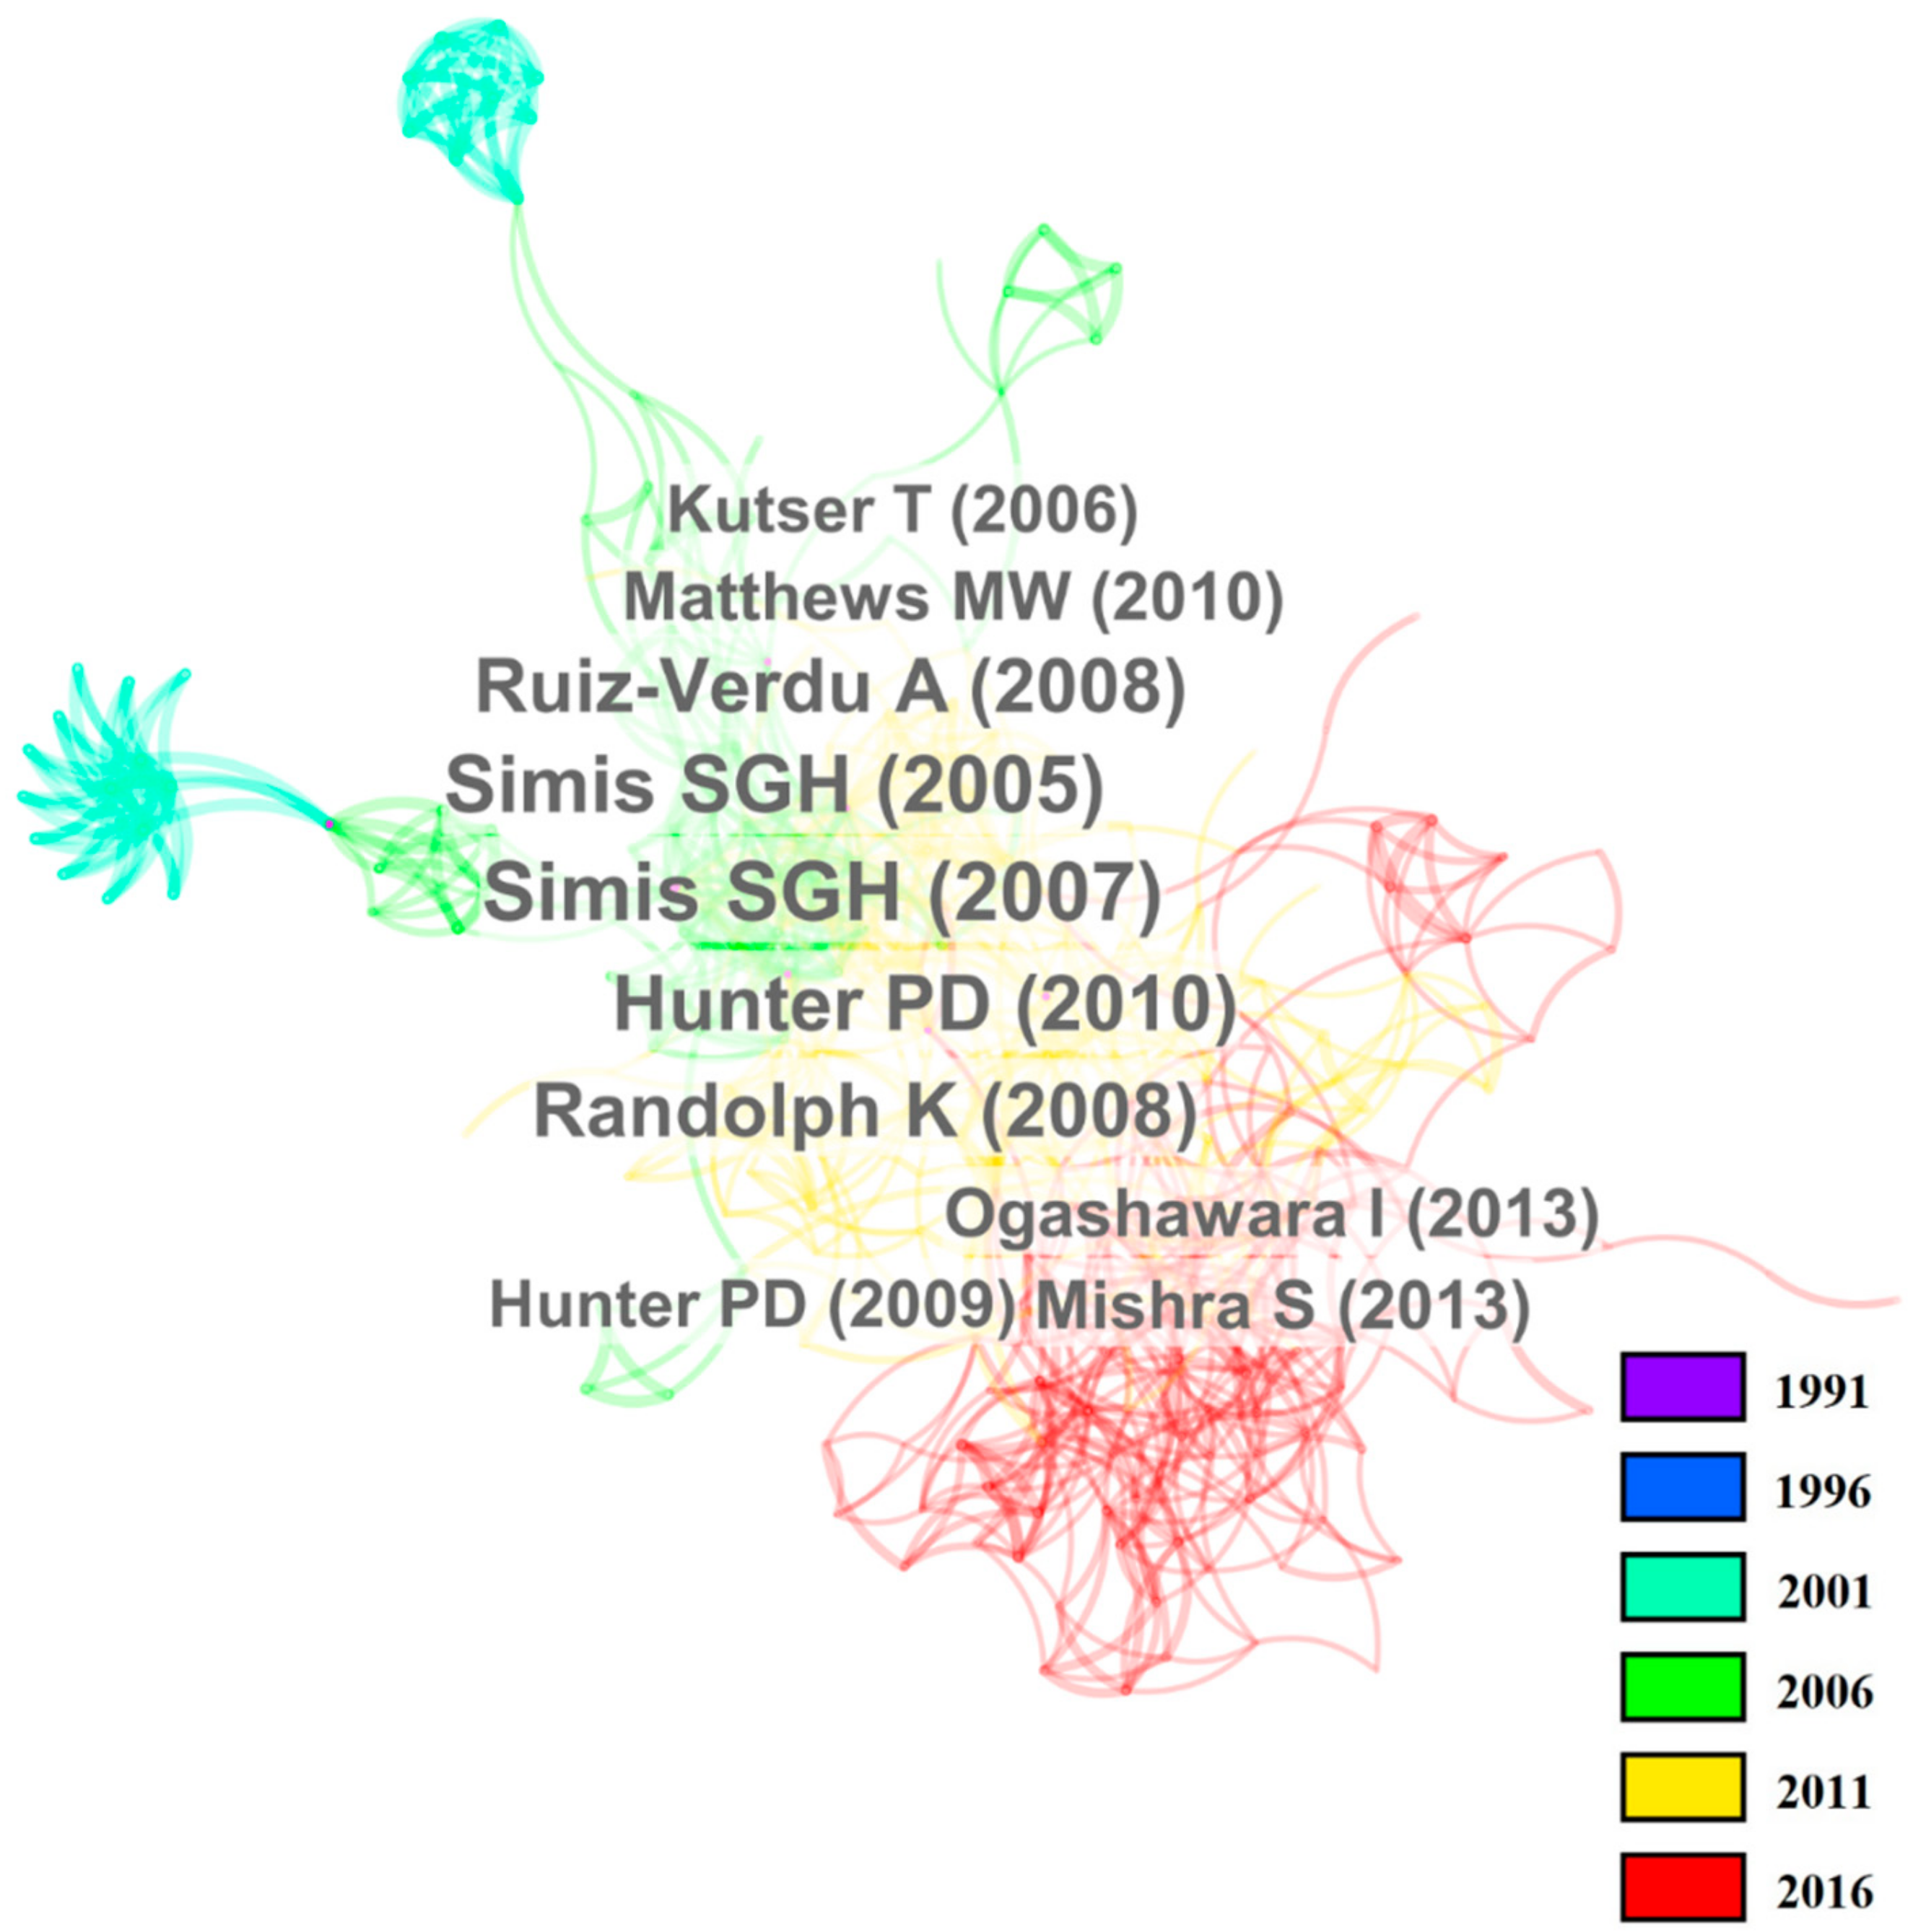
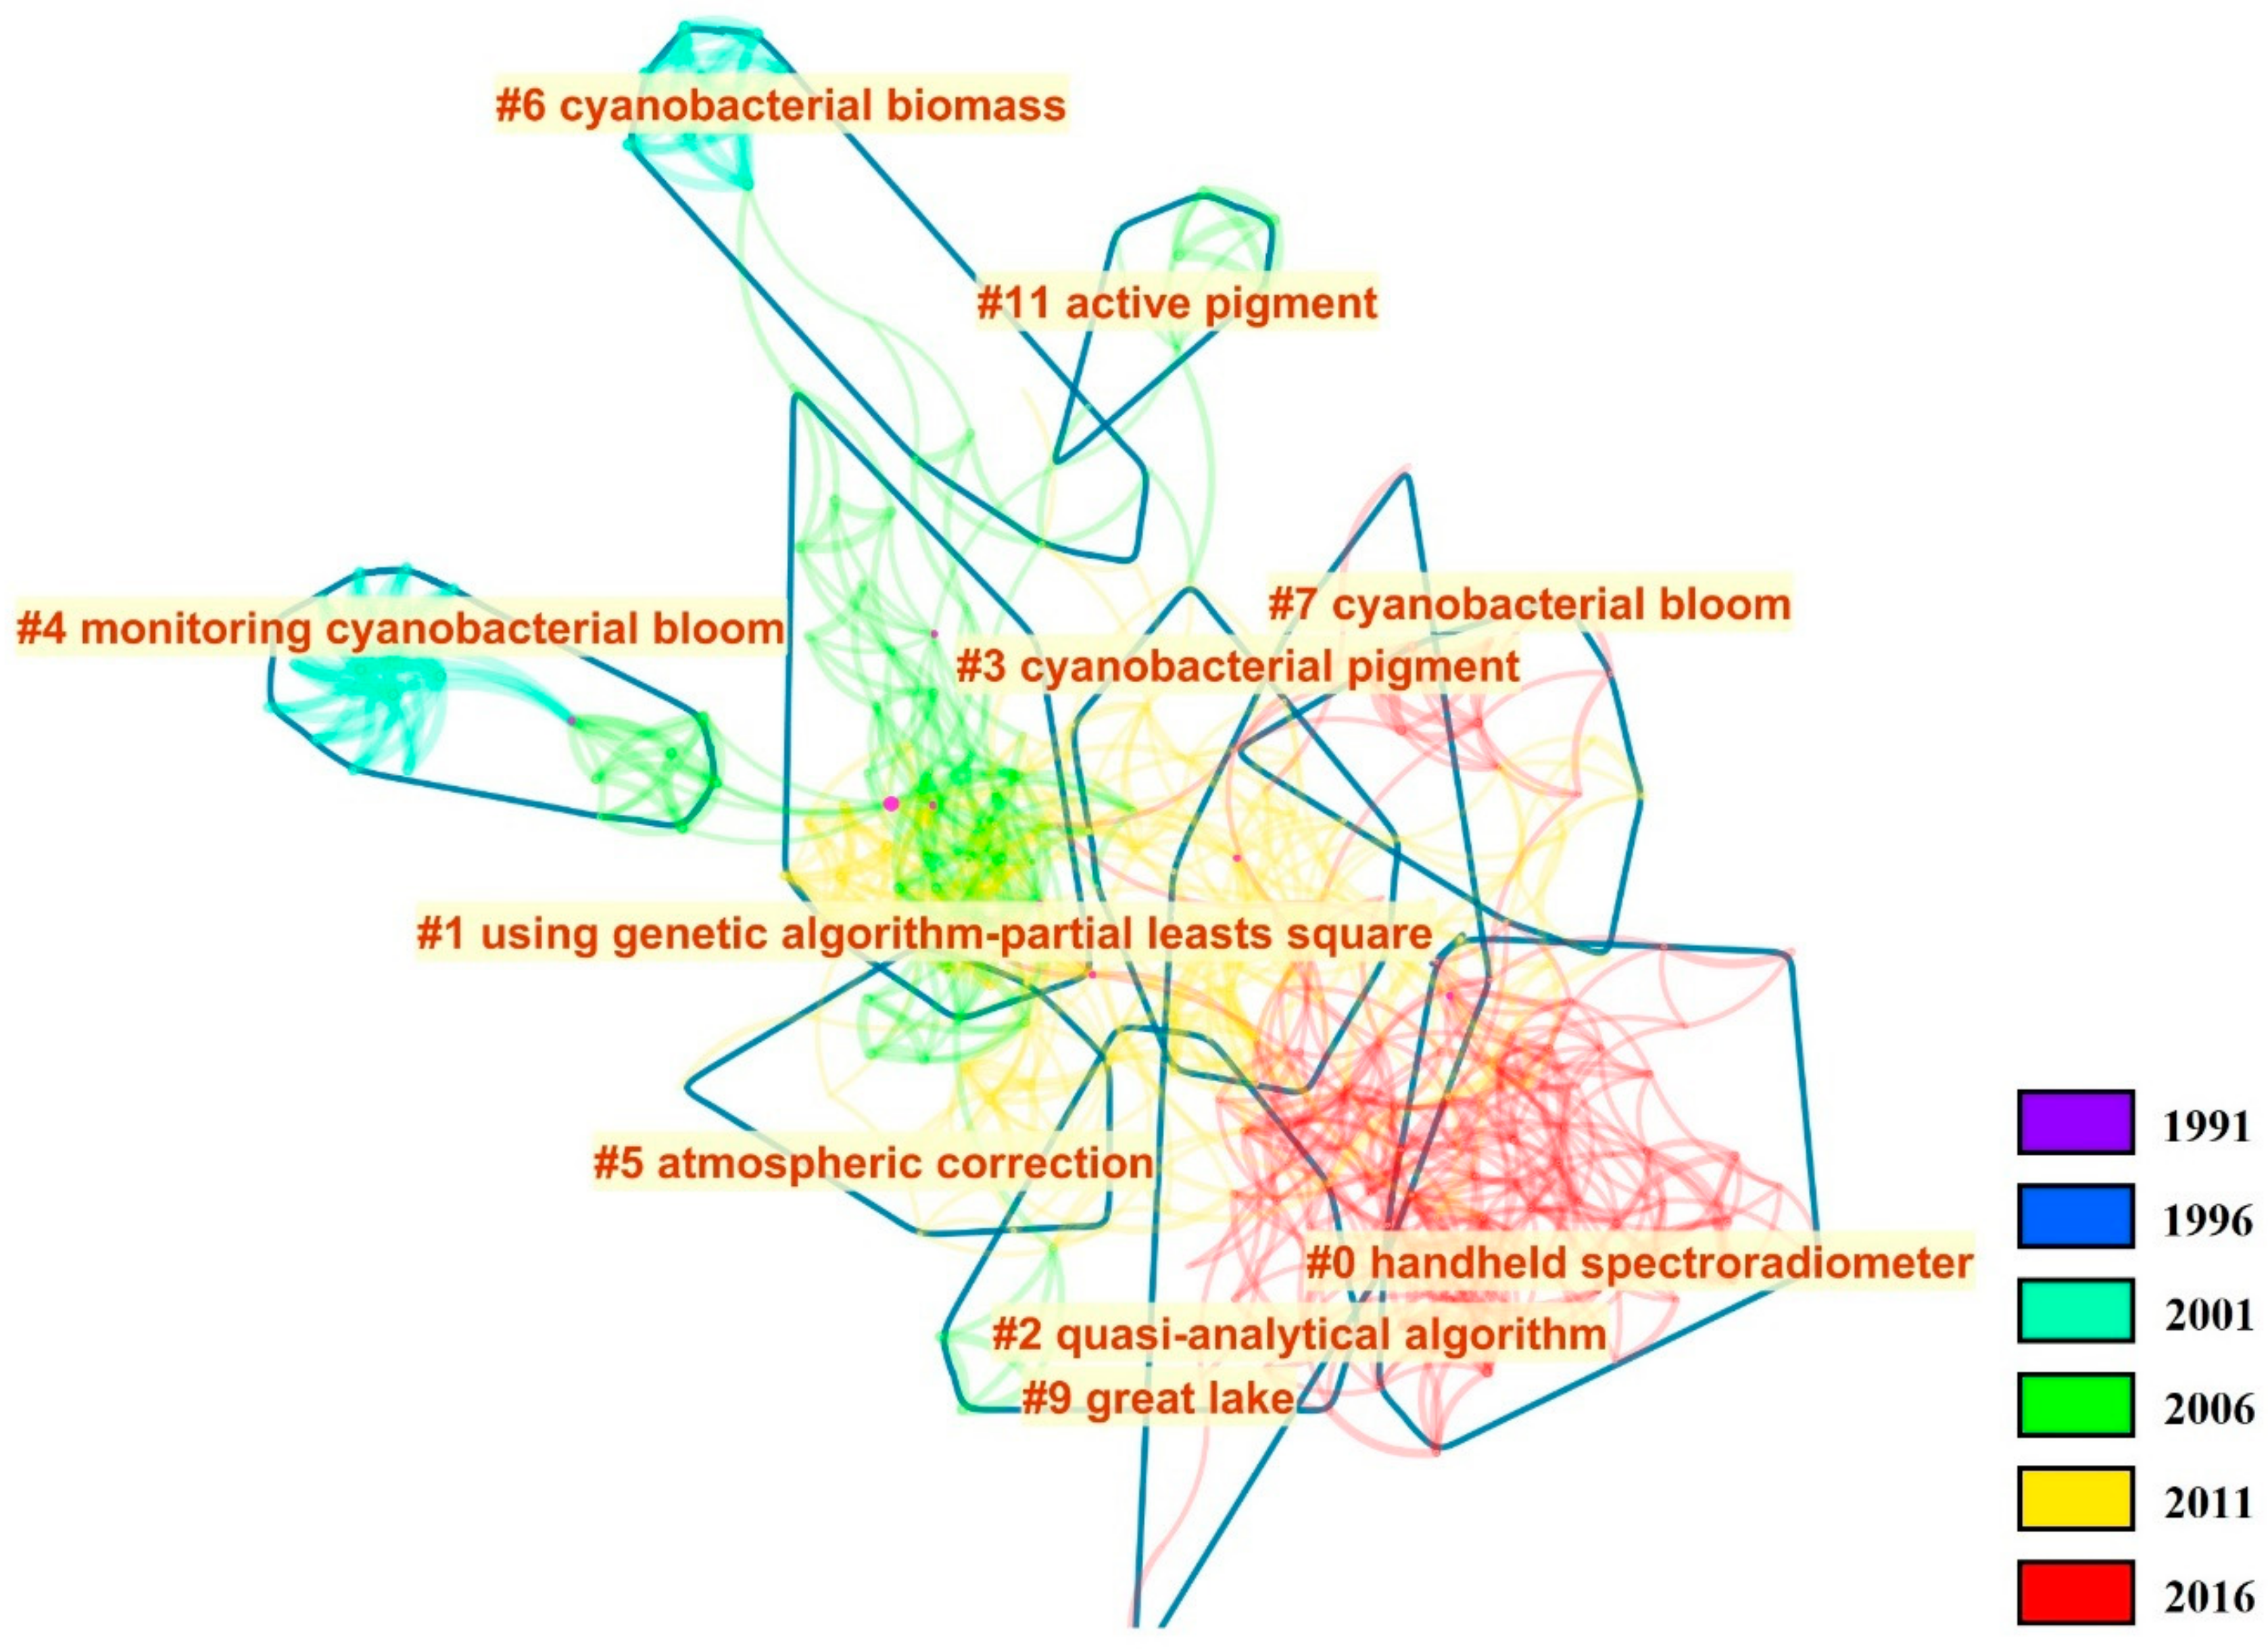
From the co-citation network structure, it was also possible to identify clusters in order to build a knowledge domain. Figure 3 shows the network with ten cluster labels extracted based on the titles of the publications using the LLR method, which is the default algorithm of CiteSpace, to extract the cluster labels. LLR was chosen especially because of this algorithm allows the computation of a p-value for each cluster. Table 2 presents the ten clusters in this co-citation network structure with their labels extracted by the LSI algorithm as well as the labels and p-values from the LLR algorithm. It was observed that earlier studies were clustered together on research domains related to the monitoring of cyanobacteria or on their pigments. In the second decade, studies were focused on the algorithm development for atmospheric correction and for cyanobacteria pigment. In the third decade, studies were focused on the development of quasi-analytical approaches for the estimation of PC concentration and in situ measurements of remote sensing reflectance (Rrs).
Similarly, Table 2 shows the main labels extracted by the LSI and LLR methods for each cluster (organized by mean cited year). It was observed that three of the clusters’ labels were the same for both methods, the differences occurred in clusters numbers 0, 1, 4, 5, 7, 9, and 11 (see Table 2). Table 2 also lists the mean year of the publications within each cluster, which allowed the observation of the same trend of evolution of the research topics. Publications started covering more the biological and biochemical at the beginning of the field and topics related to remote sensing and algorithm development in the second decade. The full list of labels is presented in Appendix B.
3.2. Decade-by-Decade Analysis
To compare the evolution of the remote sensing of PC research field, a decade-by-decade analysis was used. Figure 4, Figure 5 and Figure 6 show the publication co-citation network over the decades 1991–2000, 2001–2010, and 2011–2020, respectively. Labels of the clustering per decade are presented in Table 2, Table 3 and Table 4.
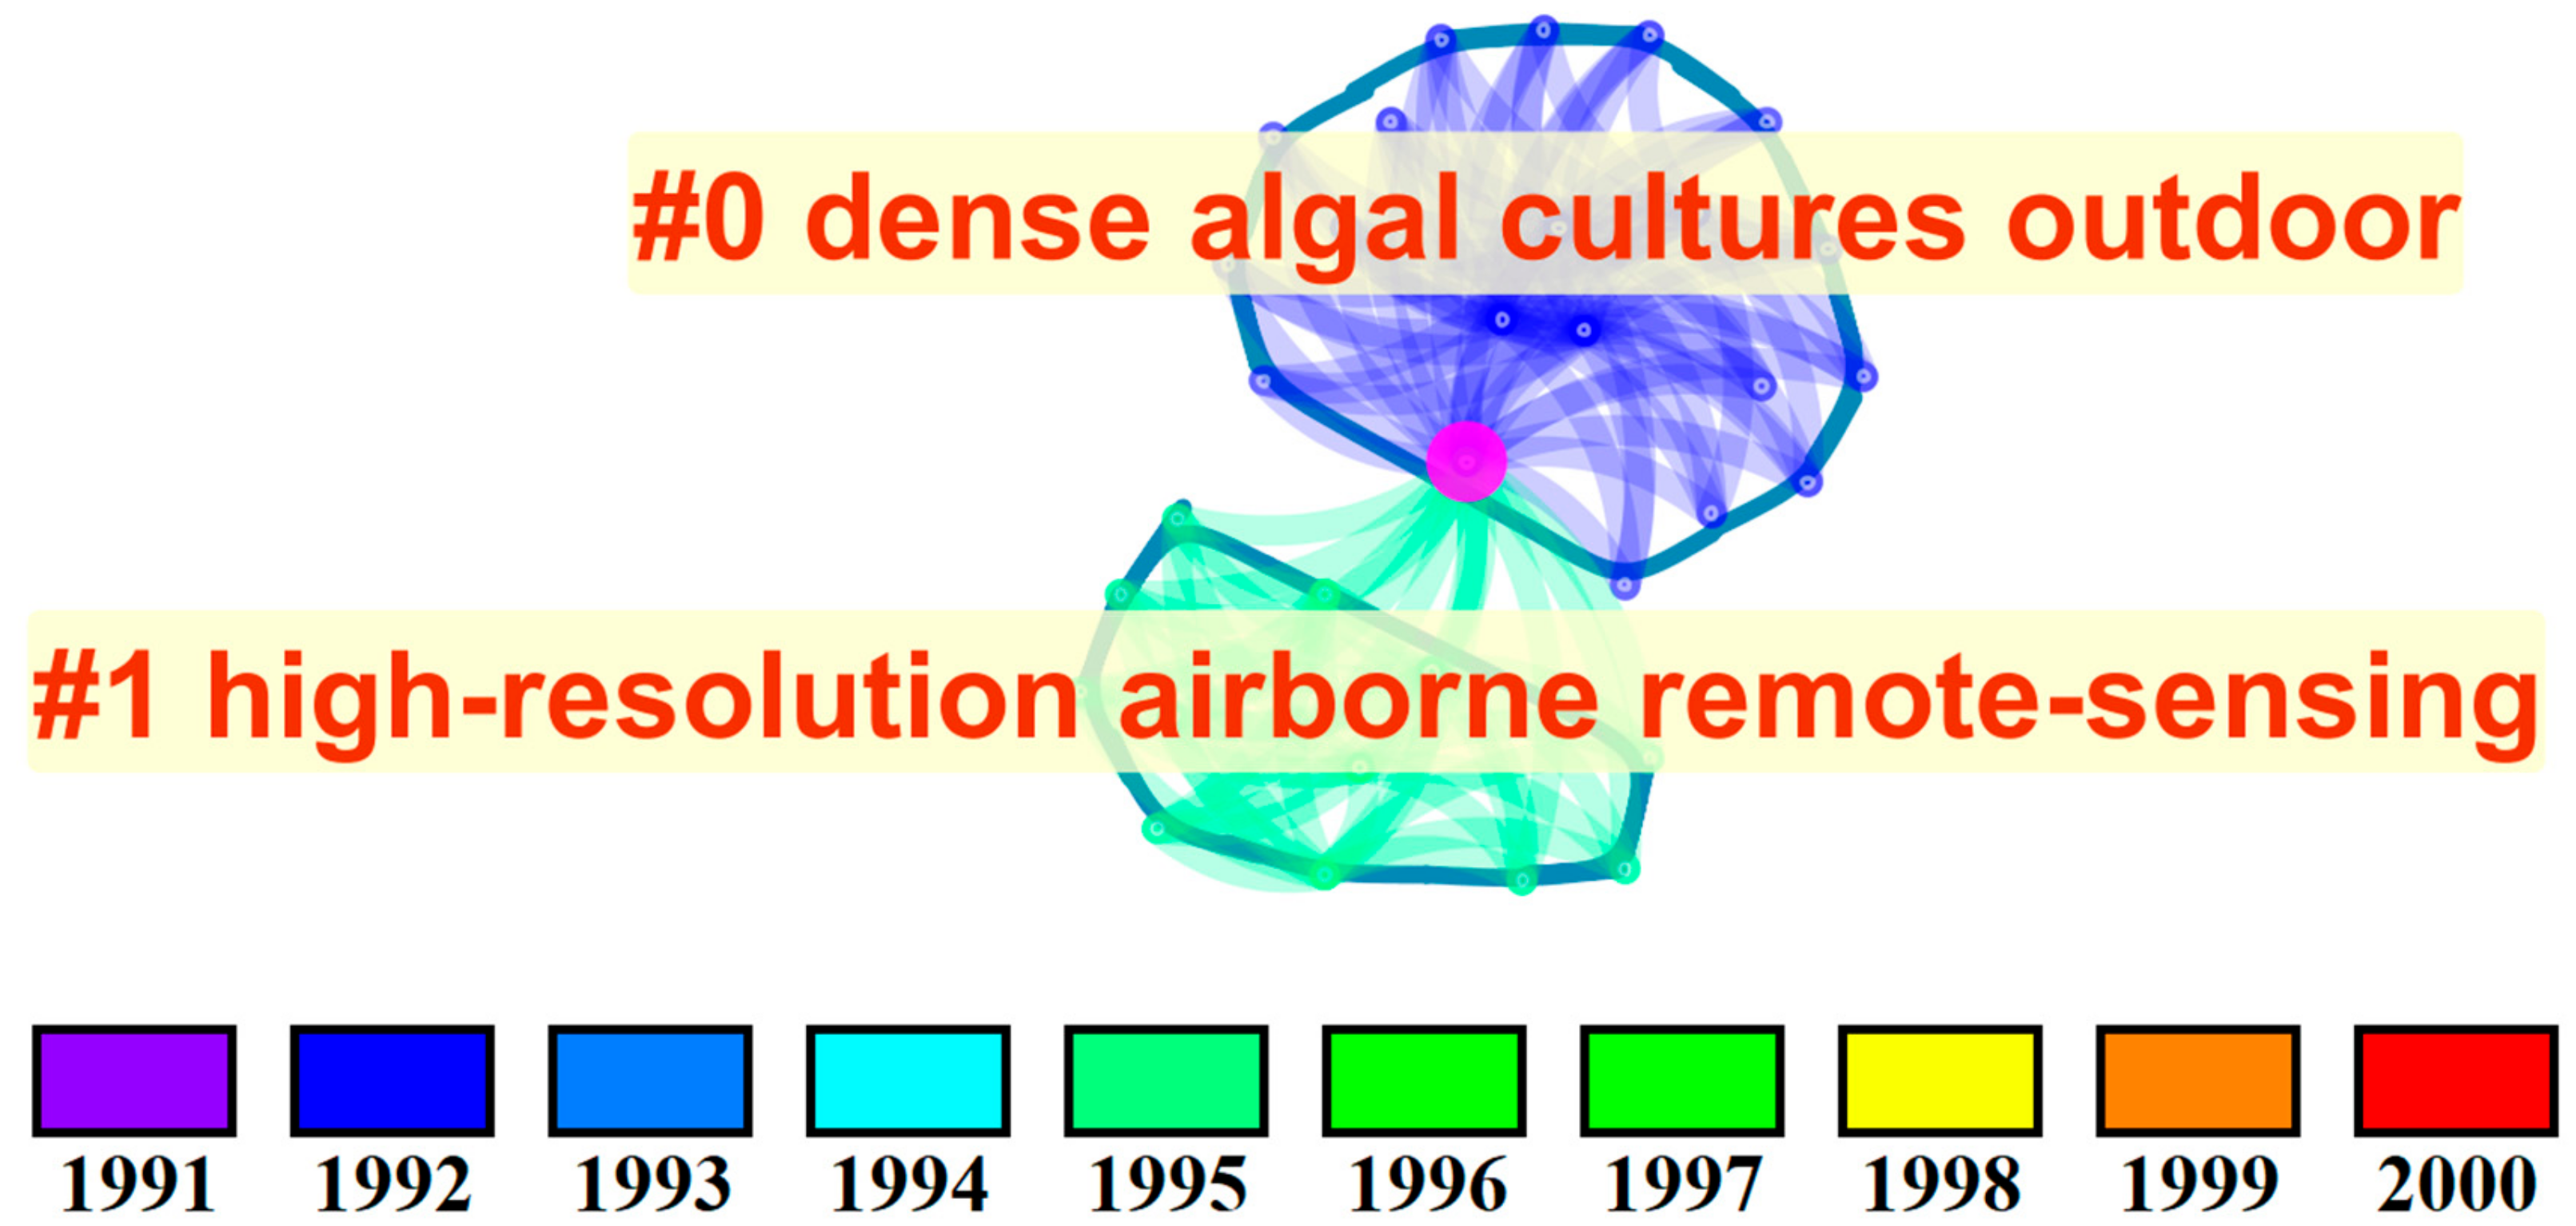
3.2.1. Period I (1991–2000)
Figure 4 shows the co-citation network of remote sensing of PC publications from 1991 to 2000. It was observed that in this period there were only a few publications that could be distributed in only two co-citation clusters. These two clusters contain 41 nodes and 126 links and the main labels for them were: (1) dense outdoor algal cultures; and (2) high resolution airborne remote sensing (see Table 3). These two clusters show the two research lines in this field: (1) the image acquisition, and (2) processing and the biochemical characterization. The first analyzed decade has a small network due to the lack of publications in this period. However, it was observed that studies were based on the acquisition of radiance data and the determination of phytoplankton pigments.
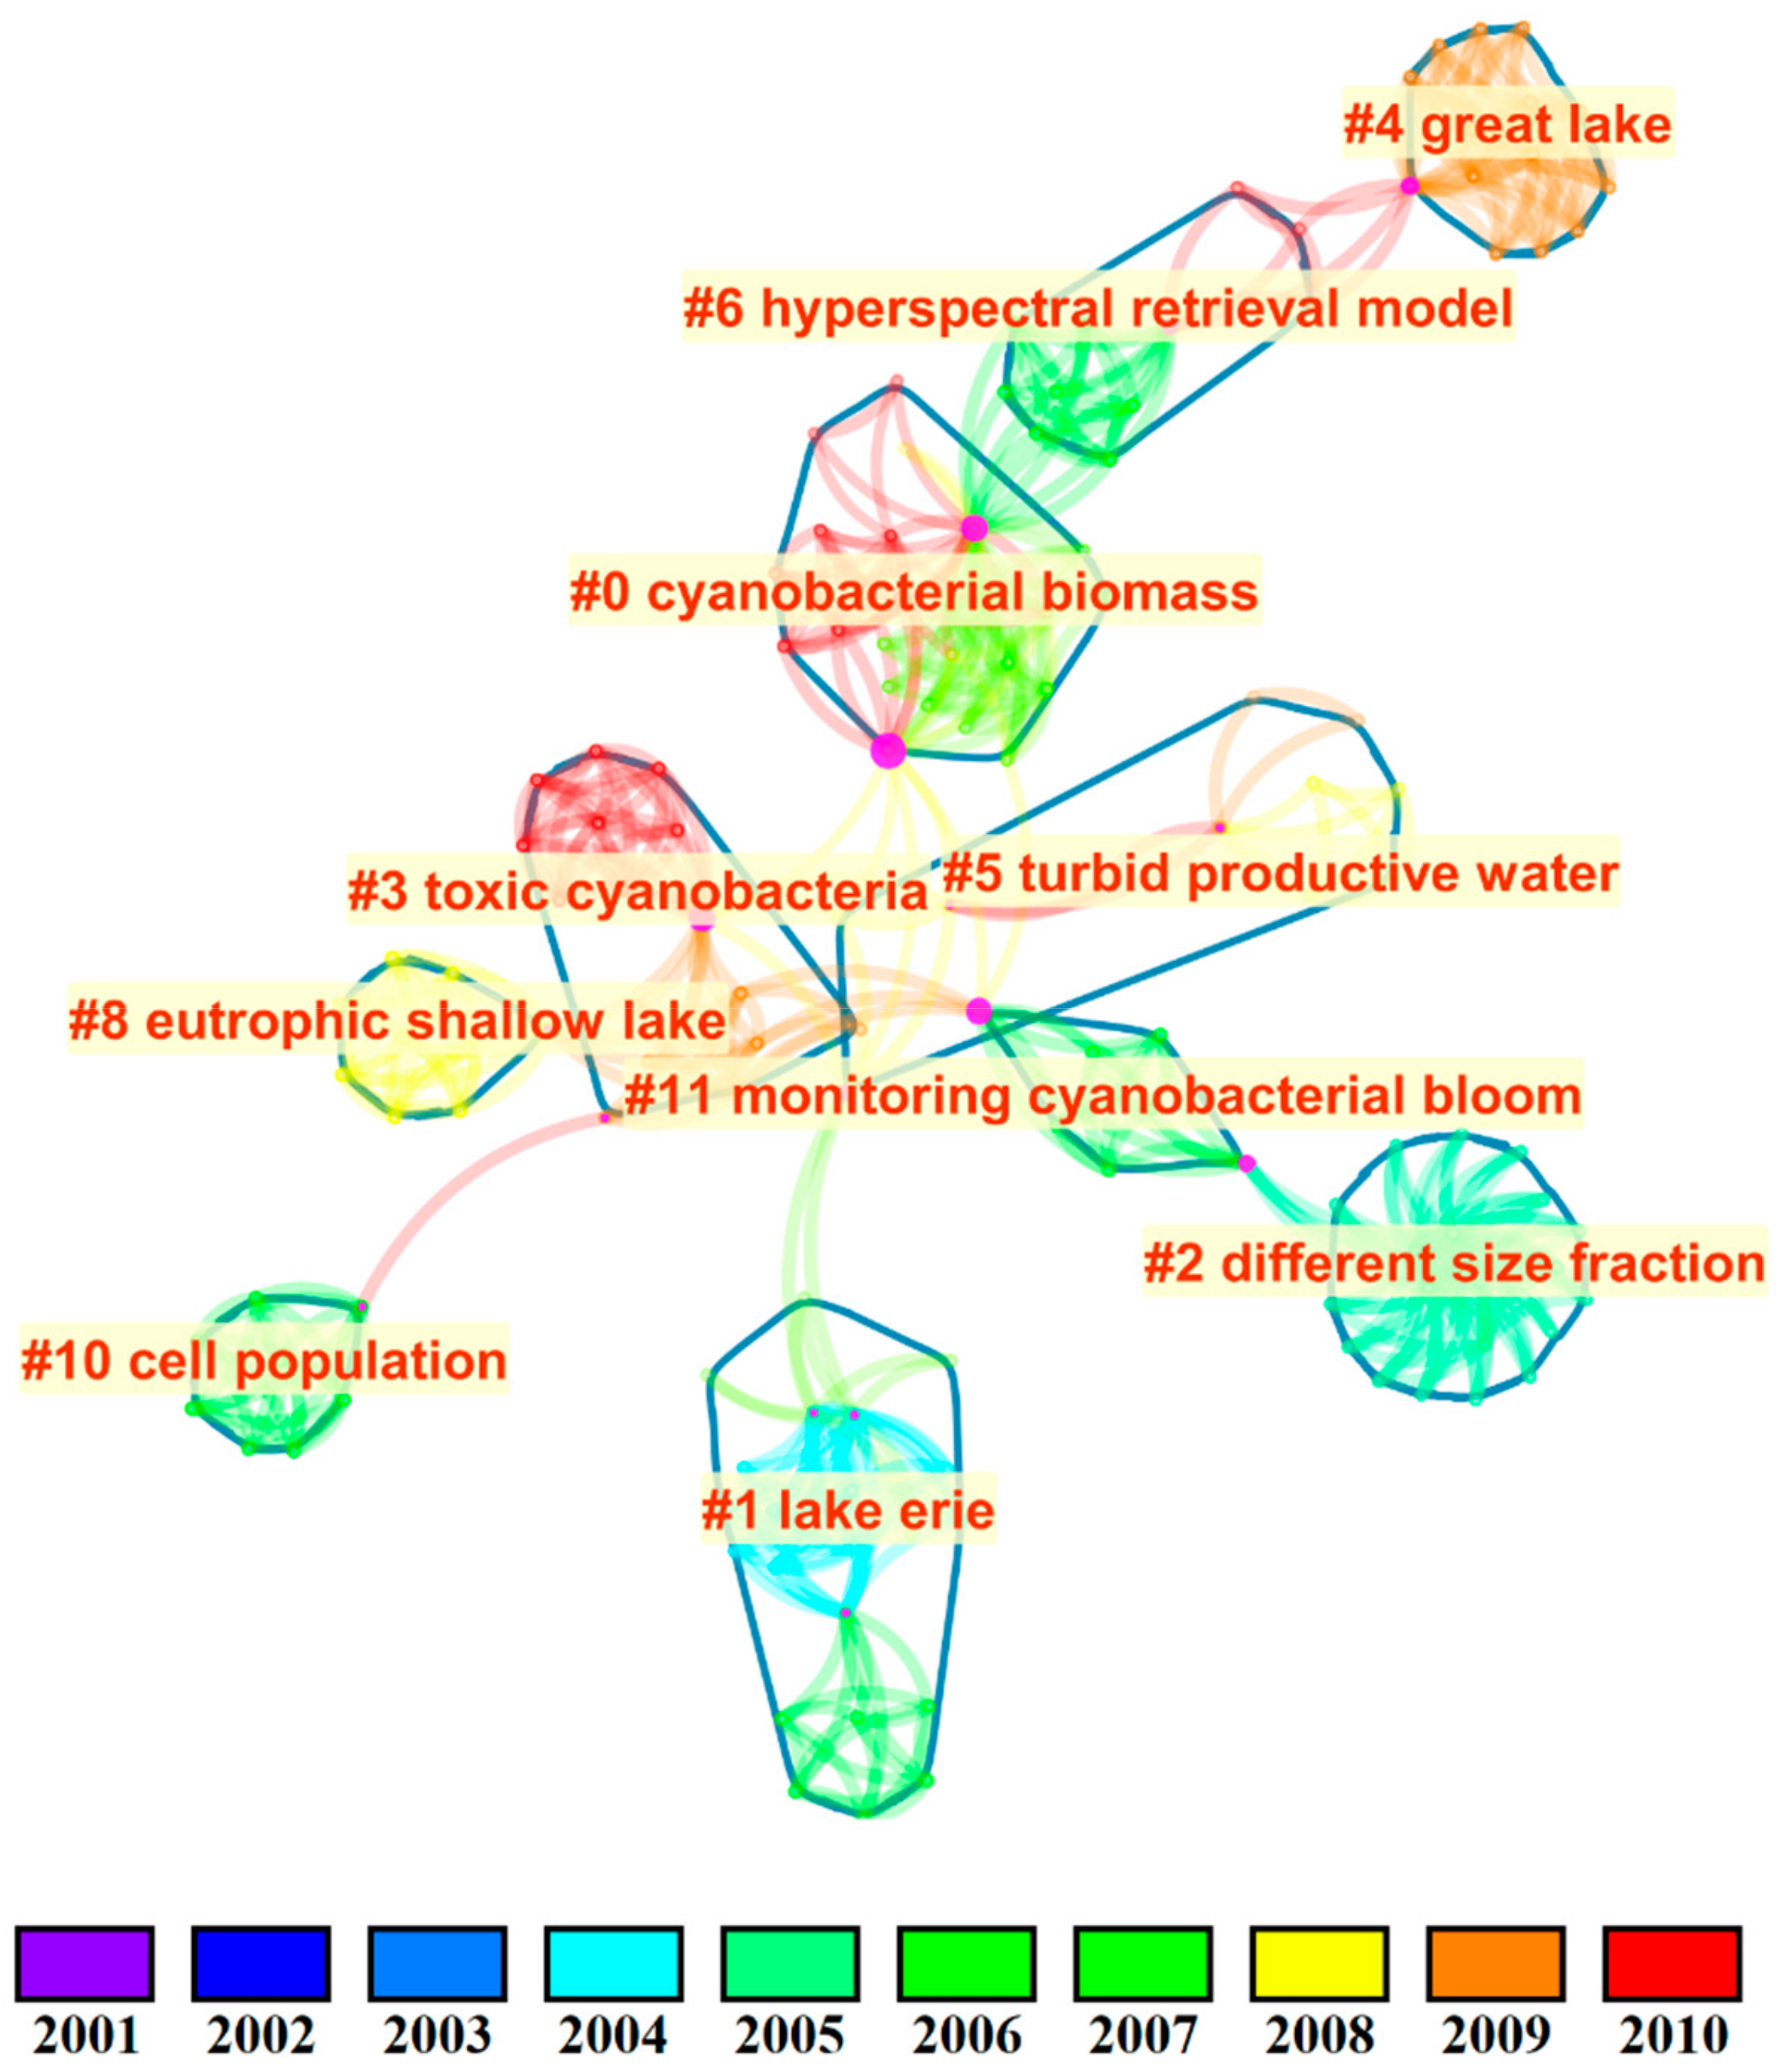
3.2.2. Period II (2001–2010)
Figure 5 shows the co-citation network of remote sensing of PC publications from 2001 to 2010. Different from the previous decade where only two clusters were identified, there are ten different co-citation clusters in this period. Not only the number of co-citation clusters was higher in this period, but the number of nodes and links also increased to 166 and 612 respectively. The main label for each cluster is presented overlaying the network in Figure 5 and in Table 4. Surprisingly, some labels were related to location, such as “Lake Erie”, “great lakes” and “eutrophic shallow lake”. This indicates that the location was an important factor driving the research during this period. The need for larger lakes could be related to the spatial resolution of MERIS and moderate-resolution imaging spectroradiometer (MODIS), which were commonly used sensors in publications in this period.
Table 4 presents the labels for each cluster arranged by the mean year of the citations for remote sensing of PC publications from 2001 to 2010. Similarly, to the results in Section 3.1 for the entire period of analysis, in this decade the labels were extracted from the RFIDF and LLR methods. For this period, the two methods only extracted one common label, the other nine labels were different. The interesting observation is that for the LSI method, a location was also extracted as the main label for a co-citation cluster and differently from the LLR method, the location was China. This indicates the growth of Chinese studies in this field. Another interesting label from the LSI method is the “Landsat TM data”, which is not the main sensor for the retrieval of PC, but some studies used empirical relationships to derive its concentration in small to medium aquatic systems [17,50,51].
3.2.3. Period III (2011–2020)
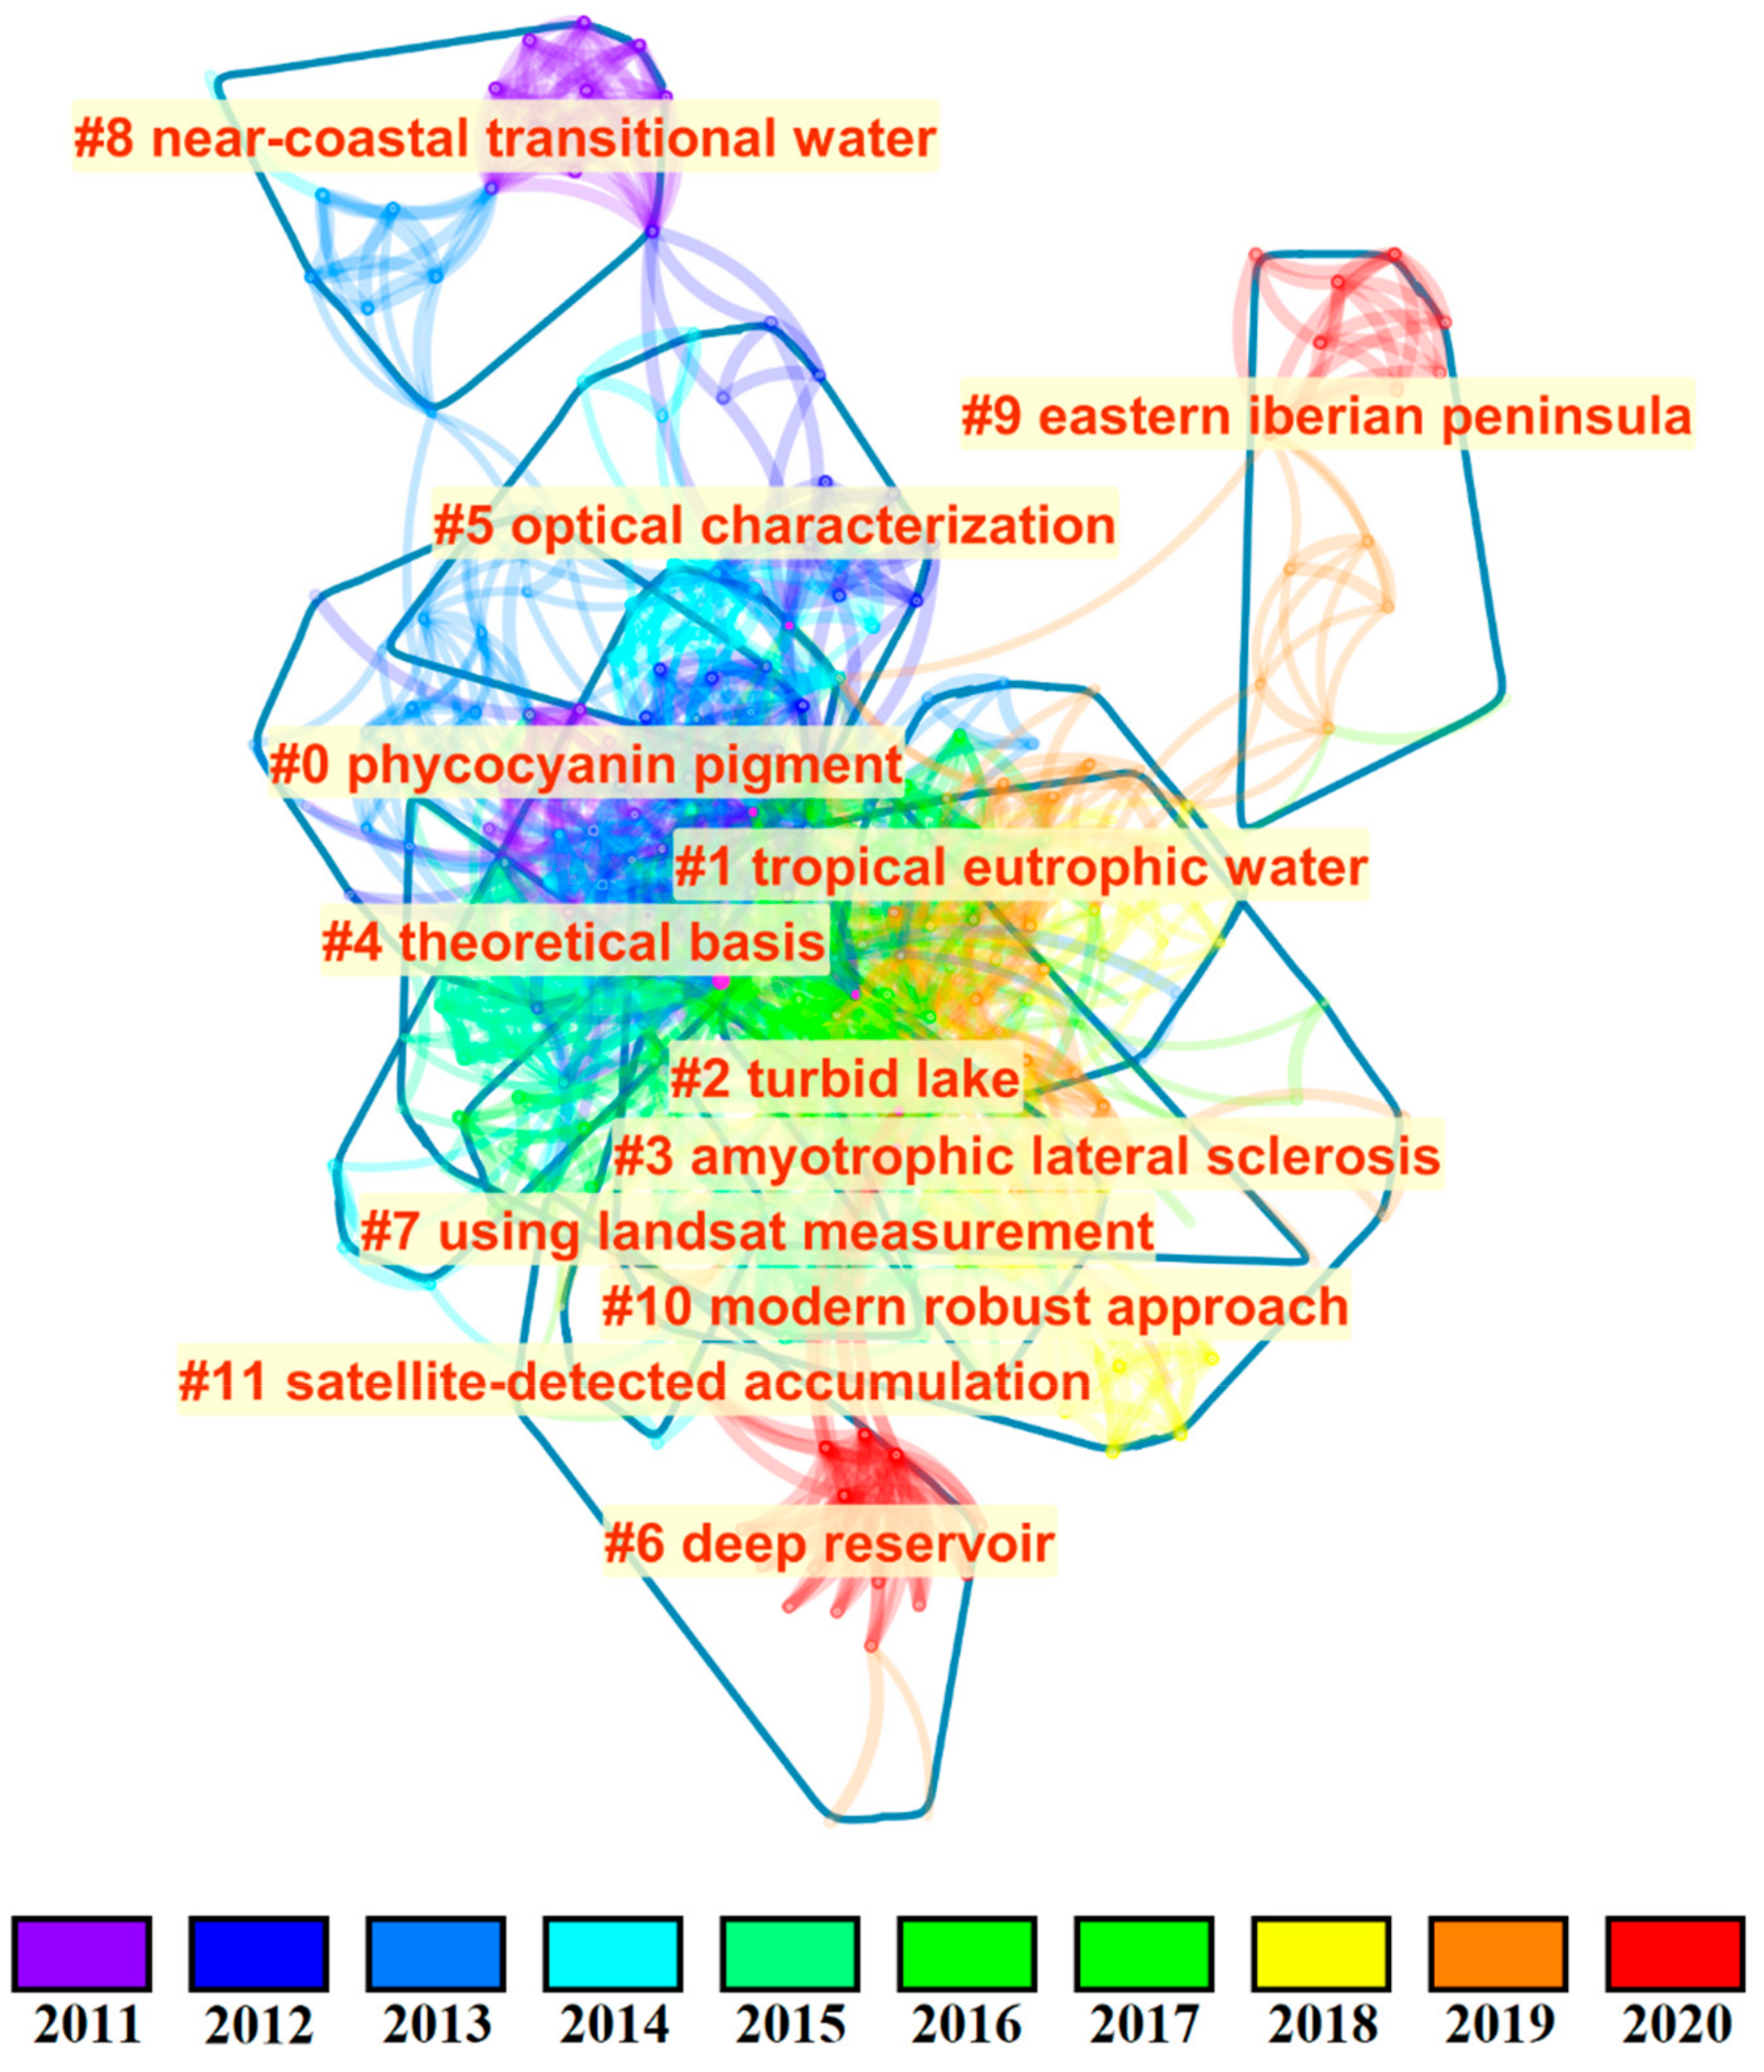
Figure 6 shows the co-citation network of remote sensing of PC publications from 2011 to 2020. In this last decade, it was found the largest co-citation network with twelve clusters, 338 nodes, and 1462 links. The main label for each cluster is presented overlaying this co-citation network in Figure 6 and in Table 5. As observed in the previous period, locations showed to be important labels for some co-citation clusters. However, instead of large aquatic lakes, in this period there is a variety in the locations such as “tropical eutrophic reservoir”, “deep reservoir”, “near coastal transition waters” and “eastern Iberian Peninsula”. This indicates a geographic expansion of the research in the field of remote sensing of PC which is now being conducted in different locations and latitudes, from large temperate lakes in Period II to tropical and coastal water in Period III.
Table 5 presents the main label for each cluster arranged by the mean year of the citations for remote sensing of PC publications from 2011 to 2020. In contrast to Period II, in this period, labels extracted via RFIDF and LLR methods were completely different with no common label for one cluster. While some labels are still common in comparison to Period I and II, it was observed of new labels such as “new scheme”, “theoretical basis” or “modern robust approach”. This indicates the development of different approaches than the ones developed in period II. Overall, this period could be characterized by the addition of new study sites—which is important for assessing global coverage of PC—and the development of new remote sensing algorithms.
4. Discussion
The increasing number of publications in the last decade can be related to the increasing number of HABs occurrences worldwide. Although HABs have been known to affect animal health since the end of 19th century [52], several studies indicate that they are currently increasing globally. A recent study in the United States showed that the number of days with HAB will increase from about seven days per year per waterbody to 18–39 days in 2090 [53]. This increase in the number of HAB events and the growing interest of policymakers for developing monitoring tools could be related to the increase in the number of publications observed in the last decade (Figure 1). Additionally, the development of orbital sensors with water quality monitoring capabilities also played an important role in the increase of the number of publications in this field [54].
Based on the results from the previous section (Section 3) and on the previous algorithms reviews [19,23,24,25,26,27] there are some perspectives for the next decade of publication on the estimation of PC concentrations from remotely sensed data. The result from the co-citation cluster labels showed an evolution on the study site locations which started locally with airborne imaging of specific lakes and laboratory experiments (Period I, Figure 4). By the use of earth observation satellites, it was possible to shift the location of the studies from local and lab cultures to larger lakes such as the Great Lakes in the United States and Lake Taihu in China (Period II, Figure 5). The use of larger aquatic systems as study sites are probably related to the spatial resolution of orbital sensors used for ocean color remote sensing in this period: MERIS (300 m) and MODIS (1000 m). Additionally, the monitoring of PC based on its absorption feature at 620 nm was only possible using MERIS images (nowadays OLCI images are available). Due to the spatial limitation of the satellite’s sensors, the monitoring of PC could only be conducted in larger aquatic systems. Period III showed the expansion to lower latitudes which are areas in which cyanobacteria develop well due to high temperatures [55]. Additionally, higher temperature increases internal phosphorus loading and rates of soil phosphorus regeneration which are used as a nutrient source for cyanobacteria blooms [56]. Thus, study sites in tropical aquatic systems and coastal areas were investigated. It was interesting that during this period, Landsat satellite was used even without the spectral band centered at 620 nm which is the spectral band related to the peak of PC absorption. This could be related to the need to monitor medium to small aquatic systems, which are commonly used for water supply. This was also observed for the monitoring of other water quality parameters with new satellite sensors with a better spatial resolution such as Sentinel 2/Multispectral Instrument (MSI) which has been used for the monitoring of chl-a and water transparency in several small to medium inland aquatic systems. Nevertheless, studies focusing on environments from the Southern Hemisphere are still lacking (especially in equatorial regions from Latin America and Africa). In the equatorial region, the small annual temperature range supports the development of HABs which are mainly controlled by wind and rainfall patterns over the watershed [57]. Therefore, one perspective in this field is to continue with this geographic expansion to have more studies collecting data from equatorial regions. To do that it is important to establish partnerships with institutions within these regions, not only for the data acquisition but also for the development of the research field. The availability of a globally representative dataset will allow future researchers to develop a universal algorithm or an algorithm for a specific optical water type (especially oligotrophic waters).
The label analysis also showed a strong presence of satellite sensors such as Landsat TM, MODIS, and MERIS. However, as pointed by Yan et al. [25] using satellite images for the estimation of PC in small inland waters is still a challenge due to the lack of a sensor with high spatial and spectral resolution (or a multi-spectral sensor containing spectral bands needed for the monitoring of PC). Additionally, considering a cyanobacteria monitoring perspective the revisit time of the sensor is also important, since blooms can form in a few hours. Beck et al. [24] suggested that future satellite sensors for water quality should have a spectral band centered at 620 nm and a spatial resolution between 20 to 90 m. However, since the remote sensing of phycocyanin relies on passive remote sensing methods, cloud cover is a major issue, especially in equatorial regions. Because of that, unmanned aerial vehicles (UAVs) have been tested as a tool to collect high spatial and spectral images over small water bodies [25]. However, their use is still limited by battery consumption which does not allow the imaging of large areas. Nevertheless, UAVs can be used to target specific regions where it is known to be the starting point of a bloom. The monitoring of these small regions could be then used for the prediction of the growth of cyanobacteria. Thus, a future perspective to the field of remote sensing of PC is to have more UAV studies being conducted.
Results also showed an evolution in algorithm development, from empirical and semi-empirical to semi and quasi-analytical algorithms. Figure 3 and Table 2 showed that recent studies have been focusing on quasi-analytical algorithms. Recently, Riddick et al. [26] showed that semi-analytical and quasi-analytical models have the best performance for the estimation of PC, especially because these two types of bio-optical algorithms account for variations in phytoplankton inherent optical properties on the water-leaving signal. The same was observed by Beck et al. [24] who reported that semi-analytical algorithms had an advantage in the estimation of blue-green algae. Thus, because of the development of new equipment to compute optical properties, it is expected that semi and quasi-analytical algorithms will be improved and validated in the near future.
Finally, for a good performance of bio-optical algorithms (especially semi and quasi-analytical) on satellite images, atmospheric correction is needed. In the 30 years of evaluation, atmospheric correction showed to be an important task in Period II, however, it is still one of the main challenges over inland water. Shi et al. [27] highlighted that it is still a challenge to perform atmospheric corrections in turbid inland waters, especially when algal blooms are occurring because they directly affect the remote sensing reflectance in the near-infrared. Additionally, atmospheric corrections over these aquatic systems are influenced by several factors, such as: proximity to terrestrial sources of atmospheric pollution, adjacency effects from neighboring land pixels, undulating topography around the water body, non-negligible reflectance of water in the near-infrared region due to high sediment concentrations in inland waters, and variations in the altitude of inland water surface from the mean sea level [58]. Since this manuscript reviewed PC publications, atmospheric correction studies or comparisons are not included here.
5. Conclusions
This study represents a new type of review in which algorithms and methods were not explored in depth. Here, a bibliometric analysis of scientific production was presented based on the Web of Science database for the terms “remote+ sensing+phycocyanin”. This approach does not describe or compare different algorithms or methods. Since these topics were extensively covered by previous reviews and comparisons [19,23,24,25,26,27], another review of algorithms was not needed. Because of that, this review was based on co-citation analysis and mapping to evaluate the evolution of the field in the last 30 years.
The results presented in this review are unique, since, to my knowledge, this is the first attempt for performing a bibliometric analysis in this field. As observed on the number of papers published on this topic (see Figure 1) the last two decades were important for the consolidation of the topic within the remote sensing community. Decade-by-decade results showed an interesting evolution of the geographic coverage of remote sensing of PC from local studies using airborne and lab cultures in Period I (1991–2000), to large temperate lakes monitored via satellites in Period II (2001–2010) and the expansion to tropical and coastal environments in Period III (2011–2020). In terms of techniques, it was observed that another evolution took place from semi-empirical algorithms in the first years of the field to semi-analytical to quasi-analytical algorithms in the last years. In the 30-year analysis (Figure 3 and Table 2) it was observed that the development of physics-based algorithms (semi-analytical and quasi-analytical) is more common in the last decade. This occurs especially because of the development of new equipment for measuring optical properties which allow the acquisition of data to validate the bio-optical modeling.
Future research seems to be related to the topics highlighted in Period III, which are related to (1) data acquisition from different locations to validate global studies, especially in oligotrophic to mesotrophic environments, (2) the development of a universal approach for the retrieval of PC concentration from Earth observation, and (3) the development of orbital sensors, which allow the assessment of PC from space. Additionally, the development of atmospheric correction algorithms, especially over inland waters, is needed for the good performance of PC algorithms. Therefore, although not strongly connected to this field, atmospheric corrections are essential.
Supplementary Materials
The following are available online at https://www.mdpi.com/2072-4292/12/3/567/s1, Table S1.
Author Contributions
I.O. designed and implemented the experiments, analyzed the research results, and wrote the paper. All authors have read and agreed to the published version of the manuscript.
Funding
This research received no external funding.
Acknowledgments
I.O would like to thank Chaomei Chen for making CiteSpace freely available for use.
Conflicts of Interest
The author declares no conflict of interest.
Appendix A

Table A1.
Top 10 most cited documents in the field of remote sensing of PC.
| Reference 1 | Journal | Citations | Year |
|---|---|---|---|
| Simis et al. (2007) | Remote Sensing of Environment | 38 | 2007 |
| Simis et al. | Limnology and Oceanography | 35 | 2005 |
| Hunter et al. | Remote Sensing of Environment | 31 | 2010 |
| Ruiz-Verdú et al. | Remote Sensing of Environment | 29 | 2008 |
| Randolph et al. | Remote Sensing of Environment | 29 | 2008 |
| Ogashawara et al. | Remote Sensing | 20 | 2013 |
| Matthews et al. (2010) | Remote Sensing of Environment | 19 | 2010 |
| Mishra et al. | Remote Sensing of Environment | 19 | 2013 |
| Hunter et al. | Environmental Science and Technology | 18 | 2009 |
| Kutser et al. (2006) | Estuarine, Coastal and Shelf Science | 18 | 2006 |
Appendix B
Table A2.
Most relevant labels extracted by LSI and LLR methods.
| Cluster ID | Top Label (LSI – LSI, p-value) | Top Label (LLR) |
|---|---|---|
| 0 | handheld spectroradiometer (29.03, 10−4); bloom management purposes (29.03, 10−4); turbid lake (24.84, 10−4); hybrid eof algorithm (24.84, 10−4); nonbloom condition (24.84, 10−4); modis cyanobacteria phycocyanin data (24.84, 10−4); dense coincident surface observation (20.67, 10−4); cyanobacterial total biovolume (20.67, 10−4); satellite reflectance algorithm (20.67, 10−4); temperate reservoir (20.67, 10−4); lake water quality (16.51, 10−4); | cyanobacteria; challenges; mapping cyanotoxin patterns; deep reservoir; drinking-water source; turbid lake; western basin; cyanobacterial total biovolume; evaluation; handheld spectroradiometer | lake erie; western basin; phytoplankton pigment absorption properties; regional example; cyanobacteria bloom waters; deep reservoir; drinking-water source; turbid lake; cyanobacterial total biovolume; evaluation |
| 1 | using genetic algorithm-partial leasts square (12.45, 0.001); potable water source (12.45, 0.001); hyperspectral retrieval (12.45, 0.001); microcystis aeruginosa (8.29, 0.005); eutrophic shallow lake (8.29, 0.005); case study (8.29, 0.005); spatial dynamics (8.29, 0.005); vertical migration (8.29, 0.005) | phycocyanin; modeling; hyperspectral retrieval; potable water sources; using genetic algorithm-partial least squares; suspended particulate matter; phytoplankton colour groups; spectral resolution; effect; sensor | suspended particulate matter; spectral discrimination; phytoplankton colour groups; spectral resolution; effect; sensor; using genetic algorithm-partial least squares; chlorophyll-a; modeling; current review |
| 2 | quasi-analytical algorithm (25.56, 10−4); retrieving absorption coefficient (18.06, 10−4); hyperspectral remote sensing reflectance (18.06, 10−4); multiple phytoplankton pigment (18.06, 10−4); organic matter (14.45, 0.001); cyanobacteria bloom water (12.94, 0.001); tropical eutrophic water (10.92, 0.001); mapping cyanobacterial bloom (10.05, 0.005); lake erie (8.13, 0.005) | quasi-analytical algorithm; parametrization; calibration; tropical eutrophic waters; cyanobacteria; mapping cyanotoxin patterns; challenges; semi-analytical algorithm; cyanobacteria biovolume; phycocyanin | cyanobacteria; challenges; mapping cyanotoxin patterns; using vertical cumulative pigment concentration; deep reservoir; phycocyanin; cyanobacteria biovolume; semi-analytical algorithm; remote estimation; meris sensor |
| 3 | cyanobacterial pigment (17.52, 10−4); theoretical basis (13.35, 0.001); cyanobacterial phycocyanin pigment concentration (13.35, 0.001); practical consideration (13.35, 0.001); eutrophic lake (13.29, 0.001); cell population (9.3, 0.005); using ocm satellite data (9.03, 0.005); freshwater lake (9.03, 0.005) | cyanobacterial pigments; freshwater lake; estimation; using ocm satellite data; cell populations; lake erie; evaluating multiple colour-producing agents; case ii waters; chlorophyll-a; mineral matter | mineral matter; cdom; absorption coefficients; central indiana reservoirs; chlorophyll; determination; cyanobacterial pigments; freshwater lake; estimation; using ocm satellite data |
| 4 | monitoring cyanobacterial bloom (16.35, 10−4); recognising cyanobacterial bloom (8.12, 0.005); modelling study (8.12, 0.005); optical signature (8.12, 0.005) | fluorescence characteristics; salinity gradient; phytoplankton; spectral absorption; different size fractions; baltic sea; recognising cyanobacterial blooms; modelling study; monitoring cyanobacterial blooms; satellite | recognising cyanobacterial blooms; modelling study; optical signature; fluorescence characteristics; salinity gradient; phytoplankton; spectral absorption; different size fractions; baltic sea; monitoring cyanobacterial blooms |
| 5 | china; lake; seasonal-spatial variation; shallow lake; phytoplankton absorption; multidecadal time series; south; satellite-detected accumulations; portugal; pigment c-phycocyanin | evaluation; east china; several lakes; spring bloom formation; remote sensing algorithms; cyanobacterial pigment retrievals; multidecadal time series; south; satellite-detected accumulations; portugal | |
| 6 | cyanobacterial biomass (32.04, 10−4); phycocyanin detection (27.56, 10−4); landsat tm data (27.56, 10−4); phytoplankton pigment composition (23.17, 10−4); cyanobacterial pigment phycocyanin (18.89, 10−4); spectral absorption (14.98, 0.001); different size fraction (14.98, 0.001); fluorescence characteristics (14.98, 0.001); salinity gradient (14.98, 0.001); phytoplankton absorption spectra (14.83, 0.001); inverse modeling approach (14.83, 0.001); phycocyanin pigment (14.74, 0.001); lake erie (10.85, 0.001); lake taihu (10.68, 0.005); baltic sea (9.41, 0.005); mapping cyanobacterial bloom (7.96, 0.005) | cyanobacterial biomass; algorithms; evaluation; phytoplankton absorption spectra; inverse modeling approach; estimating phytoplankton pigment concentrations; fluorescence characteristics; phytoplankton; spectral absorption; baltic sea | fluorescence characteristics; phytoplankton; spectral absorption; baltic sea; salinity gradient; different size fractions; algorithms; cyanobacterial biomass; cyanobacterial pigment phycocyanin; lake erie |
| 7 | cyanobacterial bloom (20.55, 10−4); user need (19.04, 10−4); future development (19.04, 10−4); multidisciplinary remote sensing ocean color sensor (19.04, 10−4); aquatic ecosystem (16.14, 10−4); hyperspectral global mapping satellite mission (16.14, 10−4); measuring freshwater (16.14, 10−4); floating algae index (13.35, 0.001); monitoring level (13.35, 0.001); visual cyanobacteria index (13.35, 0.001); multiscale mapping assessment (10.68, 0.005); cyanobacterial harmful algal bloom (10.68, 0.005); mapping cyanobacterial bloom (10.62, 0.005); lake erie (8.59, 0.005) | waters; semi-analytical algorithm; phycocyanin; remote estimation; deep reservoir; algorithms; modeling; comparative review; new scheme; user needs | new scheme; complex turbid; hyperspectral reflectance; implications; test; inversion algorithms; reconstruction; cyanobacterial harmful algal blooms; multiscale mapping assessment; lake champlain |
| 9 | great lake (15.82, 10−4); using modis (15.82, 10−4); mapping cyanobacterial bloom (14.44, 0.001); drinking-water source (12.43, 0.001); modis observation (12.43, 0.001); cyanobacterial risk (12.43, 0.001); long-term safety evaluation (12.43, 0.001); case ii water (10.33, 0.005); evaluating multiple colour-producing agent (10.33, 0.005); meris satellite data (8.23, 0.005); using quickbird (8.23, 0.005); missisquoi bay (8.23, 0.005) | mapping cyanobacterial blooms; meris satellite data; using quickbird; current review; near-coastal transitional waters; empirical procedures; lake erie; evaluating multiple colour-producing agents; case ii waters; using modis | drinking-water source; cyanobacterial risks; implications; modis observations; long-term safety evaluation; eutrophic lake; complex waters; cyanobacteria abundance; ocean colour estimation; inherent optical properties |
| 11 | active pigment (22.35, 10−4); turbid productive water (22.35, 10−4); mesotrophic reservoir (13.61, 0.001); predicting phycocyanin concentration (9.45, 0.005); novel algorithm (9.45, 0.005); | cyanobacteria; predicting phycocyanin concentrations; novel algorithm; proximal hyperspectral remote sensing approach; mesotrophic reservoir; phycocyanin; turbid productive water; chlorophyll; chlorophyll-a | phycocyanin; turbid productive water; chlorophyll; proximal hyperspectral remote sensing approach; predicting phycocyanin concentrations; chlorophyll-a; mesotrophic reservoir; cyanobacteria; novel algorithm |
References
- Bartram, J.; Carmichael, W.W.; Chorus, I.; Jones, G.; Skulberg, O.M. Introduction. In Toxic Cyanobacteria in Water: A Guide to Their Public Health Consequences, Monitoring and Management, 1st ed.; Chorus, I., Bartram, J., Eds.; UNESCO/WHO/UNEP: London, UK, 1999; Chapter 1; pp. 12–24. [Google Scholar]
- Codd, G.A.; Lindsay, J.; Young, F.M.; Morrison, L.F.; Metcalf, J.S. Harmful Cyanobacteria. In Harmful Cyanobacteria, 1st ed.; Huisman, J., Matthijs, H.C.P., Visser, P.M., Eds.; Springer: Dordrecht, The Netherlands, 2005; Chapter 1; pp. 1–23. [Google Scholar]
- Sivonen, K.; Jones, G. Cyanobacterial Toxins. In Toxic Cyanobacteria in Water: A Guide to Their Public Health Consequences, Monitoring and Management, 1st ed.; Chorus, I., Bartram, J., Eds.; UNESCO/WHO/UNEP: London, UK, 1999; Chapter 3; pp. 55–124. [Google Scholar]
- Carmichael, W.W. Health effects of toxin producing cyanobacteria: The cyanoHABs. Hum. Ecol. Risk Assess. 2001, 7, 1393–1407. [Google Scholar] [CrossRef]
- Simis, S.G.H.; Peters, S.W.M.; Gons, H.J. Remote sensing of the cyanobacterial pigment phycocyanin in turbid inland water. Limnol. Oceanogr. 2005, 50, 237–245. [Google Scholar] [CrossRef]
- Li, L.; Sengpiel, R.E.; Pascual, D.L.; Tedesco, L.D.; Wilson, J.S.; Soyeux, E. Using hyperspectral remote sensing to estimate chlorophyll-a and phycocyanin in a mesotrophic reservoir. Int. J. Remote Sens. 2010, 31, 4147–4162. [Google Scholar] [CrossRef]
- Le, C.; Li, Y.; Zha, Y.; Wang, Q.; Zhang, H.; Yin, B. Remote sensing of phycocyanin pigment in highly turbid inland waters in Lake Taihu, China. Int. J. Remote Sens. 2011, 32, 8253–8269. [Google Scholar] [CrossRef]
- Matthews, M.W.; Odermatt, D. Improved algorithm for routine monitoring of cyanobacteria and eutrophication in inland and near-coastal waters. Remote Sens. Environ. 2015, 156, 374–382. [Google Scholar] [CrossRef]
- Reynolds, C.S. Cyanobacterial Water-Blooms. In Advances in Botanical Research; Callow, J.A., Ed.; Academic Press Inc.: London, UK, 1987; Volume 13, pp. 67–143. [Google Scholar] [CrossRef]
- Hyenstrand, P.; Blomqvist, P.; Pettersson, A. Factors determining cyanobacterial success in aquatic systems: A literature review. Arch. Hydrobiol. 1998, 51, 41–62. [Google Scholar]
- Paerl, H.W. Marine Plankton. In Ecology of Cyanobacteria II: Their Diversity in Space and Time; Whitton, B.A., Ed.; Springer: Dordrecht, The Netherlands, 2012; pp. 127–153. [Google Scholar]
- Duan, H.; Ma, R.; Xu, J.; Zhang, Y.; Zhang, B. Comparison of different semi-empirical algorithms to estimate chlorophyll-a concentration in inland lake water. Environ. Monit. Assess. 2010, 170, 231–244. [Google Scholar] [CrossRef]
- Gons, H.J. Optical Teledetection of Chlorophyll a in Turbid Inland Waters. Environ. Sci. Technol. 1999, 33, 1127–1132. [Google Scholar] [CrossRef]
- Hadijimitsis, D.G.; Clayton, C. Assessment of temporal variations of water quality in inland water bodies using atmospheric corrected satellite remotely sensed image data. Environ. Monit. Assess. 2009, 159, 281–292. [Google Scholar] [CrossRef]
- Reinart, A.; Kutser, T. Comparison of different satellite sensors in detecting cyanobacterial bloom events in the Baltic Sea. Remote Sens. Environ. 2006, 102, 74–85. [Google Scholar] [CrossRef]
- Hunter, P.D.; Tyler, A.N.; Gilvear, D.J.; Willby, N.J. Using remote sensing to aid the assessment of human health risks from blooms of potentially toxic cyanobacteria. Environ. Sci. Technol. 2009, 43, 2627–2633. [Google Scholar] [CrossRef] [PubMed]
- Vincent, R.K.; Qin, X.; McKay, R.M.L.; Miner, J.; CzajkowskI, K.; Savino, J.; Bridgeman, T. Phycocyanin detection from LANDSAT TM data for mapping cyanobacterial blooms in Lake Erie. Remote Sens. Environ. 2004, 89, 381–392. [Google Scholar] [CrossRef]
- Mishra, S.; Mishra, D.R.; Schluchter, W.M. A Novel algorithm for predicting phycocyanin concentrations in cyanobacteria: A proximal hyperspectral remote sensing approach. Remote Sens. 2009, 1, 758–775. [Google Scholar] [CrossRef] [Green Version]
- Ogashawara, I.; Mishra, D.; Mishra, S.; Curtarelli, M.; Stech, J. A Performance Review of Reflectance Based Algorithms for Predicting Phycocyanin Concentrations in Inland Waters. Remote Sens. 2013, 5, 4774–4798. [Google Scholar] [CrossRef] [Green Version]
- Stumpf, R.; Dupuy, D. Experimental Lake Erie Harmful Algal Bloom Bulletin—Bulletin 28/2016; NOAA: Washington, DC, USA, 2016.
- Cyanobacteria Assessment Network (CyAN). Available online: https://www.epa.gov/water-research/cyanobacteria-assessment-network-cyan#satellitealgorithms (accessed on 24 November 2017).
- IIWQ Water Quality Portal. Available online: http://www.worldwaterquality.org/ (accessed on 16 January 2020).
- Ruiz-Verdú, A.; Simis, S.G.H.; de Hoyos, C.; Gons, H.J.; Peña-Martínez, R. An evaluation of algorithms for the remote sensing of cyanobacterial biomass. Remote Sens. Environ. 2008, 112, 3996–4008. [Google Scholar] [CrossRef]
- Beck, R.; Xu, M.; Zhan, S.; Liu, H.; Johansen, R.; Tong, S.; Yang, B.; Shu, S.; Wu, Q.; Wang, S.; et al. Comparison of Satellite Reflectance Algorithms for Estimating Phycocyanin Values and Cyanobacterial Total Biovolume in a Temperate Reservoir Using Coincident Hyperspectral Aircraft Imagery and Dense Coincident Surface Observations. Remote Sens. 2017, 9, 538. [Google Scholar] [CrossRef] [Green Version]
- Yan, Y.; Bao, Z.; Shao, J. Phycocyanin concentration retrieval in inland waters: A comparative review of the remote sensing techniques and algorithms. J. Great Lakes Res. 2018, 44, 748–755. [Google Scholar] [CrossRef]
- Riddick, C.A.L.; Hunter, P.D.; Domínguez-Gómez, J.A.; Martinez-Vicente, V.; Présing, M.; Horváth, H.; Kovács, A.W.; Vörös, L.; Zsigmond, E.; Tyler, A.N. Optimal Cyanobacterial Pigment Retrieval from Ocean Colour Sensors in a Highly Turbid, Optically Complex Lake. Remote Sens. 2019, 11, 1613. [Google Scholar] [CrossRef] [Green Version]
- Shi, K.; Zhang, Y.; Qin, B.; Zhou, B. Remote sensing of cyanobacterial blooms in inland waters: Present knowledge and future challenges. Sci. Bull. 2019, 64, 1540–1556. [Google Scholar] [CrossRef] [Green Version]
- Schalles, J.F.; Yacobi, Y.Z. Remote detection and seasonal patterns of phycocyanin, carotenoid and chlorophyll pigments in eutrophic waters. Ergeb. Limnol. 2000, 55, 153–168. [Google Scholar]
- Mishra, S.; Mishra, D.R.; Lee, Z.; Tucker, C.S. Quantifying cyanobacterial phycocyanin concentration in turbid productive waters: A quasi-analytical approach. Remote Sens. Environ. 2013, 133, 141–151. [Google Scholar] [CrossRef]
- Li, L.; Li, L.; Song, K. Remote sensing of freshwater cyanobacteria: An extended IOP Inversion Model of Inland Waters (IIMIW) for partitioning absorption coefficient and estimating phycocyanin. Remote Sens. Environ. 2015, 157, 9–23. [Google Scholar] [CrossRef]
- Dekker, A.G. Detection of Optical Water Quality Parameters for Eutrophic Waters by High Resolution Remote Sensing. Ph.D. Thesis, Proefschrift Vrije Universiteit (Free University), Amsterdam, The Netherlands, 1993. [Google Scholar]
- Hunter, P.D.; Tyler, A.N.; Carvalho, L.; Codd, G.A.; Maberly, S.C. Hyperspectral remote sensing of cyanobacterial pigments as indicators for cell populations and toxins in eutrophic lakes. Remote Sens. Environ. 2010, 114, 2705–2718. [Google Scholar] [CrossRef] [Green Version]
- Mishra, S. Remote Sensing of Cyanobacteria in Turbid Productive Waters. Ph.D. Thesis, Mississippi State University, Starkville, MS, USA, 2012. [Google Scholar]
- Mishra, S.; Mishra, D.R. A novel remote sensing algorithm to quantify phycocyanin in cyanobacterial algal blooms. Environ. Res. Lett. 2014, 9, 114003. [Google Scholar] [CrossRef]
- Stumpf, R.P.; Davis, T.W.; Wynne, T.T.; Graham, J.L.; Loftin, K.A.; Johengen, T.H.; Gossiaux, D.; Palladino, D.; Burtner, A. Challenges for mapping cyanotoxin patterns from remote sensing of cyanobacteria. Harmful Algae 2016, 54, 160–173. [Google Scholar] [CrossRef] [PubMed]
- Wynne, T.T.; Stumpf, R.P.; Tomlinson, M.C.; Warner, R.A.; Tester, P.A.; Dyble, J.; Fahnenstiel, G.L. Relating spectral shape to cyanobacterial blooms in the Laurentian Great Lakes. Int. J. Remote Sens. 2008, 29, 3665–3672. [Google Scholar] [CrossRef]
- Dash, P.; Walker, N.D.; Mishra, D.R.; Hu, C.; Pinckney, J.L.; D’Sa, E.J. Estimation of cyanobacterial pigments in a freshwater lake using OCM satellite data. Remote Sens. Environ. 2011, 115, 3409–3423. [Google Scholar] [CrossRef]
- Li, L.; Li, L.; Shi, K.; Li, Z.; Song, K. A semi-analytical algorithm for remote estimation of phycocyanin in inland waters. Sci. Total Environ. 2012, 435, 141–150. [Google Scholar] [CrossRef]
- Qi, L.; Hu, C.; Duan, H.; Cannizzaro, J.; Ma, R. A novel MERIS algorithm to derive cyanobacterial phycocyanin pigment concentrations in a eutrophic lake: Theoretical basis and practical considerations. Remote Sens. Environ. 2014, 154, 298–317. [Google Scholar] [CrossRef]
- Liu, G.; Simis, S.G.H.; Li, L.; Wang, Q.; Li, Y.; Song, K.; Lyu, H.; Zheng, Z.; Shi, K. A Four-Band Semi-Analytical Model for Estimating Phycocyanin in Inland Waters From Simulated MERIS and OLCI Data. IEEE Trans. Geosci. Remote Sens. 2018, 56, 1374–1385. [Google Scholar] [CrossRef]
- Hunter, P.; Tyler, A.; Presing, M.; Kovacs, A.; Preston, T. Spectral discrimination of phytoplankton colour groups: The effect of suspended particulate matter and sensor spectral resolution. Remote Sens. Environ. 2008, 112, 1527–1544. [Google Scholar] [CrossRef]
- Randolph, K.; Wilson, J.; Tedesco, L.; Li, L.; Pascual, D.L.; Soyeux, E. Hyperspectral remote sensing of cyanobacteria in turbid productive water using optically active pigments, chlorophyll a and phycocyanin. Remote Sens. Environ. 2008, 112, 4009–4019. [Google Scholar] [CrossRef]
- Duan, H.; Ma, R.; Hu, C. Evaluation of remote sensing algorithms for cyanobacterial pigment retrievals during spring bloom formation in several lakes of East China. Remote Sens. Environ. 2012, 126, 126–135. [Google Scholar] [CrossRef]
- Wheeler, S.M.; Morrissey, L.A.; Levine, S.N.; Livingston, G.P.; Vincent, W.F. Mapping cyanobacterial blooms in Lake Champlain’s Missisquoi Bay using QuickBird and MERIS satellite data. J. Great Lakes Res. 2012, 38, 68–75. [Google Scholar] [CrossRef]
- Sun, D.; Li, Y.; Wang, Q.; Gao, J.; Le, C.; Huang, C.; Gong, S. Hyperspectral Remote Sensing of the Pigment C-Phycocyanin in Turbid Inland Waters, Based on Optical Classification. IEEE Trans. Geosci. Remote Sens. 2013, 51, 3871–3884. [Google Scholar] [CrossRef]
- Wozniak, M.; Bradtke, K.M.; Darecki, M.; Krężel, A. Empirical model for phycocyanin concentration estimation as an indicator of cyanobacterial bloom in the optically complex coastal waters of the Baltic Sea. Remote Sens. 2016, 8, 212. [Google Scholar] [CrossRef] [Green Version]
- Chen, C. Searching for intellectual turning points: Progressive knowledge domain visualization. Proc. Natl. Acad. Sci. USA 2004, 101, 5303–5310. [Google Scholar] [CrossRef] [Green Version]
- Chen, C. Citespace ii: Detecting and visualizing emerging trends and transient patterns in scientific literature. J. Am. Soc. Inf. Sci. Technol. 2006, 57, 359–377. [Google Scholar] [CrossRef] [Green Version]
- Small, H. Co-citation in the scientific literature: A new measure of the relationship between two documents. J. Am. Soc. Inf. Sci. 1973, 24, 265–269. [Google Scholar] [CrossRef]
- Ogashawara, I.; Alcântara, E.H.; Stech, J.L.; Tundisi, J.G. Cyanobacterial Detection in Guarapiranga Reservoir (São Paulo State, Brazil) From Landsat TM and ETM + Images. Rev. Ambiente. Água 2014, 9, 224–238. [Google Scholar] [CrossRef] [Green Version]
- Oyama, Y.; Matsushita, B.; Fukushima, T. Distinguishing surface cyanobacterial blooms and aquatic macrophytes using landsat/TM and ETM + shortwave infrared bands. Remote Sens. Environ. 2015, 157, 35–47. [Google Scholar] [CrossRef]
- Francis, G. Poisonous Australian Lake. Nature 1878, 18, 11–12. [Google Scholar] [CrossRef] [Green Version]
- Chapra, S.C.; Boehlert, B.; Fant, C.; Bierman, V.J., Jr.; Henderson, J.; Mills, D.; Mas, D.M.L.; Rennels, L.; Jantarasami, L.; Martinich, J.; et al. Climate Change Impacts on Harmful Algal Blooms in U.S. Freshwaters: A Screening-Level Assessment. Environ. Sci. Technol. 2017, 51, 8933–8943. [Google Scholar] [CrossRef] [PubMed]
- Greb, S.; Dekker, A.; Binding, C. (Eds.) Earth Observations in Support of Global Water Quality Monitoring; IOCCG Report Series, No. 17; International Ocean Colour Coordinating Group: Dartmouth, NS, Canada, 2018. [Google Scholar]
- Paerl, H.W.; Huisman, J. Blooms like it hot. Science 2008, 320, 57–58. [Google Scholar] [CrossRef] [Green Version]
- Matisoff, G.; Kaltenberg, E.M.; Steely, R.L.; Hummel, S.K.; Seo, J.; Gibbons, K.J.; Bridgeman, T.B.; Seo, Y.; Behbahani, M.; James, W.F.; et al. Internal loading of phosphorus in western Lake Erie. J. Great Lakes Res. 2016, 42, 775–788. [Google Scholar] [CrossRef]
- Ashton, P.J. Seasonality in Southern Hemisphere freshwater phytoplankton assemblages. Hydrobiologia 1985, 125, 179–190. [Google Scholar] [CrossRef]
- Moses, W.J.; Sterckx, S.; Montes, L.; Keukelaere, L.D.; Knaeps, E. Atmospheric correction for inland waters. In Bio-Optical Modeling and Remote Sensing of Inland Waters, 1st ed.; Mishra, D.R., Ogashawara, I., Gitelson, A.A., Eds.; Elsevier: New York, NY, USA, 2017; Chapter 3; pp. 69–100. [Google Scholar]
Figure 1.
Remote sensing of phycocyanin publication numbers from the search in each database. (A) From Web of Science, (B) From Science Direct.
Figure 1.
Remote sensing of phycocyanin publication numbers from the search in each database. (A) From Web of Science, (B) From Science Direct.

Figure 2.
The co-citation network of remote sensing of PC and the most cited publications.

Figure 3.
The co-citation network of remote sensing of PC publications clusters (1991–2020) and clusters’ labels extracted by the LLR method.
Figure 3.
The co-citation network of remote sensing of PC publications clusters (1991–2020) and clusters’ labels extracted by the LLR method.

Figure 4.
The co-citation network of remote sensing of PC publications clusters (1991-2000) and clusters’ labels extracted by LLR method.
Figure 4.
The co-citation network of remote sensing of PC publications clusters (1991-2000) and clusters’ labels extracted by LLR method.

Figure 5.
The co-citation network of remote sensing of PC publications clusters (2001-2010) and clusters’ labels extracted by LLR method.
Figure 5.
The co-citation network of remote sensing of PC publications clusters (2001-2010) and clusters’ labels extracted by LLR method.

Figure 6.
The co-citation network of remote sensing of PC publications clusters (2011–2020) and clusters’ labels extracted by LLR method.
Figure 6.
The co-citation network of remote sensing of PC publications clusters (2011–2020) and clusters’ labels extracted by LLR method.

Table 1.
Summary of paper reviews on remotely estimation of phycocyanin.
| Study 1 | Study Sites | Reviewed Algorithms 2 |
|---|---|---|
| Ruiz-Verdu et al. | Spanish and Dutch Lakes and Reservoirs | DE93, SC00, SI05 |
| Ogashawara et al. | Funil Hydroelectric Reservoir (Brazil) and Catfish Ponds (USA) | DE93, SC00, SI05, MI09, HU10, MI12 |
| Beck et al. | Harsha Lake (USA) | SC00, SI05, HU10, MI12, MI14, ST16 |
| Yan et al. | - | DE93, SC00, SI05, WY08, MI09, HU10, DA11, LI12, MI13, QI14, MI14 |
| Riddick et al. | Global Lakes (LIMNADES dataset) | DE93, SC00, SI05, HU10, MI13, QI14, LI15, LI18 |
| Shi et al. | - | SC00, VI04, SI05, HU08, RA08, RU08, HU10, DA11, DU12, LI12, WH12, MI13, MI14, QI14, SU15, WO16 |
Table 2.
Cluster labels of remotely sensed phycocyanin research over 30 years (1991–2020).
| Cluster ID | Size | Main Label (LSI) | Main Label (LLR) | Mean (Cited Year) |
|---|---|---|---|---|
| 4 | 21 | Fluorescence characteristics | Monitoring Cyanobacteria Bloom (p-value = 10−4) | 1999 |
| 6 | 17 | Cyanobacterial Biomass | Cyanobacterial Biomass (p-value = 10−4) | 2001 |
| 11 | 7 | Cyanobacteria | Active Pigment (p-value = 10−4) | 2004 |
| 1 | 47 | Phycocyanin | Using genetic algorithm-partial least square (p-value = 10−3) | 2006 |
| 5 | 20 | China | Atmospheric Correction (p-value = 10−4) | 2007 |
| 3 | 30 | Cyanobacterial pigments | Cyanobacterial pigments (p-value = 10−4) | 2008 |
| 9 | 12 | Mapping cyanobacteria bloom | Great Lake (p-value = 10−4) | 2009 |
| 7 | 16 | Waters | Cyanobacteria Bloom (p-value = 10−4) | 2012 |
| 0 | 55 | Cyanobacteria | Handheld spectroradiometer (p-value = 10−4) | 2013 |
| 2 | 36 | Quasi-analytical algorithms | Quasi-analytical algorithms (p-value = 10−4) | 2013 |
Table 3.
Cluster labels of remotely sensed phycocyanin research over 10 years (1991–2000).
| Cluster ID | Size | Main Label (LSI) | Main Label (LLR) | Mean (Cited Year) |
|---|---|---|---|---|
| 0 | 20 | High resolution airborne remote sensing | Optical properties of dense algal cultures (p-value = 0.5) | 1986 |
| 1 | 12 | Optical properties of dense algal cultures | High resolution airborne remote sensing (p-value = 0.5) | 1992 |
Table 4.
Cluster labels of remotely sensed phycocyanin research over 30 years (2001–2010).
| Cluster ID | Size | Main Label (LSI) | Main Label (LLR) | Mean (Cited Year) |
|---|---|---|---|---|
| 2 | 20 | Spectral absorption and fluorescence characteristics | Different size fraction (p-value = 0.5) | 1999 |
| 1 | 22 | Landsat TM data | Lake Erie (p-value = 0.005) | 2000 |
| 11 | 7 | Fluorescence characteristics | Monitoring cyanobacterial bloom (p-value = 0.05) | 2001 |
| 6 | 11 | China | Hyperspectral retrieval model (p-value = 0.05) | 2002 |
| 10 | 8 | Cyanobacterial pigments | Cell population (p-value = 0.1) | 2003 |
| 8 | 9 | Spatial dynamics of vertical migration | Eutrophic shallow lake (p-value = 0.05) | 2003 |
| 0 | 24 | Cyanobacteria biomass | Cyanobacteria biomass (p-value = 0.005) | 2004 |
| 5 | 11 | Phycocyanin | Turbid productive waters (p-value = 0.001) | 2004 |
| 3 | 16 | Cyanobacteria pigments | Toxic cyanobacteria (p-value = 0.05) | 2005 |
| 4 | 14 | Phytoplankton absorption | Great Lake (p-value = 0.05) | 2005 |
Table 5.
Cluster labels of remotely sensed phycocyanin research over 30 years (2001–2010).
| Cluster ID | Size | Main Label (LSI) | Main Label (LLR) | Mean (Cited Year) |
|---|---|---|---|---|
| 8 | 18 | Mineral matter characteristics | Near-coastal transitional water (p-value = 0.001) | 2006 |
| 0 | 48 | Modeling | Phycocyanin pigment (p-value = 10−4) | 2007 |
| 5 | 22 | Case 2 | Optical characterization (p-value = 10−4) | 2008 |
| 11 | 7 | Phycocyanin | Satellite-detected accumulation (p-value = 10−4) | 2010 |
| 7 | 19 | Waters | Using Landsat measurement (p-value = 10−4) | 2010 |
| 4 | 29 | New scheme | Theoretical basis (p-value = 0.01) | 2010 |
| 10 | 14 | Semi-analytical algorithm | Modern robust approach (p-value = 10−4) | 2012 |
| 1 | 41 | Chlorophyll-a prediction algorithms | Tropical eutrophic water (p-value = 10−4) | 2012 |
| 9 | 15 | Cyanobacterial total biovolume | Eastern Iberian Peninsula (p-value = 10−4) | 2013 |
| 3 | 30 | Lake Erie | Risk factor (p-value = 10−4) | 2013 |
| 2 | 36 | Drinking water source | Turbid lake (p-value = 10−4) | 2013 |
| 6 | 20 | Cyanobacterial Blooms | Deep reservoir (p-value = 10−4) | 2015 |
© 2020 by the author. Licensee MDPI, Basel, Switzerland. This article is an open access article distributed under the terms and conditions of the Creative Commons Attribution (CC BY) license (http://creativecommons.org/licenses/by/4.0/).
Share and Cite
MDPI and ACS Style
Ogashawara, I. Determination of Phycocyanin from Space—A Bibliometric Analysis. Remote Sens. 2020, 12, 567. https://doi.org/10.3390/rs12030567
AMA Style
Ogashawara I. Determination of Phycocyanin from Space—A Bibliometric Analysis. Remote Sensing. 2020; 12(3):567. https://doi.org/10.3390/rs12030567
Chicago/Turabian StyleOgashawara, Igor. 2020. "Determination of Phycocyanin from Space—A Bibliometric Analysis" Remote Sensing 12, no. 3: 567. https://doi.org/10.3390/rs12030567
Note that from the first issue of 2016, this journal uses article numbers instead of page numbers. See further details here.