Article

An End-to-End Deep Fusion Model for Mapping Forests at Tree Species Levels with High Spatial Resolution Satellite Imagery

1
Research Institute of Forest Resource Information Techniques, Beijing 100091, China
2
Key Laboratory of Forestry Remote Sensing and Information System, NFGA, Chinese Academy of Forestry, Beijing 100091, China
3
College of Geomatics, Xi’an University of Science and Technology, Xi’an 710054, China
4
School of Information Mechanical & Electrical Engineering, Jiangsu Open University, Nanjing 210017, China
*
Author to whom correspondence should be addressed.
Remote Sens. 2020, 12(20), 3324; https://doi.org/10.3390/rs12203324
Submission received: 7 September 2020 / Revised: 6 October 2020 / Accepted: 8 October 2020 / Published: 13 October 2020
(This article belongs to the Special Issue Advances in Remote Sensing for Global Forest Monitoring)

Abstract

:
Mapping the distribution of forest resources at tree species levels is important due to their strong association with many quantitative and qualitative indicators. With the ongoing development of artificial intelligence technologies, the effectiveness of deep-learning classification models for high spatial resolution (HSR) remote sensing images has been proved. However, due to the poor statistical separability and complex scenarios, it is still challenging to realize fully automated and highly accurate forest types at tree species level mapping. To solve the problem, a novel end-to-end deep learning fusion method for HSR remote sensing images was developed by combining the advantageous properties of multi-modality representations and the powerful features of post-processing step to optimize the forest classification performance refined to the dominant tree species level in an automated way. The structure of the proposed model consisted of a two-branch fully convolutional network (dual-FCN8s) and a conditional random field as recurrent neural network (CRFasRNN), which named dual-FCN8s-CRFasRNN in the paper. By constructing a dual-FCN8s network, the dual-FCN8s-CRFasRNN extracted and fused multi-modality features to recover a high-resolution and strong semantic feature representation. By imbedding the CRFasRNN module into the network as post-processing step, the dual-FCN8s-CRFasRNN optimized the classification result in an automatic manner and generated the result with explicit category information. Quantitative evaluations on China’s Gaofen-2 (GF-2) HSR satellite data showed that the dual-FCN8s-CRFasRNN provided a competitive performance with an overall classification accuracy (OA) of 90.10%, a Kappa coefficient of 0.8872 in the Wangyedian forest farm, and an OA of 74.39%, a Kappa coefficient of 0.6973 in the GaoFeng forest farm, respectively. Experiment results also showed that the proposed model got higher OA and Kappa coefficient metrics than other four recently developed deep learning methods and achieved a better trade-off between automaticity and accuracy, which further confirmed the applicability and superiority of the dual-FCN8s-CRFasRNN in forest types at tree species level mapping tasks.

Graphical Abstract

1. Introduction

Forest classification at tree species’ levels is important for the management and sustainable development of forest resources [1]. Mapping the distribution of forest resources is important due to their strong association with qualitative monitoring indicators such as spatial locations, as well as with many quantitative indicators like forest stocks, forest carbon storage, and biodiversity [2]. Satellite images have been widely used to map forest resources due to their efficiency and increasing availability [3].
With more accurate and richer spatial and textural information, high spatial resolution (HSR) remote sensing images can be used to extract more specific information of forest types [4]. In the recent past, a growing number of studies have been conducted on this topic [5,6]. Important milestones have been achieved, but there remain limitations [7,8]. One of the key limitations is that there is poor statistical separability of the images spectral range as there are a limited number of wavebands in such images [9]. As a result, in the case of forests with complex structures and more tree species, the phenomenon of “same objects with different spectra” and “different objects with the same spectra” can lead to serious difficulties in extracting relevant information. Thus, it raises the requirements for advanced forest information extraction methods.
Deep learning models are a kind of deep artificial neural network methods that have attracted substantial attention in recent years [10]. They have been successfully applied in land cover classification as they can adaptively learn discriminative characteristics from images through supervised learning, in addition to extracting and integrating multi-scale and multi-level remote sensing characteristics [11,12,13,14]. Compared with traditional machine learning methods, these models are capable of significantly improving the classification accuracy of land cover types, especially in areas with more complicated land cover types [15,16,17].
With the ongoing development of artificial intelligence technologies, several efficient deep-learning-based optimization models for the classification of land cover types have been proposed [18]. According to several recent studies, fusion individual deep-learning classifiers such as a convolutional neural network (CNN) into a multi-classifier can further improve the classification capacity of each classifier [19,20,21]. At the same time, other studies have shown that a CNN designed with a two-branched structure can extract panchromatic and multispectral information in remote sensing images individually, ensuring better classification quality compared to single structures [22]. In addition, some related research also indicated that the combination of a CNN and traditional image analysis technology such as conditional random fields (CRF) [23] is conducive to further improve the classification accuracy [24].
In recent years, to explore the classification effectiveness of deep-learning models for mapping forest types at tree species level, some scholars have attempted to apply advanced deep-learning classification methods to HSR satellite images. Guo (2020) proposed a two-branched fully convolutional network (FCN8s) method [
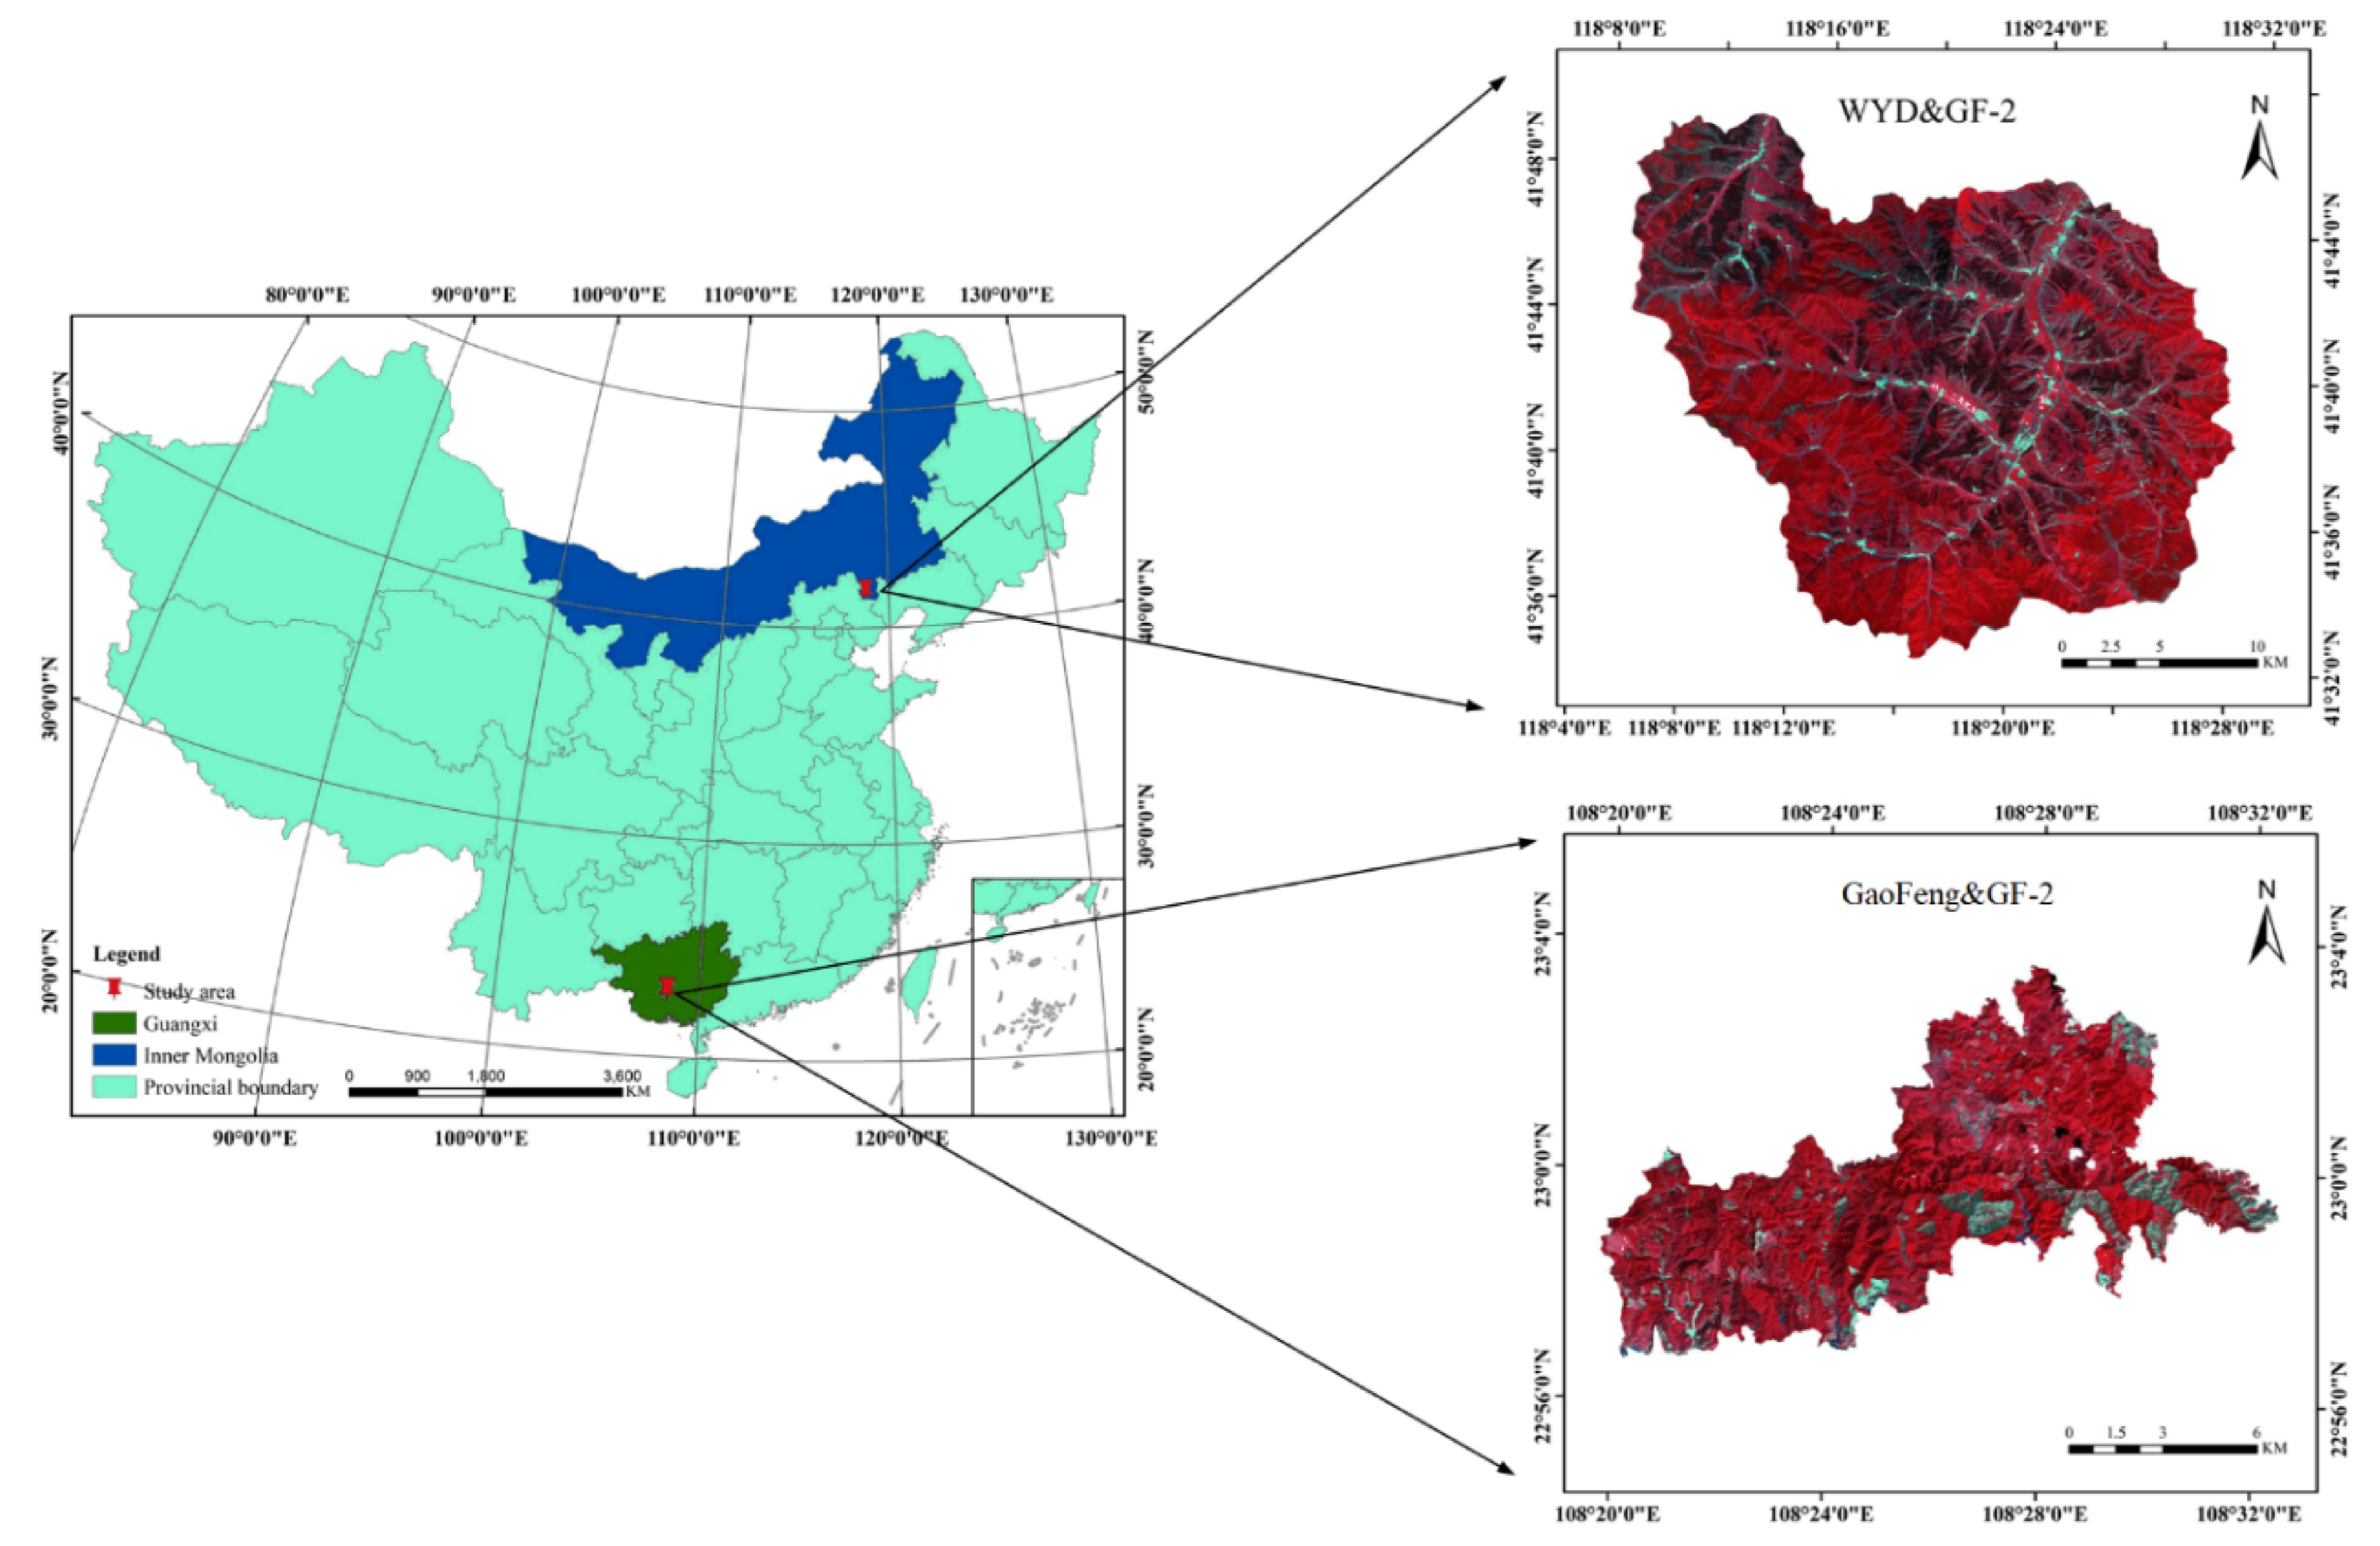
25] and successfully extracted forest type distribution information at the dominant tree species level in the Wangyedian forest farm of Chifeng City [26] with China’s GF2 data. The study revealed that the deep characteristics extracted by the two-branch FCN8s method showed a certain diversity and can enrich the input data sources of the model to some degree. Thus, it is a simple and effective optimization method. At the same time, compared with the traditional machine learning algorithms such as support vector machine and so on, there is a significant improvement in the resultant overall classification accuracy (OA). However, the classification accuracy of some forest types or dominate tree species, such as White birch (Betula platyphylla) and Aspen (Populus davidiana) in the study area, needs to be improved further.
Relevant studies have shown that when classifying forest types using FCN8s, the use of CRF as an independent post-processing step can further improve the classification accuracy [27,28]. However, even though the CRF method can improve the results of classification to some extent as a post-processing step independent of the FCN8s training, the free structures are unable to fully utilize CRF’s inferential capability. This is because the operation of the model is separated from the training of the deep neural network model. Consequently, the model parameters cannot be updated with the iterative update of weights in the training phase. To address this limitation, Zheng (2015) has proposed a conditional random field as recurrent neural networks (CRFasRNN) model in which the CNN and CRF are constructed into a recurrent neural network (RNN) structure. Then, training the deep neural network model and operation of the CRF post-processing model can be implemented in an end-to-end manner. The advantages of the CNN and CRF models are thus fully combined. At the same time, the parameters of the CRF model can also be synchronously optimized during the whole network training, resulting in significant improvements in the classification accuracy [29].
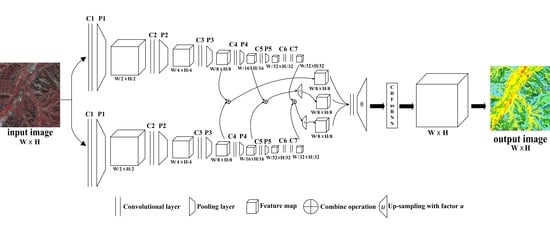
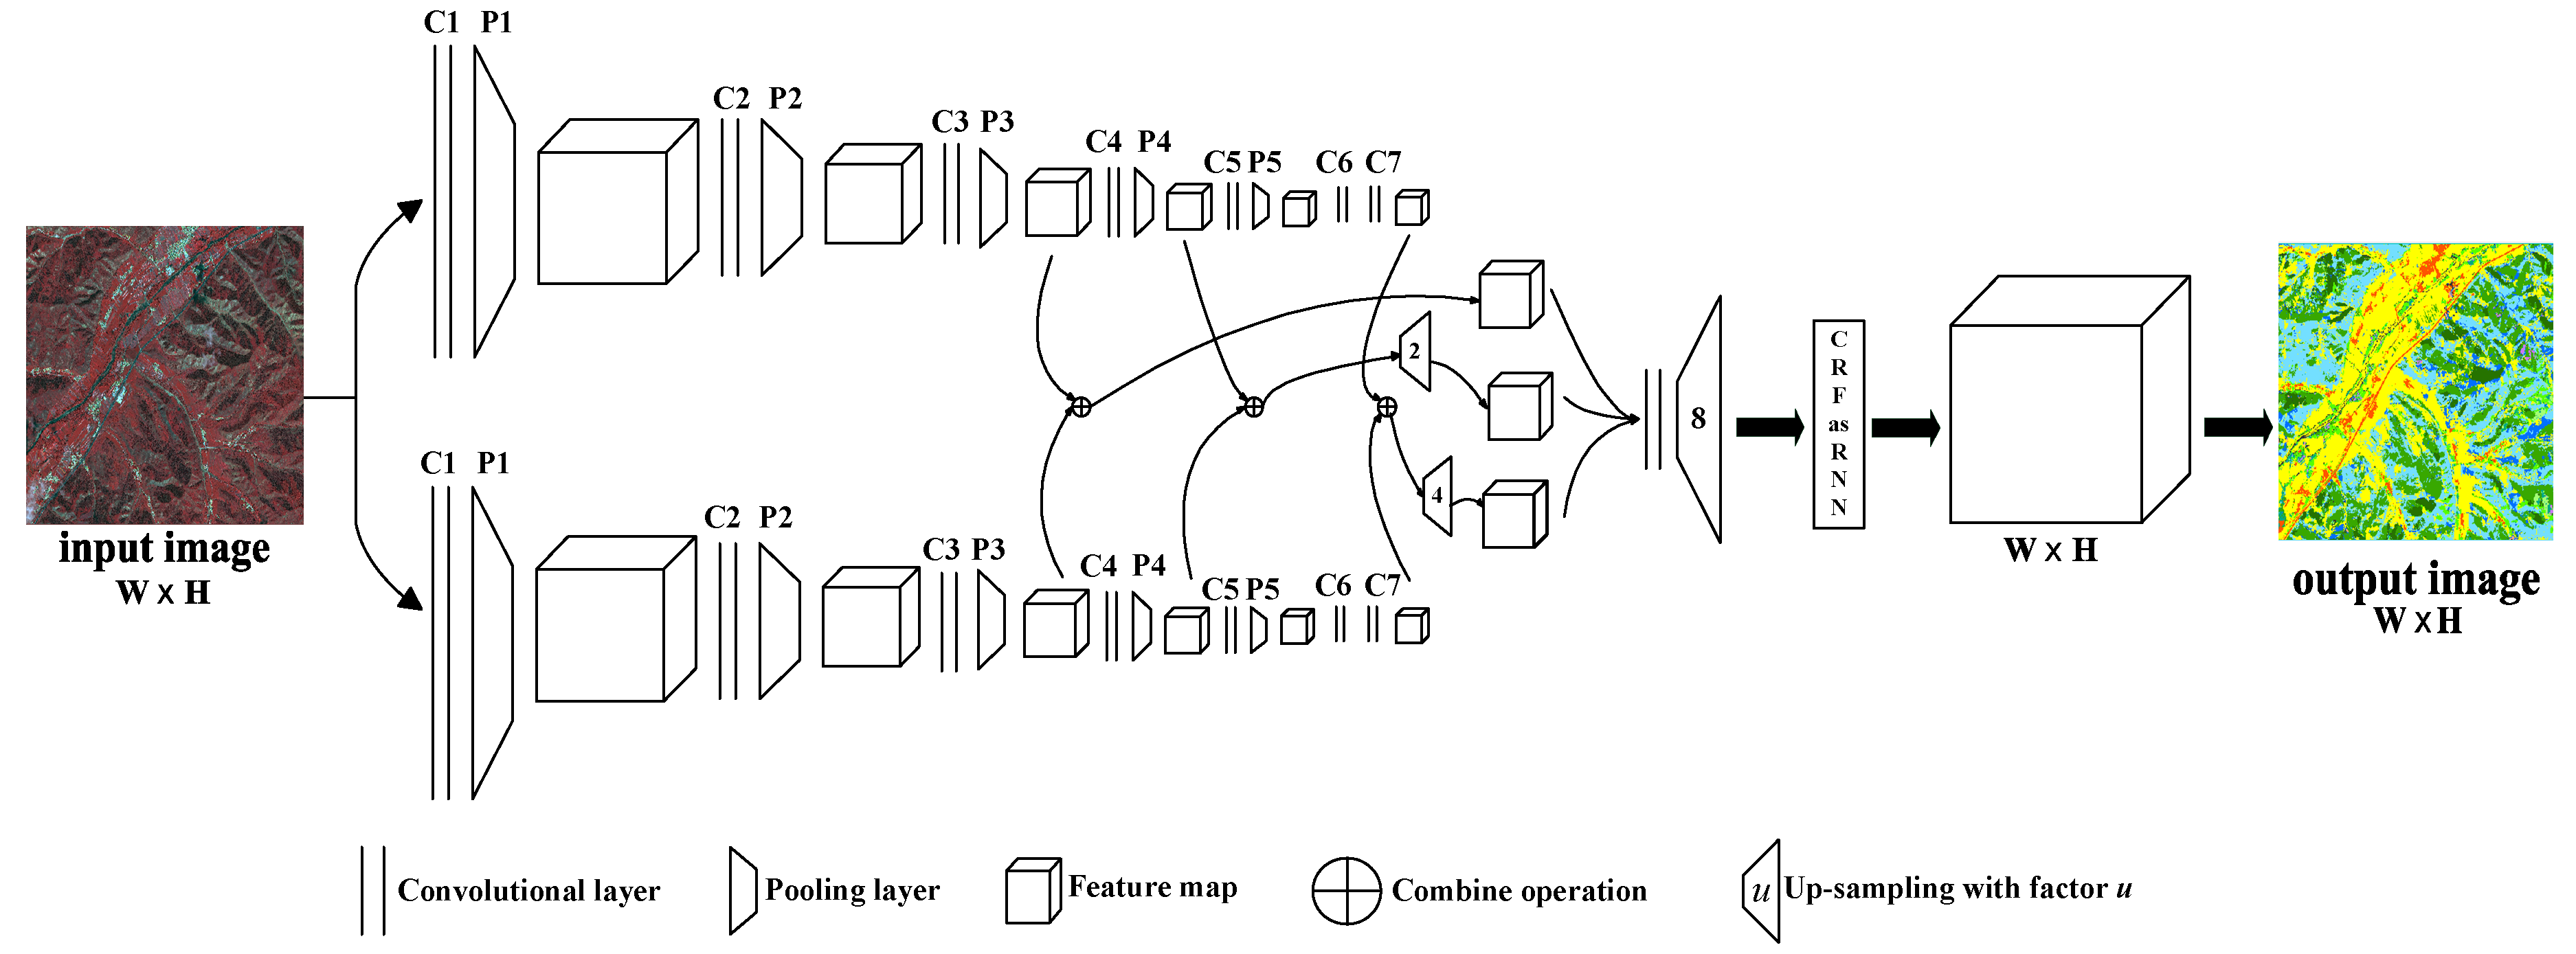
In the paper, we proposed a novel end-to-end deep learning fusion method for mapping the forest types at tree species level based on HSR remote sensing data. The proposed model based on the previous published two-branch FCN8s method and imbedded a CRFasRNN layer into the network as the post-processing step, which is named dual-FCN8s-CRFasRNN in the paper.
The main contributions of this paper are listed as follows:
  • An end-to-end deep fusion dual-FCN8s-CRFasRNN network was constructed to optimize the forest classification performance refined to the tree species level in an automated way by combining the advantageous properties of multi-modality representations and the powerful features of post-processing step to recover a high-resolution feature representation and to improve the pixel-wise mapping accuracy in an automatic way.
  • A CRFasRNN module was designed to insert into the network to comprehensively consider the powerful features of post-processing step to optimize the forest classification performance refined to the dominant tree species level in an end-to-end automated way.
The remainder of the paper was structured as follows. The Materials and Method are presented in detail in Section 2. The Results are given in Section 3. Section 4 then discusses the feasibility of the optimized model. Finally, Section 5 concludes the paper.

2. Materials and Method

2.1. Study Areas

In this research, two study areas in China were selected, namely the Wangyedian forest farm and the GaoFeng forest farm, which are located in the North and South of China respectively (Figure 1). The reason why the Wangyedian forest farm and the GaoFeng forest farm were chosen as study areas was that both of them represented typical forest plantations in North and South China, respectively. Among them, the coniferous and broad-leaved tree species in the Wangyedian forest farm had clear spectral differences; however, the tree species in the GaoFeng forest farm belonged to the evergreen species, which made the spectral characteristics less affected by the seasonal changes and had more challenging for the classifier. Thus, the validation of the two above test areas could better illustrate the effectiveness and limitations of the proposed method.
The Wangyedian forest farm was founded in 1956. The geographical location is 118°09′E~118°30′E, 41°35′N~41°50′N, which lies to the southwest of Harqin Banner, Chifeng City, Inner Mongolia Autonomous Region, China, at the juncture of the Inner Mongolia, Hebei, and Liaoning provinces. The altitude is 800–1890 m, and the slope is 15–35°. The annual average temperature is 7.4 °C and the annual average precipitation is 400 mm, the climate zone belongs to moderate-temperate continental monsoon climate. The area of the forest farm is 2.47 ha with the forest area covers 2.33 ha, of which the plantation is 1.16 ha and the forest coverage rate 92.10%. The tree species of the plantation are mainly Chinese pine (Pinus tabuliformis Carrière) and Larix principis (Larix principis-rupprechtii Mayr); the dominant tree species in natural forests includes White birch (Betula platyphylla) and Aspen (Populus davidiana).
The GaoFeng forest farm was established in 1953. Its geographical location is 108°20′E~108°32′E, 22°56′~23°4′N (Figure 1), which is in Nanning City, Guangxi Zhuang Autonomous Region, China. The relative height of the mountain is generally 150–400 m and the slopes are 20–30°. It is in the humid subtropical monsoon climate area, with an average annual temperature of 21.6 °C and an average annual rainfall of 1300 mm. The total area of the forest land under management is 8.70 ha and forest coverage is 87.50%. Eucalyptus (Eucalyptus robusta Smith) and Chinese fir (Cunninghamia lanceolate) are the main plantations. It should be noted that the GaoFeng forest farm test area in our study is part of the GaoFeng forest farm. This is because after we searched all China’s Gaofen-2 (GF-2) images within the GaoFeng Forest Farm in recent three years, only the DongSheng and JieBei sub-forest farms were cloud-free during this period. Therefore, these two sub-forest farms were selected in the research.

2.2. Test Data

2.2.1. Land Cover Types, Forest and Tree Species Definition

The land cover, forest, and tree species classification used in this study mainly refer to the regulation of forest resources planning, design, and measurement [30], which are the technical standards of national forest resources planning and design survey. Based on the analysis of potential land classification results through pre-classifications from China’s GF-2 images, the classification system of this study was determined as shown in Table 1 and Table 2. The classes were divided into 11 categories for the Wangyedian forest farm (Table 1), including Chinese pine (Pinus tabulaeformis), Larix principis (Larix principis-rupprechtii), Korean pine (Pinus koraiensis), White birch and Aspen (Betula platyphylla and Populus davidiana, respectively), Mongolian oak (Quercus mongolica), Shrub land, Other forest land, Cultivated land, Grassland, Construction land, and Other non-forest lands. For simplicity, the above categories were abbreviated as CP, LP, KP, WA, MO, SL, OFL, CUL, GL, COL, ONFL as shown in Table 1.
For the GaoFeng forest farm test area (Table 2), it was divided into 7 categories, including Eucalyptus (Eucalyptus spp.), Chinese fir (Cunninghamia lanceolata Hook.), Masson pine (Masson pine Lamb.), Star anise (Illicium verum Hook.f.), Miscellaneous wood, Logging site, and Other non-forest lands. Here, Eucalyptus, Chinese fir, Masson pine, Star anise, and Miscellaneous wood belong to the subdivision category of forest land; Other non-forest lands mainly include construction land, water, and so on. For simplicity, the above types were abbreviated as EP, CF, MP, SA, MW, LS, ONFL as shown in Table 2.

2.2.2. Remote Sensing Data

Launched on 19 August 2014, China’s GF-2 was the first sub-meter HSR satellite successfully launched by the China High-resolution Earth Observation System (CHEOS). The GF-2 satellite is equipment with two panchromatic and multispectral (PMS) cameras which can provide pan and multispectral data with nadir resolutions of 1 m and 4 m, respectively, across an imaging swath of 45 km. Radiometric resolution of GF-2 is 10 bit. The GF-2 multispectral remote sensing images include the blue band(B) (0.45 µm–0.52 µm), green band(G)(0.52 µm–0.59 µm), red band (R) (0.63 µm–0.69 µm), and near infrared band(NIR)(0.77 µm–0.89 µm).The study used China’s GF-2 panchromatic and multispectral (PMS) remote sensing imagery, which comprised a panchromatic band (1-m resolution) and four multispectral bands (4-m resolution). The WYD study area was covered by four scenes and the GaoFeng study area by one scene (specific image information is shown in Table 3).
The imaging time was September 5, 2017 for the Wangyedian forest farm and September 21, 2016 for the GaoFeng forest farm test area. The preprocessing procedure of the satellite images comprised four steps, which were radiometric calibration, atmospheric correction, ortho-rectification, and image fusion. The radiometric calibration was the first step. The pixel brightness values of satellite observations were converted to apparent radiance by using the absolute radiometric calibration coefficients released by China Resources Satellite Data and Application Center [31]. Then, the fast line-of-sight atmospheric analysis of hypercube method [32] was used to perform atmospheric correction of multi-spectral and panchromatic data. In the next step, the parameters of the multi-spectral and panchromatic images and one digital elevation model (DEM) of 5 m resolution were used to perform ortho-rectification aided by the ground control points automatically extracted by image to image registration using a scale invariant feature transformation algorithm [33] with ZY-3 digital ortho-photo map (DOM) in 2 m spatial resolution [34] as reference. Finally, by using the nearest-neighbor diffusion-based pan-sharpening algorithm [35], the multi-spectral and panchromatic images were fused to obtain a 0.8 m high spatial resolution multi-spectral remote sensing image.

2.2.3. Ground Reference Data

Being aided by multi-temporal high-resolution remote sensing imagery and forest sub-compartment map and field survey data, 154 samples for the Wangyedian forest farm (Figure 2) and 136 samples for the GaoFeng forest farm test area (Figure 3) were constructed by visual interpretation. Each sample was composed of a pre-processed remote sensing image block and a matching image interpretation block at pixel levels. The size of each sample was 310 × 310 pixels.
At the same time, to verify the classification accuracy of the deep learning model, field surveys were carried out in September 2017 in the Wangyedian forest farm and January 2018 in the GaoFeng forest farm test area. A total of 404 samples in the Wangyedian forest farm and 289 samples in the GaoFeng forest farm test area were collected, as shown in Figure 4. It should be noted that the selected time of remote sensing image used in GaoFeng Forest Farm test area was inconsistent with that of field survey. This was because the cloud cover of China’s GF-2 data in 2018 is large, which affected the classification accuracy. After the search of the data in experimental area during recent three years, we chose the cloud-free data in 2016. By the comparison among the multi-period data, the land cover types during that period had little changes, which was classified into logging sites.

2.3. Workflow Description

In this study, a novel dual-fcn8s-crfasrnn method was developed to classify forest type at tree species level for HSR images. The network consisted with a two-branch FCN8s model with the ResNet50 network [36] as the backbone and a CRFasRNN model as a post-processing module. The classification process was shown in Figure 5: 310 × 310 image blocks were cut from the entire image and the real feature categories were labeled as training samples. During the training process, it was divided into the training samples and the validation samples according to the proportion of 80% and 20%. Then the dual-fcn8s-crfasrnn method was built. The test image contained eleven and seven feature types for Wangyedian forest farm and the GaoFeng forest farm, respectively. The same method was used to label the true feature types. The image block instead of the pixel unit was sent to the network for training, and the model loss was obtained after training. The model parameters were updated by using the back-propagation algorithm [37] until the optimal parameters were obtained. In the classification stage, the test image was sent to the trained network to obtain the final classification map.

2.4. Network Structure

The proposed dual-FCN8s-CRFasRNN model is a kind of deep learning fusion model. It bases on a two-branched fully convolutional network, which predicts pixel-level labels without considering the smoothness and the consistency of the label assignments, followed by a CRFasRNN stage, which performs CRF-based probabilistic graphical modelling for structured prediction. The general workflow of the model is shown in Figure 6.

2.4.1. Two-Branched Fully Convolutional Network

The two-branched fully convolutional network (FCN8s) was proposed recently for the forest type classification at a dominant tree species level using HSR remotely sensed imagery [26], and the FCN8s [25] is the basic structure of the network which has showed impressive performance in terms of accuracy and computation time with many benchmark datasets. The architecture of FCN8s consists of down-sampling and up-sampling parts. The down-sampling part has convolutional and max-pooling layers to extract high-level abstract information, which is widely used in the classification related tasks in CNN. The convolutional and deconvolutional layers are contained in the up-sampling part which up-samples feature maps to output the score masks.
The structure of the two-branched FCN8s method contains two FCN8s sub-models which used Resnet50 [36] as its base classifier. Among them, one of the FCN8s sub-model used the RGB band information of image with fine-tuning strategy to construct the network by using the pre-trained weights of ImageNet dataset [38] and another sub-model made full use of the original 4-band information and the Normalized Difference Vegetation Index (NDVI) to build the model.
In the study, the two-branched FCN8s model was used to extract multi-modality features, with each FCN8s sub-model associated to one specific modality. For the model’s output, each FCN8s sub-model was separated into five blocks according to the resolution of the feature maps, and the features with the identical resolution from different branches were combined using convolutional blocks. Then, the combined features from different branches gradually up sampled to the original resolution of the input image. The whole model can be defined as the minimum total loss between the prediction results of the training data and the ground truth value during the training process. Meanwhile, the parameters of the network can be iteratively updated by using a stochastic gradient descent (SGD) algorithm [39].

2.4.2. Conditional Random Field as Recurrent Neural Networks

CRFasRNN is an end-to-end deep learning model to solve the problem of pixel level semantic image segmentation. This approach combines the advantages of the CNN and CRF based graphics model in a unified framework. To be more specific, the model formulates mean-field approximate inferences for the dense CRF with Gaussian pairwise potentials as an RNN model. Since the parameters can be learnt in the RNN setting using the standard back-propagation, the CRFasRNN model can refine coarse outputs from a traditional CNN in the forward pass, while passing error differentials back to the CNN during training. Thus, the whole network can be trained end-to-end by utilizing the usual back-propagation algorithm [37].

2.4.3. Implementation Details

The implementation details of the proposed dual-FCN8s-CRFasRNN model were as follows. During the training procedure, we first trained a two-branched FCN8s architecture for semantic segmentation and the error at each pixel can be computed using the standard SoftMax cross-entropy loss [40] with respect to the ground truth segmentation of the image. Then, a CRFasRNN layer was inserted into the network and continued to train with the network. The detailed structure of the model is shown in Figure 7.
For more detail, once the computation enters the CRFasRNN model in the forward pass, it takes five iterations for the data to leave the loop created by the RNN. Neither the two-branched FCN8s that provides unary values nor the layers after the CRFasRNN need to perform any computations during this time since the refinement happens only inside the RNN’s loop. Once the output Y leaves the loop, the next stages of the deep network after the CRFasRNN can continue the forward pass. During the backward pass, once the error differentials reach the CRFasRNN’s output Y, they similarly spend five iterations within the loop before reaching the RNN input. In each iteration inside the loop, error differentials are computed inside each component of the mean-field iteration. After the CRFasRNN block, the output probability graph was obtained by using a softmax layer. Then, the probability output was thresholded to generate a classification result for each pixel.
Based on this, the complete system unifies strengths of both two-branched FCN8s and CRFs and is trainable end-to-end using the back-propagation algorithm [40] and the SGD procedure [41]. It is important to mention that in all of the convolutional block, we use a batch normalization layer [42] followed by a rectifier linear unit activation function [43].
In our all experiments, we initialized the first part of the network using the publicly available weights of the two-branched FCN8s network [26]. The compatibility transform parameters of the CRFasRNN were initialized using the Potts model [29]; the kernel width and weight parameters were obtained from a cross-validation process. During the training phase, the parameters of the whole network were optimized end-to-end using the back-propagation algorithm. We used full image training with the learning rate fixed at 10−9 and momentum set to 0.99. The loss function used was the standard SoftMax loss function, that is, the log-likelihood error function described in [40].
The proposed model was implemented in the Python language using Keras [44] with a TensorFlow [45] backend. All of the experiments were performed on a Nvidia Tesla K40C GPU. To optimize the network weights and early stopping criterion, the training set was divided into subsets (training and validation). We trained the proposed model using the Adam optimizer [46] with minibatches of size 16. The maximum number of training epochs was fixed to 10,000 for all experiments, and the training computation time was approximately 36 h.

2.5. Accuracy Evaluation Index

The evaluation index includes the OA, Kappa coefficient, as well as the user’s (UA) and producer’s accuracy (PA) values. OA is calculated as a percentage of correctly classified samples relative to all verified samples. The Kappa coefficient measures the consistency between classification results. The UA is expressed as the proportion of the total number of correctly classified samples for a specific class with respect to the total number of reference sample. The PA is calculated by the proportion of a specific class of accurate classification reference samples to the whole reference samples of that class and is a supplement of the omission error. The confusion matrix represents the number of pixels which are classified into a specific class.

3. Results

3.1. Classification Results of the Dual-FCN8s-CRFasRNN

3.1.1. The Wangyedian Forest Farm

The results of the dual-FCN8s-CRFasRNN approach showed a high level of agreement with the forest status on the ground in the Wangyedian forest farm. The OA was 90.10% and the Kappa coefficient was 0.8872 (Table 4). Among the individual forest type or tree species, it showed better results for the coniferous tree species compared to the broad-leaved tree species. For the three coniferous tree species, Larix principis and Korean pine performed well reaching PA and UA values above 90%, respectively. In contrast, the classification of the broad-leaved tree species (White birch and Aspen, and Mongolian Oak), performed worse than the coniferous trees. The accuracy obtained with PA and UA was only above 80%. For White birch and aspen, the UA was 90.91%, and the PA was only 80.65% with ten samples being assigned to the coniferous forest and two samples to the other forest lands category. Mongolian Oak had better accuracies (UA:86.67%; PA:92.86%). However, the mixed class called the other forest lands had a UA of 58.33% and a PA of 48.75% with some misclassification of the Cultivated land class, Mongolian Oak, and Chinese pine class. This was probably due to the similarity of the spectrum in the reference dataset.

3.1.2. The GaoFeng Forest Farm Test Area

The quantitative evaluation of this test site is shown in Table 5. It showed that the OA was 74.39% and the Kappa coefficient was 0.6973. Compared to the non-forest lands, the classification effect of the dual-FCN8s-CRFasRNN model on single tree species or forest land was better. The Eucalyptus type had the highest classification accuracy (PA:93.33%; UA: 70.89%). In addition to the good extraction effect on Eucalyptuses, the classification accuracy on other four types of tree species or forests was also about 70%. In these four tree species or forest types, the classification effect of the Chinese fir tree species was good, which may be related to the wide distribution of this tree species in the test site. The Other non-forest lands type performed poor and a large amount of Other non-forest lands was misclassified as Eucalyptus, which may be due to the sample size involved in modeling.

3.1.3. The Complementarity of the Case Study

It could be seen from the result of Table 4, the OA of the dual-FCN8s-CRFasRNN model in the Wangyedian forest farm was 90.10%; however, it was only 43.75% for the less distributed broad-leaved tree species or mixed forest (such as White birch and Aspen). To verify the effect of the model for broad-leaved tree species or forest, this study further carried out the experiment in the GaoFeng forest farm. The main forest type in this area was broad-leaved mixed forest represented by Eucalyptus. The results showed that (Table 5), the OA of the dual-FCN8s-CRFasRNN model was 74.39%; however, it was 93.33% for the Eucalyptus species with wide distribution. This indicated that the classification effect of the model was not restricted by tree species, but rather by the distribution of tree species. It also could be seen from the results of the two test areas that (Table 4 and Table 5) the dual-FCN8s-CRFasRNN model performed well to extract the plantation with the accuracy all above 90%.

3.2. Impact of Adding NDVI and Using Fine-Tuning Strategy on Performance

According to the conclusion presented in [27], the two-branched FCN8s model can optimize the classification results after including NDVI features and using the fine-tuning strategy. Based on their conclusion, this paper further analyzed the influences of the use of NDVI features and fine-tuning strategies on the classification effect of the dual-FCN8s-CRFasRNN model.
In the follows, we will firstly analyze the classification effects of the dual-FCN8s-CRFasRNN model on the two test sites using the fine-tuning strategy without NDVI features, of which the results will be denoted as dual-FCN8s-noNDVI-CRFasRNN. Then, we will analyze the classification performance of the dual-FCN8s-CRFasRNN model with NDVI features but not using the fine-tuning strategy, whose results will be denoted as dual-FCN8s-noFinetune-CRFasRNN.

3.2.1. Impact of Adding NDVI on Performance

The classification results of the dual-FCN8s-noNDVI-CRFasRNN model on the two test sites were shown in Table 6 and Table 7. It can be seen from Table 6 that the OA of this model on the Wangyedian forest farm was 88.37%, and the Kappa coefficient was 0.8678. Its classification accuracy decreased by 1.73% compared with the dual-FCN8s-CRFasRNN model. The classification accuracy of this model on the GaoFeng forest farm test area is shown in Table 7. It can be found that the OA of the model in this test site was 71.63%, and the Kappa coefficient was 0.6645. Its classification accuracy deceased by 2.76% compared with the dual-FCN8s-CRFasRNN model. From the further analysis of the results, it can be known that the dual-FCN8s-CRFasRNN model could optimize the effect on broad-leaved trees after adding NDVI. From the comparative analysis of Table 6 and Table 7, it can be found that after including NDVI, the classification accuracies of the two broad-leaved mixed tree species of White birch and Aspen and Mongolian Oak were both improved. Especially for White birch and Aspen, the classification accuracy was improved by approximately 10%. The comparison results of the GaoFeng forest farm test site showed that, after the including of NDVI, the classification performance of broad-leaved forest was also improved.

3.2.2. Impact of Using a Fine-Tuning Strategy on Performance

The classification results of the dual-FCN8s-noFinetune-CRFasRNN model are shown in Table 6 Table 7. It can be seen from the Table 4 that the classification accuracy decreased by 4.95% and 12.8% on the Wangyedian forest farm and the GaoFeng forest farm test area, respectively, compared with the dual-FCN8s-CRFasRNN model. Through the further analysis of the results, it can be known that after applying the fine-tuning strategy, the dual-FCN8s-CRFasRNN model can optimize the classification effect of most types in the classification systems of these two test sites. From the comparative analysis of Table 6, after the fine-tuning strategy was used, the optimization effect of broad-leaved forests was significant in the Wangyedian forest farm. From the comparative analysis of the GaoFeng forest farm shown in Table 7, the classification accuracy of Chinese fir improved significantly.

3.3. Impact of Using a CRFasRNN Post-Procedureon Performance

For clearly observing the difference before and after the CRFasRNN post-processing, we compared the results of the proposed dual-FCN8s-CRFasRNN and the two-branched FCN8s, as well as the results obtained from comparing the FCN8s model with the CRFasRNN module called FCN8s-CRFasRNN with the FCN8s.

3.3.1. The Wangyedian Forest Farm

The comparison of the results of the dual-FCN8s-CRFasRNN model and the two-branched FCN8s model on the Wangyedian forest farm are shown in Table 8. It can be found that after the embedding of the CRFasRNN post-processing module, the OA of the two-branched FCN8s model increased from 87.38% to 90.1%, and the Kappa coefficient increased from 0.8567 to 0.8872. The classification result of single category showed that the Grassland had the best improvement effect, followed by White birch and Aspen.
In addition, the results in Table 8 show the OA of the FCN8s model increased from 86.63% to 88.12%, and the Kappa coefficient increased from 0.8482 to 0.8646 after the inserting the CRFasRNNpost-processing module. The classification result of single category showed that White birch and aspen had the best improvement effect.
Furthermore, the classification performance of the dual-FCN8s-CRFasRNN and the FCN8s-CRFasRNN models were better than the two-branched FCN8s model and FCN8s models. These results indicate that the learned features obtained by the CRFasRNN post-procedure achieve a level of performance that is complementary to the deep features extracted by the original model.

3.3.2. The GaoFeng Forest Farm Test Area

The comparison of the classification results of the dual-FCN8s-CRFasRNN model and the two-branched FCN8s model on the GaoFeng forest farm is shown in Table 9. After the embedding of the CRFasRNN post-processing module, the OA of the two-branched FCN8s model increased from 72.32% to 74.39%, and the Kappa coefficient increased from 0.6735 to 0.6973. The classification result of single category showed that the classification effect of Chinese fir, Masson pine, and Logging site were all improved.
In addition, the results in Table 9 reveal the OA of the FCN8s model increased from 65.05% to 73.36%, and the Kappa coefficient increased from 0.5857 to 0.6863 after embedding the CRFasRNN post-processing module. The classification result of single category showed that the classification effect of Masson pine has the most obvious improvement.
From the OA results of the two test sites, the embedding of the CRFasRNN post-processing module can optimize the classification effect of the two-branched FCN8s and FCN8s models. At the same time, the results showed that the FCN8s model with the CRFasRNN post-processing module had better optimization effects on the classification results compared with the optimization of the dual structure on the FCN8s model.

3.4. Benchmark Comparison for Classification

In order to further investigate the validity of the proposed method, this study compared the classification accuracy of the dual-FCN8s-CRFasRNN method with the performances of other four models: the two-branched FCN8s model using CRF as post processing method (named dual-FCN8s-CRF); the two-branched FCN8s model without any post-processing procedure (named dual-FCN8s); the traditional FCN8s method (named FCN8s); and the FCN8s inserted with a CRFasRNN layer (named FCN8s-CRFasRNN). Both study areas were tested with the above models (Table 8 and Table 9).
The backbone network of the FCN8s model mentioned in the four above approaches was Resnet50 [36]. The input features for the four above approaches were four-band spectral information and the NDVI feature. It can be seen from the classification results of the two test sites that among the above models that the dual-FCN8s-CRFasRNN model had the best classification performance; the FCN8s model had the poorest accuracy. Among the remaining three models, the classification accuracy of the dual-FCN8s-CRF model was better than that of the FCN8s-CRFasRNN model. The classification performance of the FCN8s-CRFasRNN model was better than that of the dual-FCN8s model. From the perspective of a single category classification, the accuracy of the dual-FCN8s-CRFasRNN model on the White birch and Aspen in the Wangyedian forest farm test site and the Chinese fir in the GaoFeng forest farm test site were better than those of other models.
Figure 8 and Figure 9 present the land cover type derived from the above five models at a more detailed scale. After post processing by the CRF and CRFasRNN algorithms, the classification result images are refined. The algorithms both reduce the degree of roughness of the image; the boundaries of Larix principis and White birch and Aspen become smoother, and the land cover shapes become clearer during the segmentation process. However, due to the excessive expansion of certain land covers during the CRF post-processing, some small land covers are incorrectly classified by the surrounding land covers, which is inferior to the CRFasRNN as the post-processing method. From the visual comparison of the model with and without the CRFasRNN post-procedure, we observed classes that tend to represent large homogeneous areas benefit substantially from the post-procedure. For the dual-FCN8s method, some small objects are easily misclassified as the surrounding categories because they are merged with surrounding pixels into the same objects during the segmentation phase. In addition, the local inaccurate boundaries generated by the segmentation method also caused deviation from the real edges. The result also shows that some details were missing from the land cover border. Small land cover areas tend to be round, and some incorrect classifications are exaggerated by directly applying the common-structure FCN8s to the image classification problem.

4. Discussion

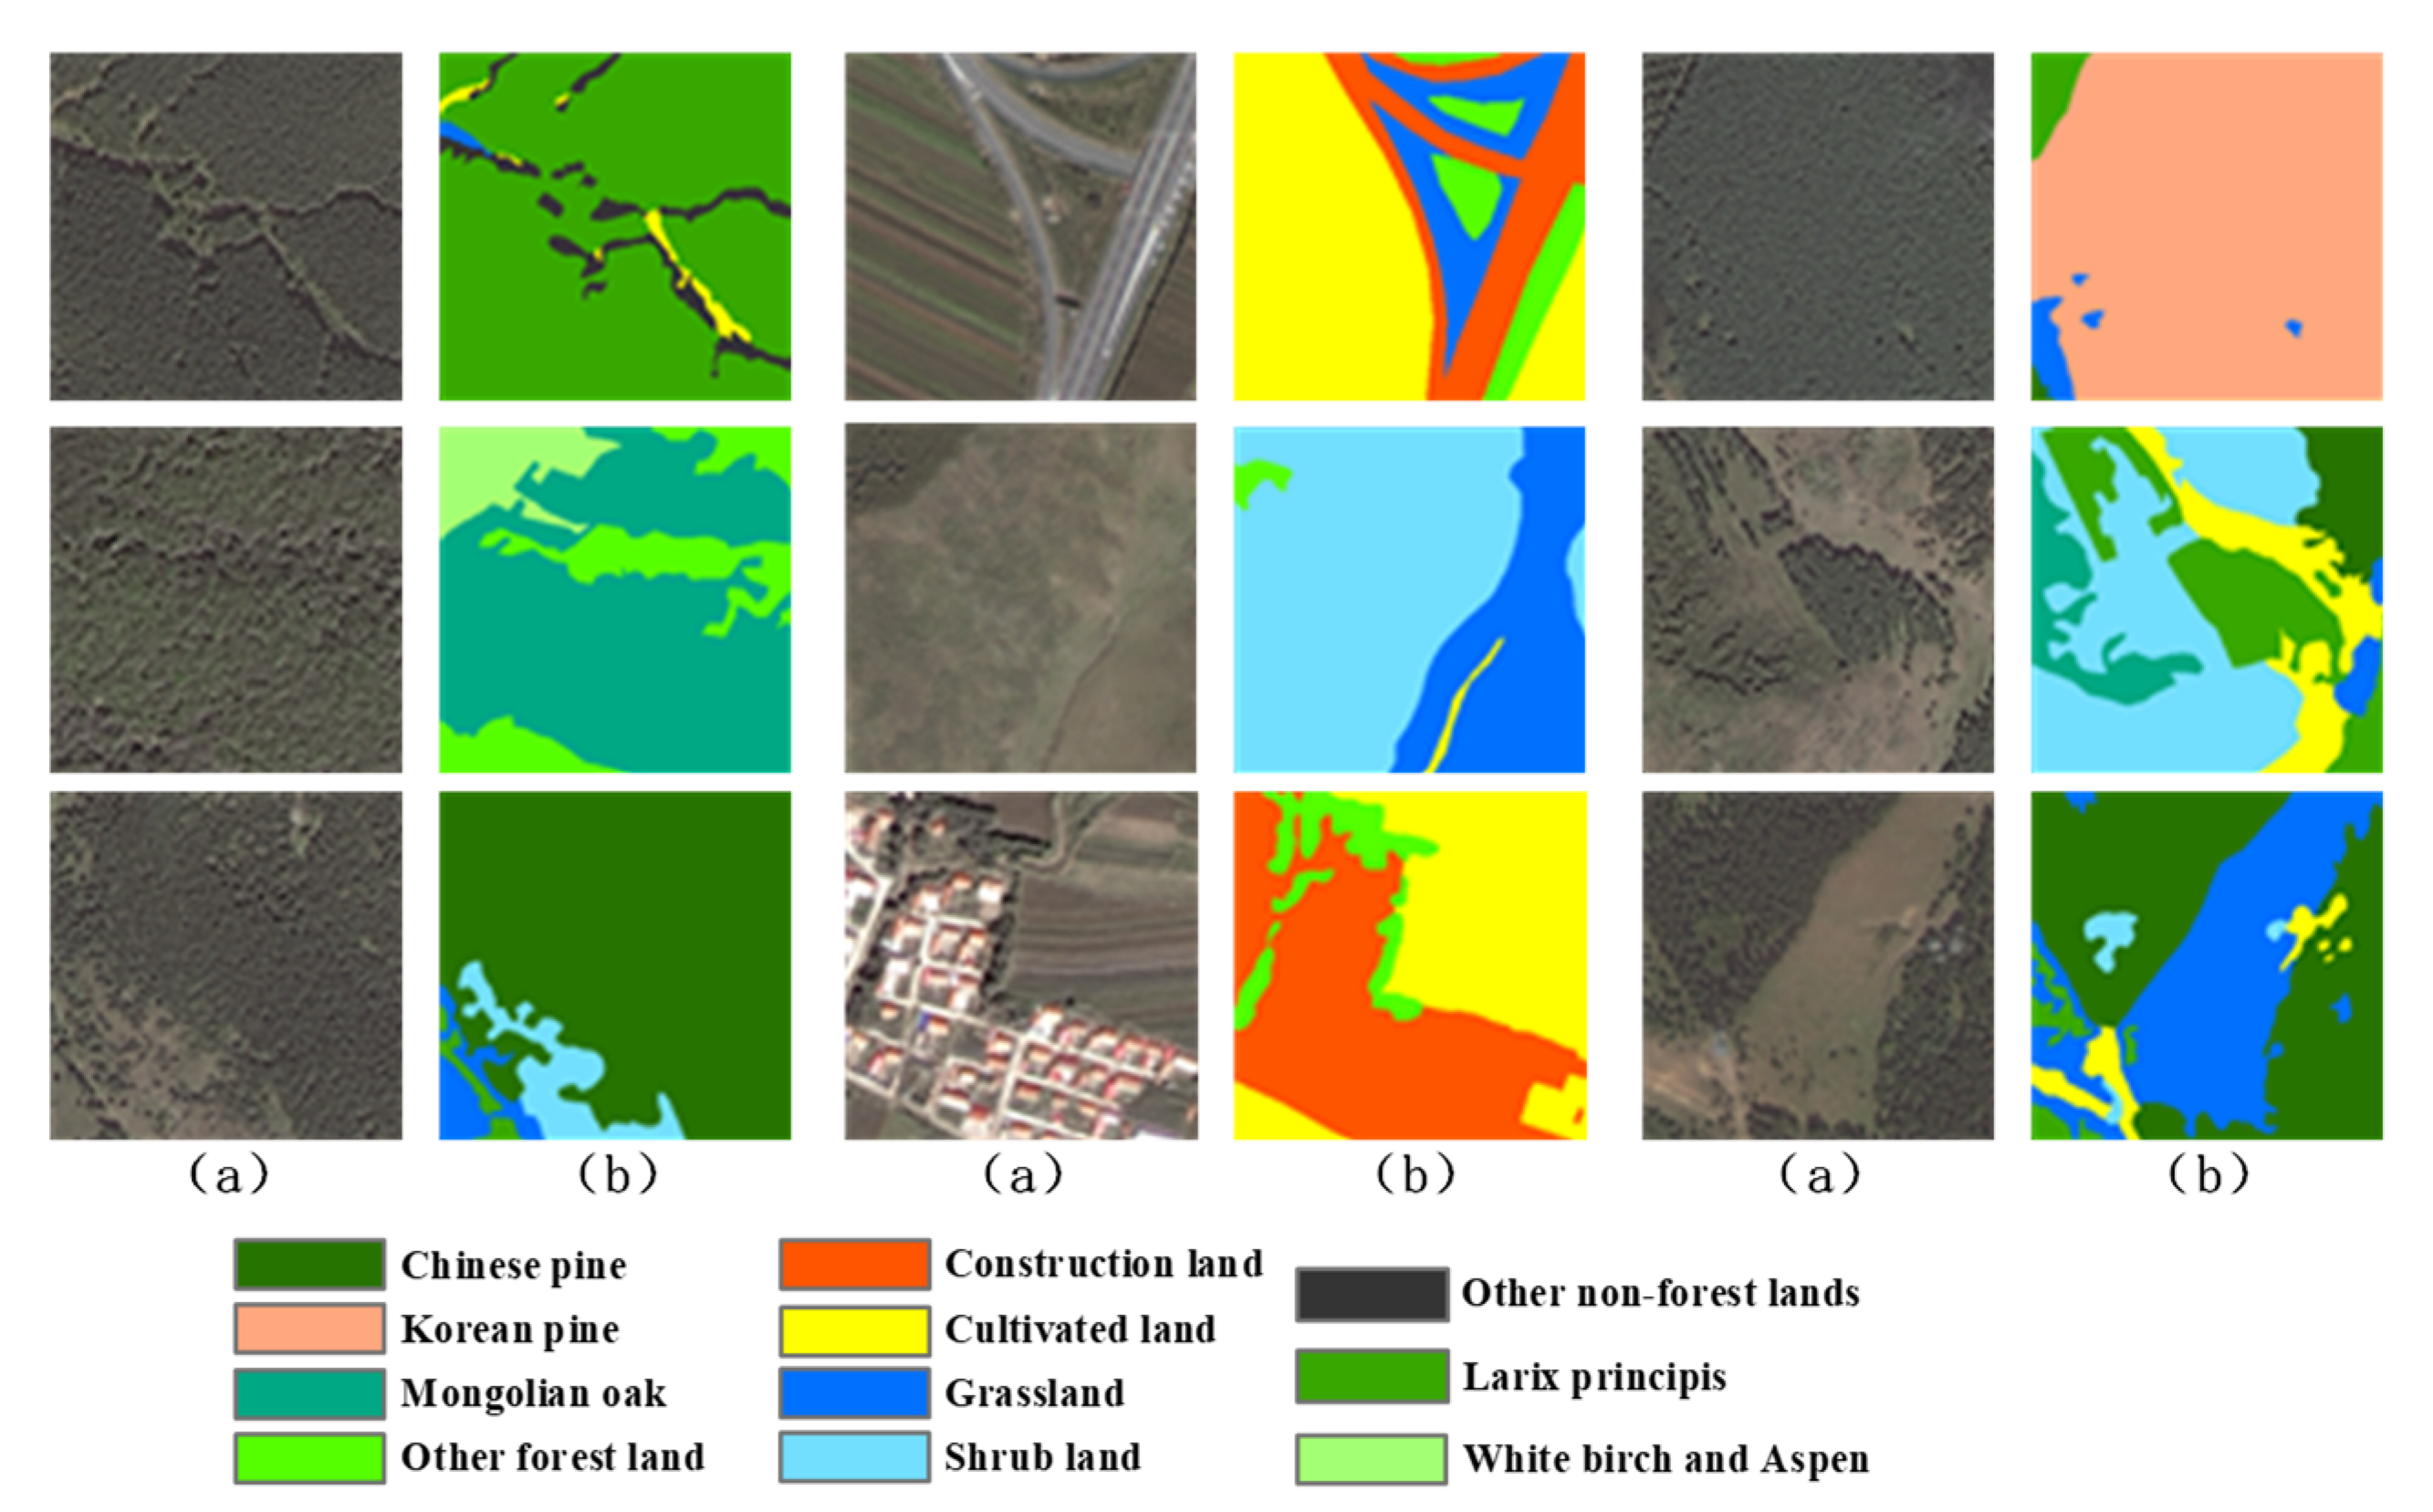
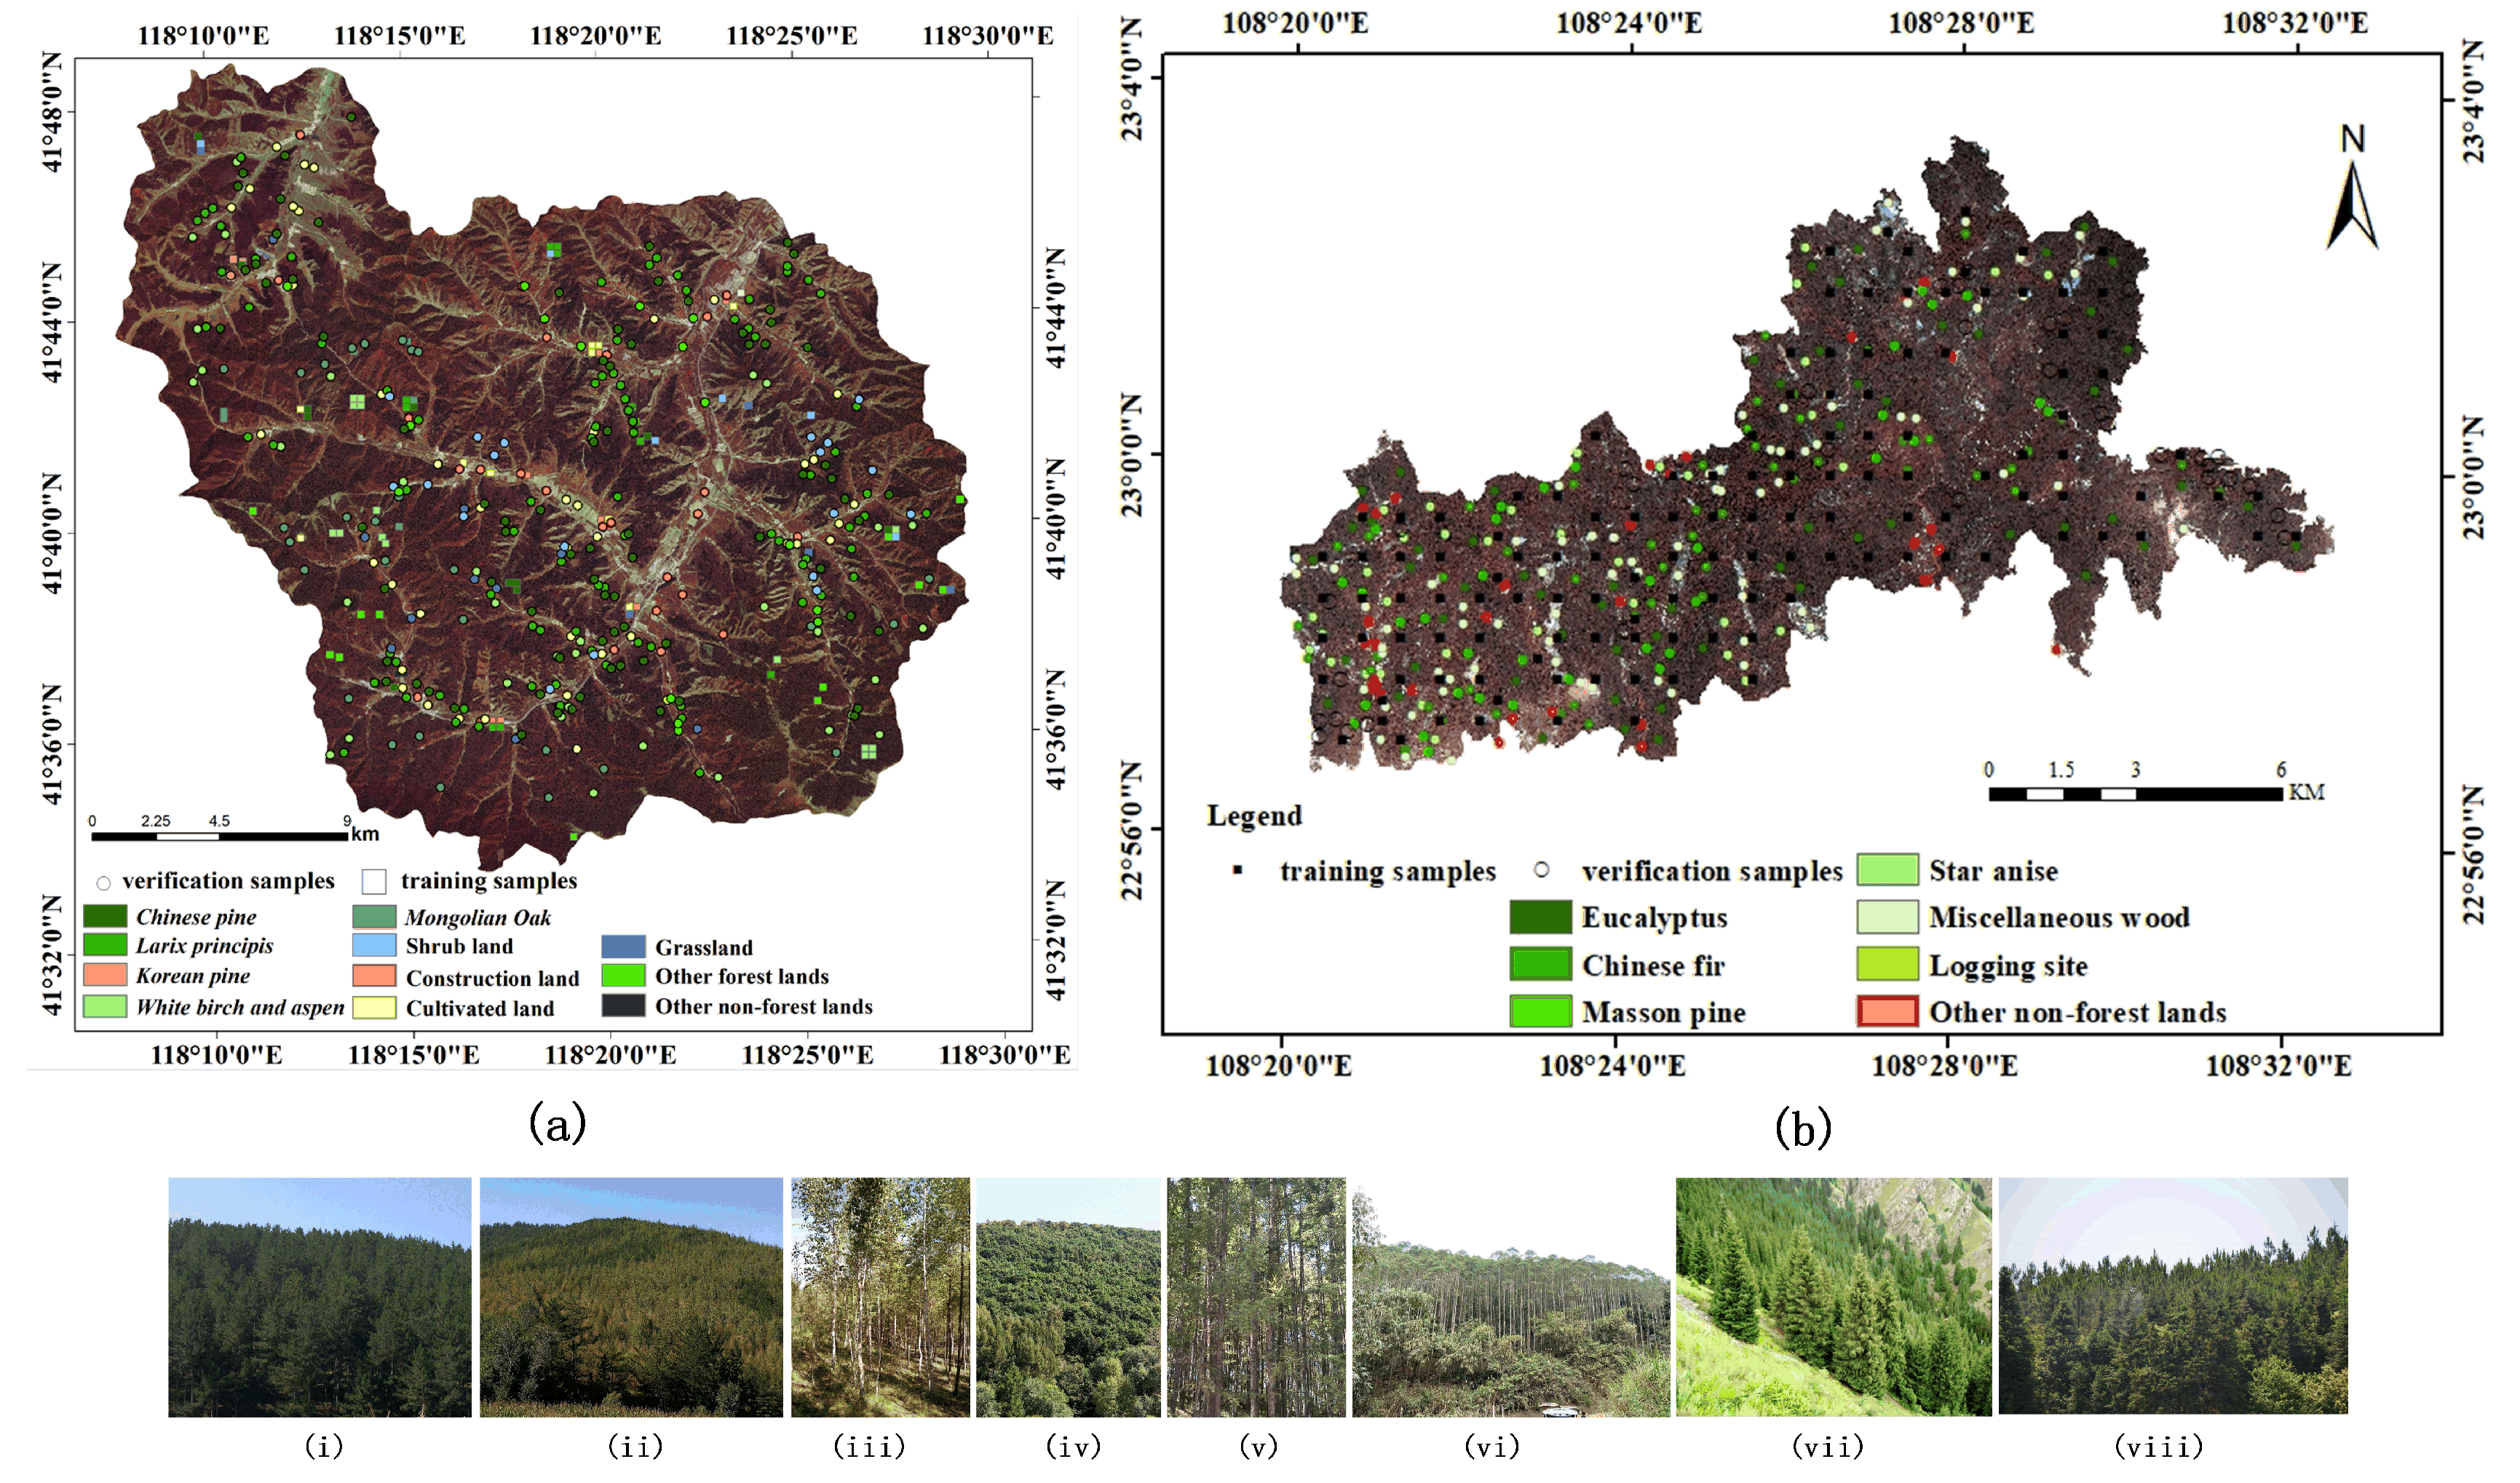
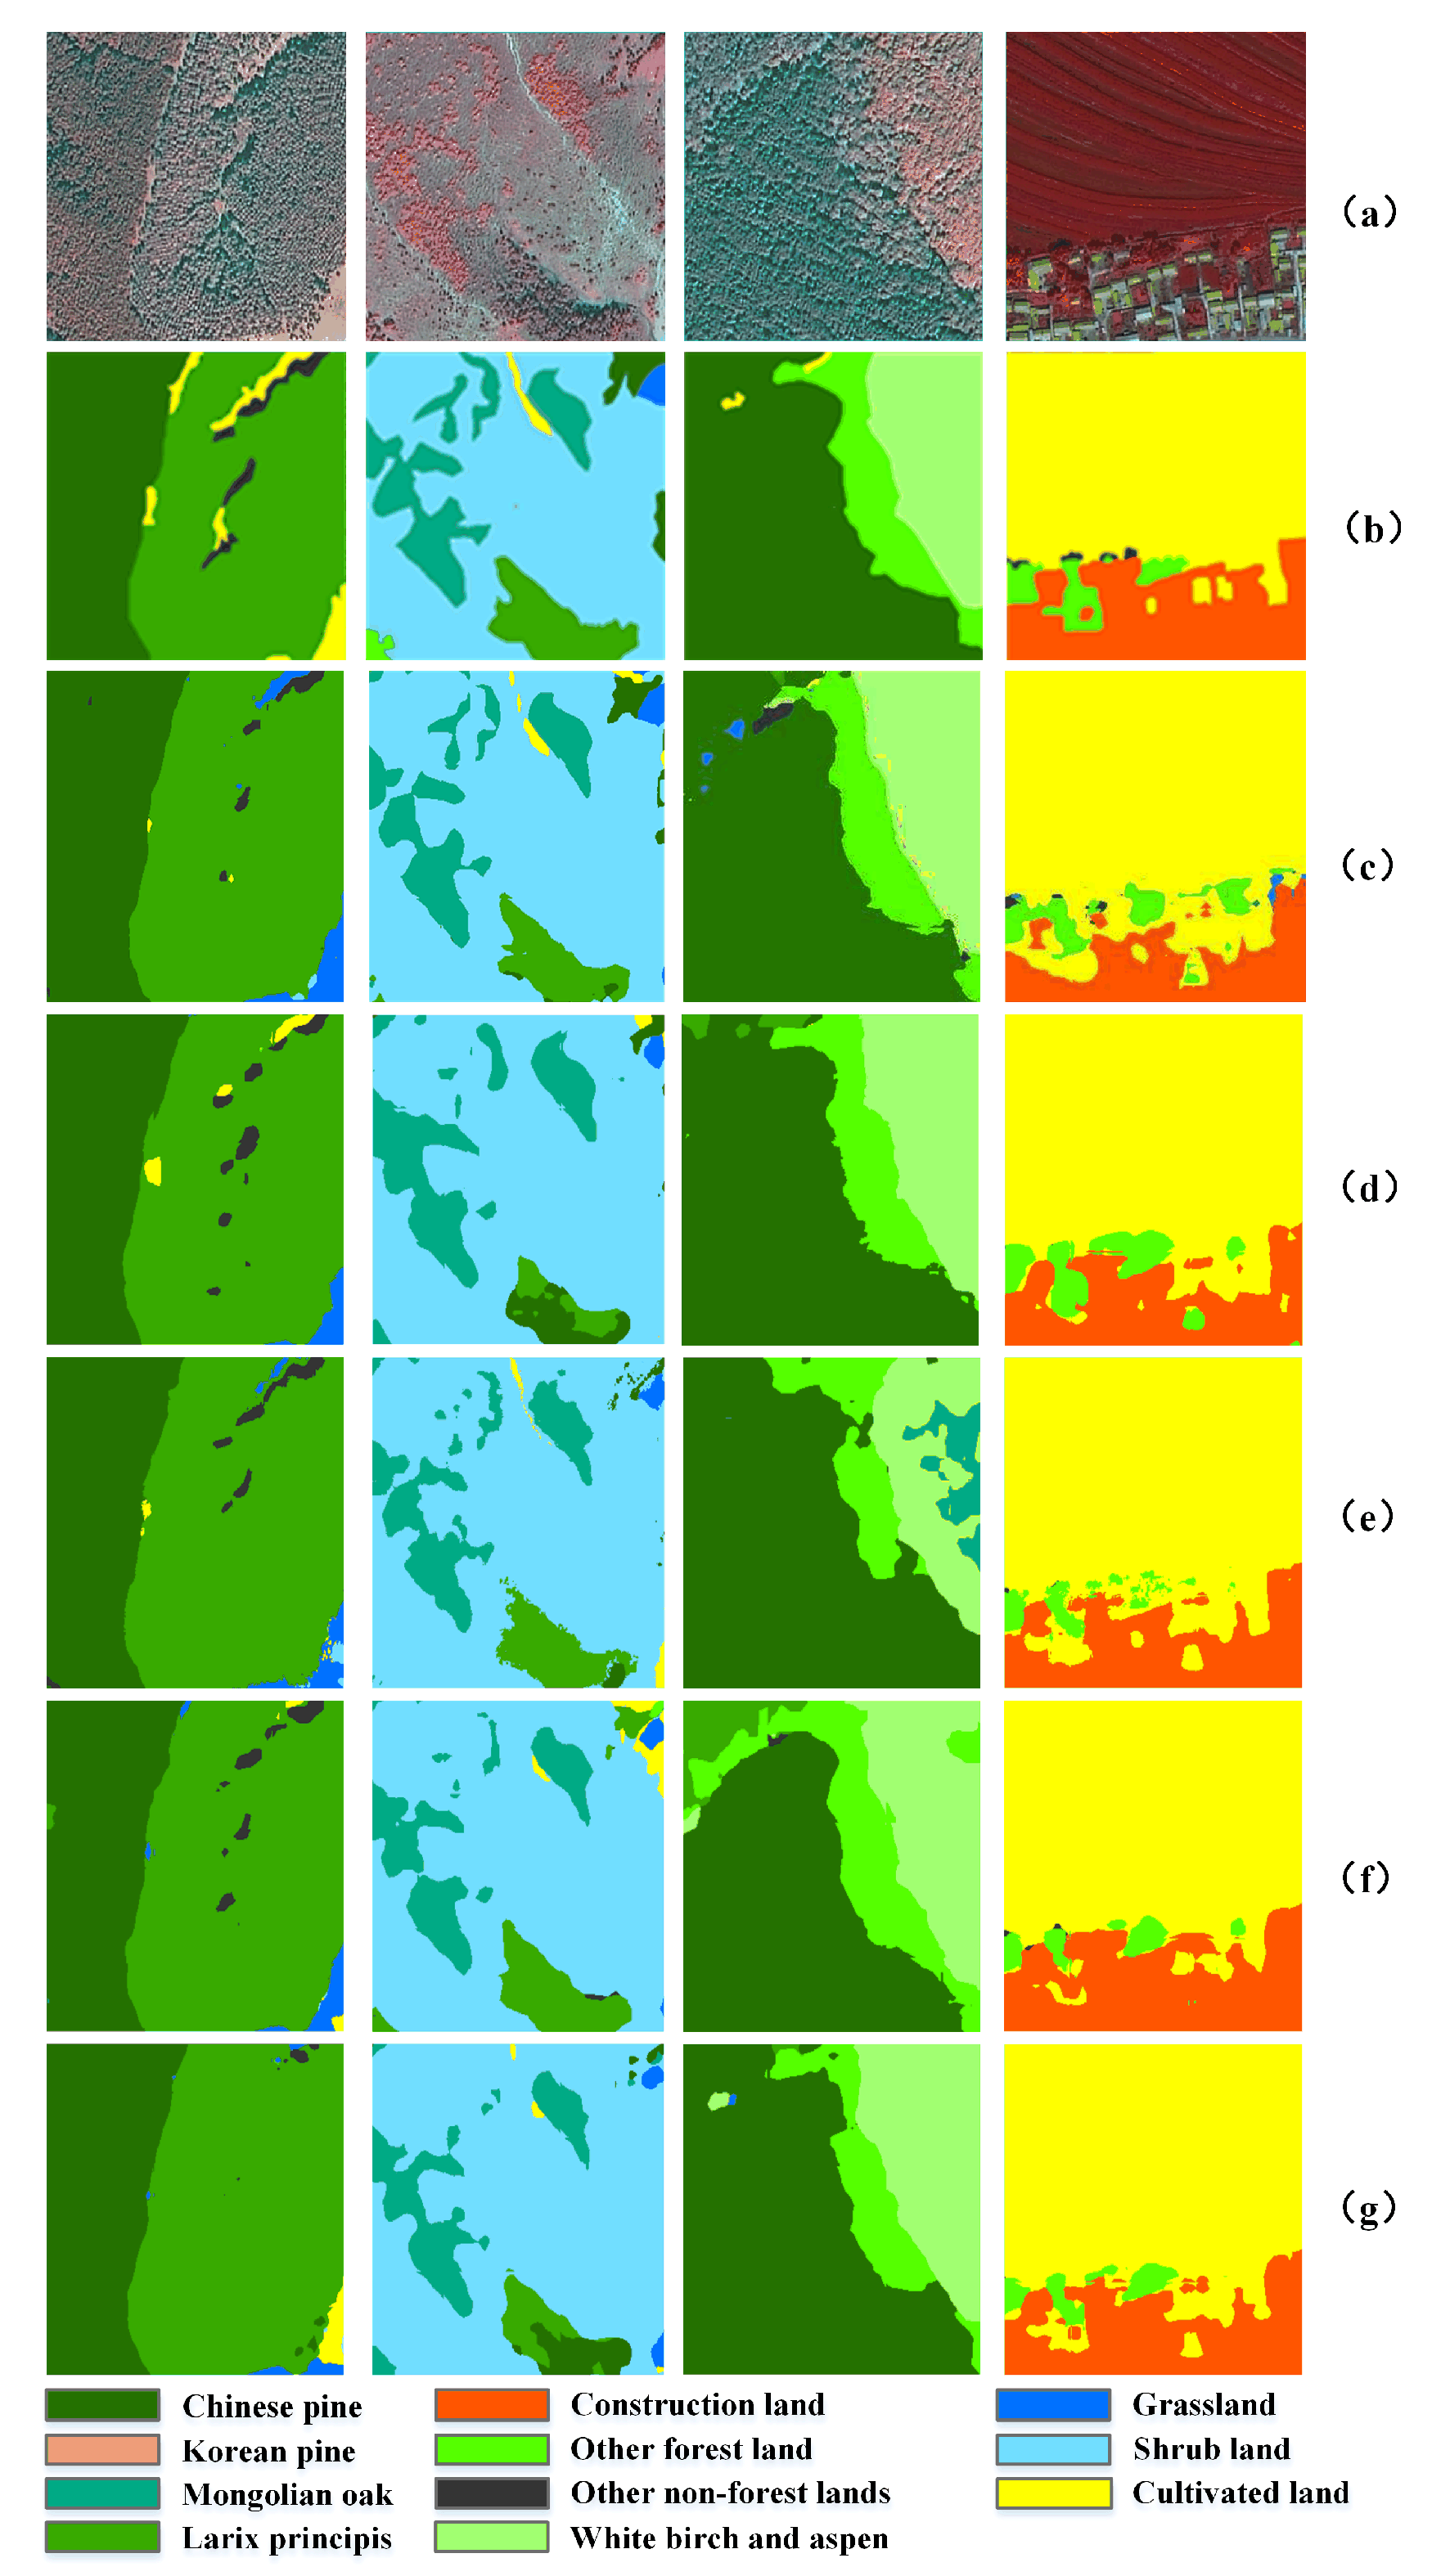
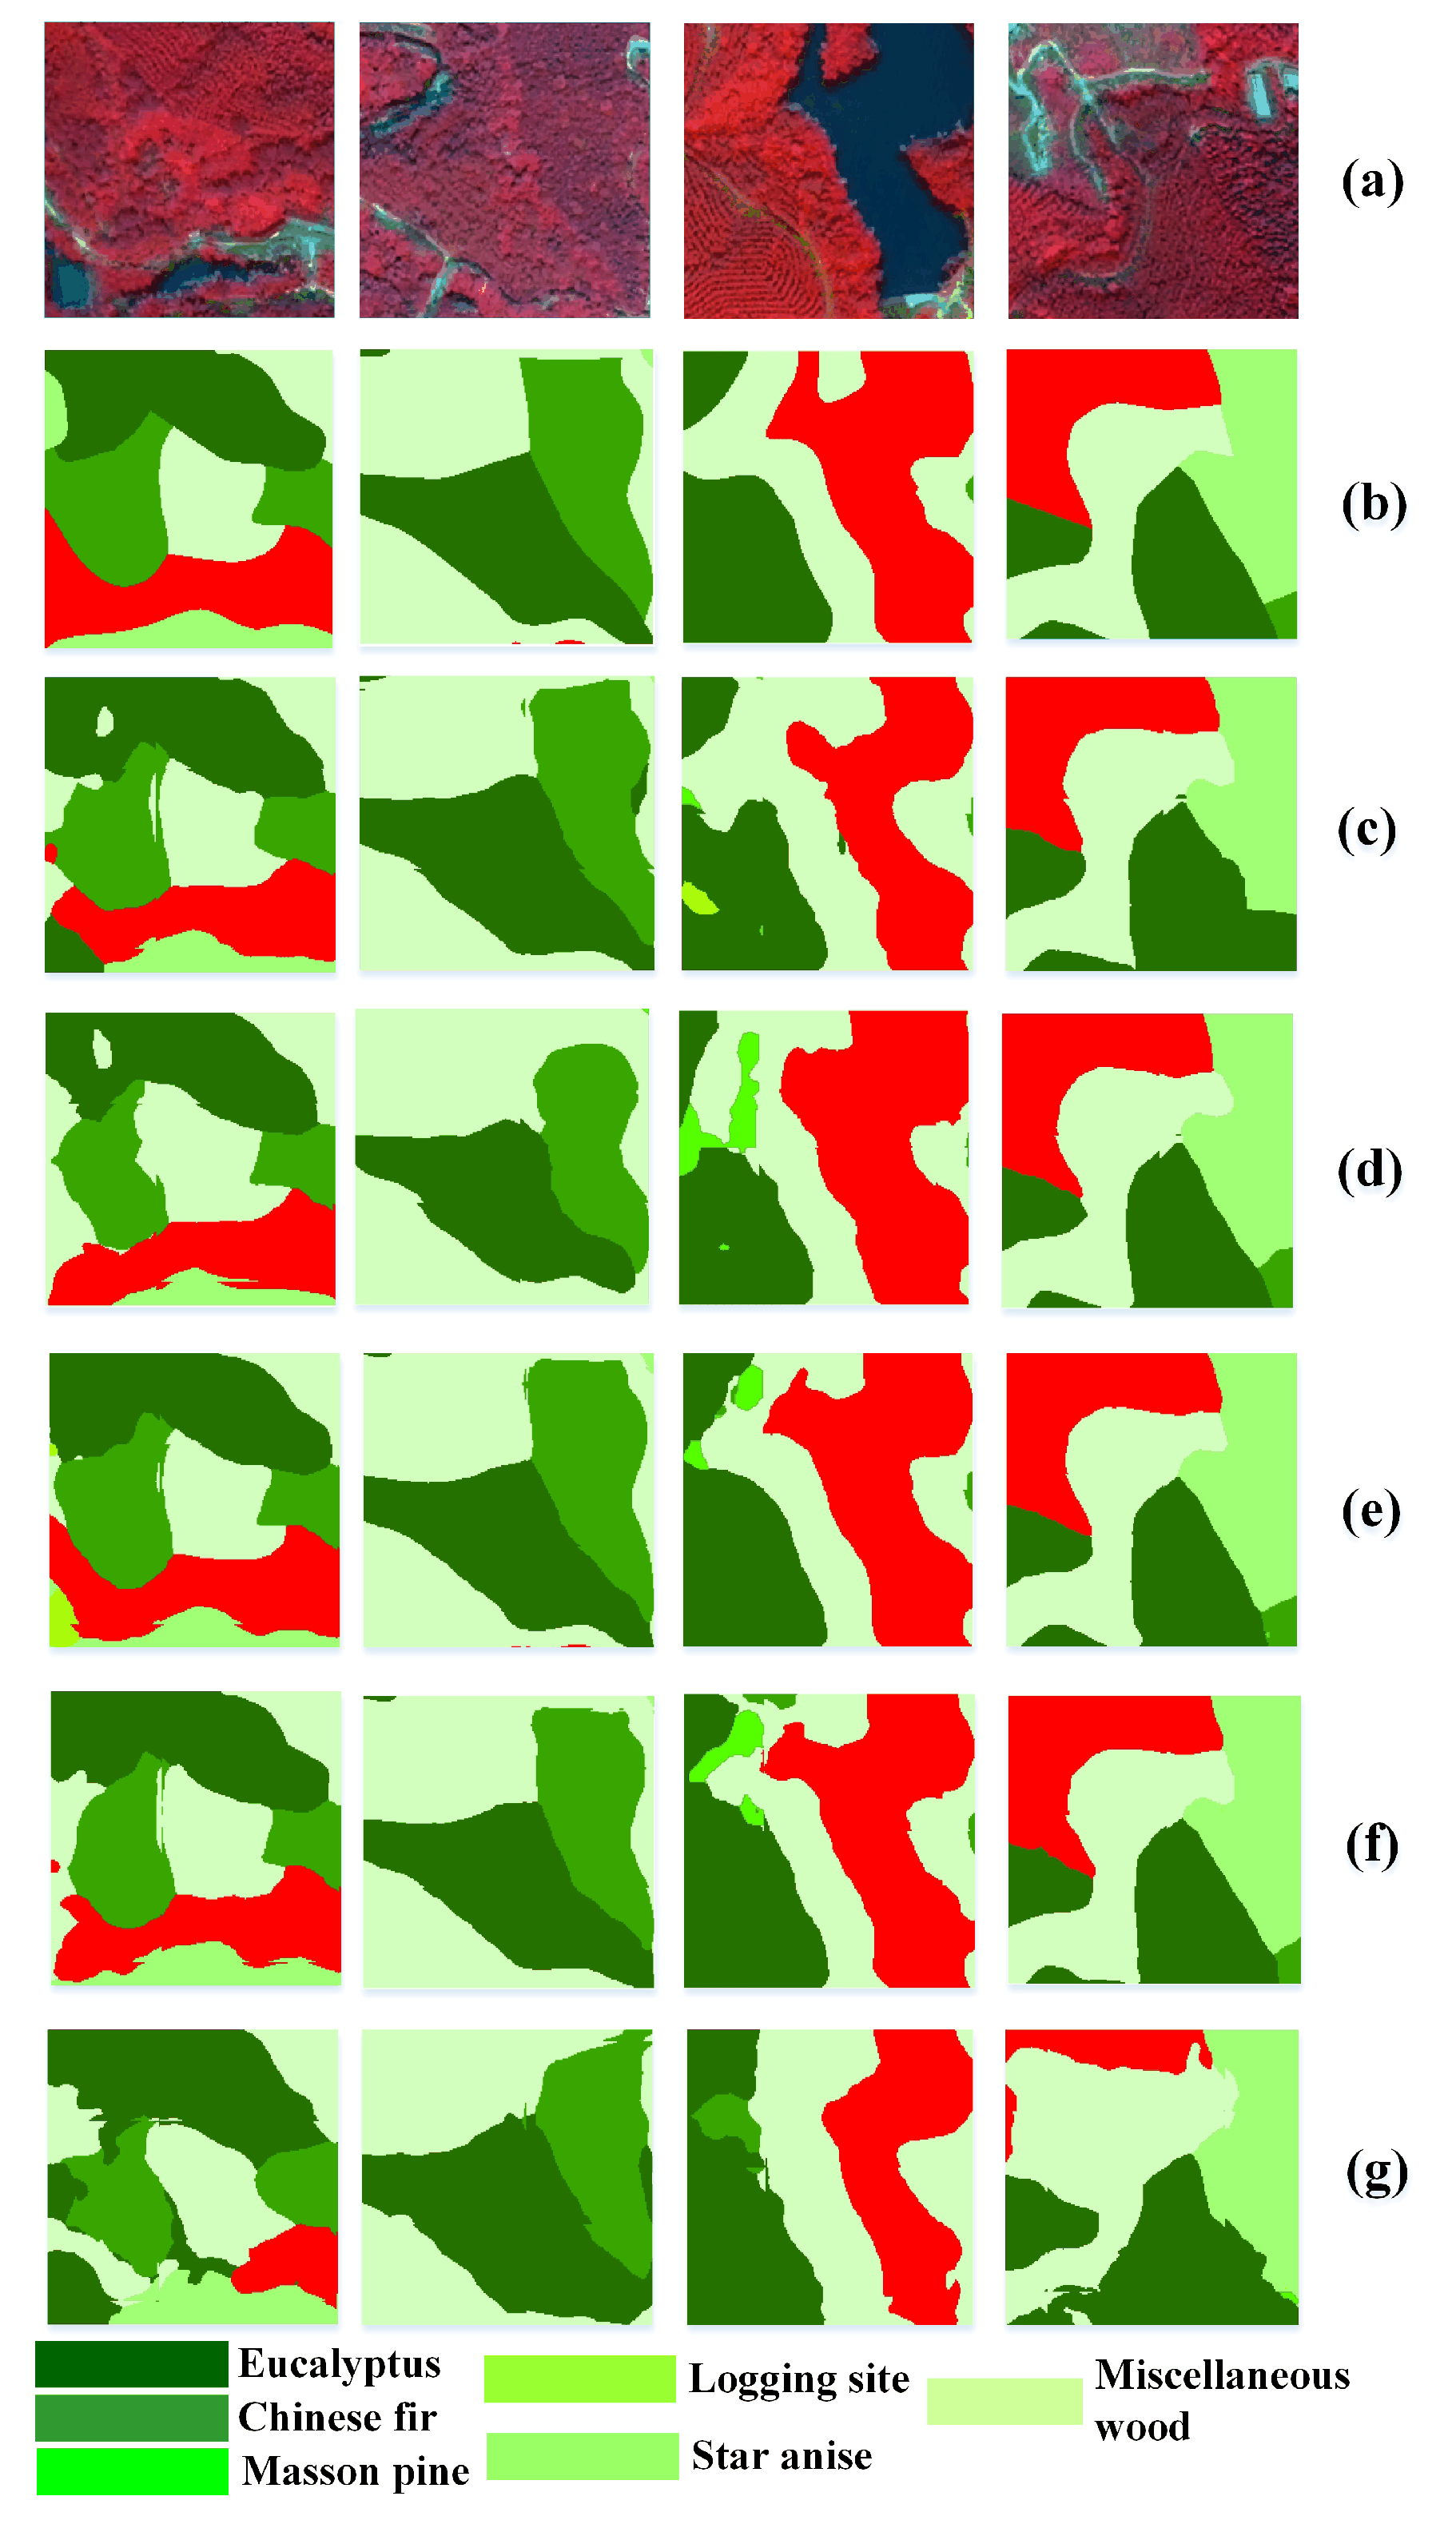
The study showed that the deep learning fusion model has great potential in the classification of forest types and tree species. The proposed dual-FCN8s-CRFasRNN method indicated its applicability for forest type classification at a tree species level from HSR remote sensing imagery. The experimental results showed that, the dual-FCN8s-CRFasRNN model could extract the dominant tree species or forest types which were widely distributed in two study areas, especially for the extraction of the plantation species such as Chinese pine, Larix principis, and Eucalyptus which all had an OA above 90%. However, for the other forest land types in the Wangyedian forest farm and the other category in the GaoFeng forest farm, the classification accuracy was poor. That may be because the above two categories included many kinds of surface features, presenting spectral characteristics that are complex and difficult to distinguish.
Through the comparative analysis of the research results of the two experimental areas, it could be seen that the classification accuracy of the GaoFeng forest farm in Guangxi was relatively low compared with the classification results of the Wangyedian forest farm in North China. The PA of Masson pine, Star anise, and Miscellaneous wood were less than 70%. This may have been caused by two reasons. Firstly, the spectral is similar among these forest land types, which inevitably increased the difficulty of distinguishing them. Secondly, the number of collected samples of these forest land types compared to Eucalyptus was relatively small, which leads to an under-fitting phenomenon of the model.
To verify the effectiveness of the proposed method and clarify the optimization effect of embedding CRFasRNN layer in the model published earlier, the paper not only compared the dual-FCN8s-CRFasRNN model with the deep learning model published earlier, but also compared the results of post-processing with CRF. The results showed that the optimal classification results were obtained after adding CRFasRNN layer in both experimental areas compared with the above two methods. The classification effect was improved obviously especially for the category with less distribution range.
To further prove that embedding CRFasRNN layer into deep learning model is a general and effective optimization method. This study further compared and analyzed the optimization effect of embedding CRFasRNN layer in the classic FCN8s model. The results showed that the model with CRFasRNN layer got better classification accuracy than the classic FCN8s model and the previously published two branch fcn8s model. At the same time, in terms of processing efficiency, it also reduced the processing time compared with using CRF post-processing method.
For including NDVI indices and using a fine-tuning strategy, the proposed method outperformed those without NDVI feature and fine-tuning strategy in terms of the OA and the Kappa coefficient achieved. To further clarify the effectiveness of the use of NDVI index, this study further replaced the NDVI index with green NDVI (GNDVI) [47] index in two experimental areas as showed in Table 10 and Table 11. The results showed that the accuracy of the dual-FCN8s-CRFasRNN model with GNDVI index was with OA of 89.47% and 73.70% and Kappa coefficient of 0.8804 and 0.6898 for Wangyedian and GaoFeng forest farm, respectively, which was very similar with the model using NDVI index and the difference between them was less than 1%. From the classification results of a single category, the use of GNDVI index improved the effect of broad-leaved mixed forest, such as the other forest types in Wangyedian forest farm and the Miscellaneous in GaoFeng forest farm.
Compared with the previous research results of the fine classification of forest types using HSR data, the method proposed in the study got better performance. Immitzer et al. (2012) carried out tree species classification with random forest using WorldView-2 satellite data and the overall accuracy for classifying 10 tree species was around 82% [48]. Adelabu et al. (2015) employed ground and satellite based QuickBird data and random forest to classify five tree species in a Southern African Woodland with OA of 86.25% [49]. Waser et al. (2014) evaluated the potential of WorldView-2 data to classify tree species using object-based supervised classification methods with OA of 83% [50]. Cho et al. (2015) based on WorldView-2 data performed tree species and canopy gaps mapping in South Africa with OA of 89.3% [51]. Sun et al. (2019) optimized three different deep learning methods to classify the tree species, the results showed that VGG16 had the best performance, with an overall accuracy of 73.25% [52]. Cao (2020) based on the airborne charge coupled device (CCD) orthophoto proposed an improved Res-UNet model for tree species classification in GaoFeng forest farm. The result showed that the proposed method got an OA of 87% which was higher than this study; however, the experimental area of this study was smaller, and the accuracy of Eucalyptus classification is 88.37%, which is lower than this paper [53]. Xie (2019) based on multi-temporal ZY-3 data, carried out the classification of tree species, forest type, and land cover type in the Wangyedian forest farm [54], which is same test area utilized in our research. The OA (84.9%) was much low than our result, but the accuracy of broad-leaved tree species such as White birch and Aspen (approximately 85%) was a little bit higher than ours. This may be due to the use of multi-temporal data to optimize the performance. The effect of using multi-temporal data for the fine classification of forest types had also been proven by other studies. For example, Ren et al. based on multi-temporal SPOT-5 and China GF-1 data achieved the fine classification of forest types with an accuracy of up to 92% [55]. Agata (2019) classified tree species over a large area based on multi-temporal Sentinel-2 and DEM with a classification accuracy of 94.8% [56]. Based on these results, studies are planned to combine multi-temporal satellite data with the deep learning method for forest type fine classification as the next step in the research. In addition, the proposed method also needs to be assessed in other forest areas to evaluate the effect of different forest structures and other tree species.

5. Conclusions

As an effort to optimize the forest mapping performance refined to the tree species level in an automated way, this study developed a novel end-to-end deep learning fusion method (dual-FCN8s-CRFasRNN) for HSR remote sensing images by combining the advantageous properties of multi-modality representations and the powerful features of post-processing step, and verified its applicability for the two areas which are located in the North and South of China respectively. With an overall accuracy of 90.1% and 74.39% for two test areas, respectively, we could demonstrate the high potential of the model for forest mapping at tree species level. The results also showed that it could get a remarkable result for some plantation tree species, such as Chinese pine and Larix principis in the northern test area, and Eucalyptus in the southern test area. The embedding of the CRFasRNN post-processing module could effectively optimize the classification result. Especially for the tree species with small distribution range, the improvement effect is obvious. Through comprehensive comparison of classification accuracy and processing time, embedding CRFasRNN layer in deep learning model not only automatically completed post-processing operation in an end-to-end manner, but also improved classification effect and reduced processing time.
Given the importance of mapping forest resources, the proposed dual-FCN8s-CRFasRNN model provided a feasible optimized idea for mapping the forest type at tree species levels for HSR image, and will substantially contribute to the improvement for the management and sustainable development of forest resources in the country.
In the future, we will further exploit the potentials of deep learning based on multi-temporal data, as well as investigating the means to build the model with limited number of training samples for the forest type classification at tree species level of high-spatial-resolution images.

Author Contributions

Y.G. conceptualized the manuscript topic and was in charge of overall direction and planning. Z.L. and E.C. reviewed and edited the first draft of the manuscript. X.Z. provided valuable information for field survey site selection. L.Z. was involved in field data collection. E.X., Y.H., and R.S. carried out the preprocessing of the images and were involved in field data collection. All co-authors contributed to the final writing. All authors have read and agreed to the published version of the manuscript.

Funding

This research was funded by the Special Funds for Fundamental Research Business Expenses of Central Public Welfare Research Institutions “Study on Dual-branch uNet Optimal Combination Model for Forest Type Remote Sensing Classification (CAFYBB2019SY027)” project and National Key R&D Program of China “Research of Key Technologies for Monitoring Forest Plantation Resources (2017YFD0600900)” project.

Acknowledgments

We express our sincere thanks to Yuancai Lei from Institute of Forest Resource Information Techniques, Chinese Academy of Forestry, for reviewing and editing the draft of the manuscript. We also would like to thank the Wangyedian Forest Farm and the GaoFeng Forest Farm for providing the wonderful datasets. The authors are also grateful to the editors and referees for their constructive criticism on this paper.

Conflicts of Interest

The authors declare no conflict of interest.

References

  1. Liu, X.; Zhang, X. Research Advances and Countermeasures of Remote Sensing Classification of Forest Vegetation. For. Resour. Manag. 2004, 1, 61–64. (In Chinese) [Google Scholar]
  2. Xiao, X.; Boles, S.; Liu, J.; Zhuang, D.; Liu, M. Characterization of forest types in Northeastern China, using multi-temporal SPOT-4 VEGETATION sensor data. Remote Sens. Environ. 2002, 82, 335–348. [Google Scholar] [CrossRef]
  3. Xie, Y.; Sha, Z.; Yu, M. Remote sensing imagery in vegetation mapping: A review. J. Plant Ecol. 2008, 1, 9–23. [Google Scholar] [CrossRef]
  4. Sun, J. Study on Automatic Cultivated Land Extraction from High Resolution Satellite Imagery Based on Knowledge. Ph.D. Thesis, China Agricultural University, Beijing, China, 2014. (In Chinese). [Google Scholar]
  5. Eisfelder, C.; Kraus, T.; Bock, M.; Werner, M.; Buchroithner, M.F.; Strunz, G. Towards automated forest-type mapping—A service within GSE Forest Monitoring based on SPOT-5 and IKONOS data. Int. J. Remote Sens. 2009, 30, 5015–5038. [Google Scholar] [CrossRef]
  6. Li, X.; Shao, G. Object-Based Land-Cover Mapping with High Resolution Aerial Photography at a County Scale in Midwestern USA. Remote Sens. 2014, 6, 11372–11390. [Google Scholar] [CrossRef] [Green Version]
  7. Duro, D.C.; Franklin, S.E.; Dubé, M.G. A comparison of pixel-based and object-based image analysis with selected machine learning algorithms for the classification of agricultural landscapes using SPOT-5 HRG imagery. Remote Sens. Environ. 2012, 118, 259–272. [Google Scholar] [CrossRef]
  8. Zhang, P.; Lv, Z.; Shi, W. Object-Based Spatial Feature for Classification of Very High Resolution Remote Sensing Images. IEEE Geosci. Remote Sens. Lett. 2013, 10, 1572–1576. [Google Scholar] [CrossRef]
  9. Yu, Q.; Gong, P.; Clinton, N.; Biging, G.; Kelly, M.; Schirokauer, D. Object-based detailed vegetation classification with airborne high spatial resolution remote sensing imagery. Photogramm. Eng. Remote Sens. 2006, 7, 799–811. [Google Scholar] [CrossRef] [Green Version]
  10. Reichstein, M.; Camps-Valls, G.; Stevens, B.; Jung, M.; Denzler, J.; Carvalhais, N.; Prabhat, N. Deep learning and process understanding for data-driven Earth system science. Nature 2019, 566, 195–204. [Google Scholar] [CrossRef]
  11. Zeiler, M.D.; Fergus, R. Visualizing and understanding convolutional networks. In Proceedings of the ECCV 2014 European Conference on Computer Vision, Zurich, Switzerland, 6–12 September 2014; pp. 818–833. [Google Scholar]
  12. Huang, B.; Zhao, B.; Song, Y. Urban land-use mapping using a deep convolutional neural network with high spatial resolution multispectral remote sensing imagery. Remote Sens. Environ. 2018, 214, 73–86. [Google Scholar] [CrossRef]
  13. Yuan, Q.; Shen, H.; Li, T.; Li, Z.; Li, S.; Jiang, Y.; Xu, H.; Tan, W.; Yang, Q.; Wang, J.; et al. Deep learning in environmental remote sensing: Achievements and challenges. Remote Sens. Environ. 2020, 241, 111716. [Google Scholar] [CrossRef]
  14. Zhang, C.; Sargent, I.; Pan, X.; Li, H.; Gardiner, A.; Hare, J.; Atkinson, P.M. Joint deep learning for land cover and land use classification. Remote Sens. Environ. 2019, 221, 173–187. [Google Scholar] [CrossRef] [Green Version]
  15. Zhang, C.; Pan, X.; Li, H.; Gardiner, A.; Sargent, I.; Hare, J.; Atkinson, P.M. A hybrid MLP-CNN classifier for very fine resolution remotely sensed image classification. ISPRS J. Photogramm. Remote Sens. 2018, 140, 133–144. [Google Scholar] [CrossRef] [Green Version]
  16. Zhao, W.; Du, S. Learning multiscale and deep representations for classifying remotely sensed imagery. ISPRS J. Photogramm. Remote Sens. 2016, 113, 155–165. [Google Scholar] [CrossRef]
  17. Zhao, W.; Guo, Z.; Yue, J.; Zhang, X.; Luo, L. On combining multiscale deep learning features for the classification of hyperspectral remote sensing imagery. Int. J. Remote Sens. 2015, 36, 3368–3379. [Google Scholar] [CrossRef]
  18. Mahdianpari, M.; Salehi, B.; Rezaee, M.; Mohammadimanesh, F.; Zhang, Y. Very deep convolutional neural networks for complex land cover mapping using multispectral remote sensing imagery. Remote Sens. 2018, 10. [Google Scholar] [CrossRef] [Green Version]
  19. Ienco, D.; Interdonato, R.; Gaetano, R.; Minh, H.D.T. Combining Sentinel-1 and Sentinel-2 satellite image time series for land cover mapping via a multi-source deep learning architecture. ISPRS J. Photogramm. Remote Sens. 2019, 158, 11–22. [Google Scholar] [CrossRef]
  20. Scott, G.J.; Hagan, K.C.; Marcum, R.A.; Hurt, J.A.; Anderson, D.T.; Davis, C.H. Enhanced fusion of deep neural networks for classification of benchmark high-resolution image data sets. IEEE Geosci. Remote Sens. Lett. 2018, 15, 1451–1455. [Google Scholar] [CrossRef]
  21. Scott, G.J.; Marcum, R.A.; Davis, C.H.; Nivin, T.W. Fusion of deep convolutional neural networks for land cover classification of high-resolution imagery. IEEE Geosci. Remote Sens. Lett. 2017, 14, 1638–1642. [Google Scholar] [CrossRef]
  22. Gaetano, R.; Ienco, D.; Ose, K.; Cresson, R. A two-branch CNN architecture for land cover classification of PAN and MS imagery. Remote Sens. 2018, 10, 1746. [Google Scholar] [CrossRef] [Green Version]
  23. Lafferty, J.; McCallum, A.; Pereira, F.C.N. Conditional Random Fields: Probabilistic Models for Segmenting and Labeling Sequence Data. In Proceedings of the Eighteenth International Conference on Machine Learning (ICML-2001), Williams College, Williamstown, MA, USA, 1–28 June 2001. [Google Scholar]
  24. Chen, L.C.; Papandreou, G.; Kokkinos, I.; Murphy, K.; Yuille, A.L. Semantic Image Segmentation with Deep Convolutional Nets and Fully Connected CRFs. Comput. Sci. 2016, 26, 357–361. [Google Scholar]
  25. Shelhamer, E.; Long, J.; Darrell, T. Fully convolutional networks for semantic segmentation. IEEE Trans. Pattern Anal. Mach. Intell. 2017, 39, 640–651. [Google Scholar] [CrossRef] [PubMed]
  26. Guo, Y.; Li, Z.; Chen, E.; Zhang, X.; Zhao, L.; Chen, Y.; Wang, Y. A Deep Learning Method for Forest Fine Classification Based on High Resolution Remote Sensing Images: Two-Branch FCN-8s. Sci. Silvae Sin. 2020, 3, 48–60. (In Chinese) [Google Scholar]
  27. Guo, Y.; Li, Z.; Chen, E.; Zhang, X.; Zhao, L.; Chen, Y.; Wang, Y. A Deep Learning Forest Types Classification Method for Resolution Multispectral Remote Sensing Images: Dual-FCN8s-CRF. In Proceedings of the 2019 IEEE International Geoscience and Remote Sensing Symposium, Yokohama, Japan, July 28–August 2019. [Google Scholar]
  28. Wang, Y.; Chen, E.; Guo, Y.; Li, Z.; Jin, Y.; Zhao, J.; Zhou, Y. Deep U-net Optimization Method for Forest Type Classification with High Resolution Multispectral Remote Sensing Images. Forest Res. 2020, 33, 11–18. (In Chinese) [Google Scholar]
  29. Zheng, S.; Jayasumana, S.; Romera-Paredes, B.; Vineet, V.; Su, Z.; Du, D.; Huang, C.; Torr, P. Conditional Random Fields as Recurrent Neural Networks. In Proceedings of the 2015 IEEE International Conference on Computer Vision, Santiago, Chile, 7–13 December 2015; pp. 1529–1537. [Google Scholar]
  30. GB/T 26424-2010 Technical Regulations for Inventory for Forest Management Planning and Design [S]. Available online: https://www.antpedia.com/standard/6160978.html/ (accessed on 10 October 2020).
  31. China Centre for Resources Satellite Data and Application. The Introduction of GF-2 Satellite. Available online: http://218.247.138.119/CN/Satellite/3128.shtml (accessed on 24 September 2020).
  32. Cooley, T.; Anderson, G.P.; Felde, G.W.; Hoke, M.L.; Ratkowski, A.J.; Chetwynd, J.H.; Gardner, J.A.; Adler-Golden, S.M.; Matthew, M.W.; Berk, A.; et al. FLAASH, a MODTRAN4-based atmospheric correction algorithm, its application and validation. In Proceedings of the 2002 IEEE International Geoscience and Remote Sensing Symposium, IGARSS 2002, Toronto, ON, Canada, 24–28 June 2002; pp. 1414–1418. [Google Scholar]
  33. Gao, Y.; Zhang, W. Comparison test and research progress of topographic correction on remotely sensed data. Geogr. Res. 2008, 27, 467–477. (In Chinese) [Google Scholar]
  34. Cao, H.; Gao, W.; Zhang, X.; Liu, X.; Fan, B.; Li, S. Overview of ZY-3 satellite research and application. In Proceedings of the 63rd IAC (International Astronautical Congress), Naples, Italy, 1–5 October 2012. [Google Scholar]
  35. Sun, W.; Chen, B.; Messinger, D.W. Nearest-neighbor diffusion-based pansharpening algorithm for spectral images. Opt. Eng. 2014, 53, 013107. [Google Scholar] [CrossRef] [Green Version]
  36. He, K.; Zhang, X.; Ren, S.; Sun, J. Identity Mappings in Deep Residual Networks. In Proceedings of the European Conference on Computer Vision, Amsterdam, The Netherlands, 11–14 October 2016. [Google Scholar]
  37. Hirose, Y.; Yamashita, K.; Hijiya, S. Back-propagation algorithm which varies the number of hidden units. IEEE Trans. Neural Netw. 1991, 4, 61–66. [Google Scholar] [CrossRef]
  38. Deng, J.; Dong, W.; Socher, R.; Li, L.-J.; Li, K.; Li, F.-F. ImageNet: A large-scale hierarchical image database. In Proceedings of the IEEE Conference on Computer Vision and Pattern Recognition, Miami, FL, USA, 20–25 June 2009; pp. 248–255. [Google Scholar]
  39. Bottou, L. Large-Scale Machine Learning with Stochastic Gradient Descent. In Proceedings of the COMPSTAT’2010, Paris, France, 22–27 August 2010; pp. 177–186. [Google Scholar]
  40. Krähenbühl, P.; Koltun, V. Parameter learning and convergent inference for dense random fields. In Proceedings of the 30th International Conference on Machine Learning, Atlanta, GA, USA, 16–21 June 2013. [Google Scholar]
  41. LeCun, Y.; Bottou, L.; Bengio, Y.; Haffner, P. Gradient-based learning applied to document recognition. Proc. IEEE 1998, 86, 2278–2324. [Google Scholar] [CrossRef] [Green Version]
  42. Ioffe, S.; Szegedy, C. Batch Normalization: Accelerating Deep Network Training by Reducing Internal Covariate Shift. In Proceedings of the 32nd International Conference on Machine Learning, ICML, Lille, France, 6–11 July 2015; pp. 448–456. [Google Scholar]
  43. Nair, V.; Hinton, G. Rectified Linear Units Improve Restricted Boltzmann Machines. In Proceedings of the 27th International Conference on Machine Learning (ICML-10), Haifa, Israel, 21–24 June 2010; pp. 807–814. [Google Scholar]
  44. Moolayil, J. An Introduction to Deep Learning and Keras: A Fast-Track Approach to Modern Deep Learning with Python; Apress: Berkeley, CA, USA, 2018; pp. 1–16. [Google Scholar]
  45. Drakopoulos, G.; Liapakis, X.; Spyrou, E.; Tzimas, G.; Sioutas, S. Computing long sequences of consecutive fibonacci integers with tensorflow. In Proceedings of the International Conference on Artificial Intelligence Applications and Innovations, Dubai, UAE, 30 November 2019; pp. 150–160. [Google Scholar]
  46. Kingma, D.; Ba, J. Adam: A Method for Stochastic Optimization. In Proceedings of the 3rd International Conference for Learning Representations, San Diego, CA, USA, 7–9 May 2015. [Google Scholar]
  47. Gitelson, A.A.; Kaufman, Y.J.; Merzlyak, M.N. Use of a green channel in remote sensing of global vegetation from EOS-MODIS. Remote Sens. Environ. 1996, 58, 289–298. [Google Scholar] [CrossRef]
  48. Immitzer, M.; Atzberger, C.; Koukal, T. Tree Species Classification with Random Forest Using Very High Spatial Resolution 8-Band WorldView-2 Satellite Data. Remote Sens. 2012, 4, 2661–2693. [Google Scholar] [CrossRef] [Green Version]
  49. Adelabu, S.; Dube, T. Employing ground and satellite-based QuickBird data and random forest to discriminate five tree species in a Southern African Woodland. Geocarto Int. 2014, 30, 457–471. [Google Scholar] [CrossRef]
  50. Waser, L.; Küchler, M.; Jütte, K.; Stampfer, T. Evaluating the Potential of WorldView-2 Data to Classify Tree Species and Different Levels of Ash Mortality. Remote Sens. 2014, 6, 4515–4545. [Google Scholar] [CrossRef] [Green Version]
  51. Cho, M.A.; Malahlela, O.; Ramoelo, A. Assessing the utility WorldView-2 imagery for tree species mapping in South African subtropical humid forest and the conservation implications: Dukuduku forest patch as case study. Int. J. Appl. Earth Obs. 2015, 38, 349–357. [Google Scholar] [CrossRef]
  52. Sun, Y.; Huang, J.; Ao, Z.; Lao, D.; Xin, Q. Deep Learning Approaches for the Mapping of Tree Species Diversity in a Tropical Wetland Using Airborne LiDAR and High-Spatial-Resolution Remote Sensing Images. Forests 2019, 10, 1047. [Google Scholar] [CrossRef] [Green Version]
  53. Cao, K.; Zhang, X. An Improved Res-UNet Model for Tree Species Classification Using Airborne High-Resolution Images. Remote Sens. 2020, 12, 1128. [Google Scholar] [CrossRef] [Green Version]
  54. Xie, Z.; Chen, Y.; Lu, D.; Li, G.; Chen, E. Classification of Land Cover, Forest, and Tree Species Classes with ZiYuan-3 Multispectral and Stereo Data. Remote Sens. 2019, 11, 164. [Google Scholar] [CrossRef] [Green Version]
  55. Ren, C.; Ju, H.; Zhang, H.; Huang, J. Forest land type precise classification based on SPOT5 and GF-1 images. In Proceedings of the 2016 IEEE International Geoscience and Remote Sensing Symposium, Beijing, China, 10–15 July 2016; pp. 894–897. [Google Scholar]
  56. Hościło, A.; Lewandowska, A. Mapping Forest Type and Tree Species on a Regional Scale Using Multi-Temporal Sentinel-2 Data. Remote Sens. 2019, 11, 929. [Google Scholar] [CrossRef] [Green Version]
Figure 1. Schematic diagram of study area location, data source. WYD—Wangyedian Forest Farm, GaoFeng—Gaofeng Forest Farm, Gaofen-2 satellite (bands 4, 3, 2 false-color combinations).
Remotesensing 12 03324 g001
Figure 2. Examples in details for some of the training samples in the Wangyedian forest farm (a) Original image blocks; (b) Ground truth (GT) blocks showing the labels corresponding to the image blocks in (a).
Remotesensing 12 03324 g002
Figure 3. Examples in details for some of the training samples in the GaoFeng forest farm test area (a) Original image blocks; (b) Ground truth (GT) blocks showing the labels corresponding to the image blocks in (a).
Remotesensing 12 03324 g003
Figure 4. Spatial distribution map of the field survey sample points and some of the training samples in (a) the Wangyedian forest farm; (b) the GaoFeng forest farm test area, (i) Chinese pine, (ii) Larix principis, (iii) White birch and aspen, (iv) Mongolian oak, (v) Korean pine, (vi) Eucalyptus, (vii) Chinese fir, and (viii) Masson pine.
Remotesensing 12 03324 g004
Figure 5. Workflow for the proposed model for forest type classification at tree species level based on high spatial resolution (HSR) image.
Remotesensing 12 03324 g005
Figure 6. The general workflow of the Dual-FCN8s-CRFasRNN classification method.
Remotesensing 12 03324 g006
Figure 7. The structure of the proposed Dual-FCN8s-CRFasRNN.
Remotesensing 12 03324 g007
Figure 8. The detailed classification results of the Wangyedian forest farm (a) GF2-PMS (b) Label (c) Dual-FCN8s-CRFasRNN (d) Dual-FCN8s-CRF (e) Dual-FCN8s (f) FCN8s (g) FCN8s-CRFasRNN.
Remotesensing 12 03324 g008
Figure 9. The detailed classification results of the GaoFeng forest farm test area (a) GF2-PMS (b) Label (c) Dual-FCN8s-CRFasRNN (d) Dual-FCN8s-CRF (e) FCN8s-CRFasRNN (f) Dual-FCN8s (g) FCN8-CRFasRNN.
Remotesensing 12 03324 g009
Table 1. Classification system of the Wangyedian study areas.
Test AreaLevel OneLevel TwoLevel Three
The Wangyedian forest farmForest landWoodlandChinese pine (CP)
Larix principis (LP)
Korean pine (KP)
White birch and aspen (WA)
Mongolian oak (MO)
Shrub land(SL)/
Other forest landInclude part of Mixed Broadleaf-conifer Forest and part of Mixed Broadleaf Forest (OFL)
Non-forest landCultivated land (CUL)/
Grassland (GL)/
Construction land (COL)/
Other non-forest land (ONFL)/
Table 2. Classification system of the GaoFeng study areas.
Test AreaLevel OneLevel TwoLevel Three
The GaoFeng forest farm test areaForest landWoodlandEucalyptus (EP)
Chinese fir (CF)
Masson pine (MP)
Star anise (SA)
Miscellaneous wood (MW)
Logging site (LS)/
Non-forest landOther non-forest land (ONFL)Include part of Construction land and part of Water
Table 3. Parameter information for Gaofen-2 (GF-2) remote sensing images in the two study areas.
Research AreaScenery Serial NumberImage TimeSolar Elevation Angle (°)Solar Azimuth (°)Cloud Cover (%)
Wangyedian (WYD)40745515 September 201736.139163.3052%
40745525 September 201735.978163.1662%
40820585 September 201736.039163.7240%
40820595 September 201735.878163.5860%
GaoFeng (GF)283582921 September 201626.133147.1070%
Table 4. Confusion Matrix of Classification Result of Dual-FCN8s-CRFasRNN for the Wangyedian forest farm.
CPLPKPWAMOOFLCULCOLSLGLONFLTotalUA (%)
CP70301000020008582.35
LP1630000010006596.92
KP1015000000001693.75
WA1205020000005590.91
MO0000261021003086.67
OFL0000032031103786.49
CUL00000040000040100.00
COL110201070001258.33
SL0000020121002487.50
GL00000000011011100.00
ONFL00000000002929100.00
Total7469156228364016231229404
PA (%)94.5991.30100.0080.6592.8688.89100.0043.7591.3091.67100.00
Overall accuracy: 90.10%; Kappa coefficient: 0.8872
Table 5. Confusion Matrix of Classification Result of Dual-FCN8s-CRFasRNN for the GaoFeng forest farm.
EPCFMPSAMWLSONFLTotalUA (%)
EP561563357970.89
CF035304004283.33
MP152622314065.00
SA110252013083.33
MW154325324358.14
LS100012733284.38
ONFL000002212391.30
Total60473836373833289
PA (%)93.3374.4768.4269.4467.5771.0563.64
Overall accuracy: 74.39%; Kappa coefficient: 0.6973
Table 6. Impact of NDVI Features and Fine-tuning Strategy on Classification Accuracy of Dual-FCN8s-CRFasRNN for the Wangyedian forest farm.
dual-FCN8s-noNDVI-CRFasRNNdual-FCN8s-noFinetune-CRFasRNN
PA (%)UA (%)PA (%)UA (%)
CP94.5981.493.2477.53
LP91.3096.9289.8688.57
KP100.0093.75100.00100.00
WA70.9789.8062.9092.86
MO89.29100.0085.7185.71
OFL81.2572.2268.7547.83
CUL88.8984.2194.4479.07
COL100.00100.00100.00100.00
SL95.6575.8682.61100.00
GL83.3376.9283.3376.92
ONFL79.3192.0072.4195.45
OA (%)88.3785.15
Kappa coefficient0.86780.831
Table 7. Impact of NDVI Features and Fine-tuning Strategy on Classification Accuracy of Dual-FCN8s-CRFasRNN for the Gaofeng forest farm test area.
dual-FCN8s-noNDVI-CRFasRNNdual-FCN8s-noFinetune-CRFasRNN
PA (%)UA (%)PA (%)UA (%)
EP91.6768.7591.6776.39
CF61.776.3246.8178.57
MP60.5348.9468.4255.32
SA69.4489.2972.2281.25
MW59.4656.4164.8648.98
LS84.2191.4378.9585.71
ONFL63.6495.4563.6480.77
OA(%)71.63%70.59%
Kappa coefficient0.66450.6538
Table 8. Classification accuracies of the FCN8s, FCN8s-CRFasRNN, Dual-FCN8s and Dual-FCN8s-CRF for the Wangyedian forest farm.
FCN8sFCN8s-CRFasRNNDual-FCN8sDual-FCN8s-CRF
PA (%)UA (%)PA (%)UA (%)PA (%)UA (%)PA (%)UA (%)
CP90.5481.7186.4981.0195.9586.5995.7184.81
LP94.2087.8489.8696.8886.9692.3194.2094.20
KP100.0093.75100.00100.00100.0093.75100.00100.00
WA56.4592.1179.0377.7867.7493.3360.5388.46
MO100.0082.3592.8681.2592.8692.8692.8696.30
OFL50.0040.0031.2583.3362.5043.4862.5055.56
CUL97.2287.5097.2283.3394.4475.5690.4480.95
COL100.00100.00100.00100.00100.00100.00100.00100.00
SL86.9695.2495.6591.6791.3087.595.6595.65
GL83.33100.0083.3390.9150.0085.7183.3383.33
ONFL93.1093.1096.55100.0096.5596.5586.21100.00
OA (%)86.6388.1287.3889.63
Kappa coefficient0.84820.86460.85670.882
Table 9. Classification accuracies of the FCN8s, FCN8s-CRFasRNN, Dual-FCN8s and Dual-FCN8s-CRF for the GaoFeng forest farm test area.
FCN8sFCN8s-CRFasRNNDual-FCN8sDual-FCN8s-CRF
PA (%)UA (%)PA (%)UA (%)PA (%)UA (%)PA (%)UA (%)
EP95.0066.2893.3378.8793.3376.7186.6789.66
CF59.5766.6755.3281.2563.8373.1770.2168.75
MP50.0070.3778.9555.5663.1661.5463.1661.54
SA72.2276.4758.3384.0069.4475.7672.2286.67
MW67.5740.3270.2754.1772.975462.1643.40
LS63.1688.8973.6890.3265.7989.2978.9585.71
ONFL27.2781.8275.7689.2966.6788.0078.79100.00
OA (%)65.05%73.36%72.32%74.05%
Kappa coefficient0.58570.68630.67350.695
Table 10. Classification accuracy of dual-FCN8s-CRFasRNN with the green NDVI index in the Wangyedian forest farm.
PA (%)UA (%)
CP95.8986.42
LP91.3096.92
KP100.0088.24
WA68.4286.67
MO89.29100.00
OFL81.2572.22
CUL88.8984.21
COL100.00100.00
SL95.6575.86
GL83.3383.33
ONFL80.0096.00
OA(%)89.4737
Kappa coefficient0.8804
Table 11. Classification accuracy of dual-FCN8s-CRFasRNN with GNDVI index in the GaoFeng forest farm.
PA (%)UA (%)
EP93.3375.68
CF61.7076.32
MP57.8952.38
SA69.4483.33
MW70.2756.52
LS81.5891.18
ONFL72.7396.00
OA(%)73.7024%
Kappa coefficient0.6898

