Recent Advances of Hyperspectral Imaging Technology and Applications in Agriculture


Abstract
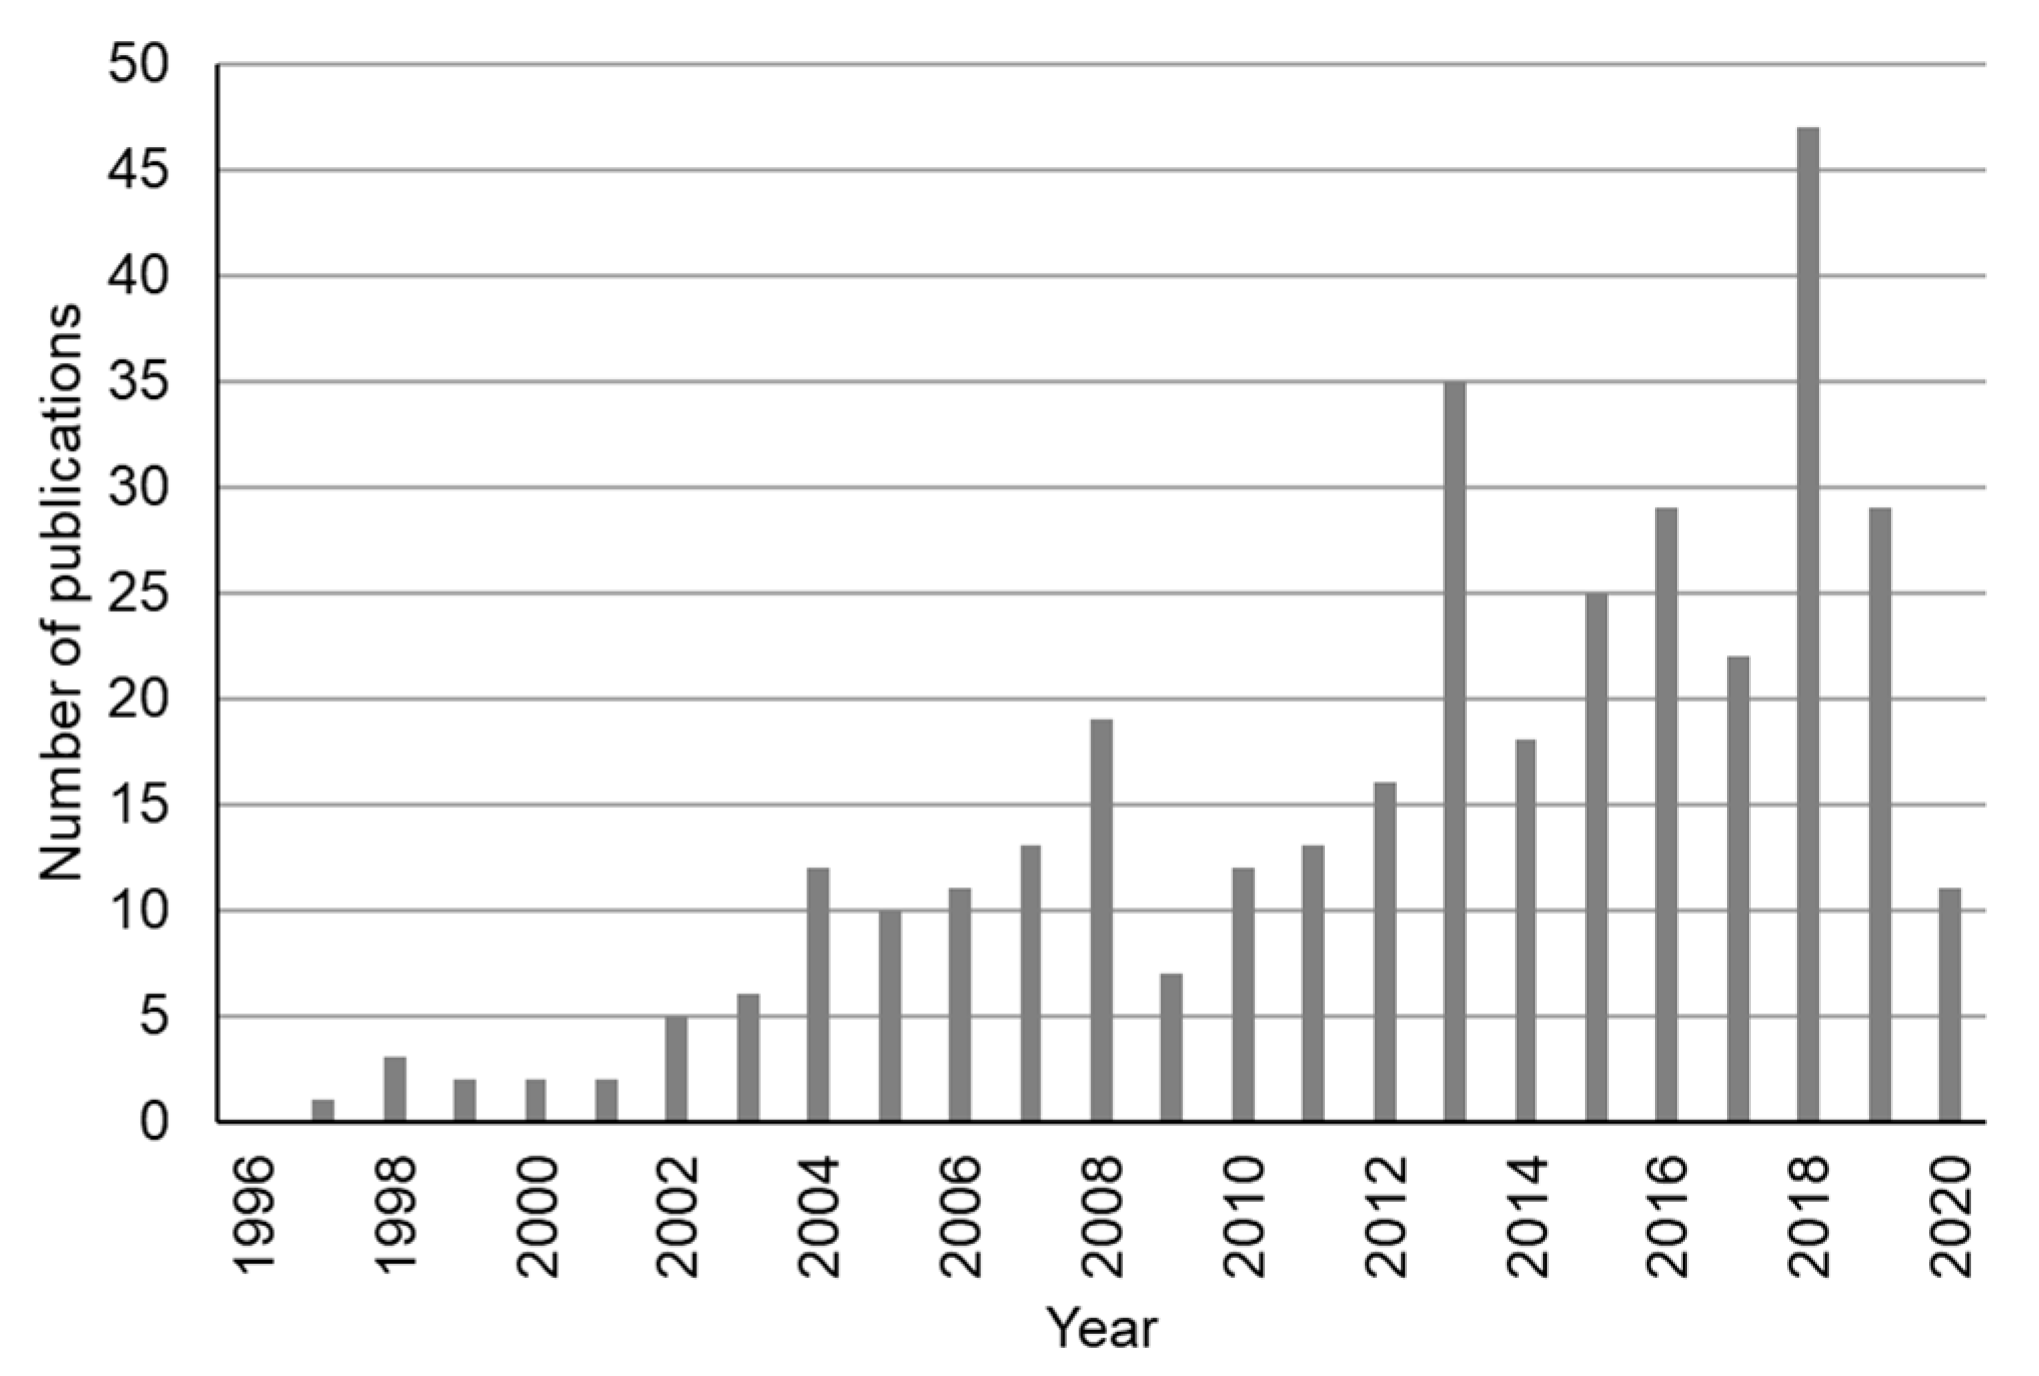
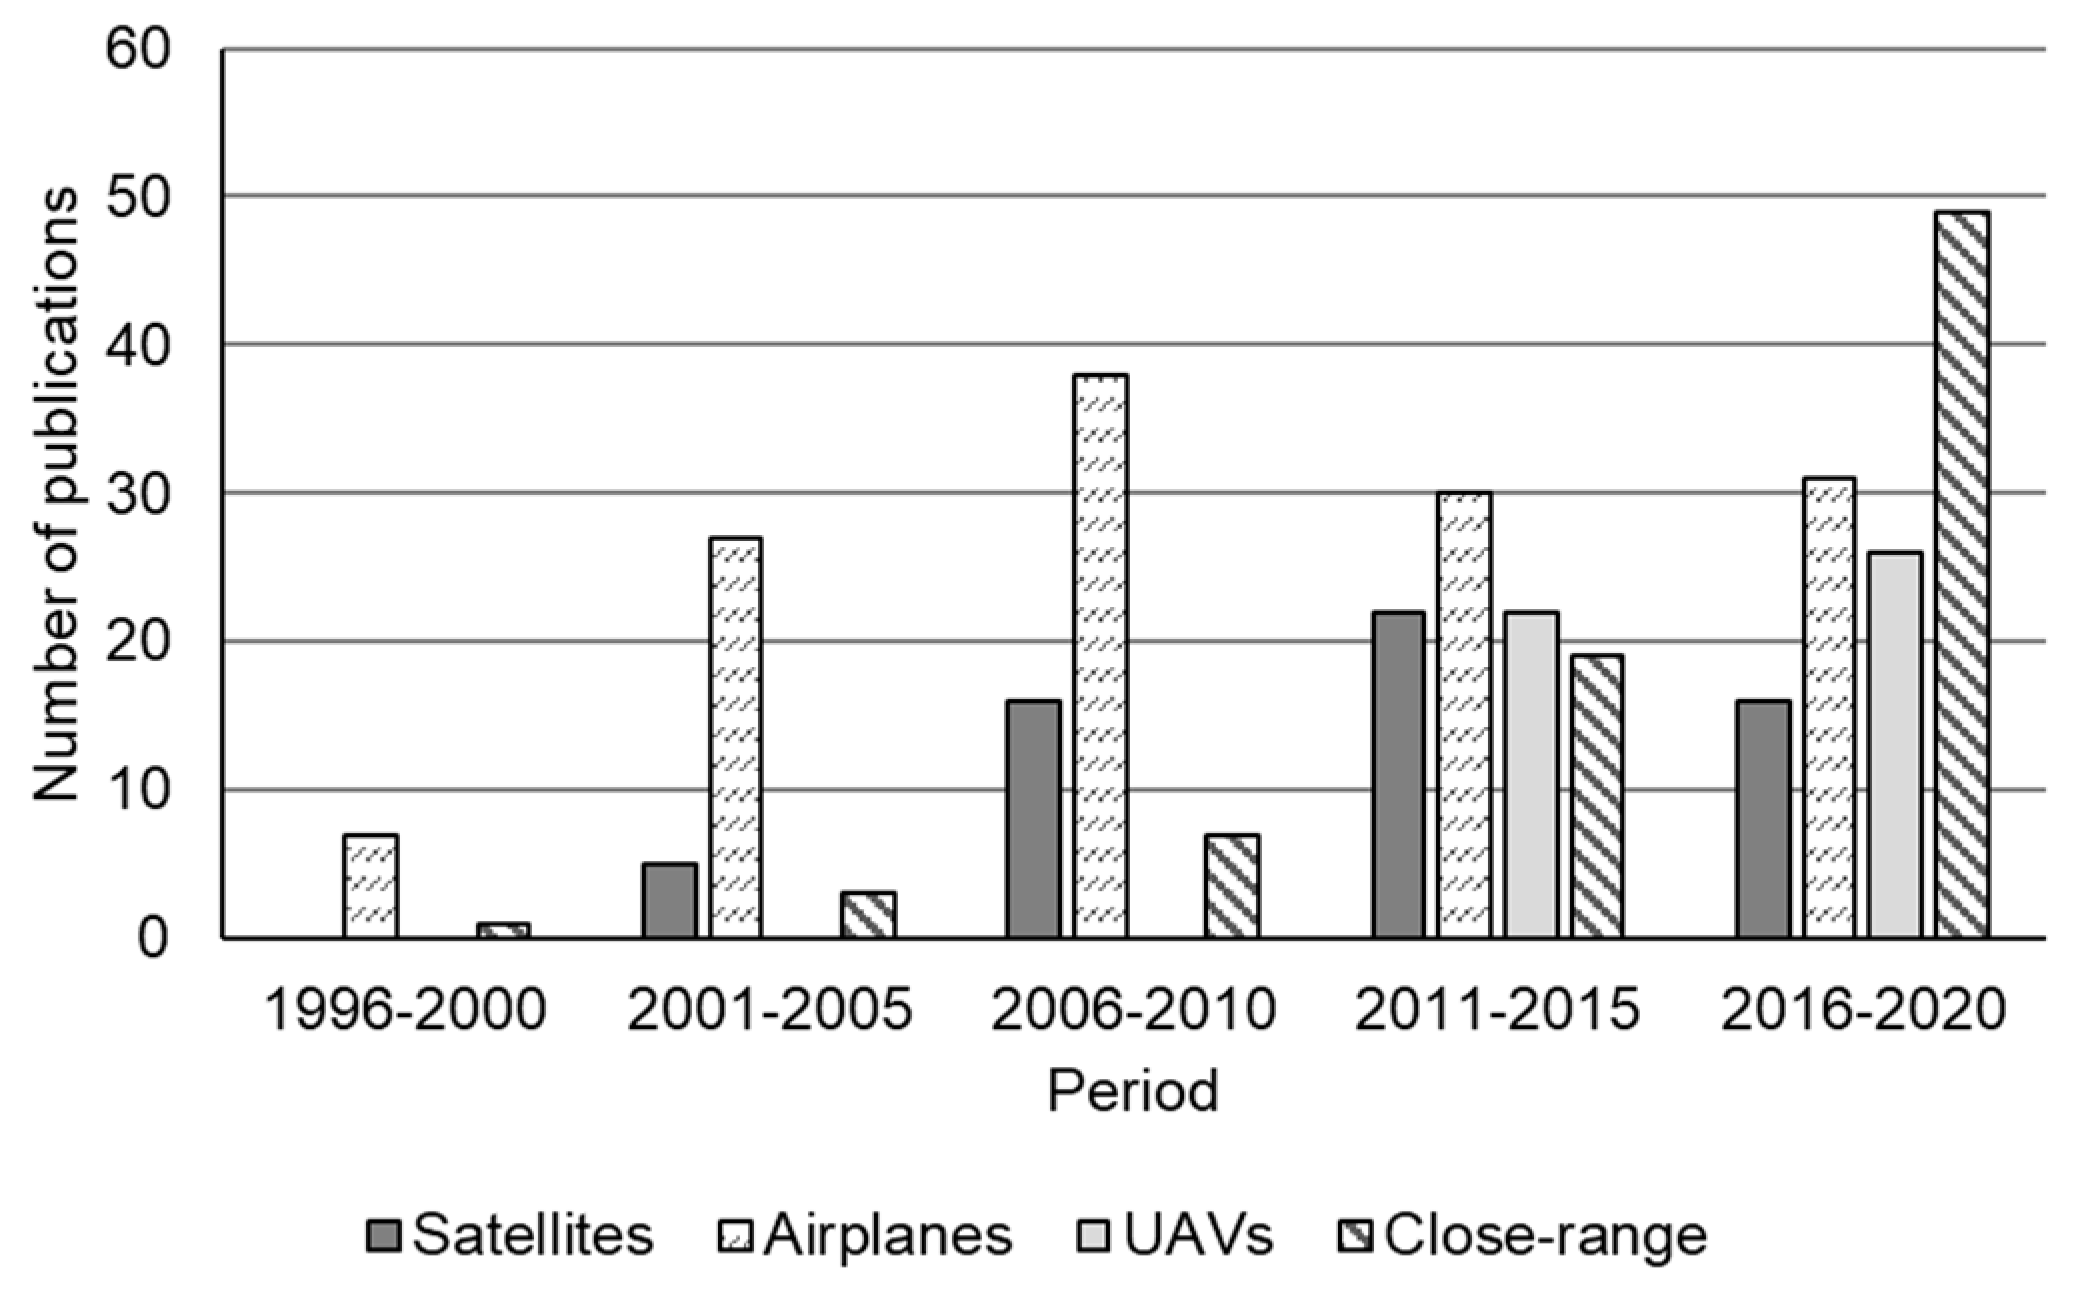
:1. Introduction
2. Hyperspectral Imaging Platforms and Sensors
2.1. Satellite-Based Hyperspectral Imaging
2.2. Airplane-Based Hyperspectral Imaging
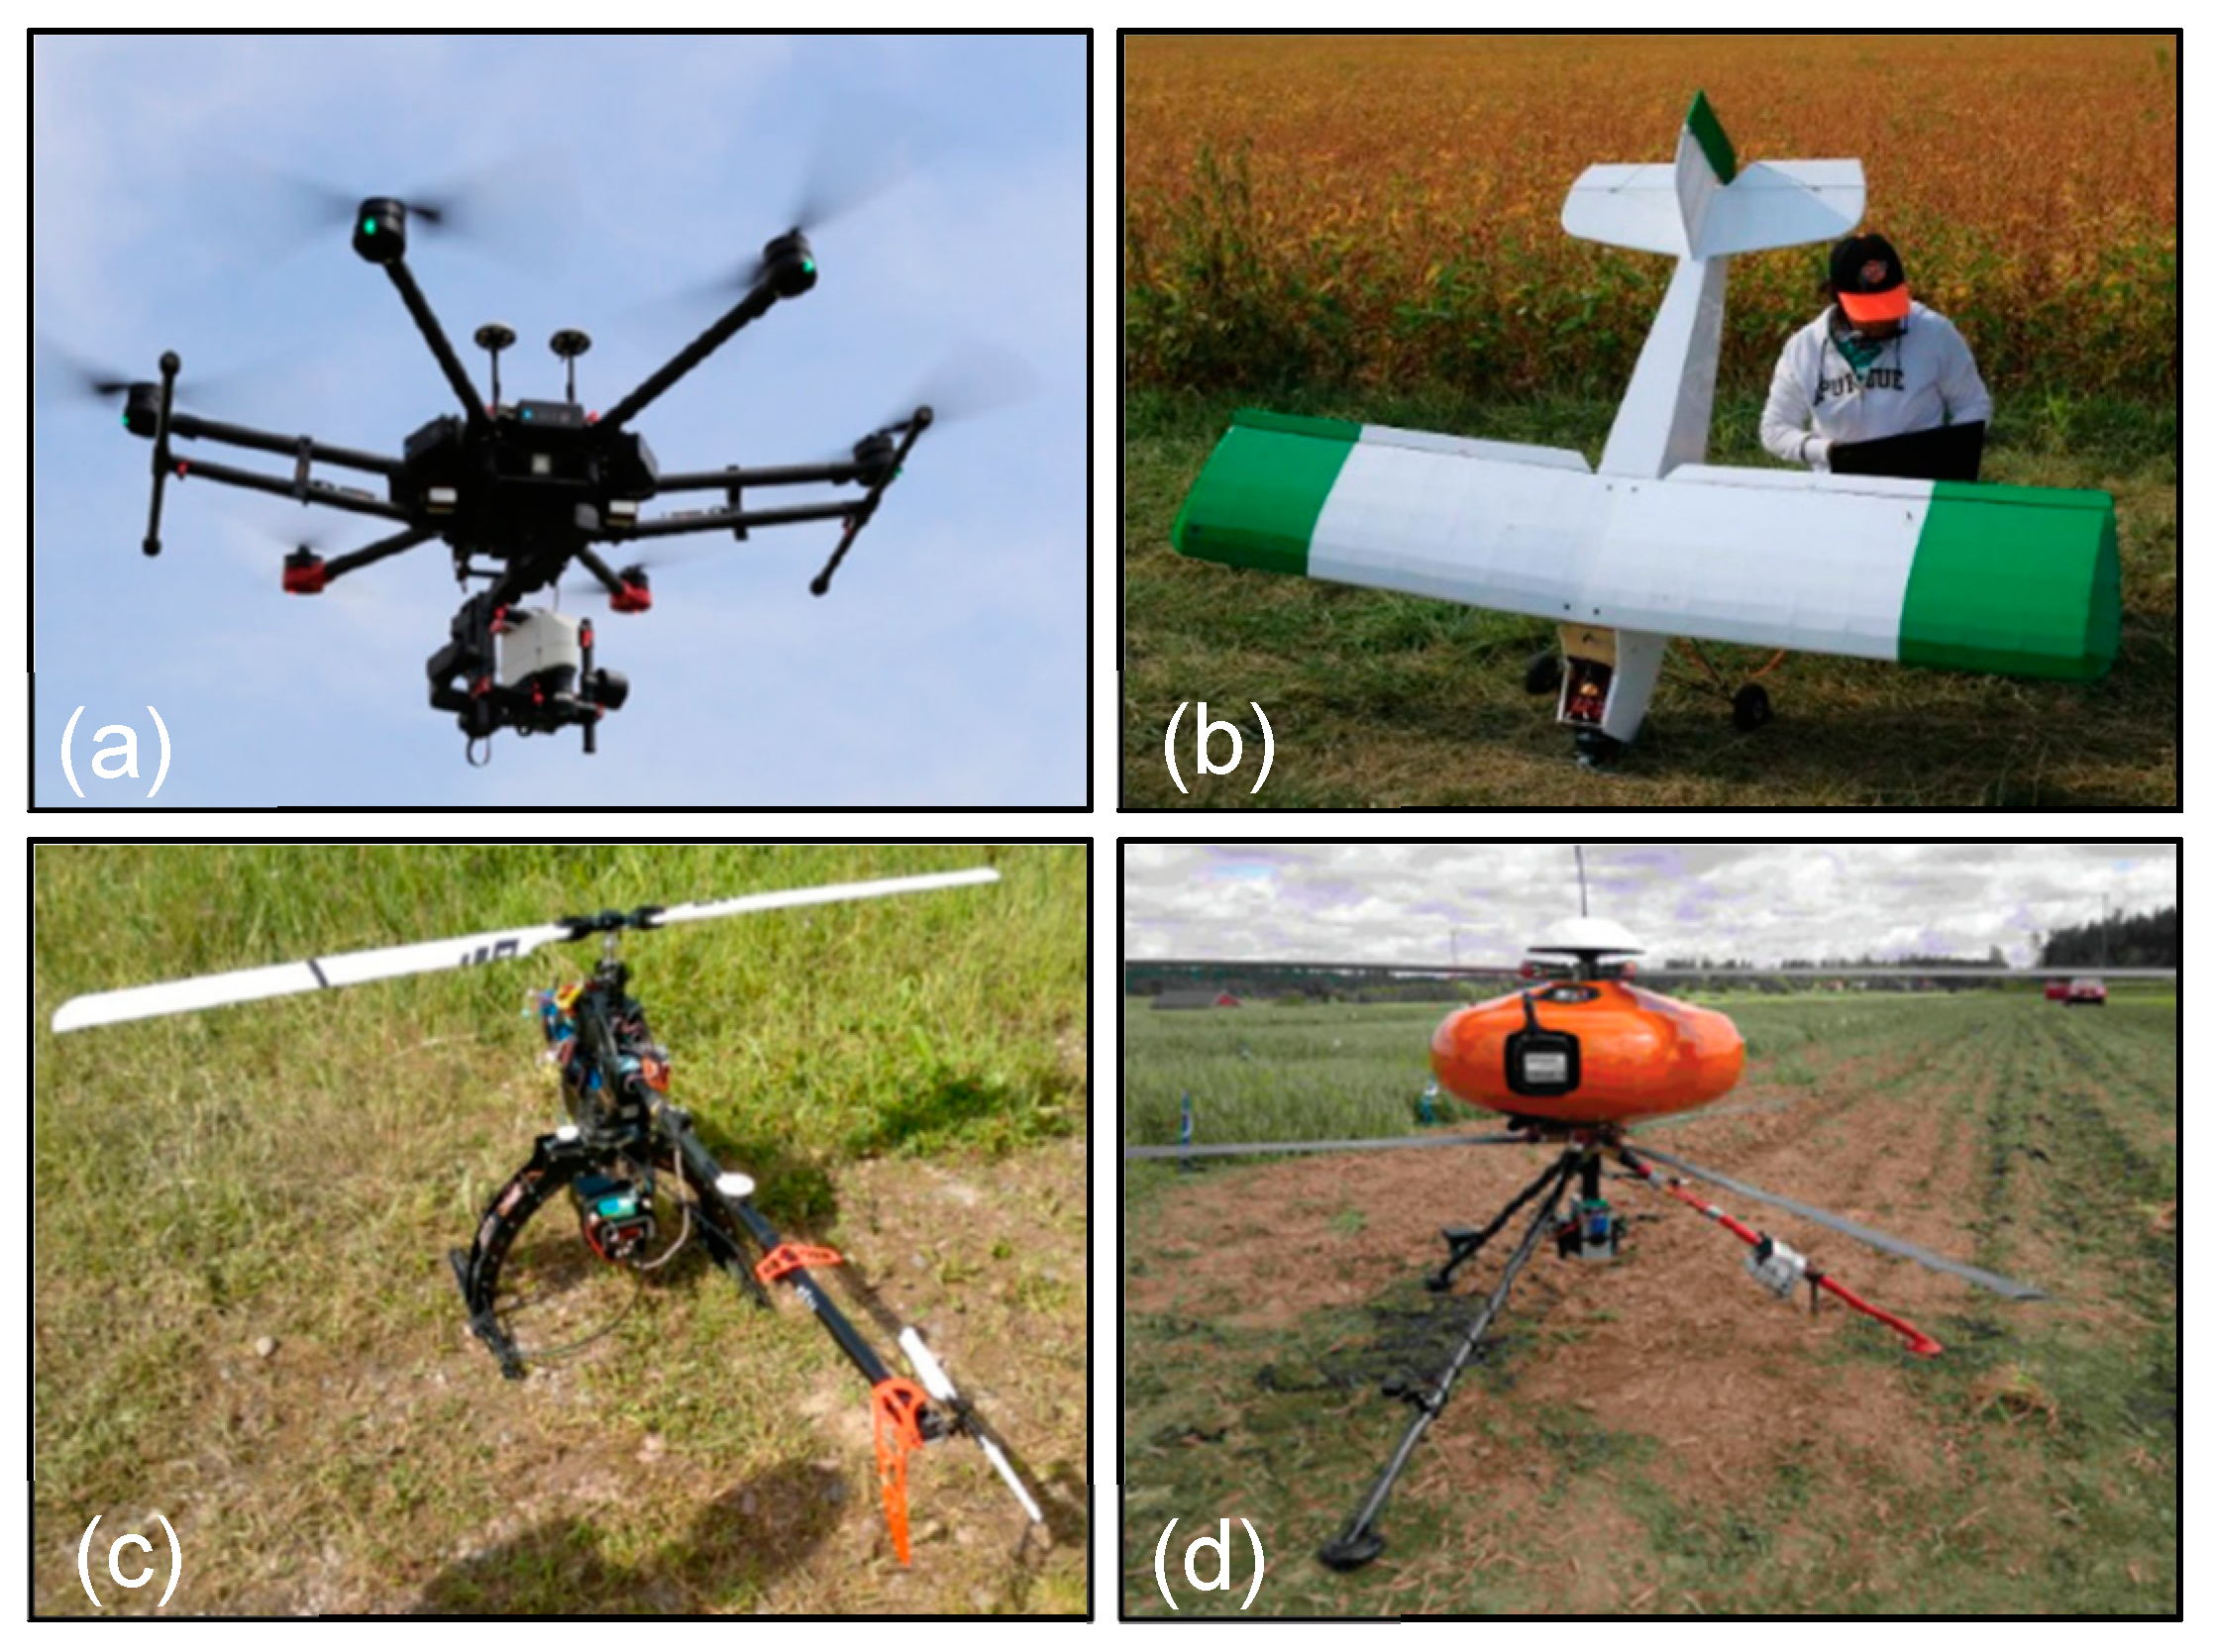
2.3. UAV-Based Hyperspectral Imaging
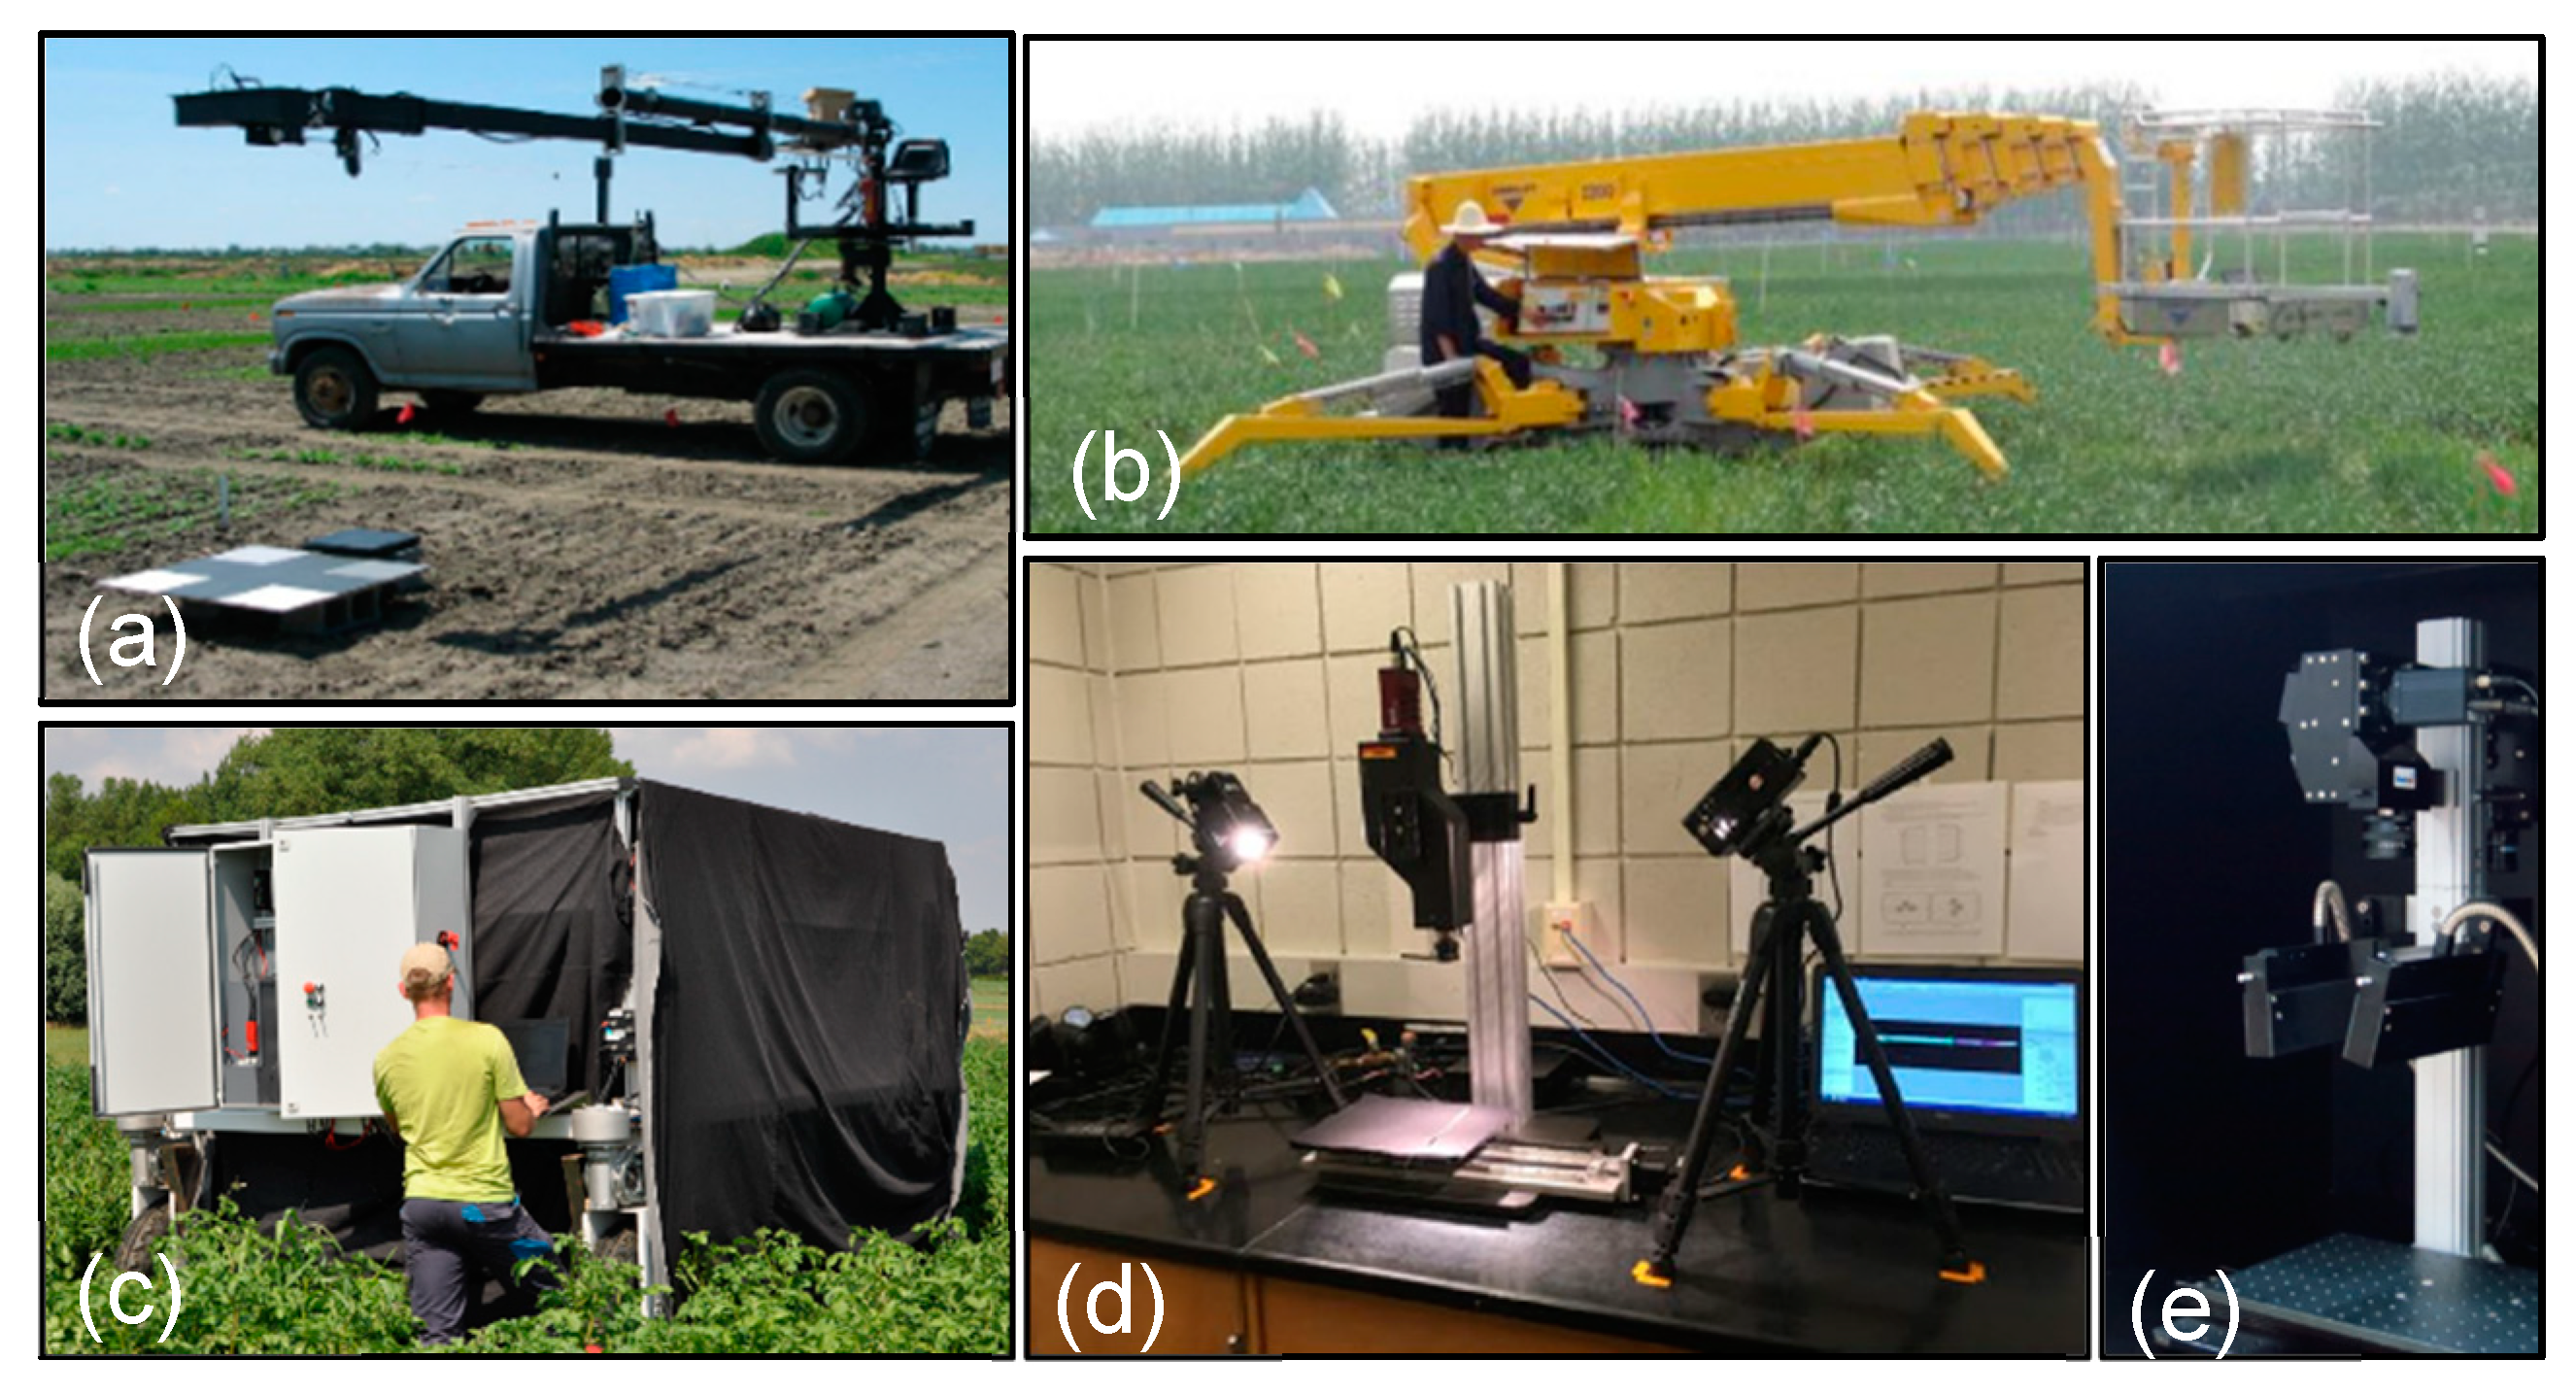
2.4. Close-Range (Ground- or Lab-Based) Hyperspectral Imaging
3. Methods for Processing and Analyzing Hyperspectral Images
3.1. Pre-Processing of Hyperspectral Images
3.2. Empirical Relationships
3.3. Radiative Transfer Modelling
3.4. Machine Learning and Deep Learning
4. Hyperspectral Applications in Agriculture
4.1. Estimation of Crop Biochemical and Biophysical Properties
4.2. Evaluating Crop Nutrient Status
4.3. Classifying Imagery to Identify Crop Types, Growing Stages, Weeds/Invasive Species, and Stress/Disease
4.4. Retrieving Soil Moisture, Fertility, and Other Physical or Chemical Properties
5. Conclusions and Recommendations
Author Contributions
Funding
Conflicts of Interest
Abbreviations
| ALI | Advanced Land Imager |
| APEX | Airborne Prism Experiment |
| AVIS | Airborne Visible Near-Infrared Imaging Spectrometer |
| AVIS | Airborne Visible Near-Infrared Imaging Spectrometer |
| AVIRIS | Airborne Visible/Infrared Imaging Spectrometer |
| ANN | Artificial Neural Networks |
| CAI | Cellulose Absorption Index |
| CAI | Chlorophyll Absorption Integral |
| CARI | Chlorophyll Absorption Ratio Index |
| CASI | Compact Airborne Spectrographic Imager |
| CHRIS | Compact High Resolution Imaging Spectrometer |
| CNN | Convolutional Neural Network |
| DEM | Digital Elevation Model |
| DESIS | Dlr Earth Sensing Imaging Spectrometer |
| DCNI | Double-Peak Canopy Nitrogen Index |
| EnMAP | Environmental Mapping And Analysis Program |
| FAPAR | Fraction Of Absorbed Photosynthetically Active Radiation |
| fCover | Fraction Of Vegetation Cover |
| GCPs | Ground Control Points |
| HSI | Hyper Spectral Imaging |
| HySI | Hyperspectral Imager |
| HICO | Hyperspectral Imager For The Coastal Ocean |
| HISUI | Hyperspectral Imager Suite |
| HyspIRI | Hyperspectral Infrared Imager |
| HyMap | Hyperspectral Mapper |
| h NDVI | Hyperspectral Normalized Difference Vegetation Index |
| PRISMA | Hyperspectral Precursor And Application Mission |
| IMU | Inertial Measurement Unit |
| LAI | Leaf Area Index |
| MTCI | Meris Terrestrial Chlorophyll Index |
| MNF | Minimum Noise Fraction |
| MCARI/MTVI2 | Modified Chlorophyll Absorption Ratio Index/Modified Triangular Vegetation Index 2 |
| MSR | Modified Simple Ratio Index |
| MSAVI | Modified Soil Adjusted Vegetation Index |
| MTVI2 | Modified Triangular Vegetation Index |
| MIVIS | Multispectral Infrared Visible Imaging Spectrometer |
| MSI | Multispectral Instrument |
| MLR | Multi-Variable Regression |
| NDRE | Normalized Difference Red Edge |
| NDTI | Normalized Difference Tillage Index |
| OLI | Operational Land Imager |
| OSAVI | Optimized Soil-Adjusted Vegetation Index |
| PLSR | Partial Least Square Regression |
| PRI | Photochemical Reflectance Index |
| PRESS | Predicted Residual Error Sum Of Squares |
| PCA | Principal Component Analysis |
| PHI | Pushbroom Hyperspectral Imager |
| RTM | Radiative Transfer Modelling |
| RF | Random Forest |
| REP | Red Edge Position |
| SWIR | Shortwave Infrared |
| SR | Simple Ratio |
| SVD | Singular Value Decomposition |
| SOC | Soil Organic Carbon |
| SHALOM | Spaceborne Hyperspectral Applicative Land And Ocean Mission |
| SFOC | Special Flight Operations Certificate |
| SVM | Support Vector Machine Regression |
| TCARI | Transformed Chlorophyll Absorption In Reflectance Index |
| TCI | Triangular Chlorophyll Index |
| TVI | Triangular Vegetation Index |
| UMD | Uniform Feature Design |
| UAV | Unmanned Aerial Vehicle |
References
- Weiss, M.; Jacob, F.; Duveiller, G. Remote sensing for agricultural applications: A meta-review. Remote Sens. Environ. 2020, 236, 111402. [Google Scholar] [CrossRef]
- Liu, J.; Miller, J.R.; Haboudane, D.; Pattey, E.; Nolin, M.C. Variability of seasonal CASI image data products and potential application for management zone delineation for precision agriculture. Can. J. Remote Sens. 2005, 31, 400–411. [Google Scholar] [CrossRef]
- Jensen, J.R. Remote Sensing of the Environment: An Earth Resource Perspective; Prentice Hall: Upper Saddle River, NJ, USA, 2006. [Google Scholar]
- Sahoo, R.N.; Ray, S.S.; Manjunath, K.R. Hyperspectral remote sensing of agriculture. Curr. Sci. 2015, 108, 848–859. [Google Scholar]
- Alonso, F.G.; Soria, S.L.; Gozalo, J.C. Comparing two methodologies for crop area estimation in Spain using Landsat TM images and ground-gathered data. Remote Sens. Environ. 1991, 35, 29–35. [Google Scholar] [CrossRef]
- McNairn, H.; Champagne, C.; Shang, J.; Holmstrom, D.; Reichert, G. Integration of optical and Synthetic Aperture Radar (SAR) imagery for delivering operational annual crop inventories. ISPRS J. Photogramm. 2009, 64, 434–449. [Google Scholar] [CrossRef]
- Shoshany, M.; Goldshleger, N.; Chudnovsky, A. Monitoring of agricultural soil degradation by remote-sensing methods: A review. Int. J. Remote Sens. 2013, 34, 6152–6181. [Google Scholar] [CrossRef]
- Hunt, E.R.; Daughtry, C.S.T. What good are unmanned aircraft systems for agricultural remote sensing and precision agriculture? Int. J. Remote Sens. 2018, 39, 5345–5376. [Google Scholar] [CrossRef] [Green Version]
- Thenkabail, P.S. Biophysical and yield information for precision farming from near-real-time and historical Landsat TM images. Int. J. Remote Sens. 2003, 24, 2879–2904. [Google Scholar] [CrossRef]
- Shang, J.; Liu, J.; Ma, B.; Zhao, T.; Jiao, X.; Geng, X.; Huffman, T.; Kovacs, J.M.; Walters, D. Mapping spatial variability of crop growth conditions using RapidEye data in Northern Ontario, Canada. Remote Sens. Environ. 2015, 168, 113–125. [Google Scholar] [CrossRef]
- Adão, T.; Hruška, J.; Pádua, L.; Bessa, J.; Peres, E.; Morais, R.; Sousa, J. Hyperspectral Imaging: A Review on UAV-Based Sensors, Data Processing and Applications for Agriculture and Forestry. Remote Sens. 2017, 9, 1110. [Google Scholar] [CrossRef] [Green Version]
- Lucieer, A.; Malenovský, Z.; Veness, T.; Wallace, L. HyperUAS-imaging spectroscopy from a multirotor unmanned aircraft system. J. Field Robot. 2014, 31, 571–590. [Google Scholar] [CrossRef] [Green Version]
- Gonzalez-Dugo, V.; Hernandez, P.; Solis, I.; Zarco-Tejada, P. Using High-Resolution Hyperspectral and Thermal Airborne Imagery to Assess Physiological Condition in the Context of Wheat Phenotyping. Remote Sens. 2015, 7, 13586–13605. [Google Scholar] [CrossRef] [Green Version]
- Lee, K.; Cohen, W.B.; Kennedy, R.E.; Maiersperger, T.K.; Gower, S.T. Hyperspectral versus multispectral data for estimating leaf area index in four different biomes. Remote Sens. Environ. 2004, 91, 508–520. [Google Scholar] [CrossRef]
- Mariotto, I.; Thenkabail, P.S.; Huete, A.; Slonecker, E.T.; Platonov, A. Hyperspectral versus multispectral crop-productivity modeling and type discrimination for the HyspIRI mission. Remote Sens. Environ. 2013, 139, 291–305. [Google Scholar] [CrossRef]
- Marshall, M.; Thenkabail, P. Advantage of hyperspectral EO-1 Hyperion over multispectral IKONOS, GeoEye-1, WorldView-2, Landsat ETM+, and MODIS vegetation indices in crop biomass estimation. ISPRS J. Photogramm. 2015, 108, 205–218. [Google Scholar] [CrossRef] [Green Version]
- Sun, J.; Yang, J.; Shi, S.; Chen, B.; Du, L.; Gong, W.; Song, S. Estimating Rice Leaf Nitrogen Concentration: Influence of Regression Algorithms Based on Passive and Active Leaf Reflectance. Remote Sens. 2017, 9, 951. [Google Scholar] [CrossRef] [Green Version]
- Darvishzadeh, R.; Matkan, A.A.; Ahangar, A.D. Inversion of a radiative transfer model for estimation of rice canopy chlorophyll content using a lookup-table approach. IEEE J.-STARS 2012, 5, 1222–1230. [Google Scholar] [CrossRef] [Green Version]
- Hruska, R.; Mitchell, J.; Anderson, M.; Glenn, N.F. Radiometric and geometric analysis of hyperspectral imagery acquired from an unmanned aerial vehicle. Remote Sens. 2012, 4, 2736–2752. [Google Scholar] [CrossRef] [Green Version]
- Transon, J.; d’Andrimont, R.; Maugnard, A.; Defourny, P. Survey of Hyperspectral Earth Observation Applications from Space in the Sentinel-2 Context. Remote Sens. 2018, 10, 157. [Google Scholar] [CrossRef] [Green Version]
- Lodhi, V.; Chakravarty, D.; Mitra, P. Hyperspectral Imaging System: Development Aspects and Recent Trends. Sens. Imaging 2019, 20, 1–24. [Google Scholar] [CrossRef]
- Hatfield, J.L.; Prueger, J.H. Value of Using Different Vegetative Indices to Quantify Agricultural Crop Characteristics at Different Growth Stages under Varying Management Practices. Remote Sens. 2010, 2, 562–578. [Google Scholar] [CrossRef] [Green Version]
- Zhang, H.; Lan, Y.; Suh, C.P.C.; Westbrook, J.; Clint Hoffmann, W.; Yang, C.; Huang, Y. Fusion of remotely sensed data from airborne and ground-based sensors to enhance detection of cotton plants. Comput. Electron. Agric. 2013, 93, 55–59. [Google Scholar] [CrossRef]
- Mahajan, G.R.; Pandey, R.N.; Sahoo, R.N.; Gupta, V.K.; Datta, S.C.; Kumar, D. Monitoring nitrogen, phosphorus and sulphur in hybrid rice (Oryza sativa L.) using hyperspectral remote sensing. Precis. Agric. 2017, 18, 736–761. [Google Scholar] [CrossRef]
- Skauli, T.; Goa, P.E.; Baarstad, I.; Loke, T. A compact combined hyperspectral and polarimetric imager. In Proceedings of the Society of Photo-Optical Instrumentation Engineers, Stockholm, Sweden, 5 October 2006; Driggers, R.G., Huckridge, D.A., Eds.; SPIE-INT SOC Optical Engineering: Bellingham, WA, USA, 2016; Volume 6395, pp. 44–51. [Google Scholar]
- Zarco-Tejada, P.J.; Suarez, L.; Gonzalez-Dugo, V. Spatial resolution effects on chlorophyll fluorescence retrieval in a heterogeneous canopy using hyperspectral imagery and radiative transfer simulation. IEEE Geosci. Remote Soc. 2013, 10, 937–941. [Google Scholar] [CrossRef]
- Lu, B.; He, Y.; Dao, P.D. Comparing the Performance of Multispectral and Hyperspectral Images for Estimating Vegetation Properties. IEEE J. STARS 2019, 12, 1784–1797. [Google Scholar] [CrossRef]
- ISS Utilization: MUSES-DESIS (Multi-User System for Earth Sensing) with DESIS instrument. Available online: https://directory.eoportal.org/web/eoportal/satellite-missions/content/-/article/iss-muses (accessed on 3 August 2020).
- PRISMA (Hyperspectral Precursor and Application Mission). Available online: https://directory.eoportal.org/web/eoportal/satellite-missions/p/prisma-hyperspectral#launch (accessed on 3 August 2020).
- Satellite Missions Database. Available online: https://directory.eoportal.org/web/eoportal/satellite-missions (accessed on 10 November 2019).
- EnMAP (Environmental Monitoring and Analysis Program). Available online: https://directory.eoportal.org/web/eoportal/satellite-missions/e/enmap (accessed on 3 August 2020).
- Mitchell, J.J.; Glenn, N.F.; Anderson, M.O.; Hruska, R.C.; Halford, A.; Baun, C.; Nydegger, N. Unmanned Aerial Vehicle (UAV) hyperspectral remote sensing for dryland vegetation monitoring. In Proceedings of the 2012 4th Workshop on Hyperspectral Image and Signal Processing: Evolution in Remote Sensing (WHISPERS), Shanghai, China, 4–7 June 2012; pp. 1–10. [Google Scholar]
- Zarco-Tejada, P.J.; Guillén-Climent, M.L.; Hernández-Clemente, R.; Catalina, A.; González, M.R.; Martín, P. Estimating leaf carotenoid content in vineyards using high resolution hyperspectral imagery acquired from an unmanned aerial vehicle (UAV). Agric. Forest Meteorol. 2013, 171, 281–294. [Google Scholar] [CrossRef] [Green Version]
- Copenhaver, K.; Hellmich, R.; Hunt, T.; Glaser, J.; Sappington, T.; Calvin, D.; Carroll, M.; Fridgen, J. Use of spectral vegetation indices derived from airborne hyperspectral imagery for detection of European corn borer infestation in Iowa corn plots. J. Econ. Entomol. 2008, 101, 1614–1623. [Google Scholar]
- Ryu, C.; Suguri, M.; Umeda, M. Multivariate analysis of nitrogen content for rice at the heading stage using reflectance of airborne hyperspectral remote sensing. Field Crops Res. 2011, 122, 214–224. [Google Scholar] [CrossRef] [Green Version]
- Lu, B.; He, Y. Evaluating Empirical Regression, Machine Learning, and Radiative Transfer Modelling for Estimating Vegetation Chlorophyll Content Using Bi-Seasonal Hyperspectral Images. Remote Sens. 2019, 11, 1979. [Google Scholar] [CrossRef] [Green Version]
- Yu, F.; Xu, T.; Du, W.; Ma, H.; Zhang, G.; Chen, C. Radiative transfer models (RTMs) for field phenotyping inversion of rice based on UAV hyperspectral remote sensing. Int. J. Agric. Biol. Eng. 2017, 10, 150–157. [Google Scholar]
- Teke, M.; Deveci, H.S.; Haliloglu, O.; Gurbuz, S.Z.; Sakarya, U. A short survey of hyperspectral remote sensing applications in agriculture. In Proceedings of the 2013 6th International Conference on Recent Advances in Space Technologies (RAST), Istanbul, Turkey, 12–14 June 2013; IEEE: New York, NY, USA, 2013; pp. 171–176. [Google Scholar]
- Dale, L.M.; Thewis, A.; Boudry, C.; Rotar, I.; Dardenne, P.; Baeten, V.; Pierna, J.A.F. Hyperspectral Imaging Applications in Agriculture and Agro-Food Product Quality and Safety Control: A Review. Appl. Spectrosc. Rev. 2013, 48, 142–159. [Google Scholar] [CrossRef]
- Tiangong/Shenzhou: China’s Human Spaceflight Program/Tianzhou Cargo Spaceship. Available online: https://directory.eoportal.org/web/eoportal/satellite-missions/t/tiangong (accessed on 3 August 2020).
- Apan, A.; Held, A.; Phinn, S.; Markley, J. Detecting sugarcane ‘orange rust’ disease using EO-1 Hyperion hyperspectral imagery. Int. J. Remote Sens. 2004, 25, 489–498. [Google Scholar] [CrossRef] [Green Version]
- Dutta, S.; Bhattacharya, B.K.; Rajak, D.R.; Chattopadhayay, C.; Patel, N.K.; Parihar, J.S. Disease detection in mustard crop using eo-1 hyperion satellite data. J. Indian Soc. Remote 2006, 34, 325–330. [Google Scholar] [CrossRef]
- Moharana, S.; Dutta, S. Spatial variability of chlorophyll and nitrogen content of rice from hyperspectral imagery. ISPRS J. Photogramm. 2016, 122, 17–29. [Google Scholar] [CrossRef]
- Thenkabail, P.S.; Mariotto, I.; Gumma, M.K.; Middleton, E.M.; Landis, D.R.; Huemmrich, K.F. Selection of Hyperspectral Narrowbands (HNBs) and Composition of Hyperspectral Twoband Vegetation Indices (HVIs) for Biophysical Characterization and Discrimination of Crop Types Using Field Reflectance and Hyperion/EO-1 Data. IEEE J. STARS 2013, 6, 427–439. [Google Scholar] [CrossRef] [Green Version]
- Wu, C.; Han, X.; Niu, Z.; Dong, J. An evaluation of EO-1 hyperspectral Hyperion data for chlorophyll content and leaf area index estimation. Int. J. Remote Sens. 2010, 31, 1079–1086. [Google Scholar] [CrossRef]
- Bannari, A.; Staenz, K.; Champagne, C.; Khurshid, K. Spatial Variability Mapping of Crop Residue Using Hyperion (EO-1) Hyperspectral Data. Remote Sens. 2015, 7, 8107–8127. [Google Scholar] [CrossRef] [Green Version]
- Galloza, M.S.; Crawford, M. Exploiting multisensor spectral data to improve crop residue cover estimates for management of agricultural water quality. In Proceedings of the IEEE Geoscience and Remote Sensing Society Symposium, Vancouver, BC, Canada, 24–29 July 2011; IEEE: New York, NY, USA, 2011; pp. 3668–3671. [Google Scholar]
- Camacho Velasco, A.; Vargas García, C.A.; Arguello Fuentes, H. A comparative study of target detection algorithms in hyperspectral imagery applied to agricultural crops in Colombia. Revista Tecnura 2016, 20, 86–99. [Google Scholar] [CrossRef] [Green Version]
- Gomez, C.; Rossel, R.A.V.; McBratney, A.B. Soil organic carbon prediction by hyperspectral remote sensing and field vis-NIR spectroscopy: An Australian case study. Geoderma 2008, 146, 403–411. [Google Scholar] [CrossRef]
- Zhang, T.; Li, L.; Zheng, B. Estimation of agricultural soil properties with imaging and laboratory spectroscopy. J. Appl. Remote Sens. 2013, 7, 73587. [Google Scholar] [CrossRef]
- Bostan, S.; Ortak, M.A.; Tuna, C.; Akoguz, A.; Sertel, E.; Ustundag, B.B. Comparison of classification accuracy of co-located hyperspectral & multispectral images for agricultural purposes. In Proceedings of the 2016 Fifth International Conference on Agro-Geoinformatics (Agro-Geoinformatics), Tianjin, China, 18–20 July 2016; IEEE: New York, NY, USA, 2016; pp. 1–4. [Google Scholar]
- Lodhi, V.; Chakravarty, D.; Mitra, P. Hyperspectral Imaging for Earth Observation: Platforms and Instruments. J. Indian Inst. Sci. 2018, 98, 429–443. [Google Scholar] [CrossRef]
- Aasen, H.; Bolten, A. Multi-temporal high-resolution imaging spectroscopy with hyperspectral 2D imagers - From theory to application. Remote Sens. Environ. 2018, 205, 374–389. [Google Scholar] [CrossRef]
- Jia, X.; Li, S.; Ke, S.; Hu, B. Overview of spaceborne hyperspectral imagers and the research progress in bathymetric maps. In Proceedings of the Second Target Recognition and Artificial Intelligence Summit Forum. International Society for Optics and Photonics, Shenyang, China, 28–30 August 2019; SPIE-INT SOC Optical Engineering: Bellingham, WA, USA, 2020. [Google Scholar]
- Headwall Hyperspectral Sensors. Available online: https://www.headwallphotonics.com/hyperspectral-sensors (accessed on 8 May 2020).
- Pullanagari, R.R.; Kereszturi, G.; Yule, I. Integrating Airborne Hyperspectral, Topographic, and Soil Data for Estimating Pasture Quality Using Recursive Feature Elimination with Random Forest Regression. Remote Sens. 2018, 10, 1117. [Google Scholar] [CrossRef] [Green Version]
- Verger, A.; Baret, F.; Camacho, F. Optimal modalities for radiative transfer-neural network estimation of canopy biophysical characteristics: Evaluation over an agricultural area with CHRIS/PROBA observations. Remote Sens. Environ. 2011, 115, 415–426. [Google Scholar] [CrossRef]
- Antony, R.; Ray, S.S.; Panigrahy, S. Discrimination of wheat crop stage using CHRIS/PROBA multi-angle narrowband data. Remote Sens. Lett. 2011, 2, 71–80. [Google Scholar] [CrossRef]
- Casa, R.; Castaldi, F.; Pascucci, S.; Palombo, A.; Pignatti, S. A comparison of sensor resolution and calibration strategies for soil texture estimation from hyperspectral remote sensing. Geoderma 2013, 197, 17–26. [Google Scholar] [CrossRef]
- Kumar, A.S.K.; Samudraiah, D.R.M. Hyperspectral Imager Onboard Indian Mini Satellite-1. In Optical Payloads for Space Missions; Qian, S., Ed.; John Wiley & Sons: Hoboken, NJ, USA, 2015; Volume 6, pp. 141–160. [Google Scholar]
- IMS-1 (Indian Microsatellite-1). Available online: https://directory.eoportal.org/web/eoportal/satellite-missions/i/ims-1 (accessed on 31 March 2020).
- Raval, M.S. Hyperspectral Imaging: A Paradigm in Remote Sensing. CSI Commun. 2014, 7, 7–9. [Google Scholar]
- Khobragade, A.N.; Raghuwanshi, M.M. Contextual Soft Classification Approaches for Crops Identification Using Multi-sensory Remote Sensing Data: Machine Learning Perspective for Satellite Images. In Artificial Intelligence Perspectives and Applications; Springer: Cham, Switzerland, 2015; pp. 333–346. [Google Scholar]
- Hyperspectral Imager for the Coastal Ocean. Available online: http://hico.coas.oregonstate.edu/ (accessed on 1 April 2020).
- Krutz, D.; Müller, R.; Knodt, U.; Günther, B.; Walter, I.; Sebastian, I.; Säuberlich, T.; Reulke, R.; Carmona, E.; Eckardt, A.; et al. The Instrument Design of the DLR Earth SensingImaging Spectrometer (DESIS). Sensors 2019, 19, 1622. [Google Scholar] [CrossRef] [Green Version]
- ISS Utilization: HISUI (Hyperspectral Imager Suite). Available online: https://eoportal.org/web/eoportal/satellite-missions/content/-/article/iss-utilization-hisui-hyperspectral-imager-suite-#launch (accessed on 1 April 2020).
- Pignatti, S.; Palombo, A.; Pascucci, S.; Romano, F.; Santini, F.; Simoniello, T.; Umberto, A.; Vincenzo, C.; Acito, N.; Diani, M.; et al. The PRISMA hyperspectral mission: Science activities and opportunities for agriculture and land monitoring. In Proceedings of the 2013 IEEE International Geoscience and Remote Sensing Symposium-IGARSS, Melbourne, VIC, Australia, 21–26 July 2013; pp. 4558–4561. [Google Scholar]
- EnMap Hyperspectral Imager. Available online: http://www.enmap.org/index.html (accessed on 1 December 2019).
- Feingersh, T.; Ben-Dor, E. SHALOM—A Commercial Hyperspectral Space Mission. In Optical Payloads for Space Missions; Qian, S.E., Ed.; John Wiley & Sons, Ltd.: Hoboken, NJ, USA, 2015; pp. 247–263. [Google Scholar]
- Pandey, P.C.; Manevski, K.; Srivastava, P.K.; Petropoulos, G.P. The Use of Hyperspectral Earth Observation Data for Land Use/Cover Classification: Present Status, Challenges, and Future Outlook. In Hyperspectral Remote Sensing of Vegetation, 2nd ed.; Thenkabail, P.S., Lyon, J.G., Huete, A., Eds.; CRC Press: Boca Raton, FL, USA, 2018; Volume 4. [Google Scholar]
- HyspIRI Mission Study. Available online: https://hyspiri.jpl.nasa.gov/ (accessed on 1 August 2020).
- Malec, S.; Rogge, D.; Heiden, U.; Sanchez-Azofeifa, A.; Bachmann, M.; Wegmann, M. Capability of Spaceborne Hyperspectral EnMAP Mission for Mapping Fractional Cover for Soil Erosion Modeling. Remote Sens. 2015, 7, 11776–11800. [Google Scholar] [CrossRef] [Green Version]
- Siegmann, B.; Jarmer, T.; Beyer, F.; Ehlers, M. The Potential of Pan-Sharpened EnMAP Data for the Assessment of Wheat LAI. Remote Sens. 2015, 7, 12737–12762. [Google Scholar] [CrossRef] [Green Version]
- Locherer, M.; Hank, T.; Danner, M.; Mauser, W. Retrieval of Seasonal Leaf Area Index from Simulated EnMAP Data through Optimized LUT-Based Inversion of the PROSAIL Model. Remote Sens. 2015, 7, 10321–10346. [Google Scholar] [CrossRef] [Green Version]
- Bachmann, M.; Makarau, A.; Segl, K.; Richter, R. Estimating the Influence of Spectral and Radiometric Calibration Uncertainties on EnMAP Data Products—Examples for Ground Reflectance Retrieval and Vegetation Indices. Remote Sens. 2015, 7, 10689–10714. [Google Scholar] [CrossRef] [Green Version]
- Castaldi, F.; Palombo, A.; Santini, F.; Pascucci, S.; Pignatti, S.; Casa, R. Evaluation of the potential of the current and forthcoming multispectral and hyperspectral imagers to estimate soil texture and organic carbon. Remote Sens. Environ. 2016, 179, 54–65. [Google Scholar] [CrossRef]
- Castaldi, F.; Palombo, A.; Pascucci, S.; Pignatti, S.; Santini, F.; Casa, R. Reducing the Influence of Soil Moisture on the Estimation of Clay from Hyperspectral Data: A Case Study Using Simulated PRISMA Data. Remote Sens. 2015, 7, 15561–15582. [Google Scholar] [CrossRef] [Green Version]
- Ghasrodashti, E.; Karami, A.; Heylen, R.; Scheunders, P. Spatial Resolution Enhancement of Hyperspectral Images Using Spectral Unmixing and Bayesian Sparse Representation. Remote Sens. 2017, 9, 541. [Google Scholar] [CrossRef] [Green Version]
- Yang, J.; Li, Y.; Chan, J.; Shen, Q. Image Fusion for Spatial Enhancement of Hyperspectral Image via Pixel Group Based Non-Local Sparse Representation. Remote Sens. 2017, 9, 53. [Google Scholar] [CrossRef] [Green Version]
- Zhao, Y.; Yang, J.; Chan, J.C. Hyperspectral Imagery Super-Resolution by Spatial-Spectral Joint Nonlocal Similarity. IEEE J. STARS 2014, 7, 2671–2679. [Google Scholar] [CrossRef]
- Loncan, L.; Almeida, L.B.; Bioucas-Dias, J.M.; Briottet, X.; Chanussot, J.; Dobigeon, N.; Fabre, S.; Liao, W.; Licciardi, G.A.; Simões, M.; et al. Hyperspectral pansharpening: A review. IEEE Geosci. Remote Sens. Mag. 2015, 3, 27–46. [Google Scholar] [CrossRef] [Green Version]
- Asner, G.P.; Heidebrecht, K.B. Imaging spectroscopy for desertification studies: Comparing aviris and eo-1 hyperion in argentina drylands. IEEE Trans. Geosci. Remote 2003, 41, 1283–1296. [Google Scholar] [CrossRef]
- Weng, Y.; Gong, P.; Zhu, Z. A Spectral Index for Estimating Soil Salinity in the Yellow River Delta Region of China Using EO-1 Hyperion Data. Pedosphere 2010, 20, 378–388. [Google Scholar] [CrossRef]
- Mulla, D.J. Twenty five years of remote sensing in precision agriculture: Key advances and remaining knowledge gaps. Biosyst. Eng. 2013, 114, 358–371. [Google Scholar] [CrossRef]
- Jacquemoud, S.; Baret, F.; Andrieu, B.; Danson, F.M.; Jaggard, K. Extraction of vegetation biophysical parameters by inversion of the PROSPECT + SAIL models on sugar beet canopy reflectance data. Application to TM and AVIRIS sensors. Remote Sens. Environ. 1995, 52, 163–172. [Google Scholar] [CrossRef]
- Gat, N.; Erives, H.; Fitzgerald, G.J.; Kaffka, S.R.; Maas, S.J. Estimating sugar beet yield using AVIRIS-derived indices. In Summaries of the 9th JPL Airborne Earth Science Workshop. Unpaginated CD; Jet Propulsion Laboratory: Pasadena, CA, USA, 2000. [Google Scholar]
- Estep, L.; Terrie, G.; Davis, B. Crop stress detection using AVIRIS hyperspectral imagery and artificial neural networks. Int. J. Remote Sens. 2004, 25, 4999–5004. [Google Scholar] [CrossRef]
- Cheng, Y.; Ustin, S.L.; Riano, D.; Vanderbilt, V.C. Water content estimation from hyperspectral images and MODIS indexes in Southeastern Arizona. Remote Sens. Environ. 2008, 112, 363–374. [Google Scholar] [CrossRef]
- Palacios-Orueta, A.; Ustin, S.L. Remote Sensing of Soil Properties in the Santa Monica Mountains I. Spectral Analysis. Remote Sens. Environ. 1998, 65, 170–183. [Google Scholar] [CrossRef]
- Gat, N.; Erives, H.; Maas, S.J.; Fitzgerald, G.J. Application of low altitude AVIRIS imagery of agricultural fields in the San Joaquin Valley, CA, to precision farming. In The 8th JPL Airborne Earth Science Workshop; Academia: Pasadena, CA, USA, 1999; pp. 145–150. Available online: https://www.researchgate.net/publication/2434575_Application_Of_Low_Altitude_Aviris_Imagery_Of_Agricultural_Fields_In_The_San_Joaquin_Valley_Ca_To_Precision_Farming (accessed on 11 July 2020.).
- Nigam, R.; Tripathy, R.; Dutta, S.; Bhagia, N.; Nagori, R.; Chandrasekar, K.; Kot, R.; Bhattacharya, B.K.; Ustin, S. Crop type discrimination and health assessment using hyperspectral imaging. Curr. Sci. 2019, 116, 1108–1123. [Google Scholar] [CrossRef]
- Shivers, S.W.; Roberts, D.A.; McFadden, J.P. Using paired thermal and hyperspectral aerial imagery to quantify land surface temperature variability and assess crop stress within California orchards. Remote Sens. Environ. 2019, 222, 215–231. [Google Scholar] [CrossRef]
- Ran, Q.; Li, W.; Du, Q.; Yang, C. Hyperspectral image classification for mapping agricultural tillage practices. J. Appl. Remote Sens. 2015, 9, 97298. [Google Scholar] [CrossRef]
- Shivers, S.W.; Roberts, D.A.; McFadden, J.P.; Tague, C. Using Imaging Spectrometry to Study Changes in Crop Area in California’s Central Valley during Drought. Remote Sens. 2018, 10, 1556. [Google Scholar] [CrossRef] [Green Version]
- Haboudane, D.; Miller, J.R.; Tremblay, N.; Zarco-Tejada, P.J.; Dextraze, L. Integrated narrow-band vegetation indices for prediction of crop chlorophyll content for application to precision agriculture. Remote Sens. Environ. 2002, 81, 416–426. [Google Scholar] [CrossRef]
- Liu, J.; Miller, J.R.; Haboudane, D.; Pattey, E.; Hochheim, K. Crop fraction estimation from casi hyperspectral data using linear spectral unmixing and vegetation indices. Can. J. Remote Sens. 2008, 34, S124–S138. [Google Scholar] [CrossRef] [Green Version]
- Goel, P.K.; Prasher, S.O.; Landry, J.; Patel, R.M.; Viau, A.A. Hyperspectral image classification to detect weed infestations and nitrogen status in corn. Trans. ASAE 2003, 46, 539. [Google Scholar]
- Richter, K.; Hank, T.; Mauser, W. Preparatory analyses and development of algorithms for agricultural applications in the context of the EnMAP hyperspectral mission. In Proceedings of the Remote Sensing for Agriculture, Ecosystems, and Hydrology XII. International Society for Optics and Photonics, Toulouse, France, 22 October 2010; pp. 782407–7824011. [Google Scholar]
- Jarmer, T. Spectroscopy and hyperspectral imagery for monitoring summer barley. Int. J. Remote Sens. 2013, 34, 6067–6078. [Google Scholar] [CrossRef]
- Thomas, U.; Philippe, D.; Christian, B.; Franz, R.; Frédéric, M.; Martin, S.; Miriam, M.; Lucien, H. Retrieving the Bioenergy Potential from Maize Crops Using Hyperspectral Remote Sensing. Remote Sens. 2013, 5, 254–273. [Google Scholar]
- Mewes, T.; Franke, J.; Menz, G. Spectral requirements on airborne hyperspectral remote sensing data for wheat disease detection. Precis. Agric. 2011, 12, 795–812. [Google Scholar] [CrossRef]
- Hbirkou, C.; Pätzold, S.; Mahlein, A.; Welp, G. Airborne hyperspectral imaging of spatial soil organic carbon heterogeneity at the field-scale. Geoderma 2012, 175–176, 21–28. [Google Scholar] [CrossRef]
- Cilia, C.; Panigada, C.; Rossini, M.; Meroni, M.; Busetto, L.; Amaducci, S.; Boschetti, M.; Picchi, V.; Colombo, R. Nitrogen Status Assessment for Variable Rate Fertilization in Maize through Hyperspectral Imagery. Remote Sens. 2014, 6, 6549–6565. [Google Scholar] [CrossRef] [Green Version]
- Ambrus, A.; Burai, P.; Lénárt, C.; Enyedi, P.; Kovács, Z. Estimating biomass of winter wheat using narrowband vegetation indices for precision agriculture. J. Cent. Eur. Green Innov. 2015, 3, 13–22. [Google Scholar]
- Oppelt, N.; Mauser, W. Hyperspectral monitoring of physiological parameters of wheat during a vegetation period using AVIS data. Int. J. Remote Sens. 2004, 25, 145–159. [Google Scholar] [CrossRef]
- Bannari, A.; Pacheco, A.; Staenz, K.; McNairn, H.; Omari, K. Estimating and mapping crop residues cover on agricultural lands using hyperspectral and IKONOS data. Remote Sens. Environ. 2006, 104, 447–459. [Google Scholar] [CrossRef]
- Van Wesemael, B.; Tychon, B.; Bartholomeus, H.; Kooistra, L.; van Leeuwen, M.; Stevens, A.; Ben-Dor, E. Soil Organic Carbon mapping of partially vegetated agricultural fields with imaging spectroscopy. Int. J. Appl. Earth Obs. 2011, 13, 81–88. [Google Scholar]
- Finn, M.P.; Lewis, M.D.; Bosch, D.D.; Giraldo, M.; Yamamoto, K.; Sullivan, D.G.; Kincaid, R.; Luna, R.; Allam, G.K.; Kvien, C.; et al. Remote Sensing of Soil Moisture Using Airborne Hyperspectral Data. Gisci. Remote Sens. 2011, 48, 522–540. [Google Scholar] [CrossRef]
- Xie, Q.; Huang, W.; Liang, D.; Chen, P.; Wu, C.; Yang, G.; Zhang, J.; Huang, L.; Zhang, D. Leaf Area Index Estimation Using Vegetation Indices Derived From Airborne Hyperspectral Images in Winter Wheat. IEEE J. STARS 2014, 7, 3586–3594. [Google Scholar] [CrossRef]
- Castaldi, F.; Chabrillat, S.; Jones, A.; Vreys, K.; Bomans, B.; van Wesemael, B. Soil Organic Carbon Estimation in Croplands by Hyperspectral Remote APEX Data Using the LUCAS Topsoil Database. Remote Sens. 2018, 10, 153. [Google Scholar] [CrossRef] [Green Version]
- Luo, S.; Wang, C.; Xi, X.; Zeng, H.; Li, D.; Xia, S.; Wang, P. Fusion of Airborne Discrete-Return LiDAR and Hyperspectral Data for Land Cover Classification. Remote Sens. 2016, 8, 3. [Google Scholar] [CrossRef] [Green Version]
- Mart, L.; Tard, A.; Pal, V.; Arbiol, R. Atmospheric correction algorithm applied to CASI multi-height hyperspectral imagery. Parameters 2006, 1, 4. [Google Scholar]
- AVIRIS Data—New Data Acquisitions. Available online: https://aviris.jpl.nasa.gov/data/newdata.html (accessed on 1 August 2020).
- Lu, B.; He, Y. Species classification using Unmanned Aerial Vehicle (UAV)-acquired high spatial resolution imagery in a heterogeneous grassland. ISPRS J. Photogramm. 2017, 128, 73–85. [Google Scholar] [CrossRef]
- Casa, R.; Pascucci, S.; Pignatti, S.; Palombo, A.; Nanni, U.; Harfouche, A.; Laura, L.; Di Rocco, M.; Fantozzi, P. UAV-based hyperspectral imaging for weed discrimination in maize. In Precision Agriculture ‘19; Stafford, J.V., Ed.; Wageningen Academic Publishers: Wageningen, The Netherlands, 2019; pp. 24–35. [Google Scholar]
- Dao, P.D.; He, Y.; Lu, B. Maximizing the quantitative utility of airborne hyperspectral imagery for studying plant physiology: An optimal sensor exposure setting procedure and empirical line method for atmospheric correction. Int. J. Appl. Earth Obs. 2019, 77, 140–150. [Google Scholar] [CrossRef]
- Capolupo, A.; Kooistra, L.; Berendonk, C.; Boccia, L.; Suomalainen, J. Estimating plant traits of grasslands from UAV-acquired hyperspectral images: A comparison of statistical approaches. ISPRS Int. J. Geo Inf. 2015, 4, 2792–2820. [Google Scholar] [CrossRef]
- Lu, B.; He, Y. Optimal spatial resolution of Unmanned Aerial Vehicle (UAV)-acquired imagery for species classification in a heterogeneous grassland ecosystem. Gisci. Remote Sens. 2018, 55, 205–220. [Google Scholar] [CrossRef]
- Bohnenkamp, D.; Behmann, J.; Mahlein, A. In-Field Detection of Yellow Rust in Wheat on the Ground Canopy and UAV Scale. Remote Sens. 2019, 11, 2495. [Google Scholar] [CrossRef] [Green Version]
- Habib, A.; Han, Y.; Xiong, W.; He, F.; Zhang, Z.; Crawford, M. Automated Ortho-Rectification of UAV-Based Hyperspectral Data over an Agricultural Field Using Frame RGB Imagery. Remote Sens. 2016, 8, 796. [Google Scholar] [CrossRef] [Green Version]
- Honkavaara, E.; Saari, H.; Kaivosoja, J.; Pölönen, I.; Hakala, T.; Litkey, P.; Mäkynen, J.; Pesonen, L. Processing and assessment of spectrometric, stereoscopic imagery collected using a lightweight UAV spectral camera for precision agriculture. Remote Sens. 2013, 5, 5006–5039. [Google Scholar] [CrossRef] [Green Version]
- Saari, H.; Pellikka, I.; Pesonen, L.; Tuominen, S.; Heikkila, J.; Holmlund, C.; Makynen, J.; Ojala, K.; Antila, T. Unmanned Aerial Vehicle (UAV) operated spectral camera system for forest and agriculture applications. In Proceedings of the Remote Sensing for Agriculture, Ecosystems, and Hydrology XIII. International Society for Optics and Photonics, Prague, Czech Republic, 6 October 2011; Volume 8174. [Google Scholar]
- Honkavaara, E.; Kaivosoja, J.; Mäkynen, J.; Pellikka, I.; Pesonen, L.; Saari, H.; Salo, H.; Hakala, T.; Marklelin, L.; Rosnell, T. Hyperspectral reflectance signatures and point clouds for precision agriculture by light weight UAV imaging system. ISPRS Ann. Photogramm. Remote Sens. Spat. Inf. Sci. 2012, 7, 353–358. [Google Scholar] [CrossRef] [Green Version]
- Yue, J.; Yang, G.; Li, C.; Li, Z.; Wang, Y.; Feng, H.; Xu, B. Estimation of Winter Wheat Above-Ground Biomass Using Unmanned Aerial Vehicle-Based Snapshot Hyperspectral Sensor and Crop Height Improved Models. Remote Sens. 2017, 9, 708. [Google Scholar] [CrossRef] [Green Version]
- Pölönen, I.; Saari, H.; Kaivosoja, J.; Honkavaara, E.; Pesonen, L. Hyperspectral imaging based biomass and nitrogen content estimations from light-weight UAV. In Proceedings of the Remote Sensing for Agriculture, Ecosystems, and Hydrology XV. International Society for Optics and Photonics, Dresden, Germany, 16 October 2013; p. 88870J. [Google Scholar]
- Kaivosoja, J.; Pesonen, L.; Kleemola, J.; Pölönen, I.; Salo, H.; Honkavaara, E.; Saari, H.; Mäkynen, J.; Rajala, A. A case study of a precision fertilizer application task generation for wheat based on classified hyperspectral data from UAV combined with farm history data. In Proceedings of the SPIE Remote Sensing, Dresden, Germany, 24–26 September 2013; pp. 1–11. [Google Scholar]
- Akhtman, Y.; Golubeva, E.; Tutubalina, O.; Zimin, M. Application of hyperspectural images and ground data for precision farming. Geogr. Environ. Sustain. 2017, 10, 117–128. [Google Scholar] [CrossRef]
- Izzo, R.R.; Lakso, A.N.; Marcellus, E.D.; Bauch, T.D.; Raqueno, N.G.; van Aardt, J. An initial analysis of real-time sUAS-based detection of grapevine water status in the Finger Lakes Wine Country of Upstate New York. In Proceedings of the Autonomous Air and Ground Sensing Systems for Agricultural Optimization and Phenotyping IV; International Society for Optics and Photonics: Baltimore, MD, USA, 2019. [Google Scholar]
- Scherrer, B.; Sheppard, J.; Jha, P.; Shaw, J.A. Hyperspectral imaging and neural networks to classify herbicide-resistant weeds. J. Appl. Remote Sens. 2019, 13, 044516. [Google Scholar] [CrossRef]
- Yue, J.; Feng, H.; Jin, X.; Yuan, H.; Li, Z.; Zhou, C.; Yang, G.; Tian, Q. A Comparison of Crop Parameters Estimation Using Images from UAV-Mounted Snapshot Hyperspectral Sensor and High-Definition Digital Camera. Remote Sens. 2018, 10, 1138. [Google Scholar] [CrossRef] [Green Version]
- Dalponte, M.; Orka, H.O.; Gobakken, T.; Gianelle, D.; Naesset, E. Tree Species Classification in Boreal Forests with Hyperspectral Data. IEEE Trans. Geosci. Remote 2013, 51, 2632–2645. [Google Scholar] [CrossRef]
- Aasen, H.; Bendig, J.; Bolten, A.; Bennertz, S.; Willkomm, M.; Bareth, G. Introduction and preliminary results of a calibration for full-frame hyperspectral cameras to monitor agricultural crops with UAVs. Int. Arch. Photogramm. Remote Sens. Spat. Inf. Sci. 2014, XL-7, 1–8. [Google Scholar] [CrossRef] [Green Version]
- Zhu, W.; Sun, Z.; Huang, Y.; Lai, J.; Li, J.; Zhang, J.; Yang, B.; Li, B.; Li, S.; Zhu, K.; et al. Improving Field-Scale Wheat LAI Retrieval Based on UAV Remote-Sensing Observations and Optimized VI-LUTs. Remote Sens. 2019, 11, 2456. [Google Scholar] [CrossRef] [Green Version]
- Zhao, J.; Zhong, Y.; Hu, X.; Wei, L.; Zhang, L. A robust spectral-spatial approach to identifying heterogeneous crops using remote sensing imagery with high spectral and spatial resolutions. Remote Sens. Environ. 2020, 239, 111605. [Google Scholar] [CrossRef]
- Zarco-Tejada, P.J.; González-Dugo, V.; Berni, J.A.J. Fluorescence, temperature and narrow-band indices acquired from a UAV platform for water stress detection using a micro-hyperspectral imager and a thermal camera. Remote Sens. Environ. 2012, 117, 322–337. [Google Scholar] [CrossRef]
- Lu, B.; He, Y.; Liu, H.H.T. Mapping vegetation biophysical and biochemical properties using unmanned aerial vehicles-acquired imagery. Int. J. Remote Sens. 2018, 39, 5265–5287. [Google Scholar] [CrossRef]
- Malmir, M.; Tahmasbian, I.; Xu, Z.; Farrar, M.B.; Bai, S.H. Prediction of soil macro- and micro-elements in sieved and ground air-dried soils using laboratory-based hyperspectral imaging technique. Geoderma 2019, 340, 70–80. [Google Scholar] [CrossRef]
- Van de Vijver, R.; Mertens, K.; Heungens, K.; Somers, B.; Nuyttens, D.; Borra-Serrano, I.; Lootens, P.; Roldan-Ruiz, I.; Vangeyte, J.; Saeys, W. In-field detection of Altemaria solani in potato crops using hyperspectral imaging. Comput. Electron. Agric. 2020, 168, 105106. [Google Scholar] [CrossRef]
- Eddy, P.R.; Smith, A.M.; Hill, B.D.; Peddle, D.R.; Coburn, C.A.; Blackshaw, R.E. Hybrid segmentation - Artificial Neural Network classification of high resolution hyperspectral imagery for Site-Specific Herbicide Management in agriculture. Photogramm. Eng. Remote Sens. 2008, 74, 1249–1257. [Google Scholar] [CrossRef]
- Feng, H.; Chen, G.; Xiong, L.; Liu, Q.; Yang, W. Accurate Digitization of the Chlorophyll Distribution of Individual Rice Leaves Using Hyperspectral Imaging and an Integrated Image Analysis Pipeline. Front. Plant Sci. 2017, 8, 1238. [Google Scholar] [CrossRef] [Green Version]
- Asaari, M.S.M.; Mishra, P.; Mertens, S.; Dhondt, S.; Inzé, D.; Wuyts, N.; Scheunders, P. Close-range hyperspectral image analysis for the early detection of stress responses in individual plants in a high-throughput phenotyping platform. ISPRS J. Photogramm. 2018, 138, 121–138. [Google Scholar] [CrossRef]
- Zhu, W.; Li, J.; Li, L.; Wang, A.; Wei, X.; Mao, H. Nondestructive diagnostics of soluble sugar, total nitrogen and their ratio of tomato leaves in greenhouse by polarized spectra–hyperspectra Introduction to the pls Package l data fusion. Int. J. Agric. Biol. Eng. 2020, 13, 189–197. [Google Scholar]
- Morel, J.; Jay, S.; Féret, J.; Bakache, A.; Bendoula, R.; Carreel, F.; Gorretta, N. Exploring the potential of PROCOSINE and close-range hyperspectral imaging to study the effects of fungal diseases on leaf physiology. Sci. Rep. 2018, 8, 1–13. [Google Scholar] [CrossRef] [PubMed]
- Nagasubramanian, K.; Jones, S.; Singh, A.K.; Sarkar, S.; Singh, A.; Ganapathysubramanian, B. Plant disease identification using explainable 3D deep learning on hyperspectral images. Plant Methods 2019, 15, 98. [Google Scholar] [CrossRef] [PubMed]
- Lopatin, J.; Fassnacht, F.E.; Kattenborn, T.; Schmidtlein, S. Mapping plant species in mixed grassland communities using close range imaging spectroscopy. Remote Sens. Environ. 2017, 201, 12–23. [Google Scholar] [CrossRef]
- Behmann, J.; Mahlein, A.; Paulus, S.; Dupuis, J.; Kuhlmann, H.; Oerke, E.; Plümer, L. Generation and application of hyperspectral 3D plant models: Methods and challenges. Mach. Vis. Appl. 2016, 27, 611–624. [Google Scholar] [CrossRef]
- Antonucci, F.; Menesatti, P.; Holden, N.M.; Canali, E.; Giorgi, S.; Maienza, A.; Stazi, S.R. Hyperspectral Visible and Near-Infrared Determination of Copper Concentration in Agricultural Polluted Soils. Commun. Soil Sci. Plan. 2012, 43, 1401–1411. [Google Scholar] [CrossRef]
- Wan, P.; Yang, G.; Xu, B.; Feng, H.; Yu, H. Geometric Correction Method of Rotary Scanning Hyperspectral Image in Agriculture Application. In Proceedings of the Conferences of the Photoelectronic Technology Committee of the Chinese Society of Astronautics, Beijing, China, 13–15 May 2014. [Google Scholar]
- Yeh, Y.; Chung, W.; Liao, J.; Chung, C.; Kuo, Y.; Lin, T. Strawberry foliar anthracnose assessment by hyperspectral imaging. Comput. Electron. Agric. 2016, 122, 1–9. [Google Scholar] [CrossRef]
- Liu, Y.; Wang, T.; Ma, L.; Wang, N. Spectral calibration of hyperspectral data observed from a hyperspectrometer loaded on an Unmanned Aerial Vehicle platform. IEEE J. Sel. Top. Appl. Earth Obs. Remote Sens. 2014, 7, 2630–2638. [Google Scholar]
- Miglani, A.; Ray, S.S.; Pandey, R.; Parihar, J.S. Evaluation of EO-1 hyperion data for agricultural applications. J. Indian Soc. Remote 2008, 36, 255–266. [Google Scholar] [CrossRef]
- Amato, U.; Antoniadis, A.; Carfora, M.F.; Colandrea, P.; Cuomo, V.; Franzese, M.; Pignatti, S.; Serio, C. Statistical Classification for Assessing PRISMA Hyperspectral Potential for Agricultural Land Use. IEEE J. STARS 2013, 6, 615–625. [Google Scholar] [CrossRef]
- Thenkabail, P.S.; Gumma, M.K.; Teluguntla, P.; Mohammed, I.A. Hyperspectral remote sensing of vegetation and agricultural crops. Photogramm. Eng. Remote Sens. J. Am. Soc. Photogramm. 2014, 80, 697–709. [Google Scholar]
- Wang, Y.; Yao, H.; Zhao, S. Auto-encoder based dimensionality reduction. Neurocomputing 2016, 184, 232–242. [Google Scholar] [CrossRef]
- Hsu, P.; Tseng, Y.; Gong, P. Dimension Reduction of Hyperspectral Images for Classification Applications. Geogr. Inf. Sci. 2002, 8, 1–8. [Google Scholar] [CrossRef]
- Abdolmaleki, M.; Fathianpour, N.; Tabaei, M. Evaluating the performance of the wavelet transform in extracting spectral alteration features from hyperspectral images. Int. J. Remote Sens. 2018, 39, 6076–6094. [Google Scholar] [CrossRef]
- Cao, X.; Yao, J.; Fu, X.; Bi, H.; Hong, D. An Enhanced 3-D Discrete Wavelet Transform for Hyperspectral Image Classification. IEEE Geosci. Remote Soc. 2020, 1–5. [Google Scholar] [CrossRef]
- Prabhakar, T.V.N.; Geetha, P. Two-dimensional empirical wavelet transform based supervised hyperspectral image classification. ISPRS J. Photogramm. 2017, 133, 37–45. [Google Scholar] [CrossRef]
- Geng, X.; Sun, K.; Ji, L.; Zhao, Y. A Fast Volume-Gradient-Based Band Selection Method for Hyperspectral Image. IEEE Trans. Geosci. Remote 2014, 52, 7111–7119. [Google Scholar] [CrossRef]
- Wang, C.; Gong, M.; Zhang, M.; Chan, Y. Unsupervised Hyperspectral Image Band Selection via Column Subset Selection. IEEE Geosci. Remote Soc. 2015, 12, 1411–1415. [Google Scholar] [CrossRef]
- Wang, Q.; Lin, J.; Yuan, Y. Salient Band Selection for Hyperspectral Image Classification via Manifold Ranking. IEEE Trans. Neural Netw. Learn. Syst. 2016, 27, 1279–1289. [Google Scholar] [CrossRef]
- Thenkabail, P.S.; Smith, R.B.; De Pauw, E. Hyperspectral vegetation indices and their relationships with agricultural crop characteristics. Remote Sens. Environ. 2000, 71, 158–182. [Google Scholar] [CrossRef]
- Nevalainen, O.; Hakala, T.; Suomalainen, J.; Kaasalainen, S. Nitrogen concentration estimation with hyperspectral LiDAR. ISPRS Ann. Photogramm. Remote Sens. Spat. Inf. Sci. 2013, 2, 205–210. [Google Scholar] [CrossRef] [Green Version]
- Huang, W.; Lamb, D.W.; Niu, Z.; Zhang, Y.; Liu, L.; Wang, J. Identification of yellow rust in wheat using in-situ spectral reflectance measurements and airborne hyperspectral imaging. Precis. Agric. 2007, 8, 187–197. [Google Scholar] [CrossRef]
- Tong, A.; He, Y. Estimating and mapping chlorophyll content for a heterogeneous grassland: Comparing prediction power of a suite of vegetation indices across scales between years. ISPRS J. Photogramm. 2017, 126, 146–167. [Google Scholar] [CrossRef]
- Haboudane, D.; Tremblay, N.; Miller, J.R.; Vigneault, P. Remote estimation of crop chlorophyll content using spectral indices derived from hyperspectral data. IEEE T. Geosci. Remote 2008, 46, 423–437. [Google Scholar] [CrossRef]
- Main, R.; Cho, M.A.; Mathieu, R.; O’Kennedy, M.M.; Ramoelo, A.; Koch, S. An investigation into robust spectral indices for leaf chlorophyll estimation. ISPRS J. Photogramm. 2011, 66, 751–761. [Google Scholar] [CrossRef]
- Peng, Y.; Gitelson, A.A. Remote estimation of gross primary productivity in soybean and maize based on total crop chlorophyll content. Remote Sens. Environ. 2012, 117, 440–448. [Google Scholar] [CrossRef]
- Croft, H.; Chen, J.M.; Zhang, Y. The applicability of empirical vegetation indices for determining leaf chlorophyll content over different leaf and canopy structures. Ecol. Complex. 2014, 17, 119–130. [Google Scholar] [CrossRef]
- Zhou, X.; Huang, W.; Kong, W.; Ye, H.; Luo, J.; Chen, P. Remote estimation of canopy nitrogen content in winter wheat using airborne hyperspectral reflectance measurements. Adv. Space Res. 2016, 58, 1627–1637. [Google Scholar] [CrossRef]
- Yue, J.; Feng, H.; Yang, G.; Li, Z. A comparison of regression techniques for estimation of above-ground winter wheat biomass using near-surface spectroscopy. Remote Sens. 2018, 10, 66. [Google Scholar] [CrossRef] [Green Version]
- Hansen, P.M.; Schjoerring, J.K. Reflectance measurement of canopy biomass and nitrogen status in wheat crops using normalized difference vegetation indices and partial least squares regression. Remote Sens. Environ. 2003, 86, 542–553. [Google Scholar] [CrossRef]
- Nguyen, H.T.; Lee, B. Assessment of rice leaf growth and nitrogen status by hyperspectral canopy reflectance and partial least square regression. Eur. J. Agron. 2006, 24, 349–356. [Google Scholar] [CrossRef]
- Pedregosa, F.; Varoquaux, G.; Gramfort, A.; Michel, V.; Thirion, B.; Grisel, O.; Blondel, M.; Prettenhofer, P.; Weiss, R.; Dubourg, V.; et al. Scikit-learn: Machine learning in Python. Mach. Learn. 2011, 12, 2825–2830. [Google Scholar]
- Mevik, B.; Wehrens, R. Introduction to the PLS Package. Help Sect. “Pls” Package R Studio Softw; R Found. Stat. Comput.: Vienna, Austria, 2015; pp. 1–23. [Google Scholar]
- Asner, G.P.; Martin, R.E.; Anderson, C.B.; Knapp, D.E. Quantifying forest canopy traits: Imaging spectroscopy versus field survey. Remote Sens. Environ. 2015, 158, 15–27. [Google Scholar] [CrossRef]
- Kiala, Z.; Odindi, J.; Mutanga, O. Potential of interval partial least square regression in estimating leaf area index. S. Afr. J. Sci. 2017, 113, 40–48. [Google Scholar] [CrossRef]
- Wang, Z.; Kawamura, K.; Sakuno, Y.; Fan, X.; Gong, Z.; Lim, J. Retrieval of Chlorophyll-a and Total Suspended Solids Using Iterative Stepwise Elimination Partial Least Squares (ISE-PLS) Regression Based on Field Hyperspectral Measurements in Irrigation Ponds in Higashihiroshima, Japan. Remote Sens. 2017, 9, 264. [Google Scholar] [CrossRef] [Green Version]
- Mehmood, T.; Ahmed, B. The diversity in the applications of partial least squares: An overview. J. Chemometr. 2016, 30, 4–17. [Google Scholar] [CrossRef]
- Jacquemoud, S.; Baret, F. PROSPECT—A model of leaf optical-properties spectra. Remote Sens. Environ. 1990, 34, 75–91. [Google Scholar] [CrossRef]
- Jacquemoud, S.; Bacour, C.; Poilve, H.; Frangi, J.P. Comparison of four radiative transfer models to simulate plant canopies reflectance: Direct and inverse mode. Remote Sens. Environ. 2000, 74, 471–481. [Google Scholar] [CrossRef]
- Casa, R.; Jones, H.G. Retrieval of crop canopy properties: A comparison between model inversion from hyperspectral data and image classification. Int. J. Remote Sens. 2004, 25, 1119–1130. [Google Scholar] [CrossRef]
- Richter, K.; Hank, T.; Atzberger, C.; Locherer, M.; Mauser, W. Regularization strategies for agricultural monitoring: The EnMAP vegetation analyzer (AVA). In Proceedings of the 2012 IEEE International Geoscience and Remote Sensing Symposium, Munich, Germany, 22–27 July 2012; pp. 6613–6616. [Google Scholar]
- Wu, C.; Wang, L.; Niu, Z.; Gao, S.; Wu, M. Nondestructive estimation of canopy chlorophyll content using Hyperion and Landsat/TM images. Int. J. Remote Sens. 2010, 31, 2159–2167. [Google Scholar] [CrossRef]
- Darvishzadeh, R.; Atzberger, C.; Skidmore, A.; Schlerf, M. Mapping grassland leaf area index with airborne hyperspectral imagery: A comparison study of statistical approaches and inversion of radiative transfer models. ISPRS J. Photogramm. 2011, 66, 894–906. [Google Scholar] [CrossRef]
- Breiman, L. Random forests. Mach. Learn. 2001, 45, 5–32. [Google Scholar] [CrossRef] [Green Version]
- Were, K.; Bui, D.T.; Dick, O.B.; Singh, B.R. A comparative assessment of support vector regression, artificial neural networks, and random forests for predicting and mapping soil organic carbon stocks across an Afromontane landscape. Ecol. Indic. 2015, 52, 394–403. [Google Scholar] [CrossRef]
- Gao, J.; Nuyttens, D.; Lootens, P.; He, Y.; Pieters, J.G. Recognising weeds in a maize crop using a random forest machine-learning algorithm and near-infrared snapshot mosaic hyperspectral imagery. Biosyst. Eng. 2018, 170, 39–50. [Google Scholar] [CrossRef]
- Siegmann, B.; Jarmer, T. Comparison of different regression models and validation techniques for the assessment of wheat leaf area index from hyperspectral data. Int. J. Remote Sens. 2015, 36, 4519–4534. [Google Scholar] [CrossRef]
- Adam, E.; Deng, H.; Odindi, J.; Abdel-Rahman, E.M.; Mutanga, O. Detecting the Early Stage of Phaeosphaeria Leaf Spot Infestations in Maize Crop Using In Situ Hyperspectral Data and Guided Regularized Random Forest Algorithm. J. Spectrosc. 2017, 2017, 1–8. [Google Scholar] [CrossRef]
- Kamilaris, A.; Prenafeta-Boldú, F.X. Deep learning in agriculture: A survey. Comput. Electron. Agric. 2018, 147, 70–90. [Google Scholar] [CrossRef] [Green Version]
- Yuan, Q.; Shen, H.; Li, T.; Li, Z.; Li, S.; Jiang, Y.; Xu, H.; Tan, W.; Yang, Q.; Wang, J.; et al. Deep learning in environmental remote sensing: Achievements and challenges. Remote Sens. Environ. 2020, 241, 111716. [Google Scholar] [CrossRef]
- Sharma, A.; Liu, X.; Yang, X. Land cover classification from multi-temporal, multi-spectral remotely sensed imagery using patch-based recurrent neural networks. Neural Netw. 2018, 105, 346–355. [Google Scholar] [CrossRef] [Green Version]
- Zhang, C.; Sargent, I.; Pan, X.; Li, H.; Gardiner, A.; Hare, J.; Atkinson, P.M. Joint Deep Learning for land cover and land use classification. Remote Sens. Environ. 2019, 221, 173–187. [Google Scholar] [CrossRef] [Green Version]
- Rezaee, M.; Mahdianpari, M.; Zhang, Y.; Salehi, B. Deep Convolutional Neural Network for Complex Wetland Classification Using Optical Remote Sensing Imagery. IEEE J. STARS 2018, 11, 3030–3039. [Google Scholar] [CrossRef]
- Xu, Y.; Wu, L.; Xie, Z.; Chen, Z. Building Extraction in Very High Resolution Remote Sensing Imagery Using Deep Learning and Guided Filters. Remote Sens. 2018, 10, 144. [Google Scholar] [CrossRef] [Green Version]
- Kuwata, K.; Shibasaki, R. Estimating crop yields with deep learning and remotely sensed data. In Proceedings of the 2015 IEEE International Geoscience and Remote Sensing Symposium (IGARSS), Milan, Italy, 26–31 July 2015; pp. 858–861. [Google Scholar]
- Mohanty, S.P.; Hughes, D.P.; Salathé, M. Using Deep Learning for Image-Based Plant Disease Detection. Front. Plant Sci. 2016, 7, 1419. [Google Scholar] [CrossRef] [PubMed] [Green Version]
- Ji, S.; Zhang, C.; Xu, A.; Shi, Y.; Duan, Y. 3D Convolutional Neural Networks for Crop Classification with Multi-Temporal Remote Sensing Images. Remote Sens. 2018, 10, 75. [Google Scholar] [CrossRef] [Green Version]
- Ndikumana, E.; Ho Tong Minh, D.; Baghdadi, N.; Courault, D.; Hossard, L. Deep Recurrent Neural Network for Agricultural Classification using multitemporal SAR Sentinel-1 for Camargue, France. Remote Sens. 2018, 10, 1217. [Google Scholar] [CrossRef] [Green Version]
- Singh, A.K.; Ganapathysubramanian, B.; Sarkar, S.; Singh, A. Deep Learning for Plant Stress Phenotyping: Trends and Future Perspectives. Trends Plant Sci. 2018, 23, 883–898. [Google Scholar] [CrossRef] [Green Version]
- Chlingaryan, A.; Sukkarieh, S.; Whelan, B. Machine learning approaches for crop yield prediction and nitrogen status estimation in precision agriculture: A review. Comput. Electron. Agric. 2018, 151, 61–69. [Google Scholar] [CrossRef]
- Song, X.; Zhang, G.; Liu, F.; Li, D.; Zhao, Y.; Yang, J. Modeling spatio-temporal distribution of soil moisture by deep learning-based cellular automata model. J. Arid Land 2016, 8, 734–748. [Google Scholar] [CrossRef] [Green Version]
- Moharana, S.; Dutta, S. Estimation of water stress variability for a rice agriculture system from space-borne hyperion imagery. Agr. Water Manag. 2019, 213, 260–269. [Google Scholar] [CrossRef]
- Yang, C. Airborne Hyperspectral Imagery for Mapping Crop Yield Variability. Geogr. Compass 2009, 3, 1717–1731. [Google Scholar] [CrossRef]
- Zimdahl, R.L. Six Chemicals That Changed Agriculture; Academic Press: Cambridge, MA, USA, 2015. [Google Scholar]
- Goel, P.K.; Prasher, S.O.; Landry, J.A.; Patel, R.M.; Bonnell, R.B.; Viau, A.A.; Miller, J.R. Potential of airborne hyperspectral remote sensing to detect nitrogen deficiency and weed infestation in corn. Comput. Electron. Agric. 2003, 38, 99–124. [Google Scholar] [CrossRef]
- Quemada, M.; Gabriel, J.; Zarco-Tejada, P. Airborne Hyperspectral Images and Ground-Level Optical Sensors As Assessment Tools for Maize Nitrogen Fertilization. Remote Sens. 2014, 6, 2940–2962. [Google Scholar] [CrossRef] [Green Version]
- Koppe, W.; Laudien, R.; Gnyp, M.L.; Jia, L.; Li, F.; Chen, X.; Bareth, G. Deriving winter wheat characteristics from combined radar and hyperspectral data analysis. In Proceedings of the Geoinformatics, Wuhan, China, 28–29 October 2006; Remotely Sensed Data and Information. SPIE-INT SOC Optical Engineering: Bellingham, WA, USA, 2006. [Google Scholar]
- Castaldi, F.; Castrignano, A.; Casa, R. A data fusion and spatial data analysis approach for the estimation of wheat grain nitrogen uptake from satellite data. Int. J. Remote Sens. 2016, 37, 4317–4336. [Google Scholar] [CrossRef]
- Zheng, H.; Zhou, X.; Cheng, T.; Yao, X.; Tian, Y.; Cao, W.; Zhu, Y. Evaluation of a uav-based hyperspectral frame camera for monitoring the leaf nitrogen concentration in rice. In Proceedings of the IEEE International Symposium on Geoscience and Remote Sensing IGARSS, Beijing, China, 10–15 July 2016; pp. 7350–7353. [Google Scholar]
- Zhou, K.; Cheng, T.; Zhu, Y.; Cao, W.; Ustin, S.L.; Zheng, H.; Yao, X.; Tian, Y. Assessing the Impact of Spatial Resolution on the Estimation of Leaf Nitrogen Concentration Over the Full Season of Paddy Rice Using Near-Surface Imaging Spectroscopy Data. Front. Plant Sci. 2018, 9, 964. [Google Scholar] [CrossRef] [PubMed] [Green Version]
- Nasi, R.; Viljanen, N.; Kaivosoja, J.; Alhonoja, K.; Hakala, T.; Markelin, L.; Honkavaara, E. Estimating Biomass and Nitrogen Amount of Barley and Grass Using UAV and Aircraft Based Spectral and Photogrammetric 3D Features. Remote Sens. 2018, 10, 1082. [Google Scholar] [CrossRef] [Green Version]
- Nigon, T.J.; Mulla, D.J.; Rosen, C.J.; Cohen, Y.; Alchanatis, V.; Knight, J.; Rud, R. Hyperspectral aerial imagery for detecting nitrogen stress in two potato cultivars. Comput. Electron. Agric. 2015, 112, 36–46. [Google Scholar] [CrossRef]
- Chen, S.; Chen, C.; Wang, C.; Yang, I.; Hsiao, S. Evaluation of nitrogen content in cabbage seedlings using hyper-spectral images. In Proceedings of the Optics East, Boston, MA, USA, 9–12 September 2007; p. L7610. [Google Scholar]
- Miphokasap, P.; Wannasiri, W. Estimations of Nitrogen Concentration in Sugarcane Using Hyperspectral Imagery. Sustainability 2018, 10, 1266. [Google Scholar] [CrossRef] [Green Version]
- Malmir, M.; Tahmasbian, I.; Xu, Z.; Farrar, M.B.; Bai, S.H. Prediction of macronutrients in plant leaves using chemometric analysis and wavelength selection. J. Soil. Sediment. 2020, 20, 249–259. [Google Scholar] [CrossRef]
- Lowe, A.; Harrison, N.; French, A.P. Hyperspectral image analysis techniques for the detection and classification of the early onset of plant disease and stress. Plant Methods 2017, 13, 80. [Google Scholar] [CrossRef]
- Kingra, P.K.; Majumder, D.; Singh, S.P. Application of Remote Sensing and Gis in Agriculture and Natural Resource Management Under Changing Climatic Conditions. Agric. Res. J. 2016, 53, 295. [Google Scholar] [CrossRef]
- Karimi, Y.; Prasher, S.O.; McNairn, H.; Bonnell, R.B.; Dutilleul, P.; Goel, R.K. Classification accuracy of discriminant analysis, artificial neural networks, and decision trees for weed and nitrogen stress detection in corn. Trans. ASAE 2005, 48, 1261–1268. [Google Scholar] [CrossRef]
- Zhang, Y.; Slaughter, D.C.; Staab, E.S. Robust hyperspectral vision-based classification for multi-season weed mapping. ISPRS J. Photogramm. 2012, 69, 65–73. [Google Scholar] [CrossRef]
- Eddy, P.R.; Smith, A.M.; Hill, B.D.; Peddle, D.R.; Coburn, C.A.; Blackshaw, R.E. Weed and crop discrimination using hyperspectral image data and reduced bandsets. Can. J. Remote Sens. 2014, 39, 481–490. [Google Scholar] [CrossRef]
- Liu, B.; Li, R.; Li, H.; You, G.; Yan, S.; Tong, Q. Crop/Weed Discrimination Using a Field Imaging Spectrometer System. Sensors 2019, 19, 5154. [Google Scholar] [CrossRef] [PubMed] [Green Version]
- LÓPEZ-Granados, F. Weed detection for site-specific weed management: Mapping and real-time approaches. Weed Res. 2011, 51, 1–11. [Google Scholar] [CrossRef] [Green Version]
- Thomas, S.; Kuska, M.T.; Bohnenkamp, D.; Brugger, A.; Alisaac, E.; Wahabzada, M.; Behmann, J.; Mahlein, A. Benefits of hyperspectral imaging for plant disease detection and plant protection: A technical perspective. J. Plant Dis. Protect. 2018, 125, 5–20. [Google Scholar] [CrossRef]
- Bauriegel, E.; Giebel, A.; Geyer, M.; Schmidt, U.; Herppich, W.B. Early detection of Fusarium infection in wheat using hyper-spectral imaging. Comput. Electron. Agric. 2011, 75, 304–312. [Google Scholar] [CrossRef]
- Zhang, N.; Pan, Y.; Feng, H.; Zhao, X.; Yang, X.; Ding, C.; Yang, G. Development of Fusarium head blight classification index using hyperspectral microscopy images of winter wheat spikelets. Biosyst. Eng. 2019, 186, 83–99. [Google Scholar] [CrossRef]
- Mahlein, A.; Oerke, E.; Steiner, U.; Dehne, H. Recent advances in sensing plant diseases for precision crop protection. Eur. J. Plant Pathol. 2012, 133, 197–209. [Google Scholar] [CrossRef]
- Casa, R.; Castaldi, F.; Pascucci, S.; Basso, B.; Pignatti, S. Geophysical and Hyperspectral Data Fusion Techniques for In-Field Estimation of Soil Properties. Vadose Zone J. 2013, 12, vzj2012.0201. [Google Scholar] [CrossRef]
- Casa, R.; Castaldi, F.; Pascucci, S.; Pignatti, S. Potential of hyperspectral remote sensing for field scale soil mapping and precision agriculture applications. Ital. J. Agron. 2012, 7, 43. [Google Scholar] [CrossRef]
- Gedminas, L.; Martin, S. Soil Organic Matter Mapping Using Hyperspectral Imagery and Elevation Data. In IEEE Aerospace Conference Proceedings; IEEE: Big Sky, MT, USA, 2019. [Google Scholar]
- Song, X.; Yan, G.; Wan, J.; Liu, L.; Xue, X.; Li, C.; Huang, W. Use of airborne hyperspectral imagery to investigate the influence of soil nitrogen supplies and variable-rate fertilization to winter wheat growth. In Proceedings of the SPIE, Florence, Italy, 11 October 2007. [Google Scholar]
- Wang, W.; Li, Z.; Wang, C.; Zheng, D.; Du, H. Prediction of Available Potassium Content in Cinnamon Soil Using Hyperspectral Imaging Technology. Spectrosc. Spect. Anal. 2019, 39, 1579–1585. [Google Scholar]
- McCann, C.; Repasky, K.S.; Lawrence, R.; Powell, S. Multi–temporal mesoscale hyperspectral data of mixed agricultural and grassland regions for anomaly detection. ISPRS J. Photogramm. 2017, 131, 121–133. [Google Scholar] [CrossRef]


| Procedures of Applying Hyperspectral Imagery | Image Acquisition | Image Processing and Analysis | Image Applications |
|---|---|---|---|
| Review Focuses | Platforms:
| Pre-processing:
| Specific Applications:
|
| Satellite-Based | Airplane-Based | UAV-Based * | |||||||
|---|---|---|---|---|---|---|---|---|---|
| Sensor | Hyperion | PROBA-CHRIS | AVIRIS | CASI | AISA | HyMap | Headwall Hyperspec | UHD 185-Firefly | |
| Spectral range (nm) | 357–2576 | 415–1050 | 400–2500 | 380–1050 (CASI-1500) | 400–970 (Eagle) | 440–2500 | 400–1000 (VNIR) | 450–950 | |
| Number of spectral bands | 220 | 19 | 63 | 224 | 288 | 244 | 128 | 270 (Nano) 324 (Micro) | 138 |
| Spectral Resolution (nm) | 10 | 34 | 17 | 10 | <3.5 | 3.3 | 15 | 6 (Nano) 2.5 (Micro) | 4 |
| Operational altitudes (km) | 705 (swath 7.7 km) | 830 (swath 14 km) | 1–20 | <0.15 | |||||
| Spatial resolution (m) | 30 | 17 | 36 | 1–20 | 0.01–0.5 | ||||
| Temporal resolution (days) | 16–30 | 8 | Depends on flight operations (hours to days) | ||||||
| Organization | NASA, USA | ESA, UK | Jet Propulsion Laboratory, USA | Itres, Canada | Specim, Finland | Integrated Spectronics, Australia | Headwall Photonics, USA | Cubert GmbH, Germany | |
| Number of publications | 41 | 9 | 18 | 22 | 20 | 12 | 9 | 6 | |
| Applications | Previous Studies | Research Focuses |
|---|---|---|
| Estimating LAI and chlorophyll | Yu et al. [37] | Estimated a range of vegetation phenotyping variables (e.g., LAI and leaf chlorophyll) using UAV-based hyperspectral imagery and radiative transfer modelling. |
| Estimating biomass | Honkavaara et al. [123] | Mounted a hyperspectral sensor and a consumer-level camera on a UAV for estimating biomass in a wheat and a barley field. |
| Yue et al. [124] | Utilized UAV-based hyperspectral images for estimating winter wheat above-ground biomass. | |
| Estimating nitrogen content | Pölönen et al. [125] | Used lightweight UAVs for collecting hyperspectral images and estimated crop biomass and nitrogen content. |
| Kaivosoja et al. [126] | Applied UAV-based hyperspectral imagery to investigate biomass and nitrogen contents in a wheat field. | |
| Akhtman et al. [127] | Utilized UAV-based hyperspectral images for estimating nitrogen content and phytomass in corn and wheat fields and monitored temporal variations of these properties. | |
| Estimating water content | Izzo et al. [128] | Evaluated water content in the commercial vineyard using UAV-based hyperspectral images and determined wavelengths sensitive to canopy water content. |
| Classifying weeds | Scherrer et al. [129] | Classified herbicide-resistant weeds in different crop fields (e.g., barley, corn, and dry pea) using both ground- and UAV-based hyperspectral imagery. |
| Detecting disease | Bohnenkamp et al. [119] | Used both ground- and UAV-based hyperspectral images for detecting yellow rust in wheat. |
| Applications | Previous Studies | Research Focuses |
|---|---|---|
| Investigating biochemical components | Feng et al. [140] | Designed a hyperspectral imaging system that consists of a Headwall hyperspectral camera, a halogen lamp, a computer, and a translation stage and used this system for taking images of rice leaves to study leaf chlorophyll distribution. |
| Mohd Asaari et al. [141] | Mounted a visible and near-infrared HIS camera in a high-throughput plant phenotyping platform for evaluating plant water status and detecting early stage signs of plant drought stress. | |
| Zhu et al. [142] | Installed a hyperspectral camera and halogen lamp on a moving stage and used this imaging system for estimating sugar and nitrogen contents in tomato leaves. | |
| Detecting crop disease | Morel et al. [143] | Used a HySpex hyperspectral camera installed in a close-range imaging system for investigating black leaf streak disease in banana leaves. |
| Nagasubramanian et al. [144] | Integrated a Pika XC hyperspectral line imaging scanner and halogen illumination lamps for taking images of soybeans and monitoring fungal disease. | |
| Identifying vegetation species or weeds | Eddy et al. [139] | Mounted a hyperspectral sensor on a boom arm that was installed on a truck for acquiring images at 1 m above the ground and applied the hyperspectral images to classifying weeds in different crop fields. |
| Lopatin et al. [145] | Installed an AISA Eagle imaging spectrometer on a scaffold at the height of 2.5 m above ground, aiming to collect hyperspectral imagery in a grassland area for classifying grassland species. | |
| Phenotyping | Behmann et al. [146] | Utilized hyperspectral cameras and a close-range 3D laser scanner that were mounted on a linear stage for collecting hyperspectral images and 3D point models, respectively, and used these two datasets for generating hyperspectral 3D plant models for better monitoring plant phenotyping features. |
| Monitoring soil properties | Antonucci et al. [147] | Attempted to estimate copper concentration in contaminated soils using hyperspectral images that were acquired from a lab-based spectral scanner. |
| Malmir et al. [137] | Collected close-range soil images using Pika XC2 hyperspectral camera that was mounted on a linear stage and used the hyperspectral imagery for investigating soil macro- and micro-elements. |
| Satellites | Airplanes | Helicopters | Fixed-Wing UAVs | Multi-Rotor UAVs | Close-Range Platforms | |
|---|---|---|---|---|---|---|
| Example Photos |  (Photo: Swales Aerospace) |  |  |  |  |  (Photo: ASPRS) |
| Operational Altitudes | 400–700 km | 1–20 km | 100 m–2 km | <150 m | <10 m | |
| Spatial Coverage | Very large | Medium—large | Medium | Small—medium | Small | Very small |
| e.g., one Hyperion scene covers 42 km × 7.7 km | A 10-min flight/operation covers | |||||
| ~100 km2 | ~10 km2 | ~5 km2 | ~0.5 km2 | ~0.005 km2 | ||
| Spatial Resolution | 20–60 m | 1–20 m | 0.1–1 m | 0.01–0.5 m | 0.0001–0.01 m | |
| Temporal Resolution | Days to weeks | Depends on flight operations (hours to days) | ||||
| Flexibility | Low (e.g., fixed repeating cycles) | Medium (e.g., limited by the availability of aviation company) | High | |||
| Operational Complexity | Low (Final data provided to users) | Medium (Depends on who operates the sensor, users or data vendors) | High (users typically operate sensors and need to set up hardware and software properly) | |||
| Applicable Scales | Regional—global | Landscape—regional | Canopy—landscape | Leaf—canopy | ||
| Major Limiting Factors | Weather (e.g., rain and clouds) | Unfavorable flight height/speed, unstable illumination conditions | Short battery endurance (e.g., 10–30 min), flight regulations | Platform design and operation | ||
| Image Acquisition Cost | Low to medium | High (typically requires hiring an aviation company to fly) | High (If need to cover a large area) | |||
| Number of publications * | 59 | 133 | 3 | 4 | 38 | 79 |
| Applications | Previous Studies | Research Focuses |
|---|---|---|
| Estimating leaf chlorophyll and nitrogen content | Oppelt and Mauser [105] | Utilized the Chlorophyll Absorption Integral (CAI), Optimized Soil-Adjusted Vegetation Index (OSAVI), and hyperspectral Normalized Difference Vegetation Index (h NDVI) for estimating leaf chlorophyll and nitrogen content from hyperspectral imagery and evaluated the performance of each of the indices. |
| Wu et al. [45] | Tested a range of vegetation indices (e.g., NDVI, Simple Ratio (SR), and Triangular Vegetation Index (TVI)) for retrieving vegetation chlorophyll content and LAI from Hyperion images and determined the indices that produced high accuracies. | |
| Cilia et al. [103] | Utilized the Double-peak Canopy Nitrogen Index (DCNI) and Modified Chlorophyll Absorption Ratio Index/Modified Triangular Vegetation Index 2 (MCARI/MTVI2) for estimating nitrogen content, as well as the Transformed Chlorophyll Absorption in Reflectance Index (TCARI), MERIS Terrestrial Chlorophyll Index (MTCI) and Triangular Chlorophyll Index (TCI) for estimating leaf pigments. | |
| Estimating LAI and biomass | Xie et al. [109] | Evaluated a range of vegetation indices, such as the modified simple ratio index (MSR), NDVI, a newly proposed index NDVI-like (which resembles NDVI), modified triangular vegetation index (MTVI2), and modified soil adjusted vegetation index (MSAVI) for estimating winter wheat LAI from hyperspectral images. |
| Ambrus et al. [104] | Tested the NDVI and Red Edge Position (REP) for estimating field-scale winter wheat biomass. | |
| Richter et al. [98] | Examined a range of techniques (e.g., index-based empirical regression, radiative transfer modelling, and artificial neural network) for estimating crop biophysical variables (e.g., LAI and water content) in terms of operational agricultural applications with airborne Hymap data and discussed the unique features of each technique. | |
| Estimating nitrogen content | Nevalainen et al. [163] | Utilized 28 published vegetation indices (e.g., Chlorophyll Absorption Ratio Index (CARI) and Normalized Difference Red Edge (NDRE)) for estimating oat nitrogen and identified the best-performing one. |
| Detecting crop disease | Huang et al. [164] | Examined the performance of the photochemical reflectance index (PRI) for estimating the disease index of wheat yellow rust using canopy reflectance data and then applied the regression on an airborne hyperspectral imagery for mapping the disease-affected areas. |
| Copenhaver et al. [34] | Calculated a range of vegetation indices (e.g., NDVI and red edge position index) for detecting crop disease and compared the effectiveness of these indices. | |
| Estimating crop residue cover | Galloza and Crawford [47] | Utilized the Normalized Difference Tillage Index (NDTI) and Cellulose Absorption Index (CAI), together with ALI, Hyperion, and airborne hyperspectral (SpecTIR) data, for estimating crop residue cover for conservation tillage application. |
| Crop classification | Thenkabail et al. [44] | Utilized both spectral bands and vegetation indices for classifying different crop types and estimating vegetation properties and evaluated the performance difference of using various bands or indices. |
| Methods | Linear Regression | Advanced Regression | Radiative Transfer Modelling | Machine Learning | Deep Learning |
|---|---|---|---|---|---|
| Parameters typically used in the model |
|
|
|
|
|
| Model complexity | Low | Medium | High | Medium | High |
| Model performance | Low—high (depend on predictor variable used) | Medium—high | Medium—high | Medium—high | Medium—high |
| Transferability in time and geographical location | Low | Low | High | Low | High |
| Typical agricultural applications | Prediction of agricultural variables (e.g., yield, LAI) | Prediction of agricultural variables Classification of agricultural features | |||
| Application recommendations |
|
|
|
|
|
| Crops | Previous Studies | Research Focuses |
|---|---|---|
| Winter wheat | Xie et al. [109] | Estimated canopy LAI in a winter wheat field using airborne hyperspectral imagery and proposed a new vegetation index for improved estimation accuracy. |
| Siegmann et al. [73] | Retrieved LAI of two wheat fields using EnMAP images and attempted to pan-sharp the images aiming to improve the spatial resolution of LAI products. | |
| Barley | Jarmer [99] | Retrieved a range of canopy variables from barley, including LAI, chlorophyll, water, and fresh matter content using HyMap data and established an efficient approach for monitoring the spatial patterns of crop variables. |
| Rice | Yu et al. [37] | Investigated LAI, leaf chlorophyll content, canopy water content, and dry matter content using UAV-based hyperspectral imagery, aiming to understand the growing status of rice. |
| Mixed agricultural fields | Richter et al. [98] | Estimated crop LAI and water content with airborne HyMap data aiming to support operational agricultural practices (e.g., irrigation management and crop stress detection) in the context of the EnMap hyperspectral mission. |
| Wu et al. [45] | Estimated chlorophyll content and LAI in a mixed agricultural field (e.g., corns, chestnuts trees, and tea plants) using Hyperion data and identified spectral bands and vegetation indices that generated the highest accuracy. | |
| Verger et al. [57] | Estimated LAI, fCover, and FAPAR in an agricultural site with different crops using PROBA-CHRIS data. | |
| Locherer et al. [74] | Estimated LAI in mixed crop fields using EnMAP data and compared the result accuracy to that of LAI estimation with airborne data. |
| Crop types | Previous Studies | Research Focuses |
|---|---|---|
| Corn | Akhtman et al. [127] | Used UAV-based hyperspectral images for estimating nitrogen content and phytomass in corn and wheat fields and monitored the temporal variation of these properties. |
| Goel et al. [207] | Collected hyperspectral images in a cornfield with different nitrogen treatments and weed controls aiming to evaluate to what extent the spectral signals can identify different nitrogen treatments, weed controls, or their interactions. | |
| Cilia et al. [103] | Estimated nitrogen concentration and dry mass in an experimental maize field using airborne hyperspectral imagery, aiming to quantify the nitrogen deficit and provide a variable rate fertilization map. The authors also suggested a way to evaluate the minimum amount of nitrogen to apply without reducing crop yield and avoid excessive fertilization. | |
| Quemada et al. [208] | Evaluated plant nitrogen status in a maize field using airborne hyperspectral images and developed nitrogen fertilizer recommendations. | |
| Wheat | Koppe et al. [209] | Attempted to investigate wheat nitrogen status and aboveground biomass using hyperspectral and radar images and to evaluate spectral signatures of wheats under different nitrogen treatments. |
| Kaivosoja et al. [126] | Used UAV-based hyperspectral imagery to investigate nitrogen content and absolute biomass in a wheat field and evaluated the degree of nitrogen shortage on the date of image acquisition. In this research, historical farming data, including a yield map and a spring fertilization map, were used for estimating the optimal amount of fertilizer to be applied in different areas of the field. | |
| Castaldi et al. [210] | Estimated nitrogen content in wheat using multi-temporal satellite-based multispectral and hyperspectral images and found that the band selection affected estimation accuracy at different phenological stages. | |
| Rice | Moharana and Dutta [43] | Collected Hyperion images for monitoring nitrogen and chlorophyll contents in rice and investigated the performance of different spectral indices. |
| Ryu et al. [35] | Used airborne hyperspectral images and multivariable analysis to estimate nitrogen content in rice at the heading stage. | |
| Zheng et al. [211] | Tried to monitor rice nitrogen status using UAV-based hyperspectral images and tested the performance of different vegetation indices for estimating the nitrogen content. | |
| Zhou et al. [212] | Estimated leaf nitrogen concentration of rice using close-range hyperspectral images and tested if the variations of the spatial resolution of the imagery affect the estimation accuracy. | |
| Other crops (i.e., barley, potato, cabbage, tomato, sugarcane, and cacao) | Nasi et al. [213] | Evaluated the performance of using airborne hyperspectral images and photogrammetric features for estimating crop nitrogen content and biomass in a barley field and a grassland site, and examined if the integration of spectral and plant height information can improve the estimation results. |
| Nigon et al. [214] | Examined nitrogen stress in potato fields using airborne hyperspectral imagery and identified spectral indices that are sensitive to nitrogen content. | |
| Chen et al. [215] | Estimated nitrogen content in cabbage seedlings using close-range hyperspectral images and identified sensitive wavelengths for the estimation. | |
| Zhu et al. [142] | Investigated soluble sugar, total nitrogen, and their ratio in tomato leaves using close-range hyperspectral images and tested data fusion analysis techniques for improving the investigation accuracy. | |
| Miphokasap and Wannasiri [216] | Collected Hyperion images for investigating spatial variations of sugarcane canopy nitrogen concentration and attempted to identify the nutrient deficient areas for corresponding treatments. | |
| Malmir et al. [217] | Attempted to evaluate nutrient status (e.g., nitrogen, phosphorus, and potassium) of cacao leaves using close-range hyperspectral images and examined influences of band selection on the evaluation accuracy. |
| Applications | Previous Studies | Research Focuses |
|---|---|---|
| Classification of crop types | Camacho Velasco et al. [48] | Utilized Hyperion data and different classification algorithms (e.g., spectral angle mapper and adaptive coherence estimator) for identifying five types of crops (e.g., oil palm, rubber, grass for grazing, citrus, and sugar cane) in Colombia. |
| Bostan et al. [51] | Classified different crop and land cover types (e.g., maize, cotton, urban, water, barren rock, and other crop types) using Landsat 8 multispectral and EO-1 Hyperion hyperspectral images and indicated that hyperspectral imagery performed better than the multispectral imagery. | |
| Amato et al. [152] | Assessed the potential of PRISMA data for classifying different agricultural land uses (e.g., soybean, corn, and sugar beet) and evaluated the contribution of spectral bands to image segmentation and classification. | |
| Nigam et al. [91] | Performed crop classification over homogeneous and heterogeneous agriculture and horticulture areas with airborne AVIRIS images and assessed crop health at the field scale. | |
| Sahoo et al. [4] | Reviewed a few previous studies that used hyperspectral images for classification purposes and indicated the robustness of hyperspectral imagery for classifying different crop types and different crop phonological stages. | |
| Other classifications (e.g., growth stages and agricultural tillage practices) | Antony et al. [58] | Applied multi-angle PROBA-CHRIS data for classifying different growth stages of wheat. |
| Ran et al. [93] | Attempted to detect agricultural tillage practices using hyperspectral imagery with different classification models and identified the best performing one. | |
| Teke et al. [38] | Discussed the application of spectral libraries for classification purposes and listed several spectral libraries available worldwide. The authors also indicated the limitations of using a spectral library, such as the spectral varieties within the same species or land cover, and highlighted the importance of having geographically specific libraries |
| Platforms | Previous Studies | Research Focuses |
|---|---|---|
| Airborne | Goel et al. [97] | Attempted to detect weed infestation in a cornfield that had different nitrogen treatments using airborne hyperspectral imagery and found the different nitrogen treatments affected the classification accuracy of weed. |
| Karimi et al. [220] | Performed combinations of different nitrogen treatment rates and weed management practices in a cornfield and tried to classify these combinations with airborne hyperspectral images. | |
| Close range | Zhang et al. [221] | Developed a close-range weed sensing system using hyperspectral images for classifying tomato and weeds and tested its performance in different environments. |
| Eddy et al. [139] | Used a ground-based hyperspectral imaging system for classifying weeds in canola, pea, and wheat crops and evaluated the applicability of this approach for real-time detection of weeds in the field. | |
| Eddy et al. [222] | Used hyperspectral image data as well as secondary products with reduced bands to classify weeds and achieved good accuracy. | |
| Liu et al. [223] | Classified carrot and weeds using a ground-based hyperspectral imaging system and evaluated the number of spectral bands needed to achieve a good classification accuracy. | |
| Multiple platforms | Scherrer et al. [129] | Attempted to classify herbicide-resistant weeds in different crop fields (e.g., barley, corn, and dry pea) using both ground- and UAV-based hyperspectral imagery and discussed factors influencing classification accuracy (e.g., crop type, plant age, and illumination condition). |
| Review studies | LÓPEZ-Granados [224] | Discussed the high potential of hyperspectral remote sensing images for mapping weeds but also indicated the limitations of this technology due to the high cost of data collection. |
| Crops | Previous Studies | Research Focuses |
|---|---|---|
| Wheat | Bohnenkamp et al. [119] | Used both ground- and UAV-based hyperspectral imaging platforms for detecting yellow rust in wheat and evaluated factors influencing the detection (e.g., measurement distance, spectral features to use). |
| Bauriegel et al. [226] | Targeted the infestation of wheat by Fusarium and attempted to detect this disease using hyperspectral remote sensing data, and consequently suggested that farmers need to deal with infected crops separately from healthy crops. | |
| Zhang et al. [227] | Attempted to detect the Fusarium head blight in winter wheat similarly using close-range hyperspectral imaging and suggested that this is a stable and feasible way to monitor this disease using low-altitude remote sensing. | |
| Corn | Copenhaver et al. [34] | Used airborne hyperspectral images to detect the signal of Ostrinia nubilalis in a cornfield (e.g., via monitoring rate of plant senescence) and tested the performance of this approach throughout the growing season. |
| Soybean | Nagasubramanian et al. [144] | Tried to detect charcoal rot in soybeans using close-range hyperspectral imaging and identified wavelength ranges that are sensitive to this disease. |
| Sugarcane | Apan et al. [41] | Detected sugarcane areas affected by orange rust disease using Hyperion data and developed specific vegetation indices that are sensitive to the disease. |
| Mustard | Dutta et al. [42] | Delineated mustard areas influenced by diseases using Hyperion images and evaluated the performance of different indices. |
| Review studies | Lowe et al. [218] | Focused on hyperspectral imaging and reviewed some of its applications in detecting and classifying crop disease and stress. |
| Thomas et al. [225] | Reviewed the contributions of hyperspectral imaging to the detection of plant disease and discussed different factors (e.g., light and wind) that may limit its wide applications. | |
| Mahlein et al. [228] | Reviewed previous studies using remote sensing for detecting plant disease, but not limited to hyperspectral imaging. |
| Platforms | Previous Studies | Research Focuses |
|---|---|---|
| Satellites | Zhang et al. [50] | Utilized EO-1 Hyperion images for estimating several soil properties, including soil moisture, soil organic matter, total carbon, total phosphorus, total nitrogen, and clay content. The authors also found the influence of spectral resolution on the performance of retrieval models. |
| Casa et al. [230] | Assessed soil organic matter and soil texture at the field scale using CHRIS-PROBA images and produced uniform soil zones for supporting irrigation management. | |
| Airplanes | Hbirkou et al. [102] | Attempted to estimate SOC in agricultural fields using airborne HyMap images and tested the influences of soil surface conditions on the estimation, aiming to support soil management in precision farming. |
| Gedminas and Martin [231] | Tried to map soil organic matter using airborne hyperspectral imagery in combination with topographic information extracted from LiDAR image and evaluated the correlation between soil organic matter and various spectral bands. | |
| Castaldi et al. [110] | Investigated the relationship between SOC in croplands and spectral signals using a soil database and then estimated SOC in their study sites using airborne hyperspectral imagery. With this approach, the authors attempted to reduce the amount of new data collection in the field or lab. | |
| Van Wesemael et al. [107] | Discussed the impacts of vegetation cover on soil and the estimation of SOC from remote sensing data and attempted to use spectral unmixing techniques to estimate the fraction of vegetation cover and then estimate the soil carbon content using the residue soil spectra. | |
| Multiple platforms | Gomez et al. [49] | Estimated SOC using both lab-based hyperspectral reflectance data and Hyperion image data and found that using the lab-acquired reflectance data can generate more accurate results than using the Hyperion data. At the same time, the Hyperion data can generate a SOC map that matches field observations and thus can also be used for prediction. |
| Soil Features | Previous Studies | Research Focuses |
|---|---|---|
| Soil texture | Casa et al. [59] | Investigated soil texture using airborne MIVIS and spaceborne PROBA-CHRIS hyperspectral images and discussed their performance and limitation (e.g., lack of SWIR band). |
| Soil nitrogen | Song et al. [232] | Used airborne hyperspectral images for evaluating the impact of soil nitrogen applications and variable-rate fertilization on winter wheat growth. The authors also indicated that the variable-rate fertilization in the field could reduce the growing difference of winter wheat caused by the spatial variations of soil nitrogen. |
| Copper concentration | Antonucci et al. [147] | Attempted to estimate in soil using lab-based hyperspectral measurement and achieved good accuracy. |
| Potassium content | Wang et al. [233] | Evaluated potassium content in cinnamon soil using close-range hyperspectral imaging aiming to better understand soil fertility and indicated the good performance of this approach when the potassium content is high (i.e., ≥ 100 mg/kg). |
| CO2 leaks | McCann et al. [234] | Detected CO2 leaks from the soil by monitoring vegetation stress signals using multi-temporal hyperspectral images. |
| Previous Focuses | Suggested Future Research Directions | |
|---|---|---|
| Crop biochemical and biophysical properties |
|
|
| Crop nutrient status |
|
|
| Classification | Classification of:
|
|
| Soil properties |
|
|
| Agro-ecosystem |
|
|
© 2020 by the authors. Licensee MDPI, Basel, Switzerland. This article is an open access article distributed under the terms and conditions of the Creative Commons Attribution (CC BY) license (http://creativecommons.org/licenses/by/4.0/).
Share and Cite
Lu, B.; Dao, P.D.; Liu, J.; He, Y.; Shang, J. Recent Advances of Hyperspectral Imaging Technology and Applications in Agriculture. Remote Sens. 2020, 12, 2659. https://doi.org/10.3390/rs12162659
Lu B, Dao PD, Liu J, He Y, Shang J. Recent Advances of Hyperspectral Imaging Technology and Applications in Agriculture. Remote Sensing. 2020; 12(16):2659. https://doi.org/10.3390/rs12162659
Chicago/Turabian StyleLu, Bing, Phuong D. Dao, Jiangui Liu, Yuhong He, and Jiali Shang. 2020. "Recent Advances of Hyperspectral Imaging Technology and Applications in Agriculture" Remote Sensing 12, no. 16: 2659. https://doi.org/10.3390/rs12162659