Land Cover Classification using Google Earth Engine and Random Forest Classifier—The Role of Image Composition


Abstract
:
1. Introduction
2. Materials and Methods
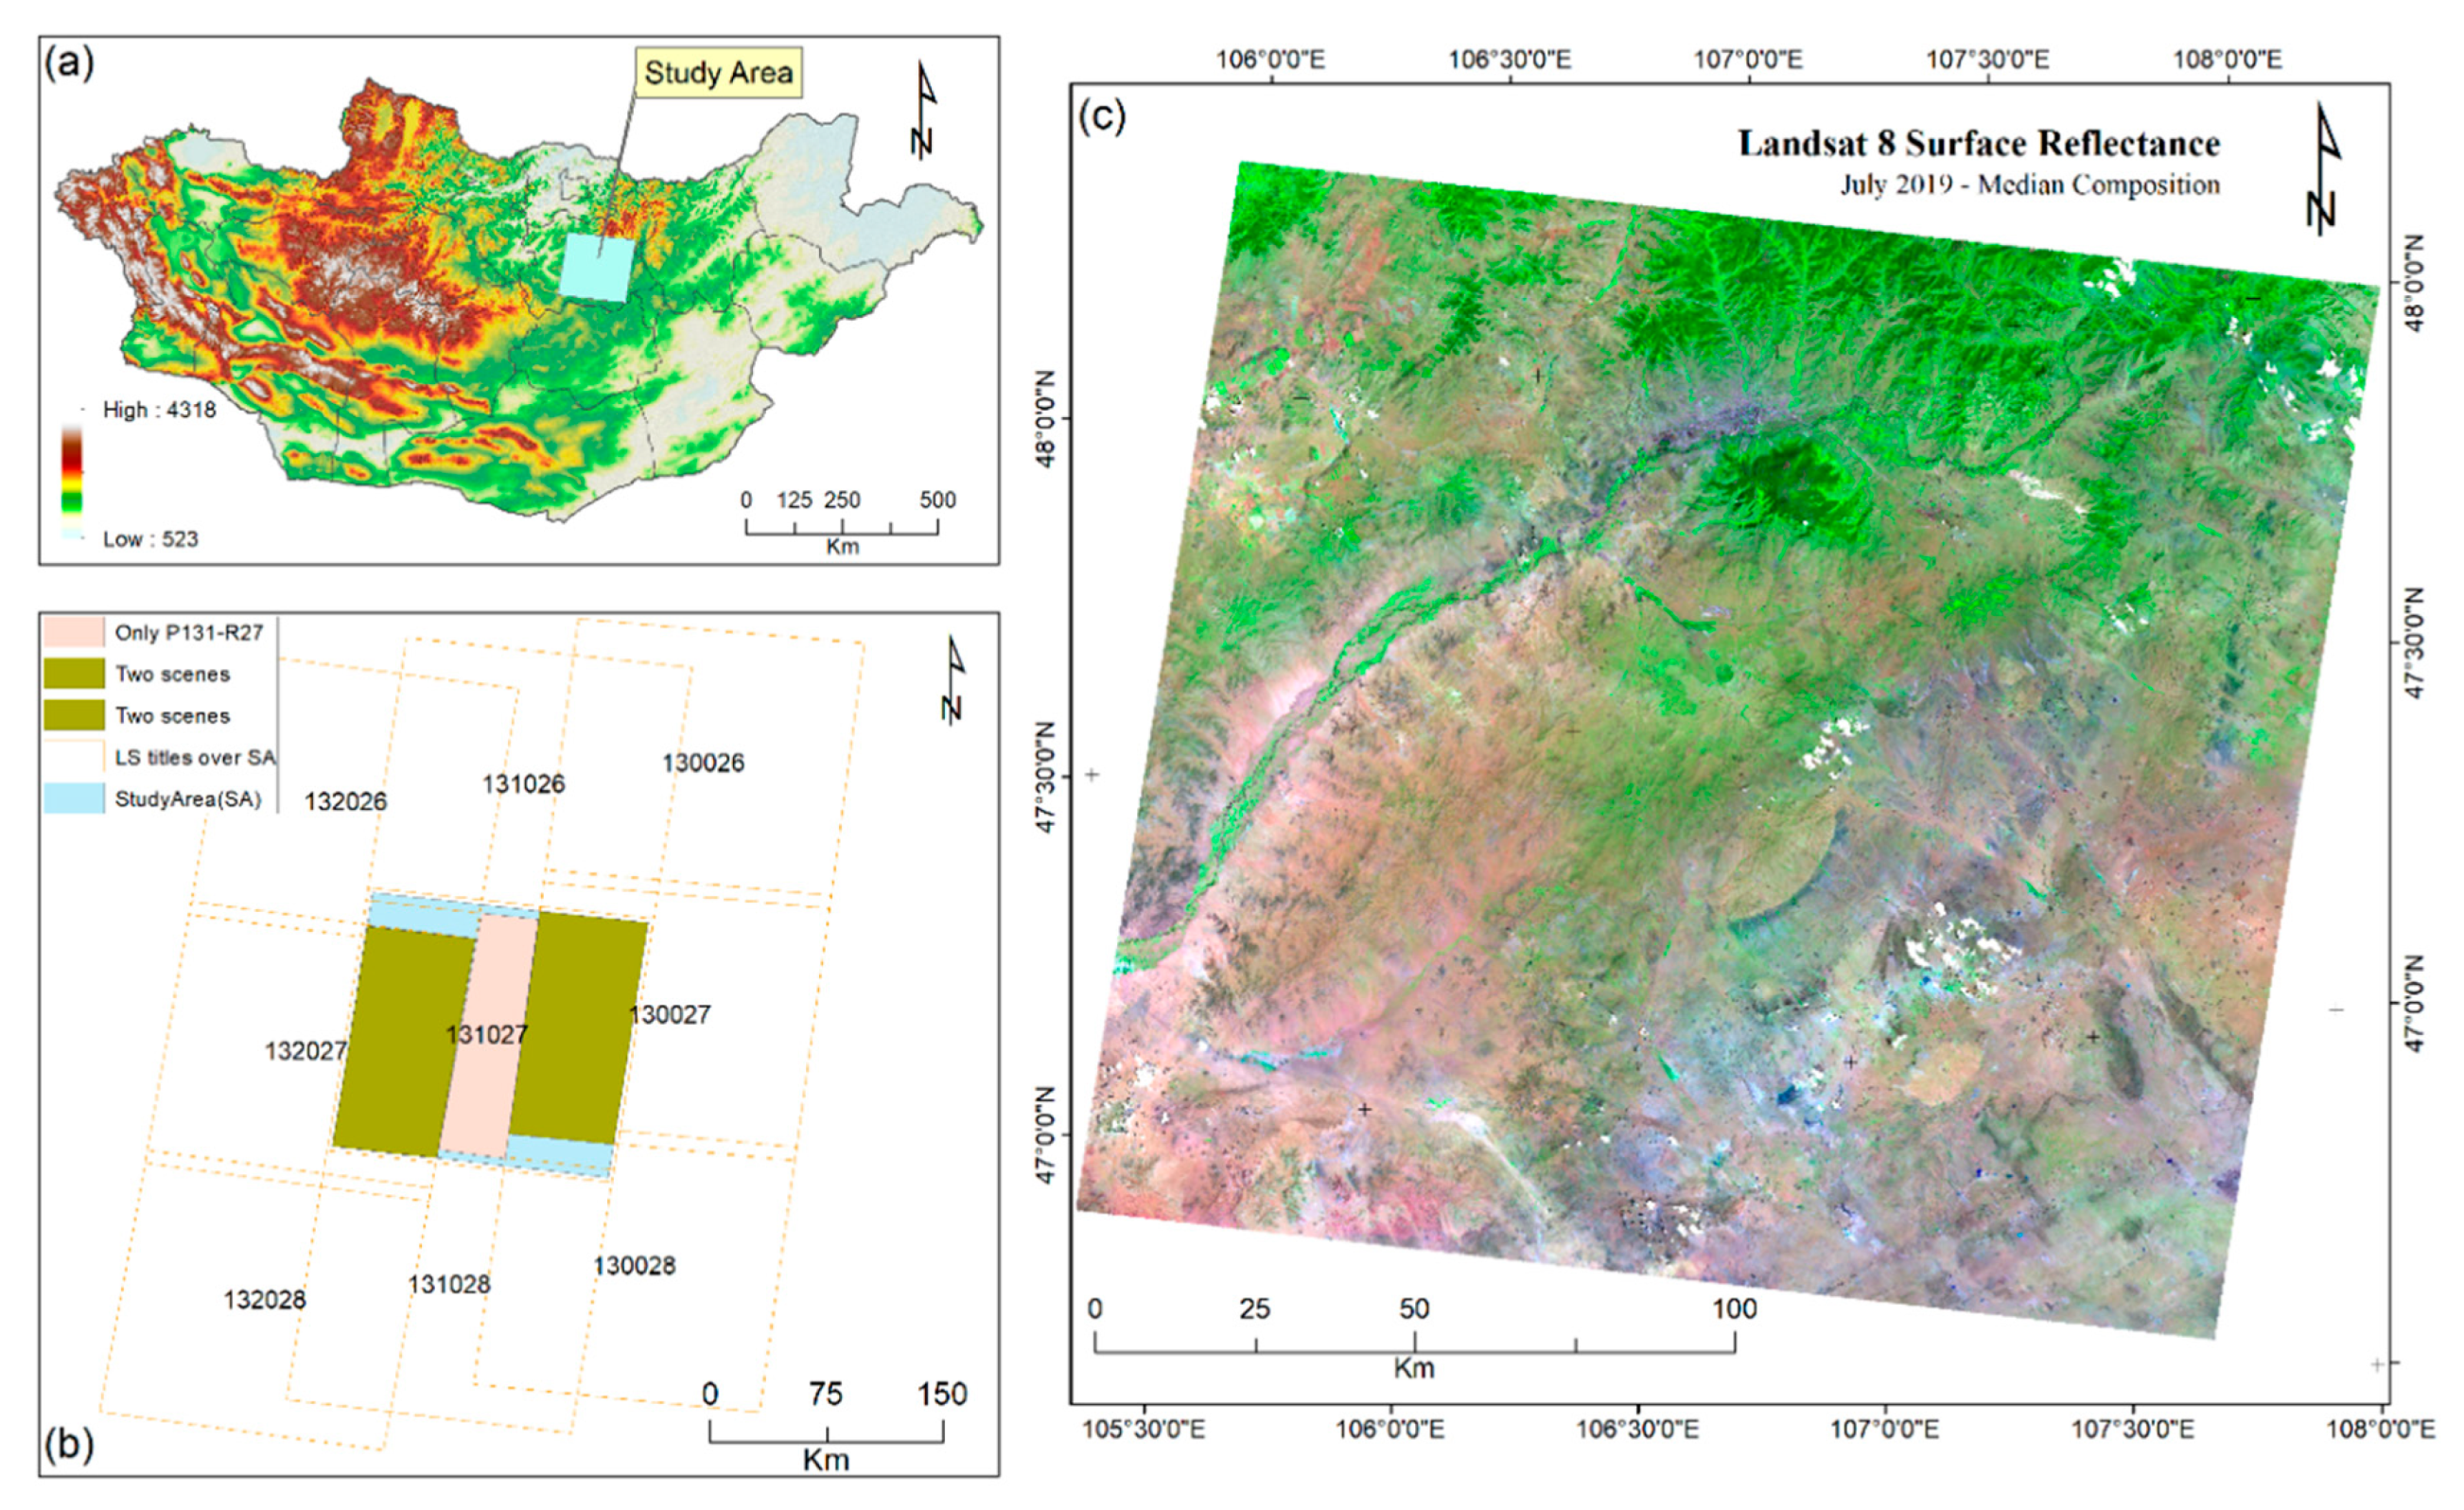
2.1. Study Area
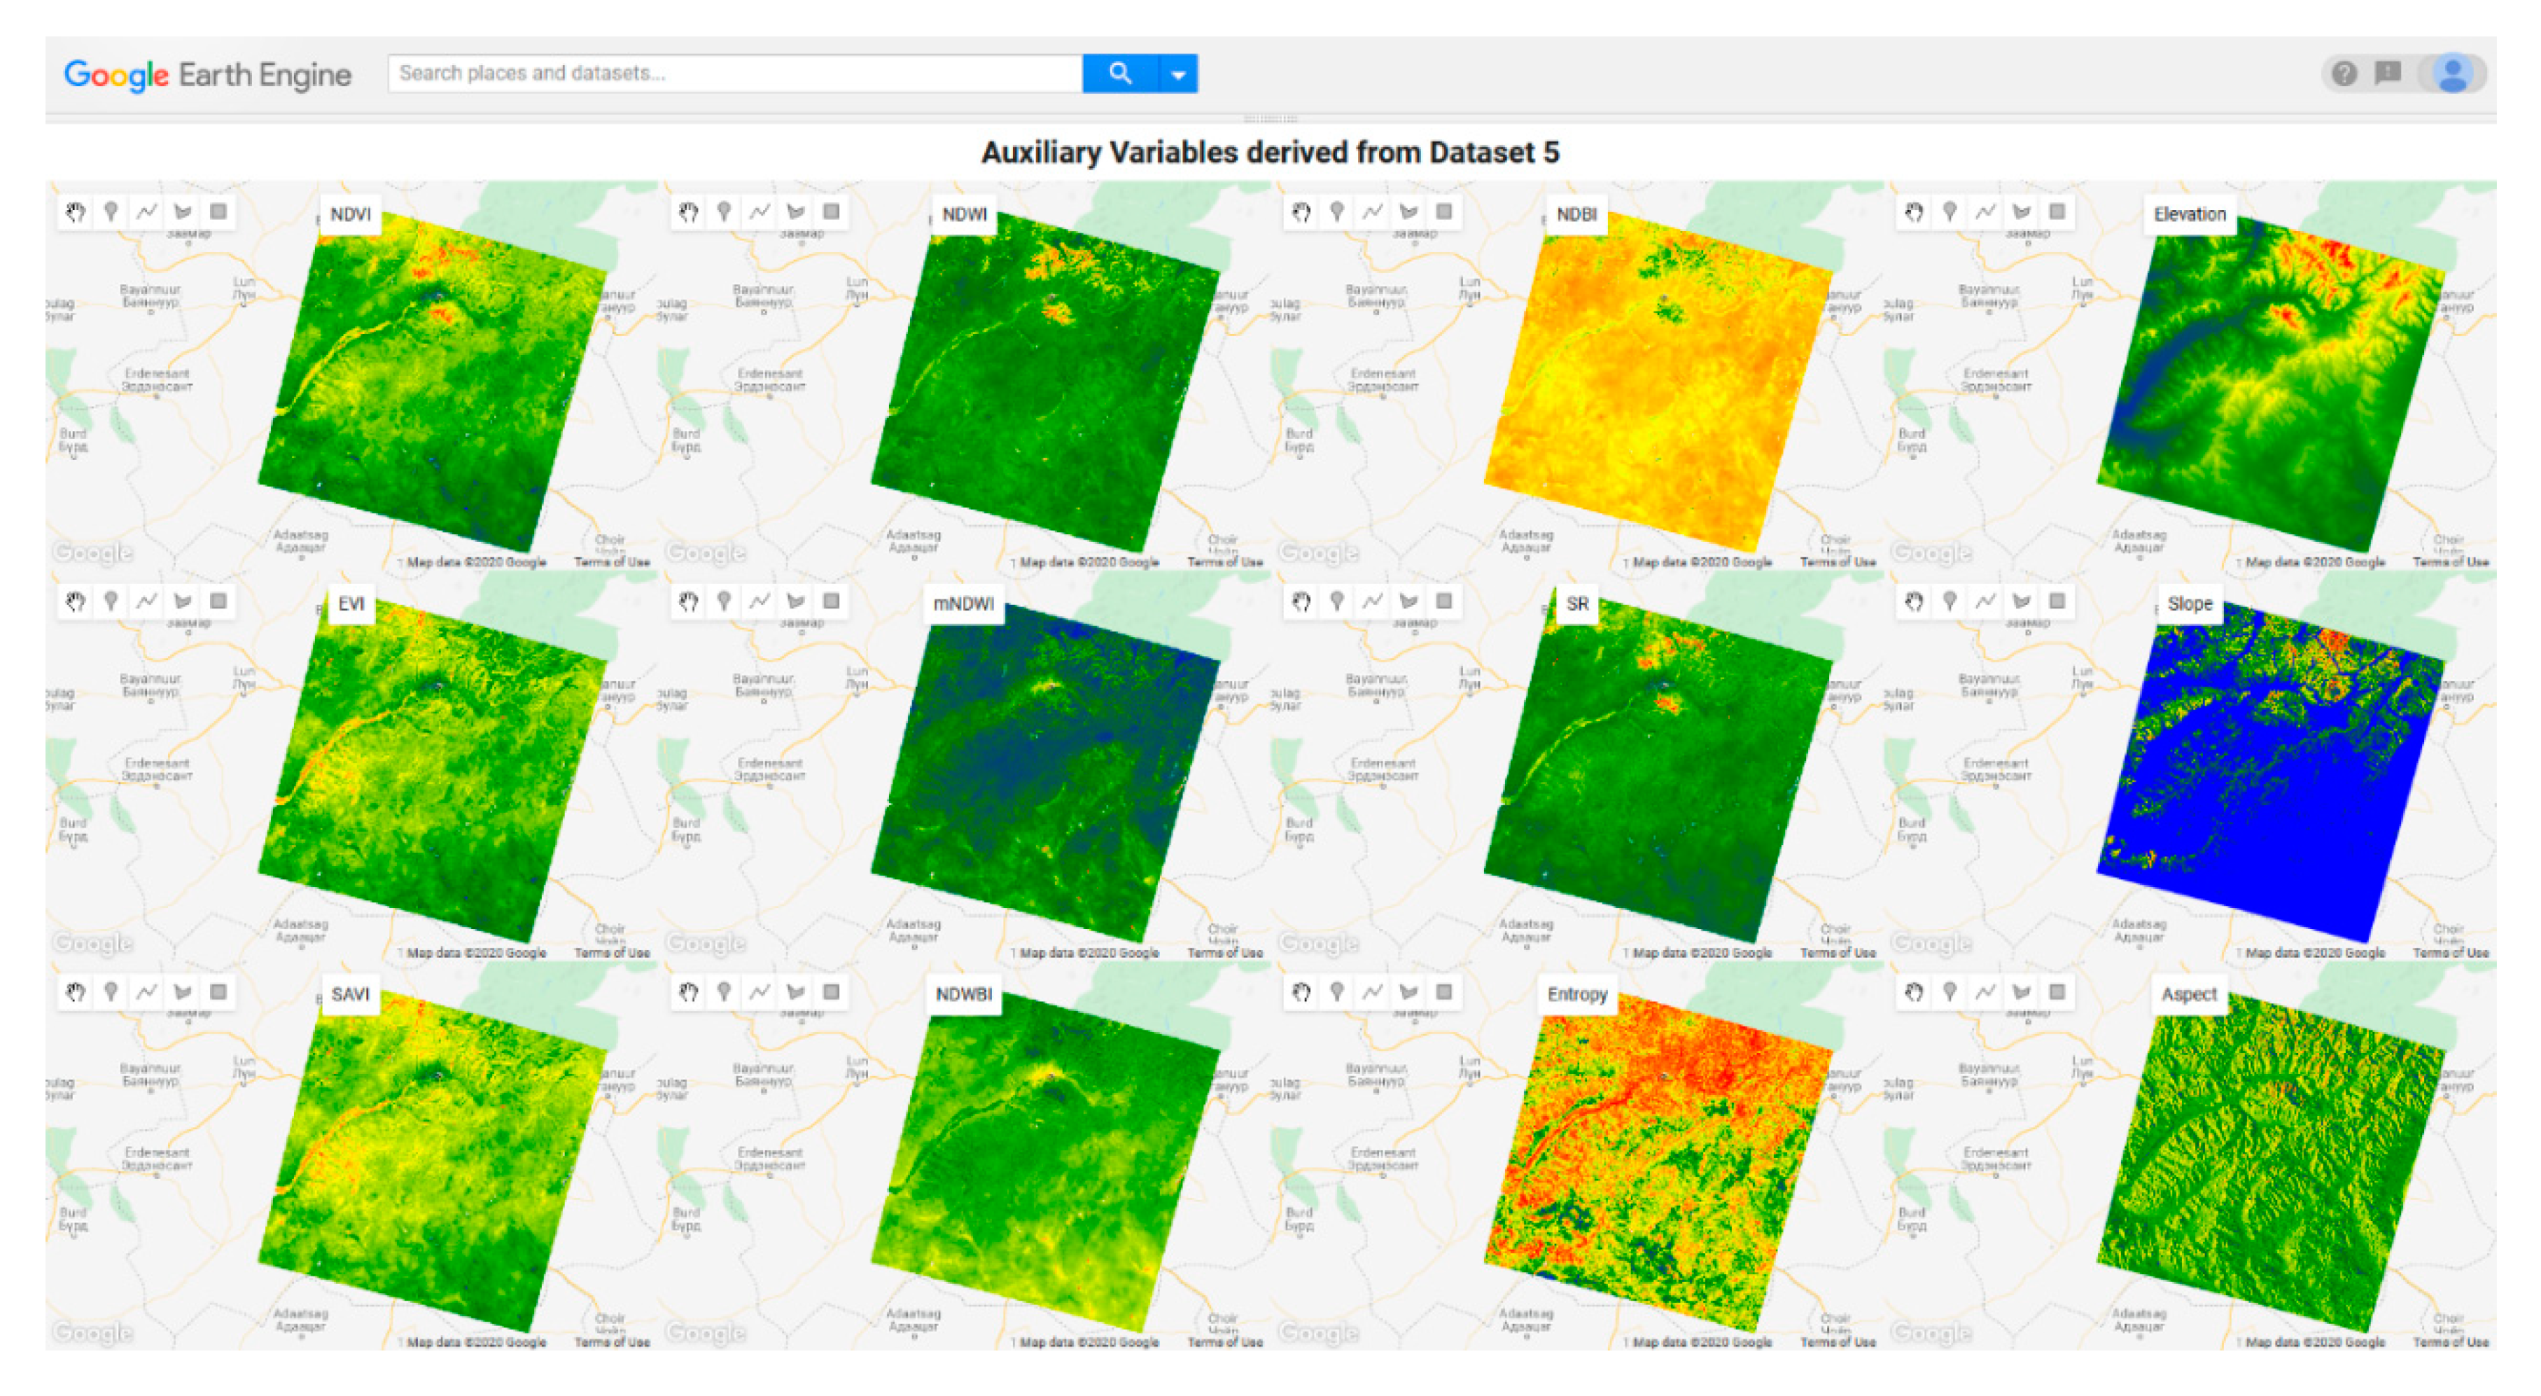
2.2. Data Used
2.2.1. Landsat-8 Surface Reflectance Tier 1 data (L8sr)
2.2.2. Training and Validation Sample Data
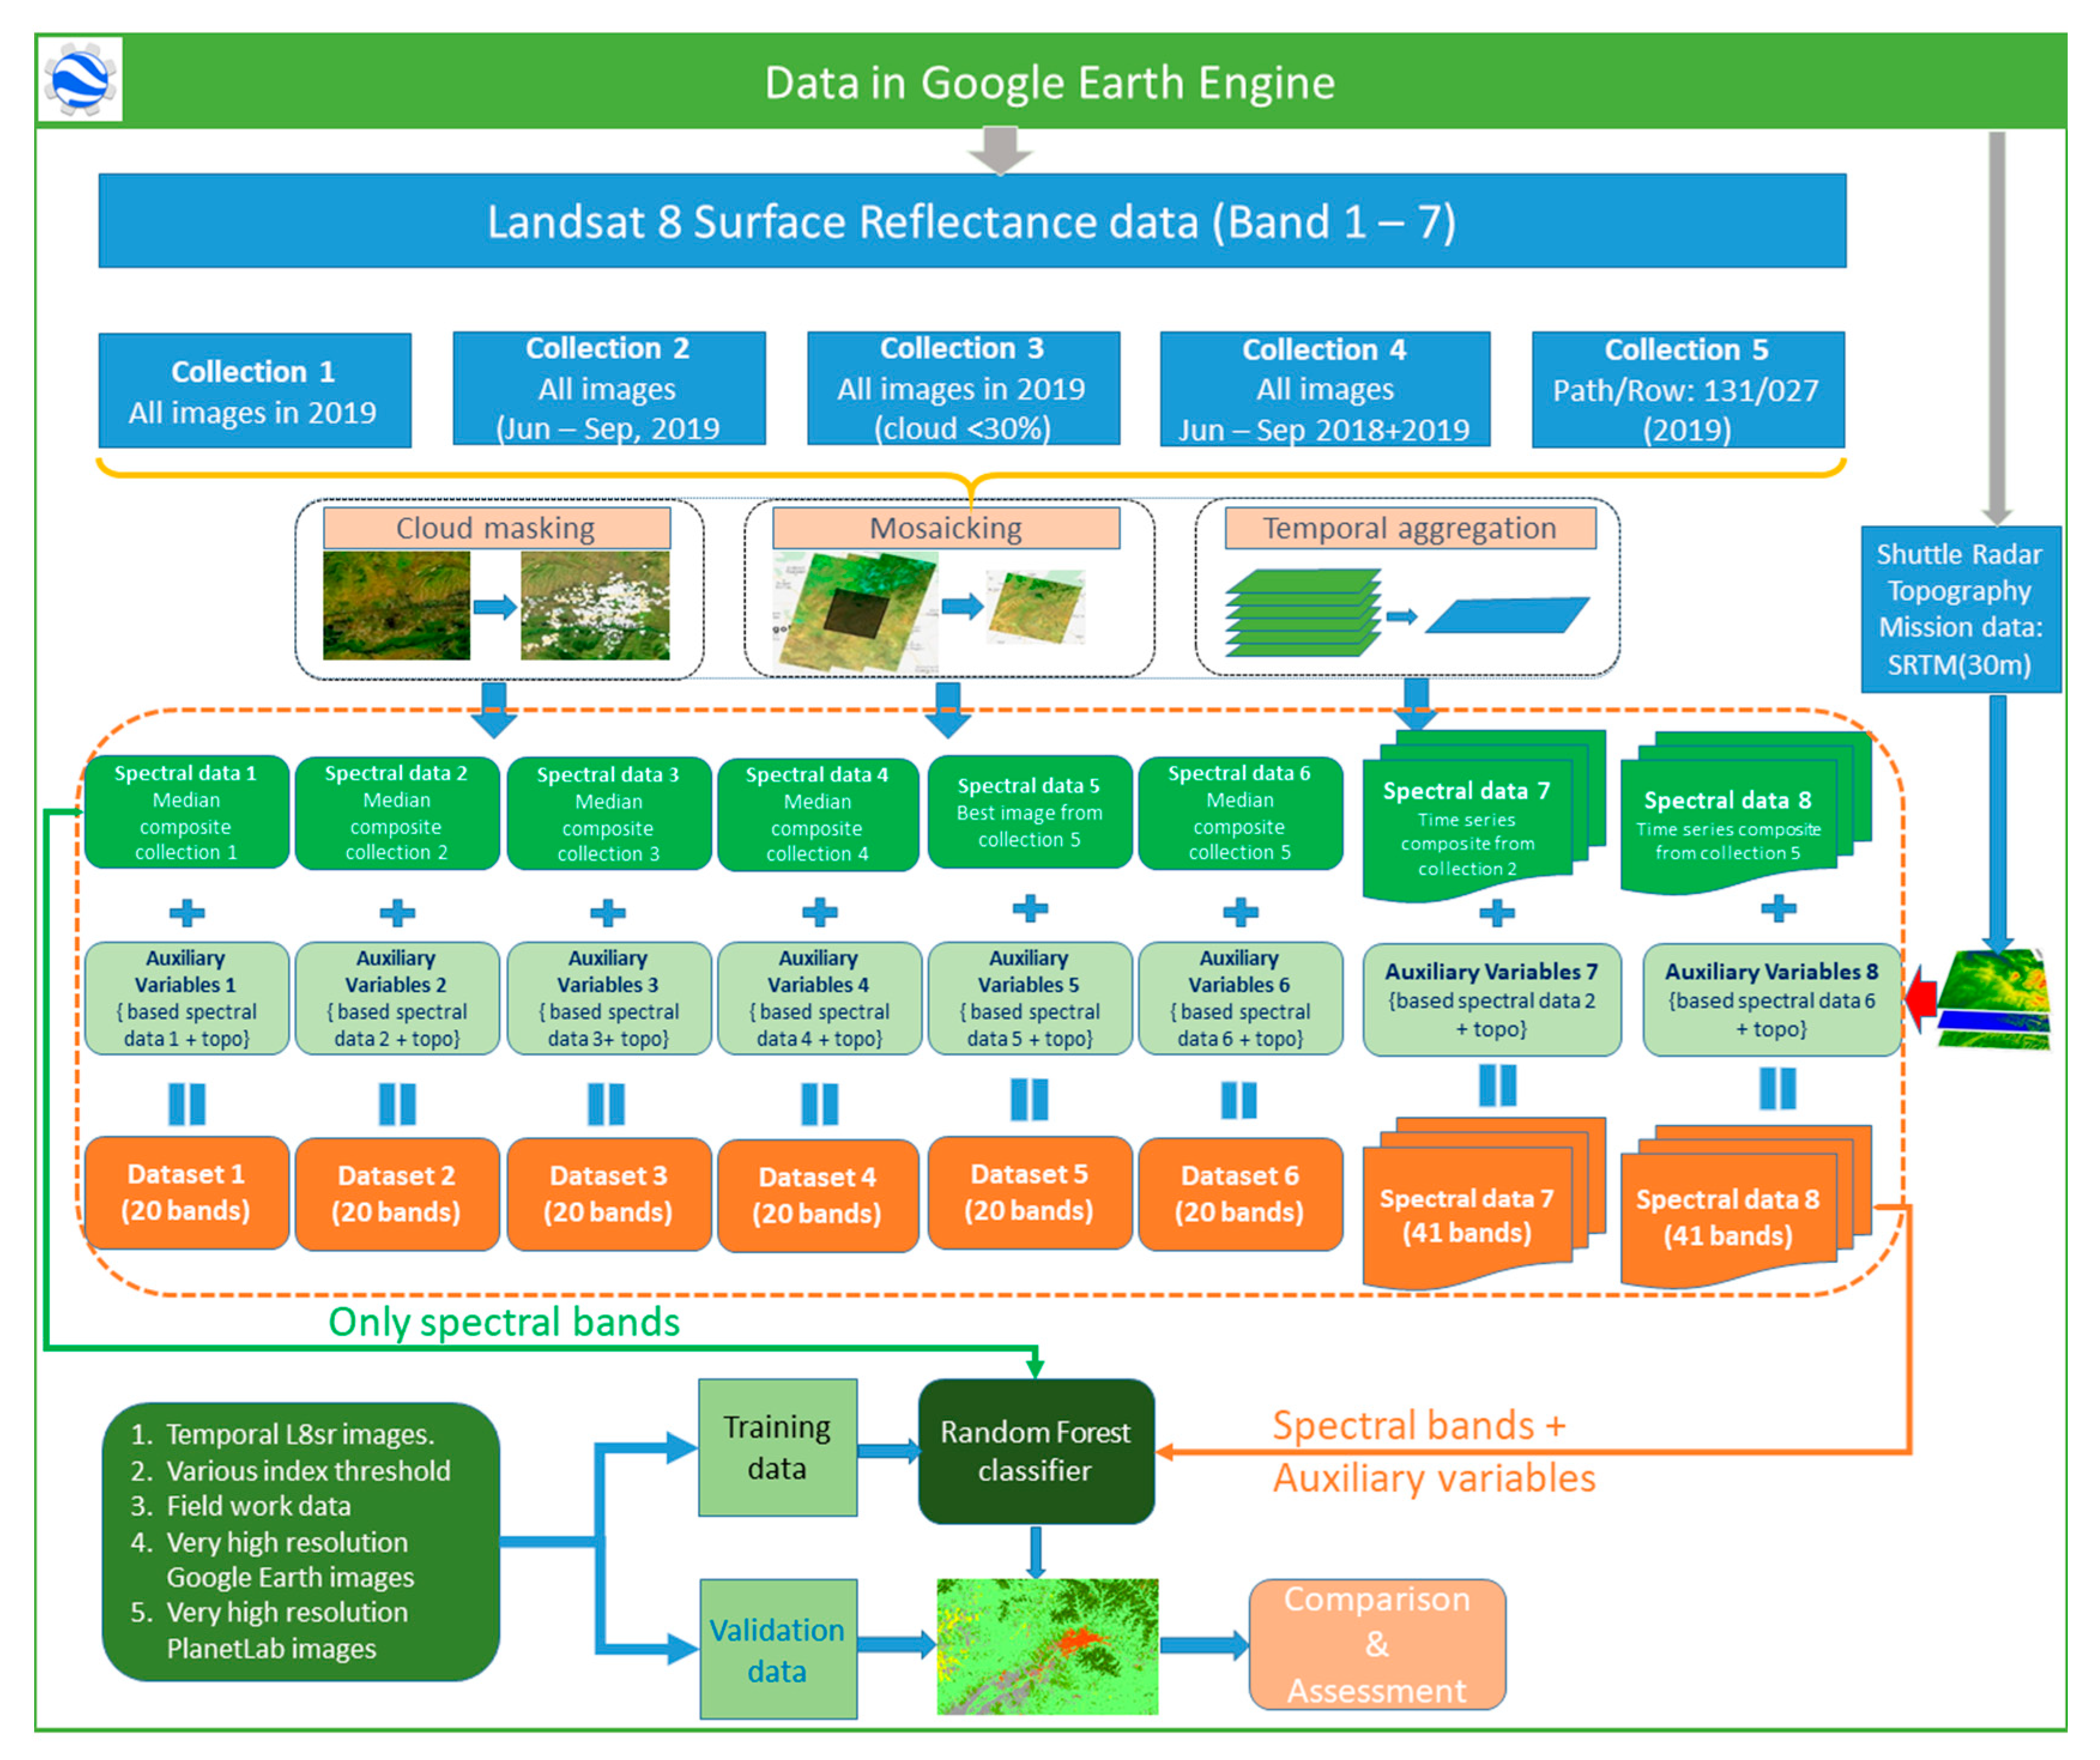
2.3. Methods
2.4. Random Forest Classifier
2.5. Accuracy Assessment, Comparison and Statistical Testing
2.6. Effects of Differences Among Classifications on the Spatial Estimation of Land Use Classes
3. Results
3.1. Overall Accuracy of Different Datasets With and Without Auxiliary Variables
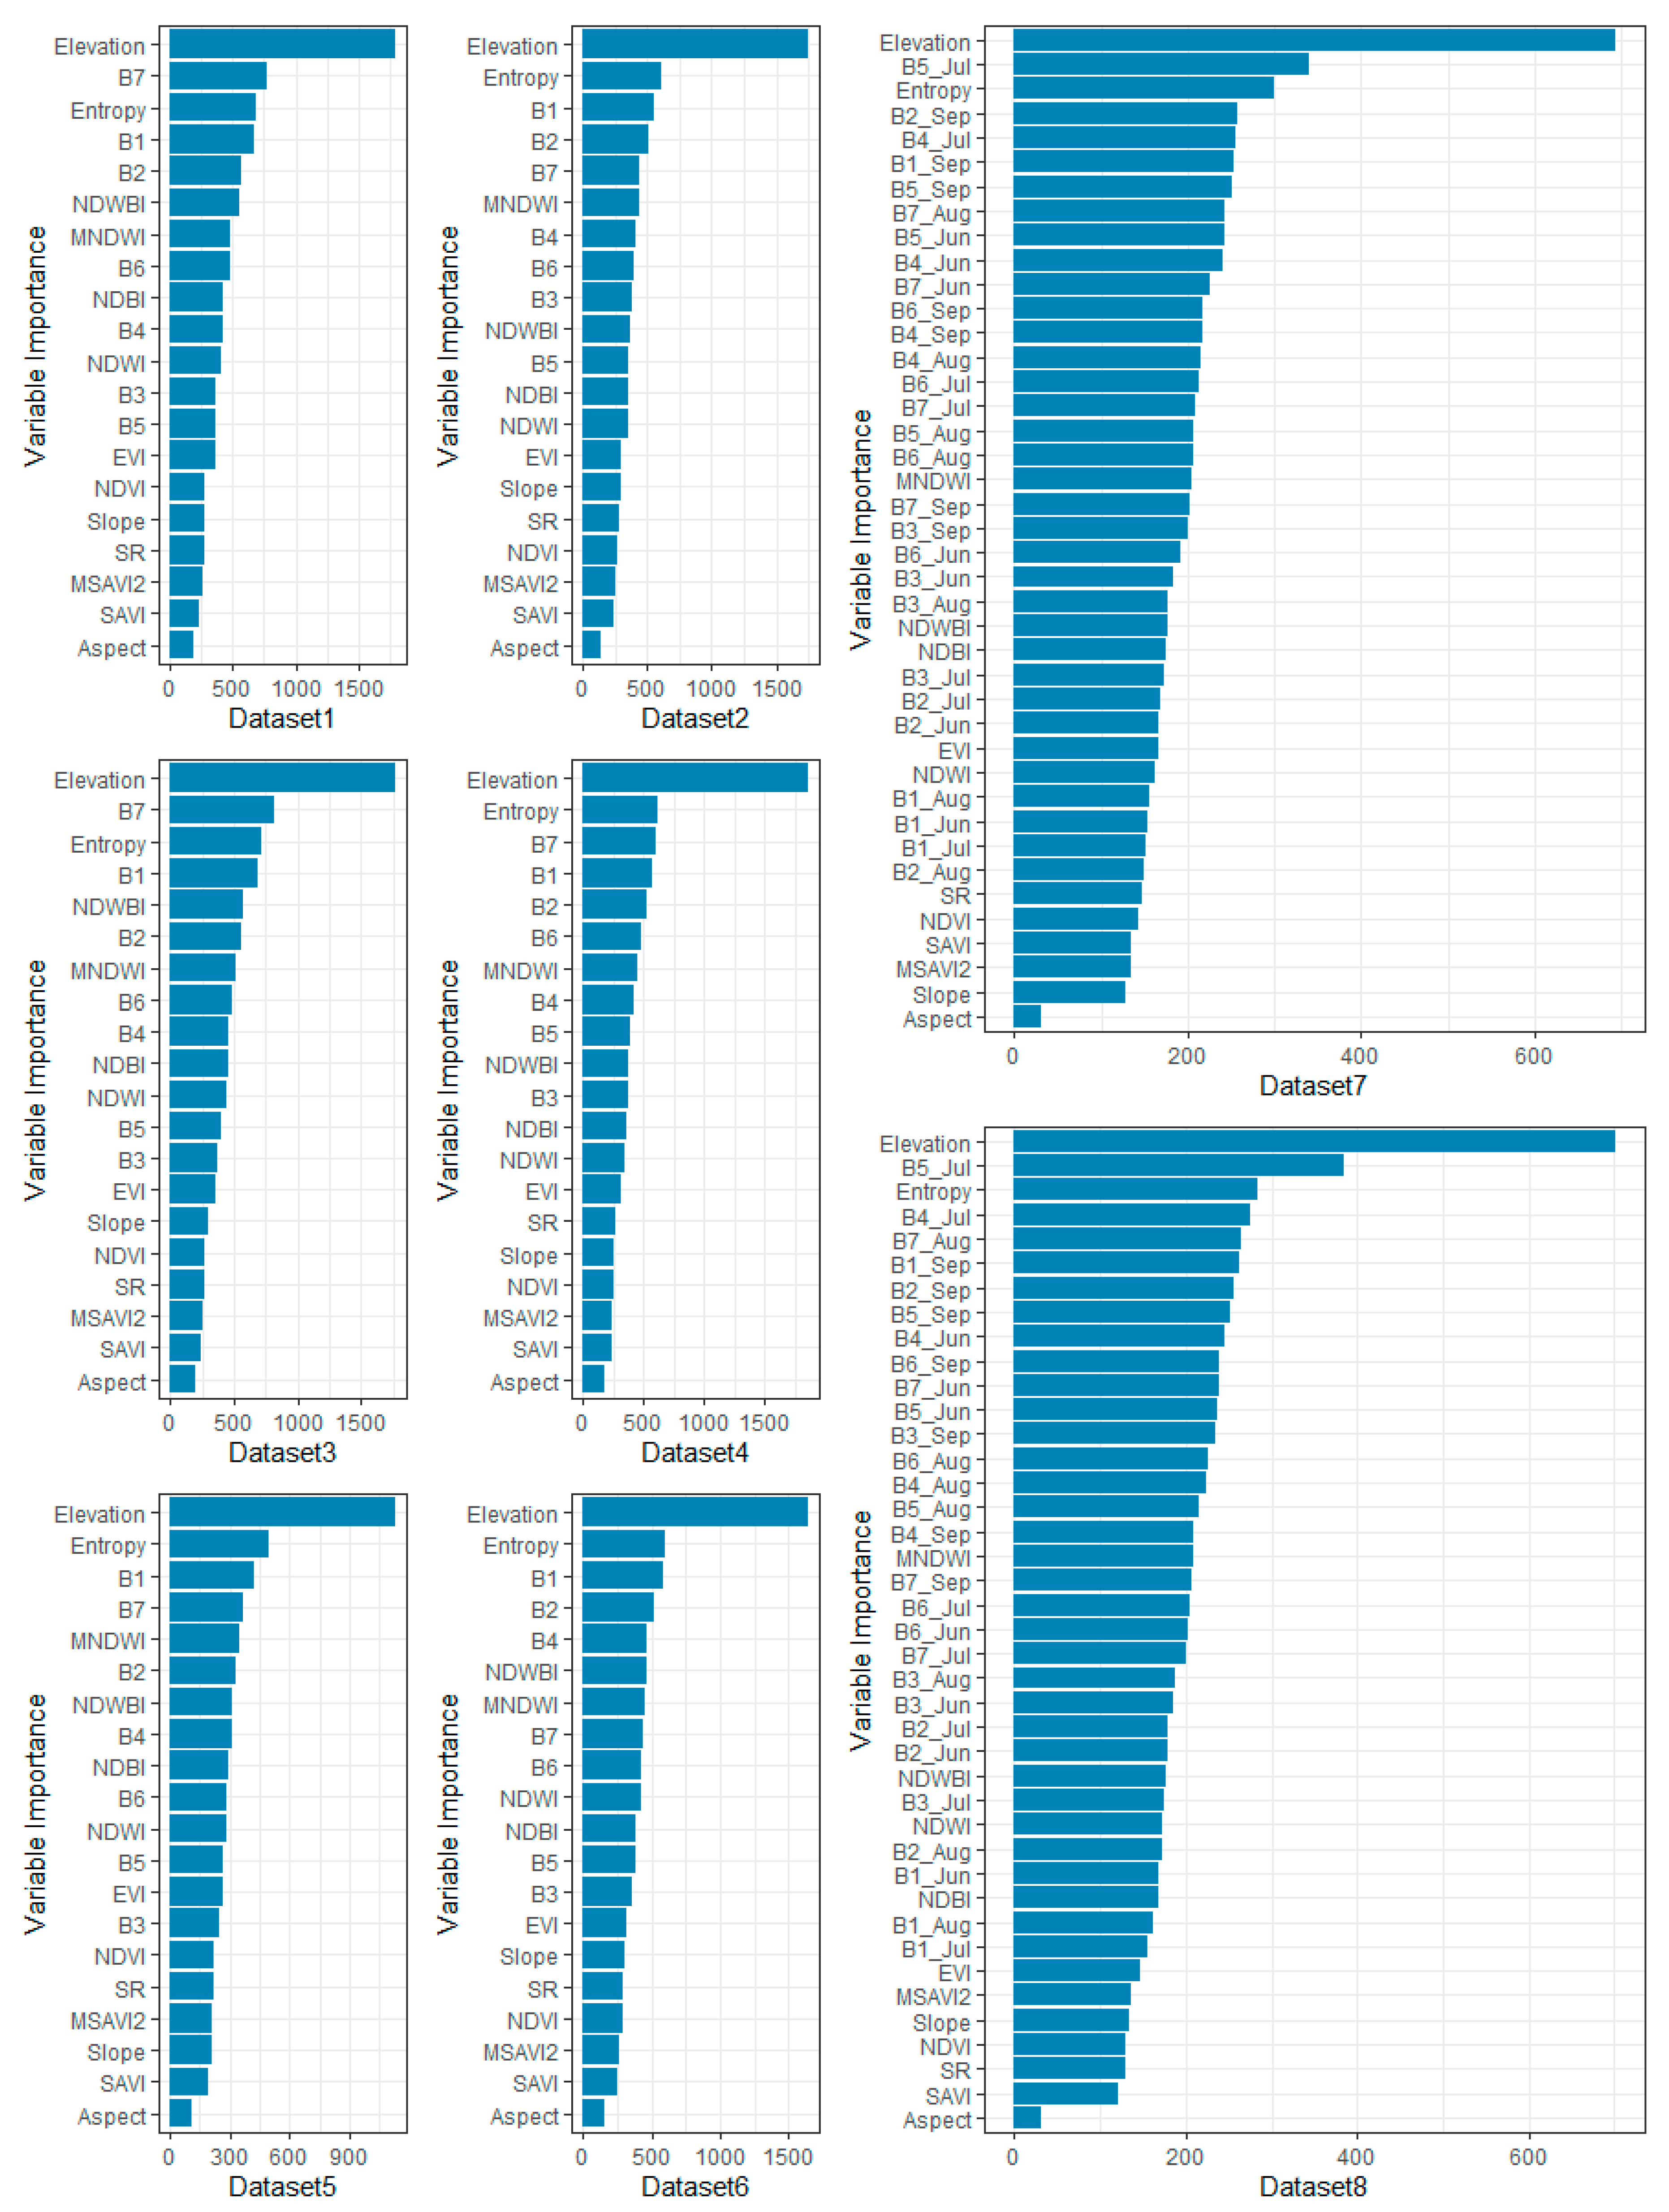
3.2. The Effect of Different Composition Datasets on Land Cover Classification Accuracy
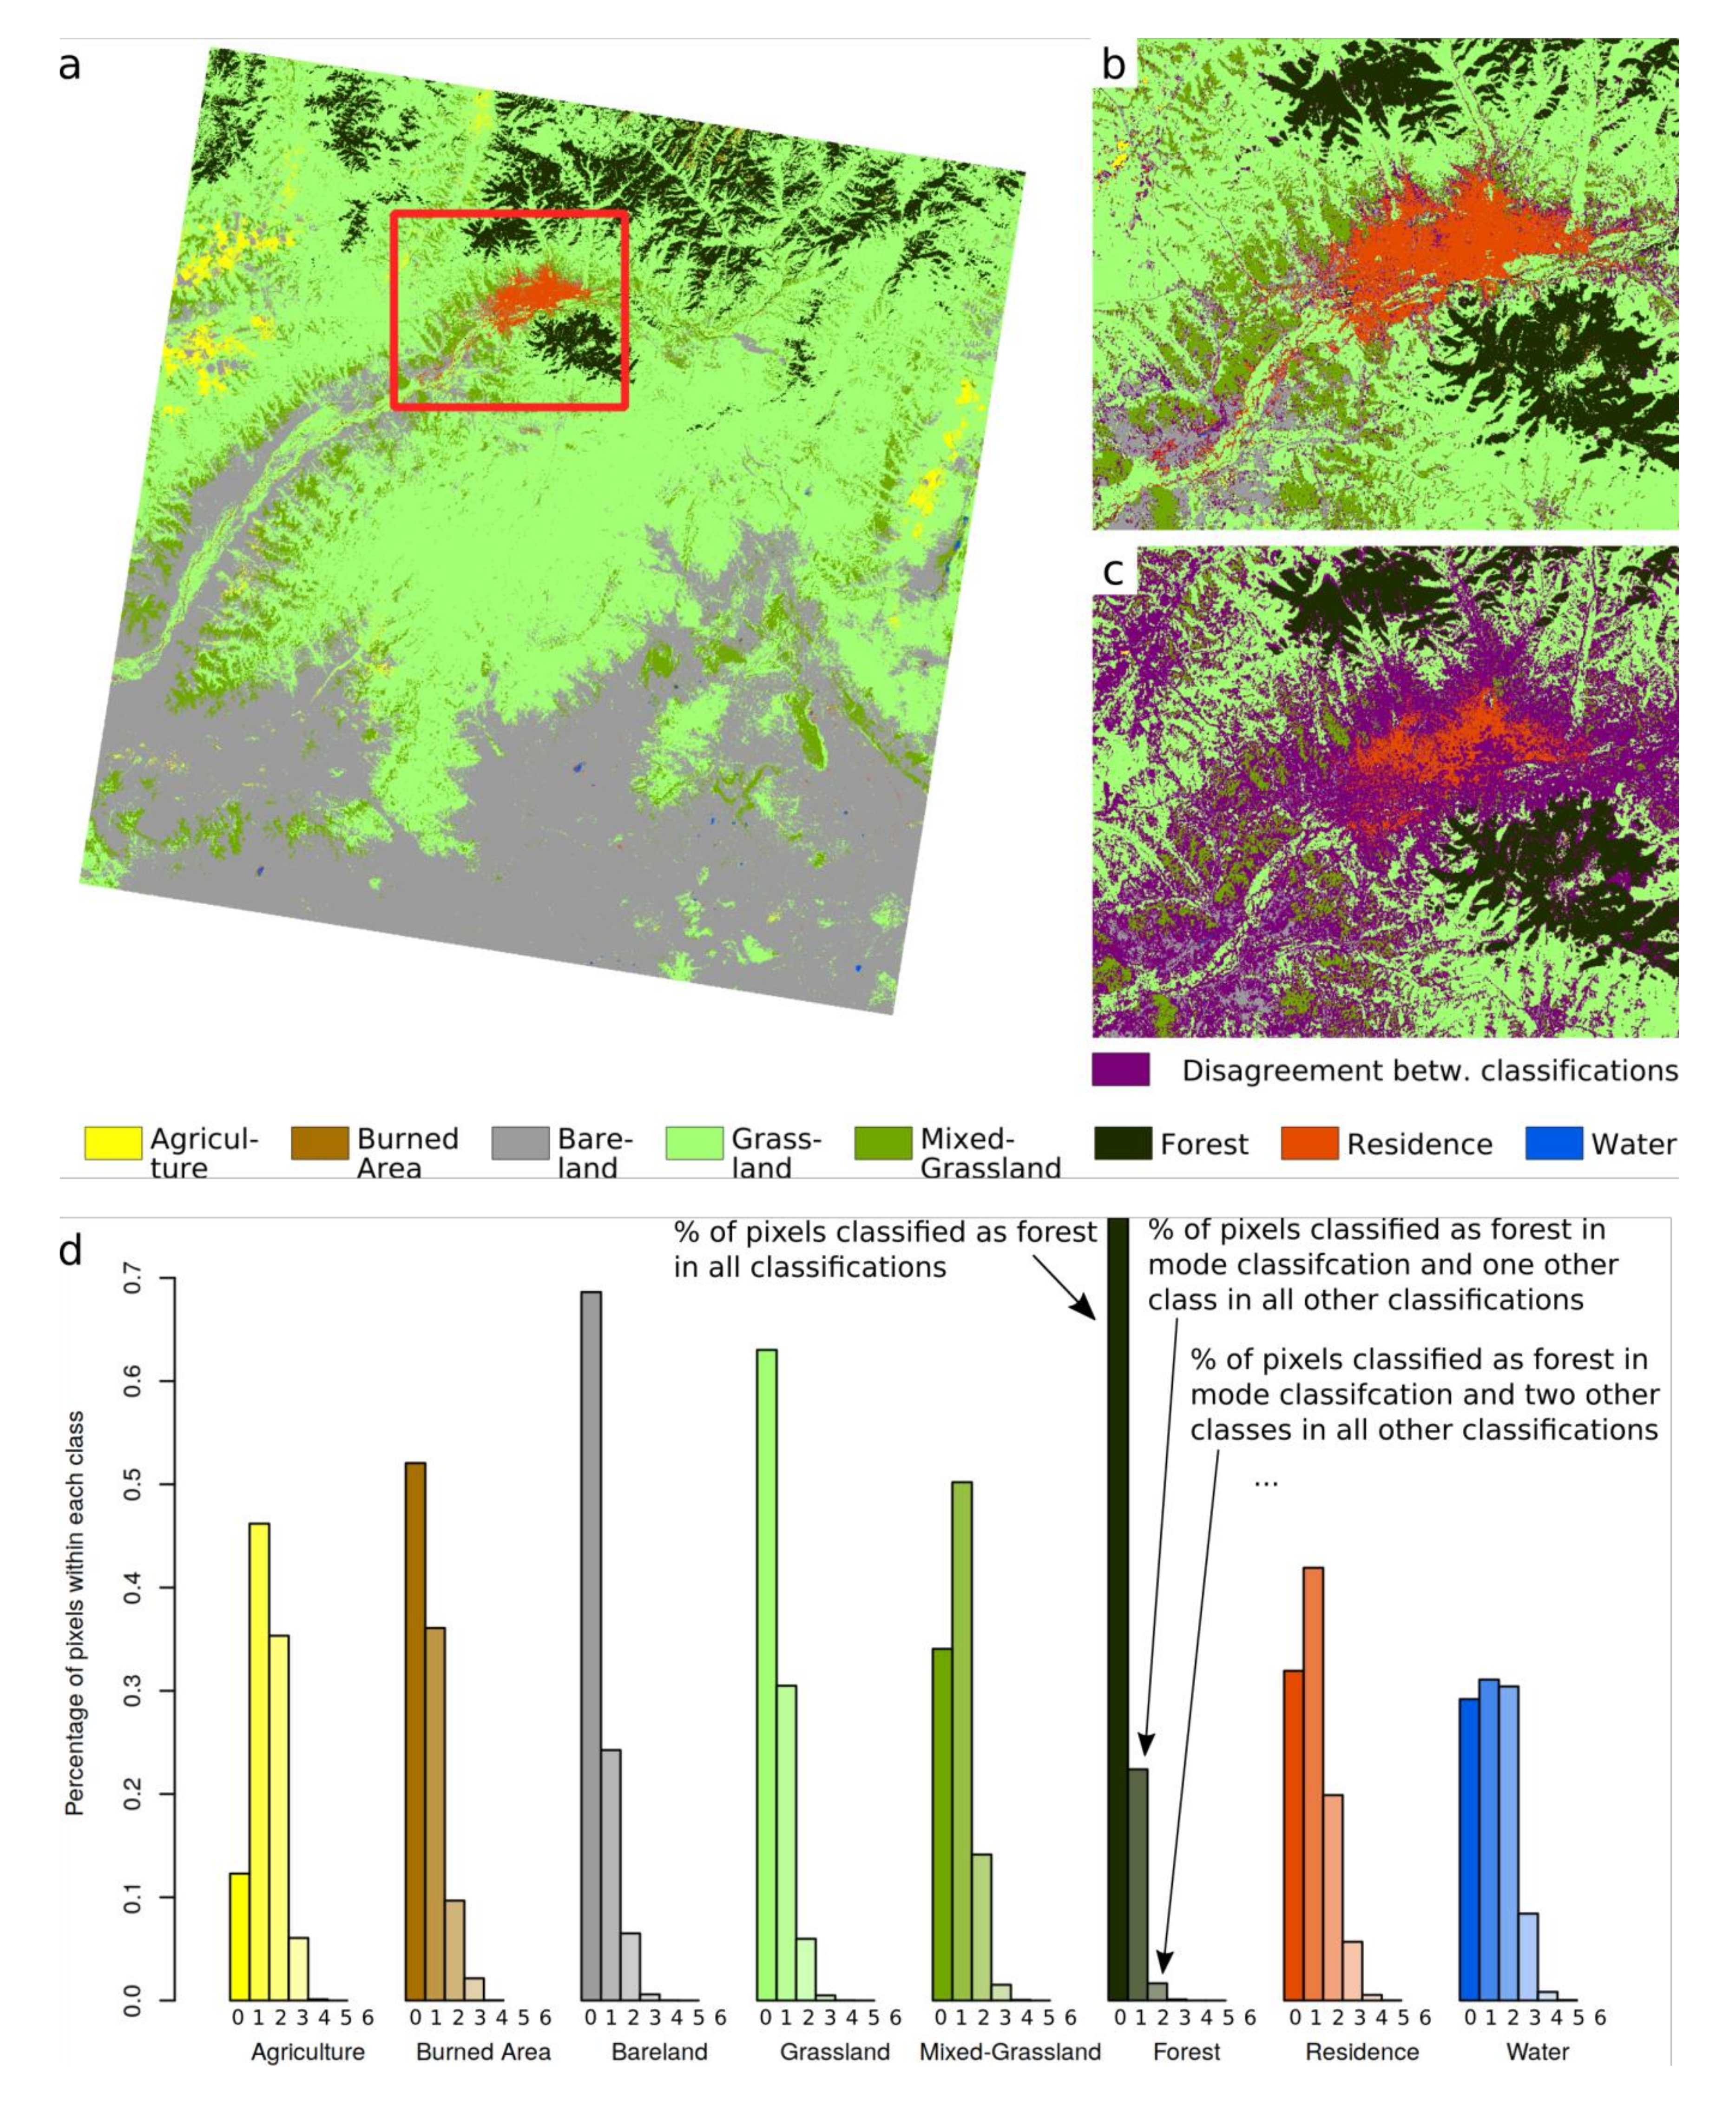
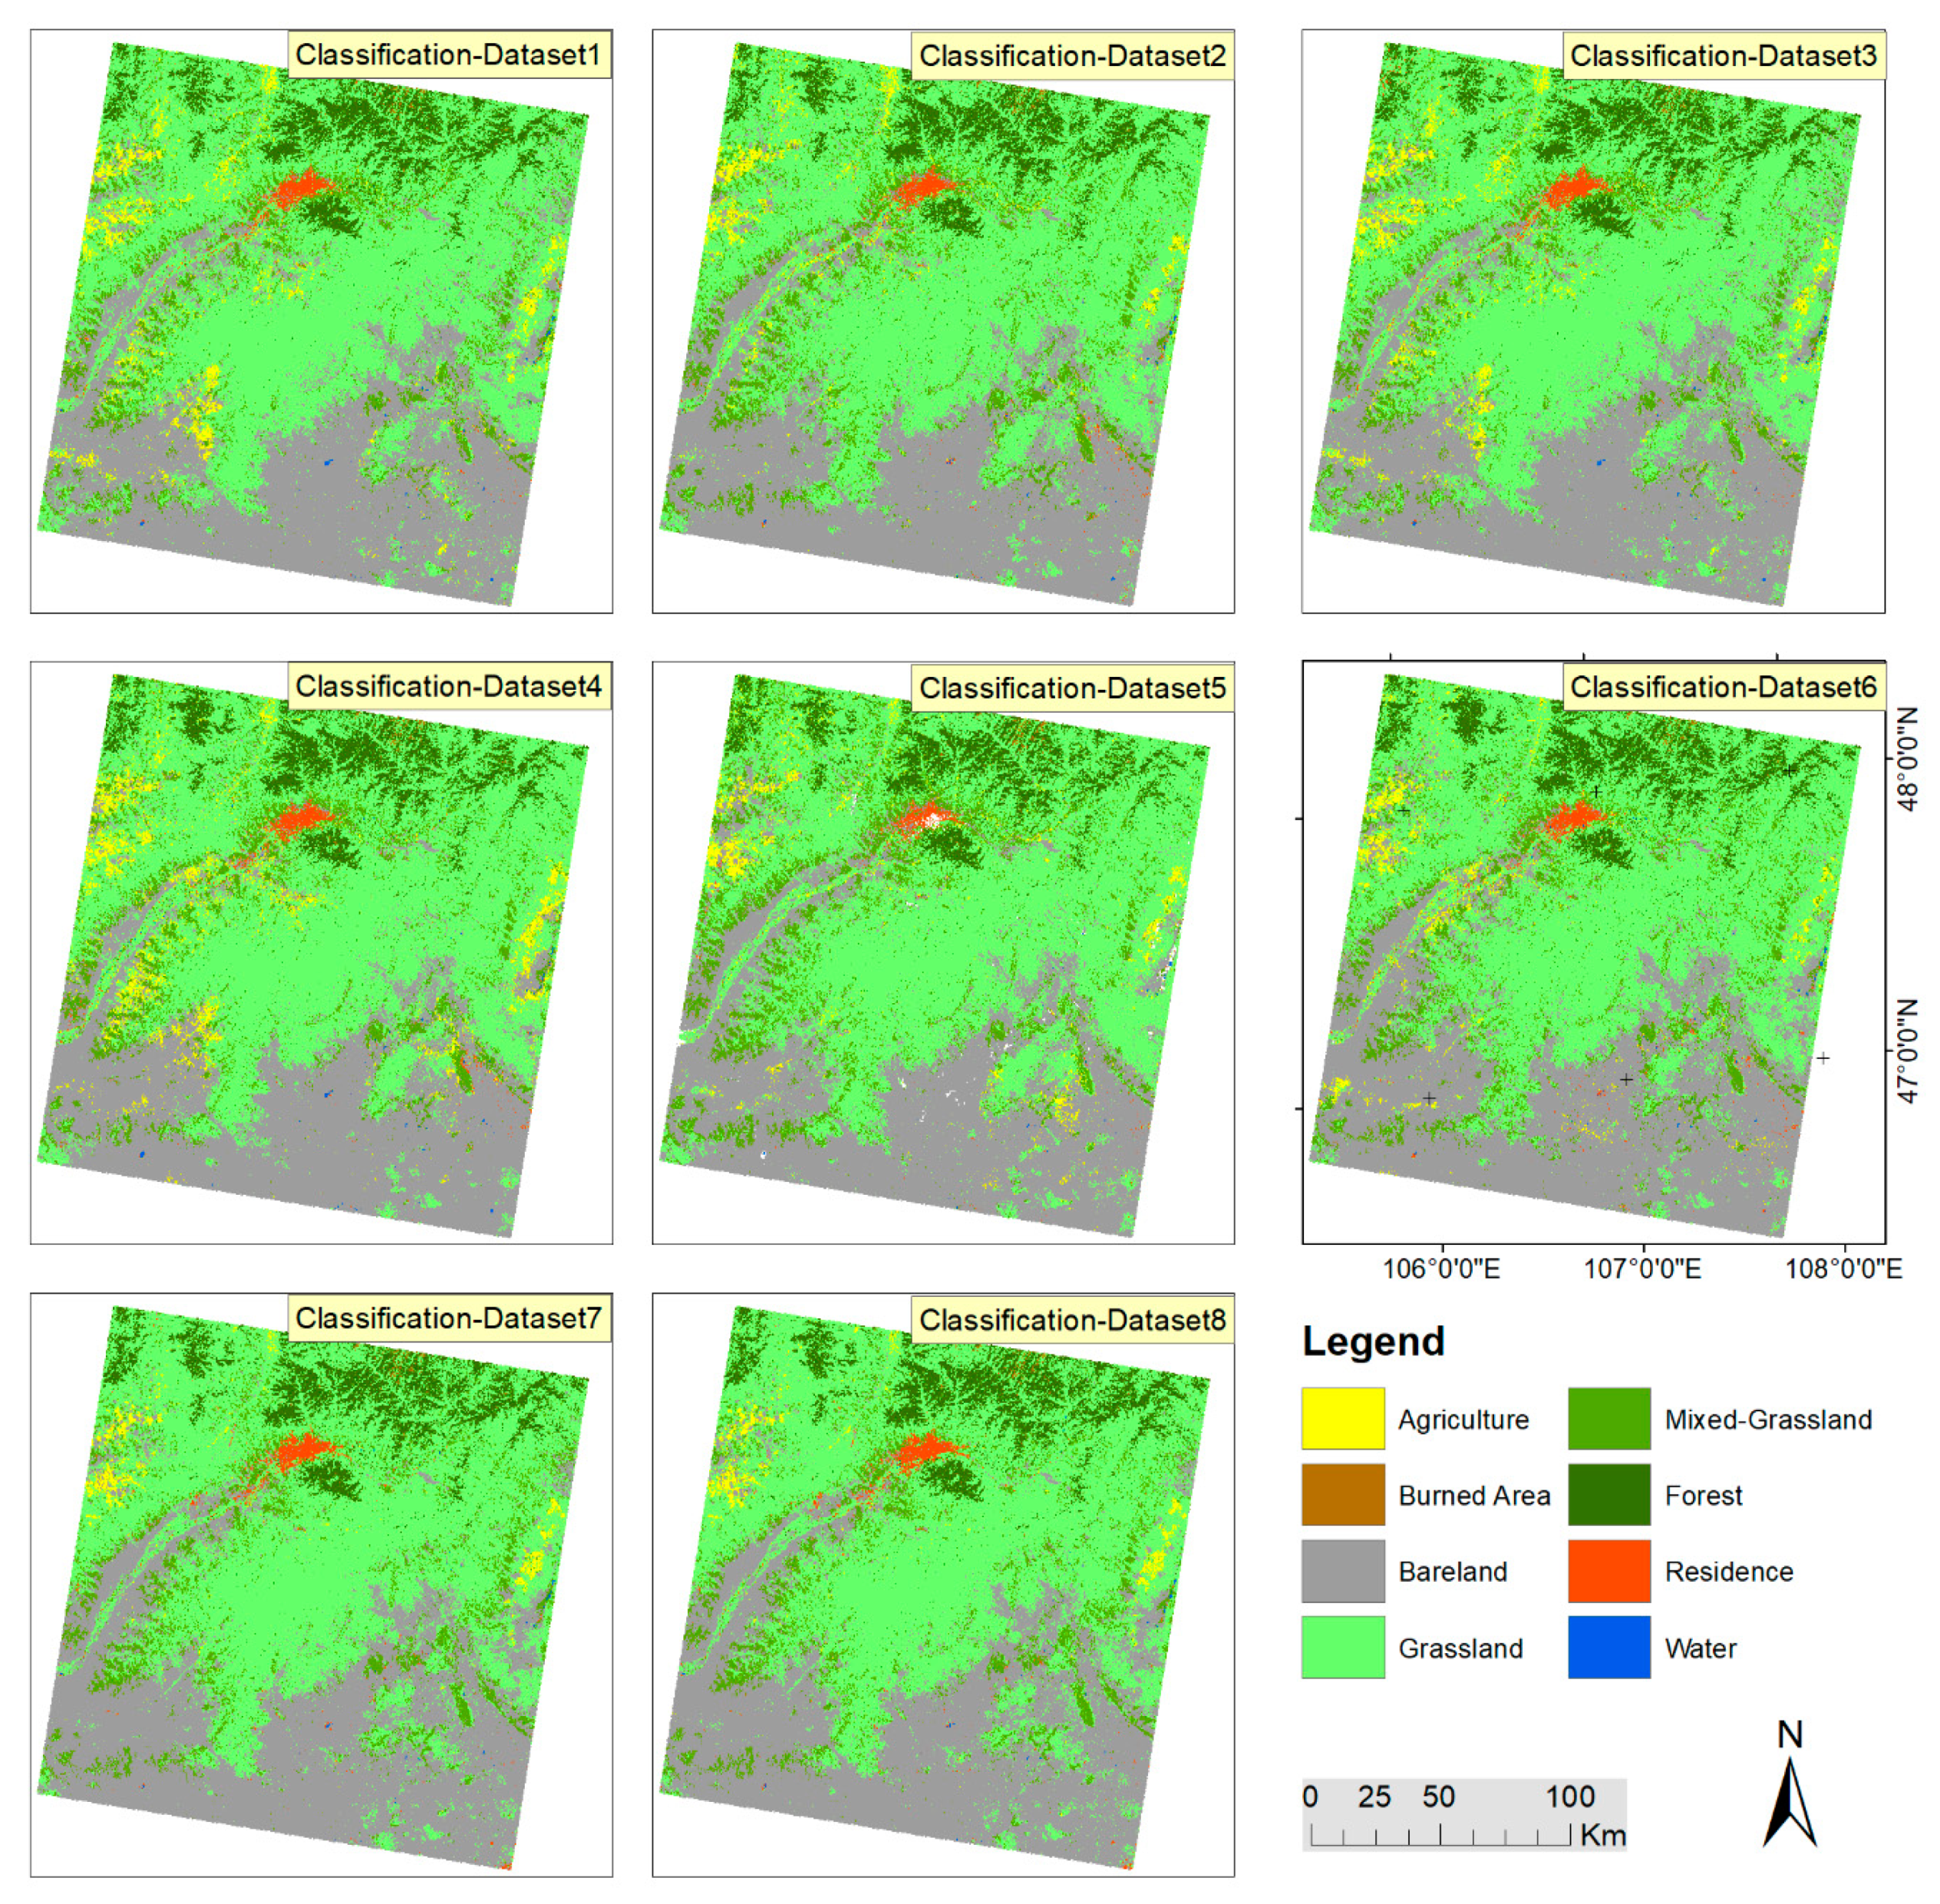
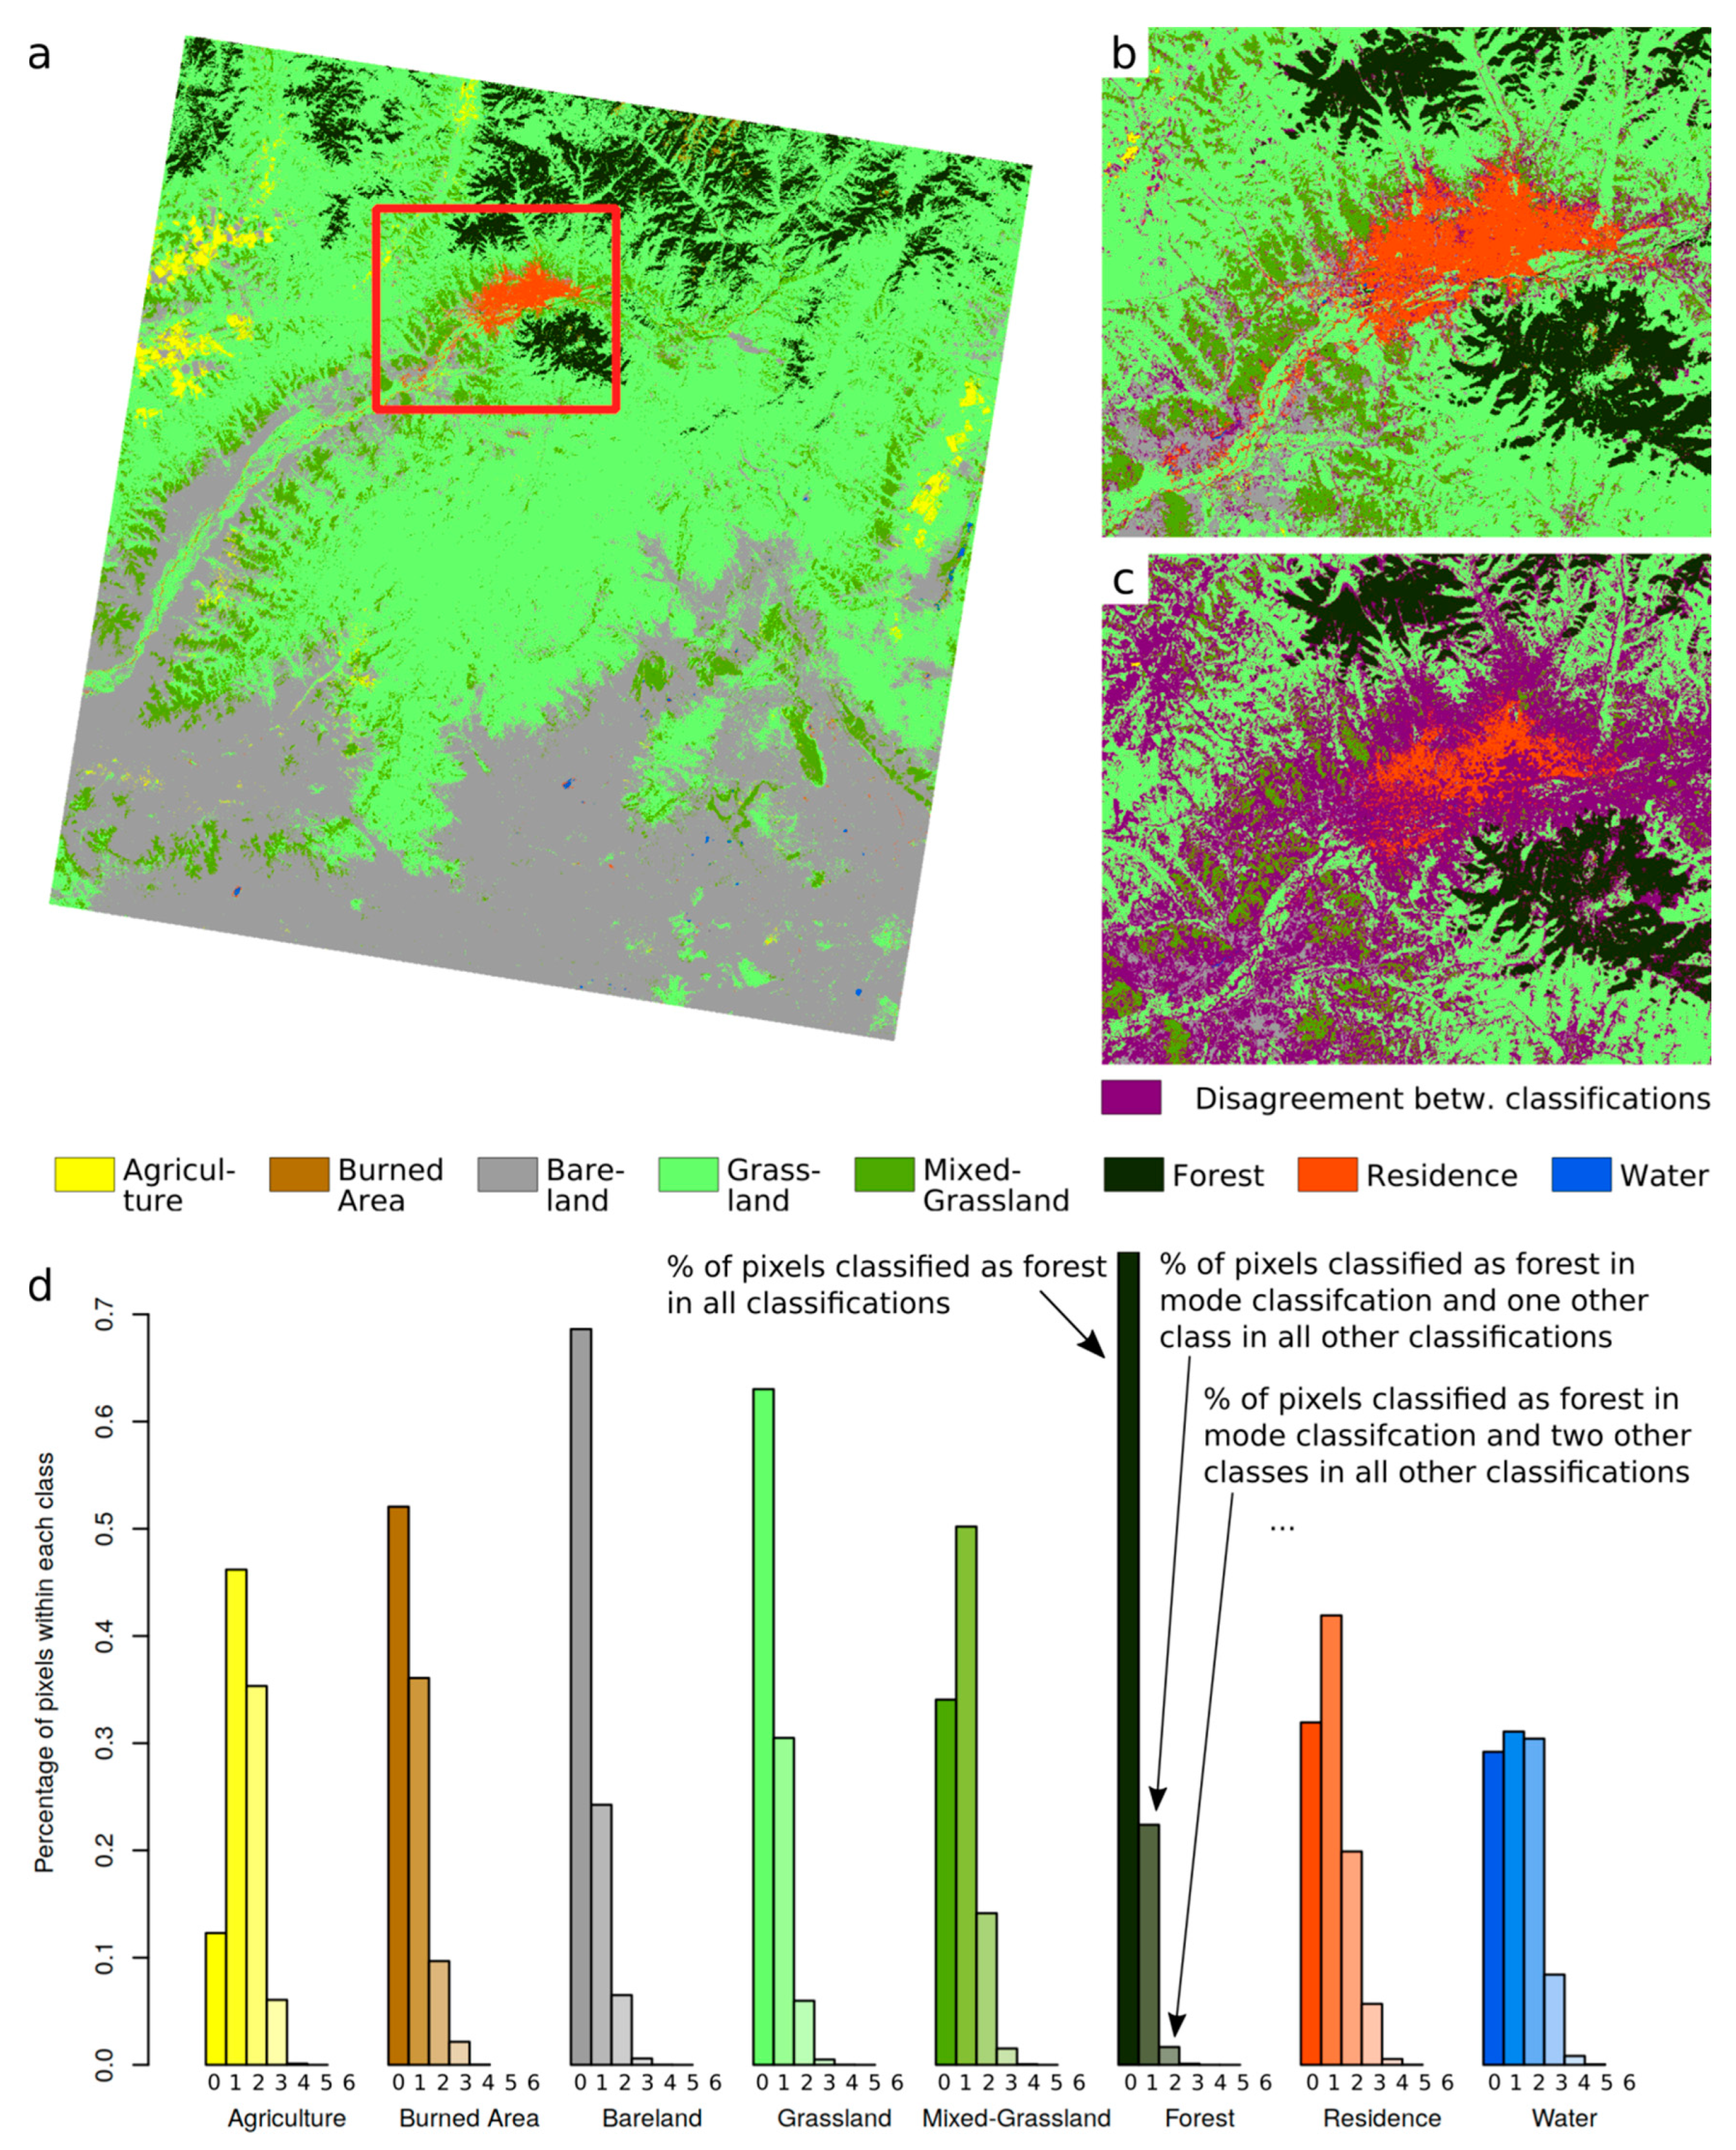
3.3. Variation of Land Cover Types Derived from Different Datasets
4. Discussion
5. Conclusions
Author Contributions
Funding
Acknowledgments
Conflicts of Interest
Appendix A

| Index | Formula | References |
|---|---|---|
| NDVI | (NIR − RED)/(NIR + RED) | Rouse et al. [88] |
| EVI | 2.5 * ((NIR − RED)/(NIR + 6 * RED − 7.5 * BLUE + 1)) | Liu & Huete [89] |
| SAVI | (NIR − RED)/(NIR + RED + 0.5) * (1.5) | Huete [90] |
| MSAVI2 | (2 * NIR + 1 − SQRT((2 * NIR + 1)2 − 8 * (NIR − RED)))/2 | Qi et al. [91] |
| NDWI | (NIR − SWIR)/(NIR + SWIR) | Gao [92] |
| mNDWI | (GREEN − SWIR)/(GREEN + SWIR) | Xu [93] |
| NDWBI | (GREEN − NIR)/(GREEN + NIR) | McFeeters [94] |
| NDBI | (SWIR − NIR)/(SWIR + NIR) | Zha et al. [86] |
| SR | NIR/RED | Birth & McVey [95] |
| Entropy | entropy of the NIR band were selected from the 4 × 4local window | Jia et al. [96] |

References
- Herold, M. Assessment of the Status of the Development of the Standards for the Terrestrial Essential Climate Variables. In Land. Land Cover; FAO: Rome, Italy, 2009. [Google Scholar]
- Koschke, L.; Fürst, C.; Frank, S.; Makeschin, F. A multi-criteria approach for an integrated land-cover-based assessment of ecosystem services provision to support landscape planning. Ecol. Indic. 2012, 21, 54–66. [Google Scholar] [CrossRef]
- Sterling, S.M.; Ducharne, A.; Polcher, J. The impact of global land-cover change on the terrestrial water cycle. Nat. Clim. Chang. 2012, 3, 385–390. [Google Scholar] [CrossRef]
- Salazar, A.; Baldi, G.; Hirota, M.; Syktus, J.; McAlpine, C. Land use and land cover change impacts on the regional climate of non-Amazonian South America: A review. Glob. Planet. Chang. 2015, 128, 103–119. [Google Scholar] [CrossRef]
- Niquisse, S.; Cabral, P.; Rodrigues, Â.; Augusto, G. Ecosystem services and biodiversity trends in Mozambique as a consequence of land cover change. Int. J. Biodivers. Sci. Ecosyst. Serv. Manag. 2017, 13, 297–311. [Google Scholar] [CrossRef] [Green Version]
- Beer, C.; Reichstein, M.; Tomelleri, E.; Ciais, P.; Jung, M.; Carvalhais, N.; Rodenbeck, C.; Arain, M.A.; Baldocchi, D.; Bonan, G.B.; et al. Terrestrial gross carbon dioxide uptake: Global distribution and covariation with climate. Science 2010, 329, 834–838. [Google Scholar] [CrossRef] [Green Version]
- Pan, Y.; Birdsey, R.A.; Fang, J.; Houghton, R.; Kauppi, P.E.; Kurz, W.A.; Phillips, O.L.; Shvidenko, A.; Lewis, S.L.; Canadell, J.G.; et al. A large and persistent carbon sink in the world’s forests. Science 2011, 333, 988–993. [Google Scholar] [CrossRef] [Green Version]
- Reichstein, M.; Bahn, M.; Ciais, P.; Frank, D.; Mahecha, M.D.; Seneviratne, S.I.; Zscheischler, J.; Beer, C.; Buchmann, N.; Frank, D.C.; et al. Climate extremes and the carbon cycle. Nature 2013, 500, 287–295. [Google Scholar] [CrossRef]
- Ahlström, A.; Xia, J.; Arneth, A.; Luo, Y.; Smith, B. Importance of vegetation dynamics for future terrestrial carbon cycling. Environ. Res. Lett. 2015, 10. [Google Scholar] [CrossRef]
- Bengtsson, J.; Bullock, J.M.; Egoh, B.; Everson, T.; O’Connor, T.; O’Farrell, P.J.; Smith, H.G.; Lindborg, R. Grasslands—more important for ecosystem services than you might think. Ecosphere 2019, 10, e02582. [Google Scholar] [CrossRef]
- Fernández-Giménez, M.E.; Batkhishig, B.; Batbuyan, B. Cross-boundary and cross-level dynamics increase vulnerability to severe winter disasters (dzud) in Mongolia. Glob. Environ. Chang. 2012, 22, 836–851. [Google Scholar] [CrossRef]
- Reid, R.S.; Fernández-Giménez, M.E.; Galvin, K.A. Dynamics and Resilience of Rangelands and Pastoral Peoples around the Globe. Annu. Rev. Environ. Resour. 2014, 39, 217–242. [Google Scholar] [CrossRef]
- Khishigbayar, J.; Fernández-Giménez, M.E.; Angerer, J.P.; Reid, R.S.; Chantsallkham, J.; Baasandorj, Y.; Zumberelmaa, D. Mongolian rangelands at a tipping point? Biomass and cover are stable but composition shifts and richness declines after 20 years of grazing and increasing temperatures. J. Arid Environ. 2015, 115, 100–112. [Google Scholar] [CrossRef]
- Fernández-Giménez, M.E.; Venable, N.H.; Angerer, J.; Fassnacht, S.R.; Reid, R.S.; Khishigbayar, J. Exploring linked ecological and cultural tipping points in Mongolia. Anthropocene 2017, 17, 46–69. [Google Scholar] [CrossRef]
- Dashpurev, B.; Bendix, J.; Lehnert, L. Monitoring Oil Exploitation Infrastructure and Dirt Roads with Object-Based Image Analysis and Random Forest in the Eastern Mongolian Steppe. Remote Sens. 2020, 12, 144. [Google Scholar] [CrossRef] [Green Version]
- McNaughton, S.J. Grazing as an optimization process: Grass-ungulate relationships in the Serengeti. Am. Nat. 1979, 113, 691–703. [Google Scholar] [CrossRef]
- Tilman, D.; Wedin, D.; Knops, J. Productivity and sustainability influenced by biodiversity in grassland ecosystems. Nature 1996, 379, 718–720. [Google Scholar] [CrossRef]
- Tilman, D.; Reich, P.B.; Knops, J.; Wedin, D.; Mielke, T.; Lehman, C. Diversity and productivity in a long-term grassland experiment. Science 2001, 294, 843–845. [Google Scholar] [CrossRef] [PubMed] [Green Version]
- Jacobs, S.M.; Naiman, R.J. Large African herbivores decrease herbaceous plant biomass while increasing plant species richness in a semi-arid savanna toposequence. J. Arid Environ. 2008, 72, 891–903. [Google Scholar] [CrossRef]
- Leisher, C.; Hess, S.; Boucher, T.M.; Beukering, P.; Sanjayan, M. Measuring the impacts of community-based grasslands management in Mongolia’s Gobi. PLoS ONE 2012, 7, e30991. [Google Scholar] [CrossRef]
- Skole, D.S.; Justice, C.O.; Janetos, A.; Townshend, J.R.G. A land cover change monitoring program: A strategy for international effort. In Mitigation and Adaptation Strategies for Global Change; Kluwer: Amsterdam, The Netherlands, 1997; pp. 1–19. [Google Scholar]
- Lautenbacher, C.C. The Global Earth Observation System of Systems: Science Serving Society. Space Policy 2006, 22, 8–11. [Google Scholar] [CrossRef]
- Bontemps, S.; Herold, M.; Kooistra, L.; van Groenestijn, A.; Hartley, A.; Arino, O.; Moreau, I.; Defourny, P. Revisiting land cover observation to address the needs of the climate modeling community. Biogeosciences 2012, 9, 2145–2157. [Google Scholar] [CrossRef] [Green Version]
- Roy, D.P.; Wulder, M.A.; Loveland, T.R.; Woodcock, C.E.; Allen, R.G.; Anderson, M.C.; Helder, D.; Irons, J.R.; Johnson, D.M.; Kennedy, R.; et al. Landsat-8: Science and product vision for terrestrial global change research. Remote Sens. Environ. 2014, 145, 154–172. [Google Scholar] [CrossRef] [Green Version]
- Li, C.; Gong, P.; Wang, J.; Zhu, Z.; Biging, G.S.; Yuan, C.; Hu, T.; Zhang, H.; Wang, Q.; Li, X. The first all-season sample set for mapping global land cover with Landsat-8 data. Sci. Bull. 2017, 7, 508–515. [Google Scholar] [CrossRef] [Green Version]
- Wulder, M.A.; White, J.C.; Loveland, T.R.; Woodcock, C.E.; Belward, A.S.; Cohen, W.B.; Fosnight, E.A.; Shaw, J.; Masek, J.G.; Roy, D.P. The global Landsat archive: Status, consolidation and direction. Remote Sens. Environ. 2016, 185, 271–283. [Google Scholar] [CrossRef] [Green Version]
- Disperati, L.; Virdis, S.G.P. Assessment of land-use and land-cover changes from 1965 to 2014 in Tam Giang-Cau Hai Lagoon, central Vietnam. Appl. Geogr. 2015, 58, 48–64. [Google Scholar] [CrossRef]
- Reiche, J.; Verbesselt, J.; Hoekman, D.; Herold, M. Fusing Landsat and SAR time series to detect deforestation in the tropics. Remote Sens. Environ. 2015, 156, 276–293. [Google Scholar] [CrossRef]
- Zhu, Z.; Woodcock, C.E.; Rogan, J.; Kellndorfer, J. Assessment of spectral, polarimetric, temporal and spatial dimensions for urban and peri-urban land cover classification using Landsat and SAR data. Remote Sens. Environ. 2012, 117, 72–82. [Google Scholar] [CrossRef]
- Wan, B.; Guo, Q.; Fang, F.; Su, Y.; Wang, R. Mapping US Urban Extents from MODIS Data Using One-Class Classification Method. Remote Sens. 2015, 7, 10143–10163. [Google Scholar] [CrossRef] [Green Version]
- Xin, Q.; Olofsson, P.; Zhu, Z.; Tan, B.; Woodcock, C.E. Toward near real-time monitoring of forest disturbance by fusion of MODIS and Landsat data. Remote Sens. Environ. 2013, 135, 234–247. [Google Scholar] [CrossRef]
- Thanh Noi, P.; Kappas, M. Comparison of Random Forest, k-Nearest Neighbor and Support Vector Machine Classifiers for Land Cover Classification Using Sentinel-2 Imagery. Sensors 2017, 18, 18. [Google Scholar] [CrossRef] [Green Version]
- Lambert, M.-J.; Traoré, P.C.S.; Blaes, X.; Baret, P.; Defourny, P. Estimating smallholder crops production at village level from Sentinel-2 time series in Mali’s cotton belt. Remote Sens. Environ. 2018, 216, 647–657. [Google Scholar] [CrossRef]
- Rapinel, S.; Mony, C.; Lecoq, L.; Clément, B.; Thomas, A.; Hubert-Moy, L. Evaluation of Sentinel-2 time-series for mapping floodplain grassland plant communities. Remote Sens. Environ. 2019, 223, 115–129. [Google Scholar] [CrossRef]
- Furberg, D.; Ban, Y.; Nascetti, A. Monitoring of Urbanization and Analysis of Environmental Impact in Stockholm with Sentinel-2A and SPOT-5 Multispectral Data. Remote Sens. 2019, 11, 2408. [Google Scholar] [CrossRef] [Green Version]
- Kuenzer, C.; Ottinger, M.; Wegmann, M.; Guo, H.; Wang, C.; Zhang, J.; Dech, S.; Wikelski, M. Earth observation satellite sensors for biodiversity monitoring: Potentials and bottlenecks. Inter. J. Remote Sens. 2014, 35, 6599–6647. [Google Scholar] [CrossRef] [Green Version]
- Mack, B.; Leinenkugel, P.; Kuenzer, C.; Dech, S. A semi-automated approach for the generation of a new land use and land cover product for Germany based on Landsat time-series and Lucas in-situ data. Remote Sens. Lett. 2017, 8, 244–253. [Google Scholar] [CrossRef]
- Wulder, M.A.; White, J.C.; Goward, S.N.; Masek, J.G.; Irons, J.R.; Herold, M.; Cohen, W.B.; Loveland, T.R.; Woodcock, C.E. Landsat continuity: Issues and opportunities for land cover monitoring. Remote Sens. Environ. 2008, 112, 955–969. [Google Scholar] [CrossRef]
- Carrasco, L.; O’Neil, A.; Morton, R.; Rowland, C. Evaluating Combinations of Temporally Aggregated Sentinel-1, Sentinel-2 and Landsat 8 for Land Cover Mapping with Google Earth Engine. Remote Sens. 2019, 11, 288. [Google Scholar] [CrossRef] [Green Version]
- Gorelick, N.; Hancher, M.; Dixon, M.; Ilyushchenko, S.; Thau, D.; Moore, R. Google Earth Engine: Planetary-scale geospatial analysis for everyone. Remote Sens. Environ. 2017, 202, 18–27. [Google Scholar] [CrossRef]
- Tamiminia, H.; Salehi, B.; Mahdianpari, M.; Quackenbush, L.; Adeli, S.; Brisco, B. Google Earth Engine for geo-big data applications: A meta-analysis and systematic review. ISPRS J. Photogramm. Remote Sens. 2020, 164, 152–170. [Google Scholar] [CrossRef]
- Kumar, L.; Mutanga, O. Remote Sensing of Above-Ground Biomass. Remote Sens. 2017, 9, 935. [Google Scholar] [CrossRef] [Green Version]
- Beckschäfer, P. Obtaining rubber plantation age information from very dense Landsat TM & ETM + time series data and pixel-based image compositing. Remote Sens. Environ. 2017, 196, 89–100. [Google Scholar] [CrossRef]
- E Nyland, K.; EGunn, G.; IShiklomanov, N.; NEngstrom, R.; AStreletskiy, D. Land Cover Change in the Lower Yenisei River Using Dense Stacking of Landsat Imagery in Google Earth Engine. Remote Sens. 2018, 10, 1226. [Google Scholar] [CrossRef] [Green Version]
- Xie, S.; Liu, L.; Zhang, X.; Yang, J.; Chen, X.; Gao, Y. Automatic Land-Cover Mapping using Landsat Time-Series Data based on Google Earth Engine. Remote Sens. 2019, 11, 3023. [Google Scholar] [CrossRef] [Green Version]
- Hu, Y.; Hu, Y. Land Cover Changes and Their Driving Mechanisms in Central Asia from 2001 to 2017 Supported by Google Earth Engine. Remote Sens. 2019, 11, 554. [Google Scholar] [CrossRef] [Green Version]
- Richards, D.R.; Belcher, R.N. Global Changes in Urban Vegetation Cover. Remote Sens. 2019, 12, 23. [Google Scholar] [CrossRef] [Green Version]
- Griffiths, P.; van der Linden, S.; Kuemmerle, T.; Hostert, P. A Pixel-Based Landsat Compositing Algorithm for Large Area Land Cover Mapping. IEEE J. Sel. Top. Appl. Earth Obs. Remote Sens. 2013, 6, 2088–2101. [Google Scholar] [CrossRef]
- Zhu, Z.; Woodcock, C.E. Continuous change detection and classification of land cover using all available Landsat data. Remote Sens. Environ. 2014, 144, 152–171. [Google Scholar] [CrossRef] [Green Version]
- Hermosilla, T.; Wulder, M.A.; White, J.C.; Coops, N.C.; Hobart, G.W. Disturbance-Informed Annual Land Cover Classification Maps of Canada’s Forested Ecosystems for a 29-Year Landsat Time Series. Can. J. Remote Sens. 2018, 44, 67–87. [Google Scholar] [CrossRef]
- Roy, D.P.; Kovalskyy, V.; Zhang, H.K.; Vermote, E.F.; Yan, L.; Kumar, S.S.; Egorov, A. Characterization of Landsat-7 to Landsat-8 reflective wavelength and normalized difference vegetation index continuity. Remote Sens. Environ. 2016, 185, 57–70. [Google Scholar] [CrossRef] [Green Version]
- Griffiths, P.; van der Linden, S.; Kuemmerle, T.; Hostert, P. Erratum: A pixel-based landsat compositing algorithm for large area land cover. IEEE J. Sel. Top. Appl. Earth Obs. Remote Sens. 2013, 6, 2088–2101. [Google Scholar]
- Denize, J.; Hubert-Moy, L.; Betbeder, J.; Corgne, S.; Baudry, J.; Pottier, E. Evaluation of Using Sentinel-1 and -2 Time-Series to Identify Winter Land Use in Agricultural Landscapes. Remote Sens. 2018, 11, 37. [Google Scholar] [CrossRef] [Green Version]
- Kupidura, P. The Comparison of Different Methods of Texture Analysis for Their Efficacy for Land Use Classification in Satellite Imagery. Remote Sens. 2019, 11, 1233. [Google Scholar] [CrossRef] [Green Version]
- Li, X.; Chen, W.; Cheng, X.; Wang, L. A Comparison of Machine Learning Algorithms for Mapping of Complex Surface-Mined and Agricultural Landscapes Using ZiYuan-3 Stereo Satellite Imagery. Remote Sens. 2016, 8, 514. [Google Scholar] [CrossRef] [Green Version]
- Jin, Y.; Liu, X.; Chen, Y.; Liang, X. Land-cover mapping using Random Forest classification and incorporating NDVI time-series and texture: A case study of central Shandong. Inter. J. Remote Sens. 2018, 39, 8703–8723. [Google Scholar] [CrossRef]
- Planet Satellite Imagery Products. 2018. Available online: https://www.planet.com (accessed on 15 June 2020).
- Hansen, M.C.; Roy, D.P.; Lindquist, E.; Adusei, B.; Justice, C.O.; Altstatt, A. A method for integrating MODIS and Landsat data for systematic monitoring of forest cover and change in the Congo Basin. Remote Sens. Environ. 2008, 112, 2495–2513. [Google Scholar] [CrossRef]
- Bwangoy, J.B.; Hansen, M.C.; Roy, D.P.; Grandi, G.D.; Justice, C.O. Wetland mapping in the Congo Basin using optical and radar remotely sensed data and derived topographical indices. Remote Sens. Environ. 2010, 114, 73–86. [Google Scholar] [CrossRef]
- De Sousa, C.; Fatoyinbo, L.; Neigh, C.; Boucka, F.; Angoue, V.; Larsen, T. Cloud-computing and machine learning in support of country-level land cover and ecosystem extent mapping in Liberia and Gabon. PLoS ONE 2020, 15, e0227438. [Google Scholar] [CrossRef]
- Millard, K.; Richardson, M. On the Importance of Training Data Sample Selection in Random Forest Image Classification: A Case Study in Peatland Ecosystem Mapping. Remote Sens. 2015, 7, 8489–8515. [Google Scholar] [CrossRef] [Green Version]
- Cánovas-García, F.; Alonso-Sarría, F.; Gomariz-Castillo, F.; Oñate-Valdivieso, F. Modification of the random forest algorithm to avoid statistical dependence problems when classifying remote sensing imagery. Comput. Geosci. 2017, 103, 1–11. [Google Scholar] [CrossRef] [Green Version]
- Maxwell, A.E.; Strager, M.P.; Warner, T.A.; Ramezan, C.A.; Morgan, A.N.; Pauley, C.E. Large-Area, High Spatial Resolution Land Cover Mapping Using Random Forests, GEOBIA and NAIP Orthophotography: Findings and Recommendations. Remote Sens. 2019, 11, 1409. [Google Scholar] [CrossRef] [Green Version]
- Kelley, L.C.; Pitcher, L.; Bacon, C. Using Google Earth Engine to Map Complex Shade-Grown Coffee Landscapes in Northern Nicaragua. Remote Sens. 2018, 10, 952. [Google Scholar] [CrossRef] [Green Version]
- Teluguntla, P.; Thenkabail, P.S.; Oliphant, A.; Xiong, J.; Gumma, M.K.; Congalton, R.G.; Yadav, K.; Huete, A. A 30-m landsat-derived cropland extent product of Australia and China using random forest machine learning algorithm on Google Earth Engine cloud computing platform. ISPRS J. Photogramm. Remote Sens. 2018, 144, 325–340. [Google Scholar] [CrossRef]
- Amani, M.; Mahdavi, S.; Afshar, M.; Brisco, B.; Huang, W.; Mohammad Javad Mirzadeh, S.; White, L.; Banks, S.; Montgomery, J.; Hopkinson, C. Canadian Wetland Inventory using Google Earth Engine: The First Map and Preliminary Results. Remote Sens. 2019, 11, 842. [Google Scholar] [CrossRef] [Green Version]
- Mahdianpari, M.; Salehi, B.; Mohammadimanesh, F.; Motagh, M. Random forest wetland classification using ALOS-2 L-band, RADARSAT-2 C-band and TerraSAR-X imagery. ISPRS J. Photogramm. Remote Sens. 2017, 130, 13–31. [Google Scholar] [CrossRef]
- Xia, J.; Falco, N.; Benediktsson, J.A.; Du, P.; Chanussot, J. Hyperspectral Image Classification With Rotation Random Forest Via KPCA. IEEE J. Sel. Top. Appl. Earth Obs. Remote Sens. 2017, 10, 1601–1609. [Google Scholar] [CrossRef] [Green Version]
- Rodriguez-Galiano, V.F.; Chica-Rivas, M. Evaluation of different machine learning methods for land cover mapping of a Mediterranean area using multi-seasonal Landsat images and Digital Terrain Models. Inter. J. Digital Earth 2012, 7, 492–509. [Google Scholar] [CrossRef]
- Abdel-Rahman, E.M.; Mutanga, O.; Adam, E.; Ismail, R. Detecting Sirex noctilio grey-attacked and lightning-struck pine trees using airborne hyperspectral data, random forest and support vector machines classifiers. ISPRS J. Photogramm. Remote Sens. 2014, 88, 48–59. [Google Scholar] [CrossRef]
- Van Beijma, S.; Comber, A.; Lamb, A. Random forest classification of salt marsh vegetation habitats using quad-polarimetric airborne SAR, elevation and optical RS data. Remote Sens. Environ. 2014, 149, 118–129. [Google Scholar] [CrossRef]
- Maxwell, A.E.; Warner, T.A.; Fang, F. Implementation of machine-learning classification in remote sensing: An applied review. Inter. J. Remote Sens. 2018, 39, 2784–2817. [Google Scholar] [CrossRef] [Green Version]
- Ghimire, B.; Rogan, J.; Galiano, V.R.; Panday, P.; Neeti, N. An Evaluation of Bagging, Boosting and Random Forests for Land-Cover Classification in Cape Cod, Massachusetts, USA. GISci. Remote Sens. 2013, 49, 623–643. [Google Scholar] [CrossRef]
- Foody, G.M. Explaining the unsuitability of the kappa coefficient in the assessment and comparison of the accuracy of thematic maps obtained by image classification. Remote Sens. Environ. 2020, 239. [Google Scholar] [CrossRef]
- Foody, G.M. Thematic map comparison: Evaluating the statistical significance of differences in classification accuracy. Photogramm. Eng. Remote Sens. 2004, 70, 627–633. [Google Scholar] [CrossRef]
- Janssen, L.L.F.; van der Wel, F.J.M. Accuracy assessment of satellite derived land-cover data: A review. Photogramm. Eng. Remote Sens. 1994, 60, 419–426. [Google Scholar]
- Congalton, R.G.; Oderwald, R.G.; Mead, R.A. Assessing Landsat classification accuracy using discrete multivariate-analysis statistical techniques. Photogramm. Eng. Remote Sens. 1983, 49, 1671–1678. [Google Scholar]
- Smits, P.C.; Dellepaine, S.G.; Schowengerdt, R.A. Quality assessment of image classification algorithms for land cover mapping: A review and a proposal for a cost based approach. Int. J. Remote Sens. 1999, 20, 1461–1486. [Google Scholar] [CrossRef]
- Agresti, A. An Introduction to Categorical Data Analysis; John Wiley & Sons: Hoboken, NJ, USA, 2007; pp. 1–372. [Google Scholar]
- Momeni, R.; Aplin, P.; Boyd, D. Mapping Complex Urban Land Cover from Spaceborne Imagery: The Influence of Spatial Resolution, Spectral Band Set and Classification Approach. Remote Sens. 2016, 8, 88. [Google Scholar] [CrossRef] [Green Version]
- Senf, C.; Leitão, P.J.; Pflugmacher, D.; van der Linden, S.; Hostert, P. Mapping land cover in complex Mediterranean landscapes using Landsat: Improved classification accuracies from integrating multi-seasonal and synthetic imagery. Remote Sens. Environ. 2015, 156, 527–536. [Google Scholar] [CrossRef]
- Inglada, J.; Vincent, A.; Arias, M.; Tardy, B.; Morin, D.; Rodes, I. Operational High Resolution Land Cover Map Production at the Country Scale Using Satellite Image Time Series. Remote Sens. 2017, 9, 95. [Google Scholar] [CrossRef] [Green Version]
- Wulder, M.A.; Coops, N.C.; Roy, D.P.; White, J.C.; Hermosilla, T. Land cover 2.0. Inter. J. Remote Sens. 2018, 39, 4254–4284. [Google Scholar] [CrossRef] [Green Version]
- Frantz, D.; Röder, A.; Stellmes, M.; Hill, J. Phenology-adaptive pixel-based compositing using optical earth observation imagery. Remote Sens. Environ. 2017, 190, 331–347. [Google Scholar] [CrossRef] [Green Version]
- Abdi, A.M. Land cover and land use classification performance of machine learning algorithms in a boreal landscape using Sentinel-2 data. GISci. Remote Sens. 2020, 57, 1–20. [Google Scholar] [CrossRef] [Green Version]
- Zha, Y.; Gao, J.; Ni, S. Use of normalized difference built-up index in automatically mapping urban areas from TM imagery. Int. J. Remote Sens. 2003, 24, 583–594. [Google Scholar] [CrossRef]
- Feyisa, G.L.; Meilby, H.; Fensholt, R.; Proud, S.R. Automated water extraction index: A new technique for surface water mapping using Landsat imagery. Remote Sens. Environ. 2014, 140, 23–35. [Google Scholar] [CrossRef]
- Rouse, J.; Hass, R.; Schell, J.; Deering, D. Monitoring vegetation systems in the great plains with ERTS. In Third ERTS Symposium; NASASP-351 I: Greenbelt, MD, USA, 1973; pp. 309–317. [Google Scholar]
- Liu, H.Q.; Huete, A. A feedback based modification of the NDV I to minimize canopy background and atmospheric noise. IEEE Trans. Geosci. Remote Sens. 1995, 33, 457–465. [Google Scholar] [CrossRef]
- Huete, A.R. A Soil-Adjusted Vegetation Index (SAVI). Remote Sens. Environ. 1988, 25, 295–309. [Google Scholar] [CrossRef]
- Qi, J.; Chehbouni, A.; Huete, A.R.; Kerr, Y.H.; Sorooshian, S. A modified soil adjusted vegetation index. Remote Sens. Environ. 1994, 48, 119–126. [Google Scholar] [CrossRef]
- Gao, B.-C. NDWI—A normalized difference water index for remote sensing of vegetation liquid water fromspace. Remote Sens. Environ. 1996, 58, 257–266. [Google Scholar] [CrossRef]
- Xu, H. Modification of normalised difference water index (NDWI) to enhance open water features in remotely sensed imagery. Int. J. Remote Sens. 2006, 27, 3025–3033. [Google Scholar] [CrossRef]
- McFeeters, S.K. The use of the normalized difference water index (NDWI) in the delineation of open water features. Int. J. Remote Sens. 1996, 17, 1425–1432. [Google Scholar] [CrossRef]
- Birth, G.; McVey, G. Measuring the Color of Growing Turf with a Reflectance Spectrophotometer. Agron. J. 1968, 60, 640–643. [Google Scholar] [CrossRef]
- Jia, K.; Wei, X.; Gu, X.; Yao, Y.; Xie, X.; Li, B. Land cover classification using Landsat 8 operational land imager data in Beijing, China. Geocarto Int. 2014, 29, 941–951. [Google Scholar] [CrossRef]


| Dataset | Description | No. L8 Images Used for Composition | No. Reflectance Bands | No. Auxiliary Variables |
|---|---|---|---|---|
| Dataset 1 | All the available data from L8sr in 2019 were selected to calculate the median image for classification. | 196 | 7 | 13 |
| Dataset 2 | Only images between 1st of June and 30th of September 2019 were selected to calculate the median image. | 61 | 7 | 13 |
| Dataset 3 | Only images with cloud cover less than 30% were used for median calculation. | 130 | 7 | 13 |
| Dataset 4 | Median image was composited from June to September of two years: 2018 and 2019. | 126 | 7 | 13 |
| Dataset 5 | The best single scene (p131r27) covering the entire study area was selected based on the lowest cloud cover percentage. | 1 | 7 | 13 |
| Dataset 6 | Median image of all p131r27 images between 1 June and 30 September 2019. | 7 | 7 | 13 |
| Dataset 7 | Time series images of Collection 2. | 61 | 28 | 13 |
| Dataset 8 | Time series images of single scene cover study area (p131r27) between 1 June and 30 September 2019. | 7 | 28 | 13 |
| Data | Only Spectral Bands | Spectral + Auxiliary Variables | ||
|---|---|---|---|---|
| No. Bands | OA | No. Bands | OA | |
| Dataset 1 | 7 | 78.25 | 20 | 85.95 |
| Dataset 2 | 7 | 81.23 | 20 | 88.74 |
| Dataset 3 | 7 | 80.46 | 20 | 85.08 |
| Dataset 4 | 7 | 80.17 | 20 | 84.31 |
| Dataset 5 | 7 | 77.66 | 20 | 85.27 |
| Dataset 6 | 7 | 78.15 | 20 | 85.66 |
| Dataset 7 | 28 | 85.08 | 41 | 89.80 |
| Dataset 8 | 28 | 85.27 | 41 | 89.70 |
| AG | BA | BL | GR | GRm | RE | FR | WA | OA | ||
|---|---|---|---|---|---|---|---|---|---|---|
| Dataset 1 | PA | 70.54 | 85.71 | 86.59 | 94.00 | 82.35 | 97.60 | 75.00 | 80.00 | 85.95 |
| UA | 88.76 | 100.00 | 78.68 | 76.05 | 92.31 | 98.39 | 89.66 | 95.65 | ||
| Dataset 2 | PA | 75.89 | 94.64 | 89.94 | 94.80 | 86.27 | 97.60 | 72.12 | 87.27 | 88.74 |
| UA | 92.39 | 100.00 | 80.50 | 80.07 | 90.72 | 99.19 | 97.40 | 100.00 | ||
| Dataset 3 | PA | 69.64 | 83.04 | 86.03 | 93.60 | 83.33 | 98.40 | 69.23 | 81.82 | 85.08 |
| UA | 90.70 | 100.00 | 78.97 | 72.22 | 92.39 | 99.19 | 90.00 | 100.00 | ||
| Dataset 4 | PA | 53.57 | 95.54 | 81.01 | 94.80 | 85.29 | 98.40 | 68.27 | 83.64 | 84.31 |
| UA | 78.95 | 99.07 | 73.98 | 76.70 | 87.00 | 97.62 | 91.03 | 100.00 | ||
| Dataset 5 | PA | 66.67 | 93.75 | 87.71 | 94.40 | 85.29 | 97.60 | 62.34 | 52.38 | 85.27 |
| UA | 89.16 | 100.00 | 73.71 | 80.00 | 93.55 | 98.39 | 77.42 | 95.65 | ||
| Dataset 6 | PA | 53.57 | 96.43 | 92.74 | 93.20 | 81.37 | 99.20 | 71.15 | 76.36 | 85.66 |
| UA | 88.24 | 100.00 | 75.45 | 78.19 | 88.30 | 99.20 | 88.10 | 100.00 | ||
| Dataset 7 | PA | 80.36 | 93.75 | 94.97 | 94.80 | 85.29 | 99.20 | 78.85 | 69.09 | 89.8 |
| UA | 97.83 | 100.00 | 82.13 | 84.34 | 90.63 | 100.00 | 85.42 | 100.00 | ||
| Dataset 8 | PA | 78.57 | 91.96 | 94.41 | 95.60 | 87.25 | 99.20 | 80.77 | 65.45 | 89.7 |
| UA | 98.88 | 100.00 | 83.25 | 84.45 | 89.90 | 99.20 | 83.17 | 100.00 |
| Dataset 1 | Dataset 2 | Dataset 3 | Dataset 4 | Dataset 5 | Dataset 6 | Dataset 7 | Dataset 8 | |
|---|---|---|---|---|---|---|---|---|
| Dataset 1 | <0.05 | 0.208 | 0.161 | 0.480 | 0.805 | <0.05 | <0.05 | |
| Dataset 2 | 6.05 | <0.05 | <0.05 | <0.05 | <0.05 | 0.313 | 0.353 | |
| Dataset 3 | 1.59 | 9.89 | 0.537 | 0.886 | 0.620 | <0.05 | <0.05 | |
| Dataset 4 | 1.97 | 16.28 | 0.38 | 0.713 | 0.227 | <0.05 | <0.05 | |
| Dataset 5 | 0.50 | 9.0 | 0.02 | 0.14 | <0.05 | <0.05 | <0.05 | |
| Dataset 6 | 0.06 | 9.85 | 0.25 | 1.46 | 7.01 | <0.05 | <0.05 | |
| Dataset 7 | 15.09 | 1.02 | 19.84 | 22.10 | 38.21 | 7.75 | 0.858 | |
| Dataset 8 | 13.46 | 0.86 | 18.00 | 21.78 | 37.07 | 15.75 | 0.03 |
© 2020 by the authors. Licensee MDPI, Basel, Switzerland. This article is an open access article distributed under the terms and conditions of the Creative Commons Attribution (CC BY) license (http://creativecommons.org/licenses/by/4.0/).
Share and Cite
Phan, T.N.; Kuch, V.; Lehnert, L.W. Land Cover Classification using Google Earth Engine and Random Forest Classifier—The Role of Image Composition. Remote Sens. 2020, 12, 2411. https://doi.org/10.3390/rs12152411
Phan TN, Kuch V, Lehnert LW. Land Cover Classification using Google Earth Engine and Random Forest Classifier—The Role of Image Composition. Remote Sensing. 2020; 12(15):2411. https://doi.org/10.3390/rs12152411
Chicago/Turabian StylePhan, Thanh Noi, Verena Kuch, and Lukas W. Lehnert. 2020. "Land Cover Classification using Google Earth Engine and Random Forest Classifier—The Role of Image Composition" Remote Sensing 12, no. 15: 2411. https://doi.org/10.3390/rs12152411