Sentinel-2 Data for Land Cover/Use Mapping: A Review

 ,
,  , , ,
, , ,  and
and 
Abstract
:
1. Introduction
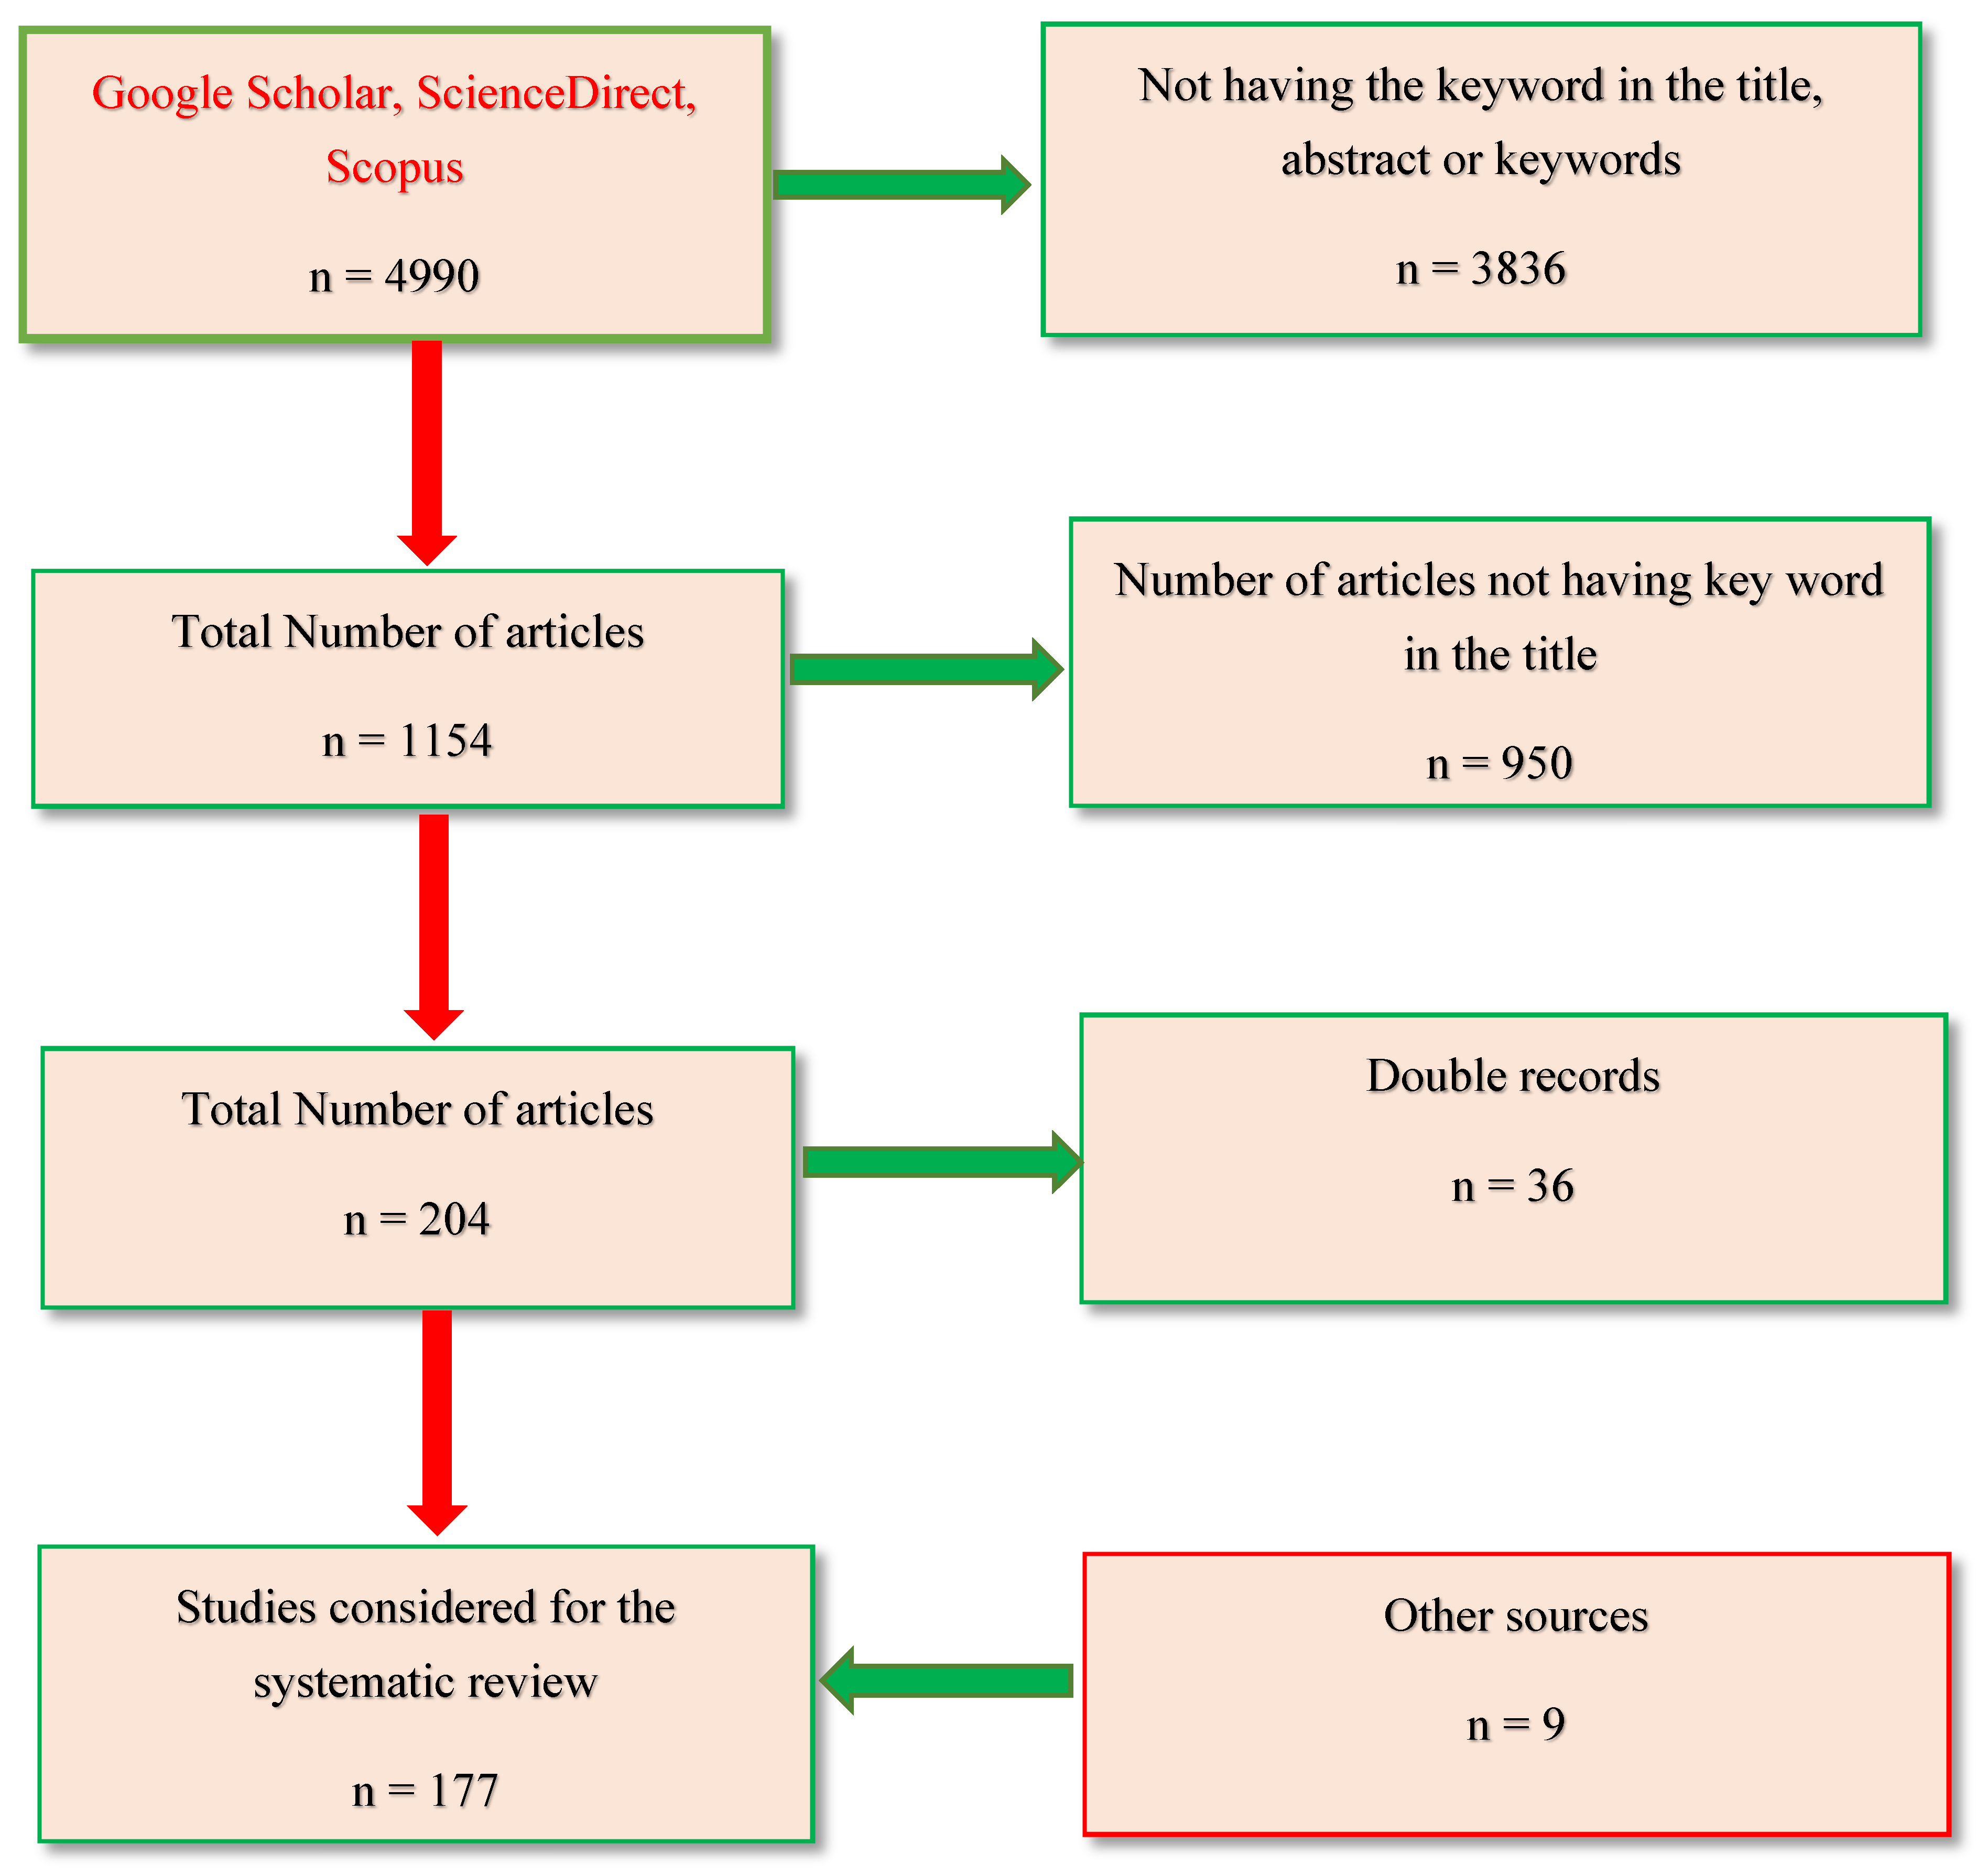
2. Methods for Searching Literature
3. Results
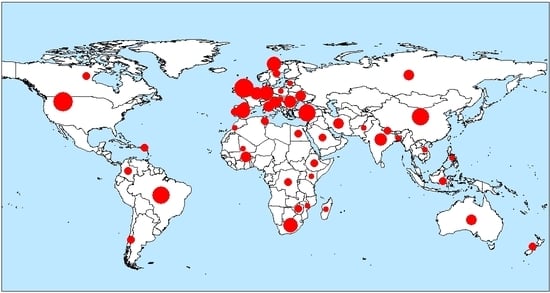
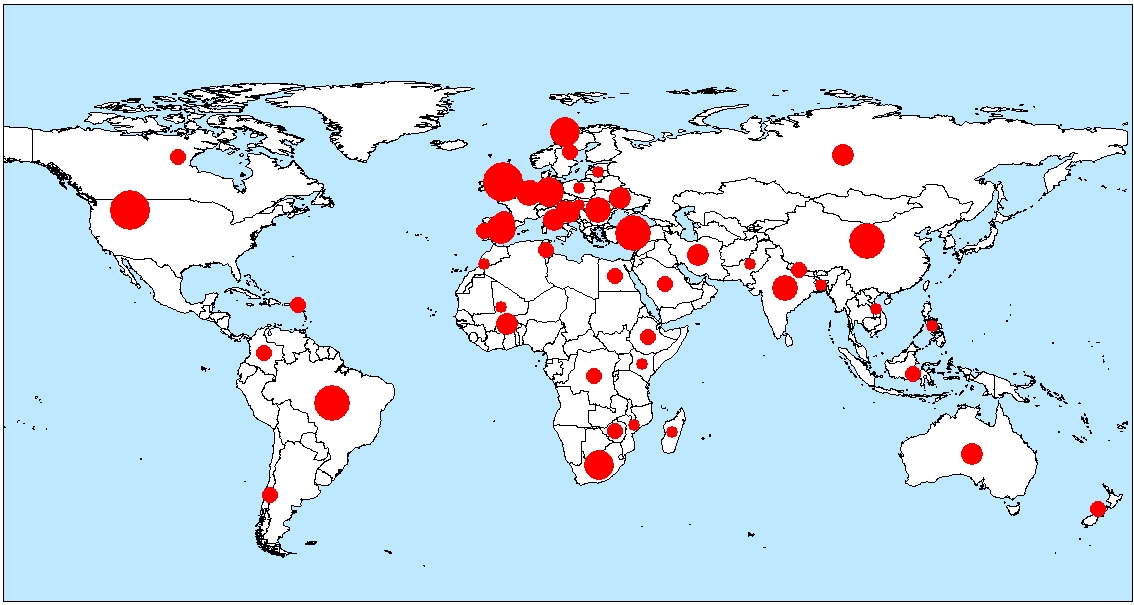
3.1. Characteristics of the Reviewed Studies
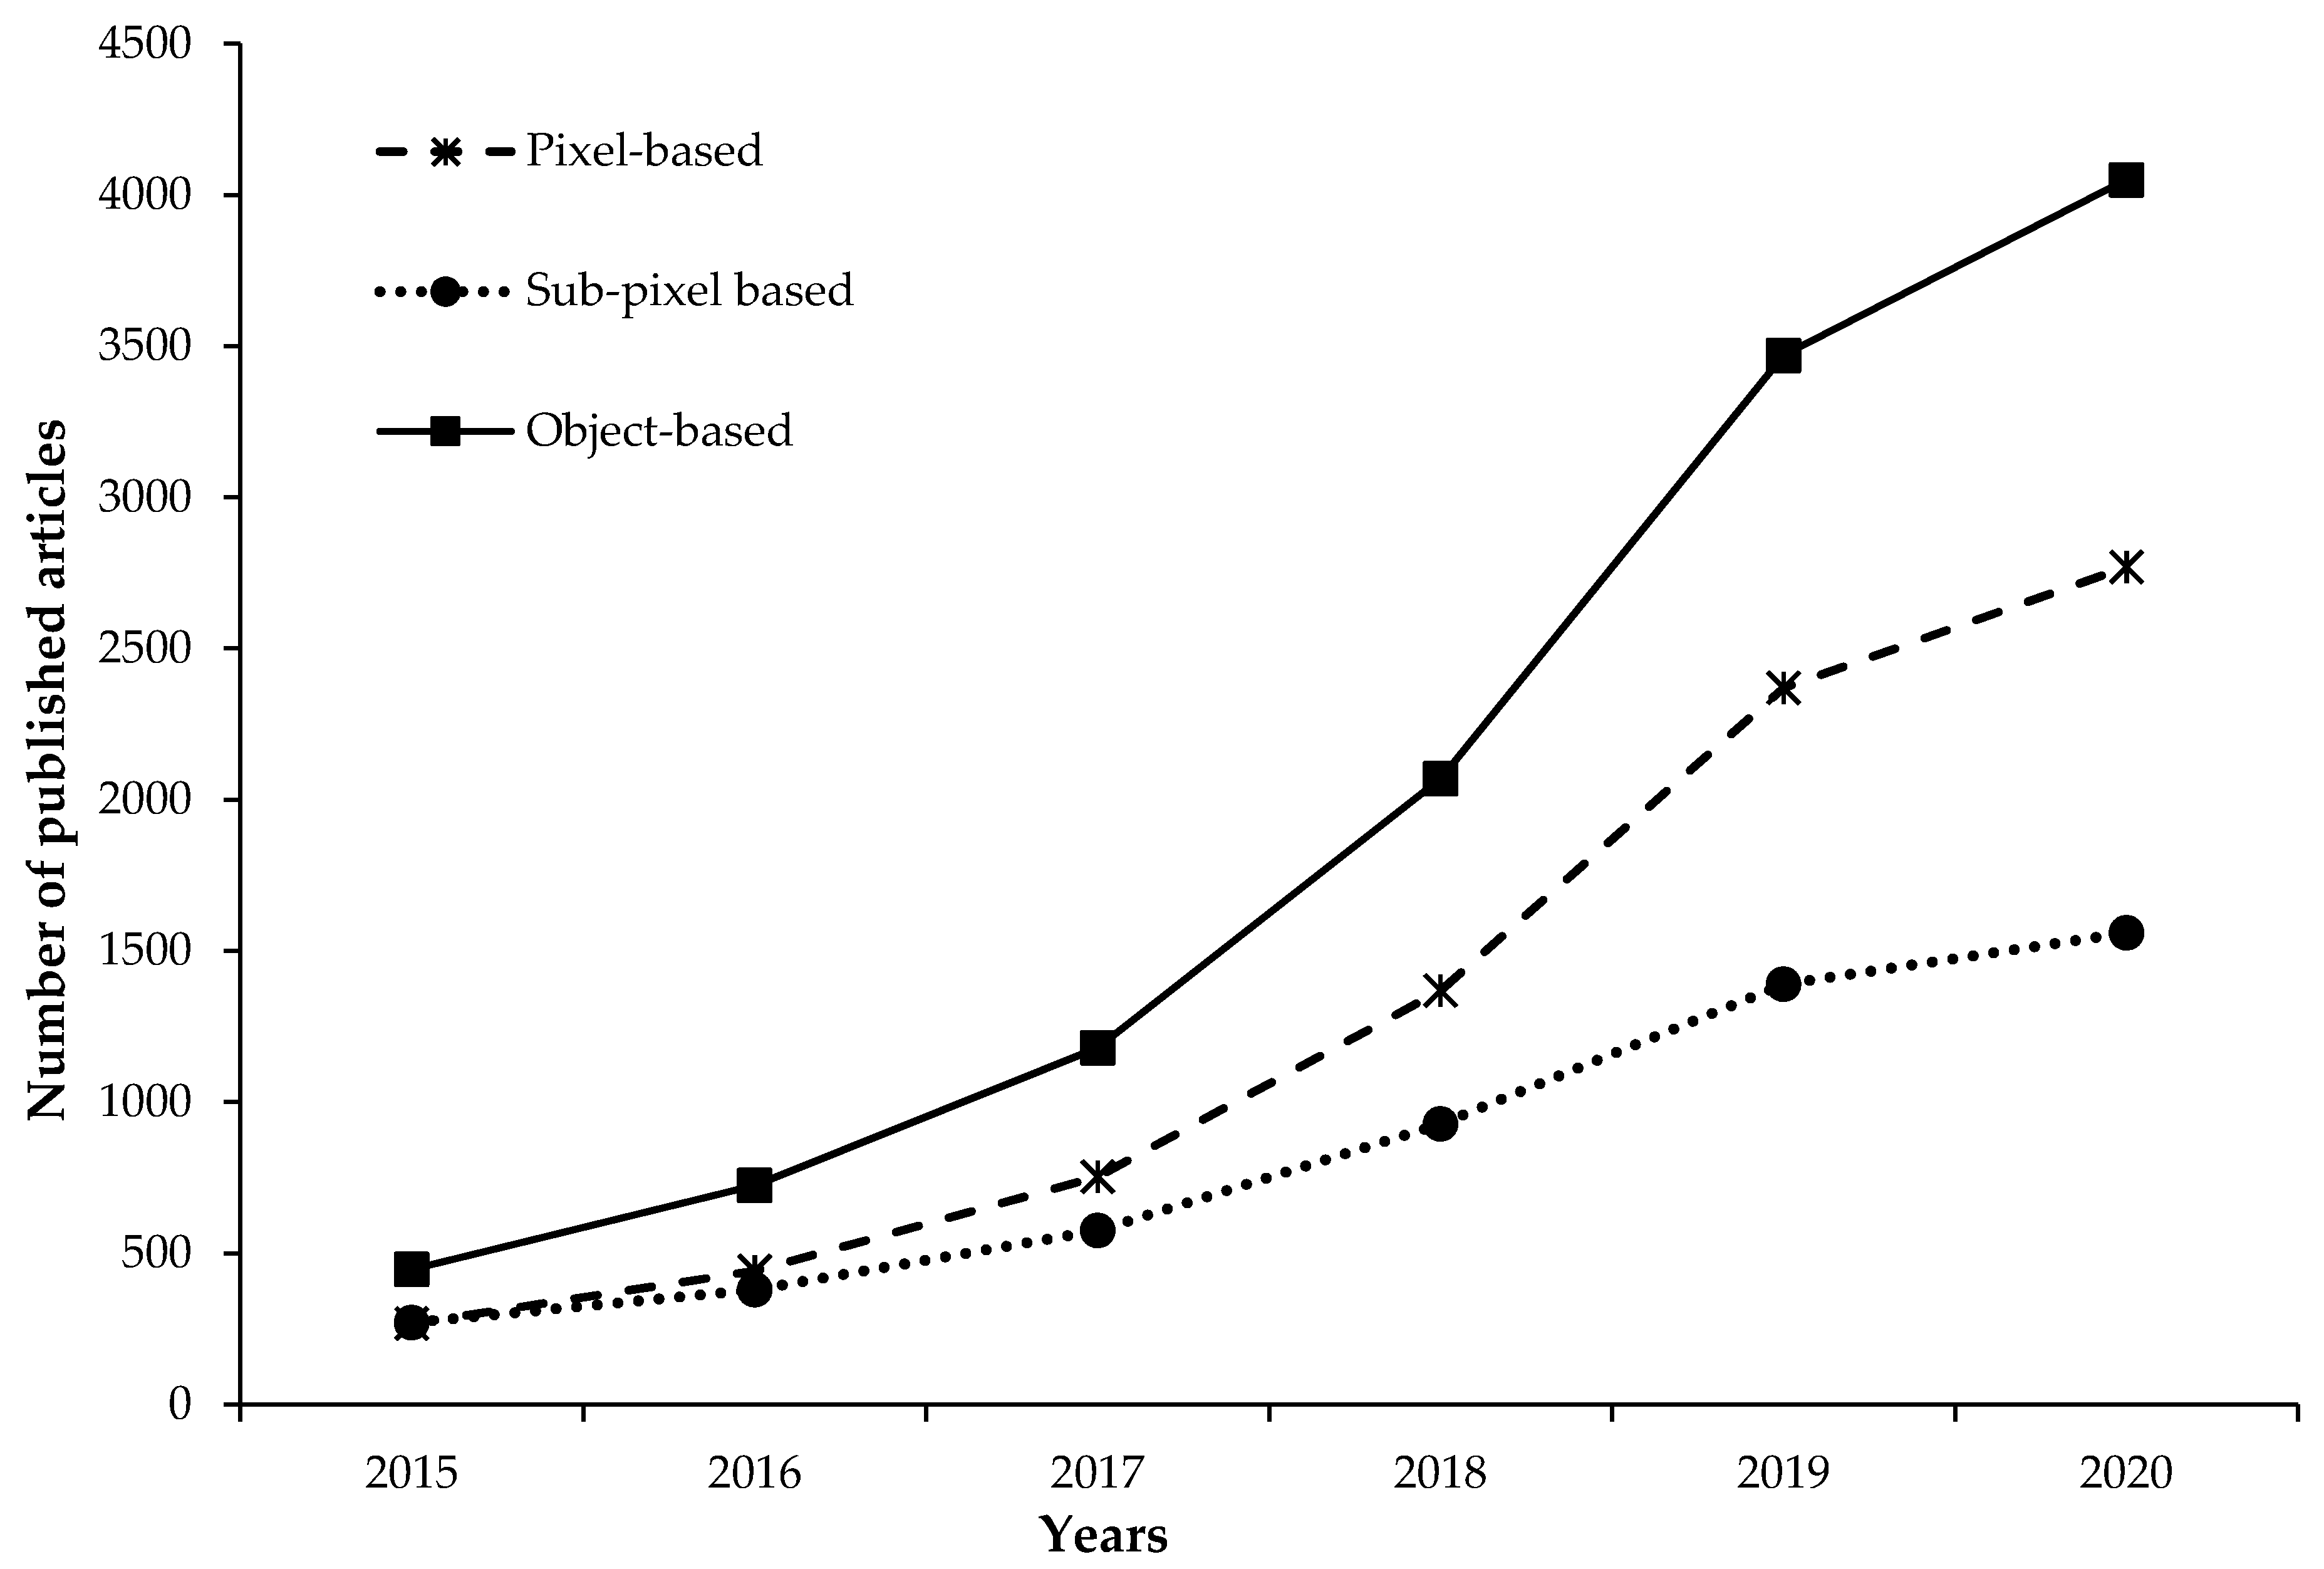
3.2. Trends of Published Articles on Sentinel-2
4. Discussion
4.1. Background of ESA Copernicus Sentinel Programme
4.2. Overview of Sentinel-2 Mission
4.2.1. Properties of Sentinel-2 Data
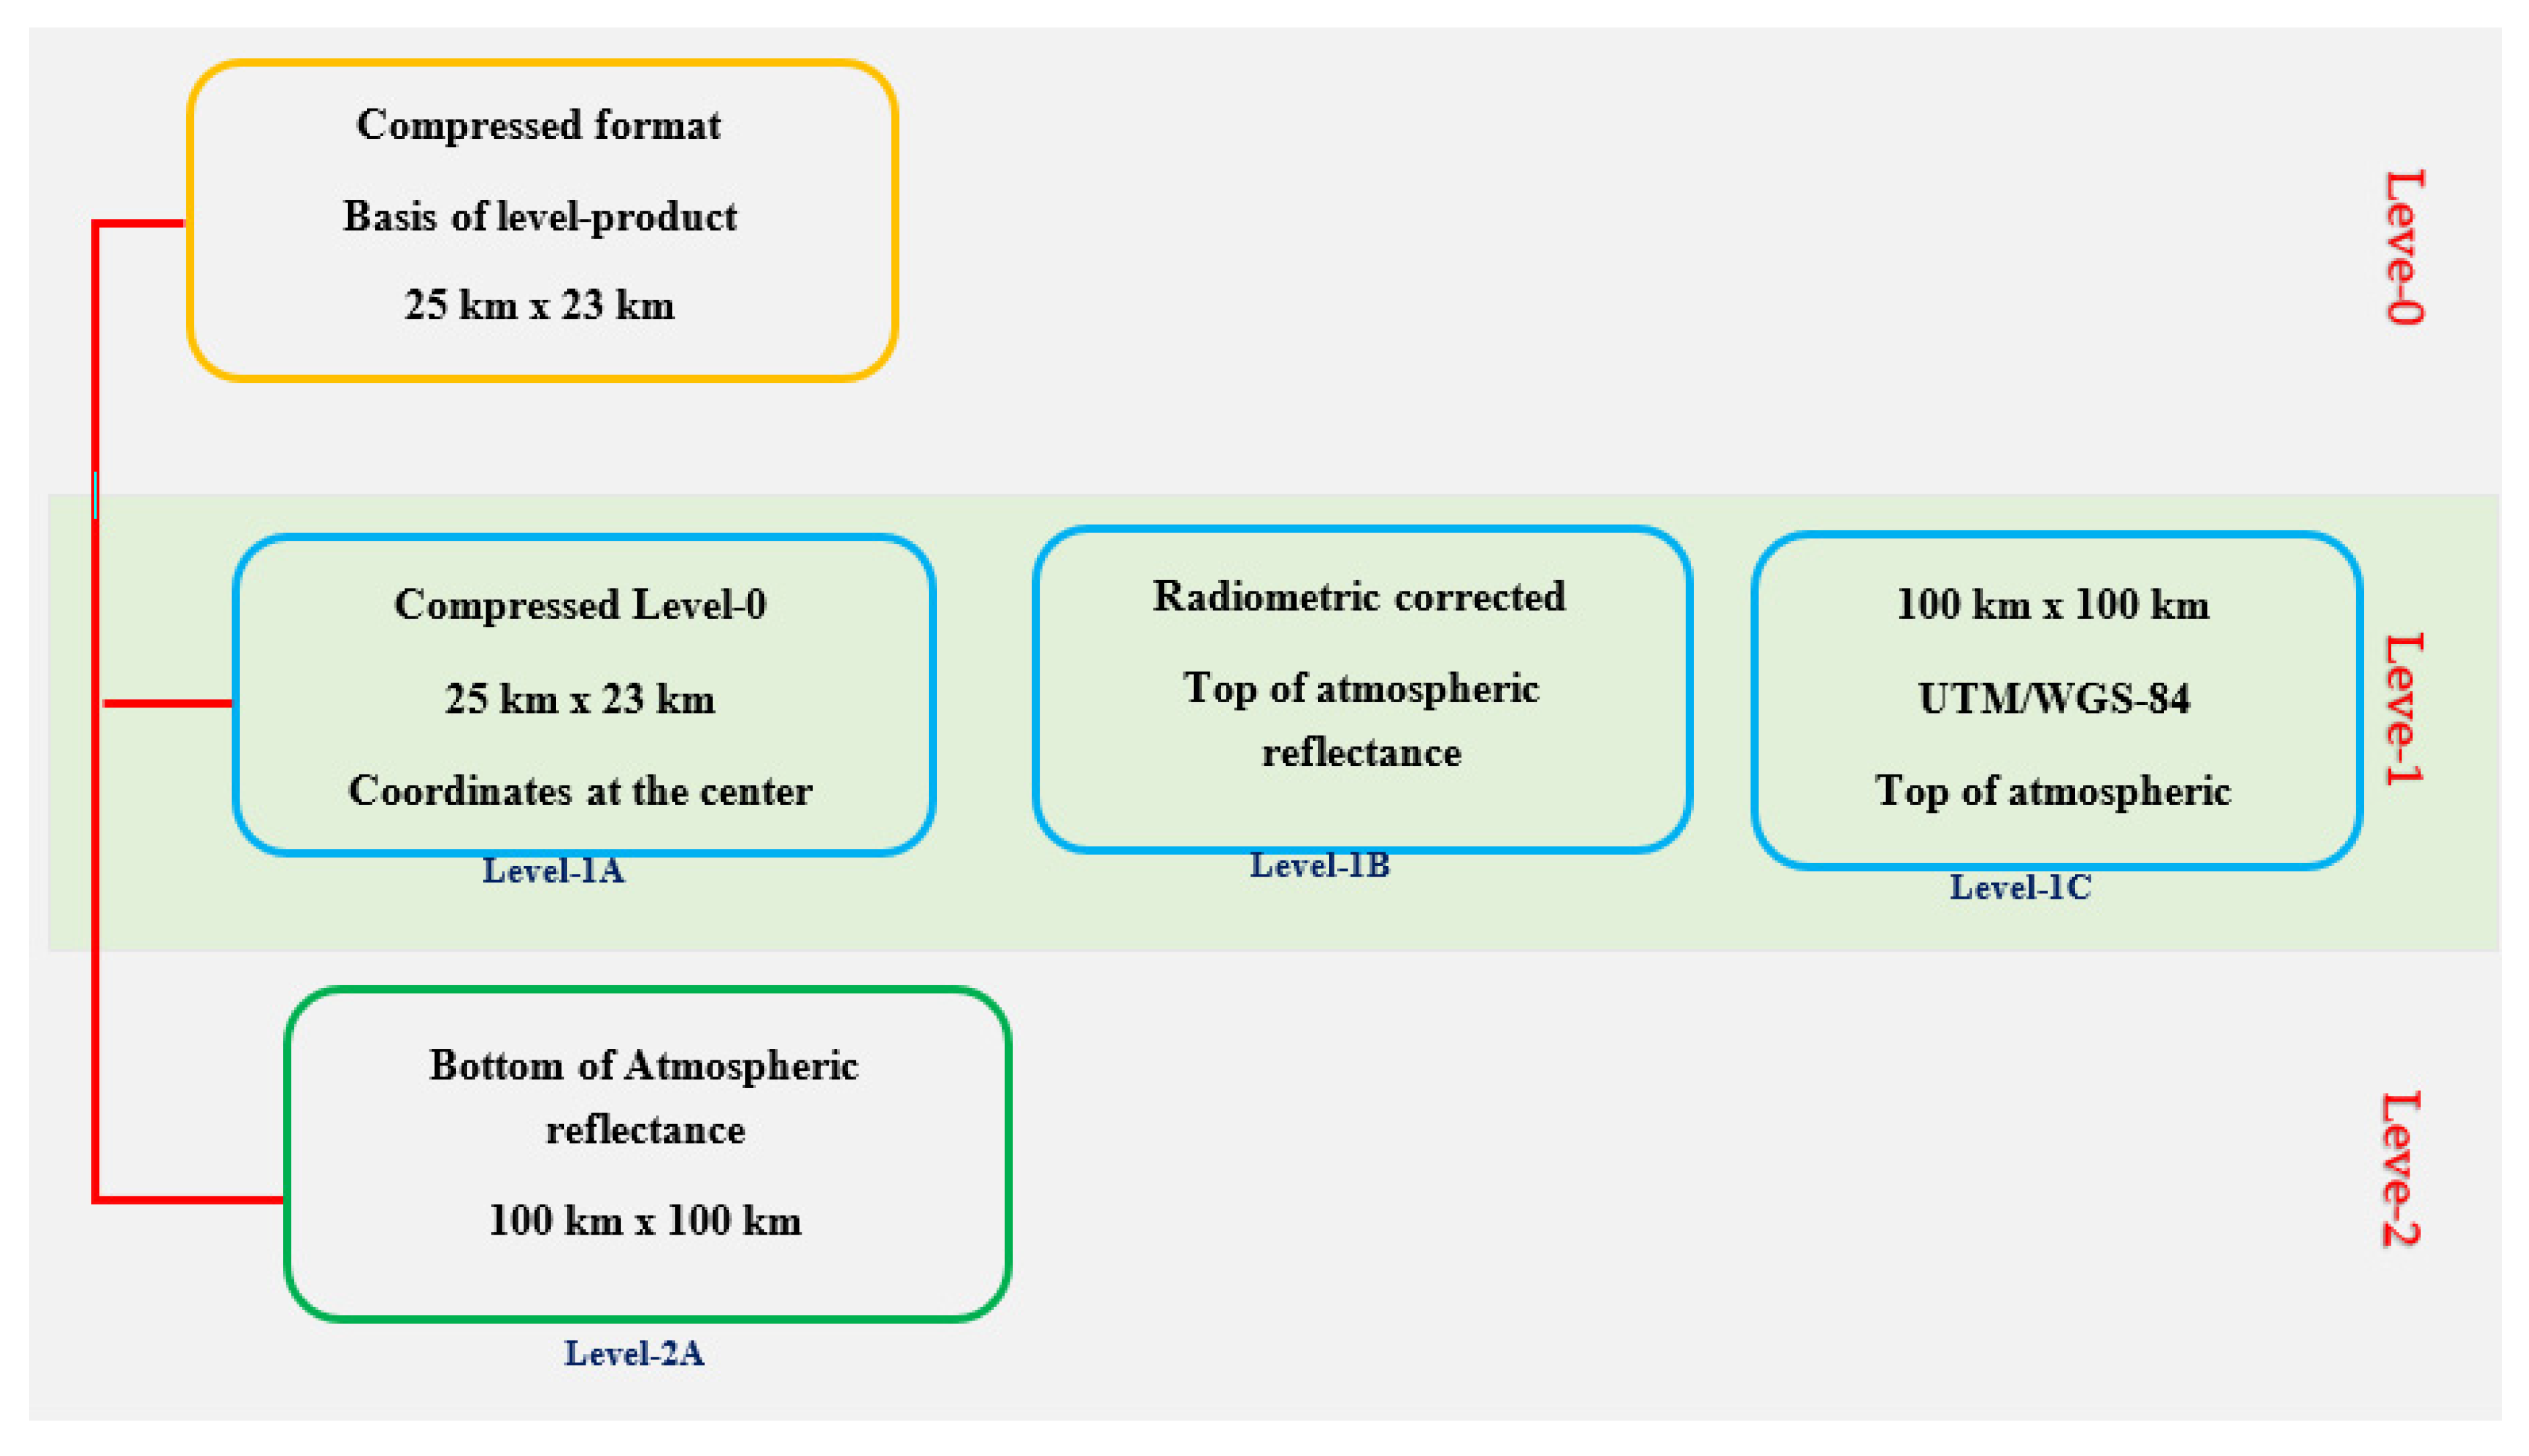
4.2.2. Sentinel-2 Data Products
4.3. Pre-processing of Sentinel-2 Images
4.3.1. Geometric Correction
4.3.2. Atmospheric Correction
4.3.3. Cloud Cover Masking
4.4. Land Cover/Use Classification with Sentinel-2
4.4.1. Supervised and Unsupervised
4.4.2. Pixel-Based Image Analysis
4.4.3. Object-Based Image Analysis
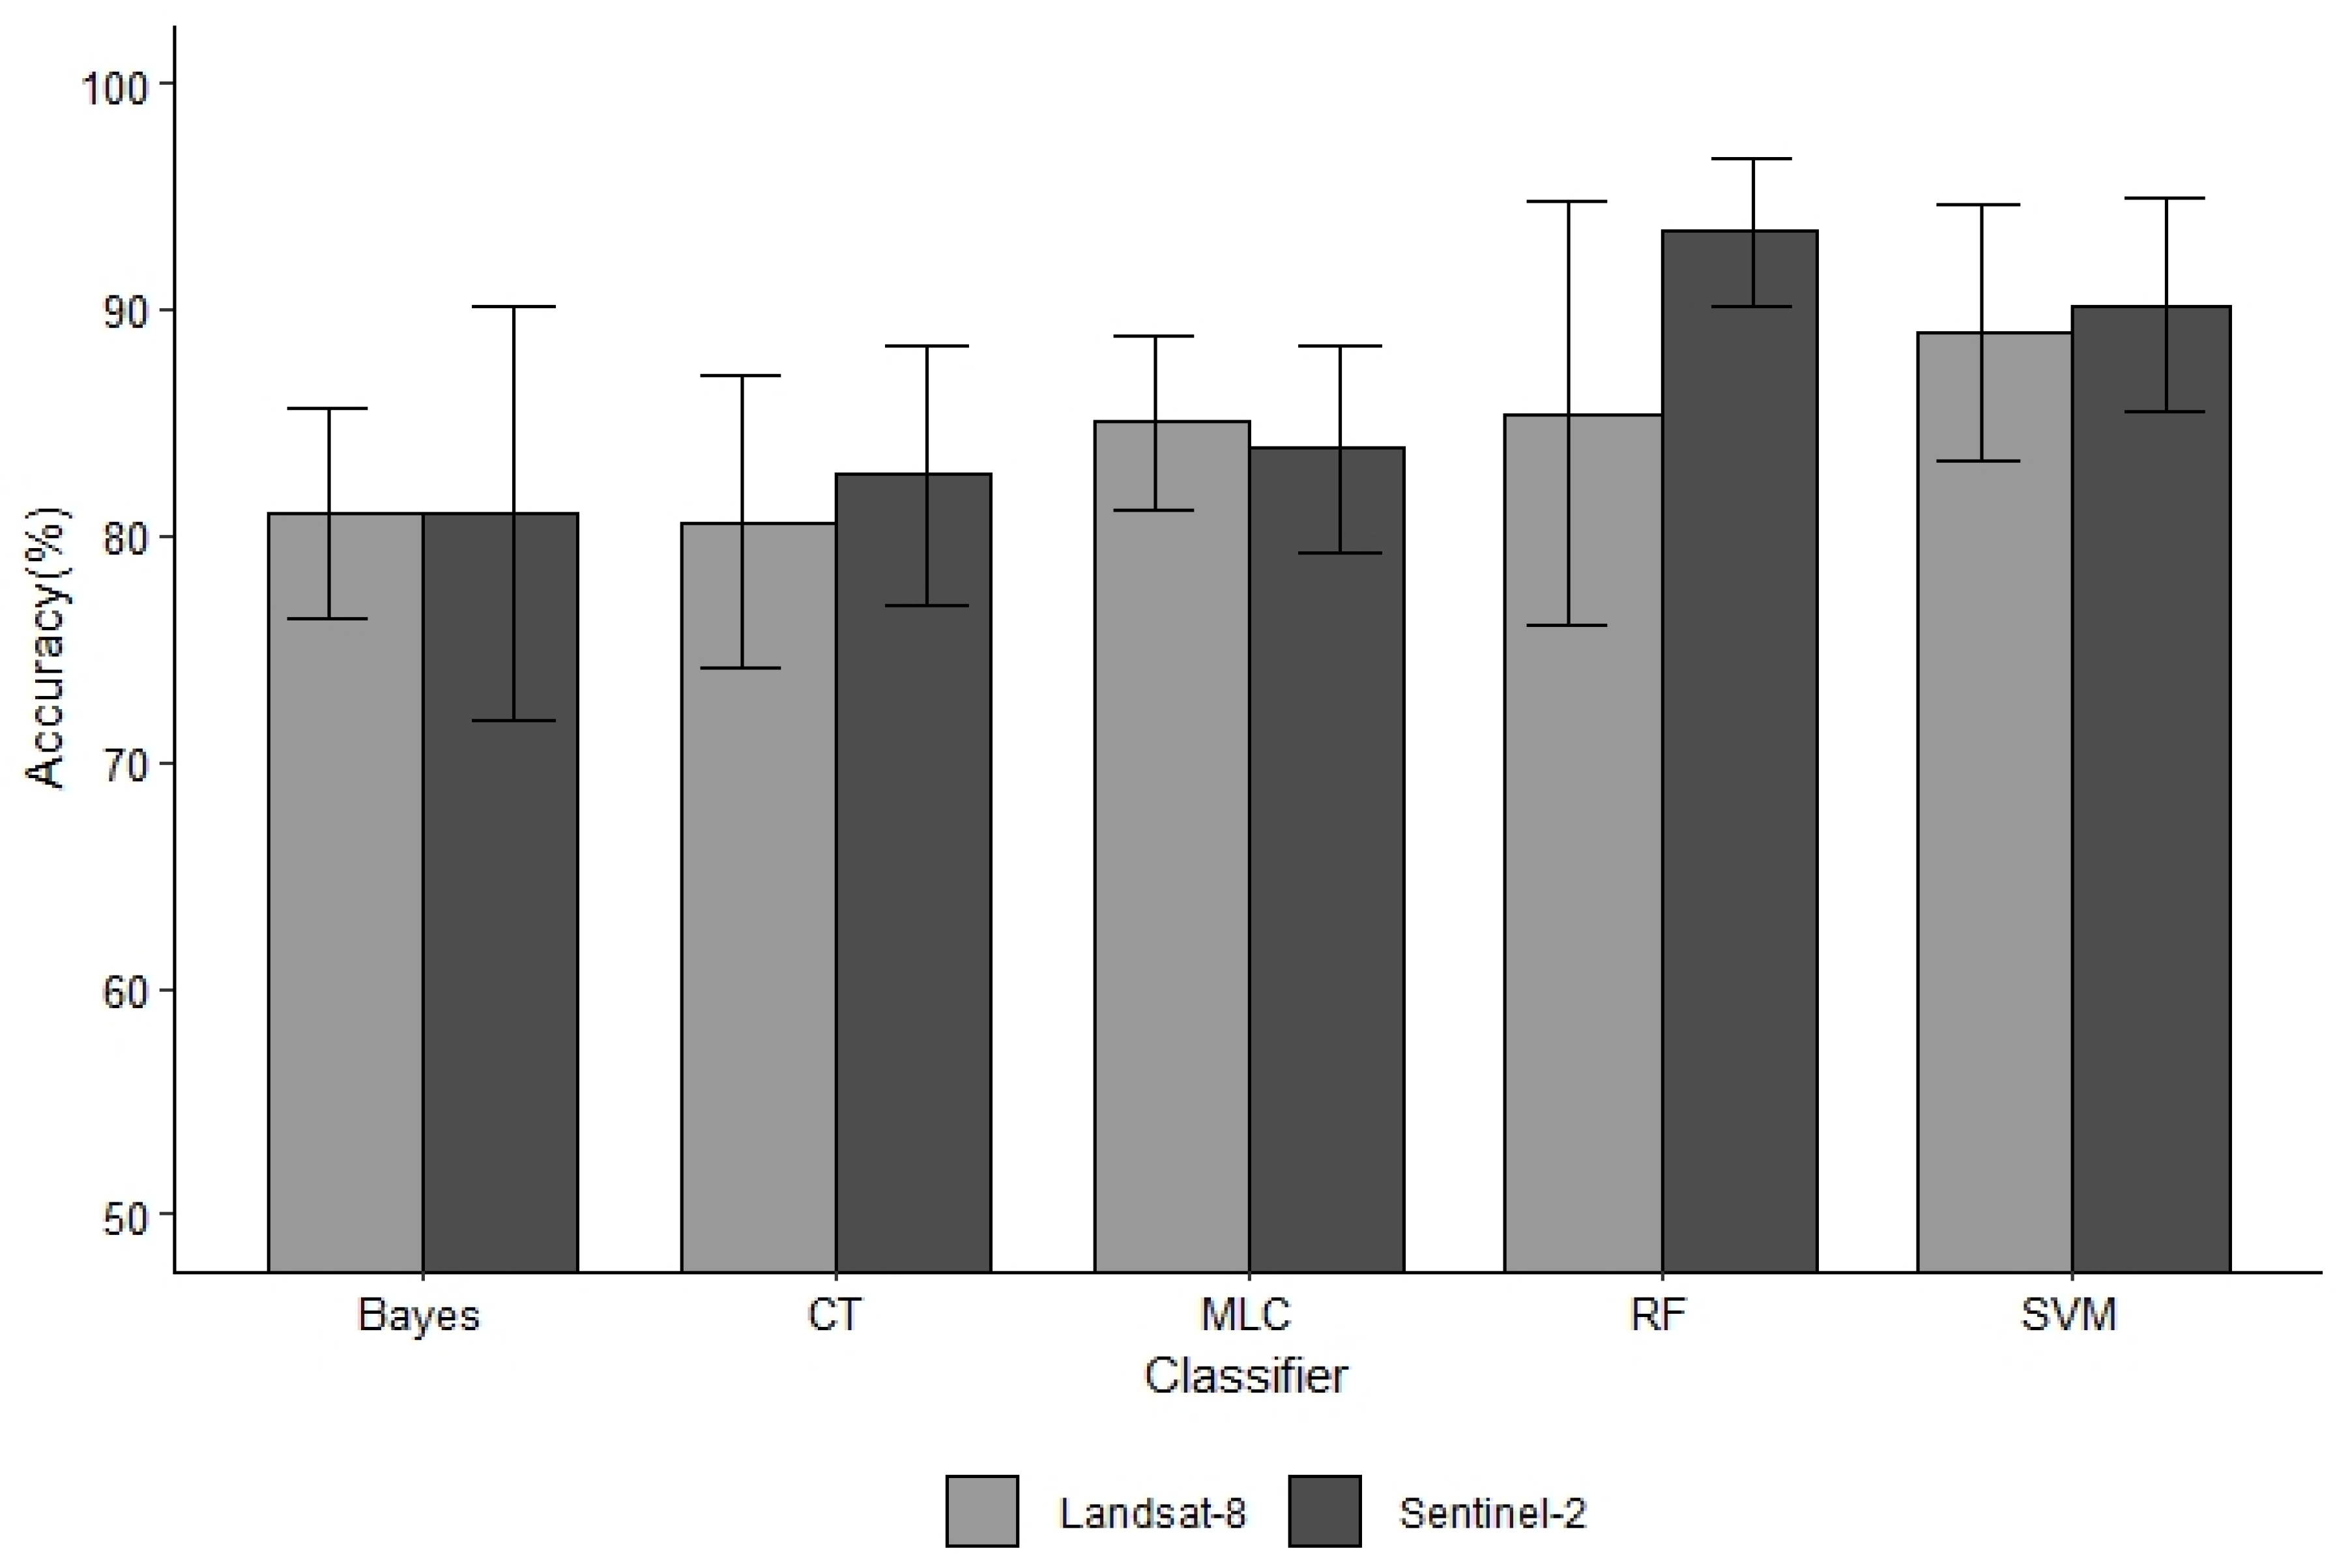
4.4.4. Accuracy of Sentinel Land Cover/Use Mapping
4.5. Integration of Sentinel-2 with Other Remotely Sensed Data
4.6. Opportunities and Challenges of Sentinel-2 Data
4.7. Best Practices for Optimal Classification Accuracy with Sentinel-2
4.8. Specific Applications of Sentinel-2 in Land Cover/Land Use Monitoring
4.8.1. Sentinel-2 for Forest Monitoring
4.8.2. Sentinel-2 for Agricultural Monitoring
4.8.3. Sentinel-2 for Urban Area Monitoring
4.8.4. Sentinel-2 for Natural Hazards
5. Conclusions
Author Contributions
Funding
Acknowledgments
Conflicts of Interest
References
- Hansen, M.C.; DeFries, R.; Townshend, J.R.; Sohlberg, R. Global land cover classification at 1 km spatial resolution using a classification tree approach. Int. J. Remote Sens. 2000, 21, 1331–1364. [Google Scholar] [CrossRef]
- Hosonuma, N.; Herold, M.; De Sy, V.; De Fries, R.S.; Brockhaus, M.; Verchot, L.; Angelsen, A.; Romijn, E. An assessment of deforestation and forest degradation drivers in developing countries. Environ. Res. Lett. 2012, 7, 044009. [Google Scholar] [CrossRef]
- Phiri, D.; Morgenroth, J.; Xu, C. Long-term land cover change in Zambia: An assessment of driving factors. Sci. Total Environ. 2019, 697, 134206. [Google Scholar] [CrossRef] [PubMed]
- Jucker, T.; Caspersen, J.; Chave, J.; Antin, C.; Barbier, N.; Bongers, F.; Dalponte, M.; van Ewijk, K.Y.; Forrester, D.I.; Haeni, M.J.G.C.B. Allometric equations for integrating remote sensing imagery into forest monitoring programmes. Glob. Chang. Biol. 2017, 23, 177–190. [Google Scholar] [CrossRef] [PubMed]
- Haack, B.N. Landsat: A tool for development. World Dev. 1982, 10, 899–909. [Google Scholar] [CrossRef]
- Turner, W.; Rondinini, C.; Pettorelli, N.; Mora, B.; Leidner, A.K.; Szantoi, Z.; Buchanan, G.; Dech, S.; Dwyer, J.; Herold, M. Free and open-access satellite data are key to biodiversity conservation. Biol. Conserv. 2015, 182, 173–176. [Google Scholar] [CrossRef] [Green Version]
- Denize, J.; Hubert-Moy, L.; Corgne, S.; Betbeder, J.; Pottier, E. Identification of winter land use in temperate agricultural landscapes based on Sentinel-1 and 2 Times-Series. In Proceedings of the IGARSS 2018-2018 IEEE International Geoscience and Remote Sensing Symposium, Valencia, Spain, 22–27 July 2018; pp. 8271–8274. [Google Scholar]
- Immitzer, M.; Vuolo, F.; Atzberger, C. First Experience with Sentinel-2 data for crop and tree species classifications in Central Europe. Remote Sens. 2016, 8, 166. [Google Scholar] [CrossRef]
- ESA. Sentinel-2 Missions-Sentinel Online; ESA: Paris, France, 2014. [Google Scholar]
- Malenovský, Z.; Rott, H.; Cihlar, J.; Schaepman, M.E.; García-Santos, G.; Fernandes, R.; Berger, M. Sentinels for science: Potential of Sentinel-1, -2, and -3 missions for scientific observations of ocean, cryosphere, and land. Remote Sens. Environ. 2012, 120, 91–101. [Google Scholar] [CrossRef]
- Korhonen, L.; Packalen, P.; Rautiainen, M. Comparison of Sentinel-2 and Landsat 8 in the estimation of boreal forest canopy cover and leaf area index. Remote Sens. Environ. 2017, 195, 259–274. [Google Scholar] [CrossRef]
- Pesaresi, M.; Corbane, C.; Julea, A.; Florczyk, A.J.; Syrris, V.; Soille, P. Assessment of the added-value of Sentinel-2 for detecting built-up areas. Remote Sens. 2016, 8, 299. [Google Scholar] [CrossRef] [Green Version]
- Drusch, M.; Del Bello, U.; Carlier, S.; Colin, O.; Fernandez, V.; Gascon, F.; Hoersch, B.; Isola, C.; Laberinti, P.; Martimort, P.; et al. Sentinel-2: ESA’s Optical High-Resolution Mission for GMES Operational Services. Remote Sens. Environ. 2012, 120, 25–36. [Google Scholar] [CrossRef]
- Sibanda, M.; Mutanga, O.; Rouget, M. Examining the potential of Sentinel-2 MSI spectral resolution in quantifying above ground biomass across different fertilizer treatments. ISPRS J. Photogramm. Remote Sens. 2015, 110, 55–65. [Google Scholar] [CrossRef]
- Otunga, C.; Odindi, J.; Mutanga, O.; Adjorlolo, C. Evaluating the potential of the Red Edge channel for C3 (Festuca spp.) grass discrimination using Sentinel-2 and Rapid Eye satellite image data. Geocarto Int. 2018, 1–21. [Google Scholar] [CrossRef]
- Bruzzone, L.; Bovolo, F.; Paris, C.; Solano-Correa, Y.T.; Zanetti, M.; Fernández-Prieto, D. Analysis of multitemporal Sentinel-2 images in the framework of the ESA Scientific Exploitation of Operational Missions. In Proceedings of the 2017 9th International Workshop on the Analysis of Multitemporal Remote Sensing Images (MultiTemp), Brugge, Belgium, 27–29 June 2017; pp. 1–4. [Google Scholar]
- Xu, Y.; Yu, L.; Feng, D.; Peng, D.; Li, C.; Huang, X.; Lu, H.; Gong, P. Comparisons of three recent moderate resolution African land cover datasets: CGLS-LC100, ESA-S2-LC20, and FROM-GLC-Africa30. Int. J. Remote Sens. 2019, 40, 6185–6202. [Google Scholar] [CrossRef]
- Gromny, E.; Lewiński, S.; Rybicki, M.; Malinowski, R.; Krupiński, M.; Nowakowski, A.; Jenerowicz, M. Creation of training dataset for Sentinel-2 land cover classification. In Proceedings of the Photonics Applications in Astronomy, Communications, Industry, and High-Energy Physics Experiments 2019, Wilga, Poland, 6 November 2019; p. 111763D. [Google Scholar]
- ESA. Mapping Germany’s Agricultural Landscape. ESA, Ed.; 2017. Available online: https://www.esa.int/ESA_Multimedia/Images/2017/2008/Mapping_Germany_s_agricultural_landscape (accessed on 28 April 2020).
- Sitokonstantinou, V.; Papoutsis, I.; Kontoes, C.; Lafarga Arnal, A.; Armesto Andrés, A.P.; Garraza Zurbano, J.A. Scalable Parcel-Based Crop Identification Scheme Using Sentinel-2 Data Time-Series for the Monitoring of the Common Agricultural Policy. Remote Sens. 2018, 10, 911. [Google Scholar] [CrossRef] [Green Version]
- Goldewijk, K.K.; Ramankutty, N.J.L.U. Land use changes during the past 300 years. In Land-Use, Land Cover and Soil Sciences-Volume I: Land Cover, Land-Use and the Global Change; EOLSS: Paris, France, 2009; pp. 147–168. [Google Scholar]
- DeFries, R.S.; Rudel, T.; Uriarte, M.; Hansen, M. Deforestation driven by urban population growth and agricultural trade in the twenty-first century. Nat. Geosci. 2010, 3, 178–181. [Google Scholar] [CrossRef]
- Hansen, M.C.; Potapov, P.V.; Moore, R.; Hancher, M.; Turubanova, S.A.; Tyukavina, A.; Thau, D.; Stehman, S.V.; Goetz, S.J.; Loveland, T.R.; et al. High-Resolution Global Maps of 21st-Century Forest Cover Change. Science 2013, 342, 850–853. [Google Scholar] [CrossRef] [Green Version]
- Sloan, S.; Sayer, J.A. Forest Resources Assessment of 2015 shows positive global trends, but forest loss and degradation persist in poor tropical countries. For. Ecol. Manag. 2015, 352, 134–145. [Google Scholar] [CrossRef] [Green Version]
- Spoto, F.; Martimort, P.; Drusch, M.J.E. Sentinel-2: ESA’s Optical High-Resolution Mission for GMES Operational Services. In Proceedings of the First Sentinel-2 Preparatory Symposium, Frascati, Italy, 23–27 April 2012. [Google Scholar]
- Helber, P.; Bischke, B.; Hees, J.; Dengel, A. Towards a sentinel-2 based human settlement layer. In Proceedings of the IGARSS 2019-2019 IEEE International Geoscience and Remote Sensing Symposium, Yokohama, Japan, 28 July–2 August 2019; pp. 5936–5939. [Google Scholar]
- Woodcock, C.E.; Allen, R.; Anderson, M.; Belward, A.; Bindschadler, R.; Cohen, W.; Gao, F.; Goward, S.N.; Helder, D.; Helmer, E.; et al. Free Access to Landsat Imagery. Science 2008, 320, 1011. [Google Scholar] [CrossRef]
- Phiri, D.; Morgenroth, J. Developments in Landsat land cover classification methods: A review. Remote Sens. 2017, 9, 967. [Google Scholar] [CrossRef] [Green Version]
- Hansen, M.C.; Loveland, T.R. A review of large area monitoring of land cover change using Landsat data. Remote Sens. Environ. 2012, 122, 66–74. [Google Scholar] [CrossRef]
- Yan, L.; Roy, D.; Zhang, H.; Li, J.; Huang, H. An Automated Approach for Sub-Pixel Registration of Landsat-8 Operational Land Imager (OLI) and Sentinel-2 Multi Spectral Instrument (MSI) Imagery. Remote Sens. 2016, 8, 520. [Google Scholar] [CrossRef] [Green Version]
- Miranda, E.; Mutiara, A.B.; Wibowo, W.C. Classification of land cover from Sentinel-2 imagery using supervised classification technique (preliminary study). In Proceedings of the 2018 International Conference on Information Management and Technology (ICIMTech), Jakarta, Indonesia, 3–5 September 2018; pp. 69–74. [Google Scholar]
- Chastain, R.; Housman, I.; Goldstein, J.; Finco, M. Empirical cross sensor comparison of Sentinel-2A and 2B MSI, Landsat-8 OLI, and Landsat-7 ETM+ top of atmosphere spectral characteristics over the conterminous United States. Remote Sens. Environ. 2019, 221, 274–285. [Google Scholar] [CrossRef]
- Blaschke, T. Object based image analysis for remote sensing. ISPRS J. Photogramm. Remote Sens. 2010, 65, 2–16. [Google Scholar] [CrossRef] [Green Version]
- Ma, L.; Li, M.; Ma, X.; Cheng, L.; Du, P.; Liu, Y. A review of supervised object-based land-cover image classification. ISPRS J. Photogramm. Remote Sens. 2017, 130, 277–293. [Google Scholar] [CrossRef]
- Mandanici, E.; Bitelli, G. Preliminary comparison of Sentinel-2 and Landsat 8 imagery for a combined use. Remote Sens. 2016, 8, 1014. [Google Scholar] [CrossRef] [Green Version]
- Inglada, J.; Arias, M.; Tardy, B.; Morin, D.; Valero, S.; Hagolle, O.; Dedieu, G.; Sepulcre, G.; Bontemps, S.; Defourny, P. Benchmarking of algorithms for crop type land-cover maps using Sentinel-2 image time series. In Proceedings of the 2015 IEEE International Geoscience and Remote Sensing Symposium (IGARSS), Milan, Italy, 26–31 July 2015; pp. 3993–3996. [Google Scholar]
- Cai, W.; Zhao, S.; Zhang, Z.; Peng, F.; Xu, J. Comparison of different crop residue indices for estimating crop residue cover using field observation data. In Proceedings of the 2018 7th International Conference on Agro-geoinformatics (Agro-geoinformatics), Hangzhou, China, 6–9 August 2018; pp. 1–4. [Google Scholar]
- Nomura, K.; Mitchard, E. More than meets the eye: Using Sentinel-2 to map small plantations in complex forest landscapes. Remote Sens. 2018, 10, 1693. [Google Scholar] [CrossRef] [Green Version]
- Novelli, A.; Aguilar, M.A.; Nemmaoui, A.; Aguilar, F.J.; Tarantino, E. Performance evaluation of object-based greenhouse detection from Sentinel-2 MSI and Landsat 8 OLI data: A case study from Almería (Spain). Int. J. Appl. Earth Obs. Geoinf. 2016, 52, 403–411. [Google Scholar] [CrossRef] [Green Version]
- Vuolo, F.; Neuwirth, M.; Immitzer, M.; Atzberger, C.; Ng, W.-T. How much does multi-temporal Sentinel-2 data improve crop type classification? Int. J. Appl. Earth Obs. Geoinf. 2018, 72, 122–130. [Google Scholar] [CrossRef]
- Phiri, D.; Simwanda, M.; Nyirenda, V. Mapping the impacts of Cyclone Idai in Mozambique using Sentinel-2 and OBIA Approach. S. Afr. J. Geogr. 2020, 1–22. [Google Scholar] [CrossRef]
- Verhegghen, A.; Eva, H.; Ceccherini, G.; Achard, F.; Gond, V.; Gourlet-Fleury, S.; Cerutti, P. The potential of Sentinel satellites for burnt area mapping and monitoring in the Congo Basin forests. Remote Sensi. 2016, 8, 986. [Google Scholar] [CrossRef] [Green Version]
- Hoque, M.A.-A.; Phinn, S.; Roelfsema, C.; Childs, I. Tropical cyclone disaster management using remote sensing and spatial analysis: A review. Int. J. Disaster Risk Reduct. 2017, 22, 345–354. [Google Scholar] [CrossRef] [Green Version]
- UN-Spider. Recommended Practice: Flood Mapping and Damage Assessment using Sentinel-2 (S2) Optical Data; UN: Queensland, Australia, 2017; Available online: http://www.un-spider.org/advisory-support/recommended-practices/recommended-practice-flood-mapping-and-damage-assessment (accessed on 5 May 2020).
- Gorroño, J.; Banks, A.C.; Fox, N.P.; Underwood, C. Radiometric inter-sensor cross-calibration uncertainty using a traceable high accuracy reference hyperspectral imager. ISPRS J. Photogramm. Remote Sens. 2017, 130, 393–417. [Google Scholar] [CrossRef] [Green Version]
- Gorroño, J.; Fomferra, N.; Peters, M.; Gascon, F.; Underwood, C.I.; Fox, N.P.; Kirches, G.; Brockmann, C.J.R.S. A radiometric uncertainty tool for the Sentinel 2 mission. Remote Sens. 2017, 9, 178. [Google Scholar]
- Phiri, D.; Morgenroth, J.; Xu, C. Four decades of land cover and forest connectivity study in Zambia—An object-based image analysis approach. Int. J. Appl. Earth Obs. Geoinf. 2019, 79, 97–109. [Google Scholar] [CrossRef]
- Chen, J.; Chen, J.; Liao, A.; Cao, X.; Chen, L.; Chen, X.; He, C.; Han, G.; Peng, S.; Lu, M. Global land cover mapping at 30 m resolution: A POK-based operational approach. ISPRS J. Photogramm. Remote Sens. 2015, 103, 7–27. [Google Scholar] [CrossRef] [Green Version]
- Clevers, J.G.; Gitelson, A.A. Remote estimation of crop and grass chlorophyll and nitrogen content using red-edge bands on Sentinel-2 and -3. Int. J. Appl. Earth Obs. Geoinf. 2013, 23, 344–351. [Google Scholar] [CrossRef]
- Martimor, P.; Arino, O.; Berger, M.; Biasutti, R.; Carnicero, B.; Del Bello, U.; Fernandez, V.; Gascon, F.; Silvestrin, P.; Spoto, F. Sentinel-2 optical high-resolution mission for GMES operational services. In Proceedings of the 2007 IEEE International Geoscience and Remote Sensing Symposium, Barcelona, Spain, 23–28 July 2007; pp. 2677–2680. [Google Scholar]
- Young, N.E.; Anderson, R.S.; Chignell, S.M.; Vorster, A.G.; Lawrence, R.; Evangelista, P.H. A survival guide to Landsat preprocessing. Ecology 2017, 98, 920–932. [Google Scholar] [CrossRef] [Green Version]
- Storey, J.; Roy, D.P.; Masek, J.; Gascon, F.; Dwyer, J.; Choate, M.J.R.S.O.E. A note on the temporary misregistration of Landsat-8 Operational Land Imager (OLI) and Sentinel-2 Multi Spectral Instrument (MSI) imagery. Remote Sens. Environ. 2016, 186, 121–122. [Google Scholar] [CrossRef] [Green Version]
- Storey, J.; Choate, M.; Lee, K.J.R.S. Landsat 8 operational land imager on-orbit geometric calibration and performance. Remote sens. 2014, 6, 11127–11152. [Google Scholar] [CrossRef] [Green Version]
- Masek, J.; Ju, J.; Roger, J.-C.; Skakun, S.; Claverie, M.; Dungan, J. Harmonized Landsat/Sentinel-2 products for land monitoring. In Proceedings of the IGARSS 2018-2018 IEEE International Geoscience and Remote Sensing Symposium, Valencia, Spain, 22–27 July 2018; pp. 8163–8165. [Google Scholar]
- Claverie, M.; Ju, J.; Masek, J.G.; Dungan, J.L.; Vermote, E.F.; Roger, J.-C.; Skakun, S.V.; Justice, C. The harmonized Landsat and Sentinel-2 surface reflectance data set. Remote Sens. Environ. 2018, 219, 145–161. [Google Scholar] [CrossRef]
- Pahlevan, N.; Sarkar, S.; Franz, B.A.; Balasubramanian, S.V.; He, J. Sentinel-2 MultiSpectral instrument (MSI) data processing for aquatic science applications: Demonstrations and validations. Remote Sens. Environ. 2017, 201, 47–56. [Google Scholar] [CrossRef]
- ESA. 4th Sentinel-2 validation team meeting. In ESA Abstract Book; ESA: Paris, France, 2020. [Google Scholar]
- Pflug, B.; Makarau, A.; Richter, R. Processing Sentinel-2 data with ATCOR. In Proceedings of the EGU General Assembly Conference Abstracts, Vienna, Austria, 17–22 April 2016; p. 15488. [Google Scholar]
- Main-Knorn, M.; Pflug, B.; Louis, J.; Debaecker, V.; Müller-Wilm, U.; Gascon, F. Sen2Cor for sentinel-2. In Proceedings of the Image and Signal Processing for Remote Sensing XXIII, Warsaw, Poland, 4 October 2017; p. 1042704. [Google Scholar]
- Phiri, D.; Morgenroth, J.; Xu, C.; Hermosilla, T. Effects of pre-processing methods on Landsat OLI-8 land cover classification using OBIA and random forests classifier. Int. J. Appl. Earth Obs. Geoinf. 2018, 73, 170–178. [Google Scholar] [CrossRef]
- Lantzanakis, G.; Mitraka, Z.; Chrysoulakis, N. Comparison of physically and image based atmospheric correction methods for Sentinel-2 satellite imagery. In Perspectives on Atmospheric Sciences; Springer: Cham, Switzerland, 2017; pp. 255–261. [Google Scholar]
- Forkuor, G.; Dimobe, K.; Serme, I.; Tondoh, J.E. Landsat-8 vs. Sentinel-2: Examining the added value of sentinel-2’s red-edge bands to land-use and land-cover mapping in Burkina Faso. GIScience Remote Sens. 2018, 55, 331–354. [Google Scholar] [CrossRef]
- Wu, M.; Yang, C.; Song, X.; Hoffmann, W.C.; Huang, W.; Niu, Z.; Wang, C.; Li, W.; Yu, B. Monitoring cotton root rot by synthetic Sentinel-2 NDVI time series using improved spatial and temporal data fusion. Sci. Rep. 2018, 8, 2016. [Google Scholar] [CrossRef] [Green Version]
- Vanhellemont, Q. Adaptation of the dark spectrum fitting atmospheric correction for aquatic applications of the Landsat and Sentinel-2 archives. Remote Sens. Environ. 2019, 225, 175–192. [Google Scholar] [CrossRef]
- Hagolle, O.; Huc, M.; Villa Pascual, D.; Dedieu, G. A multi-temporal and multi-spectral method to estimate aerosol optical thickness over Land, for the Atmospheric Correction of FormoSat-2, LandSat, VENμS and Sentinel-2 Images. Remote Sens. 2015, 7, 2668–2691. [Google Scholar] [CrossRef] [Green Version]
- De Keukelaere, L.; Sterckx, S.; Adriaensen, S.; Knaeps, E.; Reusen, I.; Giardino, C.; Bresciani, M.; Hunter, P.; Neil, C.; Van der Zande, D.J.E.J.O.R.S. Atmospheric correction of Landsat-8/OLI and Sentinel-2/MSI data using iCOR algorithm: Validation for coastal and inland waters. Eur. J. Remote Sens. 2018, 51, 525–542. [Google Scholar] [CrossRef] [Green Version]
- Zhu, Z.; Wang, S.; Woodcock, C.E. Improvement and expansion of the Fmask algorithm: Cloud, cloud shadow, and snow detection for Landsats 4–7, 8, and Sentinel 2 images. Remote Sens. Environ. 2015, 159, 269–277. [Google Scholar] [CrossRef]
- Frantz, D.; Haß, E.; Uhl, A.; Stoffels, J.; Hill, J. Improvement of the Fmask algorithm for Sentinel-2 images: Separating clouds from bright surfaces based on parallax effects. Remote Sens. Environ. 2018, 215, 471–481. [Google Scholar] [CrossRef]
- Goor, E.; Dries, J.; Daems, D.; Paepen, M.; Niro, F.; Goryl, P.; Mougnaud, P.; Della Vecchia, A. PROBA-V Mission Exploitation Platform. Remote Sens. 2016, 8, 564. [Google Scholar] [CrossRef] [Green Version]
- Coluzzi, R.; Imbrenda, V.; Lanfredi, M.; Simoniello, T.J.R.S.O.E. A first assessment of the Sentinel-2 Level 1-C cloud mask product to support informed surface analyses. Remote Sens. Environ. 2018, 217, 426–443. [Google Scholar] [CrossRef]
- Sekertekin, A.; Marangoz, A.; Akcin, H. Pixel-Based Classification Analysis of Land Use Land Cover Using SENTINEL-2 and LANDSAT-8 Data. Int. Arch. Photogramm. Remote Sens. Spatial Inf. Sci. 2017, 42, 91–93. [Google Scholar] [CrossRef] [Green Version]
- Kaplan, G.; Avdan, U. Object-based water body extraction model using Sentinel-2 satellite imagery. Eur. J. Remote Sens. 2017, 50, 137–143. [Google Scholar] [CrossRef] [Green Version]
- Thanh Noi, P.; Kappas, M. Comparison of Random Forest, k-Nearest Neighbor, and Support Vector Machine Classifiers for Land Cover Classification Using Sentinel-2 Imagery. Sensors 2018, 18, 18. [Google Scholar] [CrossRef] [PubMed] [Green Version]
- Suresh, R.; Sneghalatha, R.; Devishree, S.; Pavethera, K. A Survey on Hyperspectral Image classification Using Machine Learning. Available online: https://www.semanticscholar.org/paper/A-Survey-of-Hyperspectral-Image-Classification-in-Ablin-Sulochana/8e6b723e0c971eafd5151030de7fc4ec18edbee5 (accessed on 7 May 2019).
- Segal-Rozenhaimer, M.; Li, A.; Das, K.; Chirayath, V. Cloud detection algorithm for multi-modal satellite imagery using convolutional neural-networks (CNN). Remote Sens. Environ. 2020, 237, 111446. [Google Scholar] [CrossRef]
- Xiong, J.; Thenkabail, P.S.; Tilton, J.C.; Gumma, M.K.; Teluguntla, P.; Oliphant, A.; Congalton, R.G.; Yadav, K.; Gorelick, N.J.R.S. Nominal 30-m cropland extent map of continental Africa by integrating pixel-based and object-based algorithms using Sentinel-2 and Landsat-8 data on Google Earth Engine. Remote Sens. 2017, 9, 1065. [Google Scholar] [CrossRef] [Green Version]
- Hiestermann, J.; Ferreira, S.L. Cloud-based agricultural solution: A case study of near real-time regional agricultural crop growth information in South Africa. Int. Arch. Photogramm. Remote Sens. Spat. Inf. Sci. 2017, 42, 79–82. [Google Scholar] [CrossRef] [Green Version]
- Lu, D.; Weng, Q. A survey of image classification methods and techniques for improving classification performance. Int. J. Remote Sens. 2007, 28, 823–870. [Google Scholar] [CrossRef]
- Olaode, A.; Naghdy, G.; Todd, C.J.I.J.O.I.P. Unsupervised classification of images: A review. Int. J. Image Process. 2014, 8, 325–342. [Google Scholar]
- Derksen, D.; Inglada, J.; Michel, J. Spatially precise contextual features based on Superpixel Neighborhoods for land cover mapping with high resolution satellite image time series. In Proceedings of the IGARSS 2018-2018 IEEE International Geoscience and Remote Sensing Symposium, Valencia, Spain, 22–27 July 2018; pp. 200–203. [Google Scholar]
- Rujoiu-Mare, M.-R.; Olariu, B.; Mihai, B.-A.; Nistor, C.; Săvulescu, I. Land cover classification in Romanian Carpathians and Subcarpathians using multi-date Sentinel-2 remote sensing imagery. Eur. J. Remote Sens. 2017, 50, 496–508. [Google Scholar] [CrossRef] [Green Version]
- Andersson, J.; Bontemps, M.S. Detecting crop residues burning using Sentinel-2 imagery: Conservation agriculture promotion in Central Malawi. Master’s Thesis, Catholic University of Lovain, Lovain-la-Neuve, Belgium, 2018. Available online: http://hdl.handle.net/2078.1/thesis:17258 (accessed on 7 May 2020).
- Clark, M.L. Comparison of simulated hyperspectral HyspIRI and multispectral Landsat 8 and Sentinel-2 imagery for multi-seasonal, regional land-cover mapping. Remote Sens. Environ. 2017, 200, 311–325. [Google Scholar] [CrossRef]
- Degerickx, J.; Roberts, D.A.; Somers, B. Enhancing the performance of Multiple Endmember Spectral Mixture Analysis (MESMA) for urban land cover mapping using airborne lidar data and band selection. Remote Sens. Environ. 2019, 221, 260–273. [Google Scholar] [CrossRef]
- Colkesen, I.; Kavzoglu, T. Ensemble-based canonical correlation forest (CCF) for land use and land cover classification using sentinel-2 and Landsat OLI imagery. Remote Sens. Lett. 2017, 8, 1082–1091. [Google Scholar] [CrossRef]
- Fragoso-Campón, L.; Quirós, E.; Mora, J.; Gutiérrez, J.A.; Durán-Barroso, P. Accuracy enhancement for land cover classification using LiDAR and multitemporal Sentinel 2 images in a forested watershed. Multidiscip. Digit. Publ. Inst. Proc. 2018, 2, 1280. [Google Scholar] [CrossRef] [Green Version]
- Gašparović, M.; Jogun, T. The effect of fusing Sentinel-2 bands on land-cover classification. Int. J. Remote Sens. 2018, 39, 822–841. [Google Scholar] [CrossRef]
- Glinskis, E.A.; Gutiérrez-Vélez, V.H. Quantifying and understanding land cover changes by large and small oil palm expansion regimes in the Peruvian Amazon. Land Use Policy 2019, 80, 95–106. [Google Scholar] [CrossRef]
- Khaliq, A.; Peroni, L.; Chiaberge, M. Land cover and crop classification using multitemporal sentinel-2 images based on crops phenological cycle. In Proceedings of the 2018 IEEE Workshop on Environmental, Energy, and Structural Monitoring Systems (EESMS), Salerno, Italy, 21–22 June 2018; pp. 1–5. [Google Scholar]
- Kussul, N.; Lavreniuk, M.; Skakun, S.; Shelestov, A. Deep learning classification of land cover and crop types using remote sensing data. IEEE Geosci. Remote Sens. Lett. 2017, 14, 778–782. [Google Scholar] [CrossRef]
- Steinhausen, M.J.; Wagner, P.D.; Narasimhan, B.; Waske, B. Combining Sentinel-1 and Sentinel-2 data for improved land use and land cover mapping of monsoon regions. Int. J. Appl. Earth Obs. Geoinf. 2018, 73, 595–604. [Google Scholar] [CrossRef]
- Weinmann, M.; Weidner, U. Land-cover and land-use classification based on multitemporal Sentinel-2 data. In Proceedings of the IGARSS 2018-2018 IEEE International Geoscience and Remote Sensing Symposium, Valencia, Spain, 22–27 July 2018; pp. 4946–4949. [Google Scholar]
- Zheng, H.; Du, P.; Chen, J.; Xia, J.; Li, E.; Xu, Z.; Li, X.; Yokoya, N. Performance evaluation of downscaling Sentinel-2 imagery for land use and land cover classification by Spectral-Spatial features. Remote Sens. 2017, 9, 1274. [Google Scholar] [CrossRef] [Green Version]
- Gómez, C.; White, J.C.; Wulder, M.A. Optical remotely sensed time series data for land cover classification: A review. ISPRS J. Photogramm. Remote Sens. 2016, 116, 55–72. [Google Scholar] [CrossRef] [Green Version]
- Verrelst, J.; Muñoz, J.; Alonso, L.; Delegido, J.; Rivera, J.P.; Camps-Valls, G.; Moreno, J. Machine-learning regression algorithms for biophysical parameter retrieval: Opportunities for Sentinel-2 and -3. Remote Sens. Environ. 2012, 118, 127–139. [Google Scholar] [CrossRef]
- Belgiu, M.; Csillik, O. Sentinel-2 cropland mapping using pixel-based and object-based time-weighted dynamic time warping analysis. Remote Sens. Environ. 2018, 204, 509–523. [Google Scholar] [CrossRef]
- Dronova, I. Object-based image analysis in wetland research: A review. Remote Sens. 2015, 7, 6380–6413. [Google Scholar] [CrossRef] [Green Version]
- Dong, Q.; Chen, X.; Chen, J.; Zhang, C.; Liu, L.; Cao, X.; Zang, Y.; Zhu, X.; Cui, X.J.R.S. Mapping Winter Wheat in North China Using Sentinel 2A/B Data: A Method Based on Phenology-Time Weighted Dynamic Time Warping. Remote Sens. 2020, 12, 1274. [Google Scholar] [CrossRef] [Green Version]
- Csillik, O.; Belgiu, M. Cropland mapping from Sentinel-2 time series data using object-based image analysis. In Proceedings of the 20th AGILE International Conference on Geographic Information Science Societal Geo-Innovation Celebrating, Wageningen, The Netherlands, 9–12 May 2017. [Google Scholar]
- Delalay, M.; Tiwari, V.; Ziegler, A.D.; Gopal, V.; Passy, P. Land-use and land-cover classification using Sentinel-2 data and machine-learning algorithms: Operational method and its implementation for a mountainous area of Nepal. J. Appl. Remote Sens. 2019, 13, 014530. [Google Scholar] [CrossRef]
- Gómez, V.P.; Medina, V.D.B.; Bengoa, J.L.; García, D.A.N. Accuracy assessment of a 122 classes land cover map based on Sentinel-2, Landsat 8 and Deimos-1 images and Ancillary data. In Proceedings of the IGARSS 2018-2018 IEEE International Geoscience and Remote Sensing Symposium, Valencia, Spain, 22–27 July 2018; pp. 5453–5456. [Google Scholar]
- Heryadi, Y.; Miranda, E. Land cover classification based on Sentinel-2 satellite imagery using Convolutional Neural Network model: A case study in Semarang Area, Indonesia. In Asian Conference on Intelligent Information and Database Systems; Springer: Cham, Switzerland, 2019; pp. 191–206. [Google Scholar]
- Kaplan, G.; Avdan, U. Mapping and monitoring wetlands using sentinel-2 satellite imagery. In Proceedings of the ISPRS Annals of the Photogrammetry, Remote Sensing and Spatial Information Sciences, Volume IV-4/W4, 2017 4th International GeoAdvances Workshop, Safranbolu, Karabuk, Turkey, 14–15 October 2017. [Google Scholar]
- Kolokoussis, P.; Karathanassi, V. Oil spill detection and mapping using sentinel 2 imagery. J. Mar. Sci. Eng. 2018, 6, 4. [Google Scholar] [CrossRef] [Green Version]
- Labib, S.M.; Harris, A. The potentials of Sentinel-2 and LandSat-8 data in green infrastructure extraction, using object-based image analysis (OBIA) method. Eur. J. Remote Sens. 2018, 51, 231–240. [Google Scholar] [CrossRef]
- Laurent, V.C.E.; Schaepman, M.E.; Verhoef, W.; Weyermann, J.; Chávez, R.O. Bayesian object-based estimation of LAI and chlorophyll from a simulated Sentinel-2 top-of-atmosphere radiance image. Remote Sens. Environ. 2014, 140, 318–329. [Google Scholar] [CrossRef]
- Lu, L.; Tao, Y.; Di, L. Object-Based Plastic-Mulched Landcover Extraction Using Integrated Sentinel-1 and Sentinel-2 Data. Remote Sens. 2018, 10, 1820. [Google Scholar] [CrossRef] [Green Version]
- Marangoz, A.M.; Sekertekin, A.; Akçin, H. Analysis of land use land cover classification results derived from sentinel-2 image. In Proceedings of the 17th International Multidisciplinary Scientific GeoConference Surveying Geology and Mining Ecology Management, SGEM, Albena, Bulgaria, 29 June–5 July 2017; pp. 25–32. [Google Scholar]
- Sánchez-Espinosa, A.; Schröder, C.J.J. Land use and land cover mapping in wetlands one step closer to the ground: Sentinel-2 versus landsat 8. J. Environ. Manag. 2019, 247, 484–498. [Google Scholar] [CrossRef]
- Mongus, D.; Žalik, B. Segmentation schema for enhancing land cover identification: A case study using Sentinel 2 data. Int. J. Appl. Earth Obs. Geoinf. 2018, 66, 56–68. [Google Scholar] [CrossRef]
- Popescu, A.; Faur, D.; Vaduva, C.; Datcu, M. Enhanced classification of land cover through joint analysis of Sentinel-1 and Sentinel-2 data. In Proceedings of the ESA Living Planet Symposium, Prague, CzechRepublic, 9–13 May 2016; pp. 9–13. [Google Scholar]
- Li, C.; Wang, J.; Wang, L.; Hu, L.; Gong, P. Comparison of classification algorithms and training sample sizes in urban land classification with Landsat thematic mapper imagery. Remote Sens. 2014, 6, 964–983. [Google Scholar] [CrossRef] [Green Version]
- Ruppert, G.; Hussain, M.; Müller, H.J.A.J.O.S. Accuracy assessment of satellite image classification depending on training sample. Austrian J. Stat. 1999, 28, 195–201. [Google Scholar] [CrossRef]
- Topaloğlu, R.H.; Sertel, E.; Musaoğlu, N. Assessment of classification accuracies of sentinel-2 and landsat-8 data for land cover/use mapping. Int. Arch. Photogramm. Remote Sens. Spat. Inf. Sci. 2016, 41, 1055–1059. [Google Scholar] [CrossRef]
- Blesius, L.; Weirich, F. The use of the Minnaert correction for land-cover classification in mountainous terrain. Int. J. Remote Sens. 2005, 26, 3831–3851. [Google Scholar] [CrossRef]
- Wang, Q.; Shi, W.; Li, Z.; Atkinson, P.M. Fusion of Sentinel-2 images. Remote Sens. Environ. 2016, 187, 241–252. [Google Scholar] [CrossRef] [Green Version]
- da Silveira, H.L.F.; Galvão, L.S.; Sanches, I.D.A.; de Sá, I.B.; Taura, T.A. Use of MSI/Sentinel-2 and airborne LiDAR data for mapping vegetation and studying the relationships with soil attributes in the Brazilian semi-arid region. Int. J. Appl. Earth Obs. Geoinf. 2018, 73, 179–190. [Google Scholar] [CrossRef]
- Mura, M.; Bottalico, F.; Giannetti, F.; Bertani, R.; Giannini, R.; Mancini, M.; Orlandini, S.; Travaglini, D.; Chirici, G. Exploiting the capabilities of the Sentinel-2 multi spectral instrument for predicting growing stock volume in forest ecosystems. Int. J. Appl. Earth Obs. Geoinf. 2018, 66, 126–134. [Google Scholar] [CrossRef]
- Yang, X.; Qin, Q.; Grussenmeyer, P.; Koehl, M. Urban surface water body detection with suppressed built-up noise based on water indices from Sentinel-2 MSI imagery. Remote Sens. Environ. 2018, 219, 259–270. [Google Scholar] [CrossRef]
- Delegido, J.; Verrelst, J.; Alonso, L.; Moreno, J. Evaluation of sentinel-2 red-edge bands for empirical estimation of green LAI and chlorophyll content. Sensors 2011, 11, 7063–7081. [Google Scholar] [CrossRef] [PubMed] [Green Version]
- Ozigis, M.; Kaduk, J.; Jarvis, C. Synergistic application of Sentinel 1 and Sentinel 2 derivatives for terrestrial oil spill impact mapping. In Proceedings of the Active and Passive Microwave Remote Sensing for Environmental Monitoring II, Berlin, Germany, 20 November 2018; p. 107880R. [Google Scholar]
- Wang, Q.; Atkinson, P.M. Spatio-temporal fusion for daily sentinel-2 images. Remote Sens. Environ. 2018, 204, 31–42. [Google Scholar] [CrossRef] [Green Version]
- Guzinski, R.; Nieto, H. Evaluating the feasibility of using Sentinel-2 and Sentinel-3 satellites for high-resolution evapotranspiration estimations. Remote Sens. Environ. 2019, 221, 157–172. [Google Scholar] [CrossRef]
- Szantoi, Z.; Strobl, P. Copernicus Sentinel-2 Calibration and Validation; Taylor & Francis: New York, NY, USA, 2019. [Google Scholar]
- Pardo-Pascual, J.E.; Sánchez-García, E.; Almonacid-Caballer, J.; Palomar-Vázquez, J.M.; Priego De Los Santos, E.; Fernández-Sarría, A.; Balaguer-Beser, Á.J.R.S. Assessing the accuracy of automatically extracted shorelines on microtidal beaches from Landsat 7, Landsat 8 and Sentinel-2 imagery. Remote Sens. 2018, 10, 326. [Google Scholar] [CrossRef] [Green Version]
- Szostak, M.; Hawryło, P.; Piela, D. Using of Sentinel-2 images for automation of the forest succession detection. Eur. J. Remote Sens. 2018, 51, 142–149. [Google Scholar] [CrossRef]
- Wang, D.; Wan, B.; Qiu, P.; Su, Y.; Guo, Q.; Wang, R.; Sun, F.; Wu, X.J.R.S. Evaluating the performance of sentinel-2, landsat 8 and pléiades-1 in mapping mangrove extent and species. Remote Sens. 2018, 10, 1468. [Google Scholar] [CrossRef] [Green Version]
- Nzimande, N.; Mutanga, O.; Kiala, Z.; Sibanda, M.J.S.A.G.J. Mapping the spatial distribution of the yellowwood tree (Podocarpus henkelii) in the Weza-Ngele forest using the newly launched Sentinel-2 multispectral imager data. S. Afr. Geogr. J. 2020, 1–19. [Google Scholar] [CrossRef]
- Naidoo, L.; Van Deventer, H.; Ramoelo, A.; Mathieu, R.; Nondlazi, B.; Gangat, R. Estimating above ground biomass as an indicator of carbon storage in vegetated wetlands of the grassland biome of South Africa. Int. J. Appl. Earth Obs. Geoinf. 2019, 78, 118–129. [Google Scholar] [CrossRef]
- Bulut, S.; Gunlut, A. Determination of total carbon storage using Sentinel-2 and geographic information systems in mixed forests. Anadolu Orman Araştırmaları Dergisi 2019, 5, 127–135. [Google Scholar]
- Adjognon, G.S.; Rivera-Ballesteros, A.; van Soest, D.J.D.E. Satellite-based tree cover mapping for forest conservation in the drylands of Sub Saharan Africa (SSA): Application to Burkina Faso gazetted forests. Dev. Eng. 2019, 4, 100039. [Google Scholar] [CrossRef]
- Laurin, G.V.; Puletti, N.; Hawthorne, W.; Liesenberg, V.; Corona, P.; Papale, D.; Chen, Q.; Valentini, R.J.R.S.O.E. Discrimination of tropical forest types, dominant species, and mapping of functional guilds by hyperspectral and simulated multispectral Sentinel-2 data. Remote Sens. Environ. 2016, 176, 163–176. [Google Scholar] [CrossRef] [Green Version]
- Shikwambana, L.; Ncipha, X.; Malahlela, O.E.; Mbatha, N.; Sivakumar, V. Characterisation of aerosol constituents from wildfires using satellites and model data: A case study in Knysna, South Africa. Int. J. Remote Sens. 2019, 40, 4743–4761. [Google Scholar] [CrossRef]
- Caballero, I.; Ruiz, J.; Navarro, G.J.W. Sentinel-2 satellites provide Near-Real time evaluation of catastrophic floods in the West Mediterranean. Wate 2019, 11, 2499. [Google Scholar] [CrossRef] [Green Version]
- Al-Gaadi, K.A.; Hassaballa, A.A.; Tola, E.; Kayad, A.G.; Madugundu, R.; Alblewi, B.; Assiri, F.J.P.O. Prediction of potato crop yield using precision agriculture techniques. PLoS ONE 2016, 11, e0162219. [Google Scholar] [CrossRef] [PubMed]
- Lebourgeois, V.; Dupuy, S.; Vintrou, É.; Ameline, M.; Butler, S.; Bégué, A.J.R.S. A combined random forest and OBIA classification scheme for mapping smallholder agriculture at different nomenclature levels using multisource data (simulated Sentinel-2 time series, VHRS and DEM). Remote Sens. 2017, 9, 259. [Google Scholar] [CrossRef] [Green Version]
- Vogels, M.F.; De Jong, S.; Sterk, G.; Douma, H.; Addink, E. Spatio-temporal patterns of smallholder irrigated agriculture in the horn of Africa using GEOBIA and Sentinel-2 imagery. Remote Sens. 2019, 11, 143. [Google Scholar] [CrossRef] [Green Version]
- Estrada, J.; Sánchez, H.; Hernanz, L.; Checa, M.J.; Roman, D. Enabling the Use of Sentinel-2 and LiDAR Data for Common Agriculture Policy Funds Assignment. ISPRS Int. J. Geo-Inf. 2017, 6, 255. [Google Scholar] [CrossRef] [Green Version]
- Gao, Q.; Zribi, M.; Escorihuela, M.J.; Baghdadi, N.J.S. Synergetic use of Sentinel-1 and Sentinel-2 data for soil moisture mapping at 100 m resolution. Sensor 2017, 17, 1966. [Google Scholar] [CrossRef] [PubMed] [Green Version]
- Haas, J.; Ban, Y. Sentinel-1A SAR and sentinel-2A MSI data fusion for urban ecosystem service mapping. Remote Sens. Appl. Soc. Environ. 2017, 8, 41–53. [Google Scholar] [CrossRef]
- Puletti, N.; Chianucci, F.; Castaldi, C. Use of Sentinel-2 for forest classification in Mediterranean environments. Ann. Silvic. Res. 2017, 42, 32–38. [Google Scholar]
- Sibanda, M.; Mutanga, O.; Dube, T.; S Vundla, T.; L Mafongoya, P. Estimating LAI and mapping canopy storage capacity for hydrological applications in wattle infested ecosystems using Sentinel-2 MSI derived red edge bands. GIScience Remote Sens. 2019, 56, 68–86. [Google Scholar] [CrossRef]
- Clasen, A.; Somers, B.; Pipkins, K.; Tits, L.; Segl, K.; Brell, M.; Kleinschmit, B.; Spengler, D.; Lausch, A.; Förster, M.J.R.S. Spectral unmixing of forest crown components at close range, airborne and simulated Sentinel-2 and EnMAP spectral imaging scale. Remote Sens. 2015, 7, 15361–15387. [Google Scholar] [CrossRef] [Green Version]
- Whyte, A.; Ferentinos, K.P.; Petropoulos, G.P. A new synergistic approach for monitoring wetlands using Sentinels-1 and 2 data with object-based machine learning algorithms. Environ. Model. Softw. 2018, 104, 40–54. [Google Scholar] [CrossRef] [Green Version]
- Richter, K.; Hank, T.B.; Vuolo, F.; Mauser, W.; D’Urso, G.J.R.S. Optimal exploitation of the Sentinel-2 spectral capabilities for crop leaf area index mapping. Remote Sens. 2012, 4, 561–582. [Google Scholar] [CrossRef] [Green Version]
- Puliti, S.; Saarela, S.; Gobakken, T.; Ståhl, G.; Næsset, E. Combining UAV and Sentinel-2 auxiliary data for forest growing stock volume estimation through hierarchical model-based inference. Remote Sens. Environ. 2018, 204, 485–497. [Google Scholar] [CrossRef]
- Kattenborn, T.; Lopatin, J.; Förster, M.; Braun, A.C.; Fassnacht, F.E. UAV data as alternative to field sampling to map woody invasive species based on combined Sentinel-1 and Sentinel-2 data. Remote Sens. Environ. 2019, 227, 61–73. [Google Scholar] [CrossRef]
- Ng, W.-T.; Rima, P.; Einzmann, K.; Immitzer, M.; Atzberger, C.; Eckert, S.J.R.S. Assessing the potential of Sentinel-2 and Pléiades data for the detection of Prosopis and Vachellia spp. in Kenya. Remote Sens. 2017, 9, 74. [Google Scholar] [CrossRef] [Green Version]
- Roteta, E.; Bastarrika, A.; Padilla, M.; Storm, T.; Chuvieco, E.J.R.S.O.E. Development of a Sentinel-2 burned area algorithm: Generation of a small fire database for sub-Saharan Africa. Remote Sens. Environ. 2019, 222, 1–17. [Google Scholar] [CrossRef]
- Navarro, G.; Caballero, I.; Silva, G.; Parra, P.-C.; Vázquez, Á.; Caldeira, R. Evaluation of forest fire on Madeira Island using Sentinel-2A MSI imagery. Int. J. Appl. Earth Obs. Geoinf. 2017, 58, 97–106. [Google Scholar] [CrossRef] [Green Version]
- Martinis, S.; Caspard, M.; Plank, S.; Clandillon, S.; Haouet, S. Mapping burn scars, fire severity and soil erosion susceptibility in Southern France using multisensoral satellite data. In Proceedings of the 2017 IEEE International Geoscience and Remote Sensing Symposium (IGARSS), Fort Worth, TX, USA, 23–28 July 2017; pp. 1099–1102. [Google Scholar]
- Mondal, P.; Liu, X.; Fatoyinbo, T.E.; Lagomasino, D.J.R.S. Evaluating combinations of Sentinel-2 data and Machine-Learning Algorithms for Mangrove mapping in West Africa. Remote Sens. 2019, 11, 2928. [Google Scholar] [CrossRef] [Green Version]
- Gress, S.K.; Huxham, M.; Kairo, J.G.; Mugi, L.M.; Briers, R.A.J.G.C.B. Evaluating, predicting and mapping belowground carbon stores in Kenyan mangroves. Glob. Chang. Biol. 2017, 23, 224–234. [Google Scholar] [CrossRef] [PubMed] [Green Version]
- Pham, T.D.; Xia, J.; Baier, G.; Le, N.N.; Yokoya, N. Mangrove species mapping using Sentinel-1 and Sentinel-2 Data in North Vietnam. In Proceedings of the IGARSS 2019-2019 IEEE International Geoscience and Remote Sensing Symposium, Yokohama, Japan, 28 July–2 August 2019; pp. 6102–6105. [Google Scholar]
- Majasalmi, T.; Rautiainen, M. The potential of Sentinel-2 data for estimating biophysical variables in a boreal forest: A simulation study. Remote Sens. Lett. 2016, 7, 427–436. [Google Scholar] [CrossRef]
- Shoko, C.; Mutanga, O.; Dube, T.; Slotow, R. Characterizing the spatio-temporal variations of C3 and C4 dominated grasslands aboveground biomass in the Drakensberg, South Africa. Int. J. Appl. Earth Obs. Geoinf. 2018, 68, 51–60. [Google Scholar] [CrossRef] [Green Version]
- Gholizadeh, A.; Žižala, D.; Saberioon, M.; Borůvka, L. Soil organic carbon and texture retrieving and mapping using proximal, airborne and Sentinel-2 spectral imaging. Remote Sens. Environ. 2018, 218, 89–103. [Google Scholar] [CrossRef]
- Suresh, G.; Hovenbitzer, M. Quantification of forest extent in Germany by combining multi-temporal stacks of Sentinel-1 and Sentinel-2 images. In Proceedings of the Sixth International Conference on Remote Sensing and Geoinformation of the Environment (RSCy2018), Paphos, Cyprus, 6 August 2018; p. 107730N. [Google Scholar]
- Filchev, L.J.A.R.I.B. Land-use/land-cover change of Bistrishko Branishte biosphere reserve using Sentinel-2 simulated data. Aerosp. Res. Bulg. 2015, 27, 54–65. [Google Scholar]
- Konko, Y.; Rudant, J.P.; Akpamou, G.K.; Noumonvi, K.D.; Kokou, K. Spatio-Temporal Distribution of Southeastern Community Forests in Togo (West Africa). Geosci. Environ. Prot. 2018, 6, 51. [Google Scholar] [CrossRef] [Green Version]
- Mutowo, G.; Mutanga, O.; Masocha, M. Mapping foliar N in miombo woodlands using sentinel-2 derived chlorophyll and structural indices. J. Appl. Remote Sens. 2018, 12, 046028. [Google Scholar] [CrossRef]
- Ramoelo, A.; Cho, M.; Mathieu, R.; Skidmore, A.K. Potential of Sentinel-2 spectral configuration to assess rangeland quality. J. Appl. Remote Sens. 2015, 9, 094096. [Google Scholar] [CrossRef] [Green Version]
- Darvishzadeh, R.; Skidmore, A.; Abdullah, H.; Cherenet, E.; Ali, A.; Wang, T.; Nieuwenhuis, W.; Heurich, M.; Vrieling, A.; O’Connor, B.; et al. Mapping leaf chlorophyll content from Sentinel-2 and RapidEye data in spruce stands using the invertible forest reflectance model. Int. J. Appl. Earth Obs. Geoinf. 2019, 79, 58–70. [Google Scholar] [CrossRef] [Green Version]
- Chrysafis, I.; Mallinis, G.; Siachalou, S.; Patias, P. Assessing the relationships between growing stock volume and Sentinel-2 imagery in a Mediterranean forest ecosystem. Remote Sens. Lett. 2017, 8, 508–517. [Google Scholar] [CrossRef]
- Astola, H.; Häme, T.; Sirro, L.; Molinier, M.; Kilpi, J. Comparison of Sentinel-2 and Landsat 8 imagery for forest variable prediction in boreal region. Remote Sens. Environ. 2019, 223, 257–273. [Google Scholar] [CrossRef]
- Wittke, S.; Yu, X.; Karjalainen, M.; Hyyppä, J.; Puttonen, E. Comparison of two-dimensional multitemporal Sentinel-2 data with three-dimensional remote sensing data sources for forest inventory parameter estimation over a boreal forest. Int. J. Appl. Earth Obs. Geoinf. 2019, 76, 167–178. [Google Scholar] [CrossRef]
- Yesou, H.; Pottier, E.; Mercier, G.; Grizonnet, M.; Haouet, S.; Giros, A.; Faivre, R.; Huber, C.; Michel, J. Synergy of Sentinel-1 and Sentinel-2 imagery for wetland monitoring information extraction from continuous flow of sentinel images applied to water bodies and vegetation mapping and monitoring. In Proceedings of the 2016 IEEE International Geoscience and Remote Sensing Symposium (IGARSS), Beijing, China, 10–15 July 2016; pp. 162–165. [Google Scholar]
- Mahdianpari, M.; Salehi, B.; Mohammadimanesh, F.; Homayouni, S.; Gill, E. The first wetland inventory map of newfoundland at a spatial resolution of 10 m using sentinel-1 and sentinel-2 data on the google earth engine cloud computing platform. Remote Sens. 2019, 11, 43. [Google Scholar] [CrossRef] [Green Version]
- Dimitrov, P.; Kamenova, I.; Roumenina, E.; Filchev, L.; Ilieva, I.; Jelev, G.; Gikov, A.; Banov, M.; Krasteva, V.; Kolchakov, V.; et al. Estimation of biophysical and biochemical variables of winter wheat through Sentinel-2 vegetation indices. Bulg. J. Agric. Sci. 2019, 25, 819–832. [Google Scholar]
- Nedkov, R. Quantitative assessment of forest degradation after fire using ortogonalized satellite images from SENTINEL-2. Comptes Rendus de l’Academie Bulgare Sci. 2018, 71, 83–86. [Google Scholar]
- Munyati, C. The potential for integrating Sentinel 2 MSI with SPOT 5 HRG and Landsat 8 OLI imagery for monitoring semi-arid savannah woody cover. Int. J. Remote Sens. 2017, 38, 4888–4913. [Google Scholar] [CrossRef]
- Dotzler, S.; Hill, J.; Buddenbaum, H.; Stoffels, J.J.R.S. The potential of EnMAP and Sentinel-2 data for detecting drought stress phenomena in deciduous forest communities. Remote Sens. 2015, 7, 14227–14258. [Google Scholar] [CrossRef] [Green Version]
- Sothe, C.; Almeida, C.M.D.; Liesenberg, V.; Schimalski, M.B.J.R.S. Evaluating Sentinel-2 and Landsat-8 data to map sucessional forest stages in a subtropical forest in Southern Brazil. Remote Sens. 2017, 9, 838. [Google Scholar] [CrossRef] [Green Version]
- Hojas-Gascon, L.; Belward, A.; Eva, H.; Ceccherini, G.; Hagolle, O.; Garcia, J.; Cerutti, P. Potential improvement for forest cover and forest degradation mapping with the forthcoming Sentinel-2 program. Int. Arch. Photogramm. Remote Sens. Spat. Inf. Sci. 2015, 40, 417. [Google Scholar] [CrossRef] [Green Version]
- Hawryło, P.; Bednarz, B.; Wężyk, P.; Szostak, M. Estimating defoliation of Scots pine stands using machine learning methods and vegetation indices of Sentinel-2. Eur. J. Remote Sens. 2018, 51, 194–204. [Google Scholar] [CrossRef] [Green Version]
- Lange, M.; Dechant, B.; Rebmann, C.; Vohland, M.; Cuntz, M.; Doktor, D.J.S. Validating MODIS and sentinel-2 NDVI products at a temperate deciduous forest site using two independent ground-based sensors. Sensor 2017, 17, 1855. [Google Scholar] [CrossRef] [PubMed] [Green Version]
- Pandit, S.; Tsuyuki, S.; Dube, T. Estimating above-ground biomass in sub-tropical buffer zone community forests, Nepal, using Sentinel 2 data. Remote Sens. 2018, 10, 601. [Google Scholar] [CrossRef] [Green Version]
- Bontemps, S.; Arias, M.; Cara, C.; Dedieu, G.; Guzzonato, E.; Hagolle, O.; Inglada, J.; Matton, N.; Morin, D.; Popescu, R.J.R.S. Building a data set over 12 globally distributed sites to support the development of agriculture monitoring applications with Sentinel-2. Remote Sens. 2015, 7, 16062–16090. [Google Scholar] [CrossRef] [Green Version]
- Bontemps, S.; Arias, M.; Cara, C.; Dedieu, G.; Guzzonato, E.; Hagolle, O.; Inglada, J.; Morin, D.; Rabaute, T.; Savinaud, M. “Sentinel-2 for agriculture”: Supporting global agriculture monitoring. In Proceedings of the 2015 IEEE International Geoscience and Remote Sensing Symposium (IGARSS), Milan, Italy, 26–31 July 2015; pp. 4185–4188. [Google Scholar]
- OneSoil. An AgriTech Start-up from Belarus Demonstrates That Societal and Economic Benefits of Copernicus go Beyond the Borders of the European Union; ESA: Paris, France, 2019. [Google Scholar]
- Bellemans, N.; Bontemps, S.; Defourny, P. Sentinel-2 for Agriculture project: Preparing Sentinel-2 operational exploitation for supporting national and global crop monitoring. In Proceedings of the 6th Digital Earth Summit, ISDE, Beijing, China, 7–8 July 2016. [Google Scholar]
- Lambert, M.-J.; Traoré, P.C.S.; Blaes, X.; Baret, P.; Defourny, P. Estimating smallholder crops production at village level from Sentinel-2 time series in Mali’s cotton belt. Remote Sens. Environ. 2018, 216, 647–657. [Google Scholar] [CrossRef]
- Taona, M.T. Crop Type Mapping in a Highly Heterogeneous Agriculture Landscape: A Case of Marble Hall Using Multi-Temporal Landsat 8 and Sentinel 2 Imageries. Master’s Thesis, University of the Witwatersrand, Johannesburg, South Africa, 2019. [Google Scholar]
- Kussul, N.; Kolotii, A.; Shelestov, A.; Lavreniuk, M.; Bellemans, N.; Bontemps, S.; Defourny, P.; Koetz, B. Sentinel-2 for agriculture national demonstration in Ukraine: Results and further steps. In Proceedings of the 2017 IEEE International Geoscience and Remote Sensing Symposium (IGARSS), Fort Worth, TX, USA, 23–28 July 2017; pp. 5842–5845. [Google Scholar]
- Schlemmer, M.; Gitelson, A.; Schepers, J.; Ferguson, R.; Peng, Y.; Shanahan, J.; Rundquist, D. Remote estimation of nitrogen and chlorophyll contents in maize at leaf and canopy levels. Int. J. Appl. Earth Obs. Geoinf 2013, 25, 47–54. [Google Scholar] [CrossRef] [Green Version]
- Dhau, I.; Adam, E.; Mutanga, O.; Ayisi, K.; Abdel-Rahman, E.M.; Odindi, J.; Masocha, M. Testing the capability of spectral resolution of the new multispectral sensors on detecting the severity of grey leaf spot disease in maize crop. Geocarto Int. 2018, 33, 1223–1236. [Google Scholar] [CrossRef]
- Chemura, A.; Mutanga, O.; Odindi, J. Empirical modeling of leaf chlorophyll content in coffee (coffea arabica) plantations with sentinel-2 msi data: Effects of spectral settings, spatial resolution, and crop canopy cover. Remote Sens. 2017, 10, 5541–5550. [Google Scholar] [CrossRef]
- Vogels, M.; De Jong, S.; Sterk, G.; Addink, E. Mapping irrigated agriculture in complex landscapes using object-based image analysis. In Proceedings of the GEOBIA 2018-From Pixels to Ecosystems and Global Sustainability, Montpellier, France, 4–7 June 2018. [Google Scholar]
- Zheng, Q.; Huang, W.; Cui, X.; Shi, Y.; Liu, L.J.S. New spectral index for detecting wheat yellow rust using sentinel-2 multispectral imagery. Sensors 2018, 18, 868. [Google Scholar] [CrossRef] [Green Version]
- Mutanga, O.; Dube, T.; Galal, O. Remote sensing of crop health for food security in Africa: Potentials and constraints. Remote Sens. Appl. Soc. Environ. 2017, 8, 231–239. [Google Scholar] [CrossRef]
- Chemura, A.; Mutanga, O.; Dube, T.J.P.A. Separability of coffee leaf rust infection levels with machine learning methods at Sentinel-2 MSI spectral resolutions. Precis. Agric. 2017, 18, 859–881. [Google Scholar] [CrossRef]
- Xie, Q.; Dash, J.; Huete, A.; Jiang, A.; Yin, G.; Ding, Y.; Peng, D.; Hall, C.C.; Brown, L.; Shi, Y.; et al. Retrieval of crop biophysical parameters from Sentinel-2 remote sensing imagery. Int. J. Appl. Earth Obs. Geoinf. 2019, 80, 187–195. [Google Scholar] [CrossRef]
- Upreti, D.; Huang, W.; Kong, W.; Pascucci, S.; Pignatti, S.; Zhou, X.; Ye, H.; Casa, R. A comparison of hybrid machine learning algorithms for the retrieval of wheat biophysical variables from Sentinel-2. Remote Sens. 2019, 11, 481. [Google Scholar] [CrossRef] [Green Version]
- Frampton, W.J.; Dash, J.; Watmough, G.; Milton, E.J. Evaluating the capabilities of Sentinel-2 for quantitative estimation of biophysical variables in vegetation. ISPRS J. Photogramm. Remote Sens. 2013, 82, 83–92. [Google Scholar] [CrossRef] [Green Version]
- Verrelst, J.; Rivera, J.P.; Leonenko, G.; Alonso, L.; Moreno, J. Optimizing LUT-Based RTM Inversion for Semiautomatic Mapping of Crop Biophysical Parameters from Sentinel-2 and -3 Data: Role of Cost Functions. IEEE Trans. Geosci. Remote Sens. 2014, 52, 257–269. [Google Scholar] [CrossRef]
- Zheng, B.; Campbell, J.B.; Serbin, G.; Galbraith, J.M.J.S.; Research, T. Remote sensing of crop residue and tillage practices: Present capabilities and future prospects. Soil Tillage Res. 2014, 138, 26–34. [Google Scholar] [CrossRef]
- Veloso, A.; Mermoz, S.; Bouvet, A.; Le Toan, T.; Planells, M.; Dejoux, J.-F.; Ceschia, E. Understanding the temporal behavior of crops using Sentinel-1 and Sentinel-2-like data for agricultural applications. Remote Sens. Environ. 2017, 199, 415–426. [Google Scholar] [CrossRef]
- Dimitrov, P.; Dong, Q.; Eerens, H.; Gikov, A.; Filchev, L.; Roumenina, E.; Jelev, G. Sub-Pixel crop type classification using PROBA-V 100 m NDVI time series and reference data from Sentinel-2 classifications. Remote Sens. 2019, 11, 1370. [Google Scholar] [CrossRef] [Green Version]
- Delloye, C.; Weiss, M.; Defourny, P. Retrieval of the canopy chlorophyll content from Sentinel-2 spectral bands to estimate nitrogen uptake in intensive winter wheat cropping systems. Remote Sens. Environ. 2018, 216, 245–261. [Google Scholar] [CrossRef]
- Zhang, T.; Su, J.; Liu, C.; Chen, W.-H.; Liu, H.; Liu, G. Band selection in Sentinel-2 satellite for agriculture applications. In Proceedings of the 2017 23rd International Conference on Automation and Computing (ICAC), Huddersfield, UK, 7–8 September 2017; pp. 1–6. [Google Scholar]
- Valero, S.; Morin, D.; Inglada, J.; Sepulcre, G.; Arias, M.; Hagolle, O.; Dedieu, G.; Bontemps, S.; Defourny, P.; Koetz, B.J.R.S. Production of a dynamic cropland mask by processing remote sensing image series at high temporal and spatial resolutions. Remote Sens. 2016, 8, 55. [Google Scholar] [CrossRef] [Green Version]
- El Hajj, M.; Baghdadi, N.; Zribi, M.; Bazzi, H.J.R.S. Synergic use of Sentinel-1 and Sentinel-2 images for operational soil moisture mapping at high spatial resolution over agricultural areas. Remote Sens. 2017, 9, 1292. [Google Scholar] [CrossRef] [Green Version]
- Sadeghi, M.; Babaeian, E.; Tuller, M.; Jones, S.B. The optical trapezoid model: A novel approach to remote sensing of soil moisture applied to Sentinel-2 and Landsat-8 observations. Remote Sens. Environ. 2017, 198, 52–68. [Google Scholar] [CrossRef] [Green Version]
- Tavares, P.A.; Beltrão, N.E.S.; Guimarães, U.S.; Teodoro, A.C.J.S. Integration of sentinel-1 and sentinel-2 for classification and LULC mapping in the urban area of Belém, eastern Brazilian Amazon. Sensors 2019, 19, 1140. [Google Scholar] [CrossRef] [PubMed] [Green Version]
- Chunping, Q.; Schmitt, M.; Lichao, M.; Xiaoxiang, Z. Urban local climate zone classification with a residual convolutional Neural Network and multi-seasonal Sentinel-2 images. In Proceedings of the 2018 10th IAPR Workshop on Pattern Recognition in Remote Sensing (PRRS), Beijing, China, 19–20 August 2018; pp. 1–5. [Google Scholar]
- Møller-Jensen, L. Mapping the rural-urban transition zone: Peri-urban development in Accra, Ghana. In Proceedings of the EARSEL-SIG 5th Joint Workshop, “Urban Remote Sensing–Challenges & Solutions”, Bochum, Germany, 4–26 September 2018. [Google Scholar]
- Gibson, L.; Engelbrecht, J.; Rush, D. Detecting historic informal settlement fires with sentinel 1 and 2 satellite data-Two case studies in Cape Town. Fire Saf. J. 2019, 108, 102828. [Google Scholar] [CrossRef]
- Yang, X.; Chen, L. Evaluation of automated urban surface water extraction from Sentinel-2A imagery using different water indices. J. Appl. Remote Sens. 2017, 11, 026016. [Google Scholar] [CrossRef]
- Simwanda, M.; Murayama, Y. Integrating geospatial techniques for urban land use classification in the developing sub-Saharan African city of Lusaka, Zambia. ISPRS Int. J. Geo-Inf. 2017, 6, 102. [Google Scholar] [CrossRef] [Green Version]
- Haas, J.; Ban, Y. Urban Land Cover and Ecosystem Service Changes based on Sentinel-2A MSI and Landsat TM Data. IEEE J. Sel. Top. Appl. Earth Obs. Remote Sens. 2018, 11, 485–497. [Google Scholar] [CrossRef]
- Kranjčić, N.; Medak, D.; Župan, R.; Rezo, M.J.R.S. Support Vector Machine Accuracy Assessment for Extracting Green Urban Areas in Towns. Remote Sens. 2019, 11, 655. [Google Scholar]
- Gombe, K.E.; Asanuma, I.; Park, J.-G. Quantification of annual urban growth of Dar es Salaam Tanzania from Landsat time Series data. Adv. Remote Sens. 2017, 6, 175–191. [Google Scholar] [CrossRef] [Green Version]
- Kääb, A.; Altena, B.; Mascaro, J. Coseismic displacements of the 14 November 2016 Mw 7.8 Kaikoura, New Zealand, earthquake using the Planet optical cubesat constellation. Nat. Hazards Earth Syst. Sci. 2017, 17, 627–639. [Google Scholar] [CrossRef] [Green Version]
- Gray, D.M.; Burton-Johnson, A.; Fretwell, P.T. Evidence for a lava lake on Mt. Michael volcano, Saunders Island (South Sandwich Islands) from Landsat, Sentinel-2 and ASTER satellite imagery. J. Volcanol. Geotherm. Res. 2019, 379, 60–71. [Google Scholar] [CrossRef]
- Jelének, J.; Kopačková, V.; Fárová, K. Post-earthquake landslide distribution assessment using sentinel-1 and-2 data: The example of the 2016 mw 7.8 earthquake in New Zealand. Multidiscip. Digit. Publ. Inst. Proc. 2018, 2, 361. [Google Scholar] [CrossRef] [Green Version]
- Iannelli, G.C.; Gamba, P. Jointly exploiting Sentinel-1 and Sentinel-2 for urban mapping. In Proceedings of the IGARSS 2018-2018 IEEE International Geoscience and Remote Sensing Symposium, Valencia, Spain, 22–27 July 2018; pp. 8209–8212. [Google Scholar]
- Yang, X.; Zhao, S.; Qin, X.; Zhao, N.; Liang, L.J.R.S. Mapping of urban surface water bodies from Sentinel-2 MSI imagery at 10 m resolution via NDWI-based image sharpening. Remote Sens. 2017, 9, 596. [Google Scholar] [CrossRef] [Green Version]
- Sekertekin, A.; Cicekli, S.Y.; Arslan, N. Index-based identification of surface water resources using Sentinel-2 satellite imagery. In Proceedings of the 2018 2nd International Symposium on Multidisciplinary Studies and Innovative Technologies (ISMSIT), Ankara, Turkey, 11–13 October 2018; pp. 1–5. [Google Scholar]
- Qiu, C.; Schmitt, M.; Ghamisi, P.; Zhu, X. Effect of the training set configuration on sentinel-2-based urban local climate zone classification. In Proceedings of the International Archives of the Photogrammetry, Remote Sensing and Spatial Information Sciences Symposium, Riva del Garda, Italy, 4–7 June 2018. [Google Scholar]
- Daudt, R.C.; Le Saux, B.; Boulch, A.; Gousseau, Y. Urban change detection for multispectral earth observation using convolutional neural networks. In Proceedings of the IGARSS 2018-2018 IEEE International Geoscience and Remote Sensing Symposium, Valencia, Spain, 22–27 July 2018; pp. 2115–2118. [Google Scholar]
- Recanatesi, F.; Giuliani, C.; Ripa, M.N.J.S. Monitoring Mediterranean Oak decline in a peri-urban protected area using the NDVI and Sentinel-2 images: The case study of Castelporziano State Natural Reserve. Sustainability 2018, 10, 3308. [Google Scholar] [CrossRef] [Green Version]
- Kaloustian, N.; Bechtel, B.J.P.E. Local climatic zoning and urban heat island in Beirut. Procedia Eng. 2016, 169, 216–223. [Google Scholar] [CrossRef]
- Qiu, C.; Mou, L.; Schmitt, M.; Zhu, X.X. Local climate zone-based urban land cover classification from multi-seasonal Sentinel-2 images with a recurrent residual network. ISPRS J. Photogramm. Remote Sens. 2019, 154, 151–162. [Google Scholar] [CrossRef] [PubMed]
- Stumpf, A.; Michéa, D.; Malet, J.-P. Improved co-registration of Sentinel-2 and Landsat-8 imagery for earth surface motion measurements. Remote Sens. 2018, 10, 160. [Google Scholar] [CrossRef] [Green Version]
- Valade, S.; Ley, A.; Massimetti, F.; D’Hondt, O.; Laiolo, M.; Coppola, D.; Loibl, D.; Hellwich, O.; Walter, T.R. Towards global volcano monitoring using multisensor sentinel missions and artificial intelligence: The mounts monitoring system. Remote Sens. 2019, 11, 1528. [Google Scholar] [CrossRef] [Green Version]


| Criteria | Details |
|---|---|
| Keywords | “Sentinel-2” AND “land cover”, “Sentinel-2” AND “landcover”, “Sentinel-2” AND “Forest”, “Sentinel-2” AND “Agriculture”, and “Sentinel-2” AND “urban” |
| Document type | Journal articles, book chapters and conference proceedings, reports |
| Language | English |
| Publication period | 2015 to 2020 |
| Sentinel-2A | Sentinel-2B | ||||
|---|---|---|---|---|---|
| Spatial Resolution (m) | Bands | Central wavelength (nm) | Bandwidth (nm) | Central Wavelength (nm) | Bandwidth (nm) |
| 10 | Band 2—Blue | 492.4 | 66 | 492.1 | 66 |
| Band 3—Green | 559.8 | 36 | 559 | 36 | |
| Band 4—Red | 664.6 | 31 | 664.9 | 31 | |
| Band 8—NIR | 832.8 | 106 | 832.9 | 106 | |
| 20 | Band 6—Red edge | 740.5 | 15 | 739.1 | 15 |
| Band 7—Red edge | 782.8 | 20 | 779.7 | 20 | |
| Band 8A—Narrow NIR | 864.7 | 21 | 864 | 22 | |
| Band 11—SWIR | 1613.7 | 91 | 1610.4 | 94 | |
| Band 12—SWIR | 2202.4 | 175 | 2185.7 | 185 | |
| 60 | Band 1—Coastal aerosol | 442.7 | 21 | 442.2 | 21 |
| Band 9—Water vapour | 945.1 | 20 | 943.2 | 21 | |
| Band 10—SWIR—Cirrus | 1373.5 | 31 | 1376.9 | 30 | |
| Study | Land Cover/Use | Classification Method | Classifier | Accuracy (%) |
|---|---|---|---|---|
| Clark [83] | Bareland, built-up area, vegetation, crops | Subpixel | MESMA, RF | 74–84 |
| Colkesen, et al. [85] | forest, soil, water, corn, barren, impervious surfaces | pixel-based | CCF | 87–95 |
| Degerickx, et al. [84] | Roof, pavement, soil, shrub, tree | Sub-pixel | MESMA | 57–90 |
| Denize, et al. [7] | Crop residues, bare soil, winter crop, grassland | Supervised pixel-based | SVM, RF | 81 |
| Forkuor, et al. [62] | Agriculture, urban | Supervised pixel-based | RF, SVM, ANN | 87–92 |
| Fragoso-Campón, et al. [86] | Forest, shrubs, water, rocks | Supervised pixel-based | RF | 73–79 |
| Gašparović, et al. [87] | Water, built-up, bare soil, forests | Supervised classification | MLC, ANN | 83–91 |
| Glinskis, et al. [88] | Oil pam | Supervised pixel-based | MLC | 60–70 |
| Immitzer, et al. [8] | Maize, onion, sunflower, sugar beet | pixel-based | RF | 65–76 |
| Khaliq, et al. [89] | Water, Cabbage, Maize, built-up | Supervised pixel-based | RF | 91 |
| Kussul, et al. [90] | Crops, bareland, water | Unsupervised pixel-based | ANN | 88–94 |
| Miranda, et al. [31] | Water, forest, urban bareland | Supervised pixel-based | MLC | 100 |
| Pesaresi, et al. [12] | Built-up area | Supervised pixel-based | SML | 60 |
| Rujoiu-Mare, et al. [81] | Forest, waterbodies, built-up | Supervised pixel-based | MLC, SVM | 92–98 |
| Sekertekin, et al. [71] | Waterbody, settlement, bareland, vegetation | Supervised pixel-based | MLC | 78–85 |
| Steinhausen, et al. [91] | Cropland, forest grassland, urban areas, water | Supervised pixel-based | RF | 89–91 |
| Thanh Noi, et al. [73] | Residential, impervious surface, agriculture, bareland, forest, water | Supervised pixel based | RF, SVM, KNN | 90–95 |
| Vuolo, et al. [40] | Carrot, Maize, potato Pumpkin | Supervised pixel-based | RF | 91–95 |
| Weinmann, et al. [92] | Forest, garden, Fields, settlements | Supervised pixel-based | SVM | 72–80 |
| Study | Land Cover/Use | Classification Method | Classifier | Accuracy (%) |
|---|---|---|---|---|
| Dong, et al. [98] | Cropland | OBIA-Classifier | RF | 78–96 |
| Clark [83] | Bareland, built-up area, vegetation, crops | OBIA-Classifier | RF | 75–84 |
| Csillik, et al. [99] | Wheat, maize, rice, sunflower, forest, unclassified | OBIA-Rule based | Ruleset | 78–98 |
| Delalay, et al. [100] | settlement, industry, water, forest | OBIA-classifier | RF, CT | 61–95 |
| Derksen, et al. [80] | Crops, road, orchards | OBIA-Contexture | Contextual | 80–90 |
| Gašparović, et al. [87] | Water, built-up, bare soil, forests | OBIA-Classifier | ANN | 83– 91 |
| Gašparović, et al. [87] | Water, built-up, bare soil, low vegetation, forest | OBIA-Rule based | Ruleset | 84–91 |
| Gómez, et al. [101] | Winter, wheat, Others, Built-up | OBIA-Classifier | RF | 84–98 |
| Heryadi, et al. [102] | forest, water body, urban, bare land | OBIA-classifier | k-NN | 80–98 |
| Immitzer, et al. [8] | Maize, onion, sunflower, sugar beet | OBIA-Classifier | RF | 65–76 |
| Kaplan, et al. [103] | Water, Forest, wetland, urban, green field, dry fields | OBIA-Rule based | Ruleset | 89–90 |
| Kaplan, et al. [72] | Water, Forest, wetland, urban, green field, dry fields | OBIA-Rule based | Ruleset | 88–90 |
| Kolokoussis, et al. [104] | Land, seawater, oil spill, possibly dissolved oil spill | OBIA-Rule based | Ruleset | 72–91 |
| Labib, et al. [105] | Built-up, water, vegetation, Shadow | OBIA-Rule based | Ruleset | 67–71 |
| Laurent, et al. [106] | Canopy, brown leaves, green leaves | OBIA-Classifier | Bayesian | 96–98 |
| Lu, et al. [107] | Plastic-mulched land-cover, crops | OBIA-Classifier | CT | 88–90 |
| Marangoz, et al. [108] | forest, water body, urban | OBIA-Rule based | Ruleset | 80–88 |
| Marangoz, et al. [109] | Bare land, forest, settlement, vegetation, water | OBIA-Rule based | Ruleset | 66–76 |
| Mongus, et al. [110] | Agriculture, forest, Water, grassland | OBIA-Classifier | Naïve Bayes | 88–95 |
| Novelli, et al. [39] | Greenhouse | OBIA-Classifier | RF | 89–93 |
| Phiri, et al. [41] | Water, built-up area, forests | OBIA-Classifier | RF | 67–91 |
| Popescu, et al. [111] | urban area, water, forest, agriculture | OBIA-Classifier | Latent Dirichlet Allocation (LDA) | - |
| Weinmann, et al. [92] | Settlement, industry, water, forest | OBIA-Classifier | RF | 80–83 |
| Xiong, et al. [76] | Cropland | OBIA-Google Earth Engine | SVM, RF | 68–85 |
| Zheng, et al. [93] | Roads, bareland, Forest | OBIA-Classifier | KNN, ANN, RF, SVM | 70–90 |
| Application | Specific Application | Country | Methods | Accuracy | Reference |
|---|---|---|---|---|---|
| Forest | Forest extent | Poland, China, Burkina Faso, South Africa, Madagascar, Zimbabwe, Bulgaria | Machine-learning, cloud computing | 80–90% | Suresh, et al. [158], Wang, et al. [127], [126], Adjognon, et al. [131]; Nzimande, et al. [128]; Filchev [159] |
| Forest types | Italy, Ghana, South Africa, Togo | Linear discrimination analysis, spectral indices, Machine learning | 88–90% | Laurin, et al. [132]; Konko, et al. [160]; Puletti, et al. [141], Laurin, et al. [132] | |
| Species Identification | Germany, Italy | OBIA-RF, Stepwise regression | 65–76% | Immitzer, et al. [8], Laurin, et al. [132] | |
| Forest productivity | Germany, South Africa, Southern Africa | Machine-learning (Random Forest), Invertible Forest Reflectance Model | 90–92% | Mutowo, et al. [161]; Ramoelo, et al. [162]; Darvishzadeh, et al. [163] | |
| Growing stock | Norway, Greece, Italy, Finland | Fusion with UAV data, Linear regression | SE=3.4–5.8% | Puliti, et al. [146], Chrysafis, et al. [164], Mura, et al. [118] | |
| Forest Inventory | Finland, Norway | Fusion with UAV data, multivariable models | SE=3.4–5.8% | Puliti, et al. [146], Astola, et al. [165], [166] | |
| Wetland mapping | China, Canada, South Africa, Senegal, Ghana | machine-learning, Google Earth Engine, OBIA | 83–90% | Yesou, et al. [167], Mahdianpari, et al. [168], Whyte, et al. [144]; Mondal, et al. [152] | |
| Leaf Area Index (LAI) | Finland, Germany, South Africa, Bulgaria | Red-edge band with Partial Least Squares Regression (PLSR), Spectral Indices | R2 = 91% | Clasen, et al. [143], Korhonen, et al. [11], Sibanda, et al. [142]; Dimitrov, et al. [169] | |
| Forest Fires/Wildfire | Madeira Island, Bulgaria, Congo DRC, Africa (continent) | Active fire products with SAR data fusion, New Algorithm | 80–89% | Verhegghen, et al. [42]; Roteta, et al. [149]; Navarro, et al. [150], Nedkov [170], Filchev [159] | |
| Dryland mapping | German, South Africa | Sub-pixel classification, BiomeBGC Simulations | 82% | Munyati [171], Dotzler, et al. [172] | |
| Grassland mapping | South Africa | Sparse Partial Least Squares Regression (SPLSR) | R2 = 59% | Shoko, et al. [156] | |
| Canopy cover | Finland, German | Generalized additive models, Spectral Unmixing and UAVs | RMSE = 0.05–0.42 | Korhonen, et al. [11], Clasen, et al. [143] | |
| Forest succession | Brazil, Poland | SVM, RF, OBIA | 90–97% | Sothe, et al. [173], Szostak, et al. [126] | |
| Forest Degradation | Bulgaria, Tanzania | OBIA-RF | R2 = 0.97, 95% | Hojas-Gascon, et al. [174], Nedkov [170] | |
| Forest healthy | Poland | Machine-learning | 75–78 | Hawryło, et al. [175] | |
| Forest phenology | German | Correlation with ground sensor | R2 = 0.99 | Lange, et al. [176] | |
| Biomass assessment | Above-ground biomass | Vietnam, Finland, South Africa, Zimbabwe, Italy | Machine-Learning, SPLSR, PARAS, Regression analysis | 80–91% | Pham, et al. [154], Pandit, et al. [177]; Shoko, et al. [156], Majasalmi, et al. [155], Laurin, et al. [132] |
| Below grown biomass | Turkey | Regression analysis, Supervised classification | R2 = 97% | Bulut, et al. [130] | |
| Carbon Assessment | Carbon assessment | Czech Republic, Turkey, South Africa | Bootstrapped Random Forest, Regression analysis, multivariate regression models | R2 = 30–75% | Bulut, et al. [130], Naidoo, et al. [129], Gholizadeh, et al. [157] |
| Application | Country | Methods | Accuracy | Reference |
|---|---|---|---|---|
| Crop diseases | China, South Africa, Zimbabwe | Random Forest | 77–94% | Zheng, et al. [189], Dhau, et al. [186]; Chemura, et al. [191] |
| Crop residue | Spain, Malawi | Maximum likelihood, OBIA, regression | 90–97% | Andersson, et al. [82], Estrada, et al. [138], Zheng, et al. [196] |
| Crop type detection | Ukraine, France, Austria, Zimbabwe, Ethiopia, Bulgaria | Deep learning, Random Forest, Support vector regression | 77–96% | Kussul, et al. [184], Chemura, et al. [187]; Vogels, et al. [188], Vuolo, et al. [40], Veloso, et al. [197]; Dimitrov, et al. [198] |
| Crop yield focusing/productivity | Belgium, Saudi Arabia, Ukraine, Zimbabwe, Mali | Deep learning, Random Forest, Maximum likelihood, Spectral indices | 35–96% | Lambert, et al. [182]; Hiestermann, et al. [77], Al-Gaadi, et al. [135], Delloye, et al. [199] |
| Cropland extent | United Kingdom, Madagascar, Ukraine Global Dataset (Burkina Faso, South Africa, Morocco, Madagascar) | Cloud-based computing, Machine-learning, OBIA | 64.4–96% | Zhang, et al. [200], Bontemps, et al. [178]; Inglada, et al. [201], Lebourgeois, et al. [136], Kussul, et al. [184] |
| Irrigation crop | Ethiopia, Global Dataset (Burkina Faso, South Africa, Morocco, Madagascar) | Object-based | 94% | Vogels, et al. [137]; Vogels, et al. [188] |
| Nitrogen content | Belgium, Bulgaria | Multivariant regression | 65–90%, RMSE = 0.25 | Clevers, et al. [185], Dimitrov, et al. [169] |
| Real-time crop monitoring | South Africa | Cloud-based computing (Google Earth Engine) | - | Hiestermann, et al. [77] |
| Smallholder crop monitoring | Mali, Ethiopia | Supervised pixel-based, object-based | 80–94% | Lambert, et al. [182]; Vogels, et al. [137] |
| Soil properties | Spain, France, USA | Multivariant analysis, Neural Network, TRApezoid Model | 64–88% | Gao, et al. [139], El Hajj, et al. [202], Sadeghi, et al. [203] |
| Biophysical parameter estimates | France, Spain, Bulgaria | neural networks (NN), support vector regression (SVR), kernel ridge regression (KRR), and Gaussian processes regression (GPR) | RMSE = 0.1–0.2 | Upreti, et al. [193]; Xie, et al. [192], Dimitrov, et al. [169] |
| Application | Specific Application | Country | Methods | Accuracy | Reference |
|---|---|---|---|---|---|
| Urban | Urban expansion | Brazil, China, Tanzania, Kenya | Spectral Indices, RF | 75–92% | Gombe, et al. [212]; Ng, et al. [148]; Iannelli, et al. [216]; Tavares, et al. [204] |
| Urban extent | China, Brazil | Fusion | 83% | Iannelli, et al. [216]; Tavares, et al. [204] | |
| Rural-urban transition | Ghana | Principal Components Analysis (PCA) | - | Møller-Jensen [206] | |
| Informal settlement | South Africa | Cloud-based computing (Google Earth Engine) | - | Gibson, et al. [207] | |
| Urban surface water | China, Macedonia | Pixel-based/OBIA | 80–92% | Yang, et al. [217], Yang, et al. [208], Sekertekin, et al. [218] | |
| Urban climate | France, Germany | Canonical Correlation Forests | 69–75% | Qiu, et al. [219] | |
| Urban change | France | Convolutional Neural Networks (CNN) | 60–91 | Daudt, et al. [220] | |
| Urban ecosystem/forest/green space | Slovakia, Switzerland | SVM, Maximum likelihood | 73–90% | Haas, et al. [140], Recanatesi, et al. [221] | |
| Urban heat island | Lebanon, France, German | MLC, Neural Network | 82–84% | Kaloustian, et al. [222]; Qiu, et al. [223], Chunping, et al. [205] | |
| Natural hazards | Floods | Spain, Mozambique | Spectral indices and OBIA | 64–85% | Caballero, et al. [134], Phiri, et al. [41] |
| Droughts | Germany, South Africa | Spectral Mixture Analysis, Biome-BGC Simulations | 73–82% | Munyati [171], Dotzler, et al. [172] | |
| Earthquakes | New Zealand, France | cross-correlation | RMSE= 0.025–0.20 | Kääb, et al. [213], Jelének, et al. [215], Stumpf, et al. [224] | |
| Volcanic eruption | Saunders Island, Germany | Correlation, visual assessment, Convolutional neural network (CNN) | RMSE = 0.03 | Gray, et al. [214], Valade, et al. [225] |
© 2020 by the authors. Licensee MDPI, Basel, Switzerland. This article is an open access article distributed under the terms and conditions of the Creative Commons Attribution (CC BY) license (http://creativecommons.org/licenses/by/4.0/).
Share and Cite
Phiri, D.; Simwanda, M.; Salekin, S.; Nyirenda, V.R.; Murayama, Y.; Ranagalage, M. Sentinel-2 Data for Land Cover/Use Mapping: A Review. Remote Sens. 2020, 12, 2291. https://doi.org/10.3390/rs12142291
Phiri D, Simwanda M, Salekin S, Nyirenda VR, Murayama Y, Ranagalage M. Sentinel-2 Data for Land Cover/Use Mapping: A Review. Remote Sensing. 2020; 12(14):2291. https://doi.org/10.3390/rs12142291
Chicago/Turabian StylePhiri, Darius, Matamyo Simwanda, Serajis Salekin, Vincent R. Nyirenda, Yuji Murayama, and Manjula Ranagalage. 2020. "Sentinel-2 Data for Land Cover/Use Mapping: A Review" Remote Sensing 12, no. 14: 2291. https://doi.org/10.3390/rs12142291