Next Issue
Volume 11, April-1
Previous Issue
Volume 11, March-1
 
 
remotesensing-logo

Journal Browser

Journal Browser

Remote Sens., Volume 11, Issue 6 (March-2 2019) – 134 articles

Cover Story (view full-size image): 
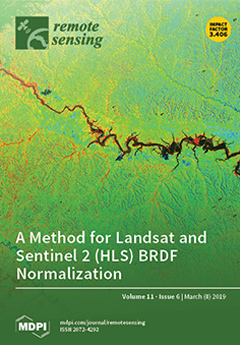
The Harmonized Landsat/Sentinel-2 (HLS) project generates a seamless surface reflectance product by combining observations from Landsat-8 and Sentinel-2. These satellites’ sampling characteristics can generate a difference in observation geometry of up to 20°. Variations in the seasonal illumination also impact the surface reflectance. These angular effects are especially stronger in the tropics, where the scan direction of Landsat and Sentinel-2 is closely aligned with the solar principal plane. This HLS image of the Brazillian Amazon forest shows the impact of these effects in the near infrared directional surface reflectance, showing higher values on the western side where the view angle is larger. This work presents a model to derive the bidirectional reflectance distribution function (BRDF) normalization of the HLS product. View this paper
  • Issues are regarded as officially published after their release is announced to the table of contents alert mailing list.
  • You may sign up for e-mail alerts to receive table of contents of newly released issues.
  • PDF is the official format for papers published in both, html and pdf forms. To view the papers in pdf format, click on the "PDF Full-text" link, and use the free Adobe Reader to open them.
Order results
Result details
Section
Select all
Export citation of selected articles as:
26 pages, 13474 KiB  
Article
Towards a Long-Term Reanalysis of Land Surface Variables over Western Africa: LDAS-Monde Applied over Burkina Faso from 2001 to 2018
by Moustapha Tall, Clément Albergel, Bertrand Bonan, Yongjun Zheng, Françoise Guichard, Mamadou Simina Dramé, Amadou Thierno Gaye, Luc Olivier Sintondji, Fabien C. C. Hountondji, Pinghouinde Michel Nikiema and Jean-Christophe Calvet
Remote Sens. 2019, 11(6), 735; https://doi.org/10.3390/rs11060735 - 26 Mar 2019
Cited by 18 | Viewed by 5161
Abstract
This study focuses on the ability of the global Land Data Assimilation System, LDAS-Monde, to improve the representation of land surface variables (LSVs) over Burkina-Faso through the joint assimilation of satellite derived surface soil moisture (SSM) and leaf area index (LAI) from January [...] Read more.
This study focuses on the ability of the global Land Data Assimilation System, LDAS-Monde, to improve the representation of land surface variables (LSVs) over Burkina-Faso through the joint assimilation of satellite derived surface soil moisture (SSM) and leaf area index (LAI) from January 2001 to June 2018. The LDAS-Monde offline system is forced by the latest European Centre for Medium-Range Weather Forecasts (ECMWF) atmospheric reanalysis ERA5 as well as ERA-Interim former reanalysis, leading to reanalyses of LSVs at 0.25° × 0.25° and 0.50° × 0.50° spatial resolution, respectively. Within LDAS-Monde, SSM and LAI observations from the Copernicus Global Land Service (CGLS) are assimilated with a simplified extended Kalman filter (SEKF) using the CO2-responsive version of the ISBA (Interactions between Soil, Biosphere, and Atmosphere) land surface model (LSM). First, it is shown that ERA5 better represents precipitation and incoming solar radiation than ERA-Interim former reanalysis from ECMWF based on in situ data. Results of four experiments are then compared: Open-loop simulation (i.e., no assimilation) and analysis (i.e., joint assimilation of SSM and LAI) forced by either ERA5 or ERA-Interim. After jointly assimilating SSM and LAI, it is noticed that the assimilation is able to impact soil moisture in the first top soil layers (the first 20 cm), and also in deeper soil layers (from 20 cm to 60 cm and below), as reflected by the structure of the SEKF Jacobians. The added value of using ERA5 reanalysis over ERA-Interim when used in LDAS-Monde is highlighted. The assimilation is able to improve the simulation of both SSM and LAI: The analyses add skill to both configurations, indicating the healthy behavior of LDAS-Monde. For LAI in particular, the southern region of the domain (dominated by a Sudan-Guinean climate) highlights a strong impact of the assimilation compared to the other two sub-regions of Burkina-Faso (dominated by Sahelian and Sudan-Sahelian climates). In the southern part of the domain, differences between the model and the observations are the largest, prior to any assimilation. These differences are linked to the model failing to represent the behavior of some specific vegetation species, which are known to put on leaves before the first rains of the season. The LDAS-Monde analysis is very efficient at compensating for this model weakness. Evapotranspiration estimates from the Global Land Evaporation Amsterdam Model (GLEAM) project as well as upscaled carbon uptake from the FLUXCOM project and sun-induced fluorescence from the Global Ozone Monitoring Experiment-2 (GOME-2) are used in the evaluation process, again demonstrating improvements in the representation of evapotranspiration and gross primary production after assimilation. Full article
Show Figures

Graphical abstract

20 pages, 4094 KiB  
Article
Optimization Performance Comparison of Three Different Group Intelligence Algorithms on a SVM for Hyperspectral Imagery Classification
by Xiufang Zhu, Nan Li and Yaozhong Pan
Remote Sens. 2019, 11(6), 734; https://doi.org/10.3390/rs11060734 - 26 Mar 2019
Cited by 52 | Viewed by 4346
Abstract
Group intelligence algorithms have been widely used in support vector machine (SVM) parameter optimization due to their obvious characteristics of strong parallel processing ability, fast optimization, and global optimization. However, few studies have made optimization performance comparisons of different group intelligence algorithms on [...] Read more.
Group intelligence algorithms have been widely used in support vector machine (SVM) parameter optimization due to their obvious characteristics of strong parallel processing ability, fast optimization, and global optimization. However, few studies have made optimization performance comparisons of different group intelligence algorithms on SVMs, especially in terms of their application to hyperspectral remote sensing classification. In this paper, we compare the optimization performance of three different group intelligence algorithms that were run on a SVM in terms of five aspects by using three hyperspectral images (one each of the Indian Pines, University of Pavia, and Salinas): the stability to parameter settings, convergence rate, feature selection ability, sample size, and classification accuracy. Particle swarm optimization (PSO), genetic algorithms (GAs), and artificial bee colony (ABC) algorithms are the three group intelligence algorithms. Our results showed the influence of these three optimization algorithms on the C-parameter optimization of the SVM was less than their influence on the σ-parameter. The convergence rate, the number of selected features, and the accuracy of the three group intelligence algorithms were statistically significant different at the p = 0.01 level. The GA algorithm could compress more than 70% of the original data and it was the least affected by sample size. GA-SVM had the highest average overall accuracy (91.77%), followed by ABC-SVM (88.73%), and PSO-SVM (86.65%). Especially, in complex scenes (e.g., the Indian Pines image), GA-SVM showed the highest classification accuracy (87.34%, which was 8.23% higher than ABC-SVM and 16.42% higher than PSO-SVM) and the best stability (the standard deviation of its classification accuracy was 0.82%, which was 5.54% lower than ABC-SVM, and 21.63% lower than PSO-SVM). Therefore, when compared with the ABC and PSO algorithms, the GA had more advantages in terms of feature band selection, small sample size classification, and classification accuracy. Full article
(This article belongs to the Section Remote Sensing Image Processing)
Show Figures

Figure 1

29 pages, 11609 KiB  
Article
Automated Mapping of Woody Debris over Harvested Forest Plantations Using UAVs, High-Resolution Imagery, and Machine Learning
by Lloyd Windrim, Mitch Bryson, Michael McLean, Jeremy Randle and Christine Stone
Remote Sens. 2019, 11(6), 733; https://doi.org/10.3390/rs11060733 - 26 Mar 2019
Cited by 28 | Viewed by 5243
Abstract
Surveying of woody debris left over from harvesting operations on managed forests is an important step in monitoring site quality, managing the extraction of residues and reconciling differences in pre-harvest inventories and actual timber yields. Traditional methods for post-harvest survey involving manual assessment [...] Read more.
Surveying of woody debris left over from harvesting operations on managed forests is an important step in monitoring site quality, managing the extraction of residues and reconciling differences in pre-harvest inventories and actual timber yields. Traditional methods for post-harvest survey involving manual assessment of debris on the ground over small sample plots are labor-intensive, time-consuming, and do not scale well to heterogeneous landscapes. In this paper, we propose and evaluate new automated methods for the collection and interpretation of high-resolution, Unmanned Aerial Vehicle (UAV)-borne imagery over post-harvested forests for estimating quantities of fine and coarse woody debris. Using high-resolution, geo-registered color mosaics generated from UAV-borne images, we develop manual and automated processing methods for detecting, segmenting and counting both fine and coarse woody debris, including tree stumps, exploiting state-of-the-art machine learning and image processing techniques. Results are presented using imagery over a post-harvested compartment in a Pinus radiata plantation and demonstrate the capacity for both manual image annotations and automated image processing to accurately detect and quantify coarse woody debris and stumps left over after harvest, providing a cost-effective and scalable survey method for forest managers. Full article
Show Figures

Graphical abstract

16 pages, 348 KiB  
Article
Pre-launch Radiometric Characterization of JPSS-2 VIIRS Thermal Emissive Bands
by Jeff McIntire, David Moyer, Hassan Oudrari and Xiaoxiong Xiong
Remote Sens. 2019, 11(6), 732; https://doi.org/10.3390/rs11060732 - 26 Mar 2019
Cited by 2 | Viewed by 2928
Abstract
The Joint Polar Satellite System 2 (JPSS-2) Visible Infrared Imaging Radiometer Suite (VIIRS) is the third in its series of sensors designed to produce high quality data products for environmental and climate data records once launched. To meet this goal, the VIIRS instrument [...] Read more.
The Joint Polar Satellite System 2 (JPSS-2) Visible Infrared Imaging Radiometer Suite (VIIRS) is the third in its series of sensors designed to produce high quality data products for environmental and climate data records once launched. To meet this goal, the VIIRS instrument must be calibrated and characterized prior to launch. A comprehensive test program was conducted at the Raytheon Space and Airborne Systems facility in 2016–2017, including extensive environmental testing. The pre-launch thermal band radiometric performance and stability is the focus of this work including: the evaluation of a number of sensor performance metrics, comparison to the design requirements, and the estimation of uncertainties. Comparisons of the thermal band performance to the earlier Suomi National Polar-orbiting Partnership (SNPP) and JPSS-1 VIIRS instruments as well as the design specifications have shown that JPSS-2 VIIRS exhibits similar performance to its predecessors. The differences of note (decreased blackbody uniformity, reduced dynamic range for bands M15 and M16, and improved performance with respect to striping) are small and not expected to have a significant impact on the science products. Full article
(This article belongs to the Collection Visible Infrared Imaging Radiometers and Applications)
Show Figures

Figure 1

17 pages, 6397 KiB  
Article
Remote Sensing of Water Use Efficiency and Terrestrial Drought Recovery across the Contiguous United States
by Behzad Ahmadi, Ali Ahmadalipour, Glenn Tootle and Hamid Moradkhani
Remote Sens. 2019, 11(6), 731; https://doi.org/10.3390/rs11060731 - 26 Mar 2019
Cited by 52 | Viewed by 7383
Abstract
Ecosystem water-use efficiency (WUE) is defined as the ratio of carbon gain (i.e., gross primary productivity; GPP) to water consumption (i.e., evapotranspiration; ET). WUE is markedly influential on carbon and water cycles, both of which are fundamental for ecosystem state, climate and the [...] Read more.
Ecosystem water-use efficiency (WUE) is defined as the ratio of carbon gain (i.e., gross primary productivity; GPP) to water consumption (i.e., evapotranspiration; ET). WUE is markedly influential on carbon and water cycles, both of which are fundamental for ecosystem state, climate and the environment. Drought can affect WUE, subsequently disturbing the composition and functionality of terrestrial ecosystems. In this study, the impacts of drought on WUE and its components (i.e., GPP and ET) are assessed across the Contiguous US (CONUS) at fine spatial and temporal resolutions. Soil moisture simulations from land surface modeling are utilized to detect and characterize agricultural drought episodes and remotely sensed GPP and ET are retrieved from the moderate resolution imaging spectroradiometer (MODIS). GPP, as the biome vitality indicator against drought stress, is employed to investigate drought recovery and the ecosystems’ required time to revert to pre-drought condition. Results show that drought recovery duration indicates a positive correlation with drought severity and duration, meaning that a protracted drought recovery is more likely to happen following severe droughts with prolonged duration. WUE is found to almost always increase in response to severe (or worse) drought episodes. Additionally, ET anomalies are negatively correlated with drought severity and ET is expected to decrease during severe (or worse) drought episodes. Lastly, the changes of WUE are decomposed in relation to its components and the cross-relation among the variables is revealed and a consistent changing pattern is detected. Full article
(This article belongs to the Special Issue Remote Sensing of Hydrological Extremes)
Show Figures

Graphical abstract

20 pages, 3319 KiB  
Article
Microwave Vegetation Index from Multi-Angular Observations and Its Application in Vegetation Properties Retrieval: Theoretical Modelling
by Somayeh Talebiesfandarani, Tianjie Zhao, Jiancheng Shi, Paolo Ferrazzoli, Jean-Pierre Wigneron, Mehdi Zamani and Peejush Pani
Remote Sens. 2019, 11(6), 730; https://doi.org/10.3390/rs11060730 - 26 Mar 2019
Cited by 10 | Viewed by 4340
Abstract
Monitoring global vegetation dynamics is of great importance for many environmental applications. The vegetation optical depth (VOD), derived from passive microwave observation, is sensitive to the water content in all aboveground vegetation and could serve as complementary information to optical observations for global [...] Read more.
Monitoring global vegetation dynamics is of great importance for many environmental applications. The vegetation optical depth (VOD), derived from passive microwave observation, is sensitive to the water content in all aboveground vegetation and could serve as complementary information to optical observations for global vegetation monitoring. The microwave vegetation index (MVI), which is originally derived from the zero-order model, is a potential approach to derive VOD and vegetation water content (VWC), however, it has limited application at dense vegetation in the global scale. In this study, we preferred to use a more complex vegetation model, the Tor Vergata model, which takes into account multi-scattering effects inside the vegetation and between the vegetation and soil layer. Validation with ground-based measurements proved this model is an efficient tool to describe the microwave emissions of corn and wheat. The MVI has been derived through two methods: (i) polarization independent ( MVI B P ) and (ii) time invariant ( MVI B T ), based on model simulations at the L band. Results show that the MVI B T has a stronger sensitivity to vegetation properties compared with MVI B P . MVI B T is used to retrieve VOD and VWC, and the results were compared to physical VOD and measured VWC. Comparisons indicated that MVI B T has a great potential to retrieve VOD and VWC. By using L band time-series information, the performance of MVIs could be enhanced and its application in a global scale could be improved while paying attention to vegetation structure and saturation effects. Full article
(This article belongs to the Section Remote Sensing in Agriculture and Vegetation)
Show Figures

Graphical abstract

24 pages, 39089 KiB  
Article
Co-Segmentation and Superpixel-Based Graph Cuts for Building Change Detection from Bi-Temporal Digital Surface Models and Aerial Images
by Shiyan Pang, Xiangyun Hu, Mi Zhang, Zhongliang Cai and Fengzhu Liu
Remote Sens. 2019, 11(6), 729; https://doi.org/10.3390/rs11060729 - 26 Mar 2019
Cited by 15 | Viewed by 3850
Abstract
Thanks to the recent development of laser scanner hardware and the technology of dense image matching (DIM), the acquisition of three-dimensional (3D) point cloud data has become increasingly convenient. However, how to effectively combine 3D point cloud data and images to realize accurate [...] Read more.
Thanks to the recent development of laser scanner hardware and the technology of dense image matching (DIM), the acquisition of three-dimensional (3D) point cloud data has become increasingly convenient. However, how to effectively combine 3D point cloud data and images to realize accurate building change detection is still a hotspot in the field of photogrammetry and remote sensing. Therefore, with the bi-temporal aerial images and point cloud data obtained by airborne laser scanner (ALS) or DIM as the data source, a novel building change detection method combining co-segmentation and superpixel-based graph cuts is proposed in this paper. In this method, the bi-temporal point cloud data are firstly combined to achieve a co-segmentation to obtain bi-temporal superpixels with the simple linear iterative clustering (SLIC) algorithm. Secondly, for each period of aerial images, semantic segmentation based on a deep convolutional neural network is used to extract building areas, and this is the basis for subsequent superpixel feature extraction. Again, with the bi-temporal superpixel as the processing unit, a graph-cuts-based building change detection algorithm is proposed to extract the changed buildings. In this step, the building change detection problem is modeled as two binary classifications, and acquisition of each period’s changed buildings is a binary classification, in which the changed building is regarded as foreground and the other area as background. Then, the graph cuts algorithm is used to obtain the optimal solution. Next, by combining the bi-temporal changed buildings and digital surface models (DSMs), these changed buildings are further classified as “newly built,” “taller,” “demolished”, and “lower”. Finally, two typical datasets composed of bi-temporal aerial images and point cloud data obtained by ALS or DIM are used to validate the proposed method, and the experiments demonstrate the effectiveness and generality of the proposed algorithm. Full article
(This article belongs to the Special Issue Change Detection Using Multi-Source Remotely Sensed Imagery)
Show Figures

Figure 1

27 pages, 3659 KiB  
Article
Identifying Mangrove Deforestation Hotspots in South Asia, Southeast Asia and Asia-Pacific
by Samir Gandhi and Trevor Gareth Jones
Remote Sens. 2019, 11(6), 728; https://doi.org/10.3390/rs11060728 - 26 Mar 2019
Cited by 61 | Viewed by 11301
Abstract
Mangroves inhabit highly productive inter-tidal ecosystems in >120 countries in the tropics and subtropics providing critical goods and services to coastal communities and contributing to global climate change mitigation owing to substantial carbon stocks. Despite their importance, global mangrove distribution continues to decline [...] Read more.
Mangroves inhabit highly productive inter-tidal ecosystems in >120 countries in the tropics and subtropics providing critical goods and services to coastal communities and contributing to global climate change mitigation owing to substantial carbon stocks. Despite their importance, global mangrove distribution continues to decline primarily due to anthropogenic drivers which vary by region/country. South Asia, Southeast Asia and Asia-Pacific contain approximately 46% of the world’s mangrove ecosystems, including the most biodiverse mangrove forests. This region also exhibits the highest global rates of mangrove loss. Remotely sensed data provides timely and accurate information on mangrove distribution and dynamics critical for targeting loss hotspots and guiding intervention. This report inventories, describes and compares all known single- and multi-date remotely sensed datasets with regional coverage and provides areal mangrove extents by country. Multi-date datasets were used to estimate dynamics and identify loss hotspots (i.e., countries that exhibit greatest proportional loss). Results indicate Myanmar is the primary mangrove loss hotspot, exhibiting 35% loss from 1975–2005 and 28% between 2000–2014. Rates of loss in Myanmar were four times the global average from 2000–2012. The Philippines is additionally identified as a loss hotspot, with secondary hotspots including Malaysia, Cambodia and Indonesia. This information helps inform and guide mangrove conservation, restoration and managed-use within the region. Full article
(This article belongs to the Special Issue Remote Sensing of Mangroves)
Show Figures

Figure 1

20 pages, 11161 KiB  
Article
Determination of Primary and Secondary Lahar Flow Paths of the Fuego Volcano (Guatemala) Using Morphometric Parameters
by Marcelo Cando-Jácome and Antonio Martínez-Graña
Remote Sens. 2019, 11(6), 727; https://doi.org/10.3390/rs11060727 - 26 Mar 2019
Cited by 15 | Viewed by 6740
Abstract
On 3 June 2018, a strong eruption of the Fuego volcano in Guatemala produced a dense cloud of 10-km-high volcanic ash and destructive pyroclastic flows that caused nearly 200 deaths and huge economic losses in the region. Subsequently, due to heavy rains, destructive [...] Read more.
On 3 June 2018, a strong eruption of the Fuego volcano in Guatemala produced a dense cloud of 10-km-high volcanic ash and destructive pyroclastic flows that caused nearly 200 deaths and huge economic losses in the region. Subsequently, due to heavy rains, destructive secondary lahars were produced, which were not plotted on the hazard maps using the LAHAR Z software. In this work we propose to complement the mapping of this type of lahars using remote-sensing (Differential Interferometry, DINSAR) in Sentinel images 1A and 2A, to locate areas of deformation of the relief on the flanks of the volcano, areas that are possibly origin of these lahars. To determine the trajectory of the lahars, parameters and morphological indices were analyzed with the software System for Automated Geoscientific Analysis (SAGA). The parameters and morphological indices used were the accumulation of flow (FCC), the topographic wetness index (TWI), the length-magnitude factor of the slope (LS). Finally, a slope stability analysis was performed using the Shallow Landslide Susceptibility software (SHALSTAB) based on the Mohr–Coulomb theory and its parameters: internal soil saturation degree and effective precipitation, parameters required to destabilize a hillside. In this case, the application of this complementary methodology provided a more accurate response of the areas destroyed by primary and secondary lahars in the vicinity of the volcano. Full article
(This article belongs to the Special Issue Remote Sensing of Volcanic Processes and Risk)
Show Figures

Figure 1

4 pages, 2768 KiB  
Correction
Correction: Luo, Y.P. et al., Using Near-Infrared Enabled Digital Repeat Photography to Track Structural and Physiological Phenology in Mediterranean Tree-Grass Ecosystems. Remote Sens. 2018, 10, 1293.
by Yunpeng Luo, Tarek S. El-Madany, Gianluca Filippa, Xuanlong Ma, Bernhard Ahrens, Arnaud Carrara, Rosario Gonzalez-Cascon, Edoardo Cremonese, Marta Galvagno, Tiana W. Hammer, Javier Pacheco-Labrador, M. Pilar Martín, Gerardo Moreno, Oscar Perez-Priego, Markus Reichstein, Andrew D. Richardson, Christine Römermann and Mirco Migliavacca
Remote Sens. 2019, 11(6), 726; https://doi.org/10.3390/rs11060726 - 26 Mar 2019
Viewed by 3076
Abstract
The authors modify the schematic plots in their article [...] Full article
Show Figures

Figure 1

20 pages, 29641 KiB  
Article
NDVI Identification and Survey of a Roman Road in the Northern Spanish Province of Álava
by Juan José Fuldain González and Félix Rafael Varón Hernández
Remote Sens. 2019, 11(6), 725; https://doi.org/10.3390/rs11060725 - 26 Mar 2019
Cited by 13 | Viewed by 5164
Abstract
The Iter 34 (Antonine Itinerary XXXIV) is the name of the Roman road that crosses the province of Álava from west to east. Since no specific path was officially recognized before our study, the remains of the road did not benefit from heritage [...] Read more.
The Iter 34 (Antonine Itinerary XXXIV) is the name of the Roman road that crosses the province of Álava from west to east. Since no specific path was officially recognized before our study, the remains of the road did not benefit from heritage protection. In 2017, we made a project to determine the course of the road through rural Álava. In addition to traditional archaeological excavation and prospecting techniques, we used UAVs (unmanned aerial vehicle) to produce NDVI (normalized difference vegetation index) orthomosaic plans of ten cultivated areas through which the road is conjectured to pass. NDVI orthomosaics let us see crop marks better than with conventional photography, allowing us to detect the crop marks during times of the year and in places where conventional photography would fail to show them. Thanks to the NDVI orthomosaics, remains of the road were identified not only in places where we knew it existed, but also in previously unknown locations. Furthermore, other archaeological features were identified close to the roadway. This technique heralds a great advance in non-invasive methods of archaeological surveying. By using precision farming techniques we have identified the course of the Roman road Iter 34 in several locations in a short period of time and with few resources. Full article
(This article belongs to the Section Remote Sensing Image Processing)
Show Figures

Graphical abstract

23 pages, 9879 KiB  
Article
Spatio-Temporal Analysis of Vegetation Dynamics as a Response to Climate Variability and Drought Patterns in the Semiarid Region, Eritrea
by Simon Measho, Baozhang Chen, Yongyut Trisurat, Petri Pellikka, Lifeng Guo, Sunsanee Arunyawat, Venus Tuankrua, Woldeselassie Ogbazghi and Tecle Yemane
Remote Sens. 2019, 11(6), 724; https://doi.org/10.3390/rs11060724 - 26 Mar 2019
Cited by 62 | Viewed by 8592
Abstract
There is a growing concern over change in vegetation dynamics and drought patterns with the increasing climate variability and warming trends in Africa, particularly in the semiarid regions of East Africa. Here, several geospatial techniques and datasets were used to analyze the spatio-temporal [...] Read more.
There is a growing concern over change in vegetation dynamics and drought patterns with the increasing climate variability and warming trends in Africa, particularly in the semiarid regions of East Africa. Here, several geospatial techniques and datasets were used to analyze the spatio-temporal vegetation dynamics in response to climate (precipitation and temperature) and drought in Eritrea from 2000 to 2017. A pixel-based trend analysis was performed, and a Pearson correlation coefficient was computed between vegetation indices and climate variables. In addition, vegetation condition index (VCI) and standard precipitation index (SPI) classifications were used to assess drought patterns in the country. The results demonstrated that there was a decreasing NDVI (Normalized Difference Vegetation Index) slope at both annual and seasonal time scales. In the study area, 57.1% of the pixels showed a decreasing annual NDVI trend, while the significance was higher in South-Western Eritrea. In most of the agro-ecological zones, the shrublands and croplands showed decreasing NDVI trends. About 87.16% of the study area had a positive correlation between growing season NDVI and precipitation (39.34%, p < 0.05). The Gash Barka region of the country showed the strongest and most significant correlations between NDVI and precipitation values. The specific drought assessments based on VCI and SPI summarized that Eritrea had been exposed to recurrent droughts of moderate to extreme conditions during the last 18 years. Based on the correlation analysis and drought patterns, this study confirms that low precipitation was mainly attributed to the slowly declining vegetation trends and increased drought conditions in the semi-arid region. Therefore, immediate action is needed to minimize the negative impact of climate variability and increasing aridity in vegetation and ecosystem services. Full article
(This article belongs to the Special Issue Monitoring Vegetation Phenology: Trends and Anomalies)
Show Figures

Graphical abstract

14 pages, 22622 KiB  
Letter
Mississippi River and Campeche Bank (Gulf of Mexico) Episodes of Cross-Shelf Export of Coastal Waters Observed with Satellites
by Daniel B. Otis, Matthieu Le Hénaff, Vassiliki H. Kourafalou, Lucas McEachron and Frank E. Muller-Karger
Remote Sens. 2019, 11(6), 723; https://doi.org/10.3390/rs11060723 - 26 Mar 2019
Cited by 15 | Viewed by 4450
Abstract
The cross-shelf advection of coastal waters into the deep Gulf of Mexico is important for the transport of nutrients or potential pollutants. Twenty years of ocean color satellite imagery document such cross-shelf transport events via three export pathways in the Gulf of Mexico: [...] Read more.
The cross-shelf advection of coastal waters into the deep Gulf of Mexico is important for the transport of nutrients or potential pollutants. Twenty years of ocean color satellite imagery document such cross-shelf transport events via three export pathways in the Gulf of Mexico: from the Campeche Bank toward the central Gulf, from the Campeche Bank toward the Florida Straits, and from the Mississippi Delta to the Florida Straits. A catalog of these events was created based on the visual examination of 7280 daily satellite images. Water transport from the Campeche Bank to the central Gulf occurred frequently and with no seasonal pattern. Transport from Campeche Bank to the Florida Straits occurred episodically, when the Loop Current was retracted. Four such episodes were identified, between about December and June, in 2002, 2009, 2016, and 2017, each lasting ~3 months. Movement of Mississippi River water to the Florida Straits was more frequent and showed near seasonal occurrence, when the Loop Current was extended, while the Mississippi River discharge seems to play only a secondary role. Eight such episodes were identified—in 1999, 2000, 2003, 2004, 2006, 2011, 2014, and 2015—each lasting ~3 months during summer. The 2015 episode lasted 5 months. Full article
(This article belongs to the Section Ocean Remote Sensing)
Show Figures

Figure 1

16 pages, 4973 KiB  
Article
Analyzing the Uncertainty of Estimating Forest Aboveground Biomass Using Optical Imagery and Spaceborne LiDAR
by Xiaofang Sun, Guicai Li, Meng Wang and Zemeng Fan
Remote Sens. 2019, 11(6), 722; https://doi.org/10.3390/rs11060722 - 26 Mar 2019
Cited by 19 | Viewed by 5370
Abstract
Accurate estimation of forest aboveground biomass (AGB) is important for carbon accounting. Forest AGB estimation has been conducted with a variety of data sources and prediction methods, but many uncertainties still exist. In this study, six prediction methods, including Gaussian processes, stepwise linear [...] Read more.
Accurate estimation of forest aboveground biomass (AGB) is important for carbon accounting. Forest AGB estimation has been conducted with a variety of data sources and prediction methods, but many uncertainties still exist. In this study, six prediction methods, including Gaussian processes, stepwise linear regression, nonlinear regression using a logistic model, partial least squares regression, random forest, and support vector machines were used to estimate forest AGB in Jiangxi Province, China, by combining Geoscience Laser Altimeter System (GLAS) data, Moderate Resolution Imaging Spectroradiometer (MODIS) data, and field measurements. We compared the effect of three factors (prediction methods, sample sizes of field measurements, and cross-validation settings) on the predictive quality of the methods. The results showed that the prediction methods had the most considerable effect on the prediction quality. In most cases, random forest produced more accurate estimates than the other methods. The sample sizes had an obvious effect on accuracy, especially for the random forest model. The accuracy increased with increasing sample sizes. The random forest algorithm with a large number of field measurements, was the most precise (coefficient of determination (R2) = 0.73, root mean square error (RMSE) = 23.58 Mg/ha). Increasing the number of folds within the cross-validation settings improved the R2 values. However, no apparent change occurred in RMSE for different numbers of folds. Finally, the wall-to-wall forest AGB map over the study area was generated using the random forest model. Full article
(This article belongs to the Section Forest Remote Sensing)
Show Figures

Graphical abstract

19 pages, 4899 KiB  
Article
UAV RTK/PPK Method—An Optimal Solution for Mapping Inaccessible Forested Areas?
by Julián Tomaštík, Martin Mokroš, Peter Surový, Alžbeta Grznárová and Ján Merganič
Remote Sens. 2019, 11(6), 721; https://doi.org/10.3390/rs11060721 - 26 Mar 2019
Cited by 142 | Viewed by 12064
Abstract
Mapping hard-to-access and hazardous parts of forests by terrestrial surveying methods is a challenging task. Remote sensing techniques can provide an alternative solution to such cases. Unmanned aerial vehicles (UAVs) can provide on-demand data and higher flexibility in comparison to other remote sensing [...] Read more.
Mapping hard-to-access and hazardous parts of forests by terrestrial surveying methods is a challenging task. Remote sensing techniques can provide an alternative solution to such cases. Unmanned aerial vehicles (UAVs) can provide on-demand data and higher flexibility in comparison to other remote sensing techniques. However, traditional georeferencing of imagery acquired by UAVs involves the use of ground control points (GCPs), thus negating the benefits of rapid and efficient mapping in remote areas. The aim of this study was to evaluate the accuracy of RTK/PPK (real-time kinematic, post-processed kinematic) solution used with a UAV to acquire camera positions through post-processed and corrected measurements by global navigation satellite systems (GNSS). To compare this solution with approaches involving GCPs, the accuracies of two GCP setup designs (4 GCPs and 9 GCPs) were evaluated. Additional factors, which can significantly influence accuracies were also introduced and evaluated: type of photogrammetric product (point cloud, orthoimages and DEM) vegetation leaf-off and leaf-on seasonal variation and flight patterns (evaluated individually and as a combination). The most accurate results for both horizontal (X and Y dimensions) and vertical (Z dimension) accuracies were acquired by the UAV RTK/PPK technology with RMSEs of 0.026 m, 0.035 m and 0.082 m, respectively. The PPK horizontal accuracy was significantly higher when compared to the 4GCP and 9GCP georeferencing approach (p < 0.05). The PPK vertical accuracy was significantly higher than 4 GCP approach accuracy, while PPK and 9 GCP approach vertical accuracies did not differ significantly (p = 0.96). Furthermore, the UAV RTK/PPK accuracy was not influenced by vegetation seasonal variation, whereas the GCP georeferencing approaches during the vegetation leaf-off season had lower accuracy. The use of the combined flight pattern resulted in higher horizontal accuracy; the influence on vertical accuracy was insignificant. Overall, the RTK/PPK technology in combination with UAVs is a feasible and appropriately accurate solution for various mapping tasks in forests. Full article
(This article belongs to the Special Issue UAV Applications in Forestry)
Show Figures

Graphical abstract

18 pages, 5364 KiB  
Article
SAR Backscatter and InSAR Coherence for Monitoring Wetland Extent, Flood Pulse and Vegetation: A Study of the Amazon Lowland
by Francis Canisius, Brian Brisco, Kevin Murnaghan, Marco Van Der Kooij and Edwin Keizer
Remote Sens. 2019, 11(6), 720; https://doi.org/10.3390/rs11060720 - 26 Mar 2019
Cited by 40 | Viewed by 6683
Abstract
Synthetic aperture radar (SAR) data have been identified as a potential source of information for monitoring surface water, including open water and flooded vegetation, in frequent time intervals, which is very significant for flood mapping applications. The SAR specular reflectance separates open water [...] Read more.
Synthetic aperture radar (SAR) data have been identified as a potential source of information for monitoring surface water, including open water and flooded vegetation, in frequent time intervals, which is very significant for flood mapping applications. The SAR specular reflectance separates open water and land surface, and its canopy penetration capability allows enhanced backscatter from flooded vegetation. Further, under certain conditions, the SAR signal from flooded vegetation may remain coherent between two acquisitions, which can be exploited using the InSAR technique. With these SAR capabilities in mind, this study examines the use of multi-temporal RADARSAT-2 C band SAR intensity and coherence components to monitor wetland extent, inundation and vegetation of a tropical wetland, such as Amazon lowland. For this study, 22 multi-temporal RADARSAT-2 images (21 pairs) were used for InSAR processing and the pairs in the low water stage (November, December) showed high coherence over the wetland areas. The three-year intensity stack was used for assessing wetland boundary, inundation extent, flood pulse, hydroperiod, and wetland vegetation. In addition to the intensity, derived coherence was used for classifying wetland vegetation. Wetland vegetation types were successfully classified with 86% accuracy using the statistical parameters derived from the multi-temporal intensity and coherence data stacks. We have found that in addition to SAR intensity, coherence provided information about wetland vegetation. In the next year, the Canadian RADARSAT Constellation Mission (RCM), will provide more data with frequent revisits, enhancing the application of SAR intensity and coherence for monitoring these types of wetlands at large scales. Full article
(This article belongs to the Special Issue Remote Sensing Water Cycle: Theory, Sensors, Data, and Applications)
Show Figures

Graphical abstract

16 pages, 6346 KiB  
Article
Application of UAV-Based Methodology for Census of an Endangered Plant Species in a Fragile Habitat
by Kody Rominger and Susan E. Meyer
Remote Sens. 2019, 11(6), 719; https://doi.org/10.3390/rs11060719 - 26 Mar 2019
Cited by 30 | Viewed by 5707
Abstract
Accurate census is essential for endangered plant management, yet lack of resources may make complete on-the-ground census difficult to achieve. Accessibility, especially for species in fragile habitats, is an added constraint. We examined the feasibility of using UAV (unmanned aerial vehicle, drone)-based imagery [...] Read more.
Accurate census is essential for endangered plant management, yet lack of resources may make complete on-the-ground census difficult to achieve. Accessibility, especially for species in fragile habitats, is an added constraint. We examined the feasibility of using UAV (unmanned aerial vehicle, drone)-based imagery for census of an endangered plant species, Arctomecon humilis (dwarf bear-poppy), an herbaceous perennial gypsophile endemic of the Mojave Desert, USA. Using UAV technology, we captured imagery at both 50-m altitude (census) and 15-m altitude (validation) at two populations, White Dome (325 ha) and Red Bluffs (166 ha). The imagery was processed into orthomosaics that averaged 2.32 cm ground sampling distance (GSD) for 50-m imagery and 0.73 cm GSD for 15-m imagery. Putative poppy plants were marked in the 50-m imagery according to predefined criteria. We then used the 15-m imagery from each area to verify the identification accuracy of marked plants. Visual evaluation of the 50-m imagery resulted in errors of both commission and omission, mainly caused by failure to accurately identify or detect small poppies (<10 cm diameter). Higher-resolution 30-m altitude imagery (1.19 cm GSD) greatly reduced errors of commission. Habitat classification demonstrated that poppy density variation was closely tied to soil surface color. This study showed that drone imagery can potentially be used to census rare plant species with distinctive morphology in open habitats and understand their spatial distribution. Full article
(This article belongs to the Special Issue Remote Sensing for Biodiversity, Ecology and Conservation)
Show Figures

Graphical abstract

25 pages, 5294 KiB  
Article
Analysis of Retrackers’ Performances and Water Level Retrieval over the Ebro River Basin Using Sentinel-3
by Qi Gao, Eduard Makhoul, Maria Jose Escorihuela, Mehrez Zribi, Pere Quintana Seguí, Pablo García and Mònica Roca
Remote Sens. 2019, 11(6), 718; https://doi.org/10.3390/rs11060718 - 25 Mar 2019
Cited by 35 | Viewed by 5658
Abstract
Satellite altimeters have been used to monitor river and reservoir water levels, from which water storage estimates can be derived. Inland water altimetry can, therefore, play an important role in continental water resource management. Traditionally, satellite altimeters were designed to monitor homogeneous surfaces [...] Read more.
Satellite altimeters have been used to monitor river and reservoir water levels, from which water storage estimates can be derived. Inland water altimetry can, therefore, play an important role in continental water resource management. Traditionally, satellite altimeters were designed to monitor homogeneous surfaces such as oceans or ice sheets, resulting in poor performance over small inland water bodies due to the contribution from land contamination in the returned waveforms. The advent of synthetic aperture radar (SAR) altimetry (with its improved along-track spatial resolution) has enabled the measurement of inland water levels with a better accuracy and an increased spatial resolution. This study aimed to retrieve water levels from Level-1B Sentinel-3 data with focus on the minimization of the land contamination over small- to middle-sized water bodies (130 m to 4.5 km), where continuous clean waveforms rarely exist. Three specialized algorithms or retrackers, together with a new waveform portion selection method, were evaluated to minimize land contamination in the waveforms and to select the nadir return associated with the water body being overflown. The waveform portion selection method, with consideration of the Digital Elevation Model (DEM), was used to fit the multipeak waveforms that arise when overflying the continental water bodies, exploiting a subwaveform-based approach to pick up the one corresponding to the nadir. The performances of the proposed waveform portion selection method with three retrackers, namely, the threshold retracker, Offset Center of Gravity (OCOG) retracker and two-step SAR physical-based retracker, were compared. No significant difference was found in the results of the three retrackers. However, waveform portion selection using DEM information great improved the results. Time series of water levels were retrieved for water bodies in the Ebro River basin (Spain). The results show good agreement with in situ measurements from the Ebro Reservoir (approximately 1.8 km wide) and Ribarroja Reservoir (approximately 400 m wide), with unbiased root-mean-square errors (RMSEs) down to 0.28 m and 0.16 m, respectively, depending on the retracker. Full article
(This article belongs to the Special Issue Advances in Satellite Altimetry and Its Application)
Show Figures

Graphical abstract

21 pages, 7866 KiB  
Article
3D Forest Mapping Using A Low-Cost UAV Laser Scanning System: Investigation and Comparison
by Jianping Li, Bisheng Yang, Yangzi Cong, Lin Cao, Xiaoyao Fu and Zhen Dong
Remote Sens. 2019, 11(6), 717; https://doi.org/10.3390/rs11060717 - 25 Mar 2019
Cited by 45 | Viewed by 8190
Abstract
Automatic 3D forest mapping and individual tree characteristics estimation are essential for forest management and ecosystem maintenance. The low-cost unmanned aerial vehicle (UAV) laser scanning (ULS) is a newly developed tool for cost-effectively collecting 3D information and attempts to use it for 3D [...] Read more.
Automatic 3D forest mapping and individual tree characteristics estimation are essential for forest management and ecosystem maintenance. The low-cost unmanned aerial vehicle (UAV) laser scanning (ULS) is a newly developed tool for cost-effectively collecting 3D information and attempts to use it for 3D forest mapping have been made, due to its capability to provide 3D information with a lower cost and higher flexibility than the standard ULS and airborne laser scanning (ALS). As the direct georeferenced point clouds may suffer from distortion caused by the poor performance of a low-cost inertial measurement unit (IMU), and 3D forest mapping using low-cost ULS poses a great challenge. Therefore, this paper utilized global navigation satellite system (GNSS) and IMU aided Structure-from-Motion (SfM) for trajectory estimation, and, hence, overcomes the poor performance of low-cost IMUs. The accuracy of the low-cost ULS point clouds was compared with the ground truth data collected by a commercial ULS system. Furthermore, the effectiveness of individual trees segmentation and tree characteristics estimation derived from the low-cost ULS point clouds were accessed. Experiments were undertaken in Dongtai forest farm, Yancheng City, Jiangsu Province, China. The results showed that the low-cost ULS achieved good point clouds quality from visual inspection and comparable individual tree segmentation results (P = 0.87, r = 0.84, F = 0.85) with the commercial system. Individual tree height estimation performed well (coefficient of determination (R2) = 0.998, root-mean-square error (RMSE) = 0.323 m) using the low-cost ULS. As for individual tree crown diameter estimation, low-cost ULS achieved good results (R2 = 0.806, RMSE = 0.195 m) after eliminating outliers. In general, such results illustrated the high potential of the low-cost ULS in 3D forest mapping, even though 3D forest mapping using the low-cost ULS requires further research. Full article
(This article belongs to the Section Forest Remote Sensing)
Show Figures

Graphical abstract

18 pages, 9249 KiB  
Article
Effective Band Ratio of Landsat 8 Images Based on VNIR-SWIR Reflectance Spectra of Topsoils for Soil Moisture Mapping in a Tropical Region
by Dinh Ngo Thi, Nguyen Thi Thu Ha, Quy Tran Dang, Katsuaki Koike and Nhuan Mai Trong
Remote Sens. 2019, 11(6), 716; https://doi.org/10.3390/rs11060716 - 25 Mar 2019
Cited by 18 | Viewed by 7980
Abstract
Effective mapping and monitoring of soil moisture content (SMC) in space and time is an expected application of remote sensing for agricultural development and drought mitigation, particularly in the context of global climate change impact, given that agricultural drought is occurring more frequently [...] Read more.
Effective mapping and monitoring of soil moisture content (SMC) in space and time is an expected application of remote sensing for agricultural development and drought mitigation, particularly in the context of global climate change impact, given that agricultural drought is occurring more frequently and severely worldwide. This study aims to develop a regional algorithm for estimating SMC by using Landsat 8 (L8) imagery, based on analyses of the response of soil reflectance, by corresponding L8 bands with the change of SMC from dry to saturated states, in all 103 soil samples taken in the central region of Vietnam. The L8 spectral band ratio of the near-infrared band (NIR: 850–880 nm, band 5) versus the short-wave infrared 2 band (SWIR2: 2110 to 2290 nm, band 7) shows the strongest correlation to SMC by a logarithm function (R2 = 0.73 and the root mean square error, RMSE ~ 12%) demonstrating the high applicability of this band ratio for estimating SMC. The resultant maps of SMC estimated from the L8 images were acquired over the northern part of the Central Highlands of Vietnam in March 2015 and March 2016 showed an agreement with the pattern of severe droughts that occurred in the region. Further discussions on the relationship between the estimated SMC and the satellite-based retrieved drought index, the Normal Different Drought Index, from the L8 image acquired in March 2016, showed a strong correlation between these two variables within an area with less than 20% dense vegetation (R2 = 0.78 to 0.95), and co-confirms the bad effect of drought on almost all areas of the northern part of the Central Highlands of Vietnam. Directly estimating SMC from L8 imagery provides more information for irrigation management and better drought mitigation than by using the remotely sensed drought index. Further investigations on various soil types and optical sensors (i.e., Sentinel 2A, 2B) need to be carried out, to extend and promote the applicability of the prosed algorithm, towards better serving agricultural management and drought mitigation. Full article
(This article belongs to the Special Issue Remote Sensing of Tropical Environmental Change)
Show Figures

Figure 1

21 pages, 1210 KiB  
Article
Determining the AMSR-E SST Footprint from Co-Located MODIS SSTs
by Brahim Boussidi, Peter Cornillon, Gavino Puggioni and Chelle Gentemann
Remote Sens. 2019, 11(6), 715; https://doi.org/10.3390/rs11060715 - 25 Mar 2019
Cited by 2 | Viewed by 3665
Abstract
This study was undertaken to derive and analyze the advanced microwave scanning radiometer-Earth observing satellite (EOS) (AMSR-E) sea surface temperature (SST) footprint associated with the remote sensing systems (RSS) level-2 (L2) product. The footprint, in this case, is characterized by the weight attributed [...] Read more.
This study was undertaken to derive and analyze the advanced microwave scanning radiometer-Earth observing satellite (EOS) (AMSR-E) sea surface temperature (SST) footprint associated with the remote sensing systems (RSS) level-2 (L2) product. The footprint, in this case, is characterized by the weight attributed to each 4 × 4 km square contributing to the SST value of a given (AMSR-E) pixel. High-resolution L2 SST fields obtained from the moderate-resolution imaging spectroradiometer (MODIS), carried on the same spacecraft as AMSR-E, are used as the sub-resolution “ground truth” from which the AMSR-E footprint is determined. Mathematically, the approach is equivalent to a linear inversion problem, and its solution is pursued by means of a constrained least square approximation based on the bootstrap sampling procedure. The method yielded an elliptic-like Gaussian kernel with an aspect ratio ≈1.58, very close to the AMSR-E 6.93 GHz channel aspect ratio, ≈1.74. (The 6.93 GHz channel is the primary spectral frequency used to determine SST.) The semi-major axis of the estimated footprint is found to be aligned with the instantaneous field-of-view of the sensor as expected from the geometric characteristics of AMSR-E. Footprints were also analyzed year-by-year and as a function of latitude and found to be stable—no dependence on latitude or on time. Precise knowledge of the footprint is central for any satellite-derived product characterization and, in particular, for efforts to deconvolve the heavily oversampled AMSR-E SST fields and for studies devoted to product validation and comparison. A preliminary analysis suggests that use of the derived footprint will reduce the variance between AMSR-E and MODIS fields compared to the results obtained ignoring the shape and size of the footprint as has been the practice in such comparisons to date. Full article
(This article belongs to the Special Issue Sea Surface Temperature Retrievals from Remote Sensing)
Show Figures

Graphical abstract

15 pages, 10781 KiB  
Article
A Non-Reference Temperature Histogram Method for Determining Tc from Ground-Based Thermal Imagery of Orchard Tree Canopies
by Arachchige Surantha Ashan Salgadoe, Andrew James Robson, David William Lamb and Derek Schneider
Remote Sens. 2019, 11(6), 714; https://doi.org/10.3390/rs11060714 - 25 Mar 2019
Cited by 12 | Viewed by 4141
Abstract
Obtaining average canopy temperature (Tc) by thresholding canopy pixels from on-ground thermal imagery has historically been undertaken using ‘wet’ and ‘dry’ reference surfaces in the field (reference temperature thresholding). However, this method is extremely time inefficient and can suffer inaccuracies if [...] Read more.
Obtaining average canopy temperature (Tc) by thresholding canopy pixels from on-ground thermal imagery has historically been undertaken using ‘wet’ and ‘dry’ reference surfaces in the field (reference temperature thresholding). However, this method is extremely time inefficient and can suffer inaccuracies if the surfaces are non-standardised or unable to stabilise with the environment. The research presented in this paper evaluates non-reference techniques to obtain average canopy temperature (Tc) from thermal imagery of avocado trees, both for the shaded side and sunlit side, without the need of reference temperature values. A sample of 510 thermal images (from 130 avocado trees) were acquired with a FLIR B250 handheld thermal imaging camera. Two methods based on temperature histograms were evaluated for removing non-canopy-related pixel information from the analysis, enabling Tc to be determined. These approaches included: 1) Histogram gradient thresholding based on temperature intensity changes (HG); and 2) histogram thresholding at one or more standard deviation (SD) above and below the mean. The HG method was found to be more accurate (R2 > 0.95) than the SD method in defining canopy pixels and calculating Tc from each thermal image (shaded and sunlit) when compared to the standard reference temperature thresholding method. The results from this study present an alternative non-reference method for determining Tc from ground-based thermal imagery without the need of calibration surfaces. As such, it offers a more efficient and computationally autonomous method that will ultimately support the greater adoption of non-invasive thermal technologies within a precision agricultural system. Full article
(This article belongs to the Section Remote Sensing in Agriculture and Vegetation)
Show Figures

Figure 1

19 pages, 3978 KiB  
Article
Extraction of Urban Objects in Cloud Shadows on the basis of Fusion of Airborne LiDAR and Hyperspectral Data
by Qixia Man and Pinliang Dong
Remote Sens. 2019, 11(6), 713; https://doi.org/10.3390/rs11060713 - 25 Mar 2019
Cited by 5 | Viewed by 3257
Abstract
Feature extraction in cloud shadows is a difficult problem in the field of optical remote sensing. The key to solving this problem is to improve the accuracy of classification algorithms by fusing multi-source remotely sensed data. Hyperspectral data have rich spectral information but [...] Read more.
Feature extraction in cloud shadows is a difficult problem in the field of optical remote sensing. The key to solving this problem is to improve the accuracy of classification algorithms by fusing multi-source remotely sensed data. Hyperspectral data have rich spectral information but highly suffer from cloud shadows, whereas light detection and ranging (LiDAR) data can be acquired from beneath clouds to provide accurate height information. In this study, fused airborne LiDAR and hyperspectral data were used to extract urban objects in cloud shadows using the following steps: (1) a series of LiDAR and hyperspectral metrics were extracted and selected; (2) cloud shadows were extracted; (3) the new proposed approach was used by combining a pixel-based support vector machine (SVM) and object-based classifiers to extract urban objects in cloud shadows; (4) a pixel-based SVM classifier was used for the classification of the whole study area with the selected metrics; (5) a decision-fusion strategy was employed to get the final results for the whole study area; (6) accuracy assessment was conducted. Compared with the SVM classification results, the decision-fusion results of the combined SVM and object-based classifiers show that the overall classification accuracy is improved by 5.00% (from 87.30% to 92.30%). The experimental results confirm that the proposed method is very effective for urban object extraction in cloud shadows and thus improve urban applications such as urban green land management, land use analysis, and impervious surface assessment. Full article
(This article belongs to the Special Issue Hyperspectral Imagery for Urban Environment)
Show Figures

Figure 1

20 pages, 2832 KiB  
Article
Enhanced Back-Projection as Postprocessing for Pansharpening
by Junmin Liu, Jing Ma, Rongrong Fei, Huirong Li and Jiangshe Zhang
Remote Sens. 2019, 11(6), 712; https://doi.org/10.3390/rs11060712 - 25 Mar 2019
Cited by 8 | Viewed by 3316
Abstract
Pansharpening is the process of integrating a high spatial resolution panchromatic image with a low spatial resolution multispectral image to obtain a multispectral image with high spatial and spectral resolution. Over the last decade, several algorithms have been developed for pansharpening. In this [...] Read more.
Pansharpening is the process of integrating a high spatial resolution panchromatic image with a low spatial resolution multispectral image to obtain a multispectral image with high spatial and spectral resolution. Over the last decade, several algorithms have been developed for pansharpening. In this paper, a technique, called enhanced back-projection (EBP), is introduced and applied as postprocessing on the pansharpening. The proposed EBP first enhances the spatial details of the pansharpening results by histogram matching and high-pass modulation, followed by a back-projection process, which takes into account the modulation transfer function (MTF) of the satellite sensor such that the pansharpening results obey the consistency property. The EBP is validated on four datasets acquired by different satellites and several commonly used pansharpening methods. The pansharpening results achieve substantial improvements by this postprocessing technique, which is widely applicable and requires no modification of existing pansharpening methods. Full article
(This article belongs to the Special Issue Advances in Remote Sensing Image Fusion)
Show Figures

Figure 1

13 pages, 1740 KiB  
Article
Automatic Grassland Cutting Status Detection in the Context of Spatiotemporal Sentinel-1 Imagery Analysis and Artificial Neural Networks
by Alireza Taravat, Matthias P. Wagner and Natascha Oppelt
Remote Sens. 2019, 11(6), 711; https://doi.org/10.3390/rs11060711 - 25 Mar 2019
Cited by 37 | Viewed by 5168
Abstract
Grassland contributes to carbon storage and animal feed production. Its yield is largely determined by the cutting times of grassland. Previous studies have used remote sensing data for grassland biomass estimation, but only a few studies have focused on SAR remote sensing approaches [...] Read more.
Grassland contributes to carbon storage and animal feed production. Its yield is largely determined by the cutting times of grassland. Previous studies have used remote sensing data for grassland biomass estimation, but only a few studies have focused on SAR remote sensing approaches for automatic grassland cutting status detection. Due to the occurrence of multiple cuttings in a year, it is crucial to effectively monitor grassland cutting events in order to achieve accurate biomass estimations of a whole season. In this study, we examined the capabilities of multilayer perceptron neural networks for automatic grassland cutting status detection using SAR imagery. The proposed model inputs are a time series dataset of VV and VH Sentinel-1 C-band SAR and second-order texture metrics (homogeneity, entropy, contrast and dissimilarity). The proposed approach has been successfully tested on a dataset collected from several fields in Germany in 2016, with an overall accuracy of 85.71% for the validation set. Full article
(This article belongs to the Special Issue Time Series Analysis Based on SAR Images)
Show Figures

Graphical abstract

21 pages, 5918 KiB  
Article
The Terra Vega Active Light Source: A First Step in a New Approach to Perform Nighttime Absolute Radiometric Calibrations and Early Results Calibrating the VIIRS DNB
by Robert E. Ryan, Mary Pagnutti, Kara Burch, Larry Leigh, Timothy Ruggles, Changyong Cao, David Aaron, Slawomir Blonski and Dennis Helder
Remote Sens. 2019, 11(6), 710; https://doi.org/10.3390/rs11060710 - 24 Mar 2019
Cited by 16 | Viewed by 4538
Abstract
A fully automated, National Institute of Standards and Technology (NIST)-traceable artificial light source called Terra Vega has been developed to radiometrically calibrate the Visible Infrared Imaging Radiometer (VIIRS) Day Night Band (DNB) working in high gain stage (HGS) mode. The Terra Vega active [...] Read more.
A fully automated, National Institute of Standards and Technology (NIST)-traceable artificial light source called Terra Vega has been developed to radiometrically calibrate the Visible Infrared Imaging Radiometer (VIIRS) Day Night Band (DNB) working in high gain stage (HGS) mode. The Terra Vega active point source is a calibrated integrating sphere that is only a fraction in size of a VIIRS DNB pixel. As such, it can be considered analogous to a ground-based photometric reference star. Vicarious calibrations that employ active point sources are different than those that make use of traditional extended sources and can be applyed to quantify the brightness of artificial light sources. The active source is successfully fielded, and early results indicate that it can be used to augment and validate the radiometric calibration of the VIIRS DNB HGS sensor on both the Suomi National Polar-orbiting Partnership (NPP) and NOAA-20 satellites. The VIIRS DNB HGS sensor can benefit from this technology as on-board calibration is challenging and hinges on transferring low gain stage (LGS) calibration using a solar diffuser to the medium gain stage (MGS) and HGS via regions of overlap. Current vicarious calibration methods that use a lunar-illuminated extended source estimate the HGS radiometric accuracy to within 8-15%. By comparison, early results and analysis showed that Terra Vega is stable to about 1%. Under clear dark night conditions, predicted top-of-atmosphere radiance from Terra Vega ranged between 1–11% of VIIRS measured values. Terra Vega’s excellent stability opens up new opportunities to validate and develop nighttime imaging applications based on point sources. Full article
(This article belongs to the Section Atmospheric Remote Sensing)
Show Figures

Figure 1

21 pages, 8226 KiB  
Article
Long-Term Impacts of Selective Logging on Amazon Forest Dynamics from Multi-Temporal Airborne LiDAR
by Ekena Rangel Pinagé, Michael Keller, Paul Duffy, Marcos Longo, Maiza Nara dos-Santos and Douglas C. Morton
Remote Sens. 2019, 11(6), 709; https://doi.org/10.3390/rs11060709 - 24 Mar 2019
Cited by 33 | Viewed by 5645
Abstract
Forest degradation is common in tropical landscapes, but estimates of the extent and duration of degradation impacts are highly uncertain. In particular, selective logging is a form of forest degradation that alters canopy structure and function, with persistent ecological impacts following forest harvest. [...] Read more.
Forest degradation is common in tropical landscapes, but estimates of the extent and duration of degradation impacts are highly uncertain. In particular, selective logging is a form of forest degradation that alters canopy structure and function, with persistent ecological impacts following forest harvest. In this study, we employed airborne laser scanning in 2012 and 2014 to estimate three-dimensional changes in the forest canopy and understory structure and aboveground biomass following reduced-impact selective logging in a site in Eastern Amazon. Also, we developed a binary classification model to distinguish intact versus logged forests. We found that canopy gap frequency was significantly higher in logged versus intact forests even after 8 years (the time span of our study). In contrast, the understory of logged areas could not be distinguished from the understory of intact forests after 6–7 years of logging activities. Measuring new gap formation between LiDAR acquisitions in 2012 and 2014, we showed rates 2 to 7 times higher in logged areas compared to intact forests. New gaps were spatially clumped with 76 to 89% of new gaps within 5 m of prior logging damage. The biomass dynamics in areas logged between the two LiDAR acquisitions was clearly detected with an average estimated loss of −4.14 ± 0.76 MgC ha−1 y−1. In areas recovering from logging prior to the first acquisition, we estimated biomass gains close to zero. Together, our findings unravel the magnitude and duration of delayed impacts of selective logging in forest structural attributes, confirm the high potential of airborne LiDAR multitemporal data to characterize forest degradation in the tropics, and present a novel approach to forest classification using LiDAR data. Full article
(This article belongs to the Special Issue Assessing Changes in the Amazon and Cerrado Biomes by Remote Sensing)
Show Figures

Figure 1

17 pages, 10725 KiB  
Article
Repeat Glacier Collapses and Surges in the Amney Machen Mountain Range, Tibet, Possibly Triggered by a Developing Rock-Slope Instability
by Frank Paul
Remote Sens. 2019, 11(6), 708; https://doi.org/10.3390/rs11060708 - 24 Mar 2019
Cited by 31 | Viewed by 4566
Abstract
Collapsing valley glaciers leaving their bed to rush down a flat hill slope at the speed of a racing car are so far rare events. They have only been reported for the Kolkaglacier (Caucasus) in 2002 and the two glaciers in the Aru [...] Read more.
Collapsing valley glaciers leaving their bed to rush down a flat hill slope at the speed of a racing car are so far rare events. They have only been reported for the Kolkaglacier (Caucasus) in 2002 and the two glaciers in the Aru mountain range (Tibet) that failed in 2016. Both events have been studied in detail using satellite data and modeling to learn more about the reasons for and processes related to such events. This study reports about a series of so far undocumented glacier collapses that occurred in the Amney Machen mountain range (eastern Tibet) in 2004, 2007, and 2016. All three collapses were associated with a glacier surge, but from 1987 to 1995, the glacier surged without collapsing. The later surges and collapses were likely triggered by a progressing slope instability that released large amounts of ice and rock to the lower glacier tongue, distorting its dynamic stability. The surges and collapses might continue in the future as more ice and rock is available to fall on the glacier. It has been speculated that the development is a direct response to regional temperature increase that destabilized the surrounding hanging glaciers. However, the specific properties of the steep rock slopes and the glacier bed might also have played a role. Full article
(This article belongs to the Special Issue Imaging Floods and Glacier Geohazards with Remote Sensing)
Show Figures

Graphical abstract

22 pages, 2404 KiB  
Article
Radiometric Cross-Calibration of GF-1 PMS Sensor with a New BRDF Model
by Qiyue Liu, Tao Yu and Hailiang Gao
Remote Sens. 2019, 11(6), 707; https://doi.org/10.3390/rs11060707 - 24 Mar 2019
Cited by 21 | Viewed by 3619
Abstract
On-orbit radiometric calibration of a space-borne sensor is of great importance for quantitative remote sensing applications. Cross-calibration is a common method with high calibration accuracy, and the core and emphasis of this method is to select the appropriate reference satellite sensor. As for [...] Read more.
On-orbit radiometric calibration of a space-borne sensor is of great importance for quantitative remote sensing applications. Cross-calibration is a common method with high calibration accuracy, and the core and emphasis of this method is to select the appropriate reference satellite sensor. As for the cross-calibration of high-spatial resolution and narrow-swath sensor, however, there are some scientific issues, such as large observation angles of reference image, and non-synchronization (or quasi-synchronization) between the imaging date of reference image and the date of sensor to be calibrated, which affects the accuracy of cross-calibration to a certain degree. Therefore, taking the GaoFen-1 (GF-1) Panchromatic and Multi-Spectral (PMS) sensor as an example in this research, an innovative radiometric cross-calibration method is proposed to overcome this bottleneck. Firstly, according a set of criteria, valid MODIS (Moderate Resolution Imagine Spectroradiometer) images of sunny day in one year over the Dunhuang radiometric calibration site in China are extracted, and a new and distinctive bidirectional reflectance distribution function (BRDF) model based on top-of-atmosphere (TOA) reflectance and imaging angles of the sunny day MODIS images is constructed. Subsequently, the cross-calibration of PMS sensor at Dunhuang and Golmud radiation calibration test sites is carried out by using the method presented in this paper, taking the MODIS image with large solar and observation angles and Landsat 8 Operational Land Imager (OLI) with different dates from PMS as reference. The validation results of the calibration coefficients indicate that our proposed method can acquire high calibration accuracy, and the total calibration uncertainties of PMS using MODIS as reference sensor are less than 6%. Full article
Show Figures

Figure 1

19 pages, 24306 KiB  
Article
A New Global Total Electron Content Empirical Model
by Jiandi Feng, Baomin Han, Zhenzhen Zhao and Zhengtao Wang
Remote Sens. 2019, 11(6), 706; https://doi.org/10.3390/rs11060706 - 24 Mar 2019
Cited by 26 | Viewed by 4337
Abstract
Research on total electron content (TEC) empirical models is one of the important topics in the field of space weather services. Global TEC empirical models based on Global Ionospheric Maps (GIMs) TEC data released by the International GNSS Service (IGS) have developed rapidly [...] Read more.
Research on total electron content (TEC) empirical models is one of the important topics in the field of space weather services. Global TEC empirical models based on Global Ionospheric Maps (GIMs) TEC data released by the International GNSS Service (IGS) have developed rapidly in recent years. However, the accuracy of such global empirical models has a crucial restriction arising from the non-uniform accuracy of IGS TEC data in the global scope. Specifically, IGS TEC data accuracy is higher on land and lower over the ocean due to the lack of stations in the latter. Using uneven precision GIMs TEC data as a whole for model fitting is unreasonable. Aiming at the limitation of global ionospheric TEC modelling, this paper proposes a new global ionospheric TEC empirical model named the TECM-GRID model. The model consists of 5183 sections, corresponding to 5183 grid points (longitude 5°, latitude 2.5°) of GIM. Two kinds of single point empirical TEC models, SSM-T1 and SSM-T2, are used for TECM-GRID. According to the locations of grid points, the SSM-T2 model is selected as the sub-model in the Mid-Latitude Summer Night Anomaly (MSNA) region, and SSM-T1 is selected as the sub-model in other regions. The fitting ability of the TECM-GRID model for modelling data was tested in accordance with root mean square (RMS) and relative RMS values. Then, the TECM-GRID model was validated and compared with the NTCM-GL model and Center for Orbit Determination in Europe (CODE) GIMs at time points other than modelling time. Results show that TECM-GRID can effectively describe the Equatorial Ionization Anomaly (EIA) and the MSNA phenomena of the ionosphere, which puts it in good agreement with CODE GIMs and means that it has better prediction ability than the NTCM-GL model. Full article
Show Figures

Graphical abstract

Previous Issue
Next Issue
Back to TopTop