

Climate Mitigation Strategies: The Use of Cool Pavements

Abstract
:1. Introduction
1.1. Objectives and Methodology
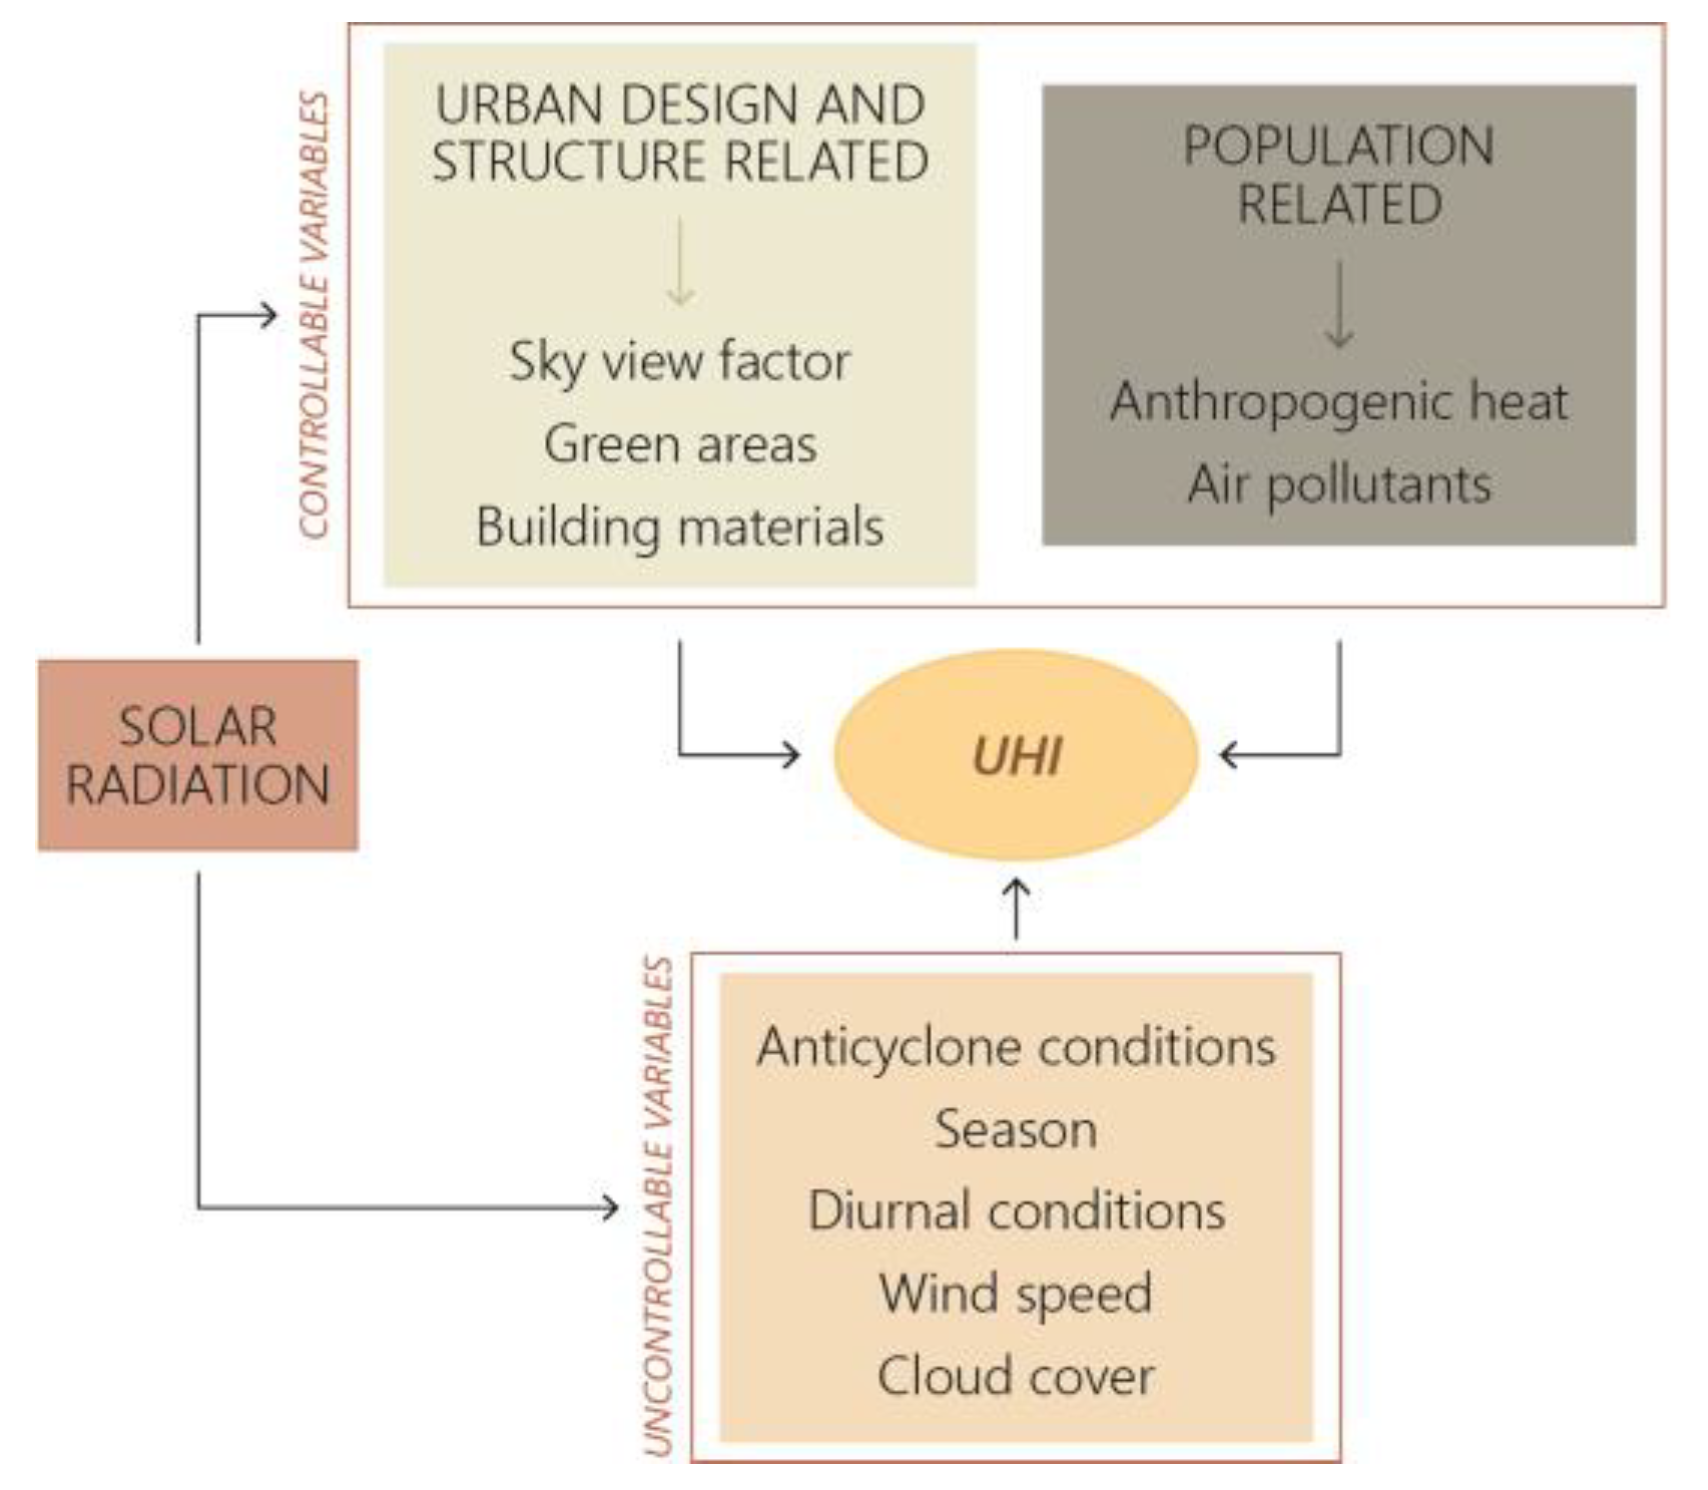
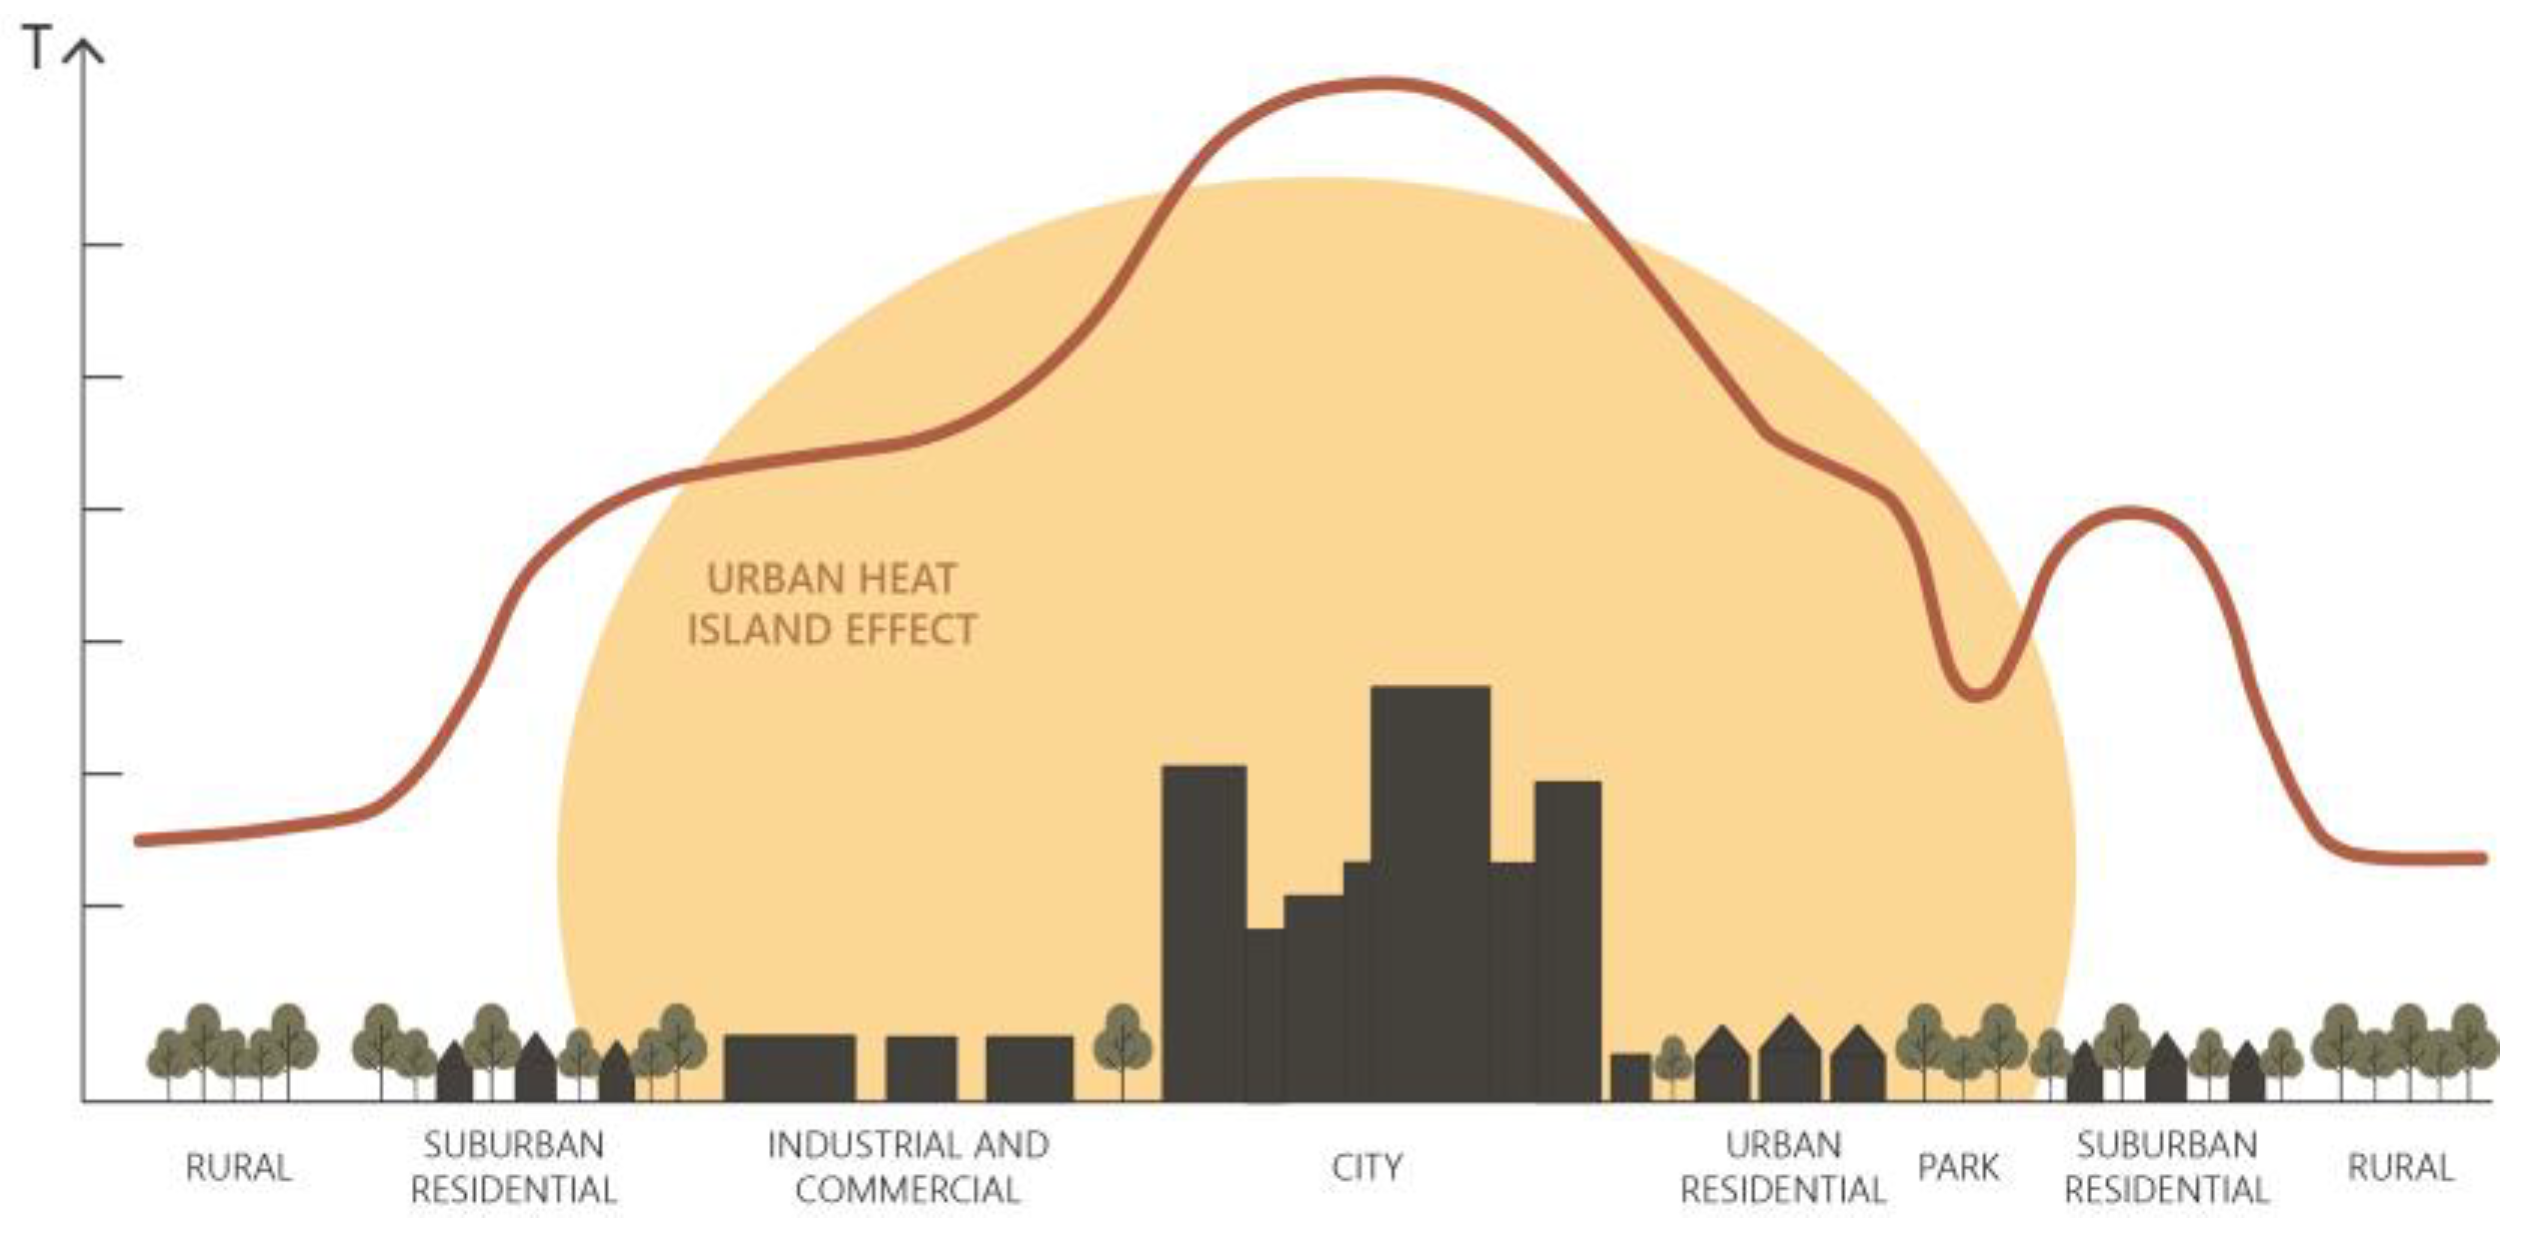
1.2. UHI (Urban Heat Island)
1.3. Solar Availability
- -
- PVGIS-SARAH2 (0.05° × 0.05°): database produced by CM SAF to replace SARAH-1 (PVGIS-SARAH). Covers Europe, Africa, most of Asia, and parts of South America. Time range: 2005–2020.
- -
- PVGIS-NSRDB (0.04° × 0.04°): results from a collaboration with NREL (Golden, CO, USA) under which the NSRDB solar radiation database was made available for PVGIS. Time range: 2005–2015.
- -
- PVGIS-ERA5 (0.25° × 0.25°): latest global reanalysis from ECMWF. Time range: 2005–2020.
2. “Cool Materials” as an Intervention Strategy
2.1. Reflective Pavements
2.2. Evaporative Pavements
3. Physical and Geomorphological Characterization of the Study Area
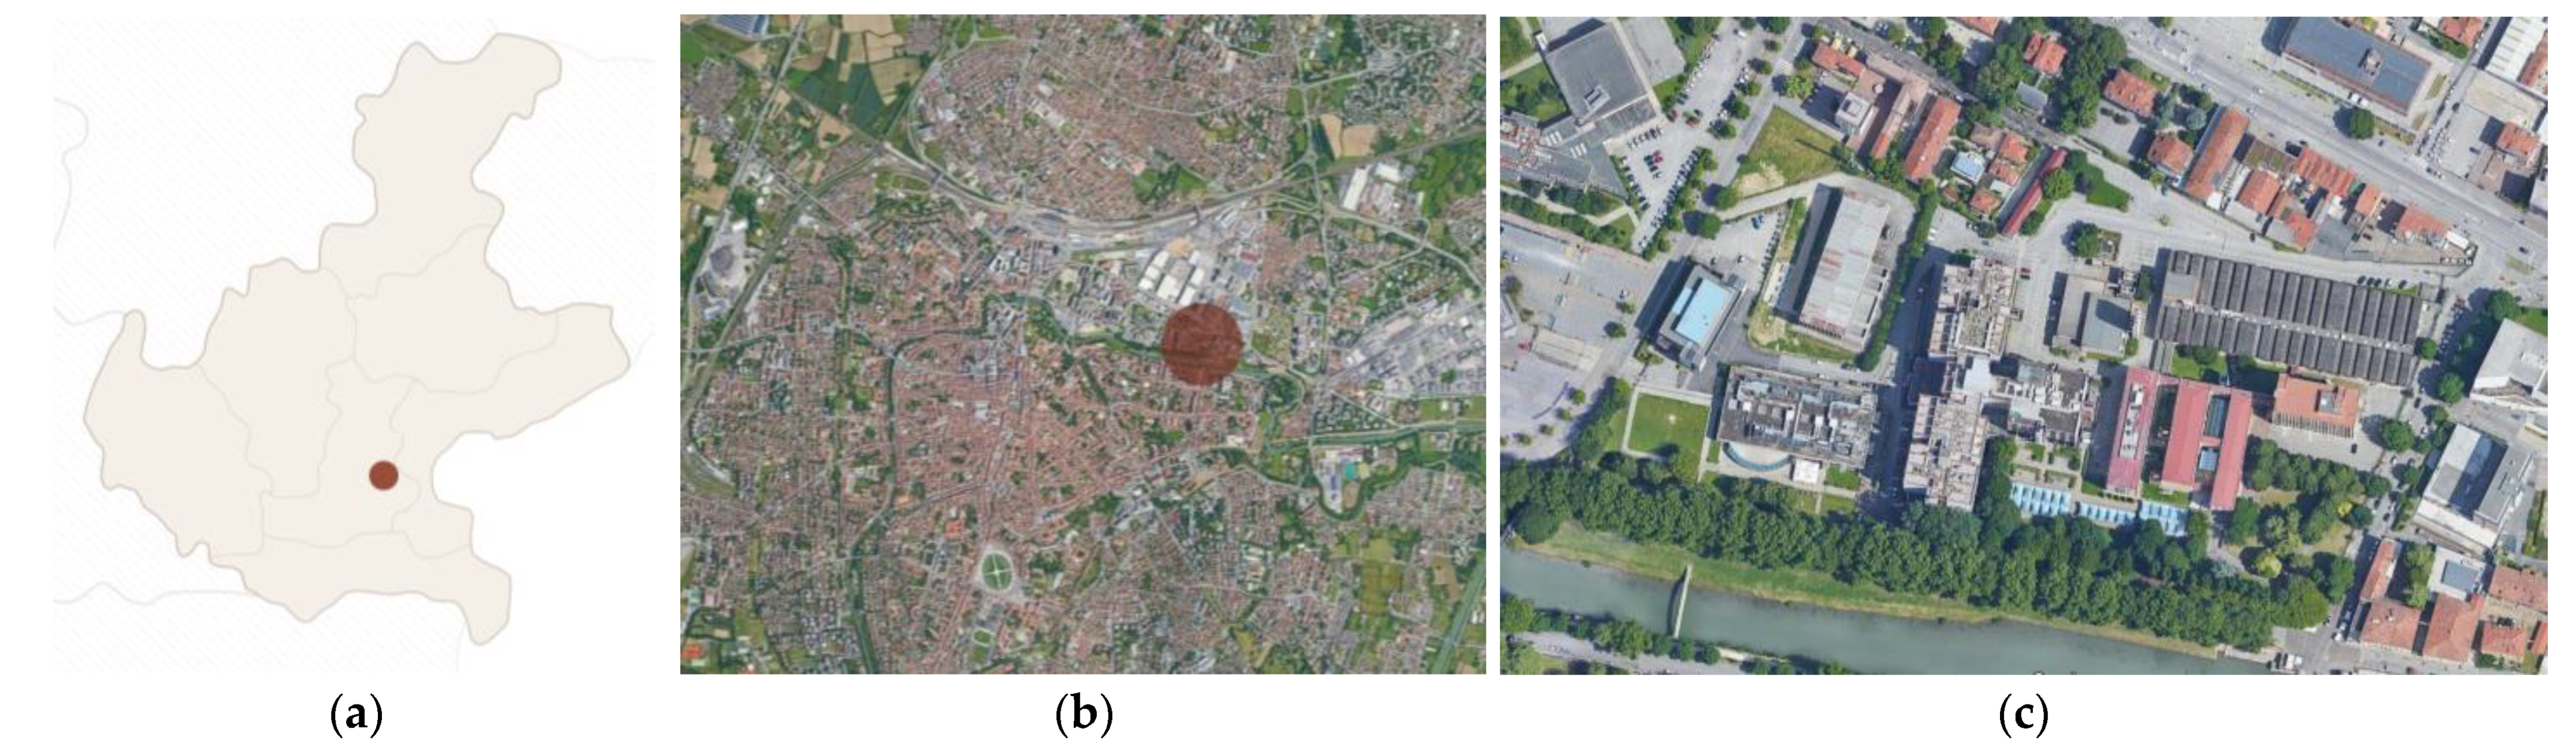
3.1. UHI and Padova
- -
- the urban canyon pattern, which affects the shortwave heat transfer capacity of urban surfaces to the sky;
- -
- the typically low albedo of urban surfaces, which increases the heat absorbed by buildings, sidewalks, roads, and roofs;
- -
- the anthropogenic heat produced by vehicle motors;
- -
- the greenhouse effect, amplified by the increased concentration of pollutants in the urban atmosphere;
- -
- the scarcity of green areas, which increases sensible heat exchange with the air and decreases the evaporative cooling effect due to the lack of evapotranspiration from trees and grass.
3.2. The Case Study
4. Microclimatic Analysis: Input Data
4.1. Materials
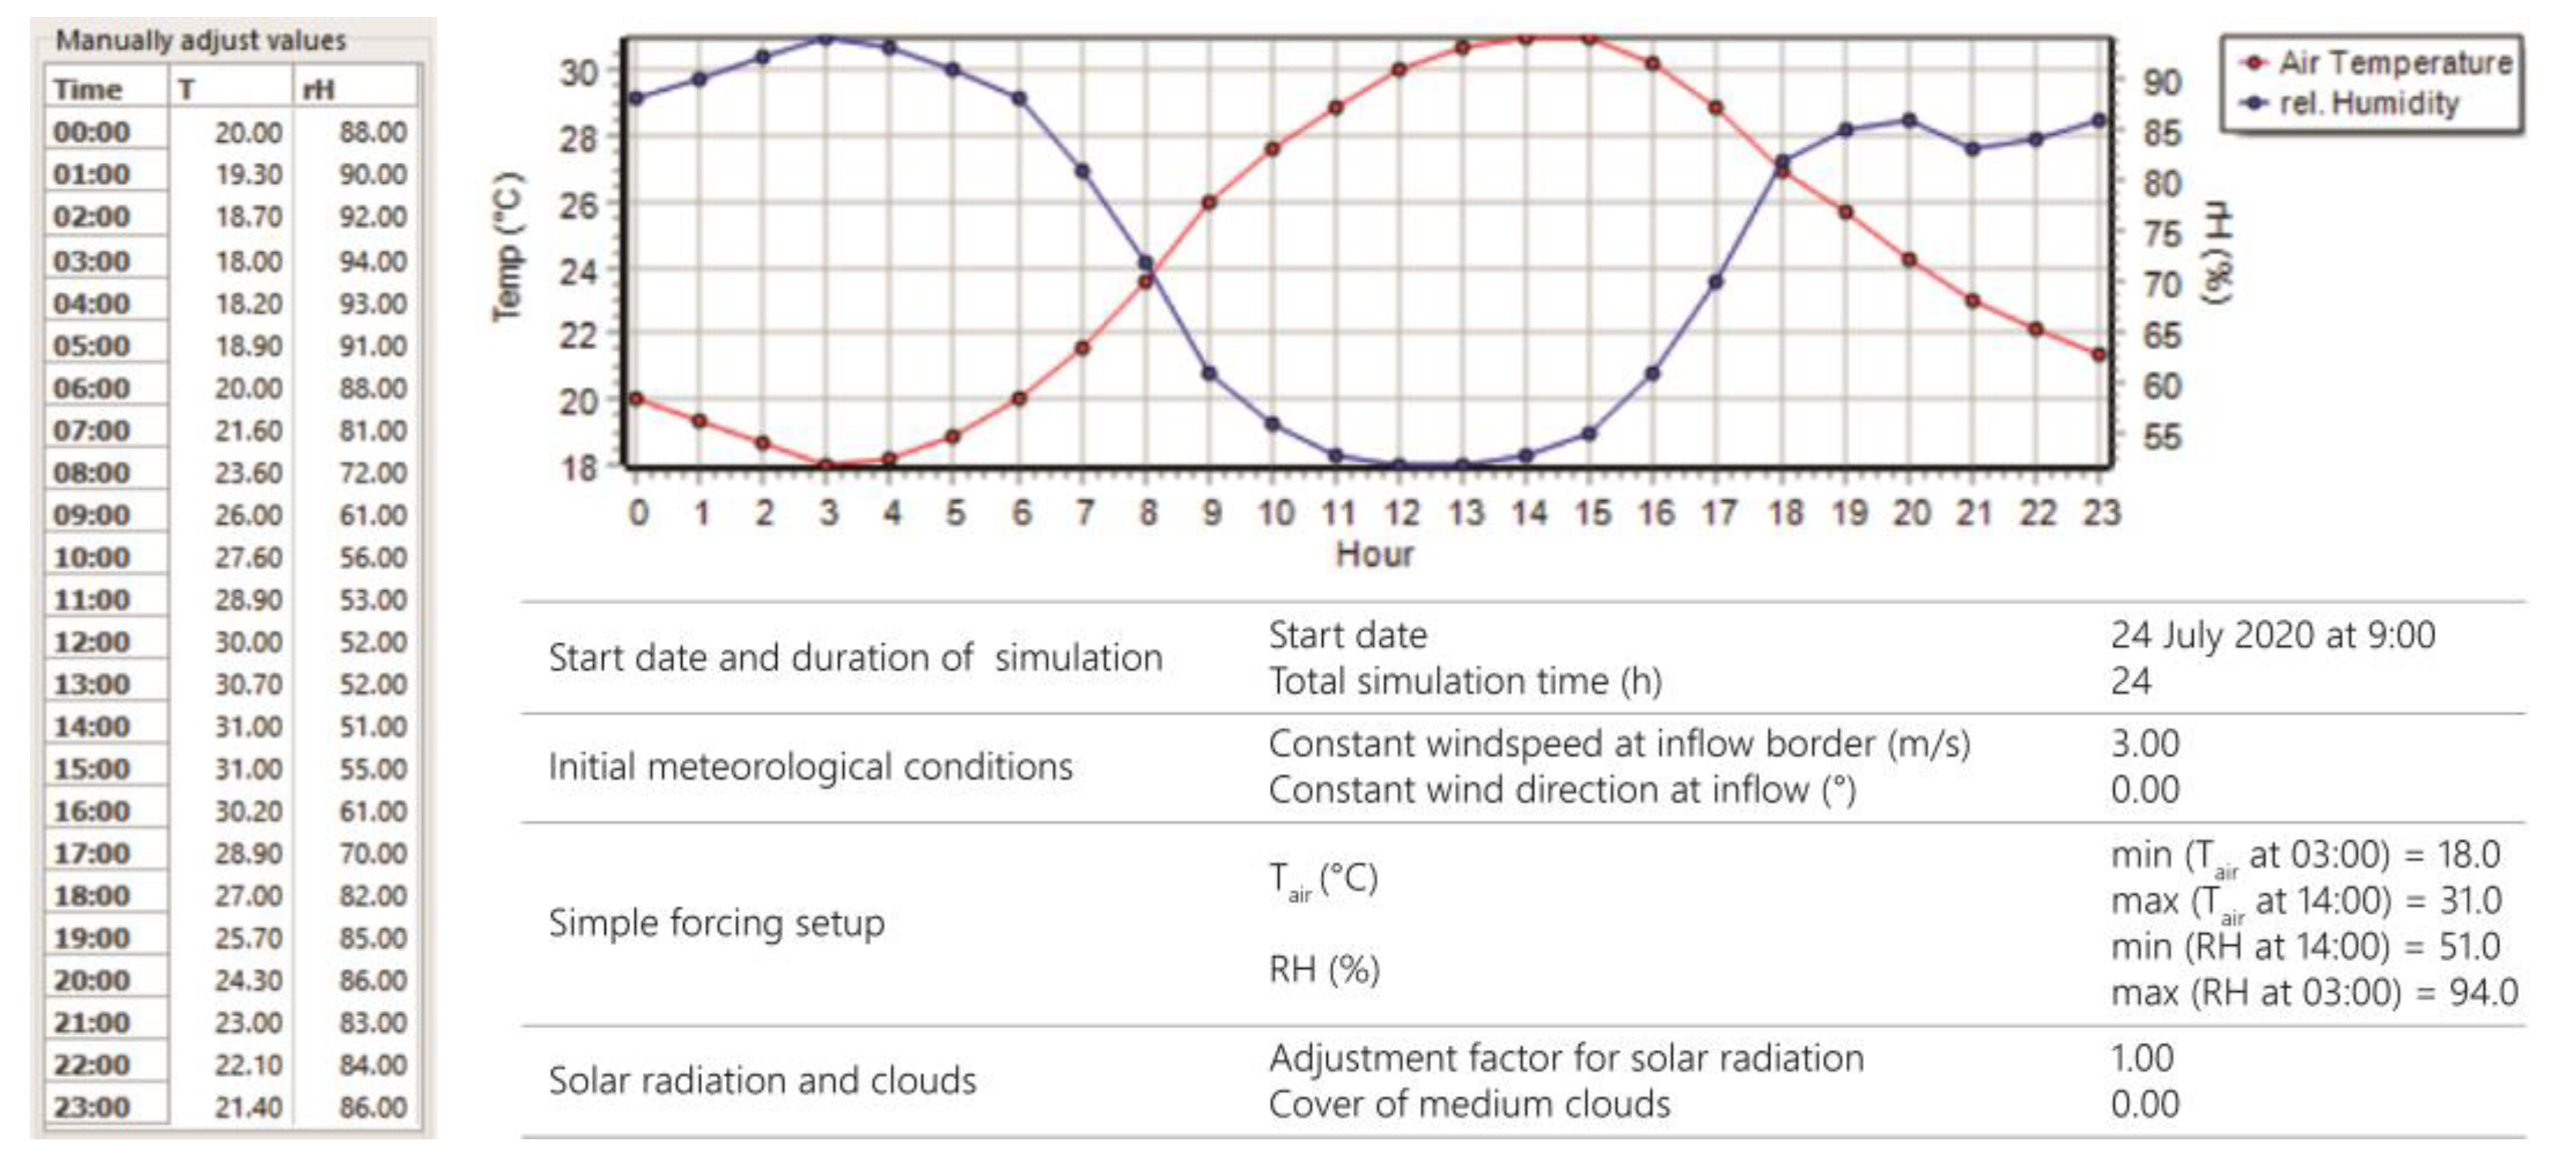
4.2. Climate Data
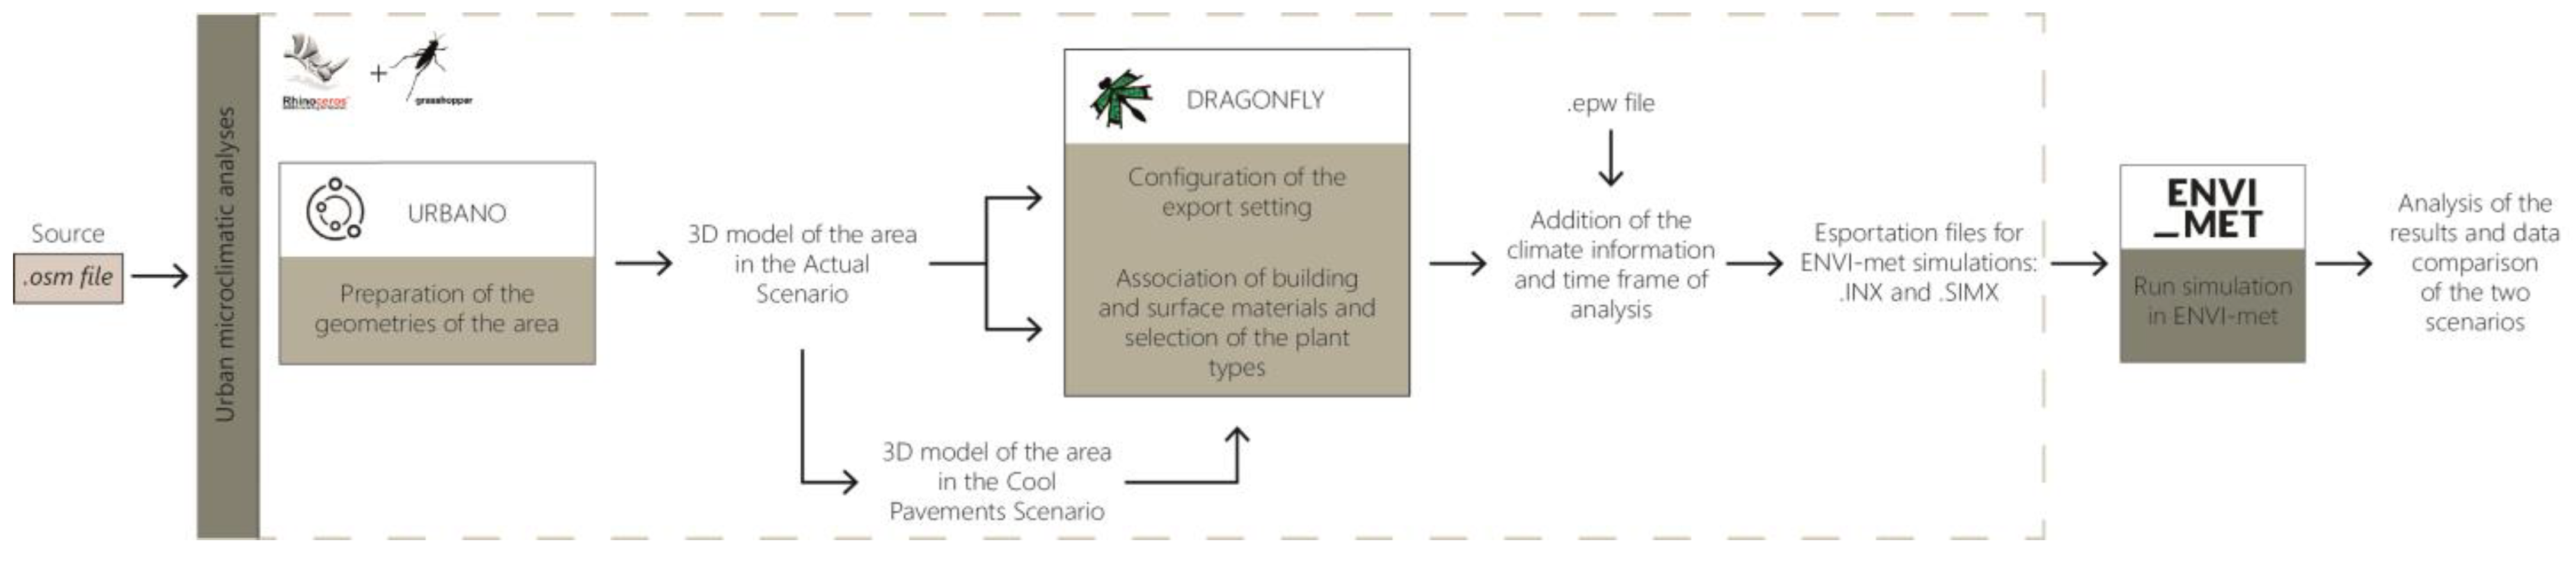
4.3. Microclimate Simulation Software
5. Microclimatic Analysis: Input Data
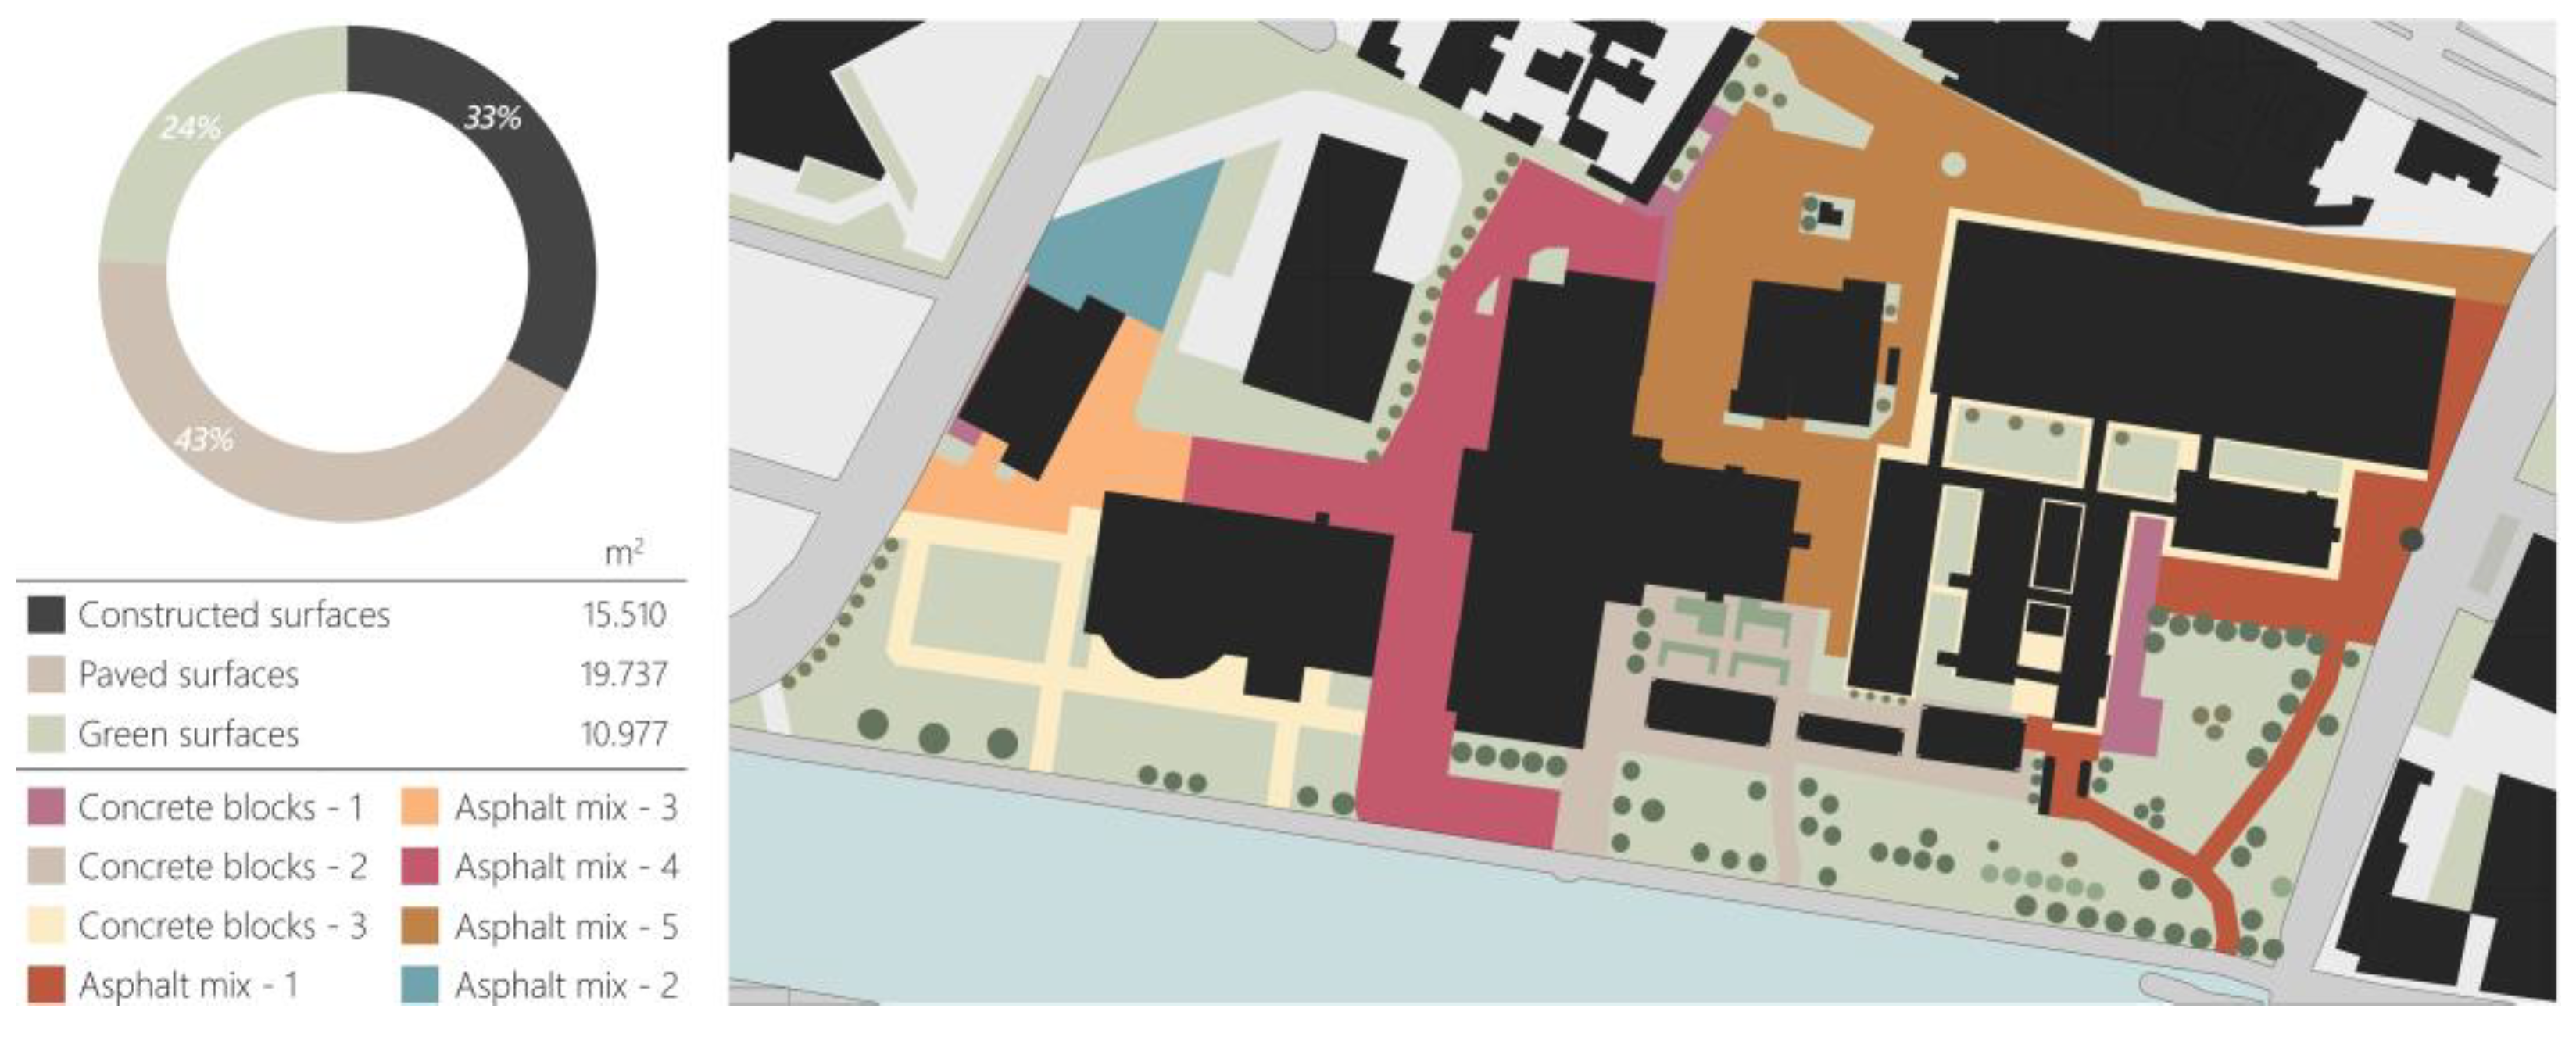
5.1. Actual Scenario
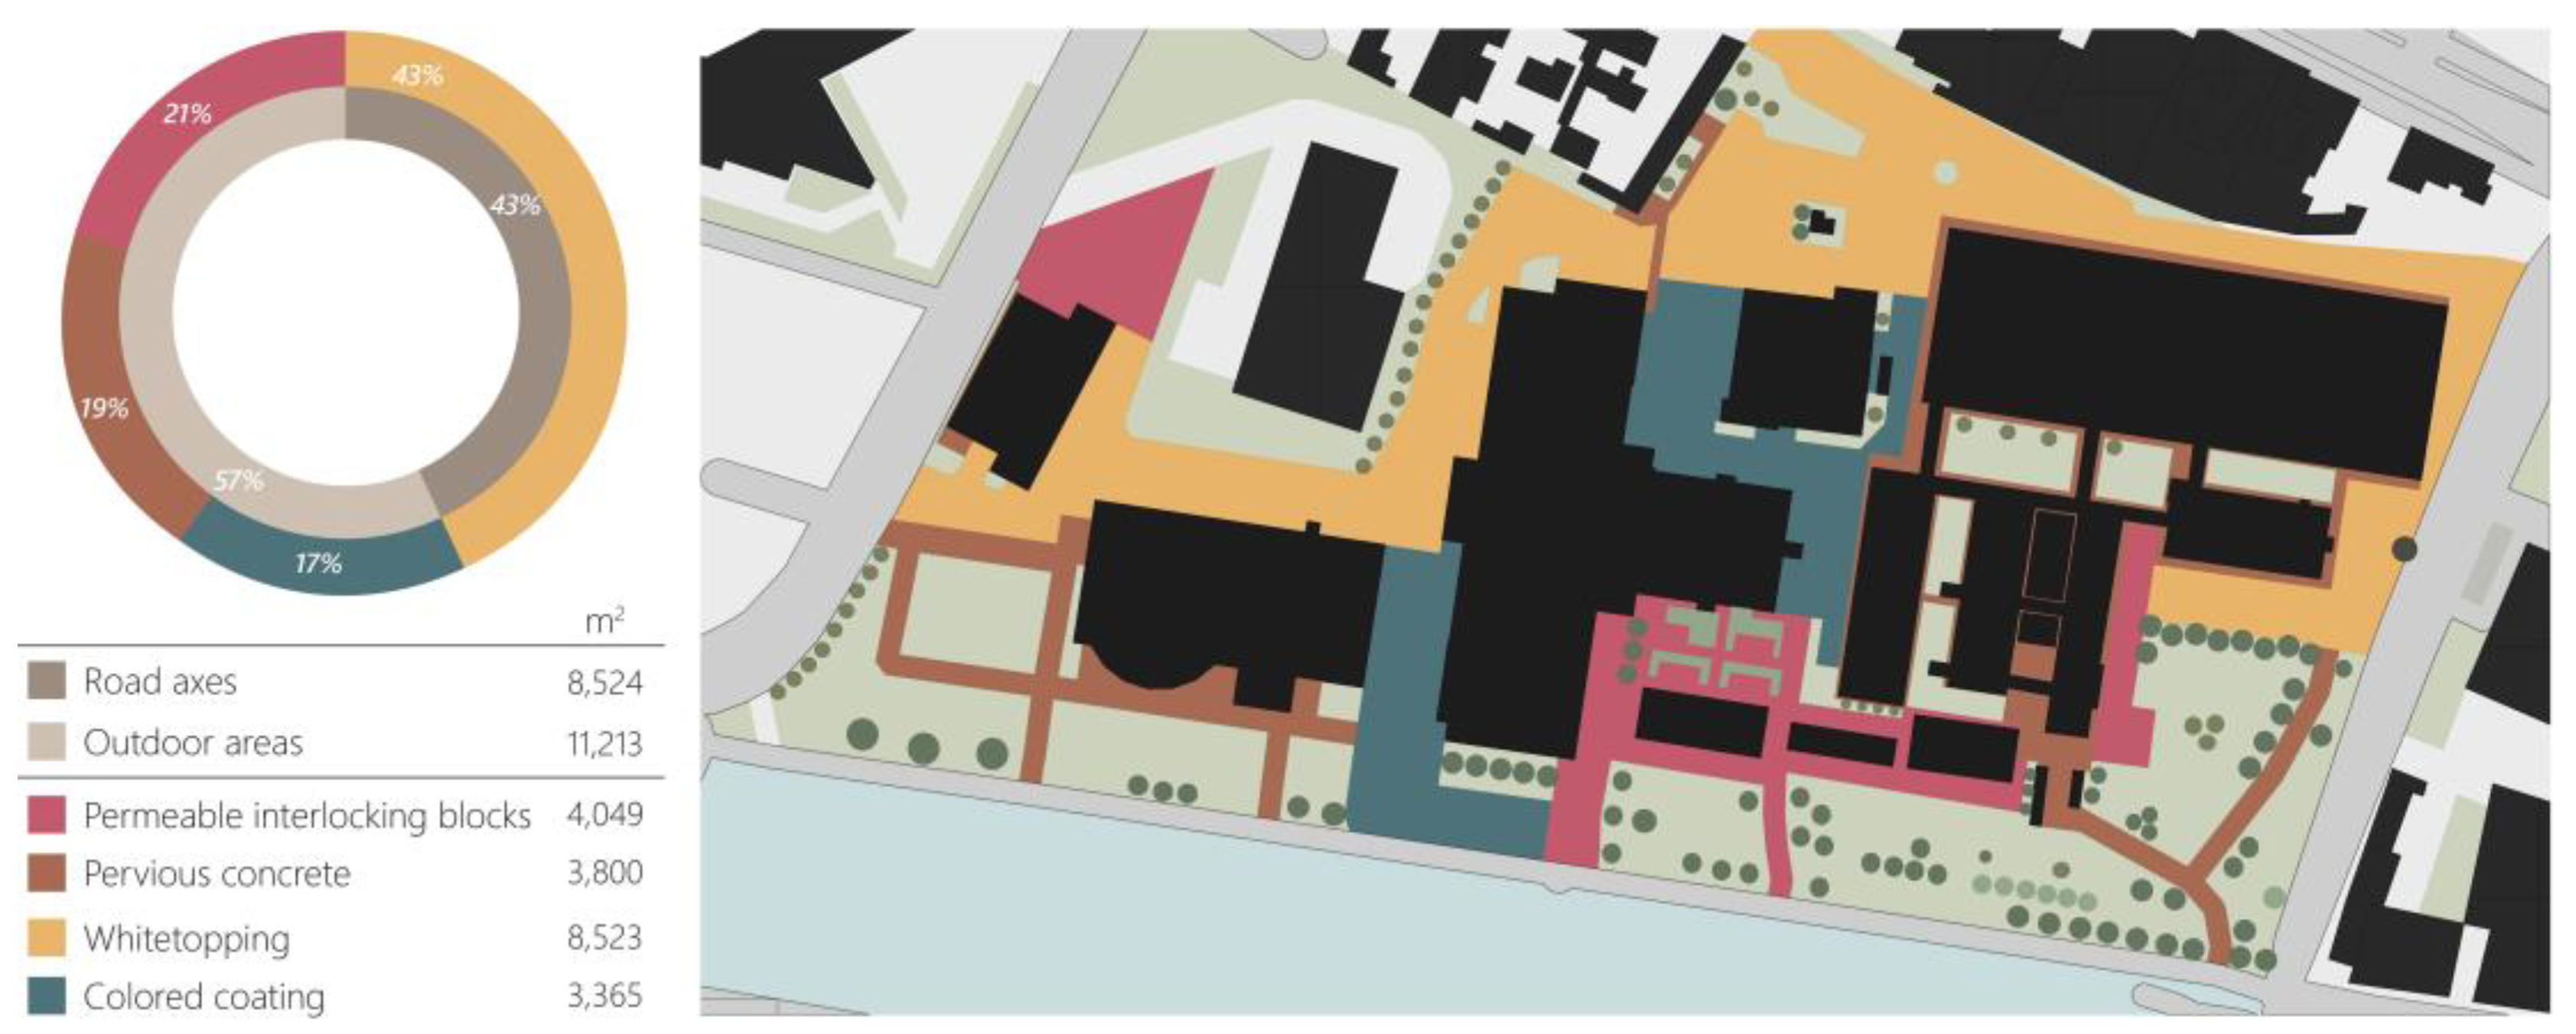
5.2. Cool Pavement Scenario
6. Simulation Analysis
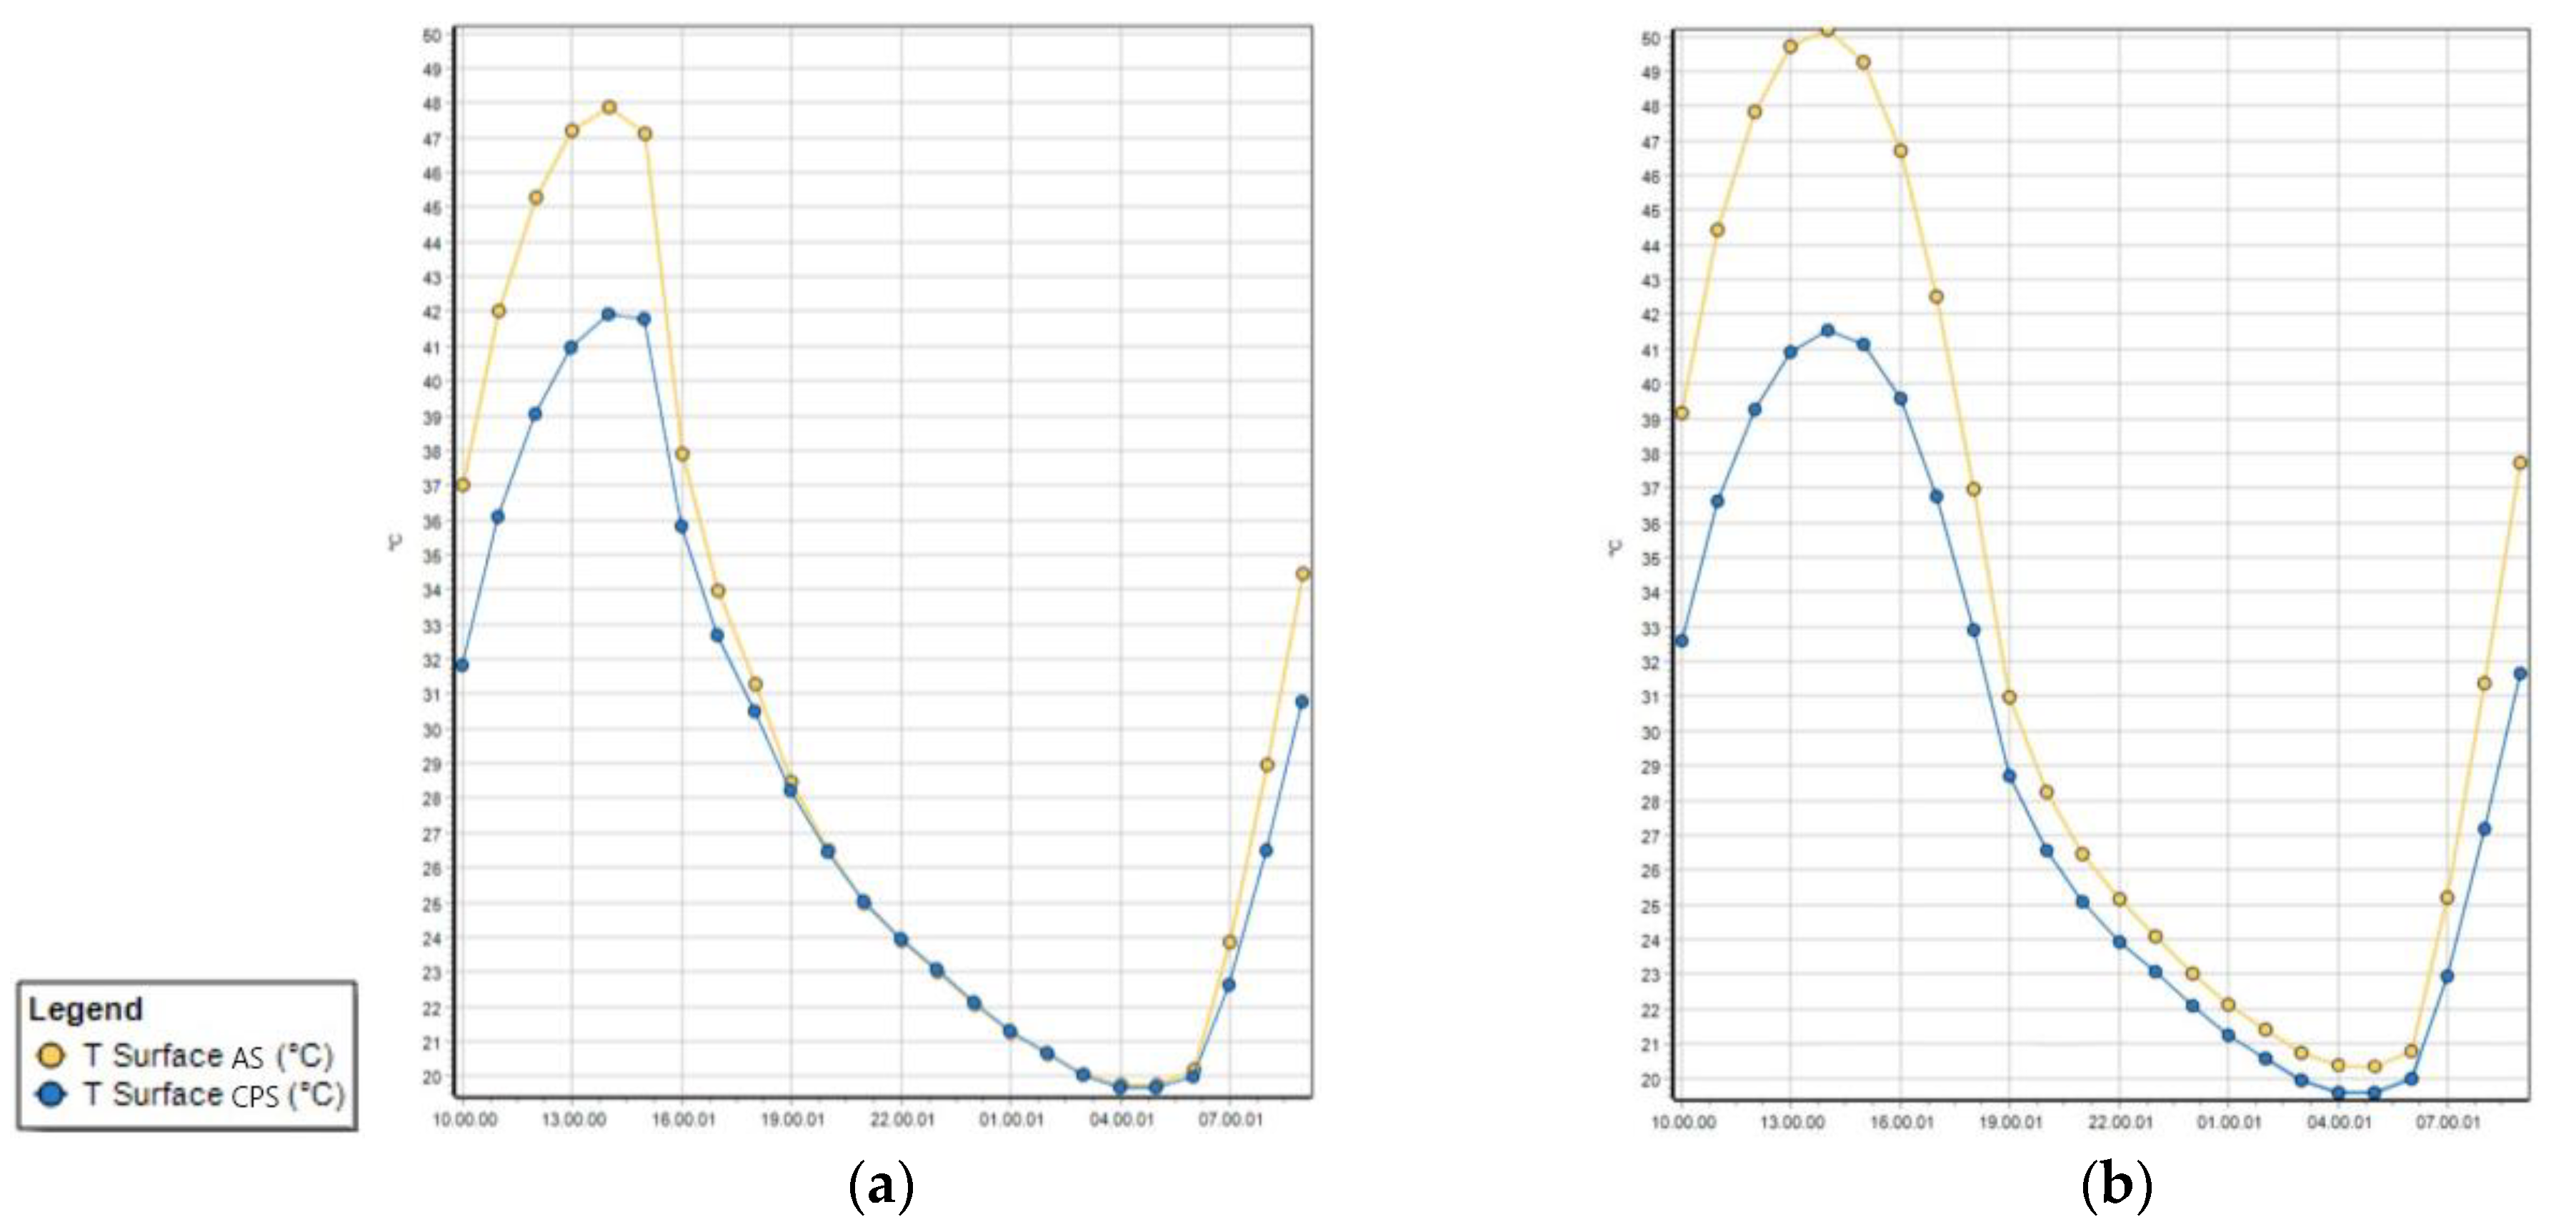
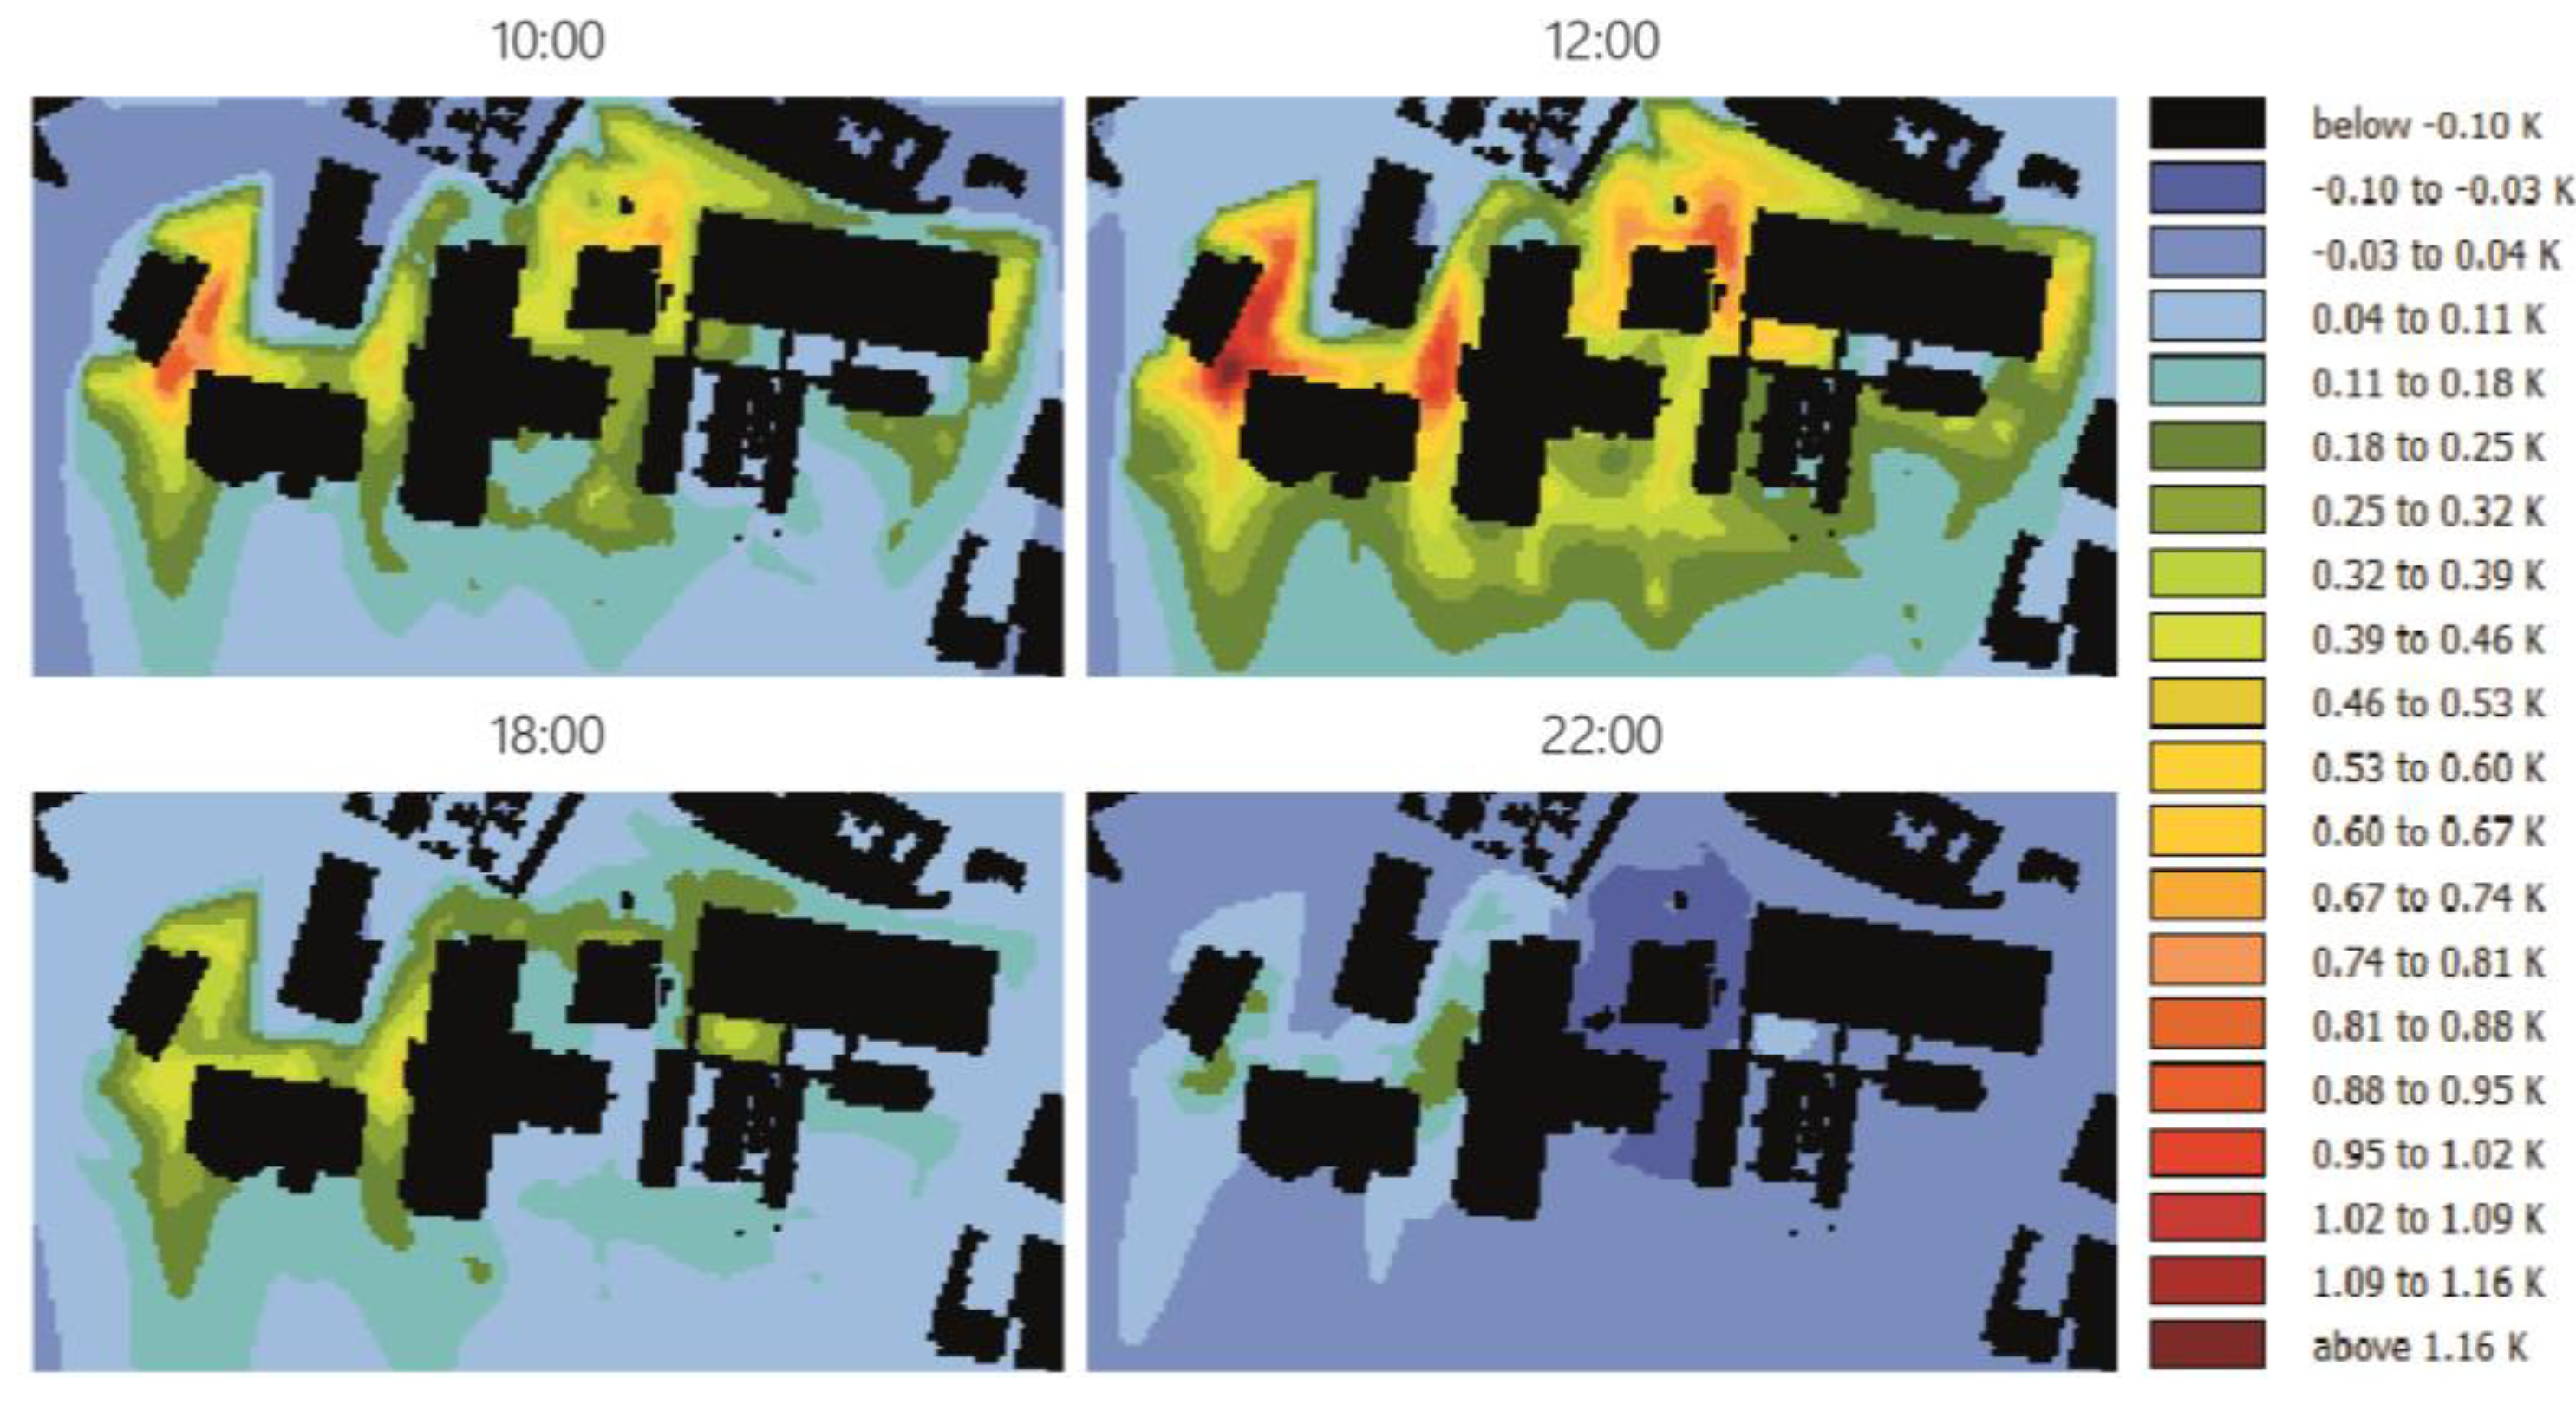
6.1. Ground Surface Temperatures
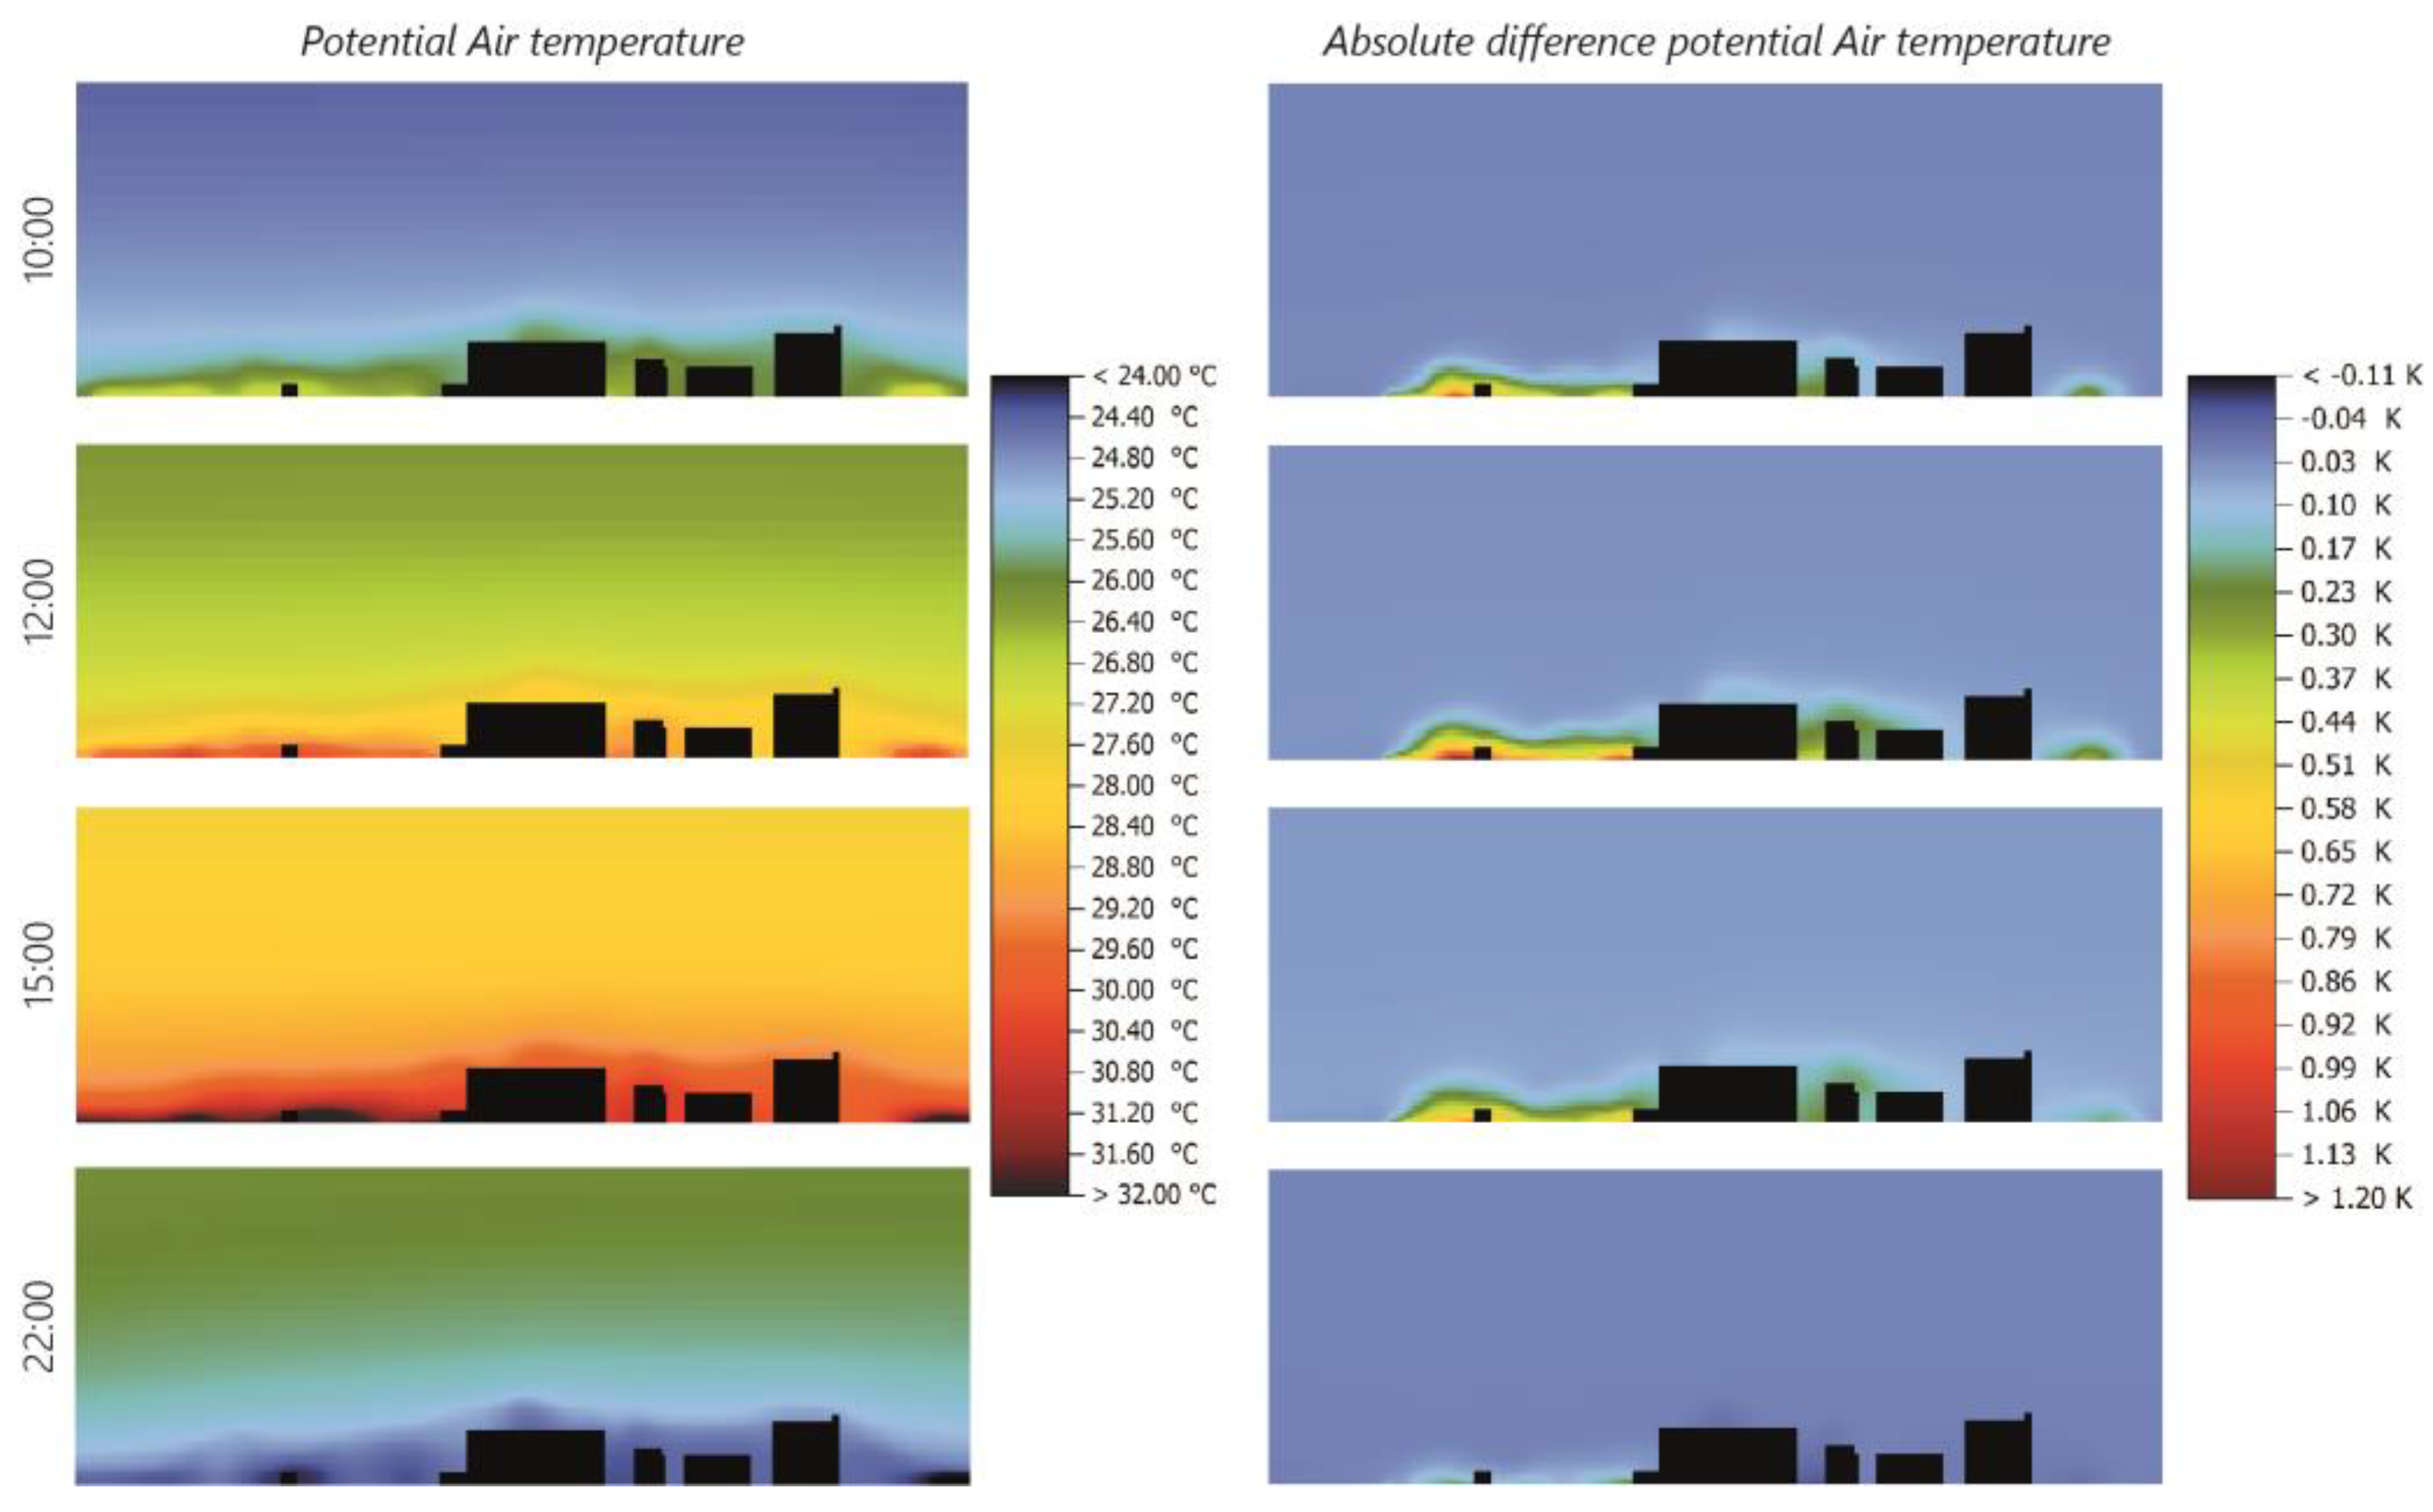
6.2. Air Temperatures
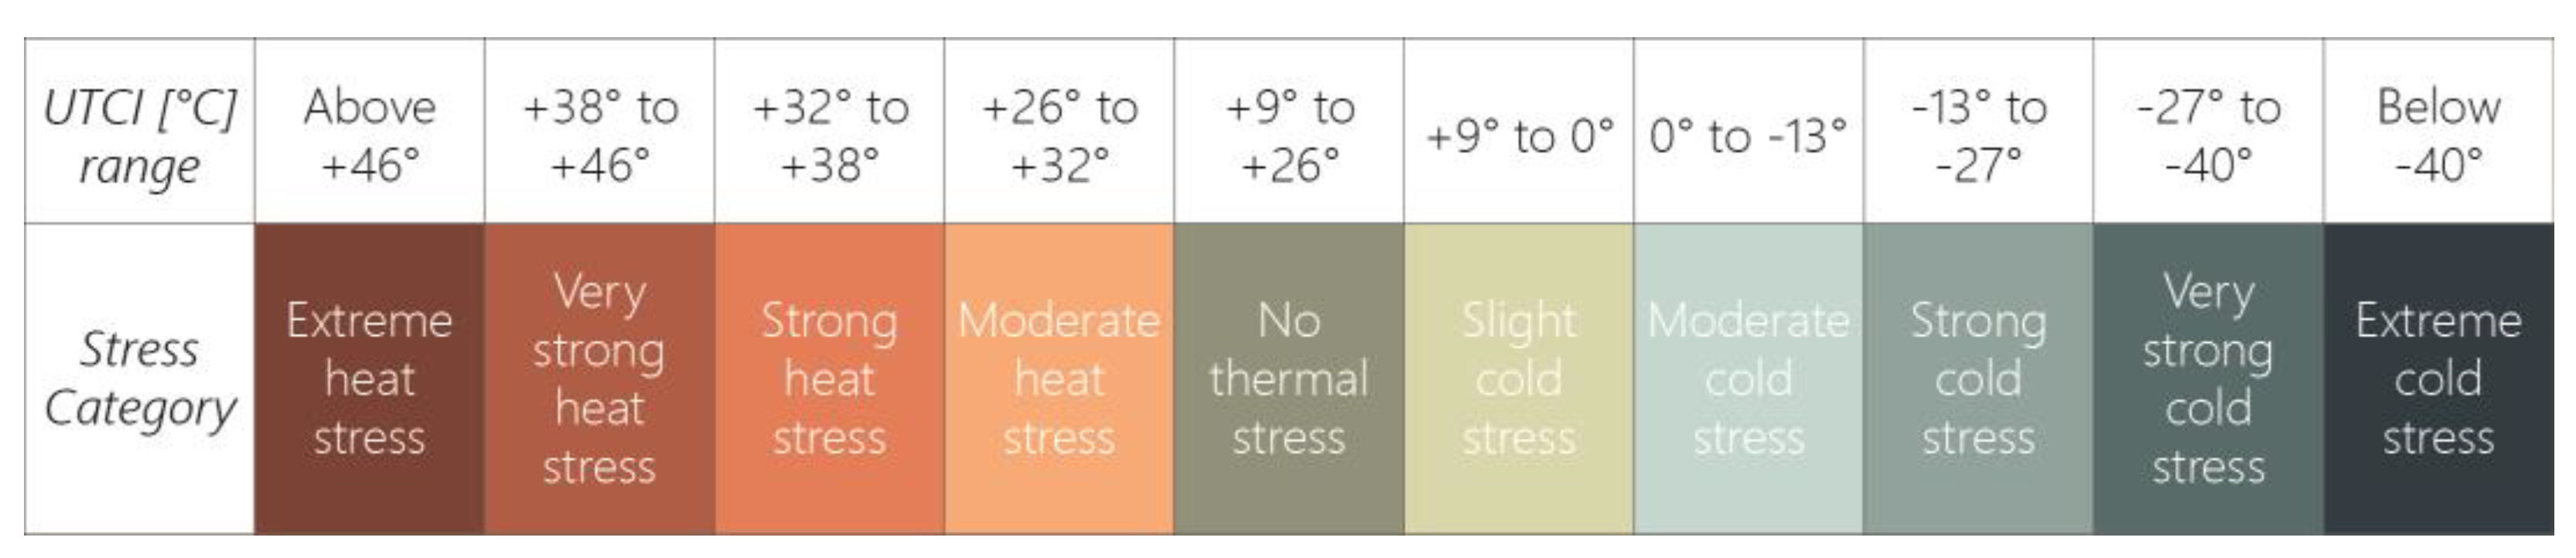
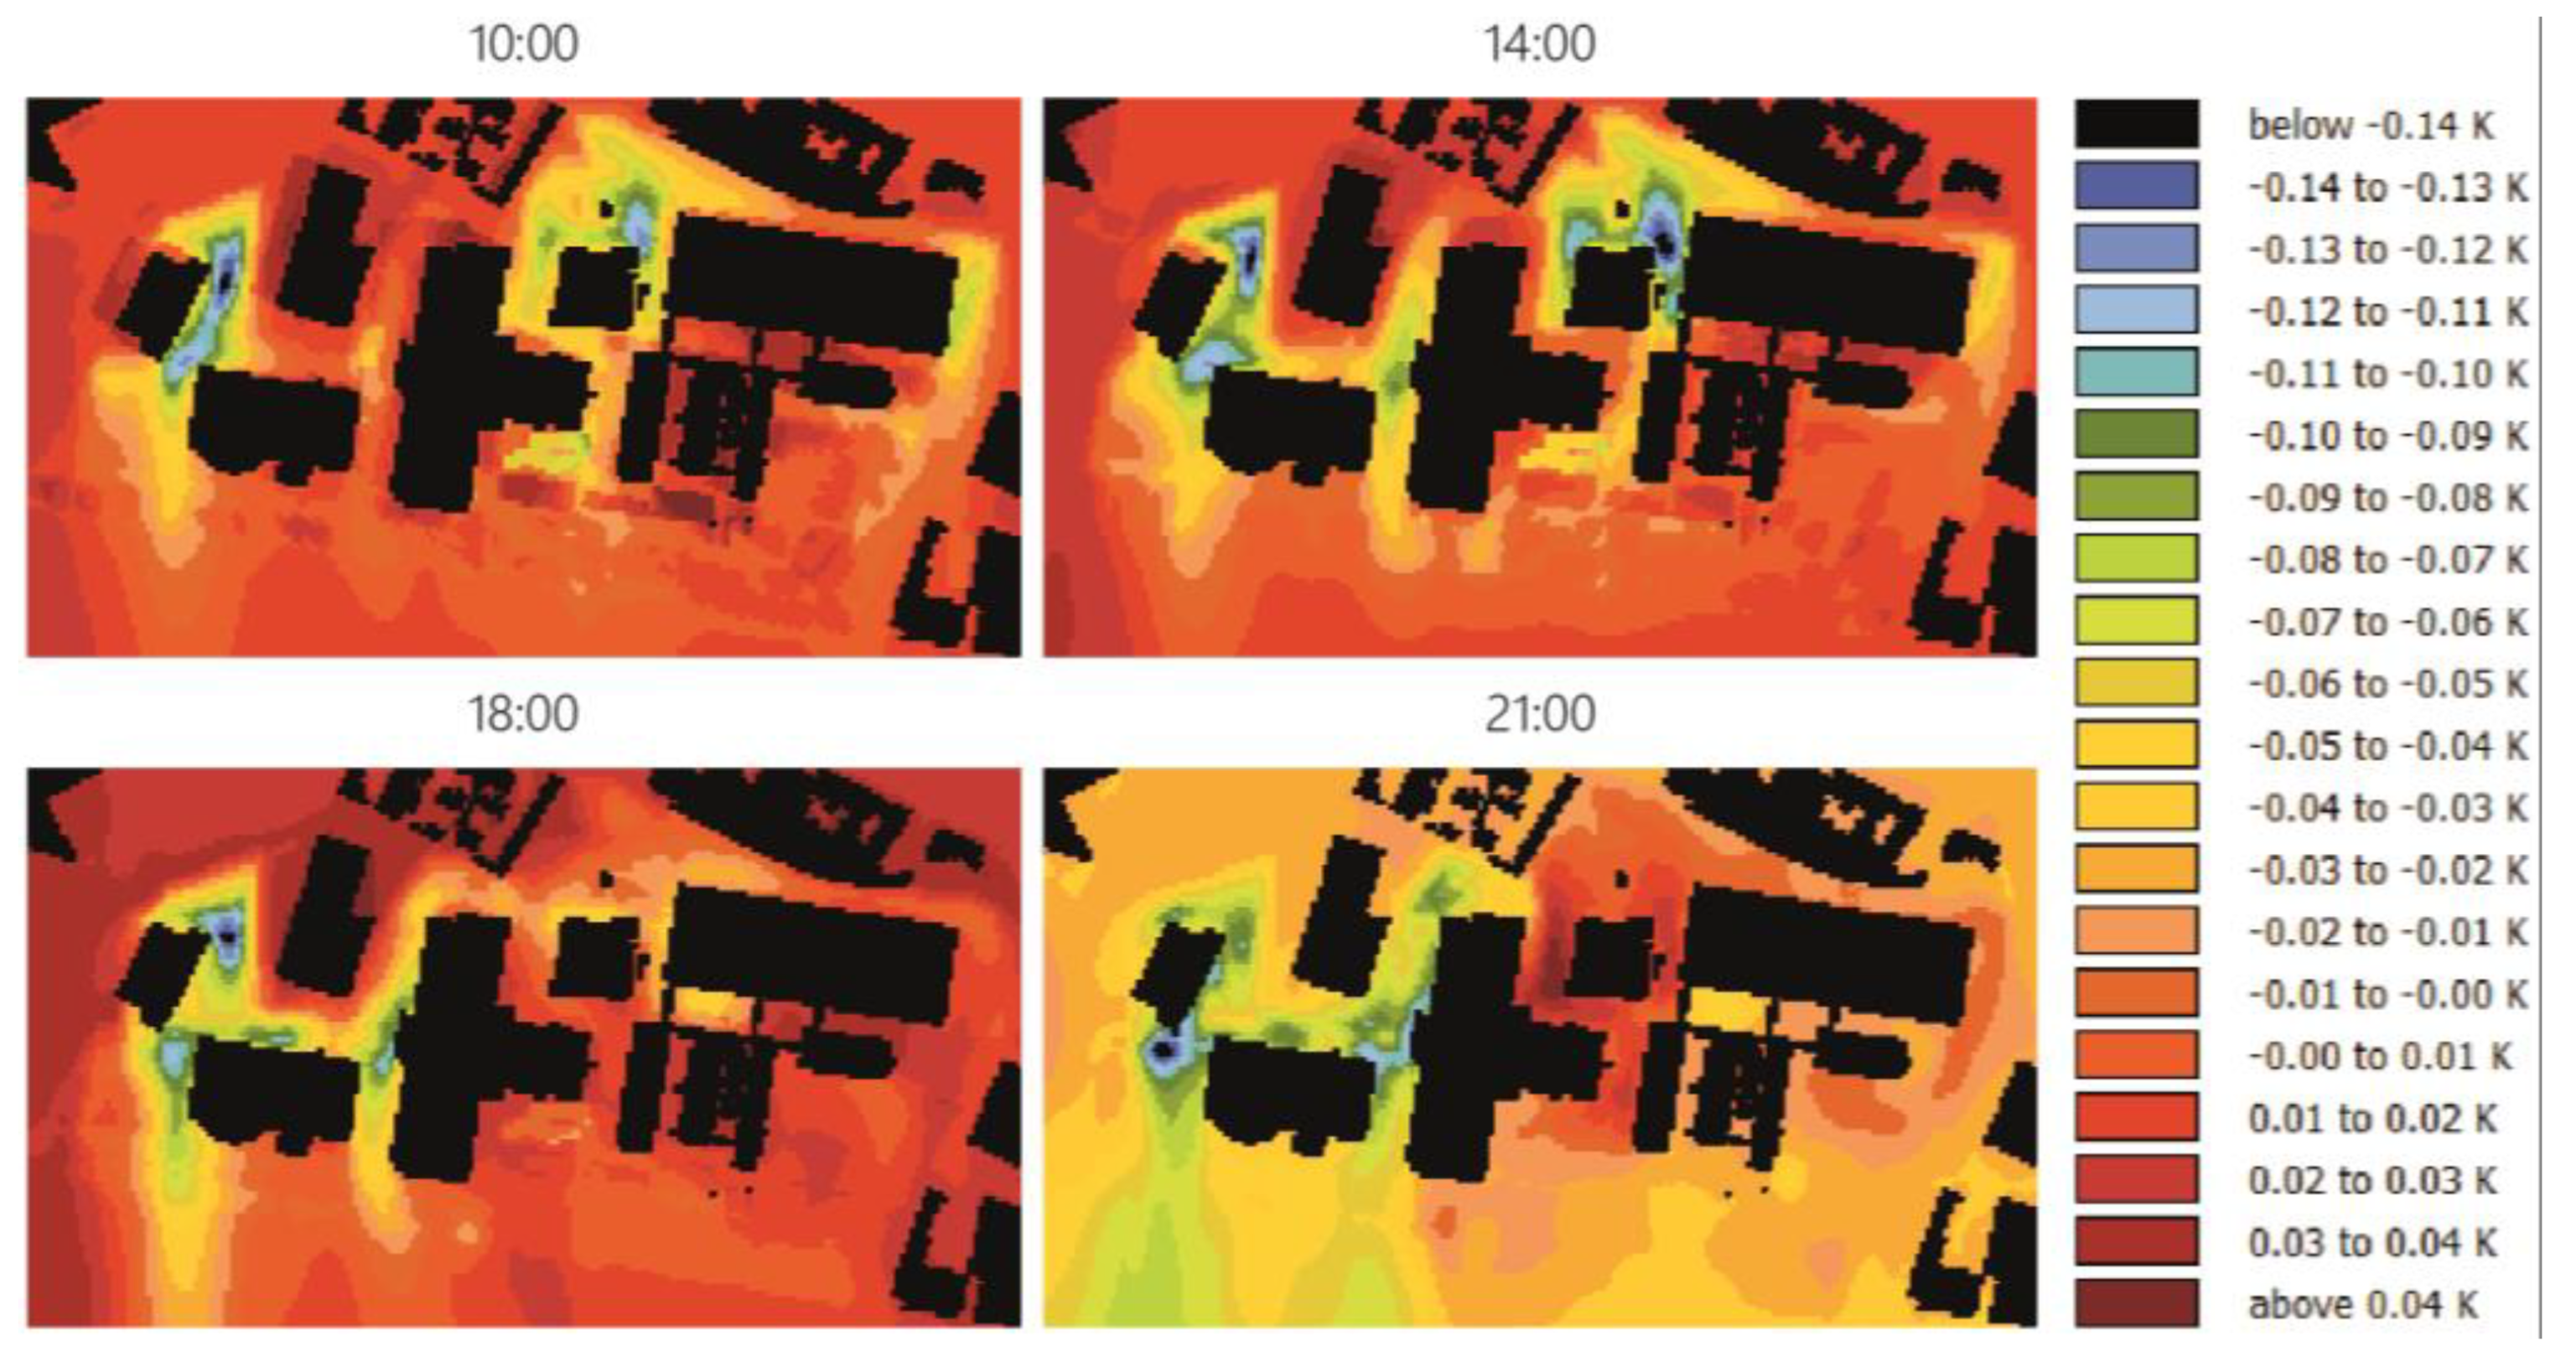
6.3. Universal Thermal Climate Index
7. Final Considerations and Future Works
- -
- Building scale: specifically, to be able to quantify the impact of changing pavement surfaces on indoor thermal comfort conditions and building energy consumption for cooling, the indoor air temperature surfaces at points distant from the external envelope should be analyzed.
- -
- District scale: it might be interesting to carry out simulations to evaluate not only the effectiveness of other regeneration solutions but to analyze the effects of combining cool pavements with other technologies.
- -
- Urban scale: by extending the scale of interventions, it may be useful to expand the study of the impacts that regeneration interventions have within a wider domain, such as whole parts of cities [112].
Author Contributions
Funding
Institutional Review Board Statement
Informed Consent Statement
Data Availability Statement
Conflicts of Interest
References
- Strakhova, K. The Modern World Process of Urbanization. 2023. Available online: https://www.researchgate.net/publication/367282566 (accessed on 15 December 2022).
- Commissione Europea. Superfici Impermeabili, Costi Nascosti. Alla Ricerca di Alternative All’occupazione e All’impermeabilizzazione dei Suoli; Commissione Europea: Lussemburgo, 2013. [Google Scholar] [CrossRef]
- UN Department of Economic and Social Affairs (UN DESA). 68% of the World Population Projected to Live in Urban Areas by 2050. Available online: https://www.un.org/development/desa/en/news/population/2018-revision-of-world-urbanization-prospects.html (accessed on 10 January 2023).
- UNDESA—Population Division. World Urbanization Prospects: The 2018 Revision (ST/ESA/SER.A/420); UNDESA—Population Division: New York, NY, USA, 2019. [Google Scholar]
- British Petroleum. Statistical Review of World Energy, 71st ed.; British Petroleum: London, UK, 2022; Available online: https://www.bp.com/en/global/corporate/energy-economics/statistical-review-of-world-energy.html (accessed on 15 December 2022).
- Huang, X.; Hao, L.; Sun, G.; Yang, Z.; Li, W.; Chen, D. Urbanization Aggravates Effects of Global Warming on Local Atmospheric Drying. Geophys. Res. Lett. 2022, 49, e2021GL095709. [Google Scholar] [CrossRef]
- Wilke, A.B.B.; Beier, J.C.; Benelli, G. Complexity of the relationship between global warming and urbanization—An obscure future for predicting increases in vector-borne infectious diseases. Curr. Opin. Insect Sci. 2019, 35, 1–9. [Google Scholar] [CrossRef] [PubMed]
- Helbling, M.; Meierrieks, D. Global warming and urbanization. J. Popul. Econ. 2022, 1–37. [Google Scholar] [CrossRef]
- Georgiadis, T. CAMBIAMENTI CLIMATICI ED EFFETTI SULLE CITTÀ—REBUS: REnovation of Public Buildings and Urban Spaces. 2018. Available online: https://issuu.com/laboratoriorebus/docs/rebus_03_georgiadis (accessed on 20 December 2022).
- Doherty, M.; Klima, K.; Hellmann, J.J. Climate change in the urban environment: Advancing, measuring and achieving resiliency. Environ. Sci. Policy 2016, 66, 310–313. [Google Scholar] [CrossRef]
- Carter, J.G.; Cavan, G.; Connelly, A.; Guy, S.; Handley, J.; Kazmierczak, A. Climate change and the city: Building capacity for urban adaptation. Prog. Plan. 2015, 95, 1–66. [Google Scholar] [CrossRef]
- Wang, C.; Wang, Z.-H. Projecting population growth as a dynamic measure of regional urban warming. Sustain. Cities Soc. 2017, 32, 357–365. [Google Scholar] [CrossRef]
- Santamouris, M.; Kolokotsa, D. Urban Climate Mitigation Techniques; Routledge: London, UK, 2016; Volume 1. [Google Scholar]
- Pörtner, H.O.; Roberts, D.C.; Tignor, M.; Poloczanska, E.S.; Mintenbeck, K.; Alegría, A.; Craig, M.; Langsdorf, S.; Löschke, S.; Möller, V. Climate Change 2022: Impacts, Adapataion and Vulnerability Summary for Policymakers. Contribution of Working Group II to the Sixth Assessment Report of the Intergovernmental Panel on Climate Change; IPCC: Geneva, Switzerland, 2022. [Google Scholar]
- World Meteorological Organization (WMO) and the Copernicus Climate Change Service. State of the Climate in Europe 2021. 2022. Available online: https://public.wmo.int/en/our-mandate/climate/wmo-statement-state-of-global-climate/Europe (accessed on 17 December 2022).
- Noor, T.; Nazeer, I.; Attique, Z.; Shahzad, M.; Baqi, A. Global temperature variations since pre industrial era. Int. J. Innov. Sci. Technol. 2021, 3, 67–74. [Google Scholar] [CrossRef]
- NOAA National Centers for Environmental Information. State of the Climate: Global Climate Report for Annual 2022. 2022. Available online: https://www.ncei.noaa.gov/access/monitoring/monthly-report/global/202113 (accessed on 10 January 2023).
- Consiglio Nazionale della Green Economy. Rapporto: Verso la neutralità climatica delle Green City. Approcci, Indirizzi, Strategie, Azioni, X Edizione Degli Stati Generali. 2021. Available online: https://www.statigenerali.org/documenti/documenti-2021/ (accessed on 15 December 2022).
- World Economic Forum (WEF). Net Zero Carbon Cities: An Integrated Approach. 2021. Available online: https://www.weforum.org/reports/net-zero-carbon-cities-an-integrated-approach/ (accessed on 20 December 2022).
- Croce, S.; Novelli, A.; Vettorato, D. Visualizzazione di parametri morfologici e ambientali a supporto della pianificazione urbana. In Proceedings of the XXIII Conferenza Nazionale ASITA, Trieste, Italy, 12–14 November 2019; Available online: https://www.researchgate.net/publication/337258740 (accessed on 10 January 2023).
- Ambrosini, D.; Galli, G.; Mancini, B.; Nardi, I.; Sfarra, S. Evaluating mitigation effects of urban heat islands in a historical small center with the ENVI-Met® climate model. Sustainability 2014, 6, 7013–7029. [Google Scholar] [CrossRef]
- Andreucci, M.B.; Cupelloni, L.; Tucci, F. Simulations beyond the building, identifying climate adaptation scale jumping potentials to district and city level. Research by design for the city of Monterotondo (Italy). In Proceedings of Building Simulation 2021: 17th Conference of IBPSA; KU Leuven: Leuven, Belgium, 2022. [Google Scholar] [CrossRef]
- Faragallah, R.N.; Ragheb, R.A. Evaluation of thermal comfort and urban heat island through cool paving materials using ENVI-Met. Ain Shams Eng. J. 2021, 13, 101609. [Google Scholar] [CrossRef]
- Gerundo, C. L’adattamento delle città ai cambiamenti climatici; Fedoa Press—Federico II University Press: Napoli, Italy, 2018. [Google Scholar]
- Kyriakodis, G.-E.; Santamouris, M. Using reflective pavements to mitigate urban heat island in warm climates—Results from a large scale urban mitigation project. Urban Clim. 2018, 24, 326–339. [Google Scholar] [CrossRef]
- Mahdavi, A.; Kiesel, K.; Vuckovic, M. Methodologies for UHI analysis: Urban heat Island phenomenon and related mitigation measures in central Europe. In Counteracting Urban Heat Island Effects in a Global Climate Change Scenario; Springer International Publishing: Berlin/Heidelberg, Germany, 2016; pp. 71–91. [Google Scholar] [CrossRef]
- Dessì, V. Progettare il comfort urbano. Soluzione per un’integrazione tra società e territorio; Sistemi Editoriali: Napoli, Italy, 2008. [Google Scholar]
- U.S. Environmental Protection Agencys Office of Atmospheric Programs. Cool Pavements. Reducing Urban Heat Islands: Compendium of Strategies; 2012. Available online: https://www.epa.gov/heat-islands/heat-island-compendium (accessed on 10 January 2023).
- Oke, T.R.; Mills, G.; Christen, A.; Voogt, J. Urban Climates; Cambridge University Press: Cambridge, UK, 2017. [Google Scholar]
- Mizwar, I.K.; Napiah, M.; Sutanto, M.H. Thermal properties of cool asphalt concrete containing phase change material. In IOP Conference Series: Materials Science and Engineering; Institute of Physics Publishing: Bristol, UK, 2019; Volume 527, p. 012049. [Google Scholar] [CrossRef]
- Li, H.; Harvey, J.T.; Holland, T.J.; Kayhanian, M. Corrigendum: The use of reflective and permeable pavements as a potential practice for heat island mitigation and stormwater management. Environ. Res. Lett. 2013, 8, 049501. [Google Scholar] [CrossRef]
- Levermore, G.; Parkinson, J.; Lee, K.; Laycock, P.; Lindley, S. The increasing trend of the urban heat island intensity. Urban Clim. 2018, 24, 360–368. [Google Scholar] [CrossRef]
- Mirzaei, P.A. Recent challenges in modeling of urban heat island. Sustain. Cities Soc. 2015, 19, 200–206. [Google Scholar] [CrossRef]
- White, P.; Golden, J.S.; Biligiri, K.P.; Kaloush, K. Modeling climate change impacts of pavement production and construction. Resour. Conserv. Recycl. 2010, 54, 776–782. [Google Scholar] [CrossRef]
- Ikechukwu, E.E. The Effects of Road and Other Pavement Materials on Urban Heat Island (A Case Study of Port Harcourt City). J. Environ. Prot. 2015, 06, 328–340. [Google Scholar] [CrossRef]
- Kappou, S.; Souliotis, M.; Papaefthimiou, S.; Panaras, G.; Paravantis, J.A.; Michalena, E.; Hills, J.M.; Vouros, A.P.; Ntymenou, A.; Mihalakakou, G. Cool Pavements: State of the Art and New Technologies. Sustainability 2022, 14, 5159. [Google Scholar] [CrossRef]
- Fujimoto, A.; Tokunaga, R.; Kiriishi, M.; Kawabata, Y.; Takahashi, N.; Ishida, T.; Fukuhara, T. A road surface freezing model using heat, water and salt balance and its validation by field experiments. Cold Reg. Sci. Technol. 2014, 106–107, 1–10. [Google Scholar] [CrossRef]
- Qin, Y.; Zhang, X.; Tan, K.; Wang, J. A review on the influencing factors of pavement surface temperature. Environ. Sci. Pollut. Res. 2022, 29, 67659–67674. [Google Scholar] [CrossRef]
- Santamouris, M. Using cool pavements as a mitigation strategy to fight urban heat island—A review of the actual developments. Renew. Sustain. Energy Rev. 2013, 26, 224–240. [Google Scholar] [CrossRef]
- Doulos, L.; Santamouris, M.; Livada, I. Passive cooling of outdoor urban spaces. The role of materials. Sol. Energy 2004, 77, 231–249. [Google Scholar] [CrossRef]
- Qin, Y.; Hiller, J.E. Understanding pavement-surface energy balance and its implications on cool pavement development. Energy Build. 2014, 85, 389–399. [Google Scholar] [CrossRef]
- Wang, Z.; Xie, Y.; Mu, M.; Feng, L.; Xie, N.; Cui, N. Materials to Mitigate the Urban Heat Island Effect for Cool Pavement: A Brief Review. Buildings 2022, 12, 1221. [Google Scholar] [CrossRef]
- Santamouris, M. Cooling the cities—A review of reflective and green roof mitigation technologies to fight heat island and improve comfort in urban environments. Sol. Energy 2012, 103, 682–703. [Google Scholar] [CrossRef]
- Berardi, U. The outdoor microclimate benefits and energy saving resulting from green roofs retrofits. Energy Build. 2016, 121, 217–229. [Google Scholar] [CrossRef]
- Smith, K.R.; Roebber, P.J. Green Roof Mitigation Potential for a Proxy Future Climate Scenario in Chicago, Illinois. J. Appl. Meteorol. Clim. 2011, 50, 507–522. [Google Scholar] [CrossRef]
- Savio, P.; Rosenzweig, C.; Sokecki, W.D.; Slosberg, R.B. Mitigating New York City’s Heat Island with Urban Forestry, Living Roof, and Light Surfaces; NewYork City Regional Heat Island Initiative: Albany, NY, USA, 2006. [Google Scholar]
- Chen, H.; Ooka, R.; Huang, H.; Tsuchiya, T. Study on mitigation measures for outdoor thermal environment on present urban blocks in Tokyo using coupled simulation. Build. Environ. 2009, 44, 2290–2299. [Google Scholar] [CrossRef]
- Cirrincione, L.; Marvuglia, A.; Scaccianoce, G. Assessing the effectiveness of green roofs in enhancing the energy and indoor comfort resilience of urban buildings to climate change: Methodology proposal and application. Build. Environ. 2021, 205, 108198. [Google Scholar] [CrossRef]
- Del Serrone, G.; Peluso, P.; Moretti, L. Evaluation of Microclimate Benefits Due to Cool Pavements and Green Infrastructures on Urban Heat Islands. Atmosphere 2022, 13, 1586. [Google Scholar] [CrossRef]
- Musco, F.; Fregolent, L. Pianificazione Urbanistica e Clima Urbano: Manuale per la Riduzione dei Fenomeni di isola di Calore Urbano, Regione Veneto; Il Poligrafo: Padova, Italy, 2014. [Google Scholar]
- Lai, D.; Liu, W.; Gan, T.; Liu, K.; Chen, Q. A review of mitigating strategies to improve the thermal environment and thermal comfort in urban outdoor spaces. Sci. Total. Environ. 2019, 661, 337–353. [Google Scholar] [CrossRef]
- EU SCIENCE HUB. Data Sources and Calculation Methods. Available online: https://ec.europa.eu/jrc/en/PVGIS (accessed on 17 January 2023).
- CEI 82-25:2022. Guida Alla Progettazione, Realizzazione e Gestione di Sistemi di Generazione Fotovoltaica. p. 10. Available online: https://mycatalogo.ceinorme.it/cei/item/0000018783/ (accessed on 20 January 2023).
- PVGIS—Photovoltaic Geographical Information System. Available online: https://re.jrc.ec.europa.eu/pvg_tools/en/ (accessed on 10 January 2023).
- Mungule, M.; Iyer, K.K.R. A Review on Role of Pavement Materials on Urban Heat Island Effects. In Sustainable Cities and Resilience, Lecture Notes in Civil Engineering; Springer: Singapore, 2022; pp. 229–237. [Google Scholar] [CrossRef]
- Santamouris, M.; Xirafi, F.; Gaitani, N.; Spanou, A.; Saliari, M.; Vassilakopoulou, K. Improving the Microclimate in a Dense Urban Area Using Experimental and Theoretical Techniques—The Case of Marousi, Athens. Int. J. Vent. 2012, 11, 1–16. [Google Scholar] [CrossRef]
- American Concrete Pavement Association (ACPA). Albedo: A Measure of Pavement Surface Reflectance. Concrete Pavement Research & Technology, Old Orchard Rd. 2002. Available online: https://trid.trb.org/view/920184 (accessed on 18 January 2023).
- Santamouris, M.; Synnefa, A.; Karlessi, T. Using advanced cool materials in the urban built environment to mitigate heat islands and improve thermal comfort conditions. Sol. Energy 2011, 85, 3085–3102. [Google Scholar] [CrossRef]
- Gaitani, N.; Mihalakakou, G.; Santamouris, M. On the use of bioclimatic architecture principles in order to improve thermal comfort conditions in outdoor spaces. Build. Environ. 2007, 42, 317–324. [Google Scholar] [CrossRef]
- Chen, J.; Zhou, Z.; Wu, J.; Hou, S.; Liu, M. Field and laboratory measurement of albedo and heat transfer for pavement materials. Constr. Build. Mater. 2019, 202, 46–57. [Google Scholar] [CrossRef]
- ASTM E1980-11R19; Standard Practice for Calculating Solar Reflectance Index of Horizontal and Low-Sloped Opaque Surfaces. ASTM International: West Conshohocken, PA, USA, 2019. [CrossRef]
- Akbari, H.; Levinson, R.; Rosenfeld, A.; Elliot, M. Global Cooling: Policies to Cool the World and Offset Global Warming from CO2 Using Reflective Roofs and Pavements. J. Heat Isl. Inst. Int. 2012, 7, 1–10. [Google Scholar]
- Qin, Y. A review on the development of cool pavements to mitigate urban heat island effect. Renew. Sustain. Energy Rev. 2015, 52, 445–459. [Google Scholar] [CrossRef]
- Moretti, L.; Di Mascio, P.; Fusco, C. Porous Concrete for Pedestrian Pavements. Water 2019, 11, 2105. [Google Scholar] [CrossRef]
- Tsoka, S.; Theodosiou, T.; Tsikaloudaki, K.; Flourentzou, F. Modeling the performance of cool pavements and the effect of their aging on outdoor surface and air temperatures. Sustain. Cities Soc. 2018, 42, 276–288. [Google Scholar] [CrossRef]
- Chen, Y.; Li, Z.; Ding, S.; Yang, X.; Guo, T. Research on heat reflective coating technology of asphalt pavement. Int. J. Pavement Eng. 2021, 1–10. [Google Scholar] [CrossRef]
- Li, Z.; Guo, T.; Chen, Y.; Wang, C.; Chen, Q.; Ding, S.; Chen, Q.; Chen, H. Preparation and Properties of New Thermal Reflective Coating for Asphalt Pavement. Materials 2022, 15, 8087. [Google Scholar] [CrossRef]
- Zhu, S.; Mai, X. A review of using reflective pavement materials as mitigation tactics to counter the effects of urban heat island. Adv. Compos. Hybrid Mater. 2019, 2, 381–388. [Google Scholar] [CrossRef]
- Ferrari, A.; Kubilay, A.; Derome, D.; Carmeliet, J. The use of permeable and reflective pavements as a potential strategy for urban heat island mitigation. Urban Clim. 2019, 31, 100534. [Google Scholar] [CrossRef]
- Liu, Q.; Varamini, S.; Tighe, S. Field Evaluation of Red-Coloured Hot Mix Asphalt Pavements for Bus Rapid Transit Lanes in Ontario, Canada. Coatings 2017, 7, 58. [Google Scholar] [CrossRef]
- Wang, J.; Meng, Q.; Zhang, L.; Zhang, Y.; He, B.-J.; Zheng, S.; Santamouris, M. Impacts of the water absorption capability on the evaporative cooling effect of pervious paving materials. Build. Environ. 2019, 151, 187–197. [Google Scholar] [CrossRef]
- Cheela, V.R.S.; John, M.; Biswas, W.; Sarker, P. Combating Urban Heat Island Effect—A Review of Reflective Pavements and Tree Shading Strategies. Buildings 2021, 11, 93. [Google Scholar] [CrossRef]
- Nichols Consulting Engineers—NCE. Pavement Management Program: Final Report; Nichols Consulting Engineers—NCE: Blue Lake, CA, USA, 2012. [Google Scholar]
- Tran, N.; Powell, B.; Marks, H.; West, R.; Kvasnak, A. Strategies for Design and Construction of High-Reflectance Asphalt Pavements. Transp. Res. Rec. 2009, 2098, 124–130. [Google Scholar] [CrossRef]
- Texas Department of Transportation. Texas Pavement Manual. 2021. Available online: http://onlinemanuals.txdot.gov/txdotmanuals/pdm/index.htm (accessed on 20 January 2023).
- Krispel, S.; Peyerl, M.; Maier, G.; Weihs, P. Reduction of urban heat islands with whitetopping. Bauphysik 2017, 39, 33–40. [Google Scholar] [CrossRef]
- Xie, J.; Zhou, Z. Numerical Analysis on the Optimization of Evaporative Cooling Performance for Permeable Pavements. Sustainability 2022, 14, 4915. [Google Scholar] [CrossRef]
- Manteghi, G.; Mostofa, T. Evaporative Pavements as an Urban Heat Island (UHI) Mitigation Strategy: A Review. Int. Trans. J. Eng Manag. Appl. Sci. Technol. 2019, 11, 1–15. [Google Scholar]
- Tan, K.; Qin, Y.; Du, T.; Li, L.; Zhang, L.; Wang, J. Biochar from waste biomass as hygroscopic filler for pervious concrete to improve evaporative cooling performance. Constr. Build. Mater. 2021, 287, 123078. [Google Scholar] [CrossRef]
- Nakayama, T.; Fujita, T. Cooling effect of water-holding pavements made of new materials on water and heat budgets in urban areas. Landsc. Urban Plan. 2010, 96, 57–67. [Google Scholar] [CrossRef]
- Elizondo-Martínez, E.-J.; Andrés-Valeri, V.-C.; Juli-Gándara, L.; Rodríguez-Hernández, J. Multifunctional Porous Concrete Urban Pavements for a More Sustainable and Resilient Future. Proceedings 2018, 2, 1453. [Google Scholar] [CrossRef]
- Noviandini, Z.P.; Dewi, O.C.; Laksitoadi, B.; Widyarta, M.N. The Effect of Permeable Pavement on Pedestrian Walkway for Human Comfort. In IOP Conference Series: Earth and Environmental Science; Institute of Physics Publishing: Bristol, UK, 2020. [Google Scholar] [CrossRef]
- Mohajerani, A.; Bakaric, J.; Jeffrey-Bailey, T. The urban heat island effect, its causes, and mitigation, with reference to the thermal properties of asphalt concrete. J. Environ. Manag. 2017, 197, 522–538. [Google Scholar] [CrossRef] [PubMed]
- Gao, L.; Wang, Z.; Xie, J.; Liu, Y.; Jia, S. Simulation of the Cooling Effect of Porous Asphalt Pavement with Different Air Voids. Appl. Sci. 2019, 9, 3659. [Google Scholar] [CrossRef]
- Li, H.; Harvey, J.; Ge, Z. Experimental investigation on evaporation rate for enhancing evaporative cooling effect of permeable pavement materials. Constr. Build. Mater. 2014, 65, 367–375. [Google Scholar] [CrossRef]
- Rymer, B.; Donavan, P.R. Determining End Limits of Quieter Pavement Projects. Transp. Res. Rec. J. Transp. Res. Board 2011, 2233, 145–151. [Google Scholar] [CrossRef]
- Bao, T.; Liu, Z.L.; Zhang, X.; He, Y. A drainable water-retaining paver block for runoff reduction and evaporation cooling. J. Clean. Prod. 2019, 228, 418–424. [Google Scholar] [CrossRef]
- Santamouris, M.; Gaitani, N.; Spanou, A.; Saliari, M.; Giannopoulou, K.; Vasilakopoulou, K.; Kardomateas, T. Using cool paving materials to improve microclimate of urban areas—Design realization and results of the flisvos project. Build. Environ. 2012, 53, 128–136. [Google Scholar] [CrossRef]
- He, B.-J.; Wang, J.; Liu, H.; Ulpiani, G. Localized synergies between heat waves and urban heat islands: Implications on human thermal comfort and urban heat management. Environ. Res. 2020, 193, 110584. [Google Scholar] [CrossRef]
- Taleghani, M.; Berardi, U. The effect of pavement characteristics on pedestrians’ thermal comfort in Toronto. Urban Clim. 2018, 24, 449–459. [Google Scholar] [CrossRef]
- Shimazaki, Y.; Aoki, M.; Nitta, J.; Okajima, H.; Yoshida, A. Experimental Determination of Pedestrian Thermal Comfort on Water-Retaining Pavement for UHI Adaptation Strategy. Atmosphere 2021, 12, 127. [Google Scholar] [CrossRef]
- Kántor, N.; Unger, J. The most problematic variable in the course of human-biometeorological comfort assessment—The mean radiant temperature. Open Geosci. 2011, 3, 90–100. [Google Scholar] [CrossRef]
- ISTAT. Population Data by Municipality. Available online: https://demo.istat.it/app/?i=P02&l=it (accessed on 10 February 2023).
- Kottek, M.; Grieser, J.; Beck, C.; Rudolf, B.; Rubel, F. World map of the Köppen-Geiger climate classification updated. Meteorol. Z. 2006, 15, 259–263. [Google Scholar] [CrossRef] [PubMed]
- Sistema Nazionale per la Protezione dell’Ambiente (SNPA). Rapporto—Consumo di suolo, Dinamiche Territoriali e Servizi Ecosistemici. Edizione 2022; 2022. Available online: https://www.isprambiente.gov.it/it/attivita/suolo-e-territorio/suolo/il-consumo-di-suolo/i-dati-sul-consumo-di-suolo (accessed on 25 February 2023).
- Sistema Nazionale per la Protezione dell’Ambiente (SNPA). Il Consumo di Suolo in Italia. Trasformazioni in atto e attività di monitoraggio—Edizione 2022. Available online: https://webgis.arpa.piemonte.it/agportal/apps/MapSeries/index.html?appid=a69317f87a5745a0b556526579755e37 (accessed on 10 February 2023).
- ISPRA e SNPA. Schede Regionali. Consumo di Suolo, Dinamiche Territoriali e Servizi Ecosistemici. Report di sistema SNPA|32 2022. Available online: https://www.snpambiente.it/2022/07/26/consumo-di-suolo-dinamiche-territoriali-e-servizi-ecosistemici-edizione-2022/ (accessed on 20 February 2023).
- Regione Veneto. Contenimento del Consumo di Suolo. 2022. Available online: https://www.regione.veneto.it/web/ambiente-e-territorio/contenimento-consumo-di-suolo#:~:text=14%2F2017%2C%20della%20quantit%C3%A0%20massima,4%20della%20legge%20regionale%20n (accessed on 20 February 2023).
- Lobaccaro, G.; De Ridder, K.; Acero, J.A.; Hooyberghs, H.; Lauwaet, D.; Maiheu, B.; Sharma, R.; Govehovitch, B. Applications of Models and Tools for Mesoscale and Microscale Thermal Analysis in Mid-Latitude Climate Regions—A Review. Sustainability 2021, 13, 12385. [Google Scholar] [CrossRef]
- Noro, M.; Lazzarin, R. Urban heat island in Padua, Italy: Simulation analysis and mitigation strategies. Urban Clim. 2015, 14, 187–196. [Google Scholar] [CrossRef]
- Busato, F.; Lazzarin, R.; Noro, M. Three years of study of the Urban Heat Island in Padua: Experimental results. Sustain. Cities Soc. 2014, 10, 251–258. [Google Scholar] [CrossRef]
- Noro, M.; Busato, F.; Lazzarin, R.M. UHI effect in the city of Padua: Simulations and mitigation strategies using the Rayman and Envimet models. Geogr. Pol. 2014, 87, 517–530. [Google Scholar] [CrossRef]
- Zhang, L.; Yuan, C. Multi-scale climate-sensitive planning framework to mitigate urban heat island effect: A case study in Singapore. Urban Clim. 2023, 49, 101451. [Google Scholar] [CrossRef]
- Naboni, E.; Havinga, L.C. Regenerative Design in Digital Practice: A Handbook for the Built Environment; Eurac Research: Bolzano, Italy, 2019. [Google Scholar]
- Epw Map—Ladybug. Available online: https://www.ladybug.tools/epwmap/ (accessed on 15 December 2022).
- Climate.OneBuilding.Org. Available online: https://climate.onebuilding.org/ (accessed on 15 December 2022).
- Oikolab. Available online: https://oikolab.com/ (accessed on 15 December 2022).
- Shiny Weather Data. Available online: https://www.shinyweatherdata.com/ (accessed on 15 December 2022).
- ARPAV. Dati Meteorologici Orari. Available online: https://www.ambienteveneto.it/datiorari/ (accessed on 15 December 2022).
- ENVI-met. Available online: https://www.envi-met.com/it/ (accessed on 15 December 2022).
- Crank, P.J.; Sailor, D.J.; Ban-Weiss, G.; Taleghani, M. Evaluating the ENVI-met microscale model for suitability in analysis of targeted urban heat mitigation strategies. Urban Clim. 2018, 26, 188–197. [Google Scholar] [CrossRef]
- Croce, S.; D’agnolo, E.; Caini, M.; Paparella, R. The Use of Cool Pavements for the Regeneration of Industrial Districts. Sustainability 2021, 13, 6322. [Google Scholar] [CrossRef]
- Yang, X.; Zhao, L.; Bruse, M.; Meng, Q. Evaluation of a microclimate model for predicting the thermal behavior of different ground surfaces. Build. Environ. 2013, 60, 93–104. [Google Scholar] [CrossRef]
- Gros, A.; Bozonnet, E.; Inard, C. Cool materials impact at district scale—Coupling building energy and microclimate models. Sustain. Cities Soc. 2014, 13, 254–266. [Google Scholar] [CrossRef]
- Tsoka, S.; Tsikaloudaki, A.; Theodosiou, T. Analyzing the ENVI-met microclimate model’s performance and assessing cool materials and urban vegetation applications—A review. Sustain. Cities Soc. 2018, 43, 55–76. [Google Scholar] [CrossRef]
- Lobaccaro, G.; Croce, S.; Vettorato, D.; Carlucci, S. A holistic approach to assess the exploitation of renewable energy sources for design interventions in the early design phases. Energy Build. 2018, 175, 235–256. [Google Scholar] [CrossRef]
- Tsoka, S.; Tsikaloudaki, K.; Theodosiou, T.; Bikas, D. Urban Warming and Cities’ Microclimates: Investigation Methods and Mitigation Strategies—A Review. Energies 2020, 13, 1414. [Google Scholar] [CrossRef]
- Wang, J.; Santamouris, M.; Meng, Q.; He, B.-J.; Zhang, L.; Zhang, Y. Predicting the solar evaporative cooling performance of pervious materials based on hygrothermal properties. Sol. Energy 2019, 191, 311–322. [Google Scholar] [CrossRef]
- Yi, Y.; Jiang, Y.; Li, Q.; Deng, C.; Ji, X.; Xue, J. Development of Super Road Heat-Reflective Coating and Its Field Application. Coatings 2019, 9, 802. [Google Scholar] [CrossRef]
- Bröde, P.; Jendritzky, G.; Fiala, D.; Havenith, G. The Universal Thermal Climate Index UTCI in Operational Use. In Proceedings of the Conference: Adapting to Change: New Thinking on Comfort Cumberland Lodge, Windsor, UK, 9–11 April 2010; Available online: http://nceub.org.uk (accessed on 21 April 2023).
- Jendritzky, G.; Havenith, G.; Weihs, P.; Batchvarova, E. Towards a Universal Thermal Climate Index UTCI for Assessing the Thermal Environment of the Human Being; Final Report COST Action 730; 2009. Available online: https://www.cost.eu/actions/730/ (accessed on 17 March 2023).
- Di Napoli, C.; Pappenberger, F.; Cloke, H.L. Assessing heat-related health risk in Europe via the Universal Thermal Climate Index (UTCI). Int. J. Biometeorol. 2018, 62, 1155–1165. [Google Scholar] [CrossRef]
- UTCI. Available online: https://utci.lobelia.earth/what-is-utci (accessed on 17 March 2023).
- Vujovic, S.; Haddad, B.; Karaky, H.; Sebaibi, N.; Boutouil, M. Urban Heat Island: Causes, Consequences, and Mitigation Measures with Emphasis on Reflective and Permeable Pavements. Civileng 2021, 2, 459–484. [Google Scholar] [CrossRef]


| Type of Pavement | Albedo | Emissivity | Density (g/cm3) |
|---|---|---|---|
| Asphalt mix—type 1 | 0.123 | 0.91 | 2.201 |
| Concrete blocks—type 1 | 0.183 | 0.92 | 2.426 |
| Concrete blocks—type 2 | 0.191 | 0.93 | 2.466 |
| Concrete blocks—type 3 | 0.155 | 0.94 | 2.477 |
| Asphalt mix—type 2 | 0.131 | 0.86 | 2.352 |
| Asphalt mix—type 3 | 0.166 | 0.92 | 2.316 |
| Asphalt mix—type 4 | 0.122 | 0.92 | 2.339 |
| Asphalt mix—type 5 | 0.167 | 0.92 | 2.366 |
| Type of Pavement | Albedo | Emissivity | Heat Conductivity (W/m K) |
|---|---|---|---|
| Whitetopping | 0.40 | 0.91 | 1.63 |
| Pervious concrete | 0.30 | 0.90 | 2.33 |
| Colored asphalt | 0.27 | 0.90 | 1.16 |
| Permeable interlocking concrete blocks | 0.50 | 0.90 | 2.00 |
| Point | Ground Surface Materials AS | Ground Surface Materials CP | AS: Ts (°C) | CPS: ΔTs (°C) | ||||||
|---|---|---|---|---|---|---|---|---|---|---|
| 09:00 | 14:00 | 17:00 | 21:00 | 09:00 | 14:00 | 17:00 | 21:00 | |||
| PT.1 | Asphalt mix—type 1 | Whitetopping | 33.6 | 51.3 | 39.1 | 26.5 | 0.8 | 5.5 | 1.5 | 0.1 |
| PT.2 | Concrete blocks—type 1 | Perm. Interl. concrete blocks | 33.9 | 43.9 | 33.9 | 26.3 | 2.7 | 3.6 | 1.7 | 0.7 |
| PT.3 | Concrete blocks—type 2 | Perm. Interl. concrete blocks | 34.9 | 38.1 | 32.9 | 25.9 | 3.7 | 3.1 | 1.5 | 0.2 |
| PT.4 | Concrete blocks—type 3 | Pervious concrete | 35.1 | 50.2 | 43.5 | 27.2 | 0.7 | 3.3 | 2.5 | 0.1 |
| PT.5 | Asphalt mix—type 2 | Perm. Interl. concrete blocks | 37.7 | 50.2 | 42.5 | 26.5 | 6.0 | 8.6 | 5.7 | 1.4 |
| PT.6 | Asphalt mix—type 3 | Colored asphalt | 24.8 | 43.6 | 35.0 | 25.2 | 0.1 | 1.6 | 0.5 | −0.3 |
| PT.7 | Asphalt mix—type 4 | Whitetopping | 34.4 | 47.9 | 34.0 | 25.0 | 3.5 | 5.9 | 1.1 | −0.3 |
| PT.8 | Asphalt mix—type 5 | Colored asphalt | 31.9 | 45.6 | 31.7 | 24.7 | 2.1 | 2.8 | 0.2 | −0.5 |
Disclaimer/Publisher’s Note: The statements, opinions and data contained in all publications are solely those of the individual author(s) and contributor(s) and not of MDPI and/or the editor(s). MDPI and/or the editor(s) disclaim responsibility for any injury to people or property resulting from any ideas, methods, instructions or products referred to in the content. |
© 2023 by the authors. Licensee MDPI, Basel, Switzerland. This article is an open access article distributed under the terms and conditions of the Creative Commons Attribution (CC BY) license (https://creativecommons.org/licenses/by/4.0/).
Share and Cite
Giorio, M.; Paparella, R. Climate Mitigation Strategies: The Use of Cool Pavements. Sustainability 2023, 15, 7641. https://doi.org/10.3390/su15097641
Giorio M, Paparella R. Climate Mitigation Strategies: The Use of Cool Pavements. Sustainability. 2023; 15(9):7641. https://doi.org/10.3390/su15097641
Chicago/Turabian StyleGiorio, Martina, and Rossana Paparella. 2023. "Climate Mitigation Strategies: The Use of Cool Pavements" Sustainability 15, no. 9: 7641. https://doi.org/10.3390/su15097641