


Disparities in Drinking Water and Sanitation in the Urban Slums of Kerala, India
Department of Economics, University of Kerala, Thiruvananthapuram 695581, India
Sustainability 2023, 15(9), 7559; https://doi.org/10.3390/su15097559
Submission received: 4 February 2023
/
Revised: 10 April 2023
/
Accepted: 27 April 2023
/
Published: 4 May 2023
(This article belongs to the Special Issue Advances in Community Resilience and Sustainable Urban Governance)
Abstract
:Even though the water and sanitation situations in urban areas are better than those in rural areas, the situation in the urban slums is worse than that in rural areas. Knowledge of the actual situation of the deprived slums is very important for introducing effective policies to steer a resilient system. This study tried to determine the disparity between the two urban slums based on the principles of availability, accessibility, acceptability, quality and safety and affordability of water and sanitation. The study used a comparative analysis based on the absolute disparity methods. With the support of water and sanitation deprivation indices, percentages, chi-square test, t-test and Mann–Whitney U test the study determined the disparity between the slums. The deprivation level of the physical environment of the two urban slums is almost the same, whereas the water and sanitation deprivation levels are very high in the Vizhinjam slum area compared to those in Barten Hill. Therefore, concerted efforts are needed to reduce the disparities between slums as well as the overall physical environment of the urban slums. Since the physical environment, including infrastructural facilities, is lacking in urban slums compared to other urban areas, achieving a resilient economy requires a systematic institutional framework with proper governance. The three components in the integrated development approaches are households, communities and cities, lacking essential services, which needs immediate solutions. The entry point should be at the household level.
1. Introduction
Globally rapid urbanization is one of the challenges of the 21st century, and it is overriding in developing countries [1]. An increase in the urban population means a corresponding increase in the population of urban slums. The percentage of the slum population in the world increased from 23 percent in 2014 to 24 percent in 2018 [2]. The highest prevalence of slum dwellers is in three regions: Eastern and South-Eastern Asia, sub-Saharan Africa, and Central and Southern Asia [2]. According to UN-Habitat data, about 35.2 percent of the people in India lived in urban slums in 2018. In India, even though there was a decline in the proportion of the urban slum population during 2001–2011 (17.4 percent), the population in the urban slum is increasing, and the relationship with urbanization has been positive, strong and linear over the decade [3]. In Kerala, the percentage of the urban population increased from 25.96 percent to 47.7 percent in the period from 2001 to 2011. The urbanization trend in Kerala has increased over the last three Censuses. Along with this, the state witnessed the proliferation of slums in the 2001–2011 decade, and around 32 percent of the towns in the state have slum populations.
The condition of households having access to safe water and sanitation services at the global and national levels has markedly improved over the decades. About 74 percent of the global population had access to safely managed drinking water services and 54 percent had access to safely managed sanitation in 2020 [4]. According to the latest Census report, about 85.5 percent of the total population of India have access to the provision of safe drinking water, and the proportion in the urban area is 91.4 percent, whereas in the rural area, it is 82.7 percent [5]. Based on NSS data in 2018, 88.7 percent of households had enough drinking water from primary drinking water sources, and 79.8 percent of households had access to toilet facilities [6]. The same case of urban households is 88.7 percent and 96.2 percent, respectively, for access to drinking water and toilet facilities. Even though the availability of drinking water is very high in Kerala compared to other states, its position is lowest in access to improved safe drinking water with 56.7 percent. There needs to be a shift from mere availability of water to quality water, especially in urban slums compared to non-urban slums to reduce the health risk [7]. According to the 2011 Census, in Kerala, open defecation in the urban slum households (3.34 percent) was higher than that in non-urban slums (1.65 percent) [7], whereas access to latrine facilities was very high, with 99.8 percent of households. As per the data of the National Sample Survey Organization (NSSO) in Kerala, the water and sanitation services of urban areas improved in 2018 compared to 2012, and it ended open defecation in 2016.
One of the major factors influencing deprivation or vulnerabilities is the lack of drinking water and sanitation. Generally, socioeconomically deprived urban communities tend to be exposed to greater public health risks from drinking water supplies than less socioeconomically deprived areas [8]. Sanitation issues due to a lack of water resources are a significant challenge, especially in developing countries. Several international reports establish the importance of a reliable drinking water supply on sanitation and health [9,10,11,12]. Targets 6.1 and 6.2 of the Sustainable Development Goals (SDGs) of the United Nations to be achieved in 2030 stress the reliability of water and sanitation. WHO/UNICEF through Joint Monitoring Programme have contributed to improving water and sanitation since 1990, as well as monitoring the targets of SDGs, universal and equitable access to drinking water, sanitation and hygiene for all. Based on the goal, India needs to achieve equitable access to safe and affordable drinking water and adequate sanitation and hygiene for all in 2030. The Central and State governments have already started different programmes as part of it. However, distributing public services in water and sanitation is less equitable compared to health care and education services. The consequences of these are very severe in urban slums where alternative sources of drinking water are limited due to less availability and affordability. The impact of this inequitable distribution of water and sanitation services creates a disproportionate effect even in different urban slums in the same region. It is widely accepted that the performance of rural areas in the provision of drinking water and sanitation is poorer compared to that of urban areas. The lack of specific studies on water and sanitation in urban slums leads to the following questions: What is the condition of water and sanitation in urban slums of Kerala? Is there equity in the distribution of water and sanitation services in two different slums? What is the status of the vulnerable group in urban slums? Against this background, the paper focused on the disparity in the water and sanitation status of urban slums of the district Thiruvananthapuram in Kerala. Data or indices related to water and sanitation at the district level and rural–urban classification do not provide the actual picture of the extremely vulnerable communities in those areas. This is a major problem when the deprivation is context-specific, and with urban areas, there may be a different experience for the urban slums. There are several studies regarding basic amenities such as housing, health and education of the slum population in India and Kerala. However, a study on the disparity in urban slums is negligible for basic amenities such as water and sanitation in Kerala, which are of the highest priority.
2. Disparity: Importance and Measurement
The main agenda of the SDGs is to build an equitable world by 2030. Goal number 11 is to make cities inclusive and goal number 6 underscores the equitable access to water and sanitation for all. Equity in distributing basic amenities is an important step toward achieving an inclusive and equitable society. One of the major factors hindering the inclusive development of urban areas is social inequality due to the lack of availability, accessibility and affordability of basic amenities. Identifying the extent of inequity in basic services is essential to reduce social inequality and promote inclusive development.
The concept of inequality and disparity are interrelated. The unequal distribution of resources and opportunities is called inequality [13]. Disparity means a difference of some kind [14]. As such, inequality is a broader concept, which can be reduced by equal distribution of resources with a specific methodology. For scarce natural resources such as water and necessary items, equal distribution of resources is not environmentally viable. Here, equity can be achieved by need-based distribution, that is fair distribution. The concept of disparity is widely used to capture differences in healthcare facilities which lead to poor healthcare outcomes [15]. Water and sanitation are of utmost importance in determining the health outcomes of a nation. Generally, the disparity is used to capture the domain directly involved in the healthcare outcome; it is also used to check the differences in socioeconomic status, resource distribution and geographical location [15,16]. Hence, the study used the principles of disparity to measure the status of water and sanitation in the urban slums.
Disparity can be measured in absolute and relative terms [17]. Since it is very difficult to define a reference point for all the variables associated with water and sanitation, the study measured the disparity in absolute terms. Thus, the disparity is the comparison of two different groups by keeping the most favourable group or the best case as the reference category [17]. The size of the disparity can be obtained by taking the differences in the major variables or indicators between groups. Since the characteristics of the particular reference category change over a period of time, predicting future disparity is difficult with the same data.
3. Data and Methods
3.1. Sources of Data
The study estimated disparity in the urban slum dwellings with the support of primary data. However, to set the context, the study also used secondary data. Thiruvananthapuram, the capital district of the state, has importance in its level of urbanization and other demographic features. Census of India data shows that Thiruvananthapuram has witnessed rapid urbanizing trends in the past few decades [18,19]. It is the district with the highest population density and the second-largest population in Kerala [5]. Urban administrative units of Thiruvananthapuram consist of one corporation area (Thiruvananthapuram, India) and four Municipalities (Attingal, Neyyattinkara, Varkala and Nedumangad). According to 2011 Census of India, the Thiruvananthapuram city area is an Urban Agglomeration (UA) ranking under the category of Million-Plus UA/City with a total population of 762,535. It is the most populous city corporation and the fifth largest UA in Kerala. It is observed that the population size is greater in coastal wards towards the south of the international airport, and the size is smaller inwards located in the city core. The average density of the population in the city corporation is about 5000 persons per sq km, spread over 100 wards.
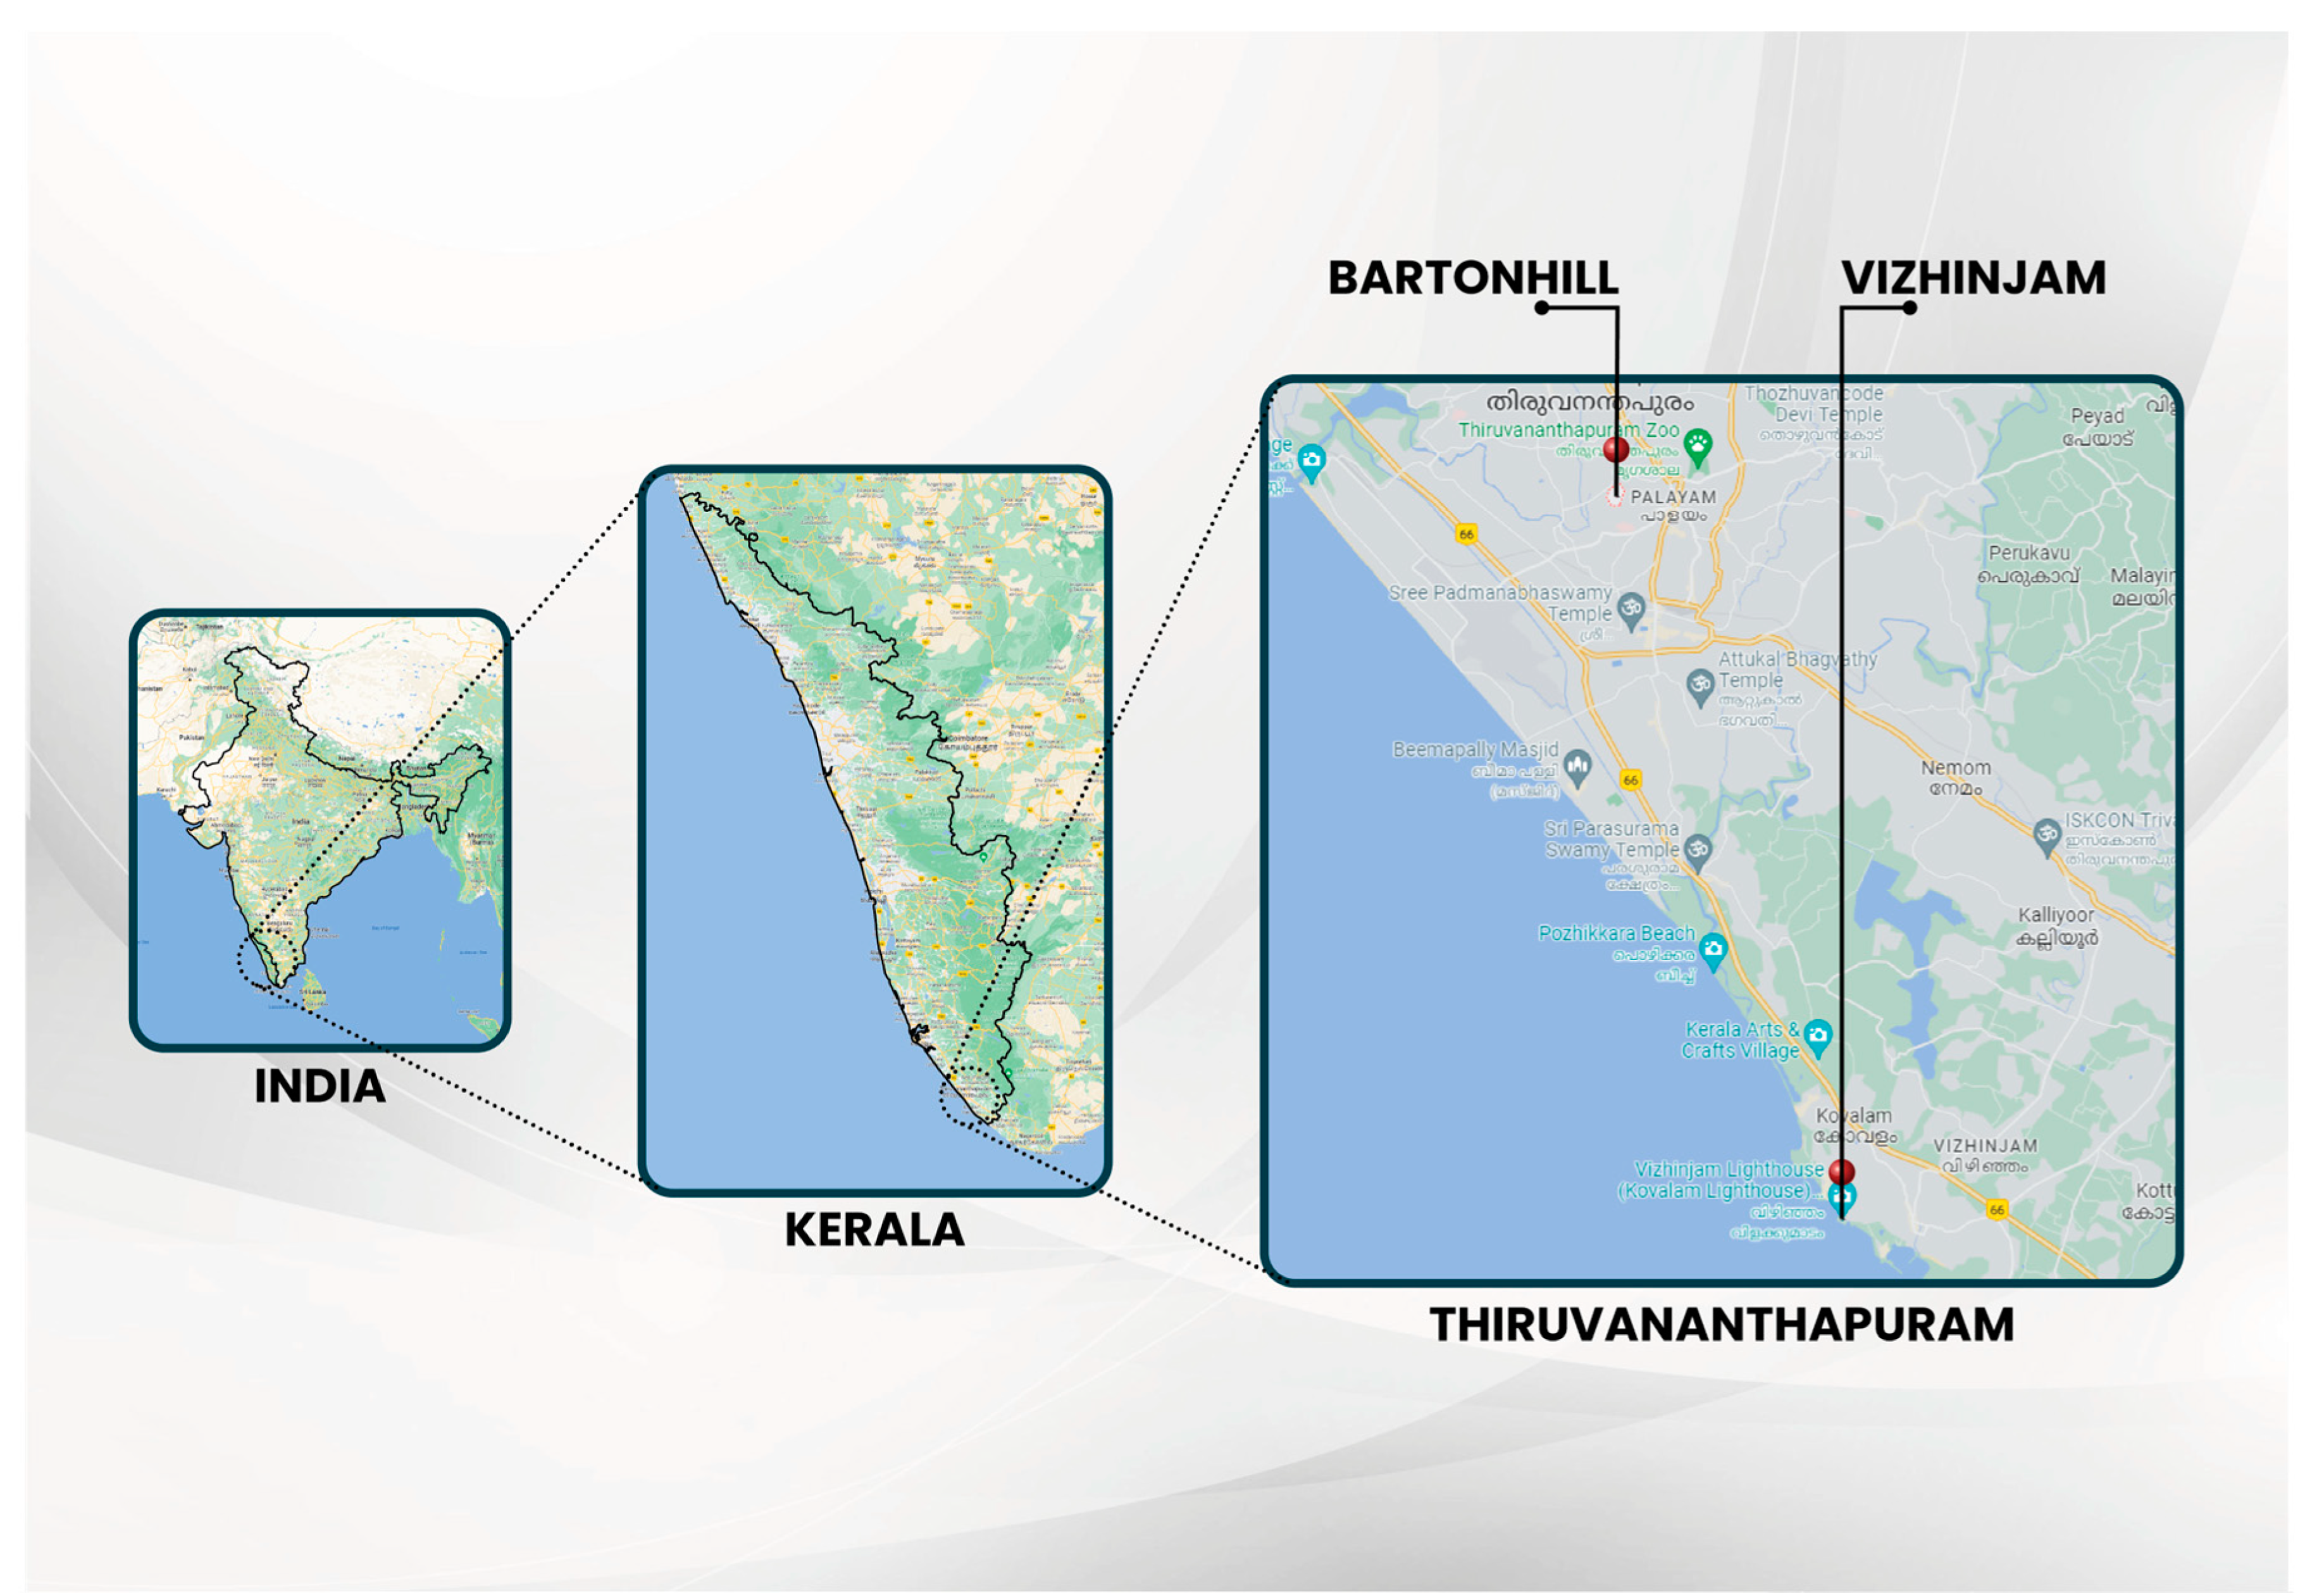
To understand the disparity within the urban areas, the study selected two urban slums, one with severe drinking water shortage (Vizhinjam, India) and the other with sufficient drinking water (Barten Hill Colony, India) in the Thiruvananthapuram district (Figure 1). Thus, the present study surveyed the households in the coastal wards of Kottapuram (Ward No. 61), Vizhinjam (Ward No. 62), and Harbour ward (Ward No. 63) for Vizhinjam coastal slum, as well as households of Kunnukuzhy (Ward No. 26) for the slum colony Barten Hill. Households were selected based on a systematic random sampling method. The data were collected from the corresponding heads of the households. Family members other than the head (especially female members in the case of the male head) were also consulted at the necessary points of discussion because the opinion, participation, and practices of the household members also matter in water and sanitation services. A detailed interview schedule was prepared to collect data from the sample households, which includes all the components, dimensions and variables given in Table 1.
3.2. Dimensions and Variables
The literature shows that there is a lack of comprehensive tools for assessing the deprivation of drinking water and sanitation services. Some studies do provide a separate assessment of sustainability [20,21], inequality [22], governance and poverty [23], vulnerability and security [24] and service gap [25] aspects of water and sanitation services. However, they are either limited to a particular component of the water and sanitation sector, or are conducted at the macro level using secondary data, or are area-specific, or have inadequate indicators to reflect the ground situation [26]. Apart from these, several studies have incorporated certain indicators of the water and sanitation sector in measuring the overall deprivation of material well-being at a macro level [27,28]. However, they are also limited in assessing the actual situation of water and sanitation of a region. The water and sanitation deprivation index developed in this study is a modified and more inclusive version of the assessment tool adopted by Ricard Giné-Garriga and Agustí Pérez-Foguet [23]. The water and sanitation deprivation index for the urban slum areas of Thiruvannthapuram was measured as an aggregate index of three components: drinking water, sanitation, and physical environment. Each component in the deprivation index was assessed by five dimensions reflecting the normative content of Human Rights to Water and Sanitation (HRtWS), namely availability, accessibility, quality and safety, affordability and acceptability [29]. The components, dimensions, variables and descriptions used for measuring the dimensions are summarized in Table 1.
3.3. Analytical Tools
The Alkire–Foster (AF) [30] methodology was used to analyze the deprivation, which has been used by the UNDP Human Development Report to assess human deprivation globally. This study assigns equal weight to each dimension and component of the deprivation index as all are equally important in the water and sanitation aspects of a household. The score for each household is calculated by using the formula
where is the composite score of household i (1, 2, 3…, n) and is the weight assigned to the indicator that implies . is the indicator score of households i which reads that = 1 if the household i is deprived in that indicator and = 0 otherwise. This study sets the poverty cut-off at 0.4 though it analyzes the index score for poverty cut-off rates from the lowest (0.2) to the highest (1) levels. The Headcount ratio (H) measures the percentage of the population that is multi-dimensionally poor based on the fixed poverty cut-off, i.e.,
H provides the incidence of deprivation in the community under study. To measure the intensity of deprivation these deprived households experience, Average Intensity (A) is calculated. A measure’s share of possible deprivations experienced by poor households is identified.
To simplify the interpretation, the H value equal to 0.45 implies that 45% of the households in the community are multi-dimensionally deprived, whereas the A value equal to 0.60 implies that 45 percent of the deprived households are deprived in 60 percent of the total dimensions taken.
The multi-dimensional deprivation index score for each component (water, sanitation, and physical environment) is calculated by using the formula
The aggregate deprivation index score of the community is calculated by combining the deprivation index score of three components (water, sanitation, and physical environment) using the formula , where is the Adjusted Headcount Ratio of each component derived at poverty cut-off k = 0.6 for each of the three components, water, sanitation, and physical environment, and is the total number of components, which is 3.
Households deprived in each dimension selected were identified, specifying dimensional cut-off fixed based on the criteria provided under UN Human Rights to Water and Sanitation in the case of drinking water and sanitation components, and for the physical environment component, the study relied on the literature, particularly 76th round survey of NSSO, 2018 [31].
The level of satisfaction of sample households with respect to the transparency, smell and taste of drinking water from the primary source of drinking water (PSDW) and the overall sanitation are marked against a five-point scale of “0”, “1”, “2”, “3”, and “4”, implying “extremely satisfied”, “satisfied”, “moderately satisfied”, “dissatisfied” and “extremely dissatisfied”, respectively. The study also used the chi-square test, independent t-test and Mann–Whitney U test to compare the variables under each dimension of the water and sanitation deprivation index of households in the two urban slums.

Table 1.
Dimensions, variables, description and sources of three components of the water and sanitation deprivation index.
Table 1.
Dimensions, variables, description and sources of three components of the water and sanitation deprivation index.
| Component | Dimension | Variables | Description | Sources | Deprivation Cut-Off (Level of Service Sufficient for a Household Be Non-Deprived) |
|---|---|---|---|---|---|
| Water | Availability | Source of Drinking Water | Whether the source of water is ‘improved’ based on JMP drinking water ladder | JMP Drinking Water Ladder by WHO and UNICEF [32] | Improved source of Drinking water (JMP ladder) |
| Sufficiency | Whether the household can obtain 50–100 L of water per person per day | UN resolution on Water and Sanitation 2010 [33] | At least 50 L/person/day | ||
| Physical accessibility | Continuity of use of drinking water service | Whether the household has continuous access to drinking water service | UN resolution on Water and Sanitation 2010 [33] | Accessible continuously when needed | |
| Location of the source of drinking water | Whether the source of drinking water is within 1 km radius of home | UN resolution on Water and Sanitation 2010 [33] | At least within a 1 km radius of the house | ||
| Collection time | Whether the collection time is exceeding 30 min | UN resolution on Water and Sanitation 2010 [33] | Collection time (travelling + waiting time) is within 30 min a day | ||
| Quality and safety | Contamination level | Whether the drinking water is free from fecal contamination | UN resolution on Water and Sanitation 2010 [33] | No detectable level of fecal coli form bacteria/100 mL or Total coli form bacteria/100 mL (0 MPN/100 mL) | |
| Affordability | Monthly cost of drinking water | Whether the monthly expenditure of drinking water exceeds 3% of monthly income | UN resolution on Water and Sanitation 2010 [33] | The monthly cost for drinking water is less than 3% of monthly income/expenditure | |
| Acceptability | Acceptability of color/clarity | Whether the drinking water has acceptable color/clarity | UN resolution on Water and Sanitation 2010 [33] | At least “satisfied” with color, odor and taste of drinking water on a 5-point scale | |
| Acceptability of odor | Whether the drinking water has acceptable odor | UN resolution on Water and Sanitation 2010 [33] | |||
| Acceptability of taste | Whether the drinking water has acceptable taste | UN resolution on Water and Sanitation 2010 [33] | |||
| Sanitation | Availability | Type | Whether the toilet facility is safely managed or not according to JMP sanitation service ladder | OPHI Working Paper No. 116 [23] | Safely managed latrine facility (JMP sanitation ladder) |
| Location | Whether the toilet facility is within the house or within the compound or neighbor’s compound or in public place | OPHI Working Paper No. 116 [23] | Located within the premises of house | ||
| Accessibility | Safety while accessing the latrine | Whether it is safe and secure while accessing the latrine facility | OPHI Working Paper No. 116 [23] | Safe and secure while accessing | |
| Continuity of use of latrine facility | Whether the household has continuous access to a toilet facility | OPHI Working Paper No. 116 [23] | Continuous access for at least 18 h a day | ||
| Suitability | Whether the toilet facility is suitable for everyone (except children) | OPHI Working Paper No. 116 [23] | Suitable for everyone (except children below 5 years) | ||
| Sanitary conditions | Whether there is presence of insects, unpleasant smell and untidiness in toilet facility | OPHI Working Paper No. 116 [23] | Absence of insects, unpleasant smell and untidiness in the toilet | ||
| Quality and safety | Latrine standards | Whether the condition of the superstructure of the latrine is satisfactory | OPHI Working Paper No. 116 [23] | Undamaged superstructure | |
| Hand washing facility with soap and water in the vicinity of latrine | Whether hand washing facility with soap and water is in the vicinity of latrine available or not | OPHI Working Paper No. 116 [23] | Availability of a hand washing facility with soap and water in the vicinity of toilet | ||
| Hygienic practices | Whether water and cleansing materials are adequately available inside latrine | OPHI Working Paper No. 116 [23] | Adequate hygiene practices | ||
| Safe management and disposal of excreta | Whether there is safe menstrual hygiene management Whether excreta are safely managed and disposed | OPHI Working Paper No. 116 [23] OPHI Working Paper No. 116 [23] | Excreta are safely managed and disposed | ||
| Affordability | Affordability of establishment of latrine facility | Whether the establishment of latrine facility is affordable to the household | OPHI Working Paper No. 116 [23] | Affordable to the household | |
| Acceptability | Satisfaction of the present sanitation service | Whether the household is satisfied with current sanitation services | OPHI Working Paper No. 116 [23] | At least “satisfied” with sanitation service on a 5-point scale | |
| Physical Environment | Availability | Availability of garbage management facility | Whether a facility for garbage management is available | SDG 11.6.1 [34] | Any form of Garbage management facility is available |
| Availability of wastewater management facility | Whether a facility for waste water management is available | SDG 6.3 [34] | Covered pucca drainage is available | ||
| Physical accessibility | Location of garbage management facility | Whether a garbage management facility is available within a 1 km radius | Manual on Solid Waste Management [35] | Garbage management and wastewater management facilities are within a 1 km radius of the house | |
| Location of wastewater management facility | Whether a wastewater management facility is available within 1 km radius | Manual on Solid Waste Management [35] | |||
| Quality and safety | Presence of solid waste piles | Whether solid waste piles are present in the vicinity of the house | Manual on Solid Waste Management [35] | Absence of solid waste piles and stagnant water in the vicinity of the house | |
| Presence of stagnant waste /sewage water | Whether stagnant waste/sewage water is present in the vicinity of the house | Drinking water, Sanitation, Hygiene, and Housing conditions in India, NSSO76th Round Survey, 2018 [34] | |||
| Method of disposal | Whether the method of disposal of household garbage is sustainable | SDG 6.3, SDG 11.6.1 [34] Drinking water, Sanitation, Hygiene, and Housing conditions in India, NSSO 76th Round Survey, 2018 [31] | Collected by LSG authorities or disposed of in the community waste bin | ||
| Whether the method of disposal of household wastewater is sustainable | Safe use after treatment or disposed of drainage | ||||
| Affordability | Affordability of acceptable waste management practice | Whether it is affordable to pay for improved wastewater and garbage management practices | About Water and Sanitation [33] | Affordable improved wastewater and garbage management | |
| Acceptability | Satisfaction with current waste management practices | Whether the household is satisfied with current wastewater or garbage management practices | About Water and Sanitation [33] | At least “satisfied” with current wastewater and garbage management practices on a 5 point scale |
4. Analysis of Empirical Results
4.1. Socio-Economic Characteristics of the Households
About 110 urban slum households were selected from the Vizhinjam region and 92 households were selected from Barten Hill. Around 77 percent of the households in both the urban slums selected is headed by adult male family members, whereas those headed by adult female members constitutes 23 percent. The marital status shows that about 88 percent of households belong to married partners in both areas. In the case of religion, the majority are Muslims in Vizhinjam (66 percent) followed by Christians (32.7 percent), whereas in Barten Hill, the majority are Hindus (53 percent) followed by Christians (47 percent). The mean age of the respondents in the two slums is almost the same, i.e., 46.79 in Vizhinjam and 47.39 in Barten Hill (t(200) = −0.383, p > 0.05). The presence of illiterate persons and those with up to primary level education is high in Vizhinjam (30 and 27.3 percent) than in Barten Hill (1.1 and 9.7 percent). About 95 percent of the households in Vizhinjam are in the Below Poverty Line (BPL) category, whereas the proportion is 77 percent in Barten Hill. The proportion of households in Barten Hill (84.8 percent) that own the house they live in is higher than that of those in Vizhinjam (67.3 percent). The mean land area owned by the households is higher in Vizhinjam (1.941 cents) than in Barten Hill (0.37 cents) (t (200) = −0.3802, p < 0.01). Since Vizhinjam is a coastal area, the majority (74.5 percent) of the people are engaged in fishing and related activities, whereas in Barten Hill, the majority (54.5 percent) are engaged in regular work and other agriculture-related activities.
4.2. Drinking Water Status of Households
In the Thiruvananthapuram district, Kerala Water Authority (KWA) (public sector), is the major supplier of water through piped connections. KWA extended piped water connections into the dwellings/yards/plot/public tap/standpipe of the two slum areas. In Barten Hill, all the households surveyed used this water for their drinking purpose, but in Vizhinjam, only 2.7 percent used it for drinking purposes. It was noted that 93.3 percent of the households surveyed in Vizhinjam relied on private tanker lorries for drinking water, whereas for other purposes such as bathing and washing 81.9 percent of the households used water from the piped connection of KWA. Despite this, the quantity of water they receive from private tanker supply, and the cost involved for obtaining the water are not satisfying for these households as they receive a minimal quantity of water at a high cost (20 L for INR 7). There is a significant difference in the average preference for the primary source of drinking water (PSDW) used by households in the two slums (t(200) = 12.45, p = 0.000).
The quantity of drinking water consumed daily by the households for different purposes was hard to assess as they did not keep measurements for each purpose. Hence, the approximate daily water consumption from PSDW by households was collected and marked in liters. The average daily water consumption of households in Vizhinjam is 410 L, and the average per capita water consumption is only 166.6 L. The average daily water consumption in Barten Hill is 349.8 L, and per capita water consumption is 93 L. Thus, there is a difference in the average consumption of water in the two areas (t(200) = 3.63, p < 0.05).
In the case of water availability, households of Barten Hill avail of water supply on a daily basis throughout the week. However, in the Vizhinjam region, about 95.5 percent of the households reported that the water from PSDW is unavailable daily. Only 4.5 percent of households in Vizhinjam with exclusive access to protected dug well avail of water throughout the day. Regarding the frequency of water supply, 31.8 percent in Vizhinjam and 59.8 percent in Barten Hill receive water supply daily, but only at certain hours, for example, for 2 h in the morning or 3 h in the evening. The percentage of sample households in the Vizhinjam region with water supply available 1 to 2 days a week and 3 to 6 days a week is 40.9 and 20, respectively.
The mean distance travelled by the households in the two areas is entirely different (t(200) = 12.245, p = 0.000), i.e., 1.85 km in Vizhinjam and 0.195 km in Barten Hill. About 7.3 percent of households travel more than one kilometer to reach the primary source of drinking water in Vizhinjam; the corresponding value in the case of Barten Hill is zero. On average, the households in Vizhinjam spend at least 41 min and households in Barten Hill region spend at least 10 min daily for collecting water. Around 8 percent of the sample households of Vizhinjam spend more than an hour travelling and waiting to collect water from PSDW. The average time required to collect drinking water is higher in Vizhinjam (29.3 min) than in Barten Hill (1.69 min) (t(200) = 16.42, p < 0.05).
On average, households in Vizhinjam pay INR 616.5 as a monthly water tariff for consumption from PSDW, whereas for Barten Hill, it is only INR 167.98. This significant difference ((t(200) = 8.34, p < 0.05) in payment for water charges between the two slums is also visible in the range of the amount paid. The monthly water charge ranges from INR 100 to INR 2900 in Vizhinjam, and the range observed in Barten Hill is from INR 1 to INR 1000.
The level of satisfaction of sample households with respect to drinking water from PSDW shows that there is no significant disparity in the case of transparency of water and smell of water in the two areas (Table 2). However, the households in Vizhinjam are less satisfied with the taste of water compared to those in Barten Hill (p < 0.05, Mann–Whitney U).
4.3. Sanitation Status of Households
The common types of latrine facility used in Kerala are categorized into “closed pit”, “centralized sewerage”, “compost latrine” and “septic tank”. The use of a closed pit latrine is very high in Vizhinjam (25.5 percent) compared to Barten Hill (14.2 percent). About 74.5 percent of the households in Vizhinjam and 85.8 percent of households in Barten Hill use latrines with septic tanks. The centralised sewerage system or compost latrine is not found in the study areas. Here, the estimated chi-square value (χ2 (1) = 3.97, p < 0.01) indicates that the type of latrine of the household is associated with its location in respect to the household.
The location types of the latrine facility are categorized into “inside the compound of the house”, “within the house” and “public place”. About 17.3 percent of the households in Vizhinjam and 47.8 percent of the households in Barten Hill have latrines inside the house compound. In addition, 52.7 percent of the households in Vizhinjam have latrine facilities within the house, whereas the proportion is 41.3 percent in the case of Barten Hill. In addition to this, 18.2 percent of the households in Vizhinjam and 10.9 percent of the households in Barten Hill (generally those who use public toilets) have latrine facility is in public places. The estimated chi-square value (χ2 (2) = 7.853, p < 0.05) indicates that the location of the latrine of each household is associated with the slum areas.
The suitability of latrine facilities assessed for “age”, “gender” and “disability” of the persons indicates that no latrine facility in the selected urban slum communities is suitable for disabled people, though they are claimed to be suitable for all ages except children below 3 years and all genders. Household access to latrine facilities is categorized into four groups: “exclusive use of the household”, “common use of the households in the building”, “public/community use without payment” and “public/community use with payment”. About 81.8 percent of households in Vizhinjam and 89.1 percent of the households in Barten Hill come under the category of exclusive use. Around 10 percent of the households in the two slums use community toilets without payment. It is noted that toilets shared with other households and community-paid toilets are only present in Vizhinjam (4.5 percent and 3.6 percent, respectively).
In regard to the sanitation facility being used for children below the age of 3 years, the disposal method employed for used diapers and cloth shows that around 23 percent of the sample households in Vizhinjam and 4.3 percent of households in Barten Hill dump waste into open areas or nearby water bodies (χ2 (3) = 9.29, p < 0.05). There is also no systematic disposal method for pads used during menstrual time. About 4.3 percent of households in Barten Hill mix it with municipal waste and 5.4 percent of sample households in Vizhinjam dump the waste to open lands or nearby water bodies. About 44.5 percent of households in Vizhinjam and 68.5 percent of the households in Barten Hill are burning this waste in the house.
Infrastructural details of the household-level sanitation services such as the condition of the structure of the latrine facility, piped water connection in the latrine, frequency of emptying the sceptic tanks, etc., were collected. In Vizhinjam, the condition of the structures is unsatisfactory for around 20 percent of households having exclusive access to a latrine, while among those using shared or community latrines, 9 percent of households find the structure of the latrine unsatisfactory. In Barten Hill, on the other hand, 13 percent of households find the structure of their latrine facilities unsatisfactory.
Water availability inside the toilet is a requisite condition to ensure the basic hygiene of the people using it. About 51.8 percent of the households in Vizhinjam and 29.3 percent of the household in Barton Hill are using toilets without piped water connections ((χ2 (1) = 10.41, p < 0.01). These households are required to bring an adequate quantity of water to the toilet manually. This is due to the presence of community toilets in Vizhinjam, which have no direct water connections.
The level of satisfaction of sample households with sanitation services indicates that only 13.6 percent of sample households in Vizhinjam is satisfied, whereas the proportion is 52 percent in Barten Hill. There exists a significant difference between the satisfaction rates displayed by the households in the two areas (p < 0.05, Mann–Whitney U).
4.4. Physical Environment of Households
About 35 percent of the surveyed households in Vizhinjam experience the presence of stagnant water (wastewater or rainwater) around the premises of their house, whereas this issue is experienced by 23 percent of the households in Barten Hill (χ2 (4) = 3.328, p < 0.01). The inquiry into the presence of solid waste piles (both degradable and non-degradable) near the house indicates that almost 40 percent of the households surveyed in the Vizhinjam experience the problem, whereas only 13 percent of the sample households in Barten Hill experience the aforementioned issue (p < 0.05, Mann–Whitney U). The drainage arrangements available and accessible to the sample households show that 26.4 percent of the households in Vizhinjam have no arrangement, whereas in Barten Hill, all sample households have access to open pucca or covered pucca drainage arrangements in their premises. The p-value (Mann–Whitney U) is greater than 0.05, which shows that there exists no significant difference between the drainage arrangements in the two areas.
In the case of domestic solid waste management, around 11 percent of the sample households in Vizhinjam and around 23 percent of sample households in Barten Hill avail of the facility of concerned Urban Local Bodies (ULB). It is noted that only used “dry” plastic carry bags/packaging covers are collected under the system. The estimated chi-square value (χ2 (1) = 5.2, p < 0.05) indicates that the arrangements for garbage collection are associated with the location of the house.
As there is no arrangement for managing domestic garbage generated (both degradable and non-degradable), the need to provide information regarding the place of disposal of this garbage becomes important (Table 3). Around a quarter of the sample households in Vizhinjam dump their degradable domestic garbage into nearby water bodies, and almost 9 percent dump them in common places which are not community dumping spots. Only 22.8 percent of the households in Vizhinjam use community dumping spots. The majority of the sample households in Vizhinjam (44.5 percent) and Barten Hill (around 53.7 percent) dispose of the domestically generated degradable garbage to the households’ individual dumping spots. The percentage of sample households using community dumping spots for dumping degradable domestic garbage is about 39 percent in Barten Hill. No household surveyed in both the slums had any individual sustainable disposal options such as biogas plants or manure pits.
About 73 percent of the sample households in Vizhinjam is either dissatisfied or highly dissatisfied with the waste management services provided to the community as a whole, whereas in Barten Hill, is the proportion is around 22 percent (p < 0.05, Mann–Whitney U), which shows that there exists a significant difference between the level of satisfaction displayed by the households in the two areas.
The willingness of the sample households to pay for an improved sewerage system shows that about 50.9 percent of the sample households in Vizhinjam and 13 percent of the households in Barten Hill are willing to pay for the service (χ2 (1) = 32.167, p < 0.01). Households’ willingness to pay for proper management of the domestically generated garbage and wastewater shows that around 62 percent of the sample households in Vizhinjam and 56.5 percent of sample households in Barten Hill are willing to pay for the improved service. The estimated chi-square value (χ2 (1) = 0.583, p > 0.05) indicates that the willingness to pay by the head of household for the disposal of household waste is not associated with the location of the house.
The maximum amount households are willing to pay monthly for proper management of domestic wastewater and garbage jointly indicates that the average preferred amount of pay in sample households of Vizhinjam is around INR 41 and that of sample households of Barten Hill is about INR 51. The payment amount ranges from INR 30 to INR 60 for Vizhinjam and INR 30 to INR 100 for Barten Hill. About 38.3 percent of the households in Vizhinjam and 43.5 percent of the households in Barten Hill are unwilling to pay because of the affordability issue.
4.5. Water and Sanitation Deprivation Index
The Head Count (H) value provides the proportion of households deprived of water and sanitation services based on poverty cut-off measures for the incidence of water and sanitation deprivation. The Average Intensity (A), on the other hand, measures the average share of weighted indicators in which people are deprived, i.e., the intensity of deprivation. The Adjusted Head Count Ratio () provides the multi-dimensional deprivation index value for each component of drinking water, sanitation, and physical environment. value indicates the total number of deprivations experienced by the poor divided by the maximum number of deprivations that could possibly be experienced by all people. It combines information on the prevalence of poverty and the average extent of a poor person’s deprivation [19], i.e., = 0.2 implies that deprived households experience 20 percent of the deprivations as a share of maximum possible deprivations that would have experienced if all households were deprived in all dimensions.
Table 4 and Table 5 show the Adjusted Headcount Ratio () for the three components of drinking water, sanitation and physical environment at different poverty cut-offs ranging from k = 0.2 to k = 1 for the slum settlement of Vizhinjam and Barten Hill, respectively. The index values calculated for Vizhinjam and Barten Hill show that both the Headcount ratio (H) and Adjusted Headcount Ratio () decrease with an increase in poverty cut-off “k”. For the drinking water component, when the poverty cut-off is k = 0.6 (number of households deprived simultaneously in 60 percent of the dimensions), H value is 0.28, which indicates that 28 percent of the households are multi-dimensionally poor and an average poor person is deprived in 71 percent of the indicators.
In Table 6, the poverty cut-off k is fixed at 0.4, i.e., a sample household is deprived in at least two dimensions among selected dimension. The aggregate water and sanitation deprivation index score shows that Barten Hill (0.23) has a better position than Vizhinjam (0.42). This difference is due to the higher deprivation experienced by Vizhinjam in terms of access to drinking water and sanitation. The deprivation in physical environment is the highest compared to the other components and is same (0.55) in the two urban slums.
In the case of the drinking water component, no household in Barten Hill has been deprived at the poverty cut-off, k = 0.4, while the index value obtained for the same component for Vizhinjam is as high as 0.47. Compared to the drinking water component, deprivation of sanitation services among the sample households of selected slum communities is low despite the existence of disparity between these two slums for this component. The sanitation score of Vizhinjam is 0.23 and that of Barten Hill is 0.15, placing Barten Hill in a better position again.
5. Discussion
Since the demand for resources is increasing with the growth in urbanization, equity in distributing basic services is a challenge to policymakers. The concept of equity can be interpreted as follows: greater resources and more services should be available to vulnerable and needy groups [36]. In the case of urban slums, a fair distribution, that is, resources according to the need of the community, can be treated as equity, which is essential to achieve the philosophical principle of SDGs, with no one left behind. In the case of water, it is very difficult to determine the actual need of a given household, which varies according to the socio-economic characteristics of it. Hence, the study used only the standard concept and variables to measure the actual situation of the households in the urban coastal slum Vizhinjam and, based on the principle of disparity, compared it with a higher performing urban slum Barten Hill. The ultimate aim of the study is to sensitize the stakeholders to the disparity in public services such as water and sanitation access, which is a human right, and to frame effective policies.
The coastal urban slum Vizhinjam is already vulnerable in many aspects such as livelihood, housing, water and sanitation, etc. Socioeconomic characteristics such as education (illiteracy), occupation (irregular income), poor housing conditions and below-poverty level (BPL) status are high in Vizhinjam compared to the urban slum Barten Hill. This underlines that the two slums are suitable for study areas based on the methodology of disparity, comparing a case of deprivation with a better case. The disparity between water and sanitation is assessed on the basis of the availability, accessibility, affordability and acceptability of water, sanitation and the physical environment of the two urban slums in terms of mean values, percentages and deprivation indices.
Even though the KWA’s water services are available at Vizhinjam and accessible to households, the inhabitants are not satisfied with the taste, color and odor of the water provided by the KWA’s piped water supply; they use it for other purposes. They believe that the quality of water supplied by the private tanker lorries is better than that of the KWA’s water connection, hence they rely on private tanker lorry supply for drinking purposes. The result considers the view that the slum population has access to tap water [7]. The per capita water consumption in the two areas is 166 L (Vizhinjam) and 93 L (Barten Hill), less than the national benchmark of the water supply of 135 L per day suggested by the Ministry of Housing and Urban Affairs.
According to the UN Human Rights to drinking Water and Sanitation (HRtWS) and UNICEF, travelling and waiting time (combined) for collecting water should not exceed 30 min daily. In the case of Vizhinjam, the term “daily” means whenever private tanker lorries bring drinking water to those who depend on private tanker lorries. An average value shows that the time taken and distance travelled to collect drinking water is high in Vizhinjam compared to Barten Hill and it is not up to the benchmark fixed at the international level.
Households with piped water connection in dwelling or yard/plot pay water charge to KWA, whereas those who use water from private tanker lorries pay to the concerned private agencies, and those with protected dug well or using the public taps such as PSDW are not required to pay any water charge. The affordability issues arise in Vizhinjam due to the price charged by the private water suppliers.
As declared by the state government that ended open defecation, all the households in the two slum areas have access to latrines. Around 10 percent of the households in the two slums used community toilets without payment, that is, exclusive use is not available in the two slums. In addition, it is noted that community-paid toilets are present in Vizhinjam (3.6 percent), which is unfair and increases the burden of already vulnerable groups. The overall satisfaction level regarding toilet access is very low in the two areas, and it is worse in Vizhinjam. It is clear that once the system is corrected with quality water supply, the issues associated with drinking water and a part of sanitation issues can be solved. In addition to this, one of the criteria for a safely managed sanitation service is the exclusive use of a latrine facility by the individual household according to the Joint Monitoring Programme (JMP).
The physical environment of the two areas is bad due to the absence of a proper waste management system. It was determined that burning inorganic material such as pads at low temperatures in an unscientific manner is detrimental to the overall health and environment. In the case of wastewater, access to the pucca drainage system has resulted in its usage by the sample households in Barten Hill. In Vizhinjam, half of the households surveyed disposed of the domestic wastewater to open lowland areas, while just a quarter of them disposed of the wastewater without treatment to the drainage and an equal number of households disposed of the wastewater without treatment to nearby water bodies, predominantly the sea. Proper disposal mechanism for domestic wastewater is necessary for urban households, especially those living in slum-like situations as this can give rise to the mass spread of communicable diseases, particularly water-borne diseases. The p-value (Mann–Whitney U, 3742) is less than 0.05, which shows that there exists a significant difference in the presence of wastewater in the two areas and it is worse in the case of Vizhinjam. Due to the overall low satisfaction of households in Vizhinjam, the percentage of households willing to pay for an improved system is higher in Vizhinjam than in Barten Hill. This shows the high demand for an improved system as well as the value assigned by the households to the proper management of the water, sanitation and physical environment.
The water and sanitation deprivation index shows that both of the slum areas are deprived, and Vizhinjam is more deprived than Barten Hill, Vizhinjam being highly deprived in the case of drinking water and sanitation and equally deprived in the case of the physical environment. However, regarding components in a particular area, Barten Hill also needs policy change to reduce the deprivation in the case of sanitation and physical environment.
Even though the KWA supplies drinking water to the two study areas, from two different sources, the majority of households in Vizhinjam do not use it for drinking purposes and they depend on private suppliers. This affects their availability, accessibility and water charges in connection with drinking water. The question arises: Why do the households not use the KWA water for drinking purposes? The households in Vizhinjam stated that this is due to poor quality of water, especially in regard to taste. The researcher tested the water quality collected from the private suppliers in Vizhinjam and the KWA’s water in the two slum areas with the support of a lab. The results show that all the samples possess normal pH values and are free from e-coli bacteria. Still, other lab tests are needed to determine the reason for the bad taste and the reason for not using the piped water. Hence, a scientific study is recommended to determine the water quality and suggest alternatives to using the KWA’s water.
To make “cities and human settlements inclusive, safe, resilient and sustainable” as mentioned in the UN’s 11th SDGs, urban slums need to improve significantly from their current position. The properties of a resilient community can be expressed in the four Rs: robustness, rapidity, resourcefulness and redundancy [37]. The first two Rs are the ultimate aim of a community, and the remaining two R’s are the means to achieve resilience, which requires sufficient resources and effective implementation. Since the physical environment, including infrastructural facilities, is lacking in urban slums compared in other urban areas, achieving a resilient economy requires a systematic institutional framework with proper governance. In the case of the physical environment, both slums need an effective policy regarding waste management, both solid and liquid. Since a centralized waste management system is absent in the two areas, stakeholders can think about alternative practices, especially a decentralized waste management system. In addition, the sanitation situation awareness improvement programme should be provided to the households.
6. Conclusions
Urbanization and the consequent strengthening of infrastructural facilities lead to a positive impact on the water and sanitation status of households in Kerala. The state-wide availability of fresh water, achievements in health status and toilet facility at the household level are very high compared to those of other states in India. However, regional variations exist in the resource availability and distribution of drinking water and sanitation, which affects the State disproportionately and is visible in urban slums. To achieve universal availability, affordable and equitable drinking water and sanitation facilities as per the UN’s Sustainable Development Goals, we need to determine the actual gap in the services in the concerned areas. Against this background, the paper assessed the disparity in the status of water and sanitation in the urban slums of Thiruvananthapuram Corporation, Vizhinjam and Barten Hill. Even though the physical environment of the two slums is equally deprived, the deprivation of drinking water is high in Vizhinjam and negligible in Barten Hill. In addition, the deprivation in the sanitation component is also high in Vizhinjam compared to that in Barten Hill. Different degree of access to water and sanitation in the different urban slums in the same district is one of the major challenges of the state government. The role of institutions in increasing the availability and accessibility of water and sanitation is important. Therefore, concerted efforts are needed to reduce the disparities between slums as well as the overall physical environment of the urban slums. Since the value of each component of the water and sanitation deprivation index varies in slums, specific policies and programmes are to be implemented in various slums for a better outcome. In Vizhinjam, people complain about the water quality, but the study could not report the actual situation scientifically, though it checked a few samples in the lab. Hence, there is a scope for a purely scientific study to check the quality of water and a psychological study to change the behaviour of the people.
Kerala’s achievements in waste management, both solid and liquid, are not up to the standard, which is also visible in the two slum areas; both are highly vulnerable in the physical environment compared to other indicators. In the urban slums, due to limited space, the impact of the absence of drainage facilities and solid waste disposal mechanisms is severe compared to other areas. Due to the presence of community toilets and paid toilets in Vizhinjam, the deprivation in terms of sanitation is very high compared to that of Barten Hill. Even though the KWA provided metered water connections to the two colonies, the majority of the people in Vizhinjam do not use that water for drinking purposes, and they depend on private tanker lorry suppliers. Since the coastal people in Vizhinjam are already vulnerable to many issues, community resilience is impossible without proper governance. Urban planning in the form of integrated infrastructural development is needed to deliver essential services such as water and sanitation access, which is critical for navigating poor cities resiliently [38]. The three components in the integrated development approaches are households, communities and cities. Since the priority area is household basic services, which need immediate solutions, the entry point should be at the household level. At the same time, the local self-government can plan long-term policies at the city level to maintain resilience and achieve sustainability.
Funding
This research was funded by ICSSR-IMPRESS on the project entitled “Households Drinking Water and Sanitation in Urban Kerala” (Order No.F.No.IMPRESS/P2833/721/OBC/2018-19/ICSSR dt. 23 September 2019).
Institutional Review Board Statement
Not applicable.
Informed Consent Statement
Informed consent was obtained from all subjects involved in the study.
Data Availability Statement
The data will be published as per the guidelines of ICSSR after the complete evaluation of the project report, for more information, please contact Anitha V.
Acknowledgments
The author sincerely thanks Suryasudharsanan, Research Associates of the ICSSR-IMPRESS project entitled “Households Drinking Water and Sanitation in Urban Kerala”. The author extends gratitude to the reviewers and editors of MDPI for their valuable comments.
Conflicts of Interest
The author declares no conflict of interest.
References
- Moghaddam, A.A.; Mirzahossein, H.; Guzik, R. Comparing Inequality in Future Urban Transport Modes by Doughnut Economy Concept. Sustainability 2022, 14, 14462. [Google Scholar] [CrossRef]
- Available online: https://unstats.un.org/sdgs/report/2021/goal-11/ (accessed on 20 December 2022).
- Yadav, V.; Rajak, R.; Yadav, A.K. Growing slums in Indian towns: Insights from Census data 2001–2011. Demogr. India 2021, 50, 113–130. [Google Scholar]
- United Nations. The Sustainable Development Goals Report 2022; United Nations: New York, NY, USA, 2022.
- Census of India, Govt. of India. 2011. Available online: https://censusindia.gov.in/census.website/ (accessed on 12 March 2021).
- Biswas, S.; Dandapat, B.; Alam, A.; Satpati, L. India’s achievement towards Sustainable Development Goal 6 (Ensure availability and sustainable management of water and sanitation for all) in the 2030 Agenda. BMC Public Health 2022, 22, 2142. [Google Scholar] [CrossRef] [PubMed]
- Satapathy, B.K. Economic and Political Weekly, Vol-XLIX, No. 24, 14 June 2014. Available online: http://www.epw.in/special-articles/safe-drinking-water-slums.html (accessed on 19 June 2020).
- Hales, S.; Black, W.; Skelly, C.; Salmond, C.; Weinstein, P. Social deprivation and the public health risks of community drinking water supplies in New Zealand. J. Epidemiol. Community Health 2003, 57, 581–583. [Google Scholar] [CrossRef] [PubMed]
- Water, Sanitation, Hygiene and Health a Primer for Health Professionals, World Health Organization. 2019. Available online: https://tinyurl.com/38kjwdna (accessed on 12 March 2021).
- 2021 Annual Report, Global Water Security and Sanitary Partnership, International Bank for Reconstruction and Development/The World Bank 1818 H Street NW, Washington, DC 20433 +1 202.473.1000. Available online: www.worldbank.org (accessed on 13 January 2023).
- WHO. Global Water, Sanitation and Hygiene Annual Report 2018; World Health Organization: Geneva, Switzerland, 2019. [Google Scholar]
- WHO. Water, Sanitation And Hygiene Strategy 2018–2025; World Health Organization: Geneva, Switzerland, 2018. [Google Scholar]
- Yee Koh, S. Audrey Kobayashi, International Encyclopedia of Human Geography, 2nd ed.; Inequality, Ed.; Elsevier: Amsterdam, The Netherlands, 2020; pp. 269–277. ISBN 9780081022962. [Google Scholar] [CrossRef]
- Meghani, S.H.; Gallagher, R.M. Disparity vs inequity: Toward re-conceptualization of pain treatment disparities. Pain Med. 2008, 9, 613–623. [Google Scholar] [CrossRef] [PubMed]
- Jung, H.; Davis, K. Disparities and Inequalities: An Overview. Encycl. Soc. Work. 2021. [Google Scholar] [CrossRef]
- Baciu, A.; Negussie, Y.; Geller, A.; Weinstein, J.A. (Eds.) Communities in Action: Pathways to Health Equity; The State of Health Disparities in the United States; National Academies Press: Washington, DC, USA, 2017. Available online: https://www.ncbi.nlm.nih.gov/books/NBK425844/ (accessed on 4 January 2020).
- Keppel, K.; Pamuk, E.; Lynch, J.; Carter-Pokras, O.; Kim Insun Mays, V.; Pearcy, J.; Schoenbach, V.; Weissman, J.S. Methodological issues in measuring health disparities. Vital. Health Stat. 2 2005, 141, 1–16. [Google Scholar]
- Lal, P.; Nair, S.B. Urbanization in Kerala—What Does the Census Data Reveal? Indian J. Hum. Dev. 2017, 11, 356–386. [Google Scholar] [CrossRef]
- Chattopadhyay, S.; Harilal, K.N. Emerging Challenges of Urban Water Governance Case of Thiruvananthapuram City, India; RULSG Occasional Paper 2017: 1; Research Unit on Local Self Governments, Centre for Development Studies: Thiruvananthapuram, India, 2017. [Google Scholar]
- Iribarnegaray, M.; D’Andrea, M.; Rodriguez-Alvarez, M.; Hernández, M.; Brannstrom, C.; Seghezzo, L. From Indicators to Policies: Open Sustainability Assessment in the Water and Sanitation Sector. Sustainability 2015, 7, 14537–14557. [Google Scholar] [CrossRef]
- Hashemi, S. Sanitation Sustainability Index: A Pilot Approach to Develop a Community-Based Indicator for Evaluating Sustainability of Sanitation Systems. Sustainability 2020, 12, 6937. [Google Scholar] [CrossRef]
- Queiroz, V.C.; de Carvalho, R.C.; Heller, L. New Approaches to Monitor Inequalities in Access to Water and Sanitation: The SDGs in Latin America and the Caribbean. Water 2020, 12, 931. [Google Scholar] [CrossRef]
- Giné-Garriga, R.; Pérez-Foguet, A. Measuring sanitation poverty: A multidimensional measure to assess delivery of sanitation and hygiene services at the household level. OPHI Working Paper 116. In Oxford Poverty and Human Development Initiative; University of Oxford: Oxford, UK, 2018; Available online: https://www.ophi.org.uk/wp-content/uploads/OPHIWP116.pdf (accessed on 4 February 2020).
- Assefa, Y.; Babel, M.; Sušnik, J.; Shinde, V. Development of a Generic Domestic Water Security Index, and Its Application in Addis Ababa, Ethiopia. Water 2018, 11, 37. [Google Scholar] [CrossRef]
- Shermin, N.; Rahaman, S.N. Assessment of sanitation service gap in urban slums for tackling COVID-19. J. Urban Manag. 2021, 10, 230–231. [Google Scholar] [CrossRef]
- Akoteyon, I.S.; Aliu, I.R.; Soladoye, O. Household levels of deprivation to WaSH and residential conditions in slum settlements of Lagos, Nigeria. J. Water Sanit. Hyg. Dev. 2021, 11, 60–74. [Google Scholar] [CrossRef]
- Patel, A.; Koizumi, N.; Crooks, A. Measuring slum severity in Mumbai and Kolkata: A household-based approach. Habitat Int. 2014, 41, 300–306. [Google Scholar] [CrossRef]
- Dehury, B.; Mohanty, S.K. Multidimensional poverty, household environment and short-term morbidity in India. Genus 2017, 73, 3. [Google Scholar] [CrossRef] [PubMed]
- United Nations. About Water and Sanitation. Available online: https://www.ohchr.org/en/water-and-sanitation/about-water-and-sanitation (accessed on 12 January 2023).
- Alkire, S.; Foster, J. Counting and multidimensional poverty measurement. J. Public Econ. 2011, 95, 476–487. [Google Scholar] [CrossRef]
- National Sample Survey Organisation (NSSO). Drinking Water, Sanitation, Hygiene and Housing Condition in India. 584(76/1.2/1). Ministry of Statistics and Programme Implementation. 2018. Available online: https://mospi.gov.in/web/mospi/download-tables-data/-/reports/view/templateTwo/16205?q=TBDCAT (accessed on 6 January 2023).
- JMP Drinking Water Ladder, WHO and UNICEF. Available online: https://washdata.org/monitoring/drinking-water (accessed on 18 March 2020).
- About Water and Sanitation, OHCHR and the Right to Water and Sanitation UN Resolution on Water and Sanitation 2010. Available online: www.ohchr.org/en/water-and-sanitation/about-water-and-sanitation (accessed on 18 November 2018).
- UN Sustainable Development Goals. Available online: https://sustainabledevelopment.un.org/sdg (accessed on 20 December 2022).
- Government of India. Part II Manual on Municipal Solid Waste Management Ministry of Urban Development. 2016. Available online: https://mohua.gov.in/upload/uploadfiles/files/Part2.pdf (accessed on 16 September 2019).
- Equity and Resource Allocation. Encyclopedia of Public Health. Available online: https://www.encyclopedia.com/education/encyclopedias-almanacs-transcripts-and-maps/equity-and-resource-allocation (accessed on 21 March 2023).
- Bruneau, M.; Chang, S.E.; Eguchi, R.T.; Lee, G.C.; Reinhorn, A.M.; Shinozuka, M.; Tierney, K.; Wallace, W.A. A Framework to Quantitatively Assess and Enhance the Seismic Resilience of Communities. Earthquake Spectra. Earthq. Spectra 2003, 19, 733. [Google Scholar] [CrossRef]
- ADB. Building Resilience of The Urban Poor Recommendations for Systemic Change; ADB: Mandaluyong, Philippines, 2022; ISBN 978-92-9269-807-2 (Electronic). Available online: https://www.adb.org/sites/default/files/publication/838596/building-resilience-urban-poor.pdf (accessed on 25 January 2023).
Figure 1.
Map of the study area. Source: Created with the support of satellites images of Google map.
Figure 1.
Map of the study area. Source: Created with the support of satellites images of Google map.

Table 2.
Satisfaction related to Quality of drinking water from Primary Source of Drinking Water.
| Qualities | Slums | Number of Households | Mean | SD | Median | IQR | Mann–Whitney U (p-Value) |
|---|---|---|---|---|---|---|---|
| Transparency/color | Vizhinjam | 110 (100) | 2.83 | 0.83 | 3 | 1 | 4953 p = 0.753 |
| Barten Hill | 92 (100) | 2.80 | 0.48 | 3 | 0 | ||
| Smell | Vizhinjam | 110 (100) | 2.86 | 0.81 | 3 | 1 | 4845 p = 0.536 |
| Barten Hill | 92 (100) | 2.83 | 0.43 | 3 | 0 | ||
| Taste | Vizhinjam | 110 (100) | 2.85 | 0.84 | 3 | 1 | 2513 p = 0.000 |
| Barten Hill | 92 (100) | 2.17 | 0.505 | 2 | 0 |
Source: Primary Survey, 2021. Note: Figures in brackets show percentages.
Table 3.
Place of disposal of domestic degradable and non-degradable garbage.
| Place of Disposal | Domestic Degradable Garbage | Domestic Non-Degradable Garbage | ||
|---|---|---|---|---|
| Vizhinjam | Barten Hill | Vizhinjam | Barten Hill | |
| Nearby water bodies | 27 (24.5) | 0 | 41 (37.3) | 0 |
| Common place other than a community dumping spot | 10 (9.1) | 7 (7.6) | 9 (8.2) | 0 |
| Community dumping spot | 24 (21.8) | 27 (39.1) | 28 (25.4) | 53 (57.6) |
| Household’s individual dumping spot | 49 (44.5) | 58 (53.7) | 32 (29.1) | 39 (42.4) |
| Total | 110 (100.0) | 92 (100.0) | 110 (100) | 92 (100) |
| Mean | 1.86 | 2.55 | 1.46 | 2.42 |
| SD | 1.23 | 02.6 | 1.26 | 0.49 |
| Median | 2 | 2 | 2 | 2 |
| IQR | 2.25 | 1 | 3 | 1 |
| Mann–Whitney U (p-value) | 3614 | p = 0.000 | 3062 | p = 0.000 |
Source: Primary Survey, 2021. Note: Figures in brackets show percentages.
Table 4.
Components of water and sanitation index in Vizhinjam across five deprivation cut-offs.
| Drinking Water | |||||
| Poverty Cut-Off (k) | |||||
| k = 0.2 | k = 0.4 | k = 0.6 | k = 0.8 | k = 1 | |
| H | 0.97 | 0.82 | 0.28 | 0.03 | 0 |
| A | 0.52 | 0.57 | 0.71 | 0.85 | 0 |
| 0.50 | 0.47 | 0.2 | 0.025 | 0 | |
| Sanitation | |||||
| Poverty Cut-Off (k) | |||||
| k = 0.2 | k = 0.4 | k = 0.6 | k = 0.8 | k = 1 | |
| H | 0.59 | 0.34 | 0.18 | 0.18 | 0 |
| A | 0.54 | 0.69 | 0.92 | 0.92 | 0 |
| 0.32 | 0.23 | 0.16 | 0.16 | 0 | |
| Physical Environment | |||||
| Poverty Cut-Off (k) | |||||
| k = 0.2 | k = 0.4 | k = 0.6 | k = 0.8 | k = 1 | |
| H | 0.93 | 0.81 | 0.61 | 0.14 | 0 |
| A | 0.64 | 0.68 | 0.74 | 0.92 | 0 |
| 0.59 | 0.55 | 0.45 | 0.13 | 0 | |
Source: Estimated from the primary data.
Table 5.
Components of water and sanitation index in Barten Hill across five deprivation cut-offs.
| Drinking Water | |||||
| Poverty Cut-Off (k) | |||||
| k = 0.2 | k = 0.4 | k = 0.6 | k = 0.8 | k = 1 | |
| H | 0.190 | 0.010 | 0.000 | 0.000 | 0.000 |
| A | 0.290 | 0.400 | 0.000 | 0.000 | 0.000 |
| 0.050 | 0.004 | 0.000 | 0.000 | 0.000 | |
| Sanitation | |||||
| Poverty Cut-Off (k) | |||||
| k = 0.2 | k = 0.4 | k = 0.6 | k = 0.8 | k = 1 | |
| H | 0.680 | 0.240 | 0.090 | 0.090 | 0.000 |
| A | 0.360 | 0.610 | 0.840 | 0.840 | 0.000 |
| 0.240 | 0.150 | 0.070 | 0.070 | 0.000 | |
| Physical Environment | |||||
| Poverty Cut-Off (k) | |||||
| k = 0.2 | k = 0.4 | k = 0.6 | k = 0.8 | k = 1 | |
| H | 0.980 | 0.890 | 0.480 | 0.060 | 0.000 |
| A | 0.590 | 0.620 | 0.710 | 0.810 | 0.000 |
| 0.580 | 0.550 | 0.340 | 0.050 | 0.000 | |
Source: Estimated from the primary data.
Table 6.
value for water and sanitation deprivation index and cut-off at k = 0.4.
| Dimensions | Urban Slums | |
|---|---|---|
| Vizhinjam | Barten Hill | |
| Drinking water | 0.47 | 0.00 |
| Sanitation | 0.23 | 0.15 |
| Physical environment | 0.55 | 0.55 |
| Water and sanitation | 0.42 | 0.23 |
Source: Estimated from water and sanitation deprivation index formulated.
Disclaimer/Publisher’s Note: The statements, opinions and data contained in all publications are solely those of the individual author(s) and contributor(s) and not of MDPI and/or the editor(s). MDPI and/or the editor(s) disclaim responsibility for any injury to people or property resulting from any ideas, methods, instructions or products referred to in the content. |
© 2023 by the author. Licensee MDPI, Basel, Switzerland. This article is an open access article distributed under the terms and conditions of the Creative Commons Attribution (CC BY) license (https://creativecommons.org/licenses/by/4.0/).
Share and Cite
MDPI and ACS Style
Vidhyadharan, A. Disparities in Drinking Water and Sanitation in the Urban Slums of Kerala, India. Sustainability 2023, 15, 7559. https://doi.org/10.3390/su15097559
AMA Style
Vidhyadharan A. Disparities in Drinking Water and Sanitation in the Urban Slums of Kerala, India. Sustainability. 2023; 15(9):7559. https://doi.org/10.3390/su15097559
Chicago/Turabian StyleVidhyadharan, Anitha. 2023. "Disparities in Drinking Water and Sanitation in the Urban Slums of Kerala, India" Sustainability 15, no. 9: 7559. https://doi.org/10.3390/su15097559
Note that from the first issue of 2016, this journal uses article numbers instead of page numbers. See further details here.