
The Influence of Passenger Car Banning Policies on Modal Shifts: Rotterdam’s Case Study


1
Nijmegen School of Management, Radboud University, 6500 HK Nijmegen, The Netherlands
2
Rotterdam School of Management, Erasmus University Rotterdam, 3062 PA Rotterdam, The Netherlands
3
Sustainable Building Design Laboratory, Department UEE, Faculty of Applied Sciences, University of Liège, 4000 Liège, Belgium
*
Author to whom correspondence should be addressed.
Sustainability 2023, 15(9), 7443; https://doi.org/10.3390/su15097443
Submission received: 30 March 2023
/
Revised: 24 April 2023
/
Accepted: 28 April 2023
/
Published: 30 April 2023
(This article belongs to the Special Issue Frontiers in Urban Mobility)
Abstract
:Low-emission zones (LEZs), incentivizing electric cars, park-and-ride systems, and other traffic reduction schemes, are all single measures aimed at achieving low-/zero-emission mobility. This paper aims to investigate the impact of LEZs’ passenger car banning and argues that such single measures cannot achieve significant traffic or emission reduction levels without being integrated into a well-designed policy package that ensures the sufficient provision of mobility alternatives. Featuring Rotterdam as a single case study, this paper follows a mixed methodology consisting of (1) quantitative real-time data on transport usage that mirror the users’ behavior and (2) qualitative data acquired from in-depth interviews and documents that explain the government’s intention and the users’ behavior. The results show that between 2016 and 2020, after applying the LEZ policy for restricting passenger cars and vans of Euro 3 and lower, there was a 50% decrease in the number of polluting passenger cars and vans entering Rotterdam. However, this decrease is insignificant, since the number of vehicles targeted by the policy was less than 2% of the overall vehicles that entered the LEZ area. The results also shed light on the role of systematic policy packaging in ensuring a change in user behavior. Among other initiatives, a successful LEZ implantation should be supported by inner-city parking reduction, electric vehicle charging facilities, incentive schemes, and alternative sustainable mobility options. Above all, the number of restricted vehicles must be significant. The conclusion and discussion develop a well-structured, educational, evaluative framework and recommend a comprehensive package of policy measures for cities seeking low-emission mobility. The research, however, did not consider the impact of different land-use distributions on the application of the LEZ, which can be an interesting angle for future researchers.
1. Introduction
1.1. Background
Within the European Union’s (EU) transport network, road transport holds a top position in all inland passenger and freight transport [1]. For instance, in 2018, the EU’s road transport formed 81.8% of all inland passenger transport [2] and 76.5% of all inland freight transport [3]. Moreover, studies have shown that about 95% of the EU’s on-road vehicles are still fossil fueled [4]. This dominance has led road transport to contribute the highest share of transport-based emissions [5,6]. As a result, around 90% of European inhabitants are subjected daily to different levels of harmful pollutants [4].
Though the EU’s air quality measures have moved towards a better profile in the past few years, measurements of annual greenhouse gases (GHGs), particulate matter (PM), and nitrogen oxides (NOx) in several cities still showed an above-the-safeguard limit in 2019 [7]. In 2019, road transport was responsible for 77% of the GHGs and 80% of the PM [8] of all transport emission releases, as well as 39% of the total EU NOx emissions [7,9,10]. Out of these percentages, freight transport is responsible for most of the road-emitted NOx and PM, and passenger transport accounts for the highest percentage of CO2, which is the primary GHG [7,11]. Therefore, various agrements, development strategies, and regulative policies are increasingly being directed toward reducing transport-based emissions by focusing on both freight and passenger transport [12] in Europe and worldwide [13,14].
An example of such strategies that are applied within the European Union is the Urban Vehicle Access Regulations (UVARs) [15,16,17]. The scale of the UVARs application is broad and expanding; one of the most popular UVARs schemes are low-emission zones (LEZs) [12]. LEZs are urban areas in which access by certain polluting vehicles is subjected to strict regulations [18,19]. The policy initially targets heavy-duty vehicles (HDVs); however, in its advanced phases, it restricts light-duty vehicles (LDVs), including passenger cars and motorcycles [12,20,21,22,23]. In the past ten years, LEZs have been icreasingly transferred to many cities with varying and expanding restriction scopes. Curently, in the European Union, there are around 260 operating LEZs [20,23].
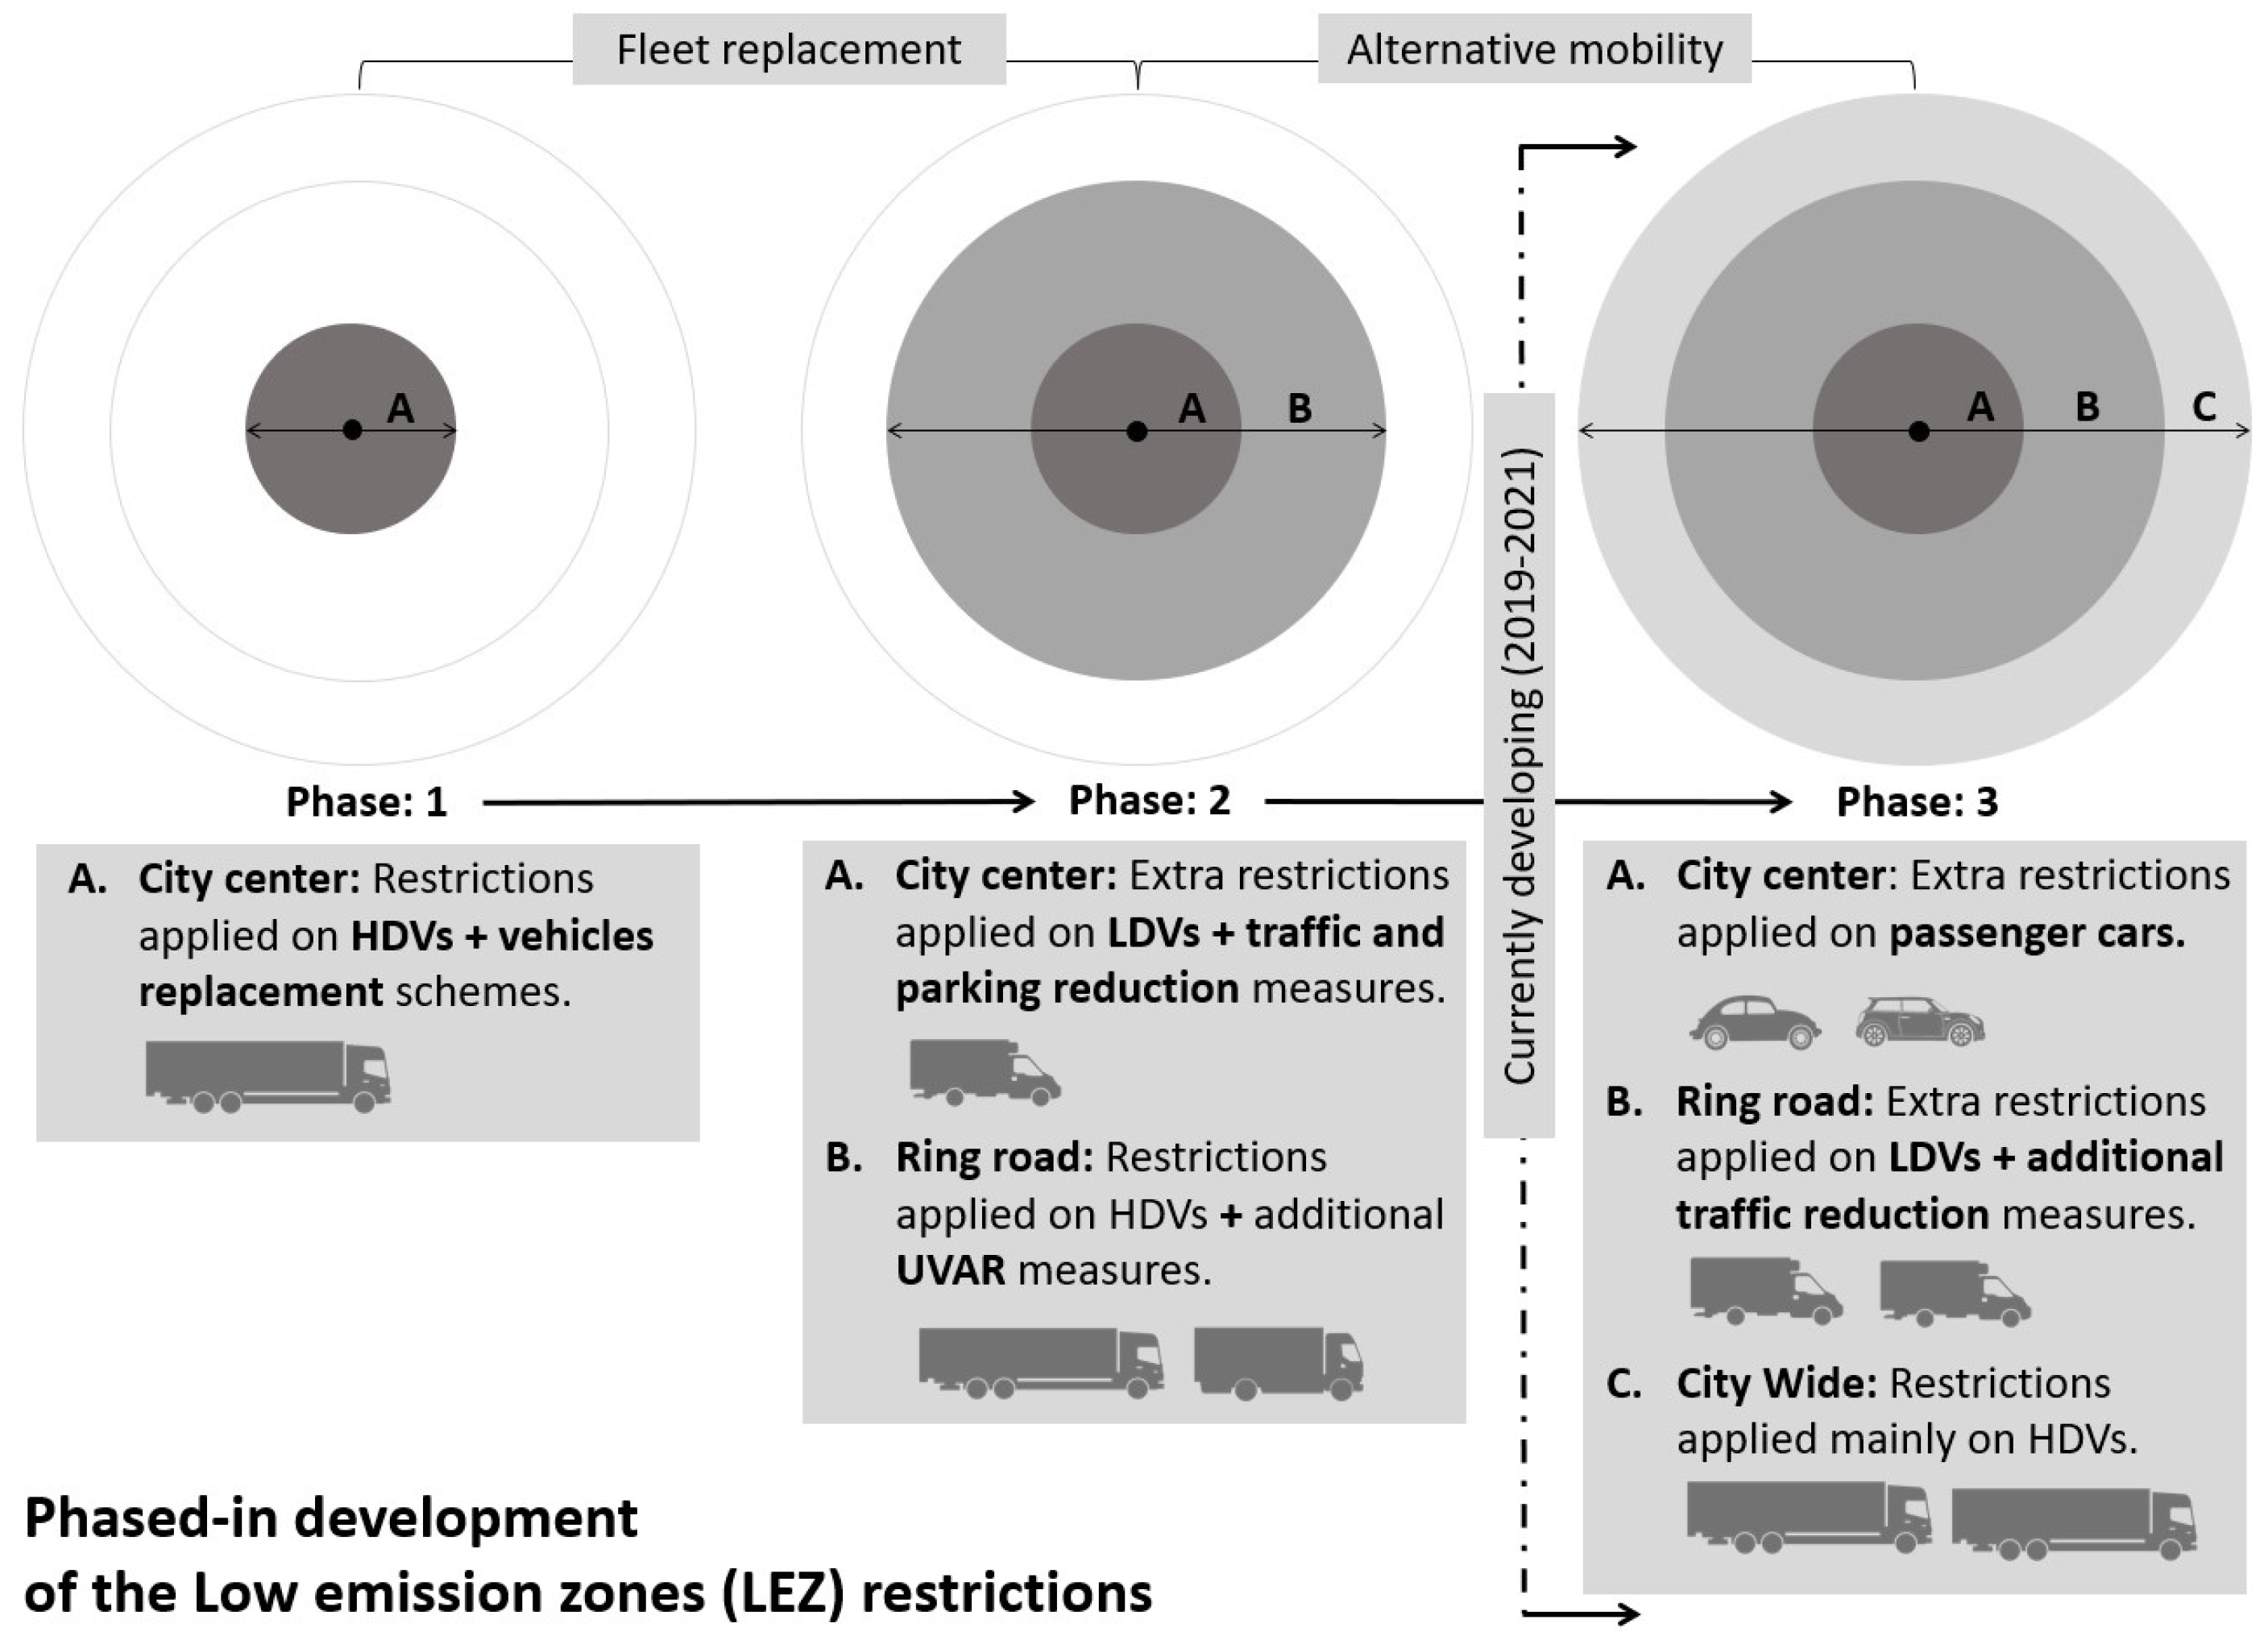
Cities that have LEZs gradually tighten their restrictions by enlarging their geographical boundaries, banning more polluting vehicles, and introducing more than one LEZ with varying scopes [24]. This phased-in policy development happens along with adding other parallel UVARs and traffic reduction schemes (See Figure 1). Such schemes include congestion charges (CC), road tolls, electric car incentives, scrapping schemes, parking restrictions, and various modal-shift measures [20,21,25]. This combination of measures is meant to couple the reduction in emissions with a controlled traffic shift, hence creating a transition towards sustainable vehicles and preventing future traffic increases.
1.2. Previous Work
Previous studies on LEZs have focused on two main subjects: (1) the effects of LEZs on emissions reduction and (2) the effects of LEZs on the reduction of polluting vehicles. Firstly, in terms of the reduction in emissions, studies have proven the success of LEZs in reduing traffic-based NOx and PM. Such reductions resulted mainly from limiting the access of HDVs [18,20]. Later, when cities started applying restrictions on passenger cars and LDVs (i.e., Rotterdam, Milan Area-C LEZ, and London’s Ultra-LEZ), studies proved the significant effects of the LEZ and its combined measures in reducing the CO2 levels and the overall traffic within its boundaries [25,26,27,28]. Such results increased the policy’s recognition and encouraged cities to move forward with their LEZ plans and apply further passenger car restrictions. Consequently, and based on the Urban Access Regulations in Europe website, by the end of 2019 and the early months of 2020, many European Union cities launched new restrictions within their LEZ boundaries. For the first time, capitals such as Paris, Brussels, and Amsterdam started applying restrictions on a specific range of passenger cars, and more cities announced their plans to follow the same approaches in the forthcoming future [29].
Secondly, in terms of the reduction of polluting vehicles, the leading literature is mainly concerned with LEZs’ effect on the goods fleet and the prospected HDVs’ technological shifts. For example, Ellison et al. [12] showed significant changes in London’s goods fleet composition, where operators shifted their vehicles towards smaller LDVs and less polluting HDVs to comply with LEZ regulations. Meanwhile, Broaddus et al. [21] studied the effect of London’s LEZ on reducing the distances traveled by all goods vehicles, where drives shifted their routes to avoid entering the LEZ. Finally, Settey et al. [30] referred to the need to reconsider the EU’s technological readiness before any further HDV bans to guarantee sufficient alternative options.
In addition, other studies have referred to the importance of policy packaging and the provision of policy alternatives to accelerate the transition and back up the harsh restrictions of the LEZs. However, on this subject, Haakman et al. [31] describe a current gap in policymaking, in which there is not much attention directed toward policy integration. Haakman’s research focused on various air quality and traffic policies applied in different Dutch and German cities (i.e., LEZs, parking restrictions, subsidy incentives). Their study showed that so far, the local policy adoption does not follow a linear path of goals, a provision for projected alternatives, or impact evaluation. They explained this to be due to the vast amount of uncertainty surrounding such critical policies. Regarding uncertainty and suitable alternatives, Tobollik et al. [30] and Morton et al. [11] recommended that leading cities exert extra effort to study alternatives, collect data, integrate methodologies, and refine techniques. Generally, a growing body of research stresses the need for air quality policies to be integrated with traffic policies to achieve realistic results.
Accordingly, though an extensive range of EU cities have made plans towards the gradual ban of passenger cars [23], cities that started this restriction earlier (i.e., London, Rotterdam, and many German cities) must be the first provide an evidence-based integrated review on the suitable application of LEZs’ passenger car bans. These leading cities need to discuss their applied policy packages, socially acceptable alternatives, influences on passenger transport composition, and technological shifts. However, although LEZ bans on passenger cars have been applied for many years now, so far, there is no literature tackling such aspects. Therefore, a case study that studies the LEZ policy packaging in a city that has restricted passenger cars can help lead the discussion and fill in the above-described literature gaps, bringing to attention policy-induced alternatives, policy packaging, and the perceived patterns of modal shifts.
One very interesting policy application started in Rotterdam in 2016. Rotterdam was one of the earliest cities to ban old diesel and petrol passenger cars from entering its LEZ. Over four years, the policy faced different challenges, was coupled with several supporting measures, and underwent many adjustments. However, by 2020, Rotterdam allowed all passenger cars back into the zone [25,32]. Even though the LEZ’s ban on passenger cars has proven to have significant emission reductions and shown changes in the road traffic composition, the policy was generally faced with multiple social and political rejections that support its replacement with other measures [22,26,33]. As a result, it was promised that the policy take-back would be replaced with more considerate traffic- and pollution-control actions [34].
Consequently, by monitoring the change in usage of different modes of transport in Rotterdam and linking such changes with the provided traffic measures and policy alternatives, this paper aims to evaluate and explain the effect of the LEZ and its accompanying measures on passenger transport composition and modal shares. The results target cities that are starting similar measures to manage their demands for alternatives and provide robust policy packaging.
1.3. Aim and Contribution of This Study
As shown in the above literature, among the expected influences of the LEZ and its supporting measures are vehicles’ replacement, modal shifts, a reduction in trips, switching routes, and changing the patterns of modal share, all towards alternative sustainable options [18,21,30,35]. So far, unlike the HDV bans, applying bans on passenger cars has been experimental and context dependent, which has allowed for many policy fluctuations and spontaneous coupling of measures and has slowed down the policy transfer. However, by studying the policy’s influence on the passenger transport composition, a first-of-its-kind empirical understanding of citizens’ needs and their reactions towards the LEZ and its supporting measures can help in the development of a guidance framework for transferring the policy.
Up until today, the influence of the LEZ and its traditional accompanying measures (i.e., park-and-ride, incentive schemes, and electric vehicles’ infrastructure) on the usage of other modes of transport has not been sufficiently researched in the academic literature [36]. This creates a gap that leads to difficulty in defining the policy measures that can help users replace their polluting cars with a more sustainable option. In other words, it is not clear in the literature whether the exclusion of old passenger cars and vans from city boundaries leads to favorable shifts in traffic dynamics or adds a different sort of polluting traffic to city boundaries. Hence, this research introduces a novel topic and a unique case study that helps in explaining this specific issue by providing a well-structured, educational, evaluative framework and recommending a comprehensive package of policy measures for cities seeking low-emission mobility.
This researcher’s overall aim is to help steer future mobility plans and to guide cities to move towards the low- and zero-emission mobility by answering the following research questions:
- What is the state of usage of Rotterdam’s passenger transport modes before and after applying the LEZ ban on passenger cars?
- To what extent did the supporting policy instruments that were provided influence the transition toward sustainable mobility?
- How do the currently applied passenger transport measures influence the modal shifts in Rotterdam?
The methodology of this research aims at comparing Rotterdam’s modal share status by adopting an explanatory deductive approach, a single case study strategy, and a mixed data collection methodology. Data on the past ten years are analyzed through qualitative and quantitative real-time comparisons by monitoring the usage of selected public and private transport facilities over the study period. The comparison groups the data into two study cases: (1) before and (2) after the policy application. Furthermore, it outlines the difference in the transport network usage inside and outside the LEZ boundaries within the two study periods. The two exact periods are from 2011 to 2015 and from 2016 to 2020. These two periods were chosen because the LEZ restrictions on passenger cars and vans of Euro 3 and lower were applied in 2016 and removed in early 2020. Consequently, to significantly assess the influence of the LEZ on modal shifts, the entire period of policy application (2016–2020) is compared to a similar period of five years before the policy application (2011–2015). The results explain and indicate the extent of the influence of the LEZ policy and its packaging on the use of alternative modes of transport and show the variation in the users’ preferences and modal share choices.
The research, however, is limited in including all means of transport. For example, shared vehicles, electric bikes, and walking are not included. Further, the paper does not include any of the land use, socio-political, or political-economic aspects that greatly affected the application of the LEZ. However, these aspects could be the focus of future research, in addition to applying a policy simulation method to test the identified set of policies.
The paper is composed of six sections. After section one, which is this general introduction, section two presents the study’s theoretical framework. Section three discusses the adopted methodology and the limitations of the study. Section four gives an analysis of the results and findings from the quantitative and qualitative approaches. Section five includes the discussion and a summary of the main findings. Finally, section six concludes the paper, summarizes the key outcomes, and provides recommendations and future research implications.
2. Theoretical Framework
2.1. Low-Emission Mobility
Traffic restrictions and air pollution reduction measures are drawn from the urgent global need to increase low-emission mobility options. The definition of the low-emission mobility concept varies in the literature. Yet, it is mainly referred to as mobility that does not contribute to producing harmful emissions, i.e., active mobility, or that contributes to emissions but with the least possible effect, i.e., public transport, electric, and shared mobility [37,38]. In the European Commission’s [39] strategy for low-emission mobility, they stated that the solution to all the traffic pollution and emissions challenges comes from the switch to low-emission mobility in cities. “The ambition is clear: by mid-century, GHG emissions from transport will need to be at least 60% lower than in 1990 and be firmly on the path towards zero-emission…air pollutants from transport that harm our health need to be drastically reduced without delay…” [39].
Low-emission mobility opens the door for new innovations, technologies, and production. It provides new job opportunities and introduces creative energy usage ideas contributing to the city’s sustainable development. This target can be reached through several approaches, including three main avenues: (1) investing in new technologies for transportation, (2) increasing public awareness, and (3) introducing policies that prohibit the usage of polluting vehicles [39]. The transition towards low-emission mobility requires a high level of transport management and decision making, a very complex and challenging task [40,41].
Furthermore, future cities’ success lies in creating cities in which users no longer need private cars. In return, they are provided with affordability, proximity, health, and open spaces. Hence, governments must incorporate strategies and policies to promote sustainable mobility that provide a new transport hierarchy, focusing on the social dimension, accessibility, modal shifts, open spaces, and the integration of people with traffic [42].
Low-Emission Zones (LEZs)
One of the substantial measures targeting low-emission mobility is the LEZ policy measure. LEZs are areas in which the entry of vehicles that do not apply to a specified emission standard is banned, or the vehicles are highly fined if they do enter [18,19].
Theoretically, the most effective application of LEZs requires at least a ban on all pre-Euro III vehicles to guarantee a reasonable pollution reduction level. Such a restriction stage implies banning heavy- and light-duty vehicles (HDVs and LDVs), whether petrol or diesel fueled. Nevertheless, social, political, and economic challenges and objections accompany some LDV restrictions, especially without the earlier preparation of alternatives [22].
Diesel engines are the primary source of traffic PM and NOx emissions [22]. Therefore, the initial LEZ criteria focused only on restricting diesel HDVs, targeting local PM and NOx reduction [20]. HDVs are simpler to control, and almost all of them are fueled by diesel. However, the range of LEZs’ restrictions and scope is context adjustable and differs from one city to another [43]. Hence, the impact of the LEZ is highly dependent on these aspects, along with the provided policy package.
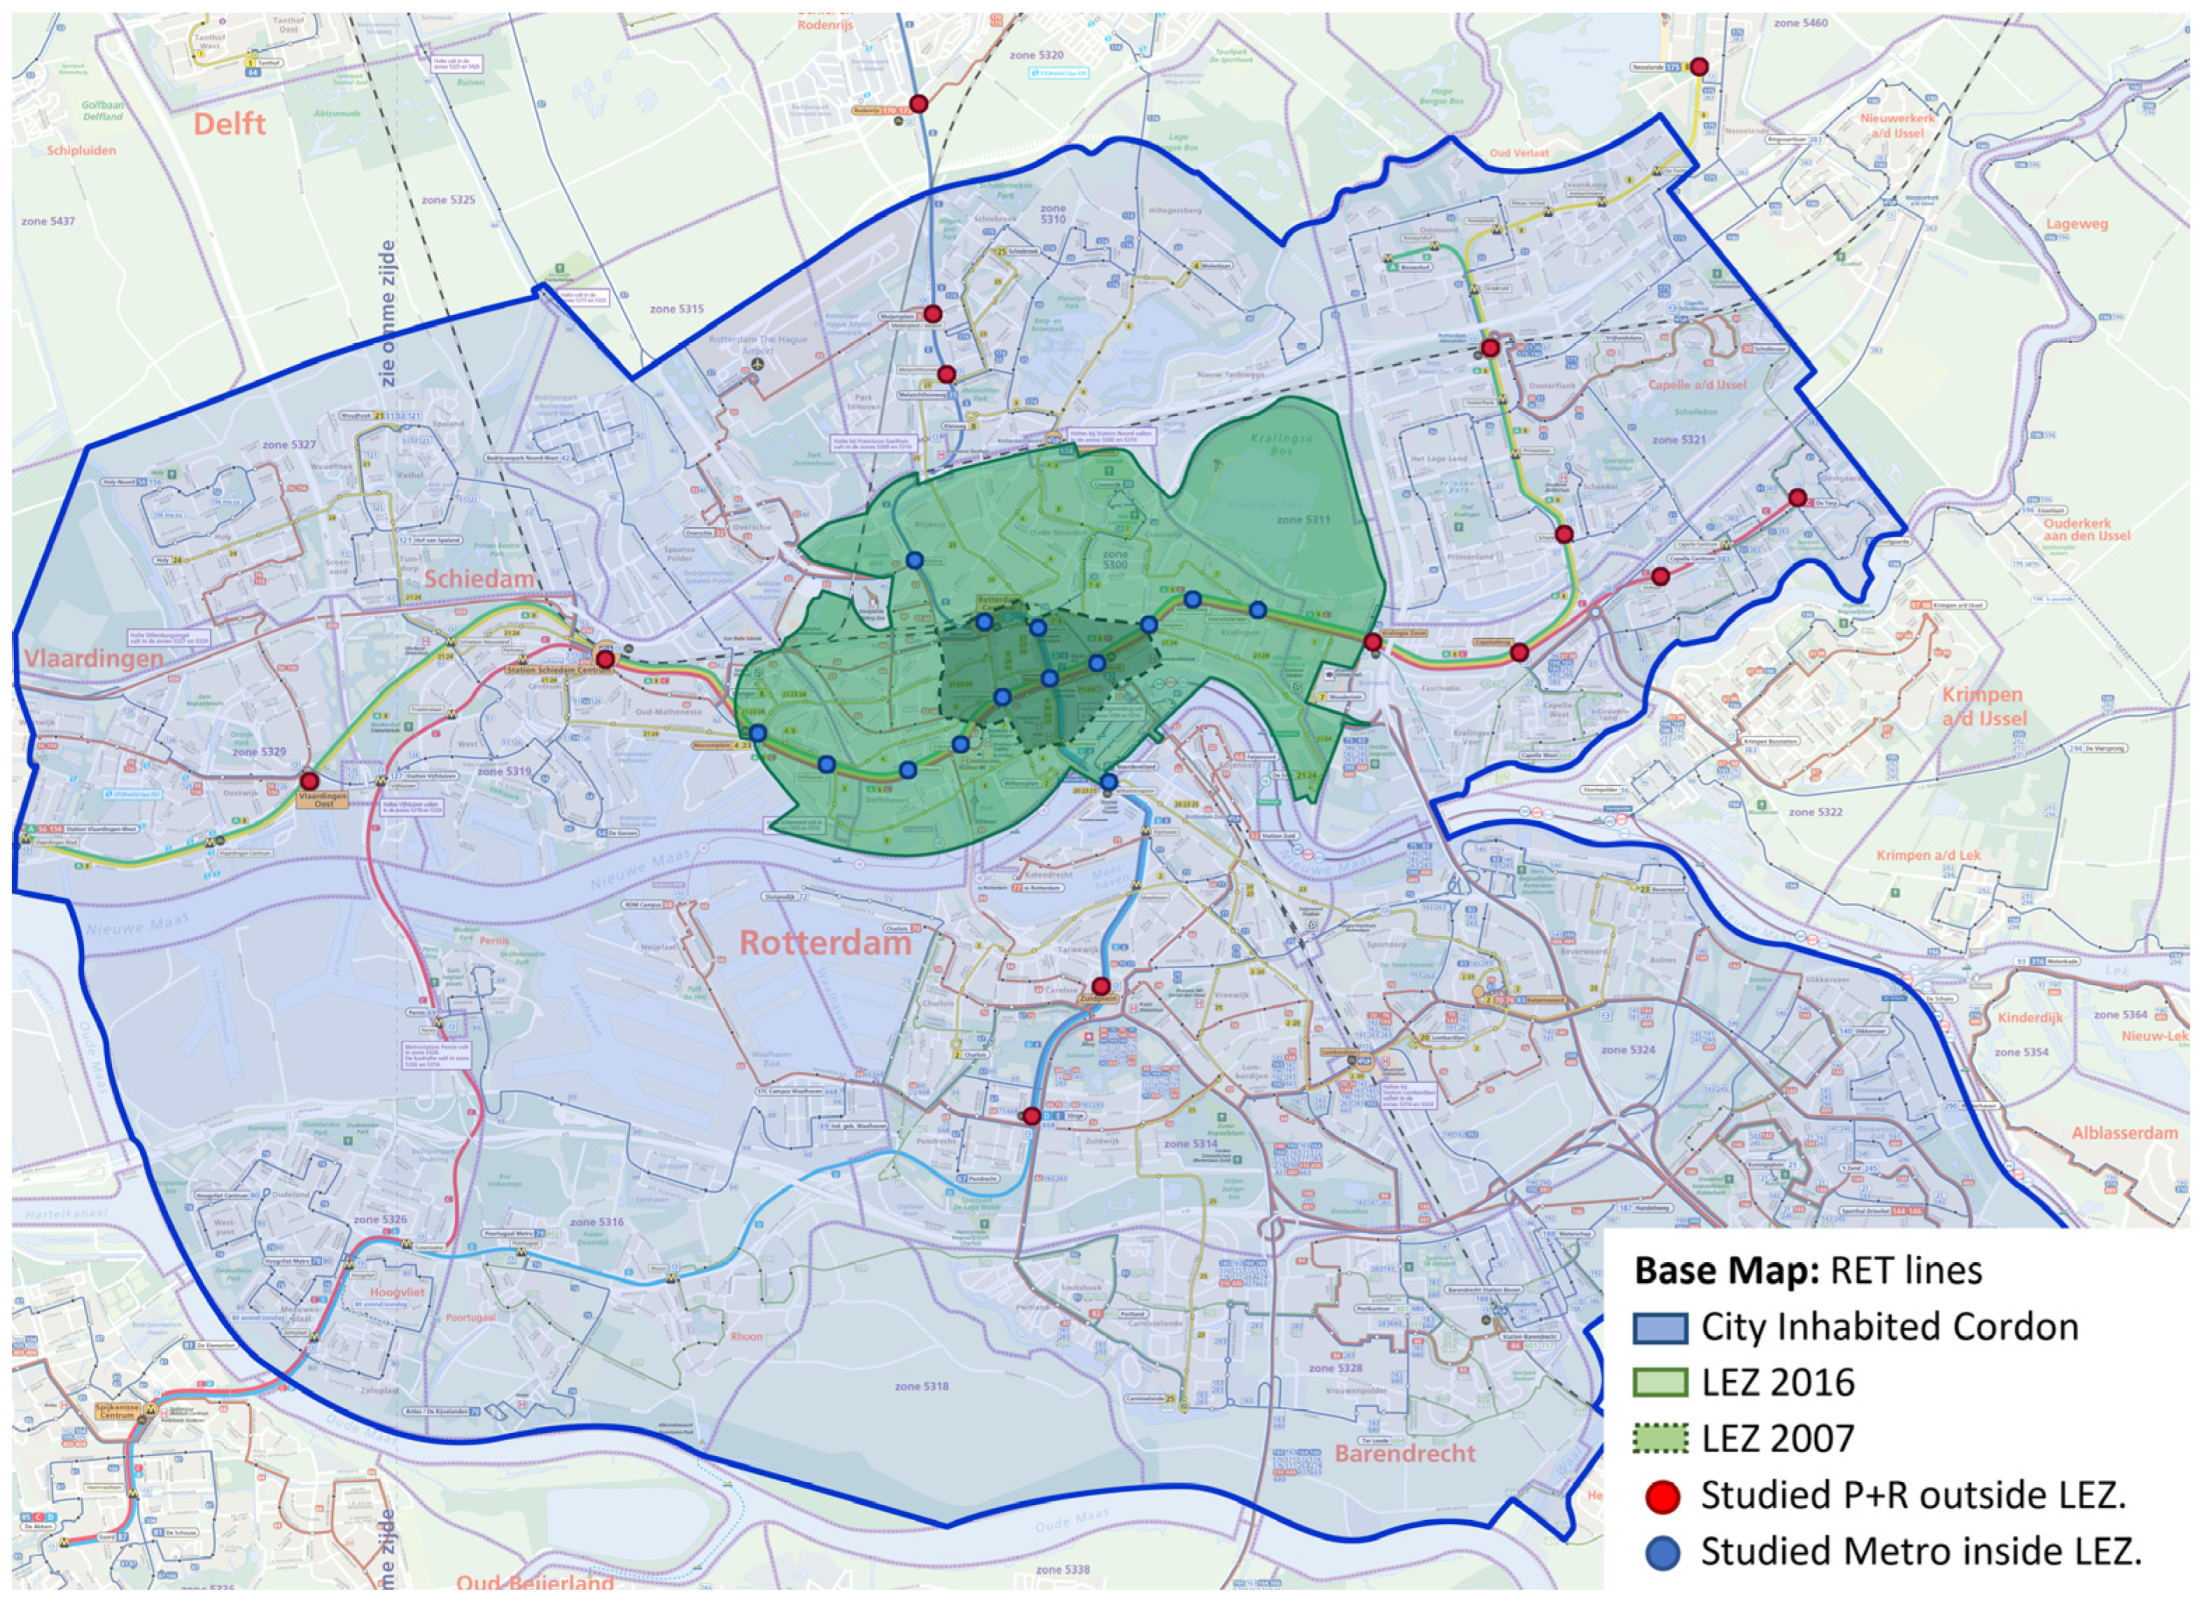
Initially, the first operating LEZ in Rotterdam started in 2007, banning freight transport of European emission standard Euro III and lower. However, it had limited boundaries, mainly around the city center. In 2016, the city widened the area to be extended from above the river to the ring road boundaries (Figure 2). The new LEZ featured an additional ban that addressed Diesel passenger cars and vans older than 31 December 2000 and petrol passenger cars and vans older than 30 June 1992 [25].
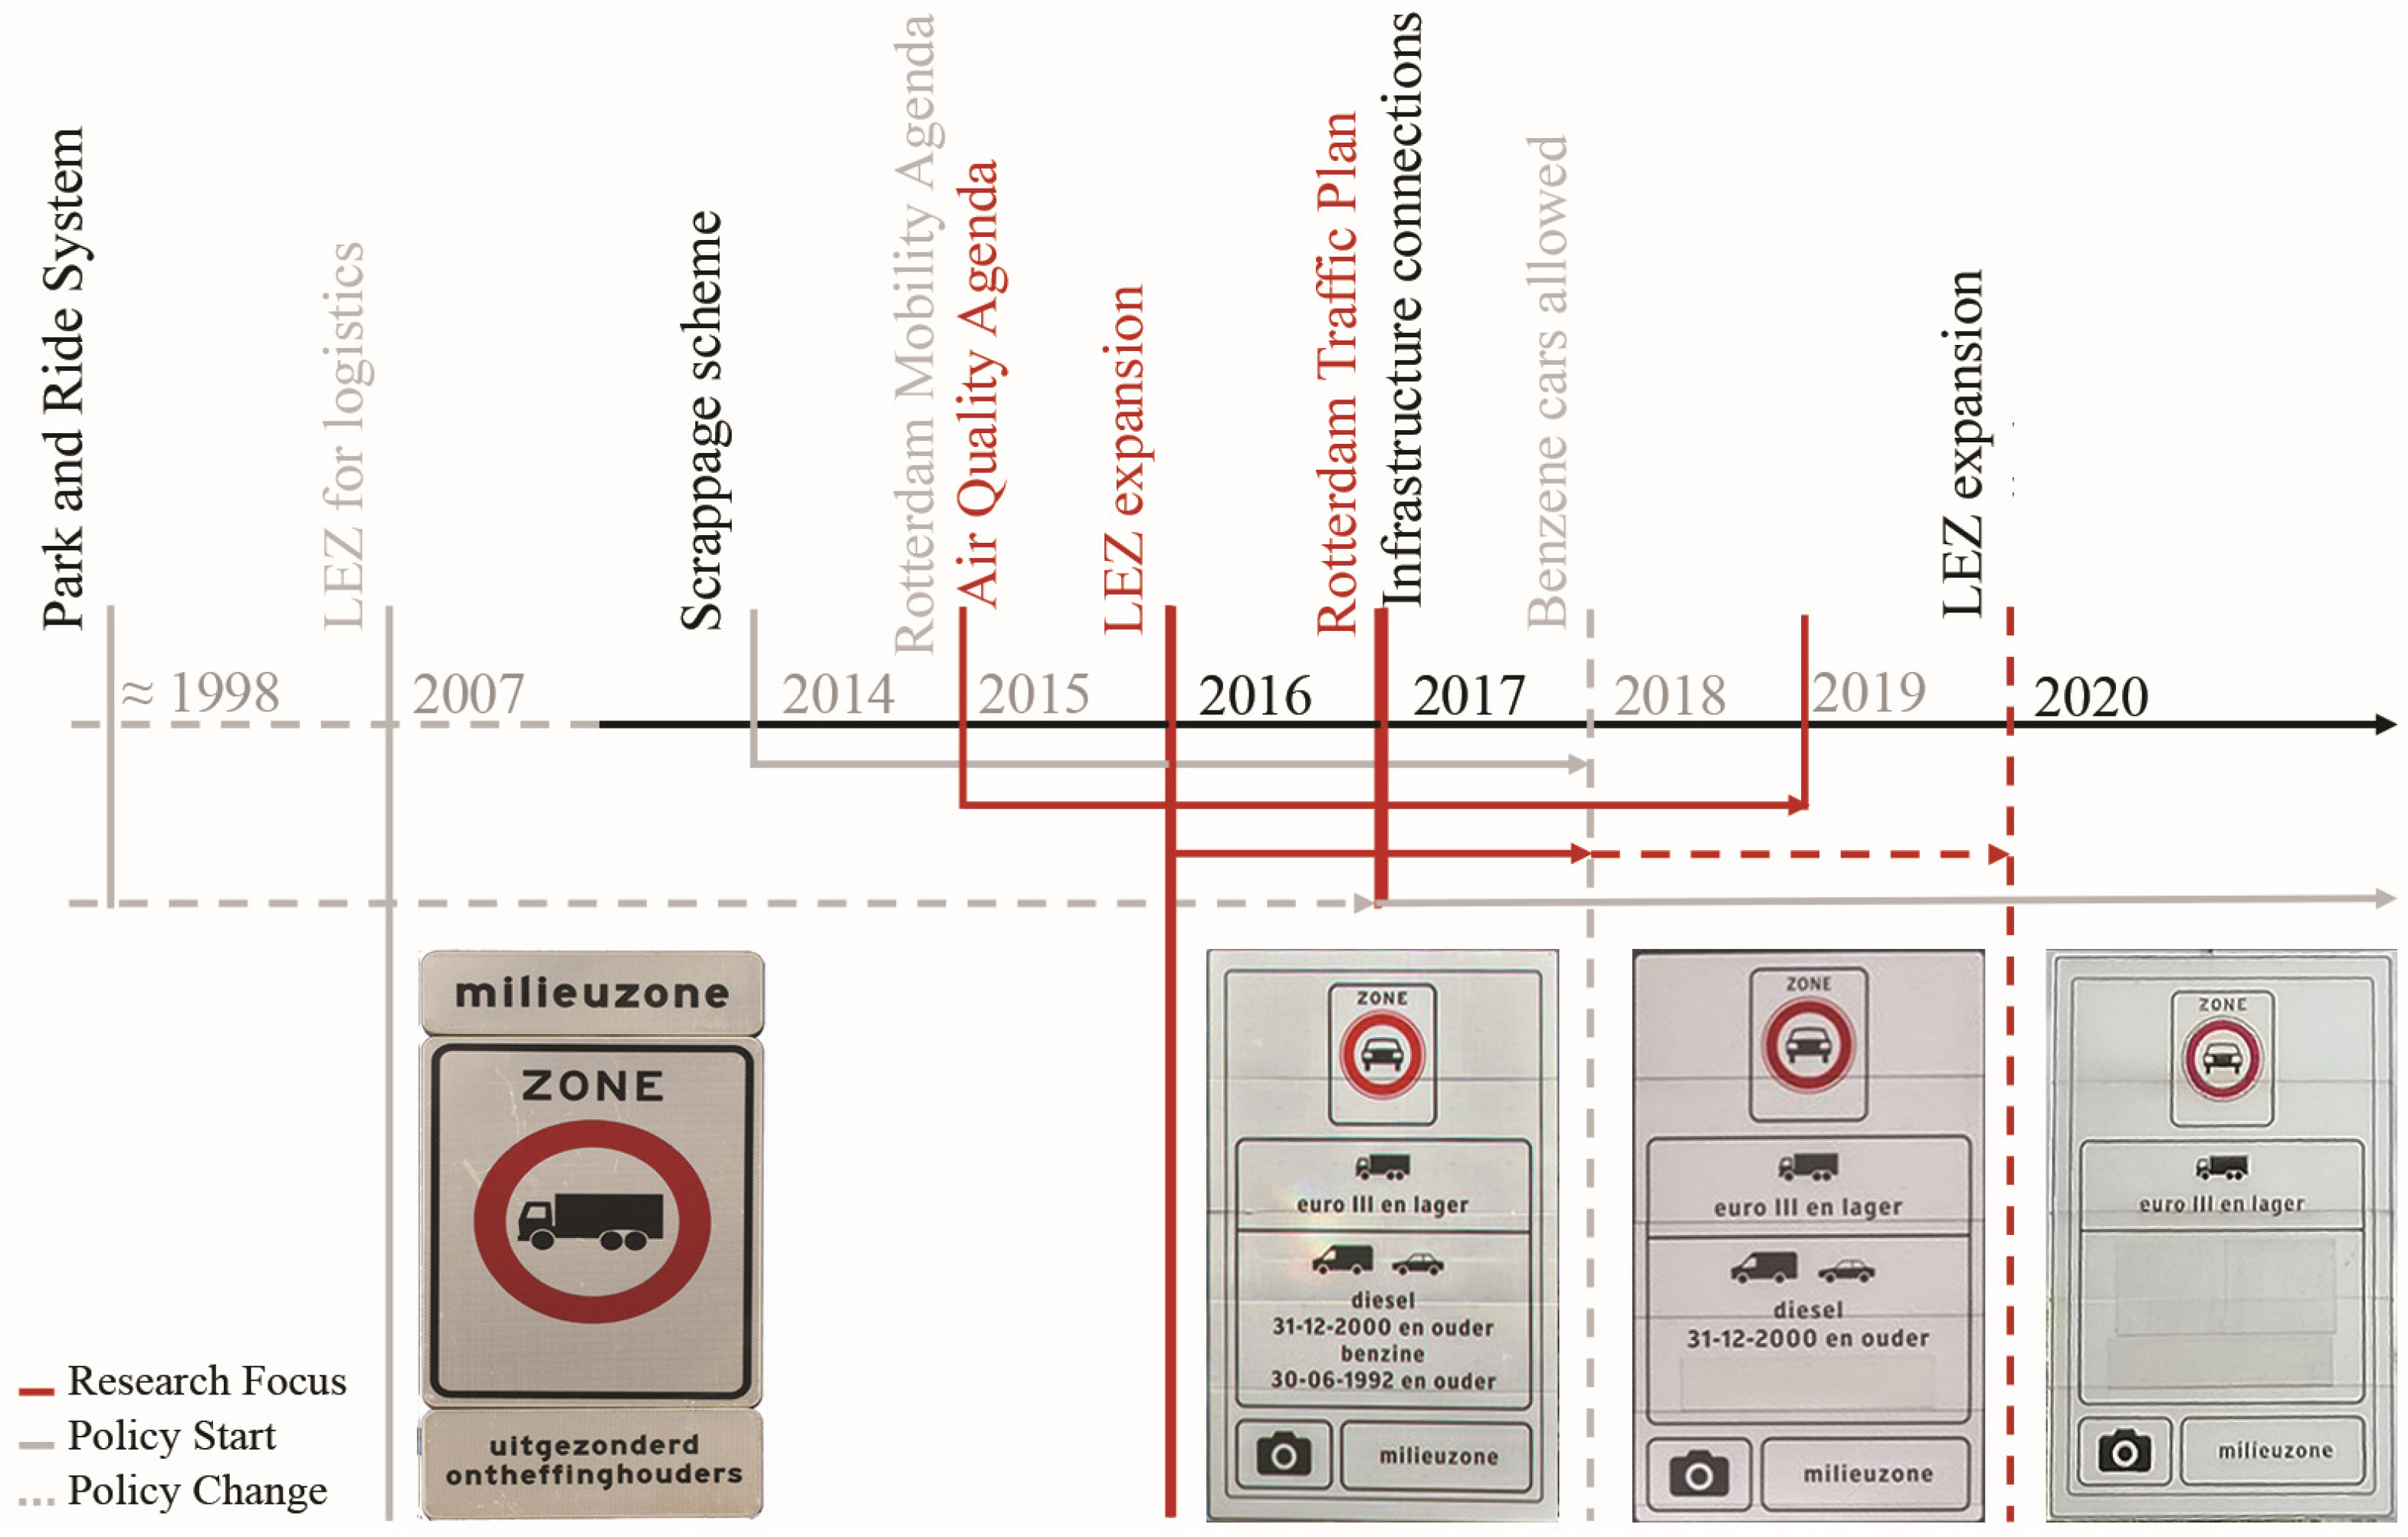
Prior to the LEZ’s launch, Rotterdam had gradually imposed different guiding policy measures (e.g., a park-and-ride system, a scrapping scheme, and electric vehicle incentives) to facilitate users’ transition, reduce opposition, and keep the traffic clean by shifting the users’ attention towards alternative modes of transport [34,44]. The 2016 LEZ was then introduced within the air quality policy package of 2015. Later, it was coupled with the traffic plan of 2017. What is significant about Rotterdam’s case is that the city kept developing alternative strategies, adapting the LEZ regulations, and coupling them with different agendas and measures to reach an acceptable level of restrictions (see Figure 3).
Figure 2.
LEZ and P+R zoning within Rotterdam’s inhabited cordon and metro lines. Based on [45,46,47,48,49].

Finally, over the four years of policy application, Rotterdam succeeded in facing various challenges, developing innovative solutions, and continuously evaluating the policy. Yet, the city decided to withdraw the passenger car ban in 2020 [25]. This withdrawal was promised to be replaced with strict parking and traffic policies that guaranteed similar pollution reduction levels [34].
2.2. Transport Policy Packages
Transport policies are described as policies and induced measures that deal with transport problems [51]. However, the effect of stand-alone policies is limited, and sometimes they produce many unwanted side effects [41]. Thus, transport policies should be accompanied by a set of measures and included in a package to complete the development process [52]. Policy packages are “… a combination of policy measures designed to address one or more policy objectives, created to improve the effectiveness of the individual policy measures, and implemented while minimizing possible unintended effects…to increase efficiency” [53]. Yet, this is still considered a vague and fluctuating concept, with different practices and understandings [41] that are context and demand flexible. Furthermore, policy packaging decision making is highly significant in assessing the relationship between the included measures for future policy improvements.
Within the different applied policy measures that aid in guiding the shift towards low-emission mobility, some measures are preferred by the user and have proven to be more successful in specific communities than others. For instance, European research showed that measures such as improving the public transport network and providing park-and-ride systems are preferred as an alternative by about 90% of car users. In contrast, only 20% of car users agreed on other measures such as cordon pricing and parking space reduction [54,55]. Therefore, it is vital to understand each city’s context, range of users, and the users’ behavior towards modal shifts before including new measures in the intended policy package.
Moreover, in the case of restricting specific vehicles such as vans and passenger cars, governments must offer alternative modes of transport as a replacement [56]. Studies on different traffic and pollution reduction policies have stressed the urgent need to provide infrastructure for sustainable alternative modes of transport within a designated package of complementary measures that accompany the imposed access restrictions [31]. By alternative modes, public transportation and active and electric mobility should be tackled. In other words, the ban on LDVs, specifically the ban on passenger cars, should always be included in a package that encourages the old polluting vehicles’ substitution by various modal choices, or policies such as the LEZs should be limited to medium- to heavy-duty vehicles and taxis to avoid objections [22].
2.3. Modal Shifts
Modal shifts mean switching usage from one mode to another, leading to a change in the overall mobility structure (e.g., using public transport instead of cars) [57]. Modal shifts can be implemented through changes in the external built environment, transport quality, availability, induced policies, and promotion campaigns [58,59]. Some changes lead to full modal shifts; others are half-shifts that can be a step towards a complete shift later. It is crucial for policymakers “… to know whether interventions promoting sustainable transport modes can produce long-term changes” [60].
A profound understanding of the users’ travel behavior in modal choices and potential shifts can better predict the associated impacts, such as traffic and air pollution reductions. Thus, studying different user choice patterns can provide a knowledge base for future planning [61]. Overall, to achieve low-emission mobility by encouraging modal shifts, it is essential to work on different tracks based on future needs, cities’ contexts [62], and the availability of alternatives.
2.4. Conceptual Framework
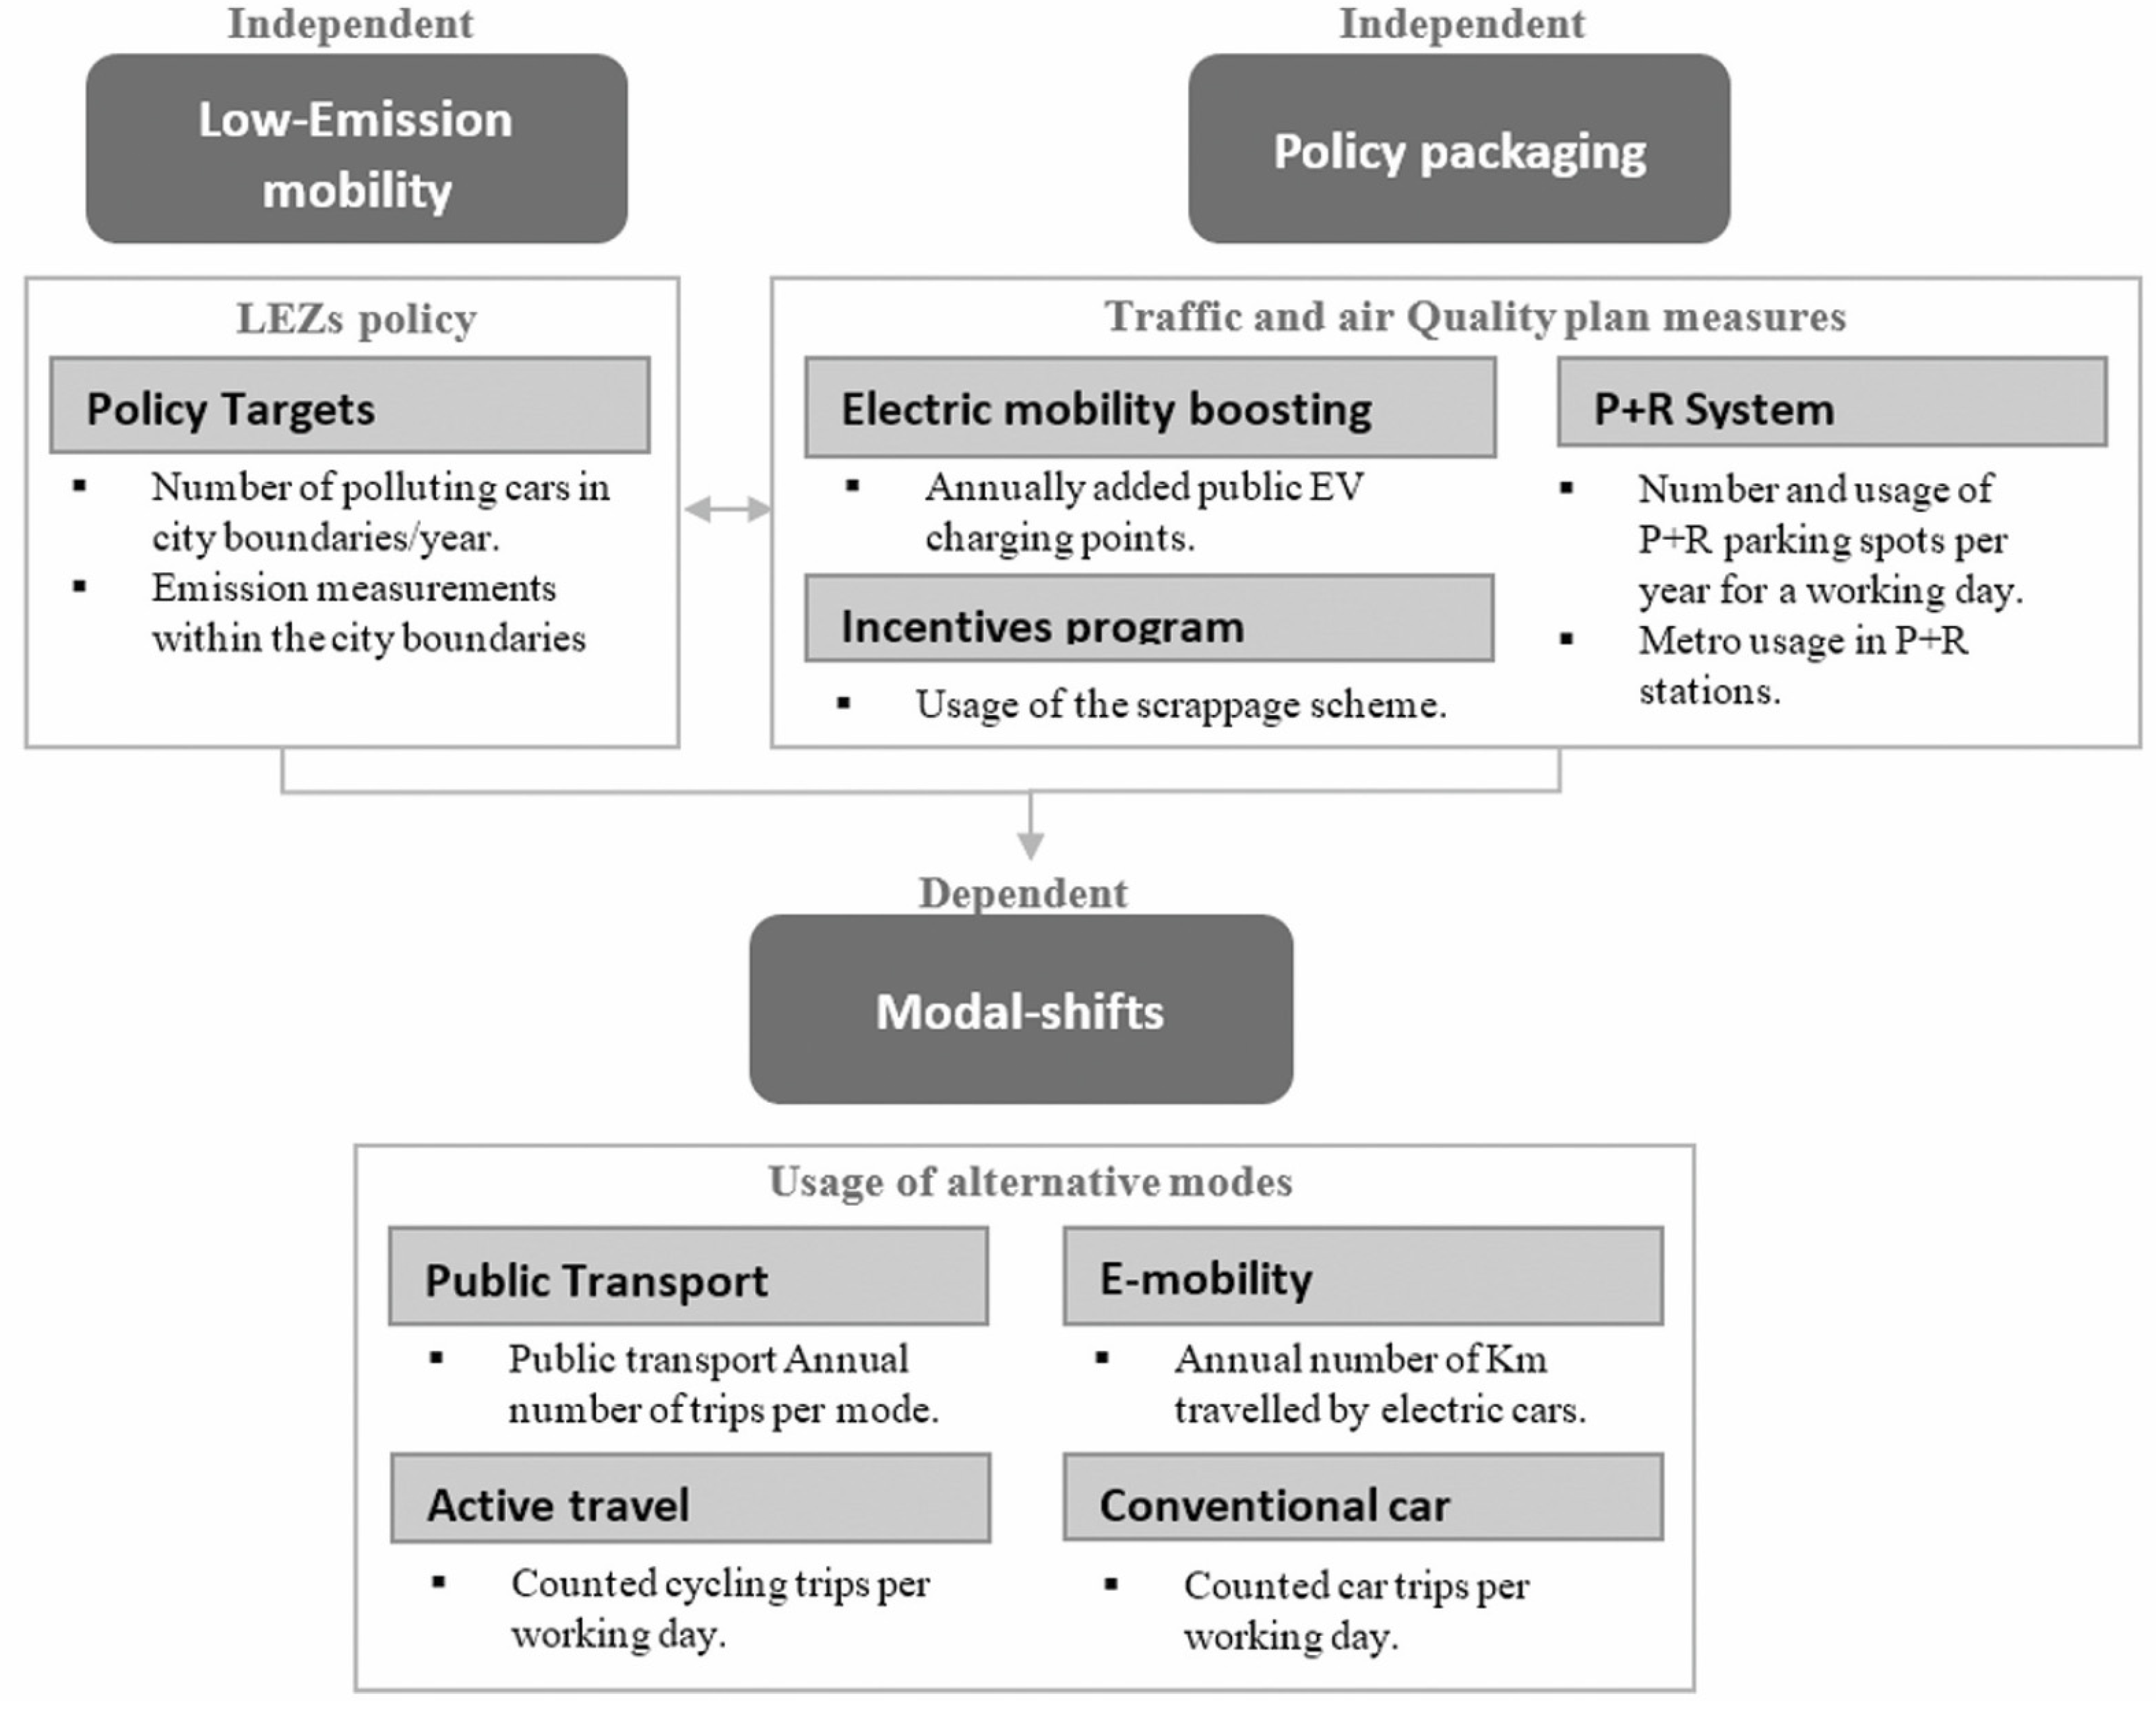
Based on the literature review, it can be said that the implementation of LEZs is directly connected to the three concepts: “Low-emission mobility”, “Policy packaging”, and “Modal-shifts.” This research provides a real-time data-based framework to understand the interaction between these three concepts, building on Rotterdam’s case study. Figure 4 illustrates the proposed relationship, the main variables, and the indicators studied underneath each of the three concepts.
3. Materials and Methods
Through a single case study analysis, this research follows an explanatory deductive meta-analytical approach. The data are collected through a mixed method, specifically triangulation design. The choice for this method is due to the variation in the existing data sources and measurement methods. This method is selected to validate and expand upon the quantitative results with qualitative data and ensure that the same information is agreed upon in three sources [63].
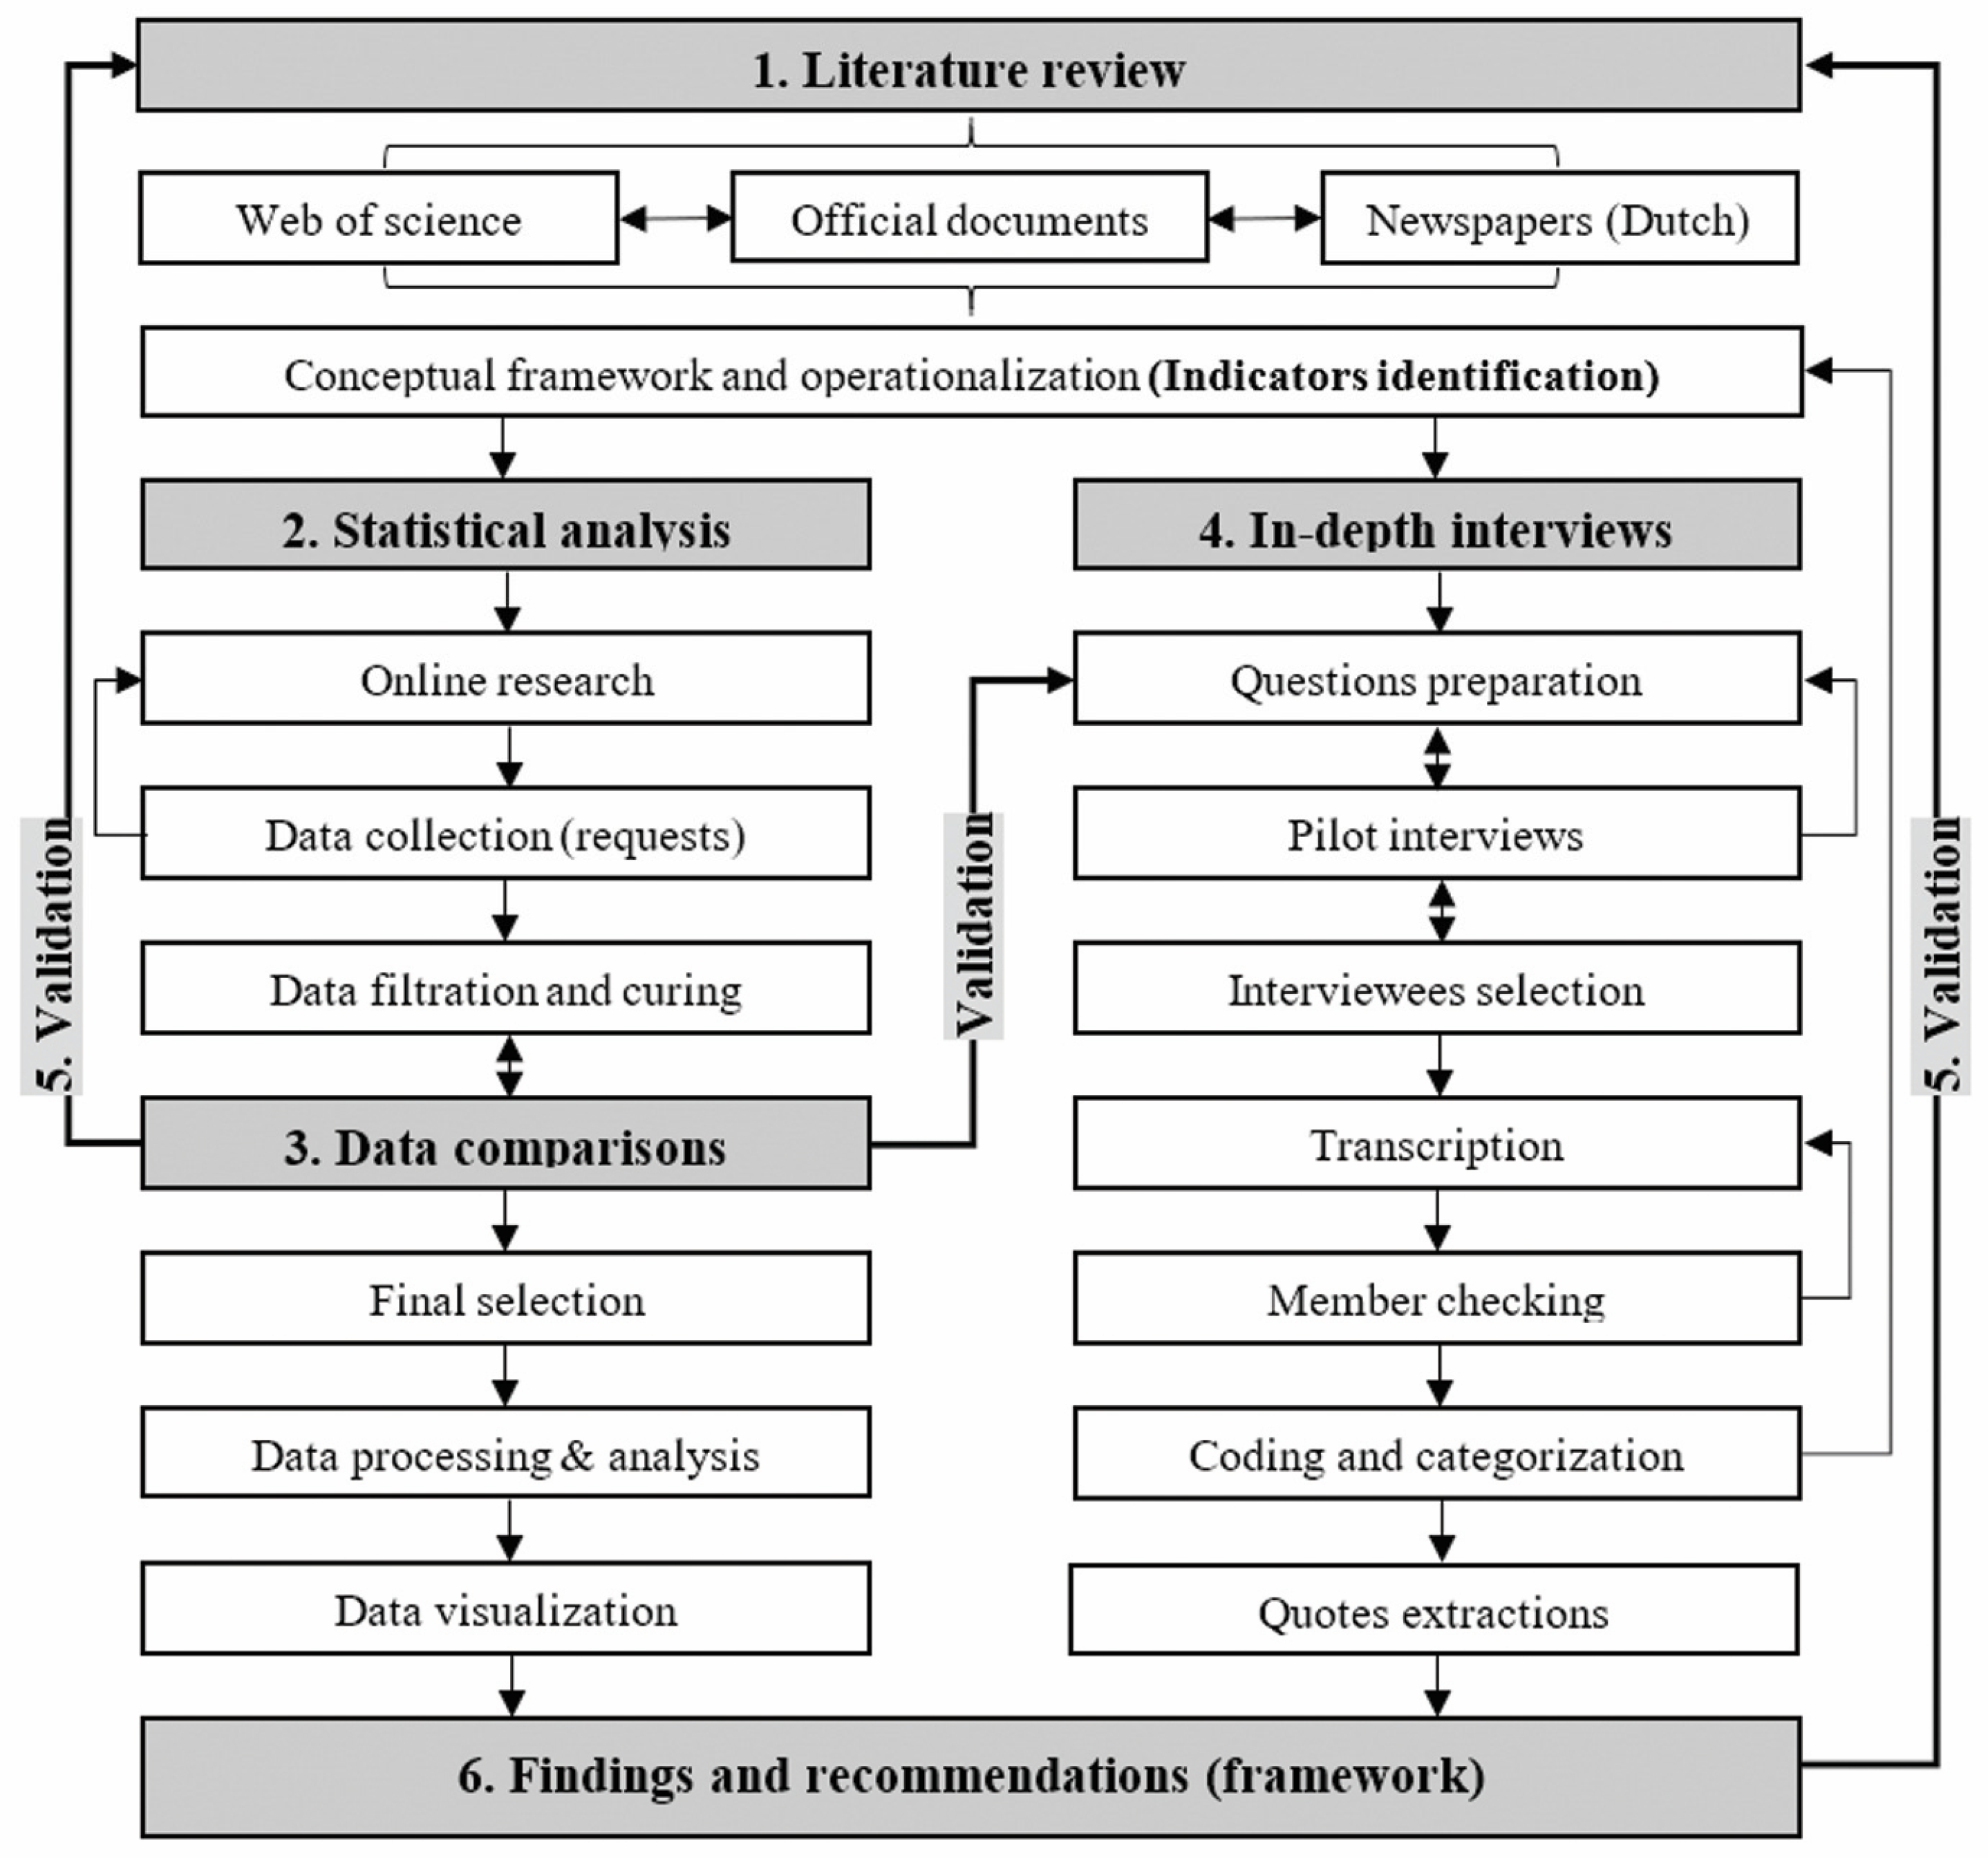
Figure 5 illustrates the research’s methodological framework and the data collection sequence. Data collection is tackled on three levels. The initial level is a qualitative study that covers conceptual and strategical information from different literature reviews. The selected literature focuses on developing traffic and air quality policies in Rotterdam and the Netherlands, gathered from the municipality’s documents, international reports, and similar policies worldwide. Articles on Rotterdam’s LEZs and traffic plans were explored from different trusted newspapers to collect more details on Rotterdam’s case and to further obtain local evidence on the problem. This initial qualitative approach helps to identify the main variables and indicators, in addition to backing up and validating the other two data sources.
The second data collection level is addressed through a quantitative study that includes the existing statistical data from the municipality portals and transport companies’ travel registrations. The sampling selection focuses on specific transport indicators (e.g., car crossings and public transport trips) by investigating all reliable data suppliers and web portals (e.g., transport authority reports, official documents, and Rotterdam’s published research). This information was gathered by stratified desk research and data coding. The collected data were either already calculated or required descriptive-analytical processing, for which Microsoft Excel 365 charts and IBM SPSS Statistics 25 [58] were used. This quantitative approach helps to provide real-life data for the timeline comparison and is the core of the study, articulating the main findings and recommendations.
Lastly, these datasets are triangulated through another qualitative data collection level, namely, by conducting in-depth interviews with officials and experts from the field. For the interviews, non-probability sampling was performed through purposive selection of the related officials and transports responsible by choosing a selective and rational number of respondents to cover the concerned organizations. “The larger the sample, the better” [64,65]. For this research, the number of semi-structured interviews can range between six and ten; the purpose of the semi-structured interviews is only for triangulation [65]. Therefore, in addition to some e-mail-based discussions with several transport companies’ researchers (e.g., [45,66,67,68]), the final sample of interviewees included eight respondents. This last data collection level was a source for filling the research gap, mostly to develop subjective results on the government’s motives and residents’ patterns in Rotterdam. To further validate the results and ensure the triangulation’s consistency, the interview questions were based on the leading research indicators and the variables extracted from the initial literature review [65,69].
3.1. Final Sampling Selection and Data Sources
Quantitative and qualitative data were collected to create a dataset of sampled traffic information. Firstly, we collected quantitative data from public and private authorities and companies that are monitoring the traffic in the city of Rotterdam. The population of this research is passenger cars users, public transport users, and cyclists in the city of Rotterdam. The population includes the inhabitants, visitors, and passers by within the city-inhabited cordon (see Figure 2). Most of the quantitative analysis is based on the number of trips per mode of transport in the targeted area. A breakdown of the sources of data for each mode of transport is listed in the following paragraphs. Secondly, we identified key experts on transport that emerged during the quantitative data analysis stage to conduct in-depth interviews.
As a result of our exhaustive research, we succeeded in approaching 25 data sources, including personal contacts. We stopped after 25 data sources, because we reached a saturation of information and triangulation. The final data sources and reports used in this research are listed below:
Public transport trips
Gathered by the RET (Rotterdam’s leading public transport operator) through counting the personalized transportation card (OV card) check-ins per day.
Cars and bikes trips
Data collected from the municipality, based on annual visual counts performed with the help of different organizations (e.g., TNO, CBS). The counts take place annually at the same time and locations through camera-based license checking or counting.
Infrastructure data
The data used for the infrastructure connections (e.g., the number of electric vehicle charging spots) come from online shared reports from the municipality.
The research excluded any survey-based datasets. It used different municipality and RET reports to confirm the validity, reliability, and sample representativeness and to back up the quantitative values extensively. Furthermore, due to COVID-19, all datasets for the year 2020 were excluded, and estimated averages were made based on previous years.
Interviews and qualitative data
As for the interview sampling, out of 20 key experts who were approached, the final sample of interviewees included the following eight respondents (Table 1):
This study’s strength comes from its mixed-method approach, which depends on qualitative interviews and official reports and shows real-time data that mirror the users’ behavior. Furthermore, the data were acquired from in-depth, reliable sources for both the qualitative (highly specialized and profoundly involved set of experts) and the quantitative (governmental datasets and transport companies’ real-time counts). Therefore, this study uses a wide-ranging, in-depth, comprehensive explanatory approach. Additional sources of information can be found in the supplemntary materials section.
3.2. Limitations of the Study
The research incorporated different limitations that worked on varying its limit of reliability. It is imperative to work on improving these limitations for any future research. The following points highlight the substantial limitations of the study:
- Not all alternative means of transport are included (e.g., shared vehicles, electric bikes, and walking) due to a shortage of data and time limitations.
- The study did not include any of the land use, the socio-political, or the political-economic aspects that greatly affect the applications of the LEZ.
- Most available data are in Dutch, and extra time and effort were required to translate and classify the documents.
- Datasets using different modes do not follow for a unified measurement condition. Cars are visually counted once a year; bikes are limited to specific locations; public transport does not have detailed data per station for all modes.
- The datasets from the municipality were not openly shared with the research community. Furthermore, their existing evaluation reports are based on different sources, including ‘1000 samples’ surveys (which cannot be significant for a city of 651,446 inhabitants). Hence, this was excluded from this research.
- There are no vehicles or emissions-monitoring stations specified for the LEZ, with continuous counting. The TNO had to perform a counting week to collect data for the municipality’s 2016 report [33].
- Data on 2020 were expected to have an impact, but due to COVID-19, transport usage was affected. Thus, any dataset in 2020 was replaced by estimated averages.
Nevertheless, these limitations do not lessen this research’s validity, as each dataset used had the same consistent measuring method over the ten years.
4. Results
This section introduces an in-depth analysis of the statistical results, interviews, and literature reviews on the selected indicators to answer the research questions. For most of the graphs, data for 2020 were estimated based on the average of the previous years. This is for statistical reasons due to the change in transport usage that occurred during the COVID-19 lockdowns.
4.1. Trends in Rotterdam’s Passenger Transport Network
Rotterdam is characterized by having a robust public transport system. It covers the city with various buses, trams, and metro lines [70]. In addition, the city has a strong bike network and a growing electric vehicle infrastructure [71,72].
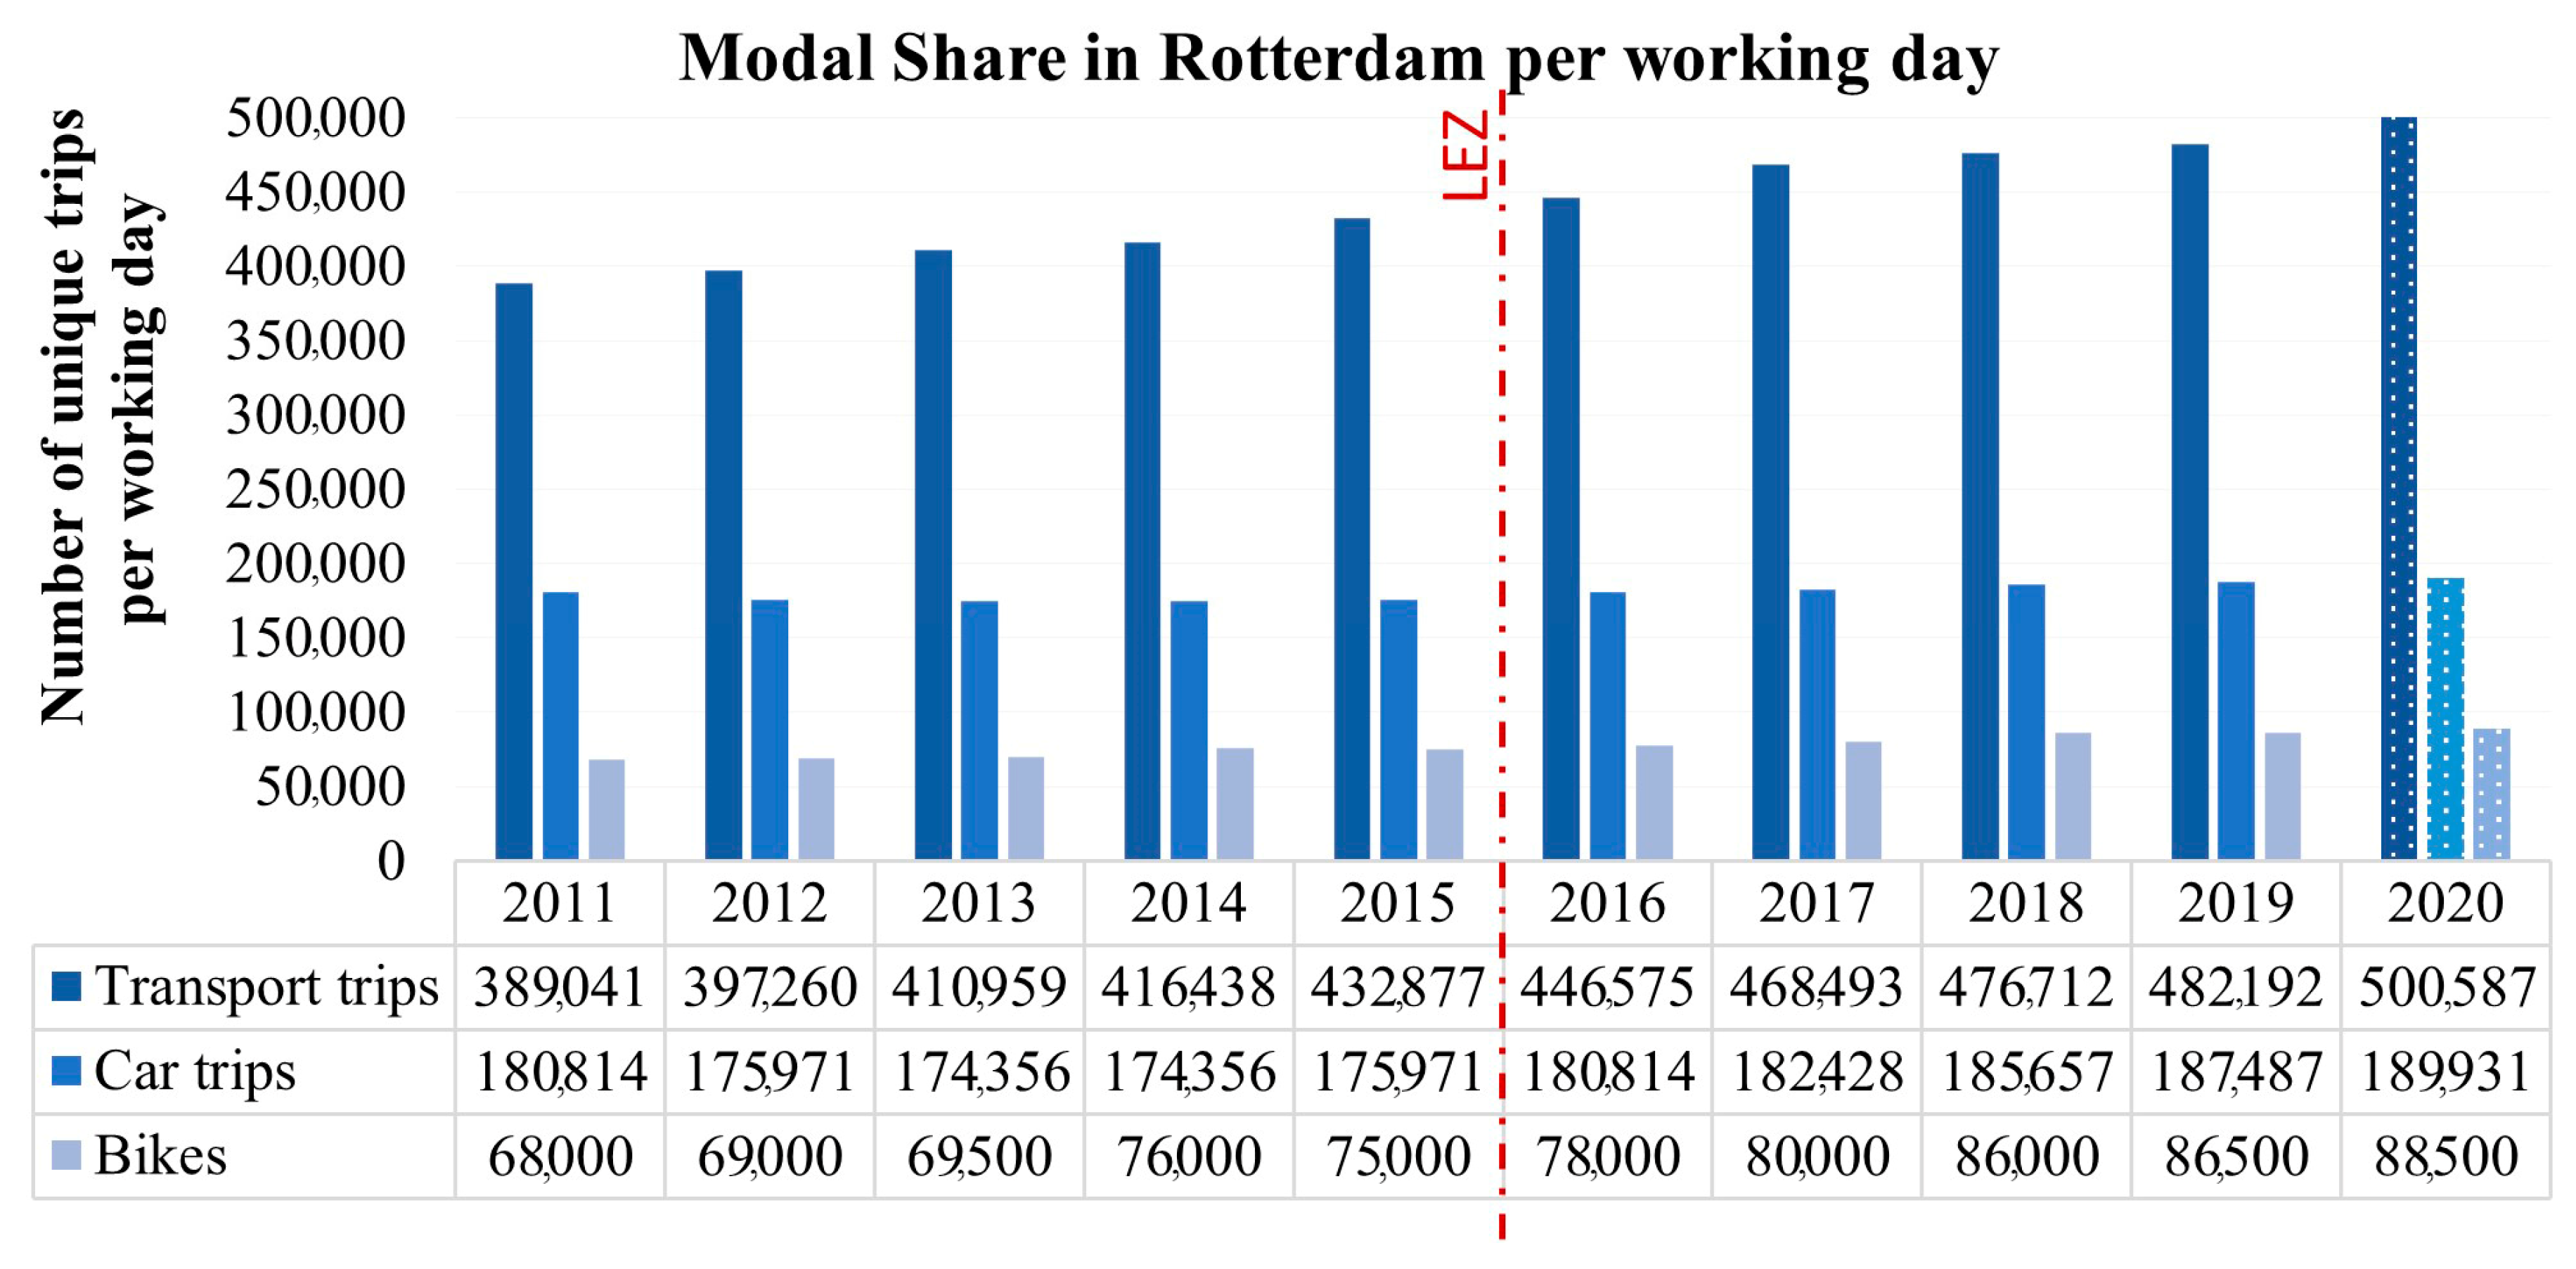
Through counting and comparing the number of daily public transport check-ins, car passages in specific main streets, and bike crossings in specific important locations, data in Figure 6 show a slight gradual increase in the overall transport network usage from 2011 to 2020. By performing an independent t-test comparison for each mode of transport between the two periods before (2011–2015) and after (2016–2020) the LEZ’s introduction, no significant variation was spotted [73].
It is important to note that no direct comparison between the modes can be deducted. Only the timeline trends are significant to compare. Due to the variety of data sources and collection techniques, each mode of transport is unique in its area and scope representation. (a) Public transport includes the overall Rotterdam (RET coverage) area [46]. (b) Cars and bike passages include specific locations surrounding the city-inhabited cordon. Furthermore, car trips assume only one user per car for easier statistical analysis, as there are no data on the number of passengers per car in Rotterdam. This assumption is based on official policy documents [74].
To understand this, Rotterdam’s experts explained that there is a constant natural increase in the entire network usage, and it is not linked to the LEZ. The number of banned passenger cars was mainly not large enough to significantly impact the city’s modal share. Expert 2 indicated that, “Of course, some of the users might switch to the public transport. But I do not think there is a big difference since there were relatively few people that were not allowed to enter the zone.” Thus, the network cannot yet be affected on a large scale. Therefore, to obtain a more in-depth (LEZ related) overview on a smaller scale, the following indicators provide comparisons on the usage of polluting passenger cars and Metro line check-ins, inside and outside the LEZ.
4.1.1. Passenger Car Trips
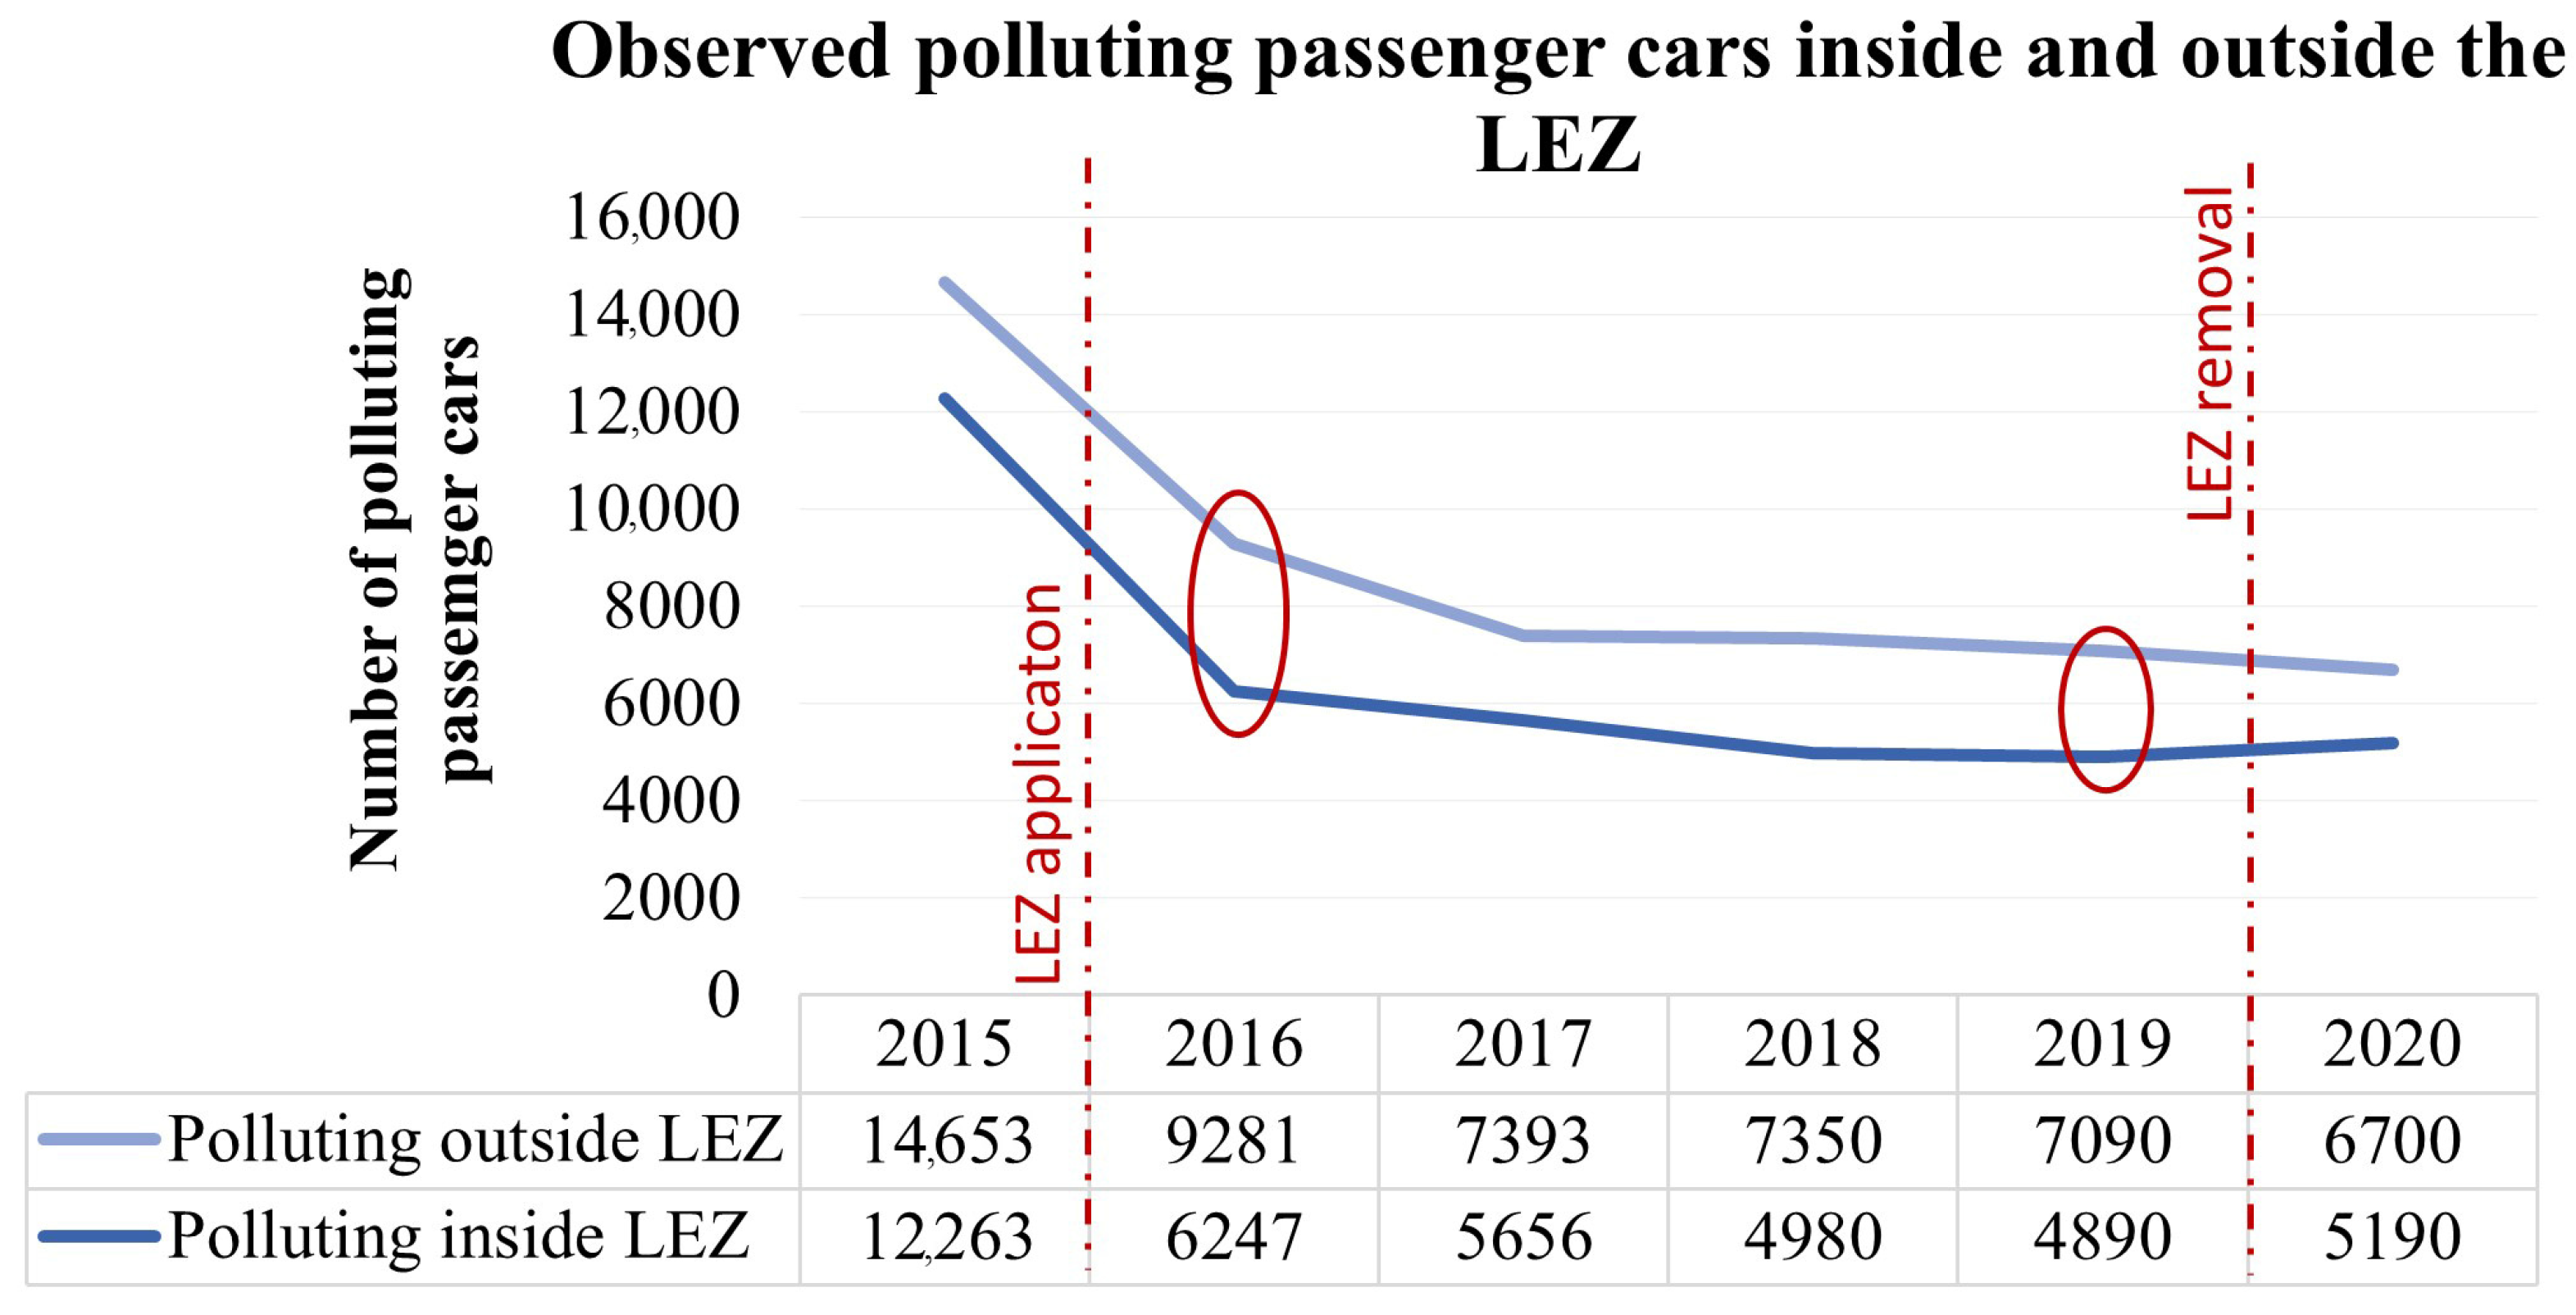
An expected effect for the LEZ is substituting the road fleet with a cleaner one [18]. Expert 5 argued that, “The policy had nothing to do with the number of cars. It had more to do with its age and emission’s quality”. Consequently, any LEZ evaluation must focus on the type of cars that enter the LEZ rather than on the overall fleet count.
Figure 7 shows the result of the LEZ evaluation fleet scan. From 2016 to 2017, the number of polluting cars entering the LEZ decreased to around 50% compared to 2015. The same decrease rate also applies to outside of the LEZ, yet the number of polluting cars outside of the LEZ is relatively higher [49]. These figures are based on the LEZ evaluation fleet scan, performed by the municipality in cooperation with the TNO. Three annual fleet scans were applied in six different location in Rotterdam (two outside the LEZ and four inside LEZ), for which polluting cars are identified based on their euro class and type of engine. Within the dataset, diesel cars E0-E3 and Benzene cars E0 are counted [75].
Expert 8 provides an explanation for the figure by indicating that “… E0-E3 cars owners are divided into three main categories, 1. Visitors from outside the city, 2. People who cannot afford a new car, and 3. Old-timer collectors. When the policy was first applied in 2016, the first category stopped entering the city, while the second category made use of the incentive scheme to replace their car, and the third category parked their car outside the LEZ area to be able to move it when needed”. The expert’s explanation was confirmed by the way in which the number of polluting cars within the LEZ did not increase significantly after the policy was removed. In 2020, only old-timer collectors were able to return their cars within the ring road boundaries, as those who used the incentive scheme had already given up their cars, and visitors did not enter the city due to COVID restrictions at the time. Further studies confirmed that the LEZ was partially the reason for the decrease in Rotterdam’s registered old light diesel vehicles [31], as “the number of old light diesel vehicles has almost halved… compared to 2016” [26].
4.1.2. Metro-Line Trips
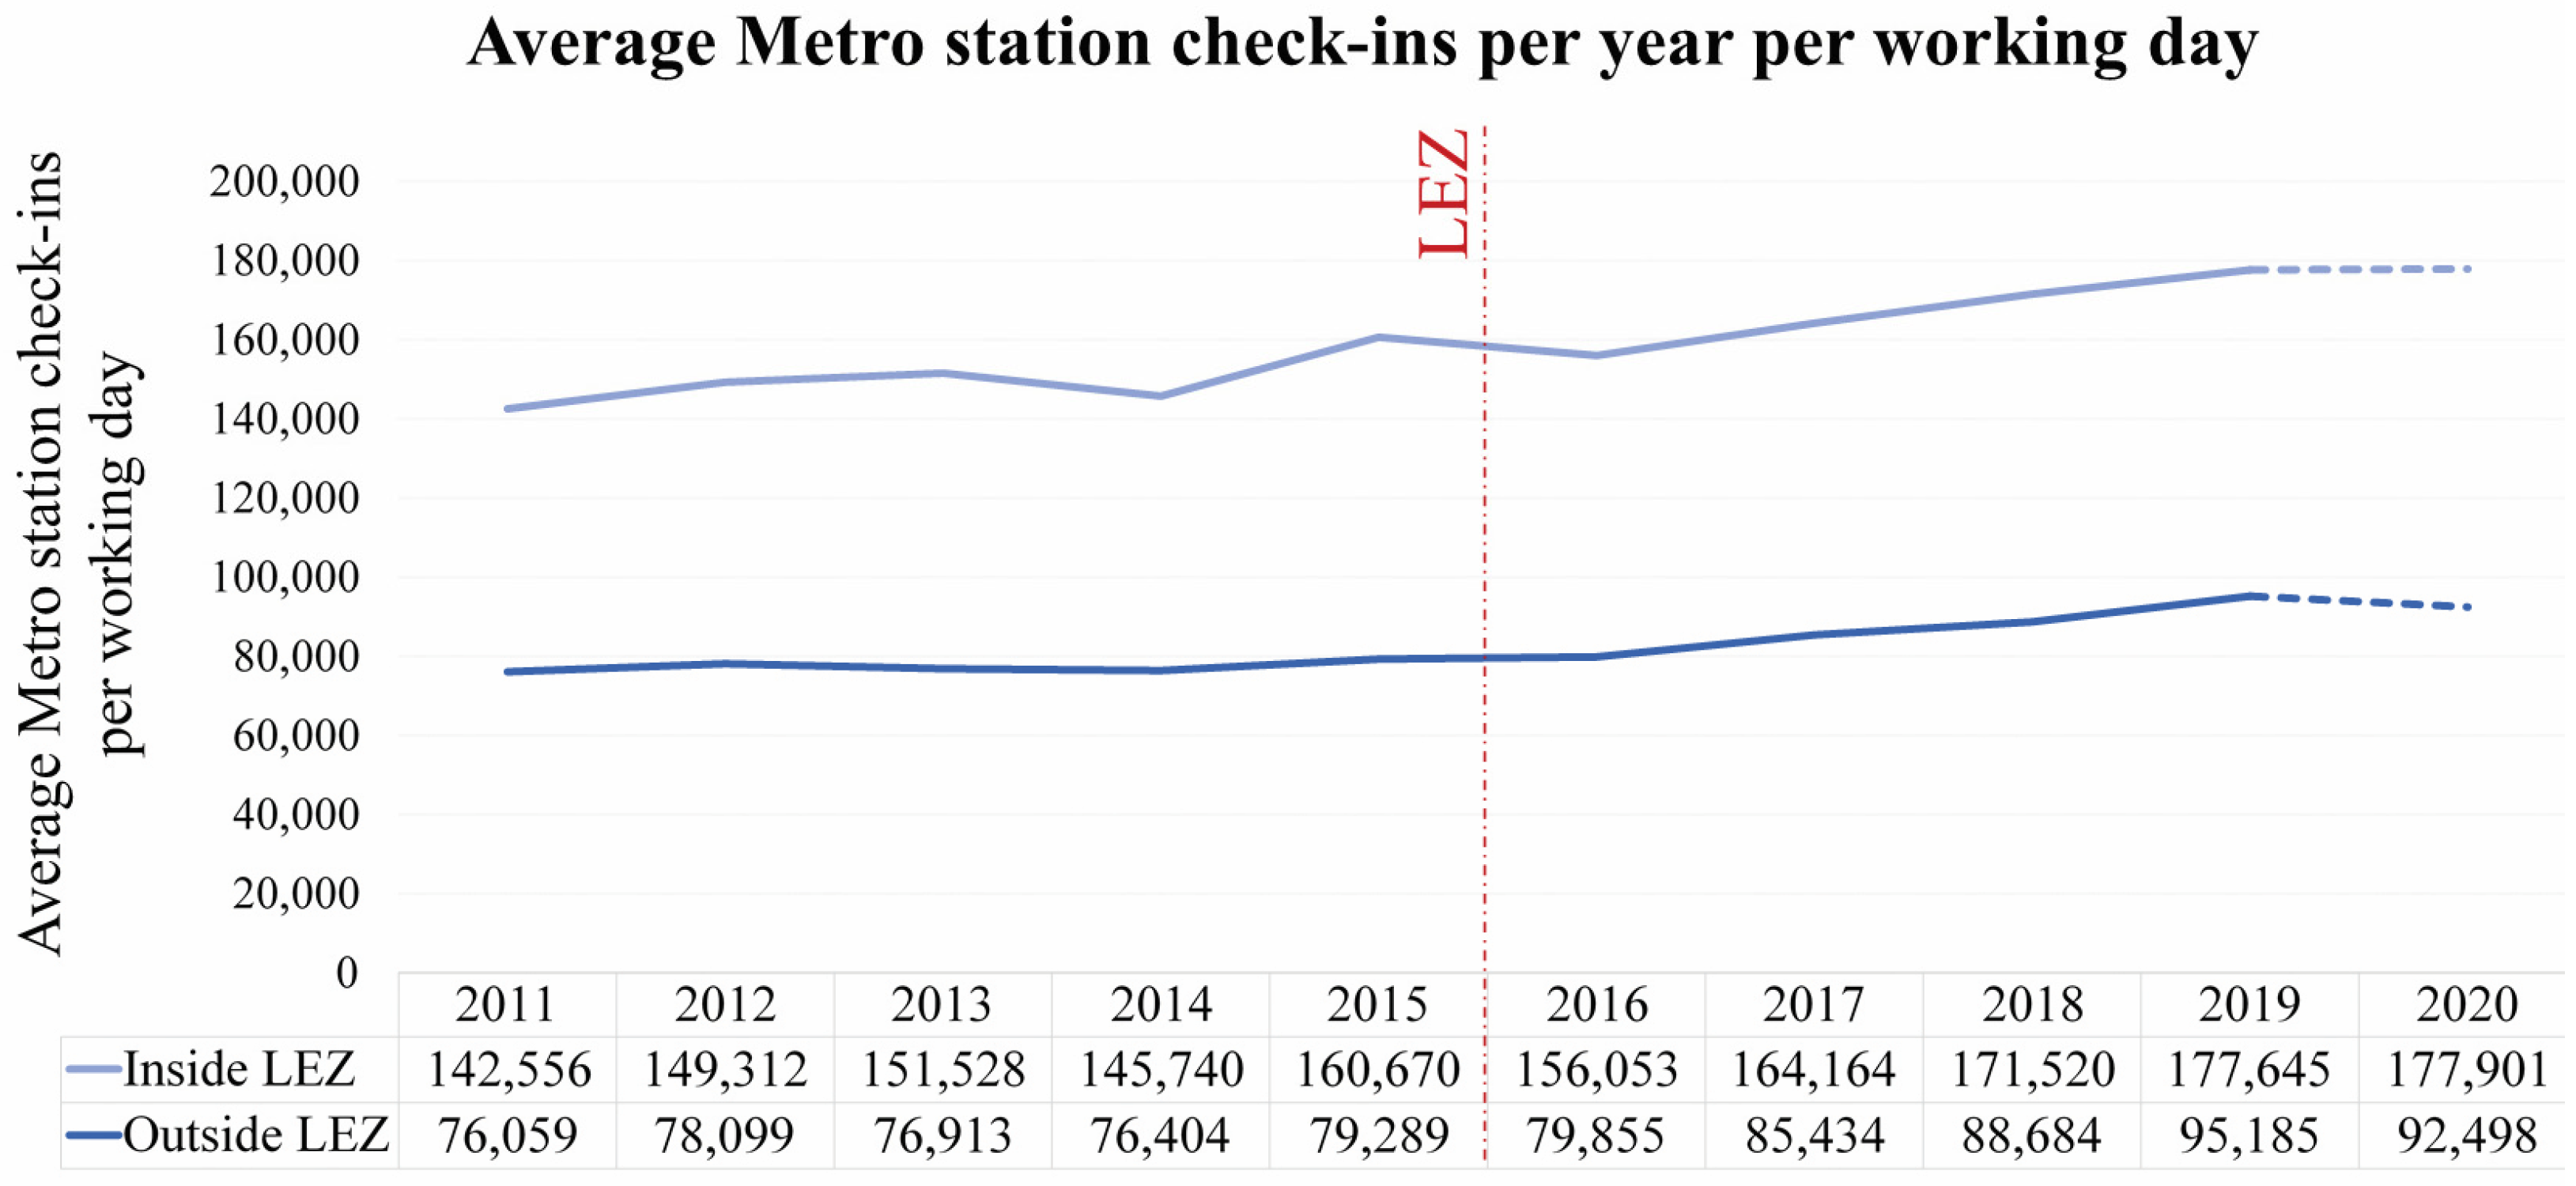
Passenger count data proved the Metro line’s dominance over trams and buses, among the public transport modes. The Metro is was used almost as much as buses and trams together [45]. In this regard, Expert 3 suggested that in Rotterdam, “The only good alternative for the car is the public transport, especially the Metro...”. Therefore, this paper narrowed down the results to include only the usage of the 14 Metro stations inside the LEZ and similarly 14 outside the LEZ boundaries, but with a park-and-ride facility (see Figure 2).
Figure 8 shows a gradual increase in the overall usage of the Metro, in which almost double the number of daily trips were made within the LEZ boundaries. However, as explained by Expert 8, “…this can be related to the land-use distribution and not to the private vehicles banning”.
In addition, statistical tests (Pearson’s correlation) proved a positive correlation between the number of trips in the two areas after 2016, which denotes an overall network usage increase, which is not related to the LEZ [74].
4.2. LEZ’s Supporting Policies
Based on the policy documents and interviews, the most effective, directly related, and linked measures that supported the LEZ’s application in Rotterdam were the scrappage scheme, increasing electric vehicles’ infrastructure, and providing extra park-and-ride facilities. Hence, it is crucial to study these measures as a basis for any LEZ evaluation.
4.2.1. The Scrappage Scheme
The scrappage scheme is an incentive program intended to support citizens in replacing their old cars. Its budget was allocated to partially fund the LEZ policy and fleet cleaning ([26,48] and Expert 1). For this purpose, the scheme was described by all the experts as a very successful measure.
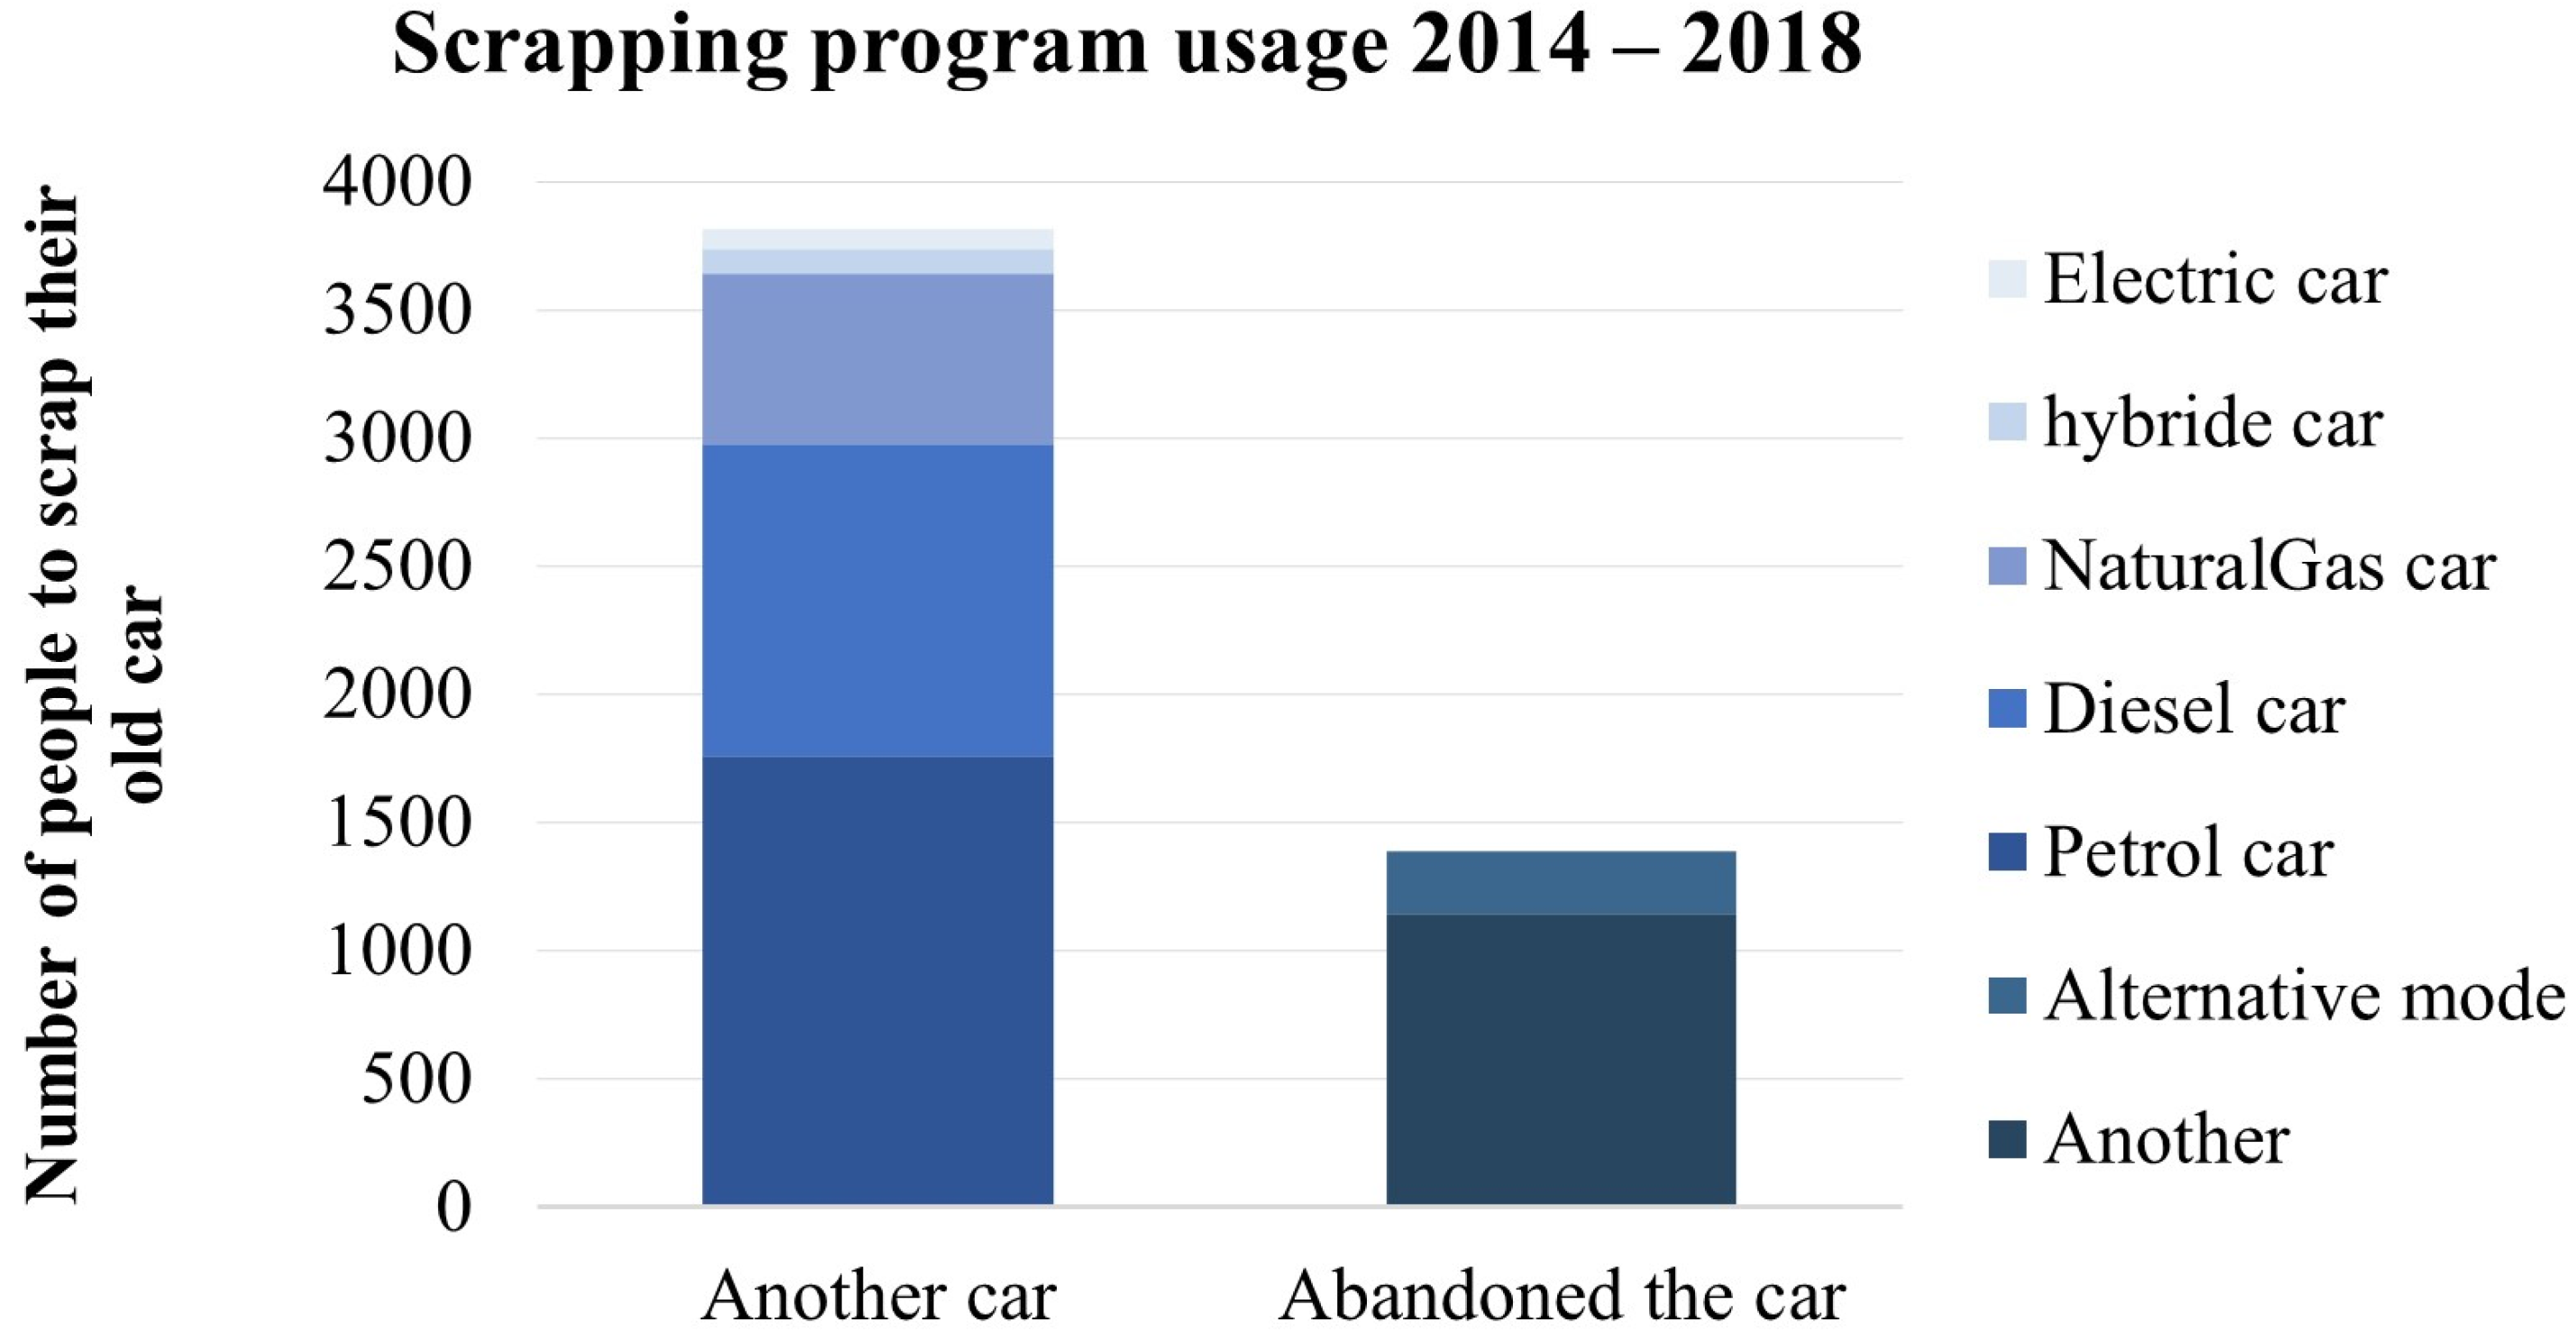
Over its years of application, the scheme was used by around 4970 users [34,76]. Figure 9 illustrates the results of the program usage survey. The figure was built based on a survey performed by the municipality, in which, out of 4970 program users, 4771 respondents were approached, out of 1952 who completed the survey. This makes the sample representative, since almost 40% of the users responded [34,76]. The survey shows that 72% of the users spent money on a new car. A total of 56% of the new car buyers bought an advanced benzene or diesel car, 13% purchased a natural gas one, and only 3% switched to an electric or hybrid. Yet out of the overall program users, only 5% shifted to an alternative transport mode.
However, discussions suggested that if the city’s target is to reduce the inner-city traffic or reach a zero-emission fleet, the program is not helpful. Four of the experts agreed that it is essential that the scheme regulate the incentive-handling direction to ensure that highly polluting cars are not replaced by less polluting ones instead of fully clean vehicles. Expert 6 clarified that, “The government should focus on public transport rather than helping people buy new cars. And if they provided incentives, they should focus on people buying small electric cars instead of the large luxury ones”. Experts also suggested that future developments may only support the scrappage scheme if adjusted to achieve future zero-emission mobility and fewer traffic congestions.
4.2.2. Increasing the Electric Vehicle’s Infrastructure
Within both the Air Quality Agenda and the Traffic Plan, Rotterdam promised to provide more local EV charging points along with the LEZ and the scrappage scheme [41,43,69,72]. The validity of this plan was assured by experts 3 and 7, who explained that it is easier for people to switch to an electric car (less polluting) if they can afford it and can easily find an implemented infrastructure for charging.
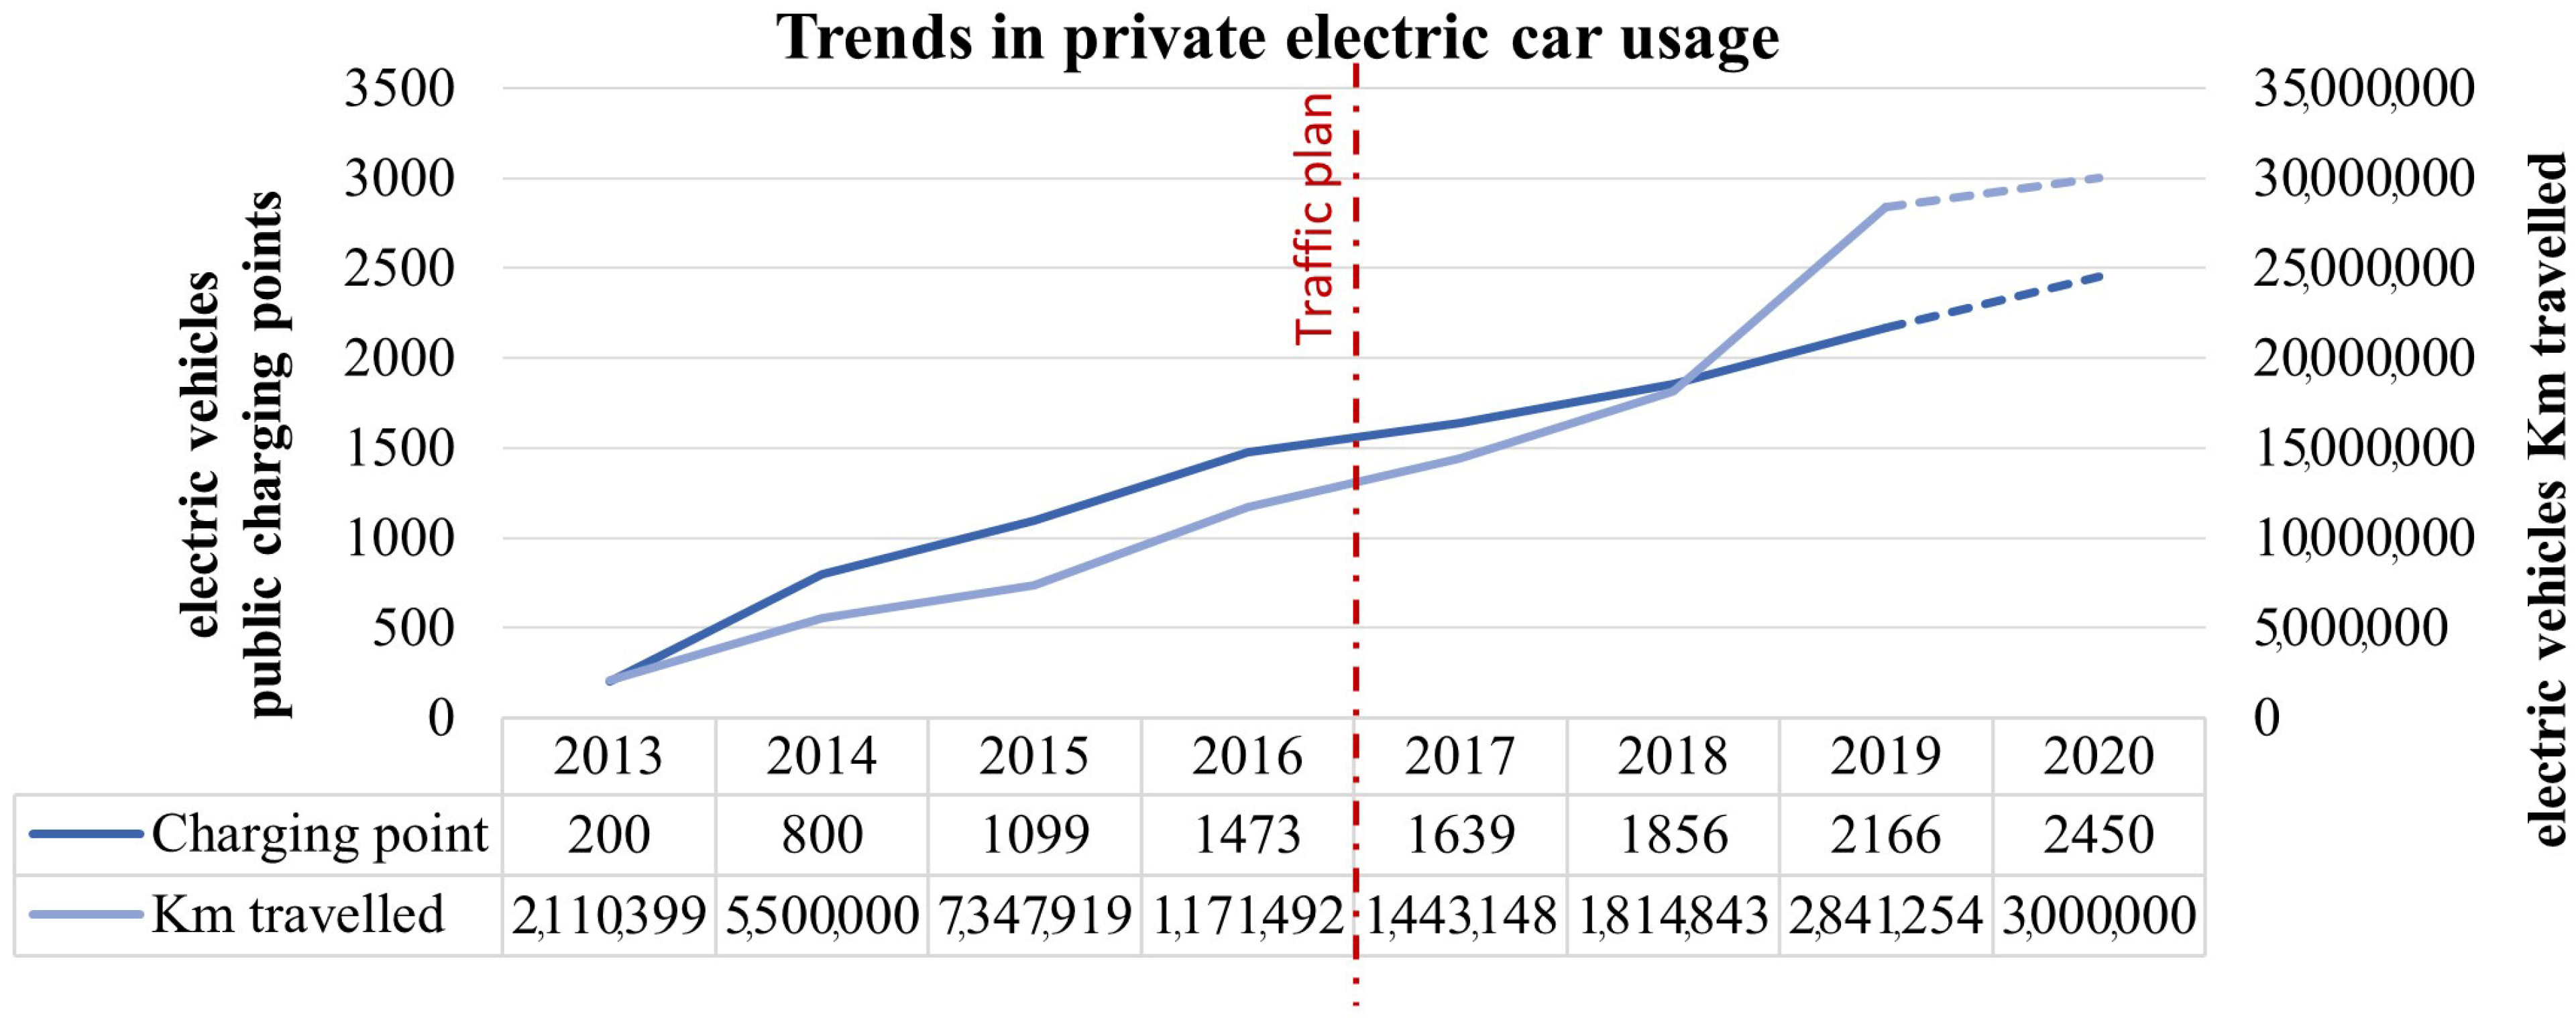
Figure 10 shows an annual increase in EV usage in parallel with the provided charging infrastructure. With an average addition of 250–300 charging points per year, the graph shows how the number of km traveled increases with an average rate of 3 million km per year. The most significant increase was between 2018 and 2019, when the number of km traveled increased by 10 million km.
Furthermore, the independent sample t-test showed significant variation for the two periods before and after the traffic plan implementation (2017) for both the EV km and charging points. Together with a 95% correlation found between the two lines after 2017, this variation proves a significant influence for the infrastructure provision on electric cars’ usage. However, the increase in electric car use correlates with Rotterdam’s overall traffic growth [74].
Experts in that regard doubted the efficiency of electric cars as a sustainable replacement. On the one hand, a majority discussed traffic congestion, the embodied energy, and the high cost of EVs. On the other hand, some of them reviewed their expectations for a more advanced, low-cost future. A less polluting and smaller version might be used, and cities must be ready to accommodate this [77]. Meanwhile, expert 6 debated that even with promising future technology, “EVs make sense only if it focuses on small E-cars and not the big ones”.
4.2.3. The Park-and-Ride System
The sufficient provision of a P+R system was included in the Air Quality Agenda and the Traffic plan. The P+R was expected to increase the Metro check-ins and decrease inner-city traffic. As indicated by Expert 1, on deciding on the LEZ boundaries, decisionmakers chose to link it with the “Krallingse zoom” Metro P+R directly [44,48].
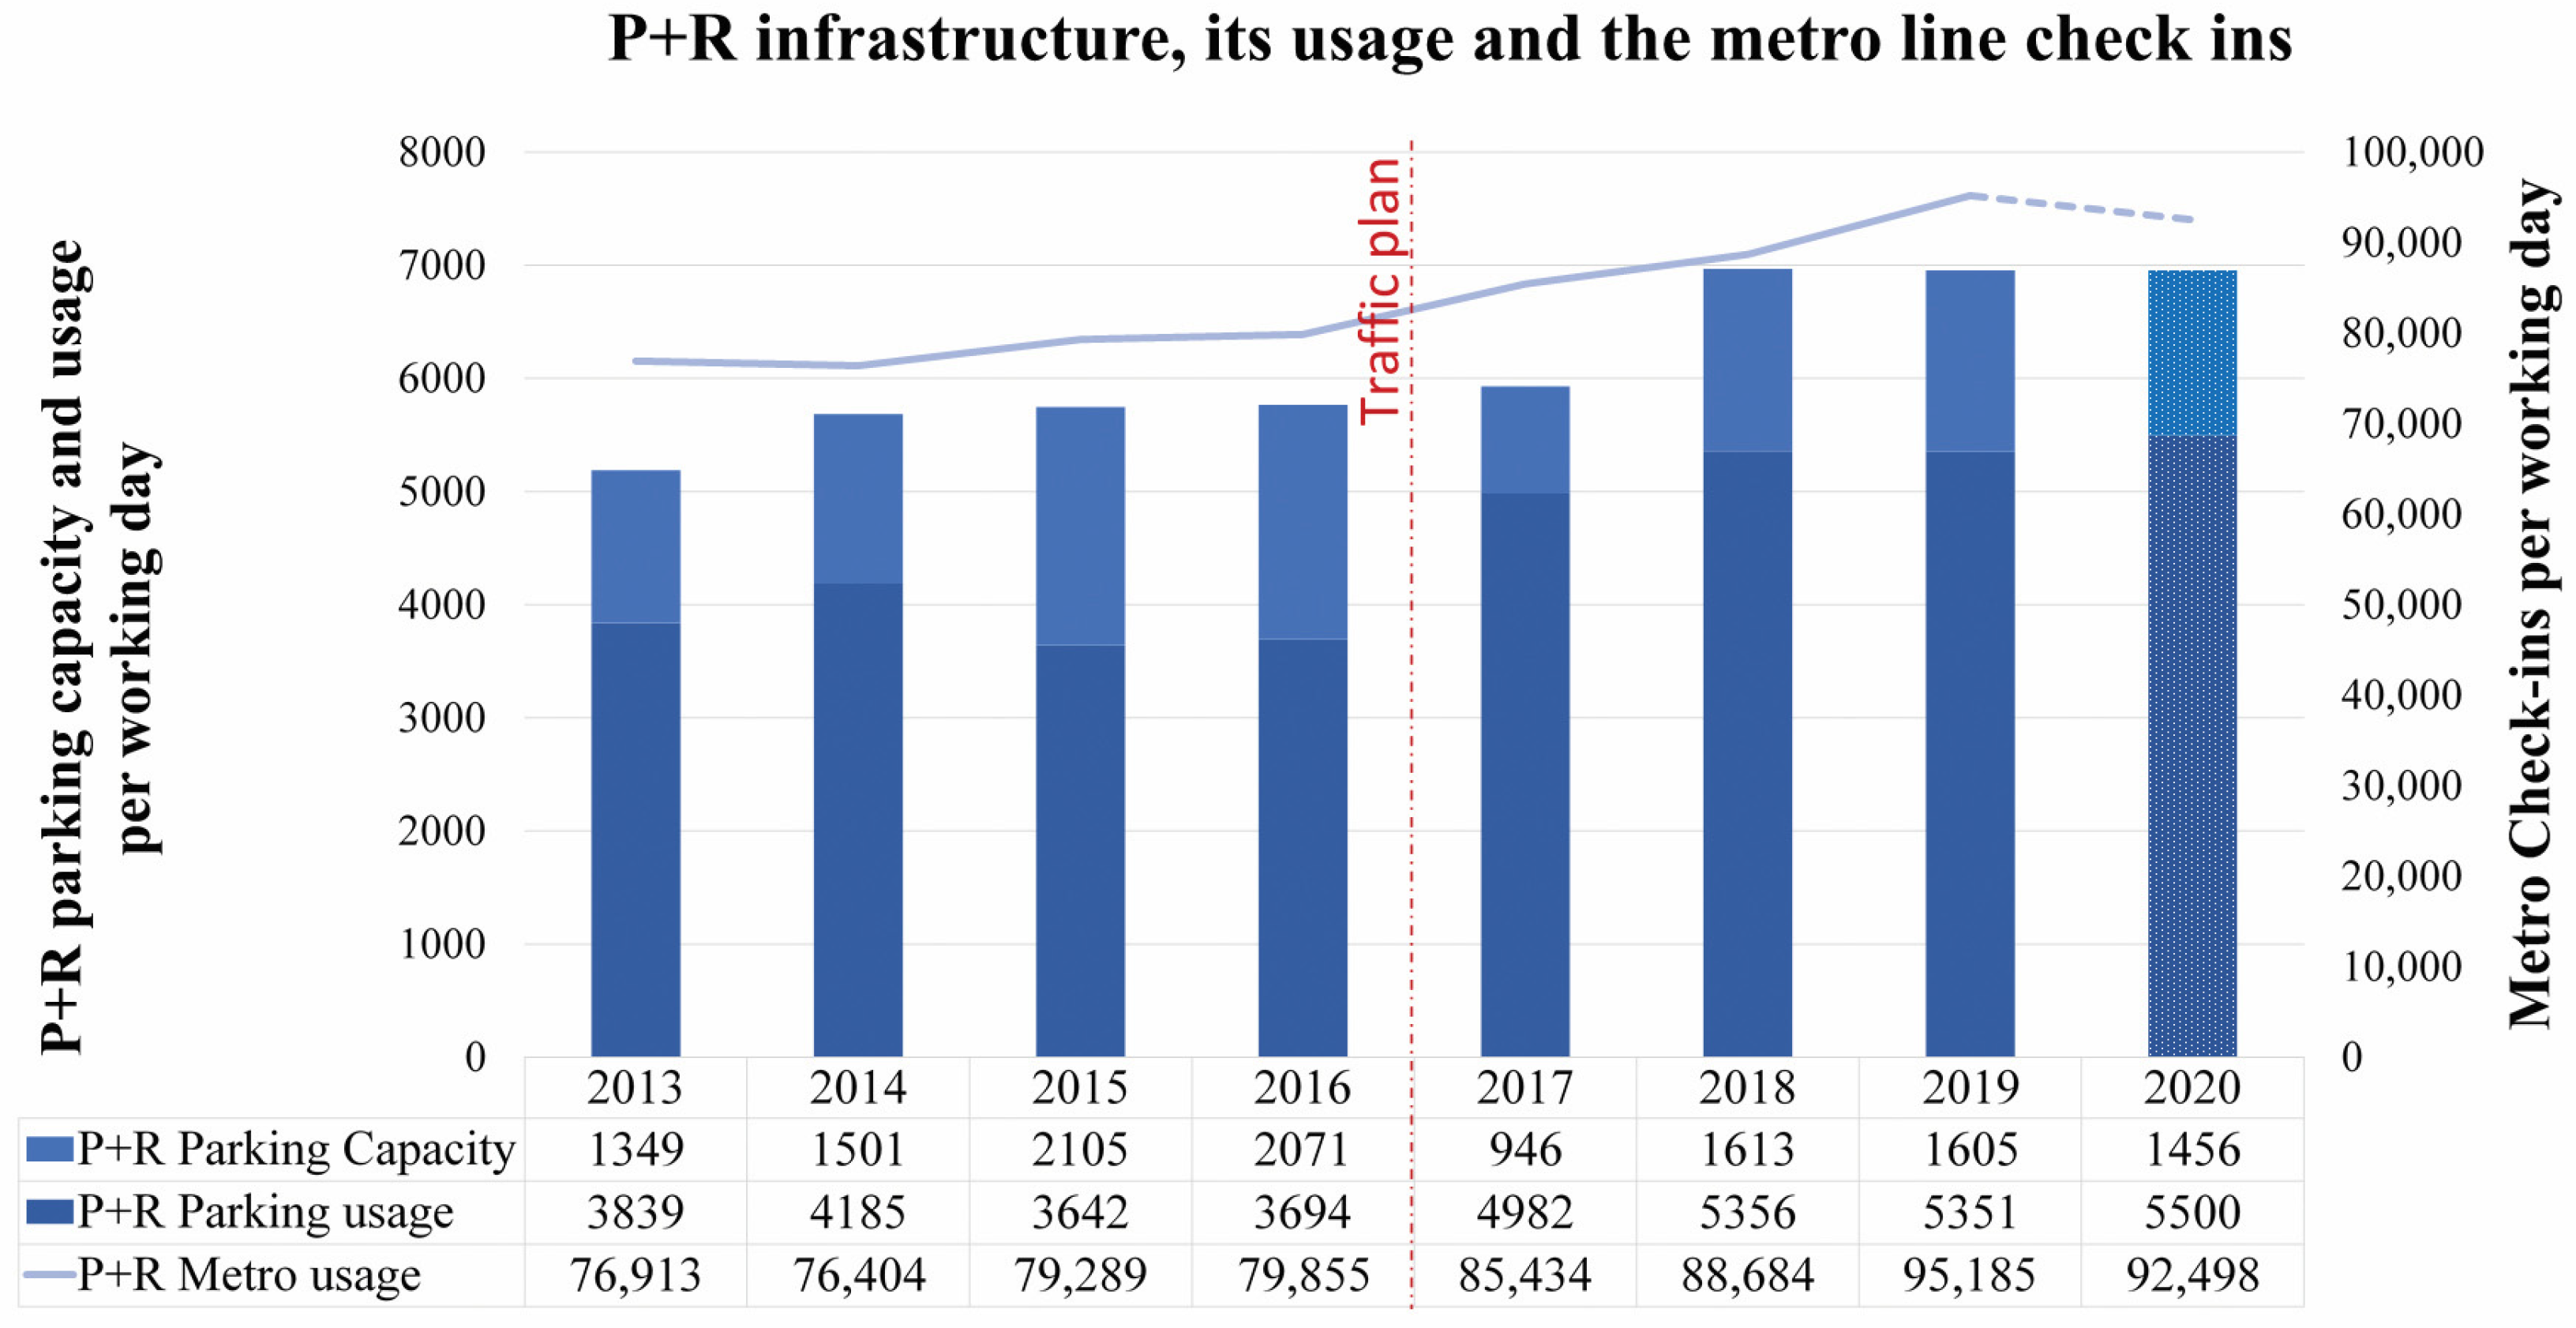
Through counting the P+R spots’ capacity and occupancy in the 14 Metro stations outside the LEZ, the data in Figure 11 show their relationship to the number of Metro line check-ins inside the LEZ (see Figure 2).
On performing an independent sample t-test for these datasets, no significant variation was found between the two periods before and after the traffic plan application in 2017. However, for the period after 2017, a 95% correlation was found between the usage of the P+R and the provided spots. At the same time, no correlation was found between the P+R and the Metro check-ins.
Regarding the P+R, four out of the eight experts doubted its success in shifting mobility patterns, even when linked to the LEZ. They stated that if the increase in P+R spots is not accompanied by a decrease in the inner-city parking spots, the facility might be used as extra parking that attracts more car users. This same idea was discussed in 2013 in a study that viewed all the P+R usage in Rotterdam [52]. Nonetheless, the municipality experts explained that “… to start reducing inner-city parking and traffic, it is important to provide the P+R in advance”. Thus, they expect the facility to be used appropriately after finalizing the inner-city plan, which incorporates reducing the city center’s parking spots, as it is a multidirectional action.
5. Discussion
Within the transition towards a zero-/low-emission future, policies promoting low-emission traffic are included in national and local agendas. Therefore, the LEZ policy measure is brought into different plans as one of the simple and practical actions to help achieve the required air quality levels and gradually guide the transition [43]. Nevertheless, it is crucial to understand that transport policies’ success depends on their inclusion in a designated comprehensive package rather than being addressed as stand-alone regulations [41,78].
This paper has given deep insights into the status of usage of the transport modes in Rotterdam. It shows the application of the LEZ policy and the ongoing traffic measures as a reference point to assess the city’s movement towards zero-/low-emission transport.
5.1. Summary of the Main Findings
The research findings have been narrowed to include (1) passenger car counts and types, (2) Metro line check-ins, and (3) electric vehicles’ km traveled to represent alternative modes of transport. Futher included are (1) the scrappage scheme, (2) the electric vehicles’ charging points, and (3) the park-and-ride system as representative of policy packaging. The following are the main research findings:
- As a hub for different transport modes, Rotterdam is characterized by a robust yet increasingly busy passenger transport network. Public transport is at its maximum capacity, and the city still identifies as car-oriented. Without prior improvements in the public transport capacity, on applying LEZ regulations on passenger cars, the owners of polluting cars did not shift their modal choices. The majority avoided entering the banned area or used the scrappage scheme to buy an advanced diesel/benzene car.
- The LEZ can be considered a fast solution that improves air quality, and it is successful in that manner [31,49]. Yet, Rotterdam’s scope of the passenger cars’ ban (2016–2020) was too small to have a statistically significant impact on the alternative transport modes. Consequently, the results highlighted Rotterdam’s urge to consider decreasing its car dependency to guarantee less traffic congestion in the future. With the passenger car ban being removed in 2020 (instead of widening its range), even the increasing traffic is no longer guaranteed to be clean.
- Rotterdam is moving slowly but steadily towards the electrification of passenger cars. The increase in electric car usage is significantly linked to the rise in the electric charging infrastructure and an overall rise in traffic, not to the incentives program or the LEZ. This link recommends that if the city wants to keep following a car-oriented vision, there must be rigid encouragement towards zero-/low-emission traffic and smaller vehicle sizes for less congestion. Furthermore, proper advertisements and the provision of electric mobility alternatives should be communicated early and directly linked to policy measures such as the LEZ and the scrappage scheme.
- Unfortunately, P+R parking is only used as extra parking in the city, where the provided spots act as traffic feeders [52]. The research results suggest that there must be a better management and monitoring system for such parking spots. The additional P+R parking spots should be directly inserted as a replacement for inner-city parking or attached to stricter parking regulations.
- Overall, the results showed various policies and planning fluctuation. The applied measures are somewhat indifferent and inconsistent and act in favor of car use. Whether it is the LEZ, the P+R, the scrappage scheme, or support for EVs, there is no clear and coherent vision for Rotterdam’s mobility. On the one hand, car dominance is not guided correctly and is not progressively moving towards zero-emission vehicles (i.e., Rotterdam’s long-term plan). On the other hand, the city is actively working on the narrowing of inner-city streets. It promises a zero-emissions future [44], which cannot be achieved without comprehensive decision-making.
Therefore, for a more resilient future, Rotterdam needs to apply (and communicate with the public) a consistent policy package; this includes long-term solutions to allow for variations in modality and reduce road traffic similar to cities such as Berlin [79] or Madrid [80]. This policy packaging can be achieved by aligning relatively successful measures to achieve the same goal.
5.2. Policy Recommendations
Based on the research results, three main policy recommendations can be addressed to cities that want to institute a LEZ, approach sustainable mobility, and reduce their inner traffic.
- Providing alternative sustainable modes of transport is essential before restricting passenger cars from entering the LEZ for cities to absorb the transition.
- From the start, clear reasons, a consistent strategy, a comprehensive package, and a long-term vision must be provided.
- To support the policy and its related future decision making, continuous monitoring and consistent evaluation regarding each specific measure and its linked accompanying package should be annually guaranteed.
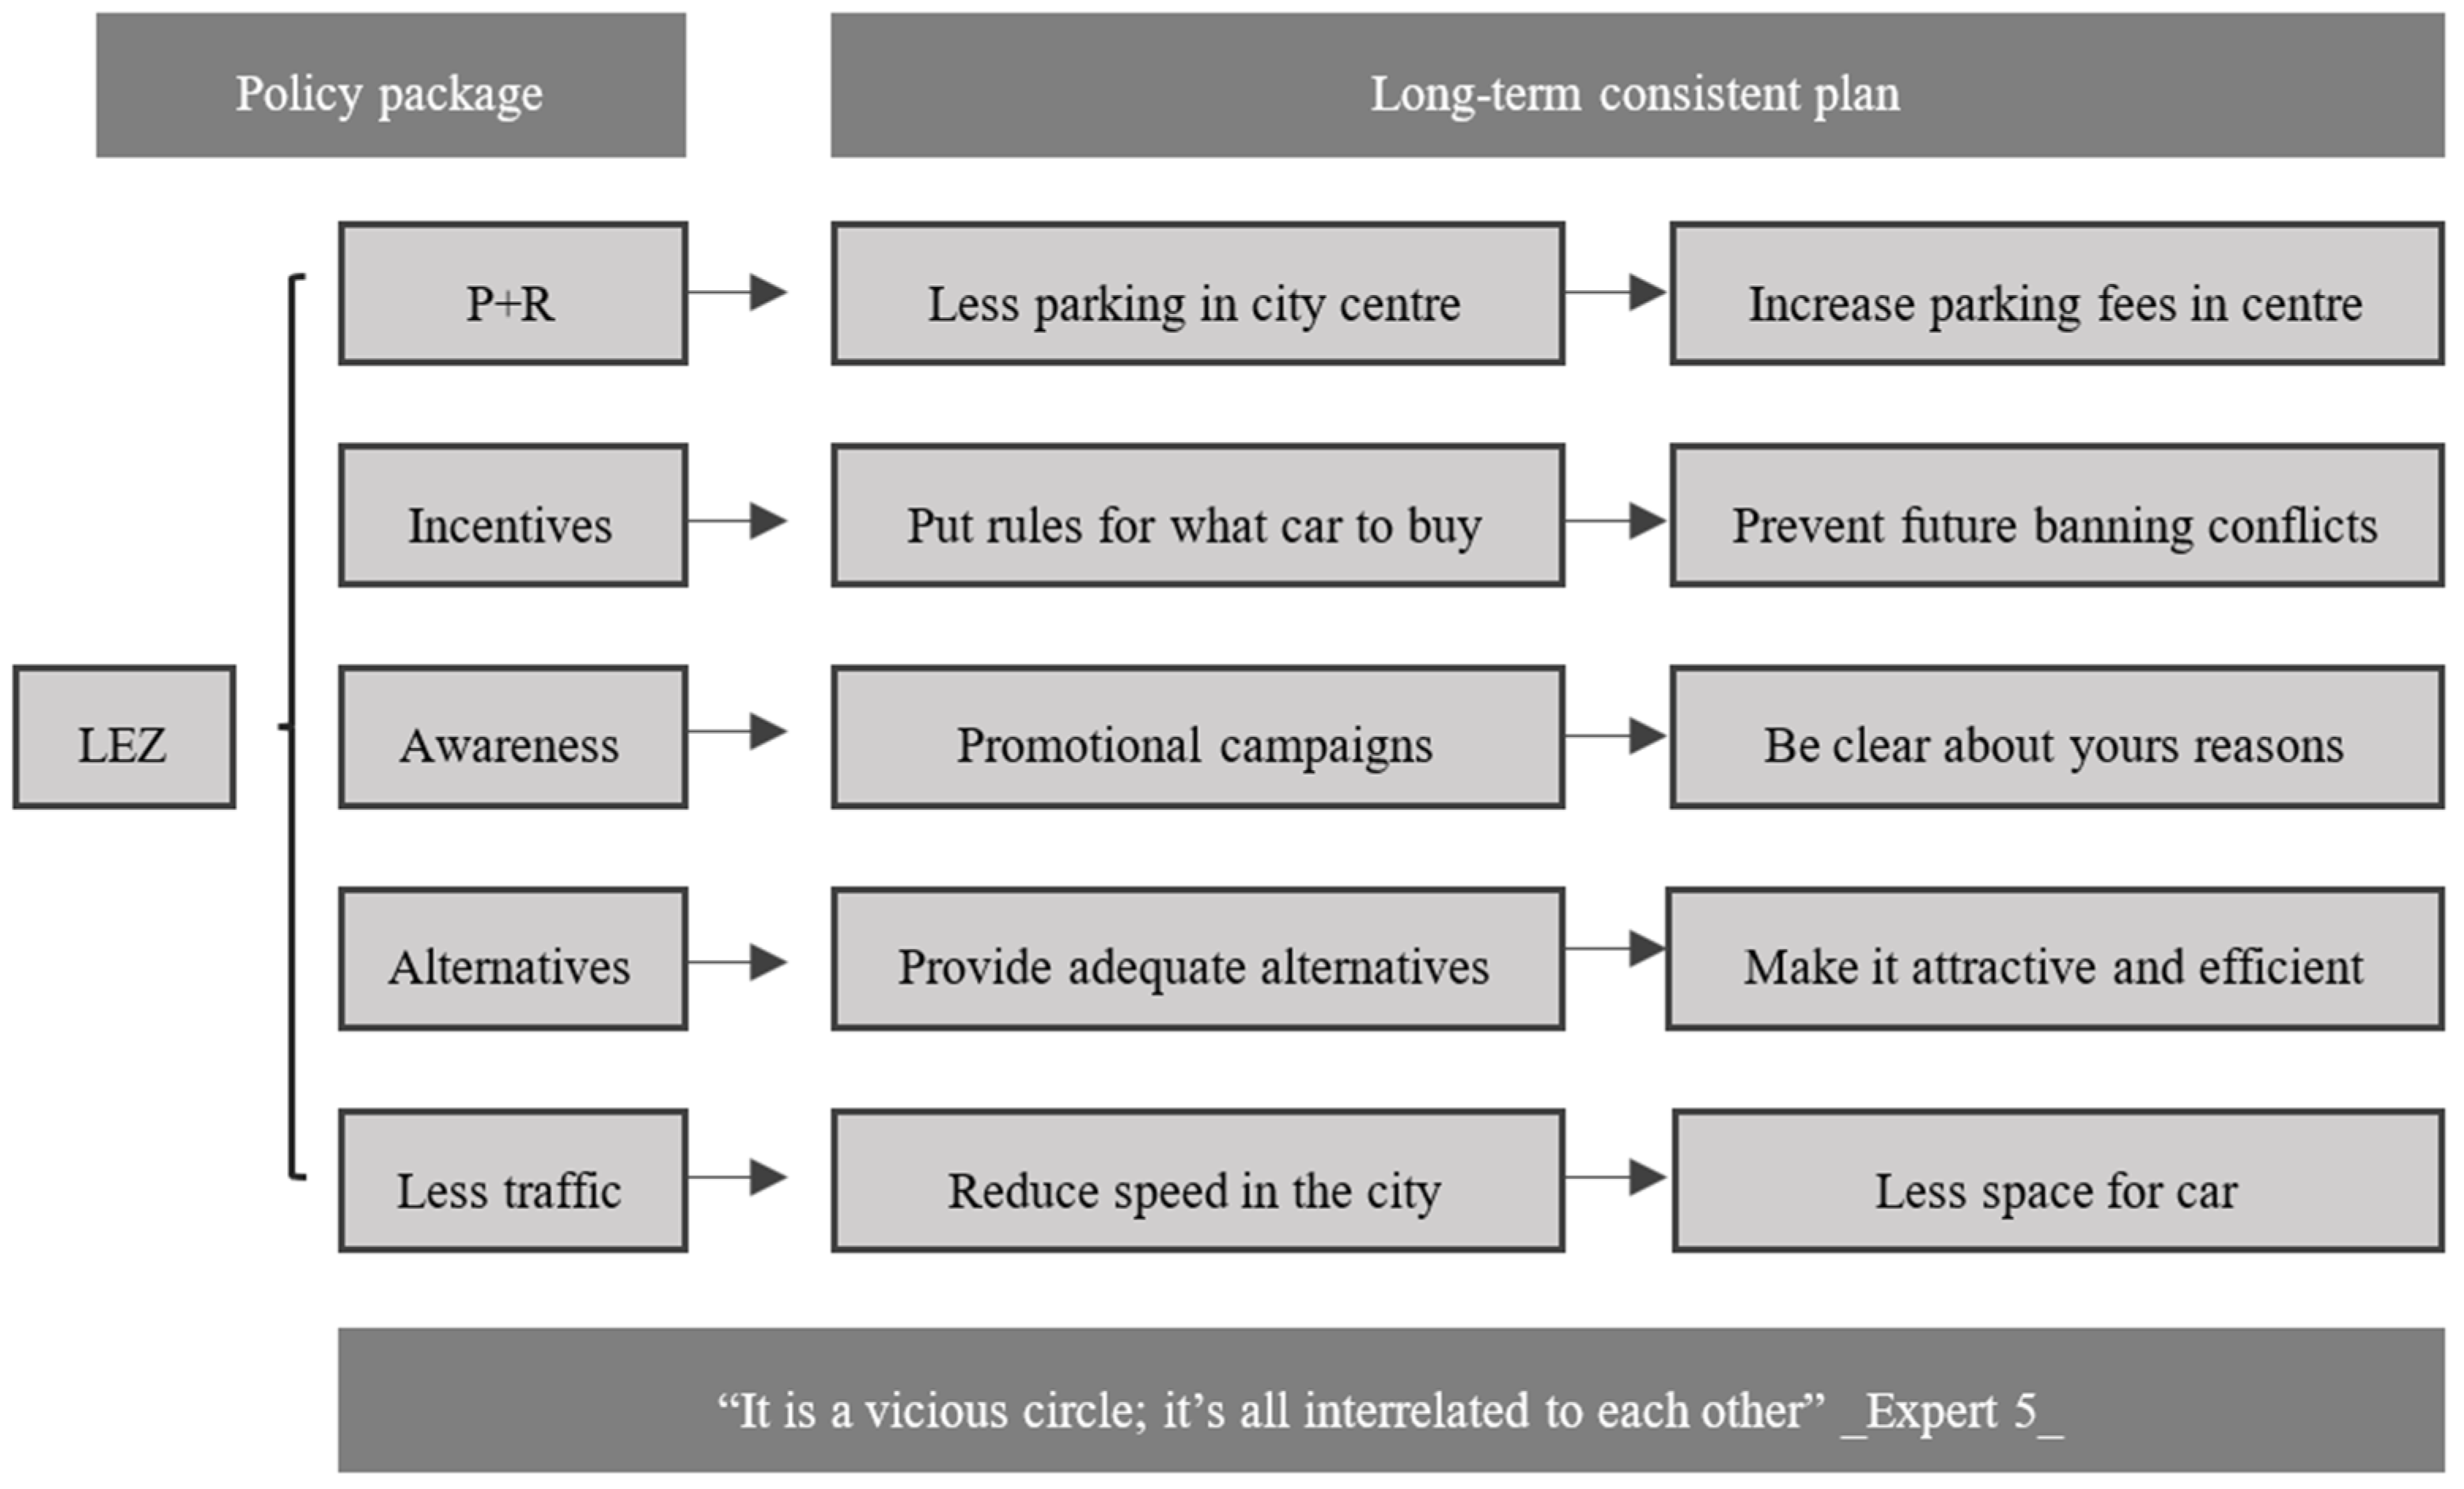
Figure 12 illustrates the recommended package of policy measures or the framework that must be applied to the LEZ policy to achieve a balanced system and prevent conflicts and political issues. To avoid implementation problems, it is advised to start with a context-tailored survey of the available alternatives, the policy’s expected outcome, and the user needs.
5.3. Implications for Future Research
There are local and universal paths that can be followed by future researchers and decisionmakers to cover the gap between the applied traffic policies in theory and practice and to avoid the pitfalls shown in Rotterdam’s traffic planning.
On the local level of Rotterdam, there is a need for future continuous evaluation and monitoring of any applied policy [81]. It can be expected that after removing the LEZ, and with the slow pace of the traffic plan, the city might return to its previous air quality levels. Different cities in Europe are starting to apply LEZs, and this can be an opportunity for Rotterdam citizens to buy old cars from the residents of those cities (the German second-hand car market has been open for years). Thus, an annual traffic evaluation is needed to ensure the city is not backward.
Furthermore, observations and data collection with large sample sizes should be performed for Rotterdam. This data collection includes different surveys and monitoring techniques with a focus on traffic. It should be similar to the existing municipality’s OViN study [68] and the Omnibusenquête survey [82] but with a large enough sample to represent the entire transport network users.
On a global level, researchers should seek a universal, consistent, and unified way, or a data collection matrix, for measuring and evaluating the usage of different modes of transport. All transport trips should be quantified by “the actual usage of vehicles” through the km traveled per person per facility. The current approaches, which use the number of trips per person or the number of visually counted vehicles, are less indicative of environmental and traffic effects. On the one hand, vehicles can include more than one person, and on the other hand, trip counting does not indicate actual use. These are the only ways to compare cities by characterizing the national and international trends and impacts of different policy measures.
Future research can also work on integrating different land-use and mobility policies in one package to help support the implementation of strict measures such as the LEZ. Integration can help to provide alternatives that are based on proximity in addition to mobility alternatives.
6. Conclusions
This research has provided deep insights into the possible integration of Rotterdam’s adopted air quality and traffic policies in the past ten years. As exposed by other research performed on car-dependent cities [75], the results of this research highlight the urgency to consider the decrease in car dependency to guarantee a sense of balance between fewer emissions and congestion in the future. This consideration can be well planned by introducing comprehensive designated low-emission transport policy packages.
Furthermore, the results prove that so far, in Rotterdam, the LEZs, the traffic plan, and the air quality measures (aiming to reduce car usage and realize a low-/zero-emission future) could not significantly influence the city’s modal-share as single measures. Additionally, analyzing different policy measures and the overall city objective prove the aspired targets to be too far away to be achieved.
Several deficiencies in policymaking and communication have led to such conflicts. First, the small number of affected users calls into question the LEZ passenger car restrictions’ efficiency. Second, the weakness in preparations to deal with the transition through the earlier provision of alternatives has made it inevitable for users to retain their original mode of transport. Third, the targets’ inconsistency and the unrealistic timeframes have created room to include extra traffic within the city boundaries. Finally, the absence of continuous monitoring and evidence-based policy evaluations has made it hard for the policy to withstand objections and eventually be put down.
Overall, the research has shown that Rotterdam is still moving very slowly towards sustainable mobility and striving to keep holding the stick from the middle, which is not the best strategy to lead such a critical transition. However, the following recommendations present a new modified comprehensive policy package for cities that intend to start a LEZ to achieve a balanced transport system and prevent conflicts.
Supplementary Materials
The following master thesis of the first author can be downloaded at: https://thesis.eur.nl/pub/56572.
Author Contributions
Conceptualization, M.A.; methodology, M.A., T.A. and S.A.; software, M.A.; validation, M.A., T.A. and S.A.; formal analysis, M.A.; investigation, M.A.; resources, M.A., T.A. and S.A.; data curation, M.A.; writing—original draft preparation, M.A.; writing—review and editing, M.A, T.A. and S.A.; visualization, M.A.; supervision, T.A. and S.A.; project administration, M.A.; funding acquisition, S.A. All authors have read and agreed to the published version of the manuscript.
Funding
This research received no external funding.
Informed Consent Statement
Not applicable.
Data Availability Statement
Data available within the article or its Supplementary Materials.
Acknowledgments
The authors would like to direct their appreciation to the different data collection and transport management organizations in Rotterdam. Thanks to the anonymous interviewees for dedicating their time and sharing their expertise.
Conflicts of Interest
The authors declare no conflict of interest.
References
- European Union. EU ETS Handbook: Climate Action; European Union: Brussels, Belgium, 2015; Available online: https://ec.europa.eu/clima/sites/clima/files/docs/ets_handbook_en.pdf (accessed on 30 July 2020).
- Mazareanu, E. Europe (EU-28): Modal Split of Passenger Transport on Land 2018. 2020. Available online: https://www.statista.com/statistics/449486/europe-eu-28-modal-split-of-passenger-transport-on-land/ (accessed on 30 March 2023).
- RStatista, R.D. EU-28: Road Freight as Share of Total Inland Freight Transport 2005–2018. 2020. Available online: https://www.statista.com/statistics/1068592/eu-road-freight-share-of-inland-transport/#:~:text=The%20share%20of%20road%20transport,estimated%2076.5%20percent%20in%202018 (accessed on 30 August 2021).
- Pietrzak, K.; Pietrzak, O. Environmental Effects of Electromobility in a Sustainable Urban Public Transport. Sustainability 2020, 12, 1052. [Google Scholar] [CrossRef]
- Edenhofer, O.; Pichs-Madruga, R.; Sokona, Y. Summary for policymakers. In Climate Change 2014: Mitigation of Climate Change. Contribution of Working Group III to the Fifth Assessment Report of the Intergovernmental Panel on Climate Change; Cambridge University Press: Cambridge, UK, 2014; Available online: https://www.ipcc.ch/site/assets/uploads/2018/02/ipcc_wg3_ar5_full.pdf (accessed on 24 April 2023).
- IEA. CO₂ Emissions from Fuel Combustion: Overview; International Energy Agency: Paris, France, 2019; Available online: https://webstore.iea.org/download/direct/2505?fileName=CO2_Emissions_from_Fuel_Combustion_2019_Overview.pdf (accessed on 30 July 2020).
- EEA. The European Environment State and Outlook: Knowledge for Transition to a Sustainable Europe; European Environment Agency: Copenhagen, Denmark, 2020; Available online: https://www.eea.europa.eu/publications/soer-2020 (accessed on 24 April 2023).
- Byčenkienė, S.; Khan, A.; Bimbaitė, V. Impact of PM2. 5 and PM10 Emissions on Changes of Their Concentration Levels in Lithuania: A Case Study. Atmosphere 2022, 13, 1793. [Google Scholar] [CrossRef]
- EEA. Greenhouse Gas Emissions from Transport in Europe; European Environment Agency: Copenhagen, Denmark, 2022; Available online: https://www.eea.europa.eu/ims/greenhouse-gas-emissions-from-transport (accessed on 24 April 2023).
- EEA. EEA Report No 5/2021: European Union Emission Inventory Report 1990–2019 under the UNECE Convention on Long-Range Transboundary Air Pollution (Air Convention); European Environment Agency: Copenhagen, Denmark, 2021. [Google Scholar] [CrossRef]
- EPA. US Transportation Sector Greenhouse Gas Emissions: 1990–2018. 2020. Available online: https://nepis.epa.gov/Exe/ZyPDF.cgi?Dockey=P100ZK4P.pdf (accessed on 30 August 2021).
- Morton, C.; Mattioli, G.; Anable, J. Public acceptability towards Low Emission Zones: The role of attitudes, norms, emotions, and trust. Transp. Res. Part A Policy Pract. 2021, 150, 256–270. [Google Scholar] [CrossRef]
- Dai, H.; Huang, G.; Zeng, H.; Yu, R. Haze Risk Assessment Based on Improved PCA-MEE and ISPO-LightGBM Model. Systems 2022, 10, 263. [Google Scholar] [CrossRef]
- Dai, H.; Huang, G.; Zeng, H.; Zhou, F. PM2. 5 volatility prediction by XGBoost-MLP based on GARCH models. J. Clean. Prod. 2022, 356, 131898. [Google Scholar] [CrossRef]
- EC. Commission Delegated Regulation (EU) No 244/2012 of 16 January 2012 supplementing Directive 2010/31. EU of the European Parliament and of the Council on the energy performance of buildings. Brussles, Belgium. 2012. Available online: https://eur-lex.europa.eu/LexUriServ/LexUriServ.do?uri=OJ:L:2012:081:0018:0036:en:PDF (accessed on 30 April 2023).
- Pastorello, C.; Melios, G. Explaining Road Transport Emissions: A Non-Technical Guide; Publications office of the European Union: Luxembourg, 2016. [Google Scholar]
- Ricci, A.; Gaggi, S.; Enei, R.; Tomassini, M.; Fioretto, M.; Gargani, F.; Di Stefano, A.; Gaspari, E.; Archer, G.; Kearns, S. Study on Urban Vehicle Access Regulations; European Commission: Brussels, Belgium, 2017. [Google Scholar]
- Ellison, R.B.; Greaves, S.P.; Hensher, D.A. Five years of London’s low emission zone: Effects on vehicle fleet composition and air quality. Transp. Res. Part D Transp. Environ. 2013, 23, 25–33. [Google Scholar] [CrossRef]
- Fensterer, V.; Küchenhoff, H.; Maier, V.; Wichmann, H.-E.; Breitner, S.; Peters, A.; Gu, J.; Cyrys, J. Evaluation of the impact of low emission zone and heavy traffic ban in Munich (Germany) on the reduction of PM10 in ambient air. Int. J. Environ. Res. Public Health 2014, 11, 5094–5112. [Google Scholar] [CrossRef]
- Amundsen, A.H.; Sundvor, I. Low Emission Zones in Europe: Requirement, Enforcement and Air Quality; Institute of Transport Economics: Oslo, Norway, 2018. [Google Scholar]
- Broaddus, A.L. The Adaptable City: The Use of Transit Investment and Congestion Pricing to Influence Travel and Location Decisions in London; University of California: Berkeley, CA, USA, 2015. [Google Scholar]
- Holman, C.; Harrison, R.; Querol, X. Review of the efficacy of low emission zones to improve urban air quality in European cities. Atmos. Environ. 2015, 111, 161–169. [Google Scholar] [CrossRef]
- Fuso Nerini, F.; Slob, A.; Ericsdotter Engström, R.; Trutnevyte, E. A research and innovation agenda for zero-emission European cities. Sustainability 2019, 11, 1692. [Google Scholar] [CrossRef]
- Lurkin, V.; Hambuckers, J.; Van Woensel, T. Urban Low Emissions Zones: A Behavioral Operations Management Perspective. Transp. Res. Part A Policy Pract. 2021, 144, 222–240. [Google Scholar] [CrossRef]
- UARE. Urban Access Regulations in Europe: Low Emission Zones, Netherlands; Urban Access Regulations in Europe: Brussels, Belgium, 2020; Available online: https://urbanaccessregulations.eu/low-emission-zones-main (accessed on 30 March 2021).
- CBS. Half Old Diesels in Rotterdam in 2016 off the Street; Centraal Bureau voor de Statistiek: The Hague, The Netherlands, 2017; Available online: https://www.cbs.nl/nl-nl/nieuws/2017/27/helft-oude-diesels-in-rotterdam-in-2016-van-de-straat (accessed on 30 July 2020).
- Ku, D.; Bencekri, M.; Kim, J.; Leec, S.; Leed, S. Review of European Low Emission Zone Policy. Chem. Eng. 2020, 78, 241–246. [Google Scholar]
- Zhang, Y.; Andre, M.; Liu, Y.; Wu, L.; Jing, B.; Mao, H. Evaluation of low emission zone policy on vehicle emission reduction in Beijing, China. In IOP Conference Series: Earth and Environmental Science; IOP Publishing: Bristol, UK, 2018; p. 052070. Available online: https://www.researchgate.net/publication/323790362_Evaluation_of_low_emission_zone_policy_on_vehicle_emission_reduction_in_Beijing_China (accessed on 30 July 2021).
- City of Amsterdam. New Rules for Low Emission Zones as of 1 November. City of Amsterdam, Amsterdam. 2020. Available online: https://www.amsterdam.nl/en/traffic-transport/low-emission-zone/new-rules-low-emission-zones/ (accessed on 30 March 2021).
- Settey, T.; Gnap, J.; Beňová, D. Examining the impact of the deployment of low emission zones in Europe on the technological readiness of road freight transport. Transp. Res. Procedia 2019, 40, 481–488. [Google Scholar] [CrossRef]
- Haakman, R.; Beenakker, I.; Geerlings, H. Reducing vehicle-related NOx and PM emissions in metropolitan areas: A comparison between the Randstad and the Rhine-Ruhr area. J. Clean. Prod. 2020, 247, 119175. [Google Scholar] [CrossRef]
- Modijefsky, M. The Municipality of Rotterdam Ends Access Restrictions to Passenger Cars. Eltis, Rotterdam. 2018. Available online: https://www.eltis.org/discover/news/municipality-rotterdam-ends-access-restrictions-passenger-cars (accessed on 30 July 2020).
- Rotterdam Council. Case against the Environmental Exemption of Rotterdam. Rotterdam City, Rotterdam. 2016. Available online: https://www.raadvanstate.nl/uitspraken/@7297/201705992-1-a2/ (accessed on 30 March 2021).
- Hope, A.; Rotterdam to Scrap Its Low-Emissions Zone. The Brussels Times, Brussels. 2019. Available online: https://www.brusselstimes.com/all-news/eu-affairs/86280/rotterdam-to-scrap-its-low-emissions-zone/ (accessed on 30 July 2020).
- Browne, M.; Allen, J.; Anderson, S. Low emission zones: The likely effects on the freight transport sector. Int. J. Logist. Res. Appl. 2005, 8, 269–281. [Google Scholar] [CrossRef]
- Tarriño-Ortiz, J.; Gómez, J.; Soria-Lara, J.A.; Vassallo, J.M. Analyzing the impact of Low Emission Zones on modal shift. Sustain. Cities Soc. 2022, 77, 103562. [Google Scholar] [CrossRef]
- Hulkkonen, M.; Mielonen, T.; Prisle, N.L. The atmospheric impacts of initiatives advancing shifts towards low-emission mobility: A scoping review. Sci. Total Environ. 2020, 713, 136133. [Google Scholar] [CrossRef]
- Markvica, K.; Millonig, A.; Rudloff, C. Introducing additional low emission mobility offers in a well connected area: Challenges and opportunities. Vienna, Real Corp Repository. REAL CORP 2017–PANTA RHEI–A World in Constant Motion, Proceedings of the 22nd International Conference on Urban Planning, Regional Development and Information Society, Vienna, Austria, 12–14 September 2017. pp. 309–318. Available online: https://repository.corp.at/394/ (accessed on 30 April 2023).
- European Commission. European Strategy for Low-Emission Mobility. 2016. Available online: https://eur-lex.europa.eu/legal-content/EN/TXT/HTML/?uri=CELEX:52016DC0501&from=en#footnote1 (accessed on 30 July 2020).
- Geerlings, H.; Shiftan, Y.; Stead, D. Transition towards Sustainable Mobility: The Role of Instruments, Individuals and Institutions; Ashgate Publishing, Ltd.: Surrey, UK, 2012. [Google Scholar]
- Givoni, M. Addressing transport policy challenges through policy-packaging. Transp. Res. Part A Policy Pract. 2014, 60, 1–8. [Google Scholar] [CrossRef]
- Banister, D. The sustainable mobility paradigm. Transp. Policy 2008, 15, 73–80. [Google Scholar] [CrossRef]
- ACEA. Low Emission Zones ACEA Position Paper; European Automobile Manufacturers’ Association: Brussels, Belgium, 2015; Available online: https://www.acea.be/uploads/publications/ACEA_LEZ_Position_May_2015.pdf (accessed on 30 July 2020).
- Rotterdam, G. Smart Accessibility for a Healthy, Economically Strong and Attractive Rotterdam: Rotterdam Urban Traffic Plan 2017–2030; Gemeente Rotterdam: Rotterdam, The Netherlands, 2017; Available online: http://tda-mobility.org/wp-content/uploads/2018/11/Rotterdam_Urban-Traffic_Plan.pdf (accessed on 30 July 2020).
- RET. ‘RET Publications’, RET, Rotterdam, The Netherlands. 2020. Available online: https://retjaarverslag.nl/directieverslag/resultaten (accessed on 30 March 2021).
- RET. ‘Maps and Plans’, Vol. 2020, No. 01-08-, RET, Rotterdam, The Netherlands. 2020. Available online: https://www.ret.nl/home/reizen/kaarten-plattegronden.html (accessed on 30 August 2021).
- Gemeente Rotterdam. Roadmap ZECL: Moving towards Zero Emission City Logistics (ZECL) in Rotterdam in 2025; Gemeente Rotterdam: Rotteram, The Netherlands, 2019; Available online: https://www.rotterdam.nl/wonen-leven/stappenplan-zero-emissie/Roadmap-ZECL.pdf (accessed on 30 July 2020).
- Gemeente Rotterdam. Schone Lucht, Voor een Aantrekkelijk en Gezond Rotterdam 2015–2018, No. Koersnota; Gemeente Rotterdam: Rotteram, The Netherlands, 2015; Available online: https://www.yumpu.com/en/document/read/54899360/schone-lucht-voor-een-aantrekkelijk-en-gezond-rotterdam-2015-2018 (accessed on 30 July 2020).
- Gemeente Rotterdam. Vervolgevaluatie Koersnota Luchtkwaliteit; Gemeente Rotterdam: Rotterdam, The Netherlands, 2018; Available online: https://www.rotterdam.nl/nieuws/minder-uitstoot-verkeer/Rapport-Gezondere-Lucht-_SPREAD.pdf (accessed on 30 July 2020).
- Gemeente Rotterdam. Aanpak Nul Emissie Mobiliteit: Naar Uitstootvrije Stedelijke Mobiliteit; Municipality of Rotterdam: Rotterdam, The Netherlands, 2019; Available online: https://www.rotterdam.nl/bestuur-organisatie/nieuwe-energie/1719_9023_Aanpak-Nul-Emissie-Mobiliteit.pdf (accessed on 30 July 2020).
- Wang, R. Shaping urban transport policies in China: Will copying foreign policies work? Transp. Policy 2010, 17, 147–152. [Google Scholar] [CrossRef]
- Mingardo, G. Transport and environmental effects of rail-based Park and Ride: Evidence from the Netherlands. J. Transp. Geogr. 2013, 30, 7–16. [Google Scholar] [CrossRef]
- Givoni, M.; Macmillen, J.; Banister, D.; Feitelson, E. From policy measures to policy packages. Transp. Rev. 2013, 33, 1–20. [Google Scholar] [CrossRef]
- Eriksson, L.; Garvill, J.; Nordlund, A.M. Acceptability of travel demand management measures: The importance of problem awareness, personal norm, freedom, and fairness. J. Environ. Psychol. 2006, 26, 15–26. [Google Scholar] [CrossRef]
- Schlag, B.; Schade, J. Public acceptability of traffic demand management in Europe. Traffic Eng. Control 2000, 41, 314–318. [Google Scholar]
- Pucher, J. Back on Track: Eight steps to rejuvenate public transport in Canada. Altern. J. 1998, 24, 26–35. [Google Scholar]
- Cuenot, F.; Fulton, L.; Staub, J. The prospect for modal shifts in passenger transport worldwide and impacts on energy use and CO2. Energy Policy 2012, 41, 98–106. [Google Scholar] [CrossRef]
- Loukopoulos, P.; Jakobsson, C.; Gärling, T.; Schneider, C.M.; Fujii, S. Car-user responses to travel demand management measures: Goal setting and choice of adaptation alternatives. Transp. Res. Part D Transp. Environ. 2004, 9, 263–280. [Google Scholar] [CrossRef]
- Scheiner, J.; Chatterjee, K.; Heinen, E. Key events and multimodality: A life course approach. Transp. Res. Part A Policy Pract. 2016, 91, 148–165. [Google Scholar] [CrossRef]
- Chatterjee, K.; Clark, B.; Bartle, C. Commute mode choice dynamics: Accounting for day-to-day variability in longer term change. Eur. J. Transp. Infrastruct. Res. 2016, 16, 713–734. Available online: https://journals.open.tudelft.nl/index.php/ejtir/article/view/3167 (accessed on 30 July 2020).
- Heinen, E.; Harshfield, A.; Panter, J.; Mackett, R.; Ogilvie, D. Does exposure to new transport infrastructure result in modal shifts? Patterns of change in commute mode choices in a four-year quasi-experimental cohort study. J. Transp. Health 2017, 6, 396–410. [Google Scholar] [CrossRef]
- Doi, K.; Kii, M. Looking at sustainable urban mobility through a cross-assessment model within the framework of land-use and transport integration. IATSS Res. 2012, 35, 62–70. [Google Scholar] [CrossRef]
- Creswell, J.W. Designing and Conducting Mixed Methods Research; SAGE: Newbury Park, CA, USA, 2006; Available online: https://www.sagepub.com/sites/default/files/upm-binaries/10982_Chapter_4.pdf (accessed on 30 July 2020).
- Barbosa de Sousa, P. Introduction to IBM SPSS Statistics 25; SAGE: Newbury Park, CA, USA, 2020. [Google Scholar]
- Van Thiel, S. Research Methods in Public Administration and Public Management: An Introduction; Routledge: New York, NY, USA, 2014. [Google Scholar]
- Translink. ‘Information Request for Rotterdam OV Usage’. 2020, Volume 2020, No. 01-08-. Available online: https://www.translink.nl/library (accessed on 30 July 2020).
- CBS. 12,5 Duizend Woningen Door Transformatie Van Gebouwen in 2019; CBS: The Hague, The Netherlands, 2020; p. 1. [Google Scholar]
- CBS. Relocation Survey in the Netherlands (OViN)’. 2020, Volume 2020, No. 19-08-. Available online: https://www.cbs.nl/nl-nl/onze-diensten/methoden/onderzoeksomschrijvingen/korte-onderzoeksbeschrijvingen/onderzoek-verplaatsingen-in-nederland--ovin-- (accessed on 30 July 2021).
- Bogner, A.; Littig, B.; Menz, W. Interviewing Experts; Springer: Hampshire, UK, 2009; Available online: https://link.springer.com/chapter/10.1057/9780230244276_1 (accessed on 30 July 2020).
- Rotterdam, G. Passenger Cars in Rotterdam; Gemeente Rotterdam: Rotterdam, The Netherlands, 2020; Available online: https://onderzoek010.nl/jive (accessed on 30 July 2020).
- Gemeente Rotterdam. Fietskoers 2025: De Fiets Als Hefboom in de Rotterdamse Mobiliteitstransitie; Gemeente Rotterdam: Rotterdam, The Netherlands, 2019; Available online: https://www.rotterdam.nl/wonen-leven/fietsstad/Fietskoers-2025.pdf (accessed on 30 July 2020).
- Gemeente Rotterdam. Facts and Figures on Electric Mobility in Rotterdam; Gemeente Rotterdam: Rotterdam, The Netherlands, 2020; Available online: https://www.rotterdam.nl/wonen-leven/elektrisch-rijden/Facts-and-figures-on-electric-mobility-in-Rotterdam.pdf (accessed on 30 July 2020).
- Gemeente Rotterdam. Uitvoerings Programma Mobiliteit: Mobiliteit Die Mensen Verbindt; Gemeente Rotterdam: Rotterdam, The Netherlands, 2019; Available online: https://rotterdam.raadsinformatie.nl/document/8097630/2/19bb21932 (accessed on 30 July 2020).
- Attia, M. The Effect of the Low Emission Zones Policy and the Rotterdam Traffic Plan on the Usage of Alternative Modes of Transport: The Case Study of Rotterdam, Netherlands; Erasmus University Rotterdam: Rotterdam, The Netherlands, 2020; Available online: https://thesis.eur.nl/pub/56572 (accessed on 30 April 2023).
- Stelwagen, U.; Eijk, A. Rotterdam Wagenparkscan 2.0, Juni 2017; TNO: Rotterdam, The Netherlands, 2018. [Google Scholar]
- Boer, S.; Erdem, Ö. Evaluatierapport Sloop—En Terugkoopregeling Gemeente Rotterdam; Gemeente Rotterdam: Rotterdam, The Netherlands, 2017. [Google Scholar]
- Stamp, A.; Lang, D.J.; Wäger, P.A. Environmental impacts of a transition toward e-mobility: The present and future role of lithium carbonate production. J. Clean. Prod. 2012, 23, 104–112. [Google Scholar] [CrossRef]
- Held, T.; Gerrits, L. On the road to electrification—A qualitative comparative analysis of urban e-mobility policies in 15 European cities. Transp. Policy 2019, 81, 12–23. [Google Scholar] [CrossRef]
- Wu, H.; Yin, B.; Liu, L.; Liu, J. Mobility and Environmental Impacts of Implementing a Driving Restriction Zone: Case Study in Berlin. 2022. HAL Open Science Repository: hal-03827236v2. Available online: http://hal.univ-lorraine.fr/MATRIS/hal-03827236v2 (accessed on 30 April 2023).
- Romero, F.; Gomez, J.; Rangel, T.; Vassallo, J.M. Impact of restrictions to tackle high pollution episodes in Madrid: Modal share change in commuting corridors. Transp. Res. Part D Transp. Environ. 2019, 77, 77–91. [Google Scholar] [CrossRef]
- Markvica, K.; Hu, B.; Prandtstetter, M.; Ritzinger, U.; Zajicek, J.; Berkowitsch, C.; Hauger, G.; Pfoser, S.; Berger, T.; Eitler, S. On the development of a sustainable and fit-for-the-future transportation network. Infrastructures 2018, 3, 23. [Google Scholar] [CrossRef]
- Rotterdam, G. Feitenkaart Rotterdammers over Hun Stad: Omnibusenquête; Gemeente Rotterdam: Rotterdam, The Netherlands, 2020; Available online: https://onderzoek010.nl/documents (accessed on 30 July 2020).
Figure 1.
Phased-in development of the LEZ concept. The authors developed the figure based on the approaches followed by the leading LEZ cities, i.e., London, Amsterdam, and Rotterdam [25]. A stands for the city center area, B stands for the inner ring road, and C stands for the city wide area.
Figure 1.
Phased-in development of the LEZ concept. The authors developed the figure based on the approaches followed by the leading LEZ cities, i.e., London, Amsterdam, and Rotterdam [25]. A stands for the city center area, B stands for the inner ring road, and C stands for the city wide area.


Figure 4.
Conceptual framework (concept variables, sub-variables, and main indicators).

Figure 5.
Methodological data collection framework. The numbers 1–6 explain the steps followed in the research methodology.
Figure 5.
Methodological data collection framework. The numbers 1–6 explain the steps followed in the research methodology.


Figure 7.
Number of unique polluting cars entering the city during the fleet scan week per year.

Figure 8.
Daily metro check-ins in 28 main stations inside and outside the LEZ. Data were acquired from RET [45].
Figure 8.
Daily metro check-ins in 28 main stations inside and outside the LEZ. Data were acquired from RET [45].


Figure 10.
Number of public charging points and km travelled in Rotterdam for E-cars. Based on [50,72,74].

Figure 11.
Relationship between P+R usage and provided P+R spots with the Metro line check-ins.

Figure 12.
LEZ-recommended policy package.


Table 1.
Final sample of interviewees.
| Field | Title | Context | |
|---|---|---|---|
| Expert 1 | Senior municipal mobility advisor | LEZ policymaker | Rotterdam |
| Expert 2 | Mobility management and parking policies | LEZ advisor and Ph.D. researcher | Rotterdam |
| Expert 3 | Senior municipal mobility advisor | Traffic plan maker | Rotterdam |
| Expert 4 | Traffic control and intersection | Ph.D. researcher | Delft |
| Expert 5 | Sustainable mobility, ports, and policies | Professor, expert | Rotterdam |
| Expert 6 | Vehicles emissions expert | Ph.D. engineer/researcher | Brussels |
| Expert 7 | LEZ expert and policymaker | LEZ and policies researcher | Paris |
| Expert 8 | Urban planning and mobility advisor | Researcher, advisor | Rotterdam |
Disclaimer/Publisher’s Note: The statements, opinions and data contained in all publications are solely those of the individual author(s) and contributor(s) and not of MDPI and/or the editor(s). MDPI and/or the editor(s) disclaim responsibility for any injury to people or property resulting from any ideas, methods, instructions or products referred to in the content. |
© 2023 by the authors. Licensee MDPI, Basel, Switzerland. This article is an open access article distributed under the terms and conditions of the Creative Commons Attribution (CC BY) license (https://creativecommons.org/licenses/by/4.0/).
Share and Cite
MDPI and ACS Style
Attia, M.; Alade, T.; Attia, S. The Influence of Passenger Car Banning Policies on Modal Shifts: Rotterdam’s Case Study. Sustainability 2023, 15, 7443. https://doi.org/10.3390/su15097443
AMA Style
Attia M, Alade T, Attia S. The Influence of Passenger Car Banning Policies on Modal Shifts: Rotterdam’s Case Study. Sustainability. 2023; 15(9):7443. https://doi.org/10.3390/su15097443
Chicago/Turabian StyleAttia, Maha, Taslim Alade, and Shady Attia. 2023. "The Influence of Passenger Car Banning Policies on Modal Shifts: Rotterdam’s Case Study" Sustainability 15, no. 9: 7443. https://doi.org/10.3390/su15097443
Note that from the first issue of 2016, this journal uses article numbers instead of page numbers. See further details here.