Article

Evaluation of Emergency Shelter Service Functions and Optimisation Suggestions—Case Study in the Songyuan City Central Area

1
College of Earth Sciences, Jilin University, Changchun 130061, China
2
College of Public Administration, Changchun University of Technology, Changchun 130012, China
3
College of Geo-Exploration Science and Technology, Jilin University, Changchun 130026, China
*
Author to whom correspondence should be addressed.
Sustainability 2023, 15(9), 7283; https://doi.org/10.3390/su15097283
Submission received: 14 March 2023 / Revised: 12 April 2023 / Accepted: 25 April 2023 / Published: 27 April 2023
(This article belongs to the Special Issue Urban Safety and Security Assessment)

Abstract

:
Reasonable planning and construction of emergency shelters is of great significance in improving the ability of cities to prevent and mitigate disasters and ensuring urban public safety. From the perspective of the needs of the evacuees, this paper constructs an evaluation index system for the service function of emergency evacuation places in four aspects: effectiveness, accessibility, safety and rescue responsiveness. This paper takes the central city of Songyuan as the case study area. We apply the entropy weight–TOPSIS–grey correlation method to evaluate the service functions of emergency shelters in the central city of Songyuan and determine their service function levels. An interactive analysis using the bivariate Moran index is used to determine the current state of supply and demand for places of refuge, in terms of their service functions and population distribution. It also makes recommendations for optimisation, based on the extent to which the service function of the emergency shelter is coordinated with the distribution of the population. The results show that of the 54 emergency shelters in the central city of Songyuan, the low and medium service function levels are divided into 33 and 15, with problems such as unreasonable spatial layout and inadequate emergency supplies and medical resources. The future construction of emergency shelters should focus not only on increasing the number and improving the scale, but also on considering the characteristics of population distribution, optimising the spatial distribution pattern and making full use of existing resources such as parks, squares and schools. The establishment of composite spatial resources for disaster preparedness and the promotion of a government-led model of interconnected shelter and emergency infrastructure can effectively enhance the spatial resilience of cities in response to natural hazards.

1. Introduction

In recent years, global climate change has intensified, and natural hazards are frequent, with significant implications for regional economic development and urban safety [1,2]. China is one of the countries that suffer the most from earthquakes and floods in the world [3,4,5,6]. According to statistics, in 2022 alone, direct economic losses from earthquake and flood disasters accounted for 9.41% and 54.01% of total direct economic losses from natural hazards. The Chinese government has attached great importance to the prevention and avoidance of disaster risks and the enhancement of urban natural hazards’ prevention and control capabilities. As an important part of the emergency response to disasters, emergency shelters are important places for people to take refuge, escape from direct or indirect damage caused by disasters and carry out rescue when major disasters such as earthquakes, fires and explosions occur [7,8]. Past experience in disaster prevention and control has shown that rational and effective planning and construction of emergency shelters is an effective measure to minimise casualties and increase the level of urban resilience to disasters and urban risk prevention during catastrophic events [9,10].
The study of emergency shelters can be dated back as far as the Renaissance. In order to guarantee the rapid evacuation of the population to a wide area in the event of a major disaster, Catania has created wide, straight urban roads connected to large public squares [11]. The United States and Japan have started to build and plan emergency shelters due to the frequency of disasters such as fires, earthquakes and typhoons, and have enacted a series of laws and regulations [12,13,14]. Research on places of refuge in China is still in the practical stage, and there are more studies on the evaluation of places of refuge. The study of the location and layout of emergency shelters focused on the effectiveness, safety and accessibility of the shelters [15,16]. Numerous scholars have used this as a basis for extending and refining the system of evaluation indicators (Table 1), with indicators such as effective shelter area, service area, open space ratio, distance to hospitals, fire stations, large supermarkets and distance to sources of danger and earthquake rupture zones [17,18,19]. These indicators are all designed to assess the suitability of emergency shelters, but it can be seen from them that the evaluation of existing shelters is mostly based on a system of evaluation indicators from the researcher’s perspective. Existing evaluation factors may not be appropriate for the needs of particular populations. Vulnerable groups such as the elderly and children significantly differ from adults in terms of evacuation speed and evacuation behaviour, and the post-disaster needs of vulnerable groups are more demanding than those of adults. Studies have shown that the potential refuge population and their need for refuge space are important influences in the planning and construction of refuge spaces [20,21]. More and more countries are paying attention to the asylum needs and evacuation behaviour of vulnerable people seeking refuge. For example, the United States provides detailed standards for planning and operating shelters for special populations and places a high priority on the shelter needs of vulnerable groups [22]. Japan focuses on the construction and management of welfare-type shelters, which are special shelters for special people in times of disaster, and they cooperate with medical institutions to provide timely medical assistance to people in need [23]. Some scholars have also begun to focus on the heterogeneity of evacuation capacity between particular groups, such as the elderly, children and patients, and to assess the effectiveness of emergency shelters on this basis [24,25]. Therefore, it is feasible and necessary to establish an evaluation index system to evaluate the function of emergency shelter services from the perspective of the needs of evacuees. Commonly used methods for emergency shelter evaluation include TOPSIS, analytic hierarchy process (AHP), the intuitionistic fuzzy number (IFN), the grey correlation method, etc [26,27,28,29]. The hierarchical analysis method relies more on subjective experience and has a high level of uncertainty in its use, which may lead to evaluation results that deviate from the actual situation. The intuitionistic fuzzy number method does not accurately reflect the differences between the data, and the accuracy is not high, which makes the results prone to errors.
Considering the diverse needs of the evacuees and the special characteristics of the vulnerable groups, this paper establishes an evaluation index system in four aspects: effectiveness, accessibility, safety and rescue responsiveness, and establishes a comprehensive evaluation model based on an entropy weight–TOPSIS–grey correlation method to evaluate the service functions of emergency evacuation places. It also analyses the interaction between the distribution of population density and the service functions of refuge places, establishes the zoning of the supply and demand of refuge places and makes recommendations for the optimisation of refuge places. Due to the consideration of the frequency and intensity of natural hazards, this paper selects the central city of Songyuan as an example for the study. The main contributions are as follows:
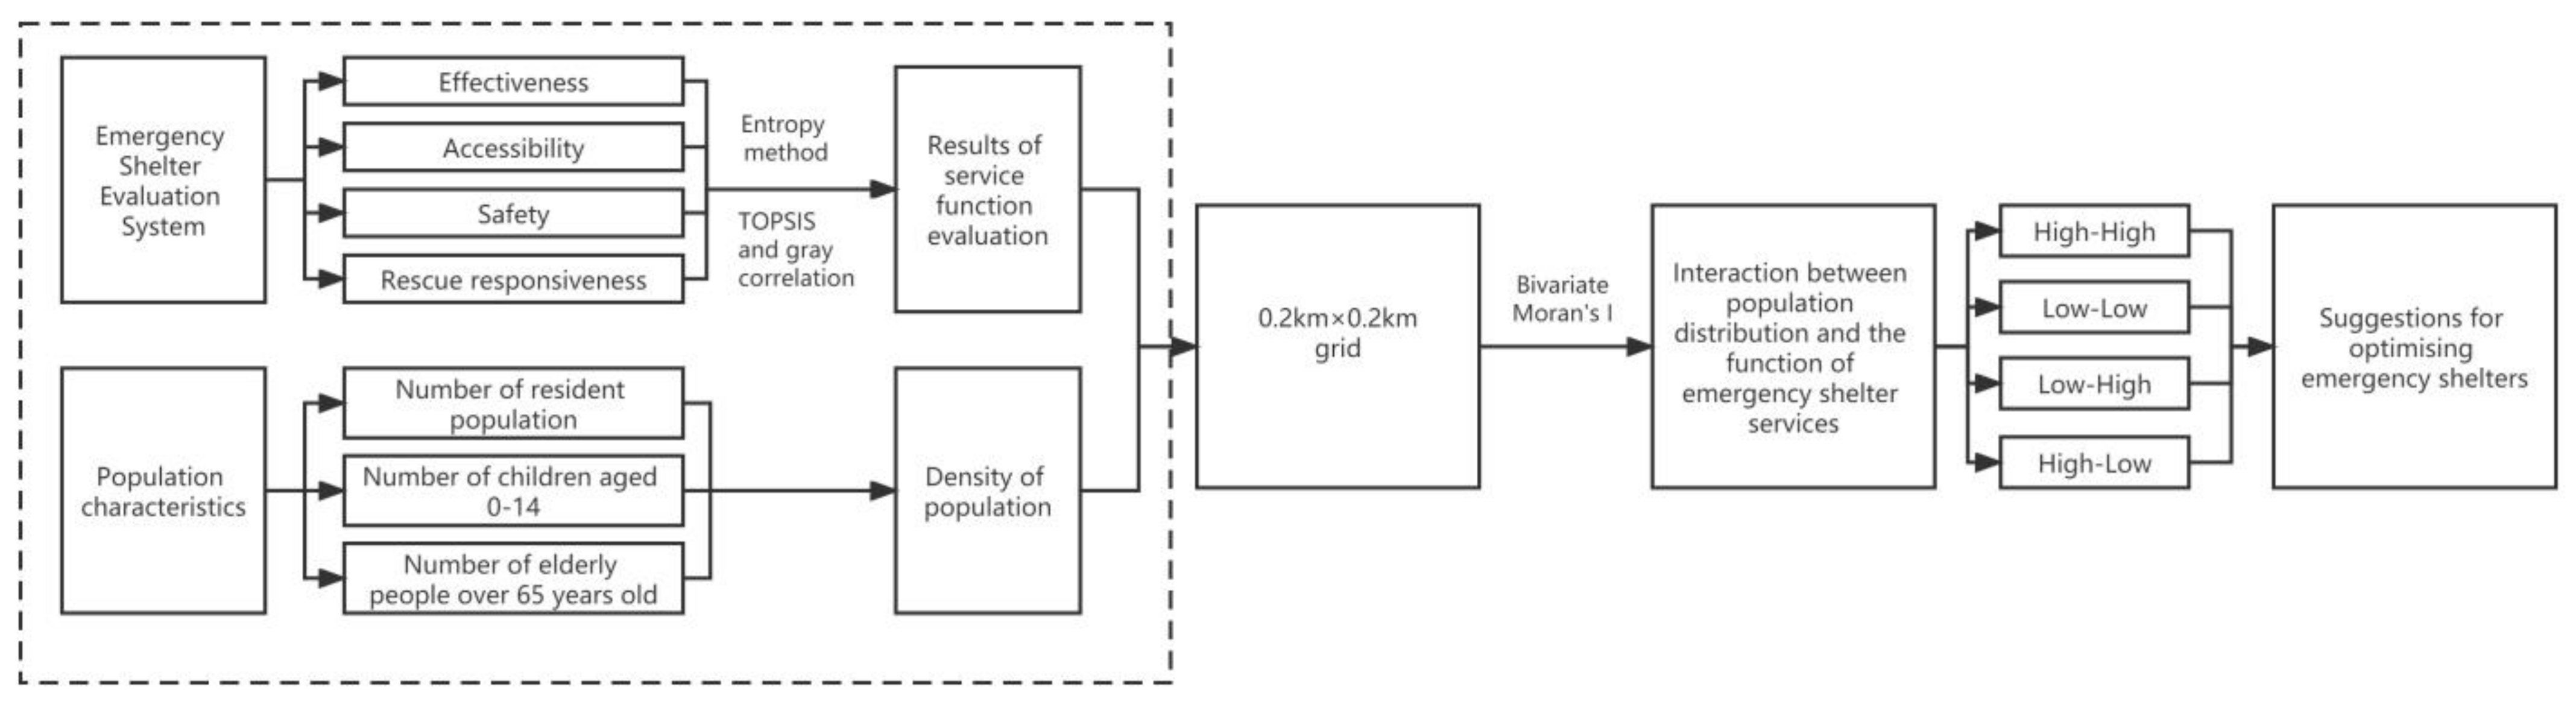
  • From the perspective of the needs of the evacuees and considering the evacuation behaviour of vulnerable groups, and the stock of emergency supplies and the medical rescue capacity of emergency shelters, a criterion is added to evaluate the service function of shelters, expanding the dimensions of the existing evaluation system.
  • Using the entropy weight–TOPSIS–grey correlation method to evaluate the service function of the shelter, the optimal weights are objectively determined to make the evaluation results more scientific and reasonable.
  • In order to determine the current situation of supply and demand of evacuation places in the central city of Songyuan, an interactive analysis of the distribution of population density and the service function of evacuation places is conducted. Based on the perspective of evacuee demand, suggestions are made for the optimisation of evacuation places.

2. Materials and Methods

2.1. Study Area

Songyuan City is located in the central and western parts of Jilin Province. It is located in the south of the Song Nen Plain. The terrain is mainly composed of Song Nen venues, Songliao Division and Tower Plains. Songyuan City covers an area of 22,000 square kilometres, with a total population of 2.75 million, and the city’s gross regional product is 75,288 million [30]. Songyuan City has jurisdiction over Ningjiang District, Fuyu City, Qianguolos Mongol Autonomous County, Changling County, Qian’an County and two national development zones and five provincial development zones. The central urban area of Songyuan is mainly located in the south-eastern part of Ningjiang District and part of the administrative area of Qianguolos Mongol Autonomous County (Figure 1). It includes 21 (township) streets and 93 communities, with a resident population of 700,000, of which 92,400 are elderly people over 65 years old and 88,900 are children aged 0–14 [31]. According to the official website of the Songyuan Earthquake Bureau, since 2016, about 117 earthquakes have occurred in Songyuan City, and 92 occurred in Ningjiang District alone; especially, in 2018 and 2019, earthquakes of magnitude 5.0 or higher occurred in both years [32]. This poses serious threats to important building facilities. Moreover, the city of Songyuan is crisscrossed by rivers, and the water system is developed in a dendritic network of rivers and numerous tributaries. If there is a greater intensity of rainfall, prone to flooding, an earthquake accompanied by heavy rainfall and flooding is a parallel disaster. Although there is no direct causal relationship between earthquakes and flash floods, the water vapour released during earthquakes can increase the amount of rainfall, which in turn can aggravate or trigger flash floods, leading to an increase in the intensity and frequency of flash floods, as well as floods caused by the sudden collapse of dams as a result of earthquake hazards. The central city of Songyuan is densely populated and full of high-rise buildings. In the event of an earthquake or flood disaster, the consequences would be unimaginable.

2.2. Data Sources

The data in this paper mainly include regional socioeconomic statistics and geographic information data (Table 2). Statistics, including the resident population, the number of elderly people and the number of children aged 0–14, were mainly from the official website of the World Pop, the bulletin of the 7th National Population Census of Songyuan City and the statistical bulletin on the national economic and social development of Songyuan City in 2020. The geographic information data include vector data of emergency shelters, communities, hospitals, fire stations, public security organisations and commercial service areas, road vector data, 30 m resolution DEM and active fault vector data. The above data were obtained from the website of the Songyuan Earthquake Bureau, the 2022 POI dataset, the Geo Cloud platform and the data centre of seismic active fault exploration.

2.3. Emergency Shelter Service Function Evaluation Index System

According to the relevant requirements of the “Earthquake Emergency Separation Places and Supporting Facilities”, “Design Specifications for Disaster Prevention and Fields” and “Standards Evaluation and research results of emergency evacuation venues”, based on the previous research, this paper adds the first-level index of rescue responsiveness based on the refined indexes of effectiveness, accessibility and safety from the perspective of the needs of evacuees (Table 3).
The traditional effectiveness indicators are based more on the evaluation of the area of refuge and the scope of service of the shelter. There is a higher demand for refuge space from vulnerable groups such as the elderly and the disabled [33], adding a secondary indicator for the area of refuge per capita to provide a more comprehensive evaluation of the effectiveness of refuge spaces. Previously, accessibility indicators focused more on the connectivity of places of refuge to surrounding public services. However, evacuees are the main service providers of emergency shelters in the event of a disaster, and the number of evacuees and their choice of shelter should be considered [19]. Therefore, this paper calculates the number of people to be accepted in the shelter based on the service area and evacuee selection, which is used to reflect the accessibility of the evacuees to the shelter. Safety indicators are mainly concerned with the possible threats to shelters caused by earthquakes, floods and their secondary hazards, from which secondary indicators of safety are constructed. Based on the needs of evacuees for emergency supplies, emergency facilities and medical rescue [34,35], this paper introduces rescue responsiveness criteria to evaluate the emergency rescue capacity of evacuation sites, expanding the dimensions of existing emergency evacuation site evaluation indicators and providing a more comprehensive and complete evaluation of evacuation site service functions.

2.4. Research Methods

From the perspective of evacuees’ needs, the evaluation index system is based on the criteria of effectiveness, accessibility, safety and rescue responsiveness. The entropy weight–TOPSIS–grey correlation method was used to evaluate the service function of urban refuge places, combined with the bivariate Moran index to analyse the supply and demand of service function evaluation results and population density distribution. Based on this, a zoning of the supply and demand of emergency shelters in the central city of Songyuan was established, and the suggestions for the optimisation of emergency shelters were made. The technical route of this paper is shown in Figure 2.

2.4.1. Entropy Weight–TOPSIS–Grey Correlation Method

The entropy weighting method is an objective decision-making method based on data to determine weights. The TOPSIS method is a multi-objective decision-making method that obtains a relative closeness based on the distance between the indicator and the best and worst solutions, and then ranks the indicators in a comprehensive manner [36,37]. The grey correlation is a branch of grey systems theory that determines the degree of the relationship between indicators based on the closeness of the developmental dynamics between the series [38,39]. The entropy weight method and grey correlation analysis were introduced to optimise TOPSIS, which not only yields the service function evaluation grade, but also calculates the result index of emergency shelter places in the central city of Songyuan. The different indices of the same grade were ranked to make the evaluation results more accurate and to more comprehensively reflect the current service function of emergency shelter places. The steps of the integrated evaluation method based on the entropy weight–TOPSIS–grey correlation method are as follows:
(1) Entropy weighting method for determining weights.
① Build the original decision matrix of evaluation indicators.
With m emergency shelters and n evaluation indicators for each emergency shelter, the measurement of the emergency shelter under the evaluation indicator is X ij i = 1 , 2 , 3 m ;   j = 1 , 2 , 3 n , so the original decision matrix is shown below as:
X = x 11 x 12 x 21 x 22 x 1 n x 2 n x m 1 x m 2 x mn
② Standardisation of indicators.
The data of the original decision matrix are normalised to obtain the dimensionless decision matrix, Y = y ij m × n .
Positive   evaluation   indicators :   y ij = x ij min x j max x j min x j
Negative   evaluation   indicators :   y ij = max x j x ij max x j min x j
③ Determine the weighting of each indicator.
Information entropy of indicator j:
e j = 1 lnm i = 1 m q ij ln q ij
In the formula: q ij = y ij i = 1 m y ij .
Calculate the weight of each indicator:
w j = 1 e j j = 1 n ( 1 e j )
(2) TOPSIS method to determine the ideal solution.
① Construction of a weighted normalisation matrix.
Multiply the dimensionless decision matrix Y with the weights to obtain the weighted normalisation matrix Z:
Z = z ij m × n = w j y ij m × n
② Determine the positive and negative ideal solutions of the matrix Z:
Z + = max z i 1 , max z i 2 , , max z im Z = max z i 1 , max z i 2 , , max z im
③ Calculate the Euclidean distance of each solution from the positive and negative ideal solutions:
D i + = i = 1 m max z ij z ij 2 D i = i = 1 m min z ij z ij 2
(3) The grey correlation method.
① Calculation of grey correlation coefficients
On the basis of the weighted normalisation matrix Z, determine the grey correlation coefficient of program i with respect to indicator j for the positive and negative ideal solutions:
g ij + = min 1 i m min 1 j n y j + y ij + ρ max 1 i m min 1 j nj y j + y ij y j + y ij + ρ max 1 i m min j 1 j n y j + y ij g ij = min 1 i m min j y j y ij + ρ max 1 i m min j 1 j n y j y ij y j y ij + ρ max 1 i m min j 1 j n y j y ij
In the formula, ρ is the discrimination factor, ρ [ 0 , 1 ] and ρ usually takes the value 0.5.
② Calculate the grey correlation:
G i + = 1 n i = 1 n g ij + G i = 1 n i = 1 n g ij
③ Dimensionless treatment of D i + ,   D i ,   G i + ,   G i :
φ i = θ i max 1 i m θ i
In the formula, θ i refers to D i + ,   D i ,   G i + ,   G i and φ i refers to the calculated values d i + ,   d i , j i + and j i .
④ Combining dimensionless weighted Euclidean distances and grey correlations:
S i + = α d i + β j i + S i = α d i + + β j i
In the formula, α and β are degrees of preference, α + β = 1 , α ,   β [ 0 , 1 ] .
⑤ Calculate the relative closeness:
A i + = S i + S i + + S i
Solutions are ranked according to the size of the A i + -value, and the higher the A i + -value, the better the service function of the solution to be evaluated, while the lower the A i + -value, the worse the service function of the solution to be evaluated.

2.4.2. Natural Breaks (Jenks) Classification Method

The natural classification method is a hierarchical method that maximises the differences between groups of data and optimises the similarity of values within groups by naturally grouping the data based on their intrinsic linkages and grouping similar values most appropriately [40]. The specific formulas are as follows:
(1) Calculate the mean and sum of deviation squares (SDAM) for each class of arrays:
A i + = j n A ij + n SDAM = j n ( A ij + A j + ) 2
In the formula, n is the number of elements in the array.
(2) Calculate the sum of squared deviation squares (SDCM) of the category means for each combination in the classification results and identify the SDCM minimum:
SDCM = j = 1 n 1 ( A 1 j + A 1 + ) 2 + j = 1 n n ( A 1 j + A 1 + ) 2
(3) The goodness of fit (GVF) was calculated to verify the goodness of fit, with GVF ranging from 1 to 0, with higher gradients indicating greater variation between classes:
GVF = ( SDAM minSDCM ) SDAM

2.4.3. Bivariate Moran Index

The emergency shelter, as an important part of the basic shelter facilities, should have a certain relationship between its service function and the regional population distribution in terms of spatial distribution. In order to explore the spatial distribution characteristics of the coupling between the two, balance the evacuation resources and optimise the layout of evacuation places, this paper used the bivariate Moran index to analyse the spatial correlation between the service functions of emergency evacuation places and the distribution of population density. The bivariate Moran index is divided into a global bivariate Moran index and a local bivariate Moran index with the following formula:
I = n i = 1 n j = 1 n w ij Z xi Z yj i = 1 n j = 1 n w ij i = 1 n Z xi Z yj I i = Z xi j = 1 , j i n w ij Z yj
In the formula, I is the bivariate Moran index, I i is the local Moran index of a given grid, w ij is the value of the elements of the spatial weight matrix and Z xi and Z yj represent the normalised values of population density and the service function of a place of refuge in a given grid.
By extracting the demand (population density) and the supply of places of refuge (service functions of places of refuge) as grid attributes, the study is transformed into an analysis of the spatial coupling between grid attributes.

3. Results and Analysis

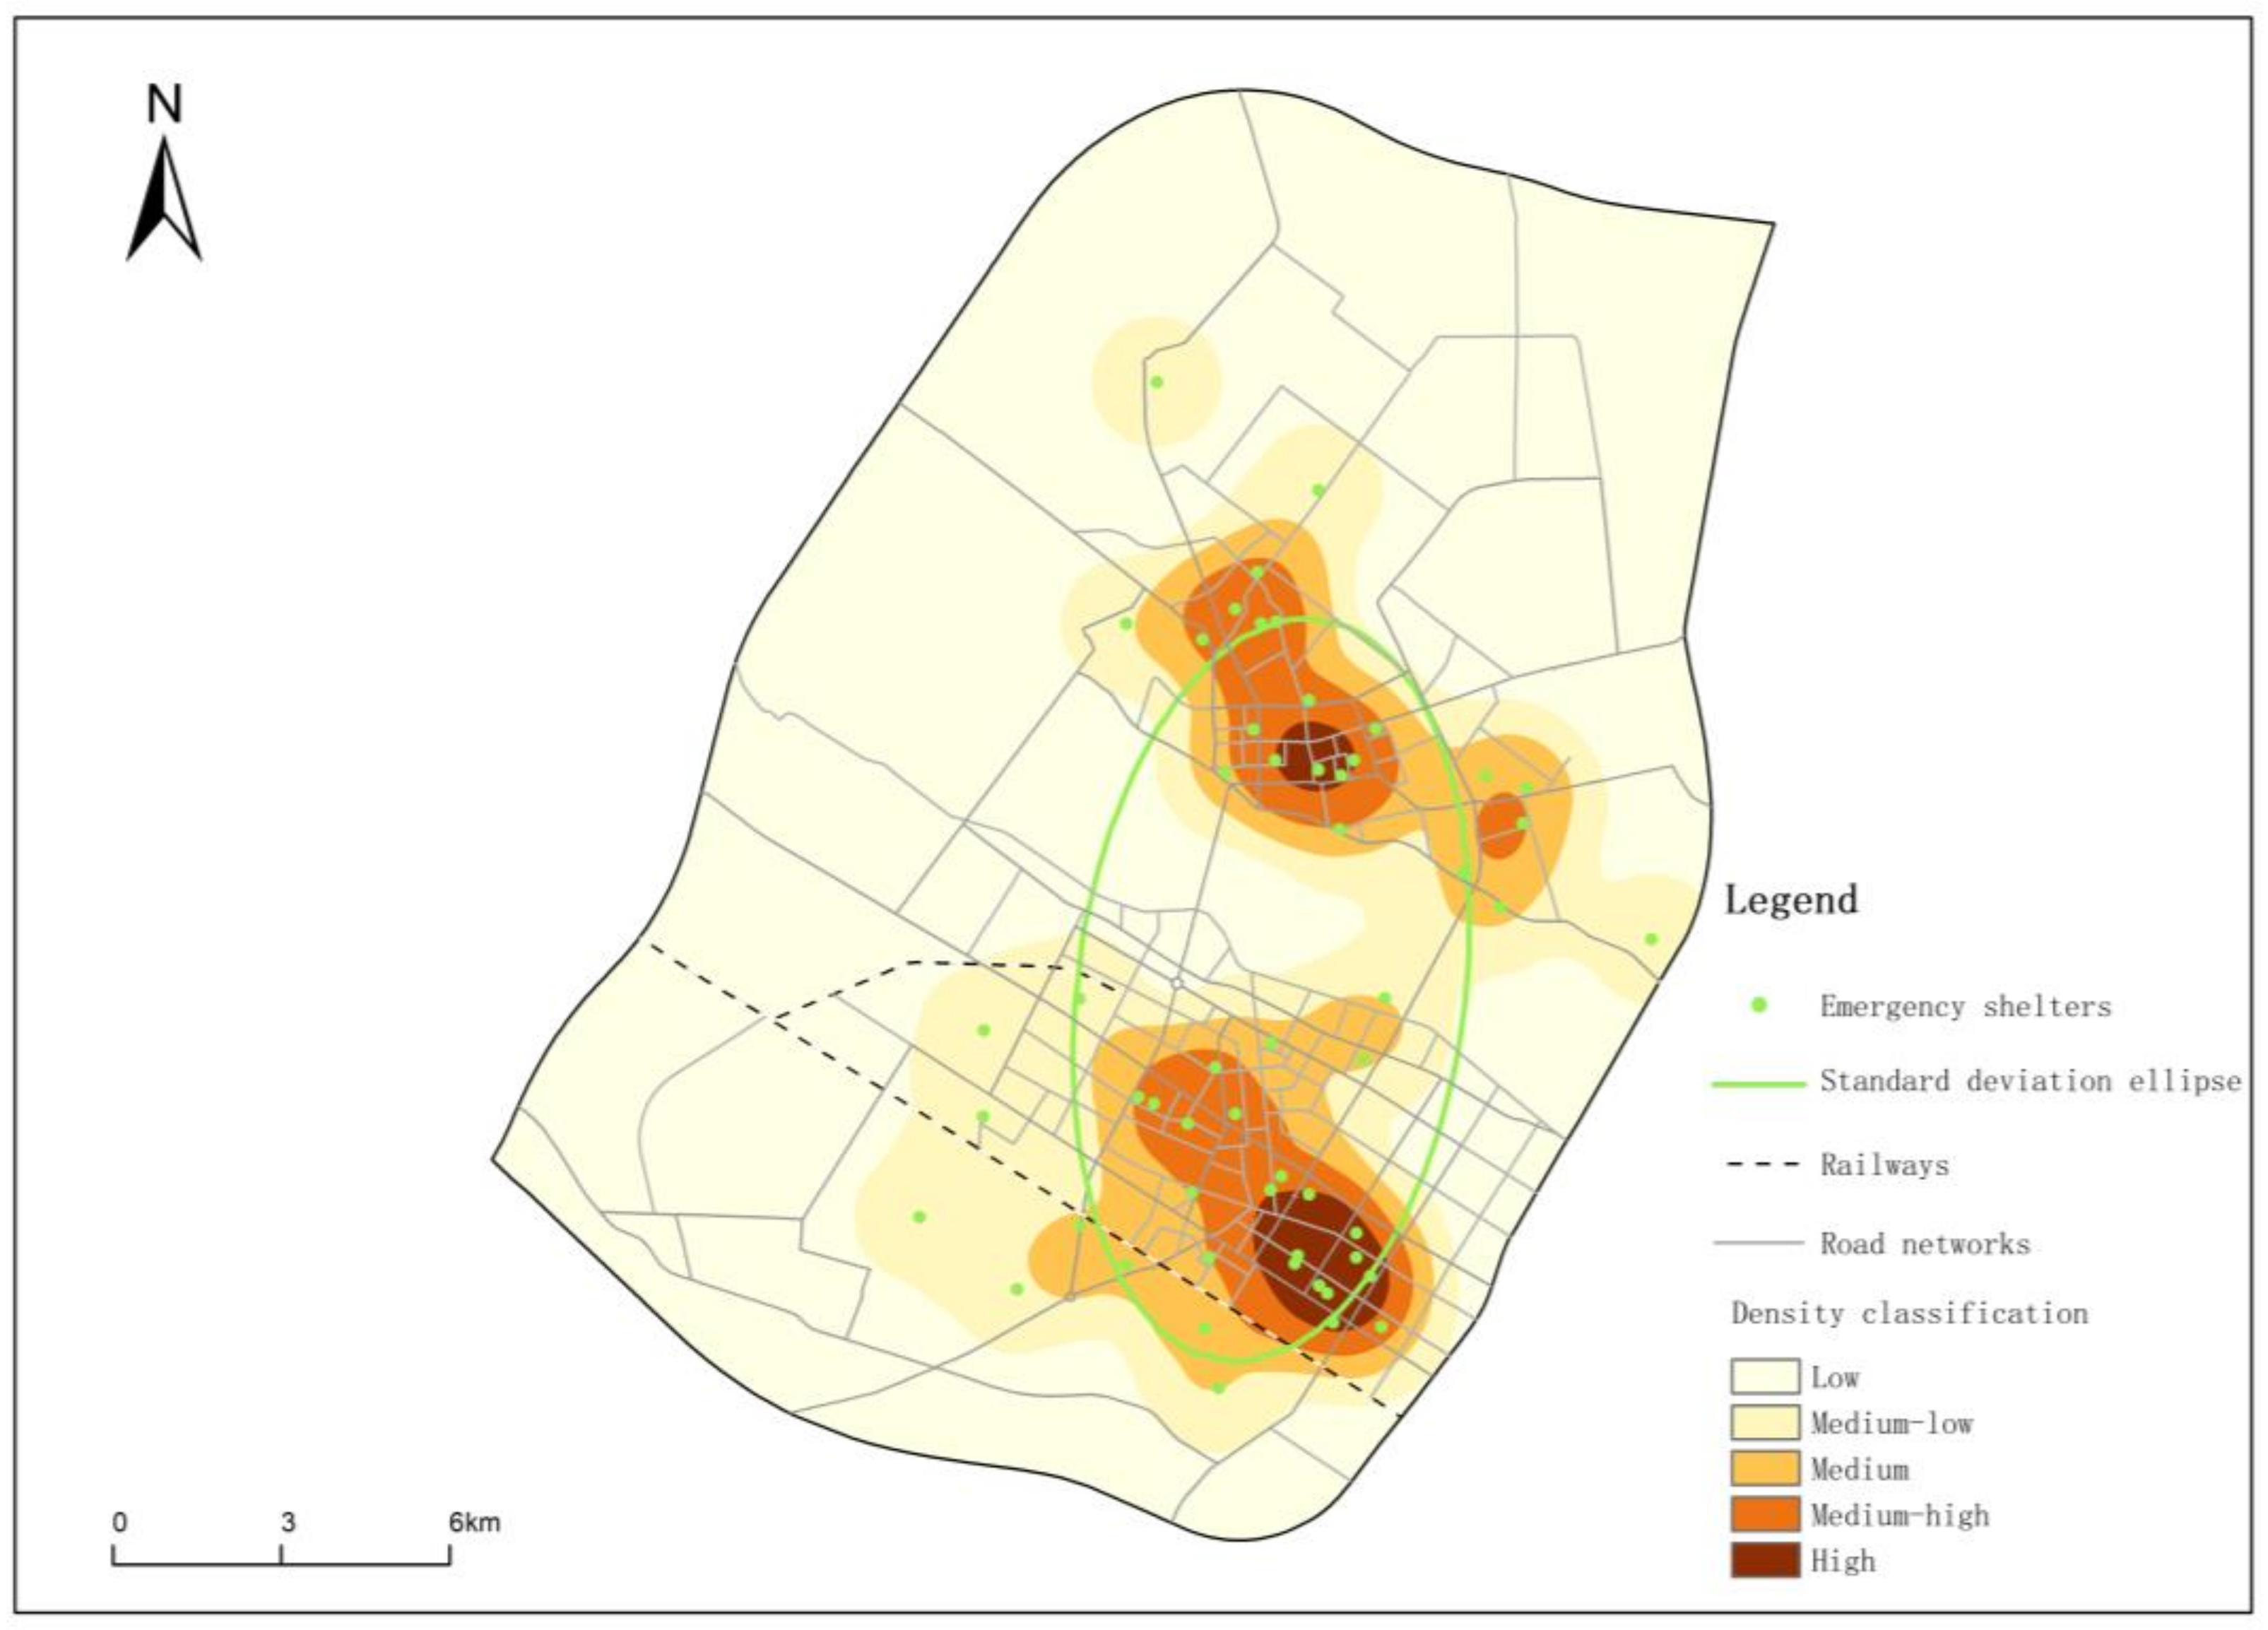
3.1. General Layout Features of Emergency Shelters

At present, 54 places of refuge have been built in the central city of Songyuan, including 5 long-term places of refuge, 30 short-term places of refuge and 19 emergency places of refuge, with a total effective refuge area of 700,000 m 2 (Table 4). In terms of spatial distribution, the distribution of evacuation sites in the central city of Songyuan is relatively scattered, and by drawing standard deviation ellipses for emergency evacuation sites, it was found that the evacuation sites are clearly directional, with a northwest–southeast distribution (Figure 3).
Using the ArcGIS software natural breaks classification method to classify the results of the shelter kernel density analysis into five categories, it was possible to identify that there are obvious clustering areas for emergency shelters in the central city of Songyuan, including eight high-density clustering areas: Ningjiang First Middle School, Ningjiang District Construction Primary School, Ningjiang District Experimental Senior High School, Qianguo County Hassar Square, Hassar Road Primary School, Qianguo County First Middle School, Qianguo County Second Middle School and Qianguo County Fifth Middle School. Overall, the spatial distribution of emergency shelters in the central city of Songyuan has formed a development pattern of “double cores and belt-like extensions”, and the outward spread of the agglomeration centre showed a more obvious circle system, i.e., the composite centre formed by the intersection of Culture Street, Democracy Street and Linjiang Street, as well as the composite centre formed by the intersection of Qianguolous Town and Construction Street, showed the highest level of the agglomeration centre, and the outward spread was in circles, and the level of agglomeration gradually decreased.

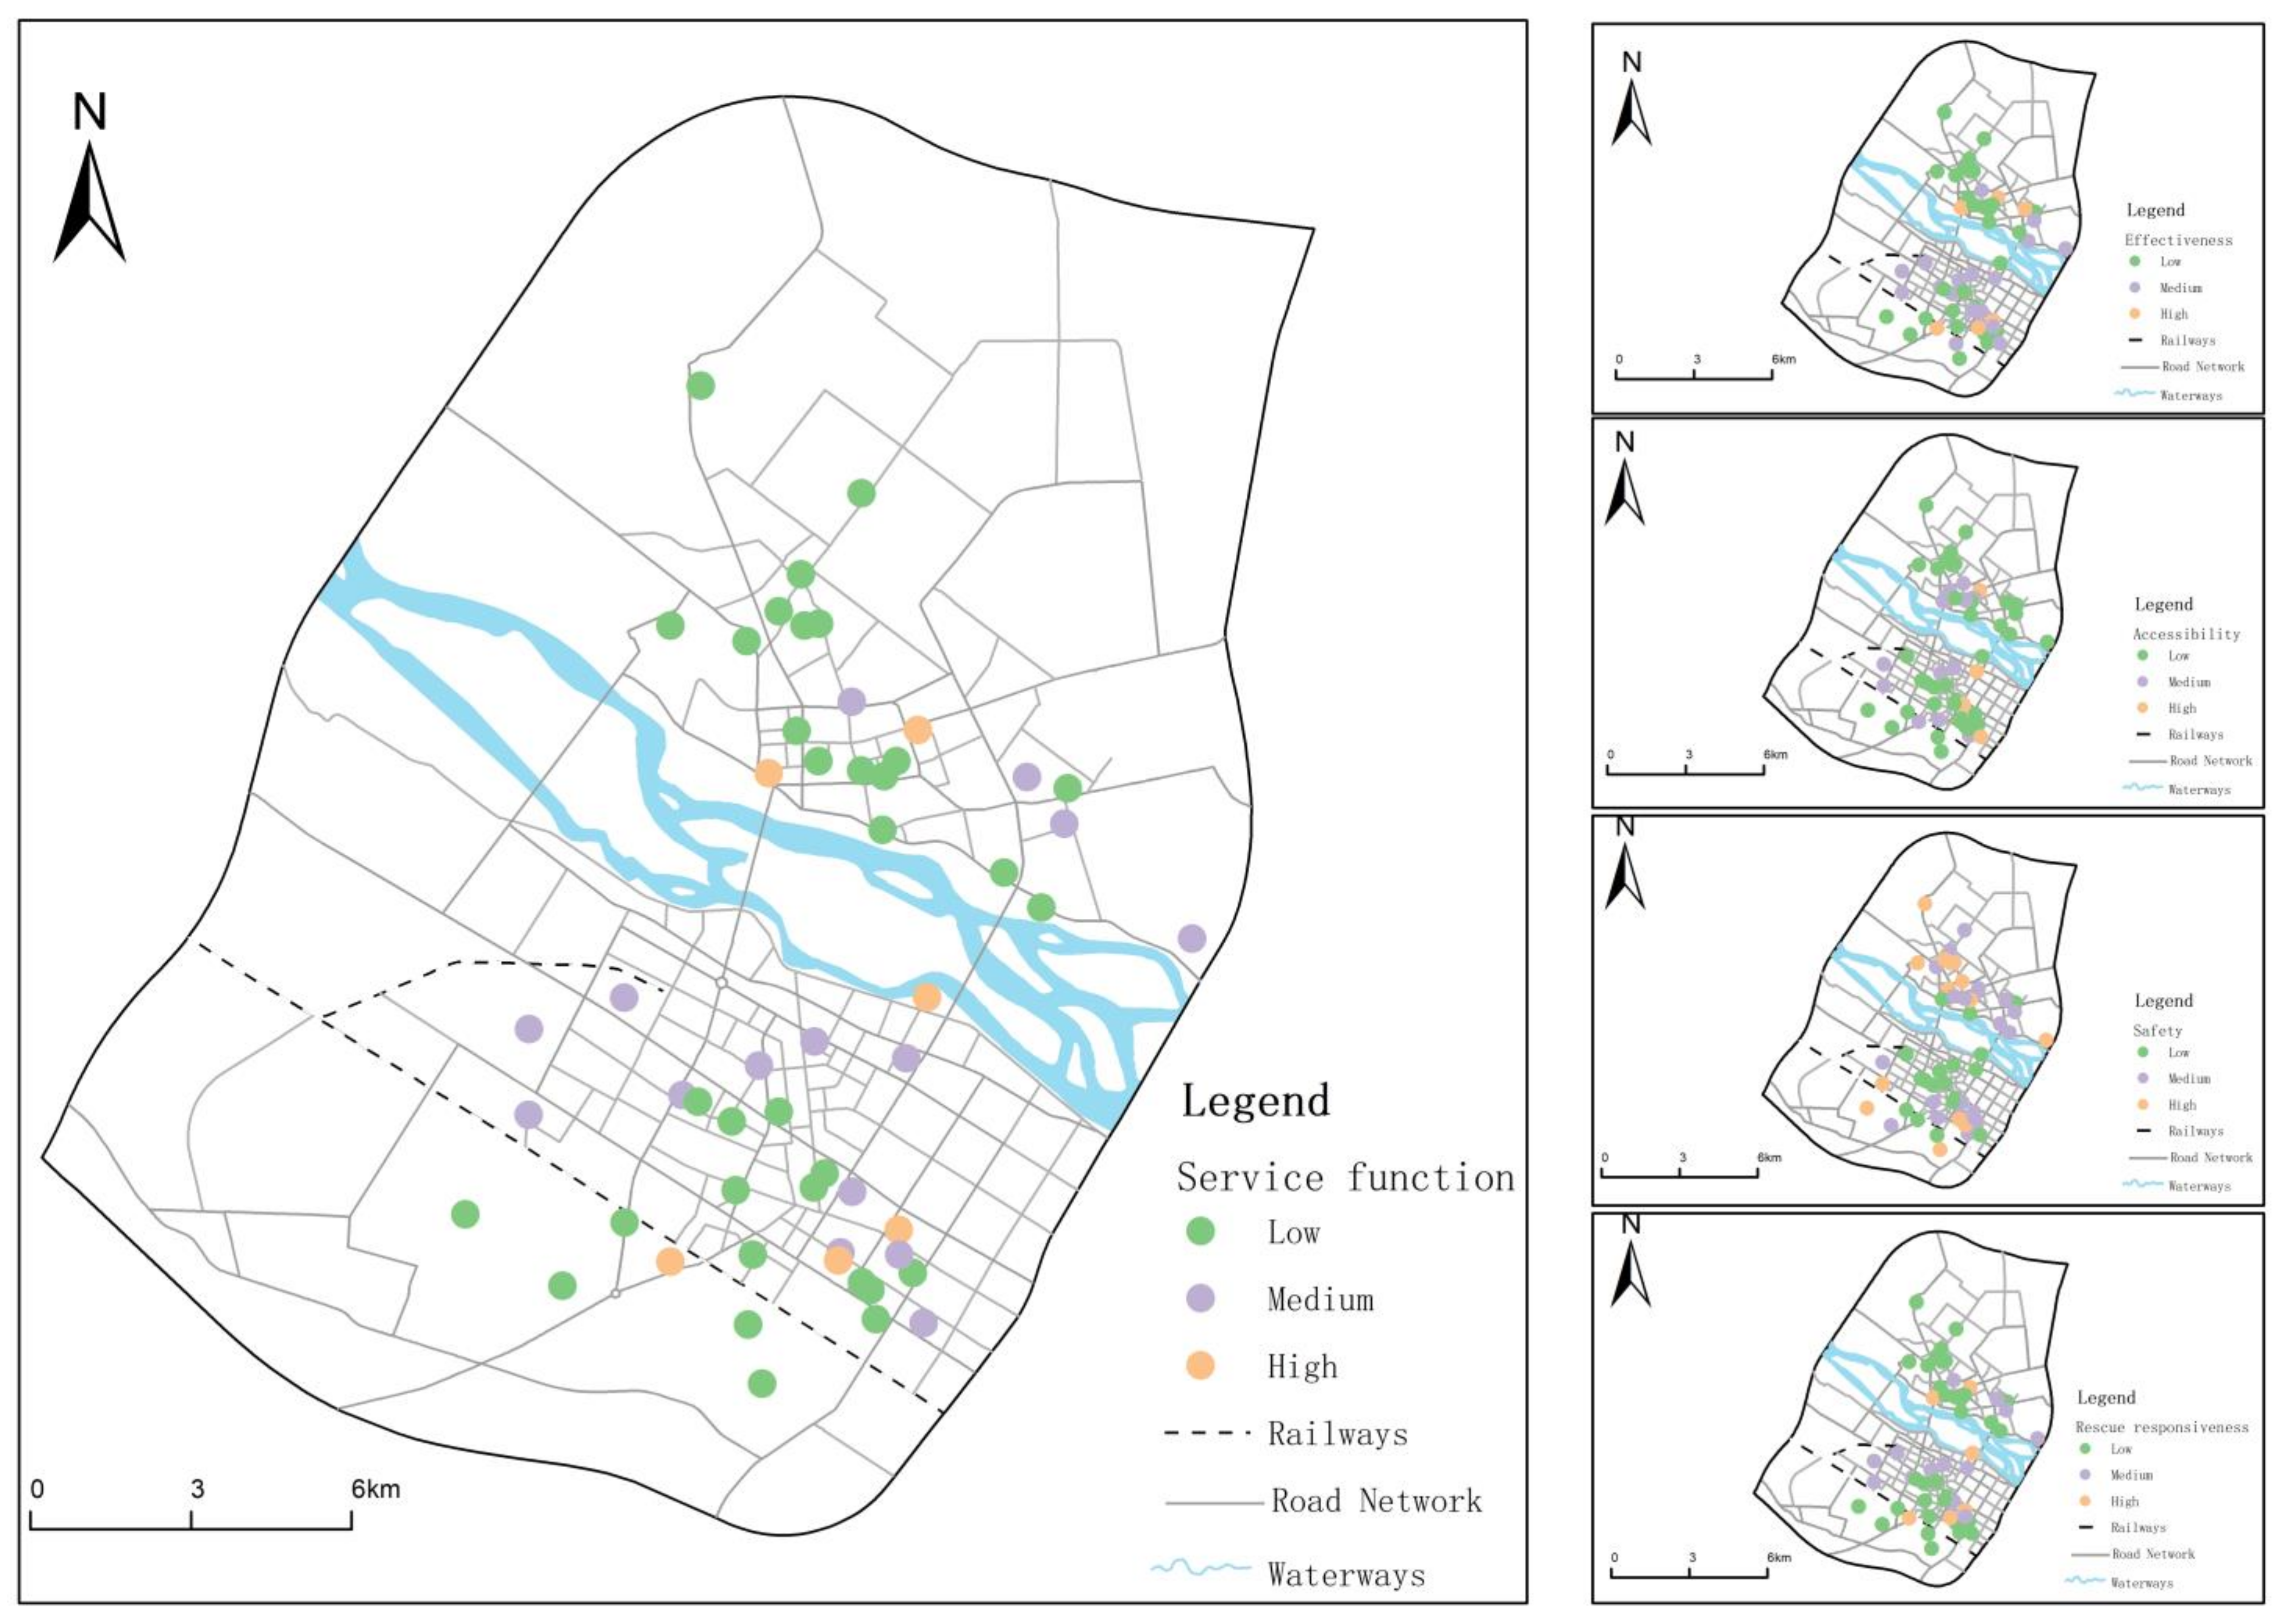
3.2. Results of the Evaluation of the Function of the Shelter Services

3.2.1. Evaluation of the Function of Individual Services in Emergency Shelters

According to the above calculation method, an evaluation of 54 emergency shelters in the central city of Songyuan was carried out to obtain the weighting results (Table 5) and the evaluation results of each single factor, as well as the natural classification method in ArcGIS mapping software to classify the calculated scores into 3 categories (Figure 4).
(1)
Effectiveness evaluation results
Overall, the effectiveness of emergency shelters in the central urban area of Songyuan City was 11.11%, 33.33% and 55.56% for the high, medium and low levels, respectively (Figure 4). The area with good effectiveness was Qianguo Town, which has a large effective refuge area and sufficient resources to provide relief for more victims, while the per capita refuge area basically meets the standard and can better meet the space needs of evacuees. Thirty evacuation sites with poor effectiveness are scattered in the central urban area of Songyuan city, among which the cultural streets are more densely distributed. These places have a small effective area to accommodate a limited number of people and have a limited capacity to receive evacuees, so their effectiveness is not good overall.
(2)
Accessibility evaluation results
According to the accessibility evaluation results, there are 4 high-value areas, 12 medium-value areas and 38 low-value areas, accounting for 7.41%, 22.22% and 70.37%, respectively. The overall effect of the accessibility of regional emergency shelters was poor, mainly in areas such as Mirror Lake Street, the new city and Xing Yuan Township, where the distance from residential areas and public rescue facilities and the low connectivity are the main reasons for the low accessibility of the shelters. As a result, the emergency shelters in the area are not as effective as they could be.
(3)
Safety evaluation results
Overall, the safety scores of the places of refuge in the central city of Songyuan were 25.93%, 40.74% and 33.33% for high, medium and low values, respectively, which shows that the overall safety of the places of refuge in the central city of Songyuan is good, and most of the places of refuge in the region are less threatened by natural hazards and have a higher safety factor. However, some of the places of refuge are close to flammable and explosive places, such as active faults, which pose safety hazards, and could be easily affected by secondary hazards, thus affecting the effect of refuge.
(4)
Rescue responsiveness evaluation results
According to the rescue responsiveness results, the percentages of high, medium and low grades were 11.11%%, 25.93% and 62.96%, respectively. The evaluation results showed that the overall emergency shelter rescue responsiveness in the central city of Songyuan is less than good. Only Tiexi, Binjiang Street and Qianguo Town performed better in terms of the responsiveness of some emergency shelters. Due to the good stockpiling of emergency materials in this area and the adequate medical resources in the surrounding area, medical assistance can be provided to evacuees in a timely manner. The rest of the region has gaps in emergency supply reserves, and the number of health technicians and ambulances in the surrounding hospitals is limited, limiting the overall emergency rescue capacity.

3.2.2. Comprehensive Evaluation of the Function of Emergency Shelter Services

The evaluation scores of each individual element were superimposed and analysed to calculate the evaluation results of the comprehensive service function of refuge places in the central city of Songyuan, and the natural breakpoint method was used to classify the evaluation results into three grades: high ( A i + ≥ 0.507003), medium (0.424313 ≤ A i + < 0.507003) and low ( A i + < 0.424313) (Table 6, Figure 4). In general, the service function evaluation scores of the places of refuge in the central city of Songyuan were all between 0.3852823 and 0.629108, with 6 places of refuge with a high service function grade, 15 places with a medium grade and 33 places with a low grade.
The results of the evaluation showed that the safety, effectiveness, accessibility and rescue response of the shelters in the areas of Qianguo Town, Bethune Street and Tuanjie Street are generally good. Emergency shelters in the region are reasonably located and in close proximity to public rescue facilities so that emergency relief work can be carried out as soon as possible after a disaster. The best service function of these places of refuge was the Plaza Bethune, which is well-stocked with emergency supplies as a permanent place of refuge, has good infrastructure such as emergency toilets, emergency wells and emergency electricity and meets the residents’ need for a space of refuge per capita, and is known to the public because of its reasonable location and high historical status, so its service function is relatively high. The median-value area of evacuation sites was mainly located in Binjiang Street, along the river streets and in Qianguo Town, including 15 evacuation sites such as Songjiang Primary School, Zhongshan Square, Administration Square and Qianguo County Century Square, etc. The overall situation of the effectiveness and rescue response of these evacuation sites is good, with high openness, more people accommodated and more medical resources around the sites, and more ambulances, which can provide timely medical assistance to the evacuees. However, although the individual places of refuge have sufficient space for refuge and are far away from active faults and sources of danger, as well as being safer, they are far away from residential areas and cannot be used to maximum effect in the event of a disaster, so they are generally in the middle-value area of service functions. In terms of spatial location, there is a high degree of overlap between the low-value service areas and the low-value areas of effectiveness, accessibility and rescue response. The type of refuge in this area is mainly schools, which have a limited effective refuge area and are surrounded by a high population density, high traffic pressure and are prone to congestion, in addition to the proximity of the regional emergency refuge to sources of danger, which are easily threatened by flammable and explosive substances or toxic gases, so the overall service function is relatively weak.

3.2.3. Supply and Demand Analysis

Supply and demand analysis is an important part of urban emergency shelter planning, with shelter capacity and potential shelter population being the two most important factors considered in the supply and demand analysis [24]. The study found that the global Moran index of population density and shelter service function in the central city of Songyuan was 0.296, indicating a positive spatial correlation between population density and shelter service function in the central city of Songyuan. The study further analysed the spatial clustering effect of population density and shelter service function based on the binary local LISA aggregation diagram (Figure 5), which can be divided into four types: “high-high”, “low-low”, “low-high” and “high-low”.
(1) The “high-high” distribution grid accounted for 9.41% of the total, mainly in the streets of Minzhu, Boudouna, Tuanjie, Binjiang and Tiexi, as well as Qianguo Town. In terms of its local characteristics, the regional population density is relatively high, and the number of vulnerable human beings (children aged 0–14 and the elderly population aged 65 or above) is high, accounting for more than 25% of the total population of the street (township). The region has a large number of places of refuge and a concentrated layout, mainly parks and squares, with a sufficient effective refuge area, and the population designed to accommodate places of refuge matches the current situation of the regional population and is sufficient to accommodate the region. At the same time, the public rescue facilities (general hospitals, public security organisations, fire stations, etc.) around the places of refuge are relatively complete, which can better meet the needs of the evacuees and the disadvantaged groups for shelter space and medical assistance, and the comprehensive service functions are relatively good, indicating that the relationship between the distribution of population density and the supply and demand of the service functions of the places of refuge in the region shows a “high-high” clustering type. The relationship between the distribution of population density and the supply and demand of shelter services in the area shows a “high-high” clustering type, and a positive correlation.
(2) The “low-low” distribution grid accounts for 21.58%, mainly distributed in the periphery of the central city. The regional resident population is relatively small, the population distribution is sparse and the resident population density is below 500 people/km2. The region’s shelter resources are relatively scattered, mainly of the short-term shelter type, with a small effective shelter area and a limited radius. At the same time, there is no stockpile of basic living materials and disaster relief supplies in the regional shelters, they are far away from supermarkets, fire brigades and other rescue facilities, the emergency response time is long, and the comprehensive service function is low, so there is a “low-low” clustering type of population density distribution and shelter service function.
(3) The “low-high” distribution grid accounts for 2.39% of the total. The analysis shows that the area is sparsely populated and is within the service area of Ningjiang District No. 4 Middle School and Longhua Cultural Park, with sufficient space for refuge. In particular, the Long Hua Cultural Park has an effective evacuation area of 50,000 m2, with a per capita evacuation area much higher than the relevant domestic and international standards, and the infrastructure of the evacuation site is relatively complete, with a certain amount of living materials in reserve, which can meet the evacuation needs of the surrounding residents, and there is an oversupply, so the supply and demand relationship shows a “low-high” clustering type.
(4) The “high-low” distribution grid accounts for 3.63%, mainly in Changning, Qianjin, Heping, Tiexi and Jinghu Streets, with a dense distribution of regional shelters, mainly schools. Although the school is well-connected to the surrounding rescue facilities, the service area is limited, and the population density in the surrounding area is high, so the number of people needing shelter is greater than the designed capacity of the shelter, and some residents cannot utilise the shelter service in case of an emergency. As a result, the comprehensive service function of the refuge is low, and the relationship between the distribution of population density and the supply and demand of the service function of the refuge shows a “high-low” clustering type.

4. Discussion and Suggestions

4.1. Discussion

Different from the perspective of previous studies, this paper constructed an evaluation system for the service function of emergency shelters based on the perspective of evacuees and used the entropy weight–TOPSIS–grey correlation method to evaluate emergency shelters in the central city of Songyuan in four dimensions: effectiveness, accessibility, safety and rescue responsiveness. Based on this, the spatial coupling relationship between the service function of emergency shelters and the distribution of the regional population was further explored to effectively identify the current situation of supply and demand for shelter resources in the central city of Songyuan. The results of the study highlight that the availability of emergency supplies and the number of people accommodated are the main factors influencing the service function of emergency shelters, in addition to the medical assistance capacity of shelters and the connectivity to basic disaster prevention facilities, which also have a significant impact on the overall service function. According to the analysis, there was an overall positive correlation between the service function of emergency shelters and the regional population distribution in the central city of Songyuan. Meanwhile, a significant difference existed between the service function of emergency shelters and the distribution of the regional population. The “high-high” and “low-low” clusters were mainly located in the core of the region and the periphery of the region, and the “high-low” distribution area is the focus of the planning and construction of emergency shelters in Songyuan. In order to meet the needs of evacuees, the service functions of regional emergency shelters should be comprehensively improved in the future.

4.2. Optimisation Suggestions

Starting from the needs of evacuees, the planning and construction of emergency shelters in the central city of Songyuan is proposed to be optimised based on four aspects: accessibility, safety, effectiveness and rescue responsiveness.
(1) Optimise the layout of places of refuge and improve their construction standards
It is necessary to optimise the planning and construction layout of evacuation sites, improve supporting facilities, raise the standard of construction of evacuation sites and extend from meeting the basic living needs of evacuees to meeting diverse needs. The disadvantaged groups have higher requirements for refuge space and supporting facilities. For areas with low effectiveness of refuge places and insufficient refuge space per capita, the construction of refuge places in these areas should be appropriately increased, making full use of existing public infrastructure resources, relying on existing squares, stadiums, schools and other publicly owned buildings for site selection, increasing the supply of refuge places, taking into account the current situation of population distribution, and reinforcing each other with existing refuge places to ensure that every citizen enjoys equal refuge resources. In addition, the construction of evacuation sites should take into account the relationship with the surrounding environment, avoiding the fragmentation of the evacuation space by passing through the city’s main roads, setting up signs for rubbish collection, emergency toilets and emergency water sources, keeping the evacuation space clean and tidy and improving the living environment of the evacuees. Furthermore, taking into account the physiological conditions of specific groups such as infants, elderly people, disabled people with mobility difficulties and the sick and wounded, setting up special evacuation areas or special evacuation units for the week, and carrying out barrier-free design, setting up barrier-free staircases and barrier-free toilets and setting up safe passageways to ensure wheelchair access is also necessary. An emergency command area and an emergency medical and health rescue area should be setup, and the daily training for the managers of the evacuation sites and the emergency command staff should be strengthened, so that they can direct the rapid resettlement of evacuees when the evacuation sites are opened, and provide them with simple medical assistance and psychological counselling when necessary, so as to ultimately achieve the goal of meeting the diverse needs of evacuees.
(2) Focusing on the conversion of daily and disaster functions and improving the road system
As a “combination of daily and disaster use” type of place, emergency shelters only play their role of disaster prevention and avoidance in times of disaster, but in most cases, they are still mainly used to provide public services and are closely related to the daily lives of residents and are frequently used. In the city centre, it is difficult to plan a large number of new evacuation facilities due to land constraints, so it is important to carry out a proper design for emergency conversion and complete functional transformation to reduce land construction and investment. For areas with low accessibility to evacuation sites, such as Qianguo, Xincheng and Xingyuan Townships, it is necessary to improve the road system around existing evacuation sites, reduce travel time for citizens during normal times and in times of disaster, create a high-density pedestrian network, build reasonably wide pedestrian roads, open up cut-off roads and add street crossings on main roads with barriers to reduce detour times and make it easier for residents to get to the sites. The function of emergency shelters is short-lived, and their basic functions are long-term. Focusing on the combination of levelling and reducing the travel time will not only make effective use of public infrastructure, but also reduce the cost of shelter construction and improve the coverage of urban shelters.
(3) Promote a government-led model of interconnected shelter and emergency infrastructure
Unlike normal residents, disaster-affected people find it difficult to access the supplies, medical assistance, etc., that they need in a short period of time [25,26]. From the overall urban planning of Songyuan City, the focus should be on the fact that the shelter should be coordinated with the layout of emergency protection infrastructure and emergency medical and health rescue, material reserve distribution and other emergency service facilities, to create an interconnected model of disaster prevention and mitigation infrastructure under the guidance of the government. There is a need for rapid deployment of resources under the government’s emergency command to people in shelters affected by disasters, to reduce the loss of life and property, to enhance the rescue response capability of the shelter and to lay the foundation for safe urban development. For places of refuge that are not stocked with emergency supplies, the government should strengthen their management to ensure that the stockpile distribution infrastructure can distribute relief supplies to places of refuge in the event of possible disruptions to the transport network. For areas with low accessibility and a poor rescue response, such as Xingyuan and Xincheng Townships, which have a relatively sparse distribution of people and limited access to basic public facilities, the requirements for shelter and service areas can be appropriately relaxed. In addition, in the future urban planning and construction process, the construction of basic public service facilities, such as comprehensive hospitals, large supermarkets and material reserves, should be setup in conjunction with the location of evacuation sites, so as to reasonably allocate disaster relief resources and improve the level of disaster prevention and mitigation in the region, from point to point.
(4) Enhancing awareness of evacuation sites and improving evacuation efficiency
The public’s access to disaster information and knowledge of disaster prevention and avoidance is relatively limited. Efforts should be stepped up to educate the public on evacuation techniques, and the specific addresses and access routes to emergency shelters should be publicised through radio, television, mobile phone text messages, electronic display screens and the internet to improve the public’s knowledge of disaster information and shelters. For vulnerable people, mainly children and the elderly, the approach can be tailored to their characteristics. Kindergartens, primary and secondary schools are gradually improving disaster prevention education for children, organising disaster prevention quizzes and emergency drills based on different disaster scenarios to improve children’s disaster prevention and avoidance capabilities. The community and nursing homes will be used to publicise places of refuge and to disseminate disaster prevention knowledge to the elderly. Regularly, they will watch disaster prevention films and lectures, and setup windows, galleries and wall posters to publicise the location of places of refuge and escape routes, so as to improve the elderly’s comprehensive knowledge of places of refuge. The publicity of evacuation sites should be strengthened to prevent people from choosing the same evacuation site, to improve the efficiency of the use of evacuation sites and to meet the needs of residents for emergency evacuation.

5. Conclusions

(1) From the perspective of evacuees’ needs, here, the evaluation indexes of the existing emergency shelters were enriched by adding rescue responsiveness criteria. The entropy weight–TOPSIS–grey correlation method was used to evaluate the service function of emergency shelters in the central city of Songyuan, which provided both the evaluation level and the index of the results, making the evaluation results more accurate and more comprehensively reflecting the rationality of the current spatial distribution of emergency shelters and their service functions.
(2) Using the bivariate Moran index to explore the interaction between shelter service functions and population distribution, it is possible to identify the coordination characteristics between emergency shelter resources and population distribution.
(3) From the perspective of the diversified needs of evacuees, the optimisation strategy of emergency evacuation places was proposed. This allows to optimise the layout of evacuation sites, improve construction standards, meet the needs of the diverse population for evacuation space and support facilities, strengthen the conversion of evacuation sites into disaster-levelling designs, optimise road systems, reduce travel and escape times for the public and provide a path for effectively safeguarding the lives and property of the public and improve the regional disaster prevention and mitigation capabilities.
Compared with previous studies, the evaluation index system for emergency shelters constructed in this paper has been improved in terms of considering the demand of the evacuated population and analysing the supply and demand of the service functions and population distribution of shelters. However, due to the limitations of data acquisition, the spatial and temporal differences in the population between day and night could not be analysed. In the future, we will strengthen our research on this aspect and consider the supply and demand situation in different disaster contexts.

Author Contributions

Methodology, S.T.; formal analysis, S.T.; investigation, Y.X., J.Z., W.Z. and G.W.; resources, Y.X., S.C., J.Z. and W.Z.; writing—original draft, S.T.; writing—review and editing, J.W. All authors have read and agreed to the published version of the manuscript.

Funding

The authors gratefully acknowledge the support provided by the Natural Hazard Risk Census Project in Jilin Province (JLSZC202002826).

Institutional Review Board Statement

Not applicable.

Informed Consent Statement

Informed consent was obtained from all subjects involved in the study.

Data Availability Statement

Not applicable.

Conflicts of Interest

The authors declare no conflict of interest.

References

  1. Fan, C.; Zhai, G.; Zhou, S.; Zhang, H.; Qiao, P. Integrated Framework for Emergency Shelter Planning Based on Multihazard Risk Evaluation and Its Application: Case Study in China. Nat. Hazards Rev. 2017, 18, 05017003. [Google Scholar] [CrossRef]
  2. Chen, W.; Zhai, G.; Ren, C.; Shi, Y.; Zhang, J. Urban Resources Selection and Allocation for Emergency Shelters: In a Multi-Hazard Environment. Int. J. Environ. Res. Public Health 2018, 15, 1261. [Google Scholar] [CrossRef] [PubMed]
  3. Cao, Y.; Guo, Y.; Wang, C.; Li, Y. Evaluation and Optimization of Refuge Green Space in the Central Area of Tianjin for Geological Disasters. Sustainability 2022, 14, 15507. [Google Scholar] [CrossRef]
  4. Liu, Y.; Yang, Y.; Li, L. Major natural disasters and their spatio-temporal variation in the history of China. J. Geogr. Sci. 2012, 22, 963–976. [Google Scholar] [CrossRef]
  5. Wang, Q.; Zhang, Q.P.; Liu, Y.Y.; Tong, L.J.; Zhang, Y.Z.; Li, X.Y.; Li, J.L. Characterizing the spatial distribution of typical natural disaster vulnerability in China from 2010 to 2017. Nat. Hazards 2020, 100, 3–15. [Google Scholar] [CrossRef]
  6. Li, G.; Qin, P.Y.; Dong, Z.Q.; Li, H.N. Research Progress on Risk Analysis and Design for Structures under Multiple Hazards of Earthquake and Flood. J. Disaster Prev. Mitig. 2022, 42, 237–250. [Google Scholar]
  7. Chu, J.Y.; Su, Y.P. Comprehensive Evaluation Index System in the Application for Earthquake Emergency Shelter Site. Adv. Mater. Res. 2011, 156-157, 79–83. [Google Scholar] [CrossRef]
  8. Zhou, A.H.; Chen, L.; Zhu, H.Y.; Chen, S.Y. Reasonability of spatial distribution for urban emergency shelter in central district of Beijing at community scale. J. Saf. Environ. 2021, 21, 1662–1669. [Google Scholar]
  9. Shi, Y.; Zhai, G.; Xu, L.; Zhu, Q.; Deng, J. Planning Emergency Shelters for Urban Disasters: A Multi-Level Location–Allocation Modeling Approach. Sustainability 2019, 11, 4285. [Google Scholar] [CrossRef]
  10. Liu, Q.; Ruan, X.; Shi, P. Selection of emergency shelter sites for seismic disasters in mountainous regions: Lessons from the 2008 Wenchuan Ms 8.0 Earthquake, China. J. Asian Earth Sci. 2011, 40, 926–934. [Google Scholar] [CrossRef]
  11. Zhang, M. Disaster prevention and mitigation in foreign cities and our thoughts. Planners 2000, 2, 101–104. [Google Scholar]
  12. FEMA. The National Earthquake Hazards Reduction Program (NEHRP) Fact Sheet. Available online: https://www.fema.gov/media-library/assets/documents/5772 (accessed on 18 January 2023).
  13. Imaizumi, A.; Ito, K.; Okazaki, T. Impact of natural disasters on industrial agglomeration: The case of the Great Kantō Earthquake in 1923. Explor. Econ. Hist. 2016, 60, 52–68. [Google Scholar] [CrossRef]
  14. Cabinet Office. Government of Japan White Paper on Disaster Management. 2013. Available online: http://www.bousai.go.jp/kaigirep/hakusho/ (accessed on 13 January 2023).
  15. Xiong, Y.; Liang, F.; Qiao, Y.J.; Bo, T. Mitigation Capabilities Evaluation System of Beijing earthquake emergency shelters. Technol. Earthq. Disaster Prev. 2014, 9, 921–931. [Google Scholar]
  16. Wei, B.; Tan, Q.; Li, X. Assessment on Spatial Distribution and Service Efficiency of Emergency Shelters in Beijing. J. Seismol. Res. 2019, 42, 295–303+306. [Google Scholar]
  17. Wang, X.; Guan, M.; Dong, C.; Wang, J.; Fan, Y.; Xin, F.; Lian, G. A Multi-Indicator Evaluation Method for Spatial Distribution of Urban Emergency Shelters. Remote Sens. 2022, 14, 4649. [Google Scholar] [CrossRef]
  18. Anhorn, J.; Khazai, B. Open space suitability analysis for emergency shelter after an earthquake. Nat. Hazards Earth Syst. Sci. 2015, 15, 789–803. [Google Scholar] [CrossRef]
  19. Zhu, X.; Tong, Z.; Liu, X.; Li, X.; Lin, P.; Wang, T. An Improved Two-Step Floating Catchment Area Method for Evaluating Spatial Accessibility to Urban Emergency Shelters. Sustainability 2018, 10, 2180. [Google Scholar] [CrossRef]
  20. Zhang, X.; Yu, J.; Chen, Y.; Wen, J.; Chen, J.; Yin, Z. Supply–Demand Analysis of Urban Emergency Shelters Based on Spatiotemporal Population Estimation. Int. J. Disaster Risk Sci. 2020, 11, 519–537. [Google Scholar] [CrossRef]
  21. Zhong, G.; Zhai, G.; Chen, W. Optimization on Spatial Distribution of Shelter through Dynamic Evacuation Simulation of High Density Urban Area-Xinjiekou Case. KSCE J. Civ. Eng. 2022, 26, 4760–4776. [Google Scholar] [CrossRef]
  22. FEMA. Guidance on Planning for Integration of Functional Needs Support Services in General Population Shelters. Available online: https://www.fema.gov/ (accessed on 19 January 2023).
  23. Li, W.; Zhai, G.; Gu, F.; Chen, Z. Inspirations of Japanese Welfare Shelter Construction for Aging China. Urban Plan. Int. 2019, 34, 119–126. [Google Scholar] [CrossRef]
  24. Yazdani, M.; Mojtahedi, M.; Loosemore, M.; Sanderson, D.; Dixit, V. Hospital evacuation modelling: A critical literature review on current knowledge and research gaps. Int. J. Disaster Risk Reduct. 2021, 66, 102627. [Google Scholar] [CrossRef]
  25. Su, H.; Chen, W.; Zhang, C. Evaluating the effectiveness of emergency shelters by applying an age-integrated method. GeoJournal 2023, 88, 951–969. [Google Scholar] [CrossRef]
  26. Yao, Y.; Zhang, Y.; Yao, T.; Wong, K.; Tsou, J.Y.; Zhang, Y. A GIS-Based System for Spatial-Temporal Availability Evaluation of the Open Spaces Used as Emergency Shelters: The Case of Victoria, British Columbia, Canada. ISPRS Int. J. Geo-Inf. 2021, 10, 63. [Google Scholar] [CrossRef]
  27. Ruang, D.J.; Li, C.G.; Wu, Z.Z. Method of assessment of urban emergency shelter adaptation. Prog. Saf. Sci. Technol. 2006, 6, 434–438. [Google Scholar]
  28. Jia, Y.; Wen, J. Multi-criteria Satisfaction Assessment of the Spatial Distribution of Urban Emergency Shelters Based on High-Precision Population Estimation. Int. J. Disaster Risk Sci. 2016, 7, 413–429. [Google Scholar]
  29. Li, P.; Ji, Y.; Wu, Z.; Qu, S.J. A New Multi-Attribute Emergency Decision-Making Algorithm Based on Intuitionistic Fuzzy Cross-Entropy and Comprehensive Grey Correlation Analysis. Entropy 2020, 22, 768. [Google Scholar] [CrossRef]
  30. Statistics Bureau of Jilin. Statistical Bulletin on National Economic and Social Development of Songyuan City in 2021. Available online: http://tjj.jl.gov.cn/tjsj/tjgb/ndgb/ (accessed on 1 December 2022).
  31. Statistics Bureau of Songyuan. Songyuan City 7th National Census Bulletin. Available online: http://www.jlsy.gov.cn/zwgk/sjsy/tjgb/ (accessed on 5 December 2022).
  32. Zhang, R.; Feng, J.; Lei, H.; Yu, H.; Ma, F.; Wang, J. Characteristics of Building Seismic Damage in Songyuan M5.7 and M5.1 Earthquakes and its Enlightenment. J. Inst. Disaster Prev. 2022, 24, 80–87. [Google Scholar]
  33. Geng, S.; Hou, H. Demand Stratification and Prediction of Evacuees after Earthquakes. Sustainability 2021, 13, 8837. [Google Scholar] [CrossRef]
  34. Pérez-Galarce, F.; Canales, L.J.; Vergara, C.; Candia-Véjar, A. An optimization model for the location of disaster refuges. Socio-Econ. Plan. Sci. 2017, 59, 56–66. [Google Scholar] [CrossRef]
  35. Veenema, T.G.; Rains, A.B.; Casey-Lockyer, M.; Springer, J.; Kowal, M. Quality of healthcare services provided in disaster shelters: An integrative literature review. Int. Emerg. Nurs. 2015, 23, 225–231. [Google Scholar] [CrossRef]
  36. Chen, P. A Novel Coordinated TOPSIS Based on Coefficient of Variation. Mathematics 2019, 7, 614. [Google Scholar] [CrossRef]
  37. Mohammadnazari, Z.; Mousapour Mamoudan, M.; Alipour-Vaezi, M.; Aghsami, A.; Jolai, F.; Yazdani, M. Prioritizing Post-Disaster Reconstruction Projects Using an Integrated Multi-Criteria Decision-Making Approach: A Case Study. Buildings 2022, 12, 136. [Google Scholar] [CrossRef]
  38. Dong, J.; Ji, H.; Miao, L. Reliability Analysis of Electric Human Factors Based on Grey Correlation Analysis. IOP Conf. Ser. Earth Environ. Sci. 2019, 252, 032128. [Google Scholar] [CrossRef]
  39. Liu, S.; Fang, Z.; Xie, N.; Yang, Y. Explanation of terms of Grey models for decision-making. Grey Syst. Theory Appl. 2018, 8, 382–387. [Google Scholar] [CrossRef]
  40. Wei, J.; Ding, Z.; Meng, Y.; Li, Q. Regional Sustainable Assessment at City Level Based on CSDIS (China Sustainable Development Indicator System) Concept in the New Era, China. Chin. Geogr. Sci. 2020, 30, 976–992. [Google Scholar] [CrossRef]
Figure 1. Study area overview map.
Sustainability 15 07283 g001
Figure 2. Research flowchart.
Sustainability 15 07283 g002
Figure 3. Emergency shelter layout features.
Sustainability 15 07283 g003
Figure 4. Results of the evaluation of the function of emergency shelter services.
Sustainability 15 07283 g004
Figure 5. Results of the spatial analysis of population density and the function of shelter services.
Sustainability 15 07283 g005
Table 1. Indicator factors related to the evaluation of emergency shelters.
First-Level IndicatorSecond-Level IndicatorTarget Vector
EffectivenessEffective area of emergency shelterPositive
Number of capacityPositive
Effective service rangePositive
Refuge area per capitaPositive
Infrastructure situationPositive
AccessibilityDistance from the hospitalNegative
Distance from the fire stationNegative
Distance from large supermarketsNegative
Distance from the settlementNegative
SafetySite slopeNegative
Area of surrounding high-rise buildingsNegative
Distance from hazard sourcesPositive
Distance from earthquake fault zonePositive
Distance from geological faultsPositive
SuitabilityOpen-space ratioPositive
CrowdednessNegative
FairnessService overlap ratioNegative
Configuration gapsNegative
Table 2. Data sources.
DataSource
Map of the central city of SongyuanNational Geographic Information Public Service Platform
Population dataThe Seventh National Census Bulletin of Songyuan City, the Statistics of the National Economic and Social Development Statistics in 2020
Emergency shelter informationSongyuan Earthquake Bureau website
Data on medical institutionsSongyuan Health and Wellness Committee website (http://wsjkw.jlsy.gov.cn/ (accessed on 25 December 2022))
Road vector dataOpen Street Map
Digital elevation modelGeographical cloud platform
Active fault vector dataEarthquake Activity Fleece Exploration Data Centre
Table 3. Evaluation indicator system.
First-Level IndicatorSecond-Level IndicatorIndex ExplanationTarget Vector
EffectivenessOpen-space ratioRatio of the effective area of the refuge to the footprint of the premisesPositive
CapacityMaximum number of emergency shelter population that can be accommodated in the shelterPositive
Refuge area per capitaRatio of effective area of refuge to number of people accommodatedPositive
AccessibilityPedestrian accessibilityNumber of people receiving emergency shelter within the service area of the shelterPositive
Distance from the hospitalThe closest distance to medical institutionsNegative
Distance from the fire stationThe closest distance to the fire stationNegative
Distance from the public security authoritiesThe closest distance to the public security organisationsNegative
Distance to commercial service areasThe closest distance to the commercial service areaNegative
SafetyDistance from active faultsThe closest distance to the seismic activity faultPositive
Distance from hazard sourcesThe closest distance to gas stations and chemical parksPositive
Site slopeThe terrain of the refuge should not be too large, and the slope of the terrain should not be greater than 7° after engineeringNegative
Terrain conditionsThe elevation data are used to determine the topography of the shelter, which is high enough to be less threatened by floodingNegative
Rescue responsivenessEmergency supplies stockpileShelter sites stocked with basic living materials, medical supplies, resettlement kits, etc., 1 point for 1 item or more, 0 points for non-compliancePositive
Emergency facilitiesFire-fighting facilities, communication facilities, medical facilities, water supply facilities and power supply facilities in the refuge, 1 point for two or more, 0 points for nonePositive
Number of emergency commandersTotal number of permanent staff maintaining or managing places of refuge on a daily basisPositive
Number of ambulances to the nearest hospitalNumber of ambulances from the nearest medical facility to the evacuation sitePositive
Number of health technicians at the nearest hospitalNumber of health technicians in the nearest health facility to the refugePositive
Number of beds at the nearest hospitalNumber of beds in the nearest medical facility to the refugePositive
Table 4. Statistics on the construction of places of refuge in the central city of Songyuan.
No.Name of StreetStreet Area/km2Number of Emergency SheltersEffective Area for Emergency SheltersNo.Name of StreetStreet Area/km2Number of Emergency SheltersEffective Area for Emergency Shelters
1Binjiang Street9.49316,00012Economic and Technological Development Zone7.75581,000
2Bethune Street3.213158,00013Tiexi Street2.8814800
3Fanrong Street1.190014Tuanjie Street3.04211,000
4Gongnong Street0.650015Wenhua Street0.934125,000
5Heping Street1.501500016Xincheng Township71.13317,500
6Jianshe Street1.572980017Xinqu Street11.224113,000
7Jinghu Street1.78358,00018XingyuanTownship75.2438000
8Linjiang Street3.48111,20019Yanjiang Street4.63318,500
9Minzhu Street2.101450020Changning Street0.66215,500
10Qianjin Street1.822600021QianguolosTownship8.4411156,500
11Shihua Street0.5200
Table 5. Indicator weighting results.
First-Level IndicatorSecond-Level IndicatorWeight
EffectivenessOpen-space ratio0.0386
Capacity0.1308
Refuge area per capita0.0148
AccessibilityPedestrian accessibility0.0885
Distance from the hospital0.0061
Distance from the fire station0.0093
Distance from the public security authorities0.0047
Distance to commercial service areas0.0062
SafetyDistance from active faults0.0176
Distance from hazard sources0.0354
Site slope0.0140
Terrain conditions0.0280
Rescue responsivenessEmergency supplies stockpile0.2890
Emergency facilities0.0075
Number of emergency commanders0.0658
Number of ambulances to the nearest hospital0.0997
Number of health technicians in the nearest hospital0.0678
Number of beds in the nearest hospital0.0764
Table 6. Results of the evaluation of the function of emergency shelter services.
Name of Emergency ShelterEvaluation ResultsGradeName of Emergency ShelterEvaluation ResultsGradeName of Emergency ShelterEvaluation ResultsGrade
Berdune Square0.629108HighSchool of Health0.4390513MediumSecond Senior Secondary School0.4062639Low
Mongolian Middle School0.628369HighCentury Square0.4385886MediumSchool for the Deaf0.4056373Low
Jiangbin Park0.628023HighSurid Park0.4341492MediumHeerchil Primary School0.4054404Low
Naren Khan Park0.626991HighBalda Park0.4243132LowOilfield Second Middle School0.4028111Low
Ningjiang District Fourth Middle School0.624171HighProsperity District Square0.4238444LowNingjiang First Middle School0.4014672Low
Hassar Road Primary School0.623482HighGuoqi Street Square0.4228981LowOilfield Vocational University0.4008389Low
Songyuan Vocational and Technical College0.507003MediumNingjiang District Experimental Primary School0.4205521LowConstruction Primary School0.4005275Low
Qianguo County Fifth Middle School0.479281MediumTiexi Grain Depot0.4203456LowQianguo County No.3 Secondary School0.4000878Low
Fujiang Yuan Square0.477948MediumHouwafang Village Committee0.4185571LowNingjiang District Experimental Middle School0.399896Low
National Sports Stadium0.471939MediumOilfield Supply Primary School0.4154991LowYujia Primary School0.3998152Low
Longhua Cultural Park0.471212MediumOilfield Eleven Middle School0.4150573LowPlanning Exhibition Hall0.3983458Low
Linjiang Primary School0.455391MediumJinghu Park0.4146364LowExperimental Senior High School0.3983234Low
Karun House Primary School0.449625MediumQianguo County First Middle School0.4142242LowOilfield Logging Primary School0.3969815Low
Zhongshan Square0.449272MediumBajiazi Primary School0.4139191LowDock Square0.3952523Low
Hassar Square0.447090MediumShanjia Village Primary School0.4112123LowOilfield Experimental Primary School0.394908Low
Songjiang Primary School0.446442MediumXincheng Secondary School0.4088768LowQianguo County Second Middle School0.3939445Low
Economic Development Zone Square0.445585MediumHuizu Primary School0.4083038LowOilfield Teachers’ Training School0.3872365Low
Administration Square0.439921MediumExperimental Primary School0.4076816LowWanghu Park0.3852823Low
Disclaimer/Publisher’s Note: The statements, opinions and data contained in all publications are solely those of the individual author(s) and contributor(s) and not of MDPI and/or the editor(s). MDPI and/or the editor(s) disclaim responsibility for any injury to people or property resulting from any ideas, methods, instructions or products referred to in the content.

