Article

Trend for Soil CO2 Efflux in Grassland and Forest Land in Relation with Meteorological Conditions and Root Parameters

Institute of Agriculture, Lithuanian Research Centre for Agriculture and Forestry, Kedainiai District, 58344 Akademija, Lithuania
*
Author to whom correspondence should be addressed.
Sustainability 2023, 15(9), 7193; https://doi.org/10.3390/su15097193
Submission received: 22 February 2023 / Revised: 21 April 2023 / Accepted: 24 April 2023 / Published: 26 April 2023

Abstract

:
The key process in understanding carbon dynamics under different ecosystems is quantifying soil CO2 efflux. However, this process can change annually as it depends on environmental variables. The results of this paper present the effects of root network, soil temperature, and volumetric water content on soil CO2 efflux, which were investigated on Retisol of two types of land uses in Western Lithuania in 2017–2019: forest and grassland. It was determined that the average soil CO2 efflux in the grassland was 32% higher than in the forest land. The CO2 efflux, average across land uses, tended to increase in the following order: 2017 < 2018 < 2019. Dry weather conditions with high temperatures during the vegetation period governed the soil CO2 efflux increase by 14%. Soil temperature (up to 20 °C) and volumetric water content (up to 23–25%) had a positive effect on the soil CO2 efflux increase on Retisol. We established that the root’s activity plays one of the main roles in the CO2 production rate—in both land uses, the soil CO2 efflux was influenced by the root length density and the root volume.

1. Introduction

One of the most important priorities for the environment nowadays is climate change, and one of the major impacts of this process is the increased amount of atmospheric carbon dioxide (CO2) [1]. The CO2 soil emissions are a result of biochemical processes due to plant root and microbial respiration [2,3]. The intensity of CO2 emissions can vary depending on soil type and soil properties, land management practices, wide ranges of meteorological conditions, and other factors [4,5,6,7,8]. Weather conditions (temperature and precipitation) and agricultural practices influence soil temperature and water content which in turn, affect the intensity of CO2 soil emissions [9,10,11]. A decrease in CO2 soil emissions might be due to a decrease in soil temperature [12], while greater soil moisture availability can accelerate CO2 efflux due to enhanced microbial activity [13]. Soil temperature and humidity are influenced by meteorological conditions annually; thus, CO2 emissions will be different for each specific year and location. The research results published by Putramentaite et al. [14] revealed that soil temperature was the main factor having impact on soil respiration, while the temperature effect was suppressed by the influence of soil moisture content, air temperature, and the amount of rainfall. The results published by Scotland scientists revealed that soil temperature and moisture content were the main determinants influencing the soil gas origination rate [15]. In different genesis of soils, CO2 efflux demonstrated a typical polynomial relationship with soil temperature, but the relationship was very weak [16]. Some other research in Lithuania revealed [17] a significant but negative correlation between soil temperature and CO2 soil emissions. Rey et al. [18] concluded that the soil temperature and CO2 emissions from the soil did not correlate, but a positive linear correlation was found between soil moisture and CO2 release. Pergrina [19] showed that the CO2 emissions were intensified after precipitation events. This was related to heterotrophic respiration intensity.
Agriculture management practices that increase soil moisture content and decrease soil temperature by providing soil surface cover can accelerate soil biological activity, which can improve soil organic matter sequestration [3]. Different grassland management systems have a great impact on the quantity and quality of plant residue input to the soil, and can also influence the intensity of the CO2 emissions from the soil [20]. Land use changes such as grassland, the establishment of woody species within the agricultural landscape, as well as soil tillage intensity have the potential to sequester atmospheric carbon and are capable of offsetting CO2 emissions [21]. Woody species incorporated within the agricultural landscape can also influence CO2 emissions by altering the respiration intensity of plant roots [22], along with soil temperature and moisture, and controlling mineralizable carbon contents [23]. The trees reduce air movement. Due to this, the trees cause lower soil surface evaporation, increase soil wetness [24], and decrease the temperature of the soil. This result slows the microbial processes responsible for the mineralization of soil organic matter, and hence reduces the CO2 gas emissions [25].
Summing up the results, it could be stated that the effect of different land uses on soil CO2 emissions is very complex. It is determined by various factors, including meteorological conditions. The aim of this study was to investigate the impacts of changing meteorological conditions and two different natural land-use (grassland and forest land) methods on plant root network on soil CO2 efflux on Retisol in Lithuania.

2. Materials and Methods

2.1. Experimental Site and Soil Description

The type of soil in this study is classified according to WRB [26] as Dystric Retisol (Loamic, Bathygleyic), near Bijotai (55°31′12″ N, 22°36′55″ E), Šilalė district [16]. Retisols are representative and commonly found in the Western part of Lithuania, mainly in the forest areas. The experiment was carried out on two natural land uses (forest and grassland) on Retisol. The natural forest (60–80% closed) is 90 years old with the dominant tree (average diameter—35 cm (vary from 30 to 90 cm and 20–25 m in height)) species: Quercus robur L. (60%) and Acer platanoides L. (40%), including those with predominant perennial grass cover: Pulmonaria obscura L., Anemone nemorosa L., and Aegopodium podagraria L. The natural grassland consisted of the following botanical grass composition: Trifolium repens L., Taraxacum officinale L., Leontodon autumnalis L., Festuca ovina L., and Dactylis glomerata L. The content of organic carbon in the soil at the 0–10 cm layer averaged 27.5 g kg−1 in the forest and 13.3 g kg−1 in the grassland. The soil textural composition and bulk density of 0–10 cm layer at the experimental sites are presented in Table 1.

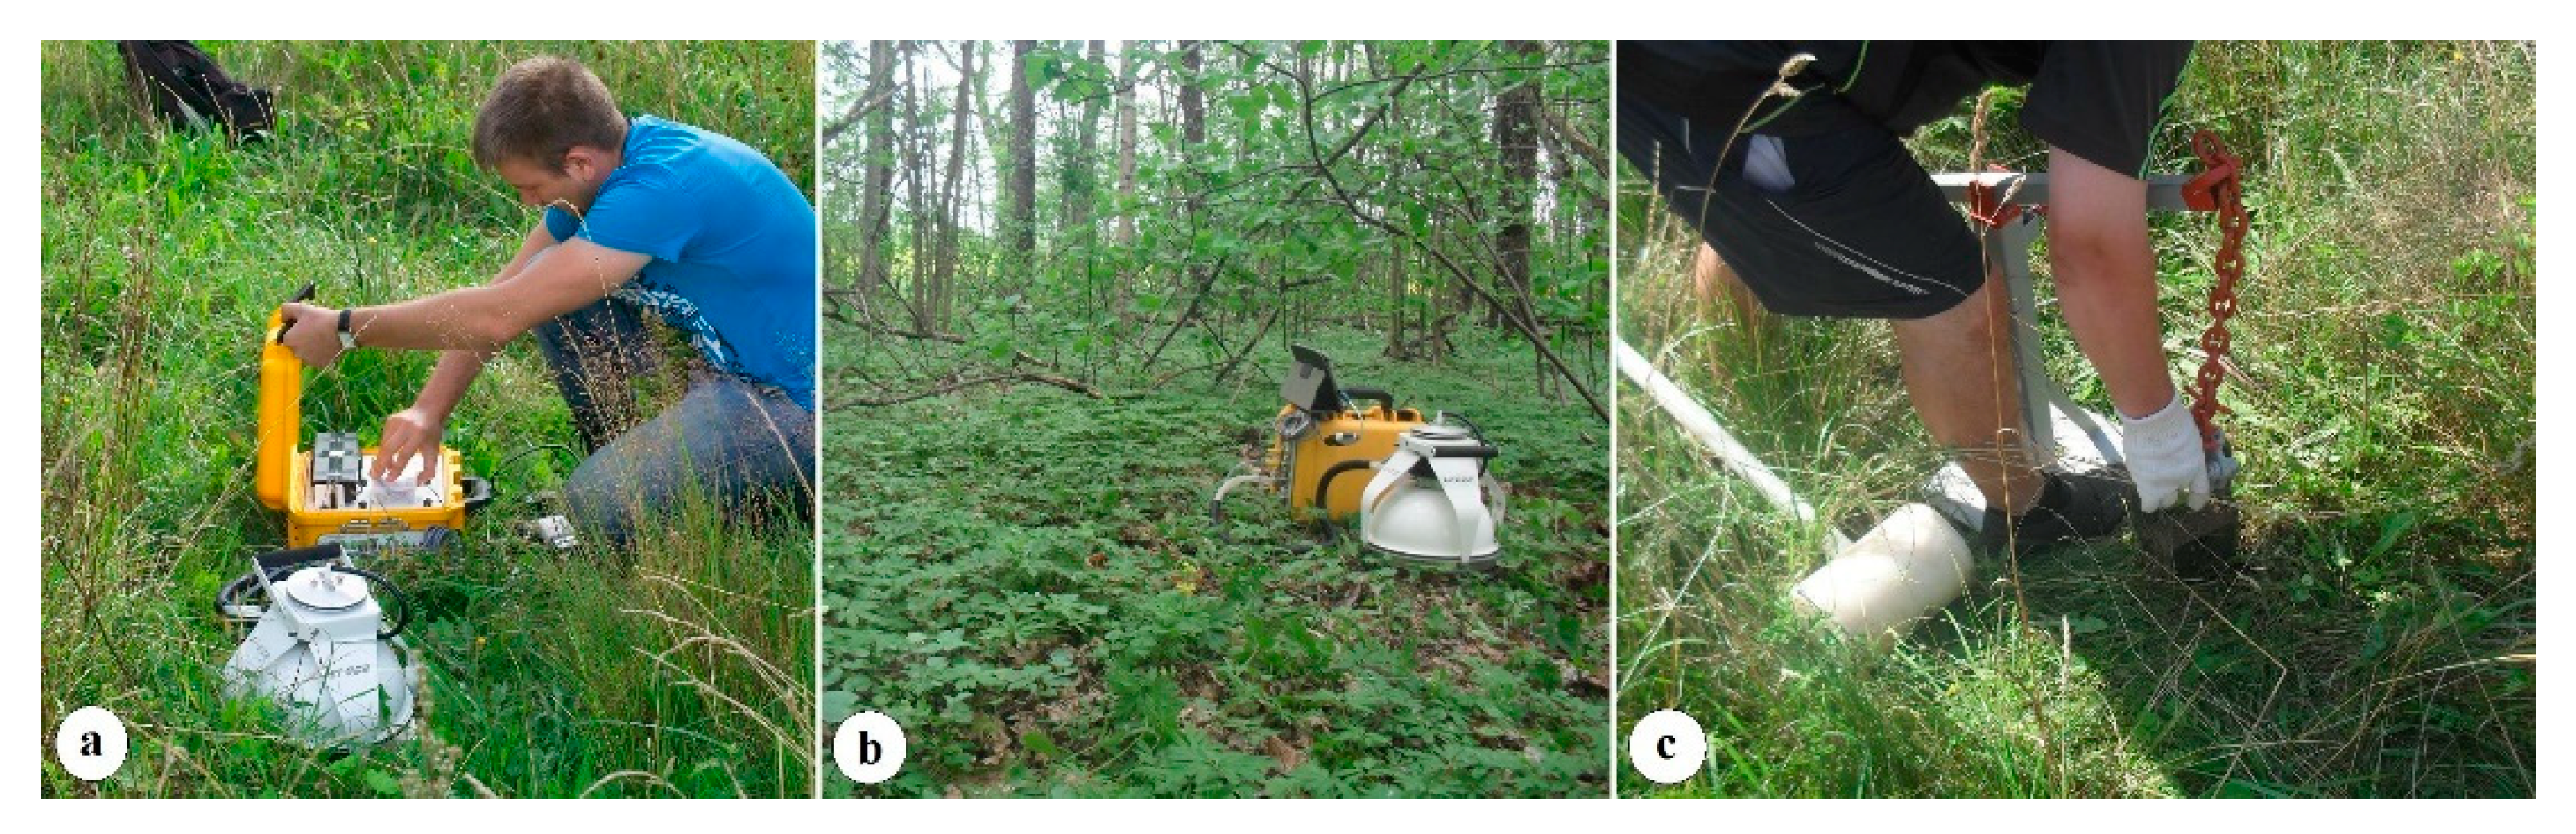
2.2. Measurements of Soil CO2 Efflux

In this study, the soil CO2 efflux (0–10 cm) was measured (Figure 1a,b) at the same time of the day (from 10 a.m. to 5 p.m.) using a closed CO2 efflux measurement chamber LI-8100A (LI-COR Inc., Lincoln, NE 68504, USA). The CO2 efflux from each land use with three replications was measured six times per growing season in 2017, 2018, and 2019.

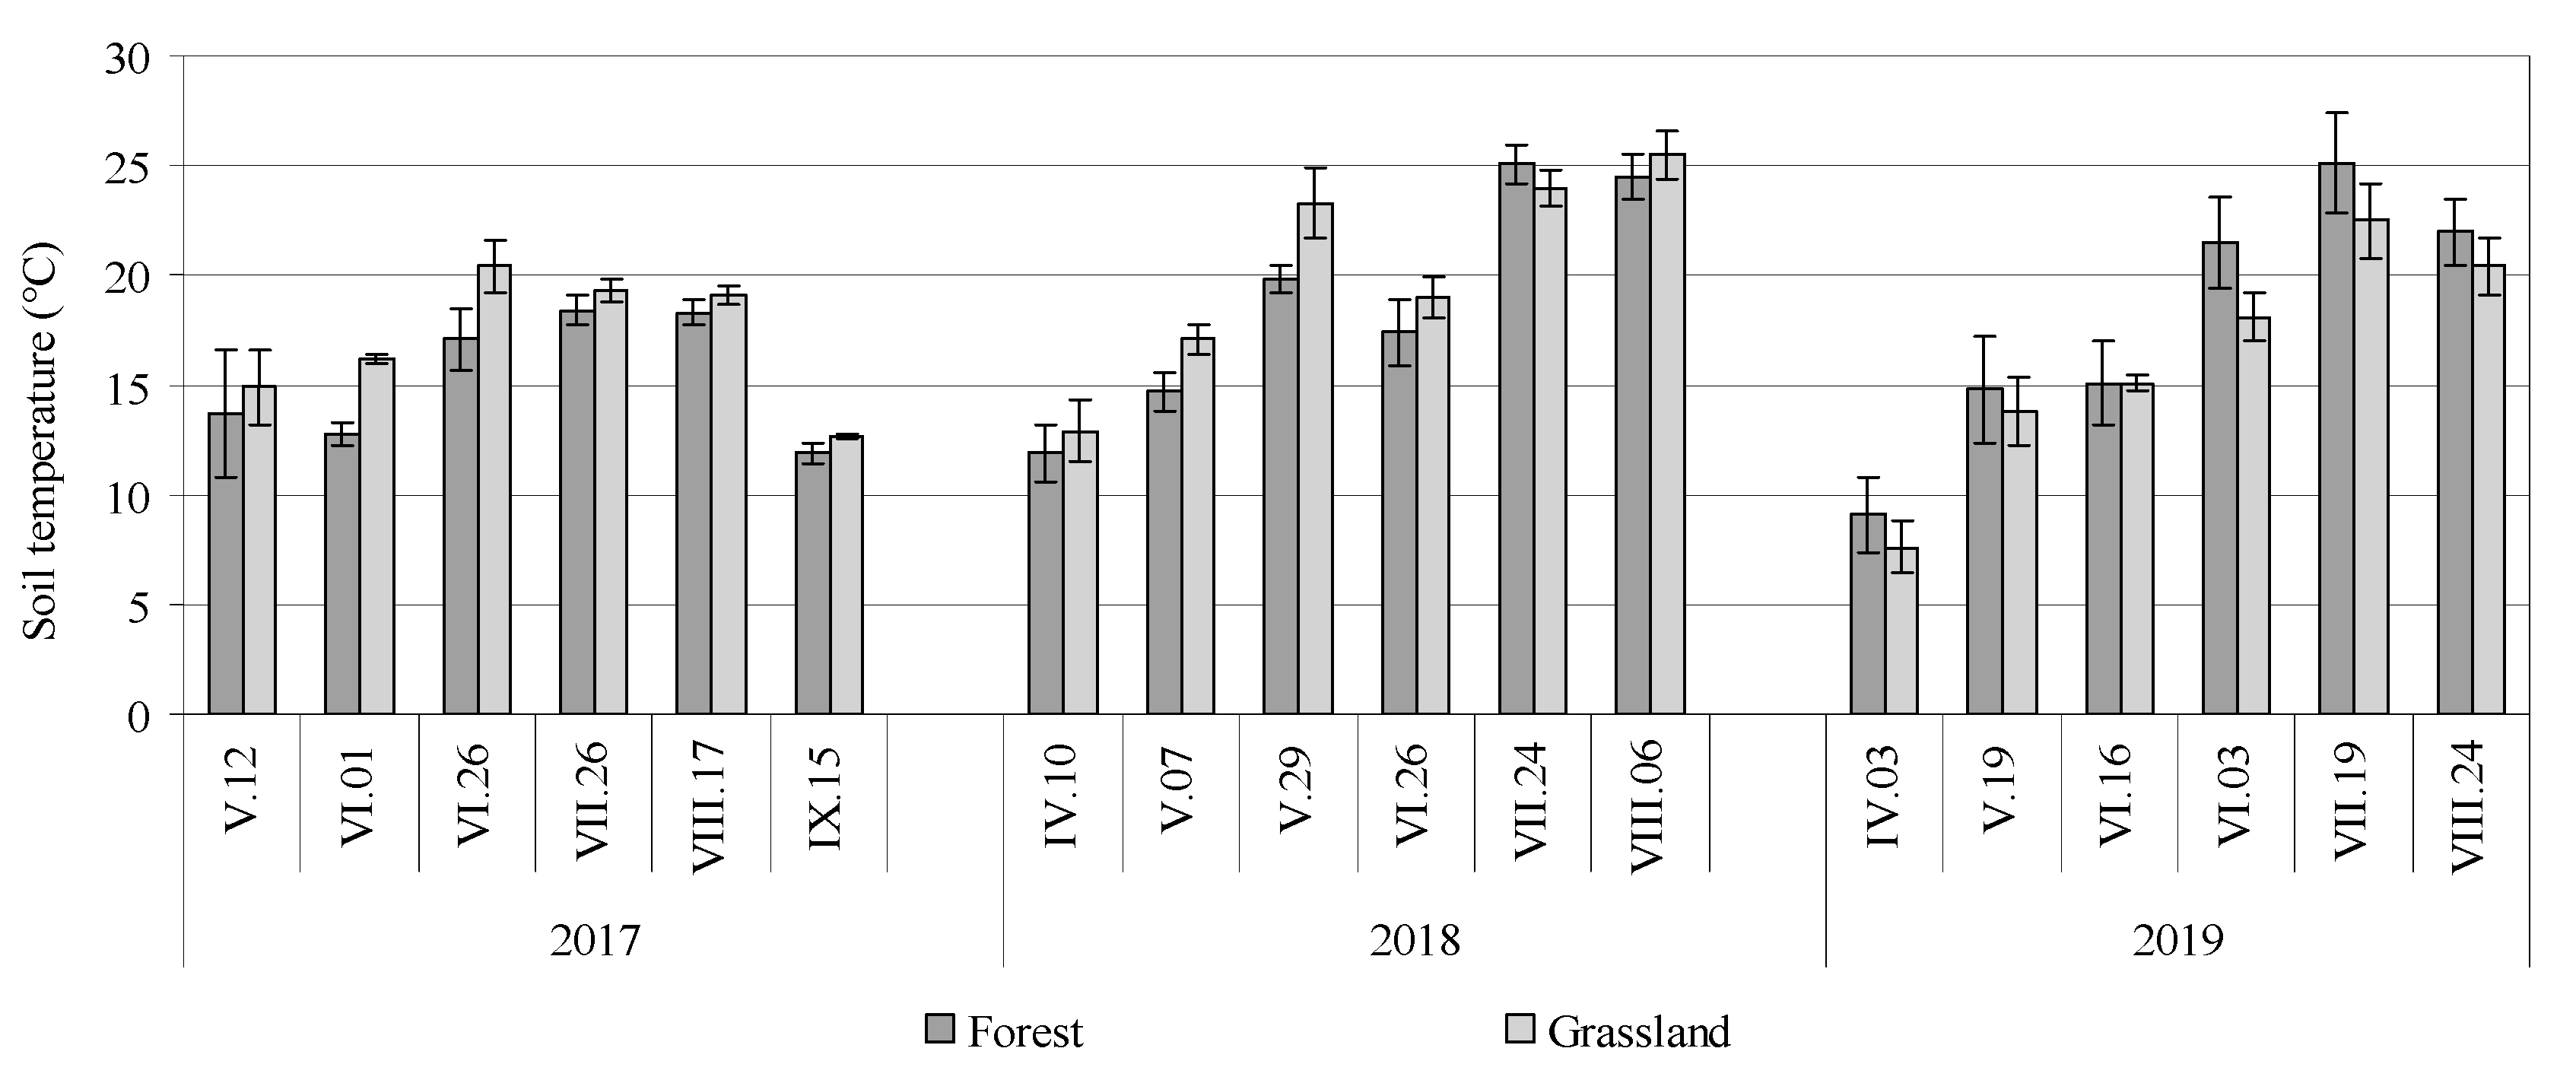
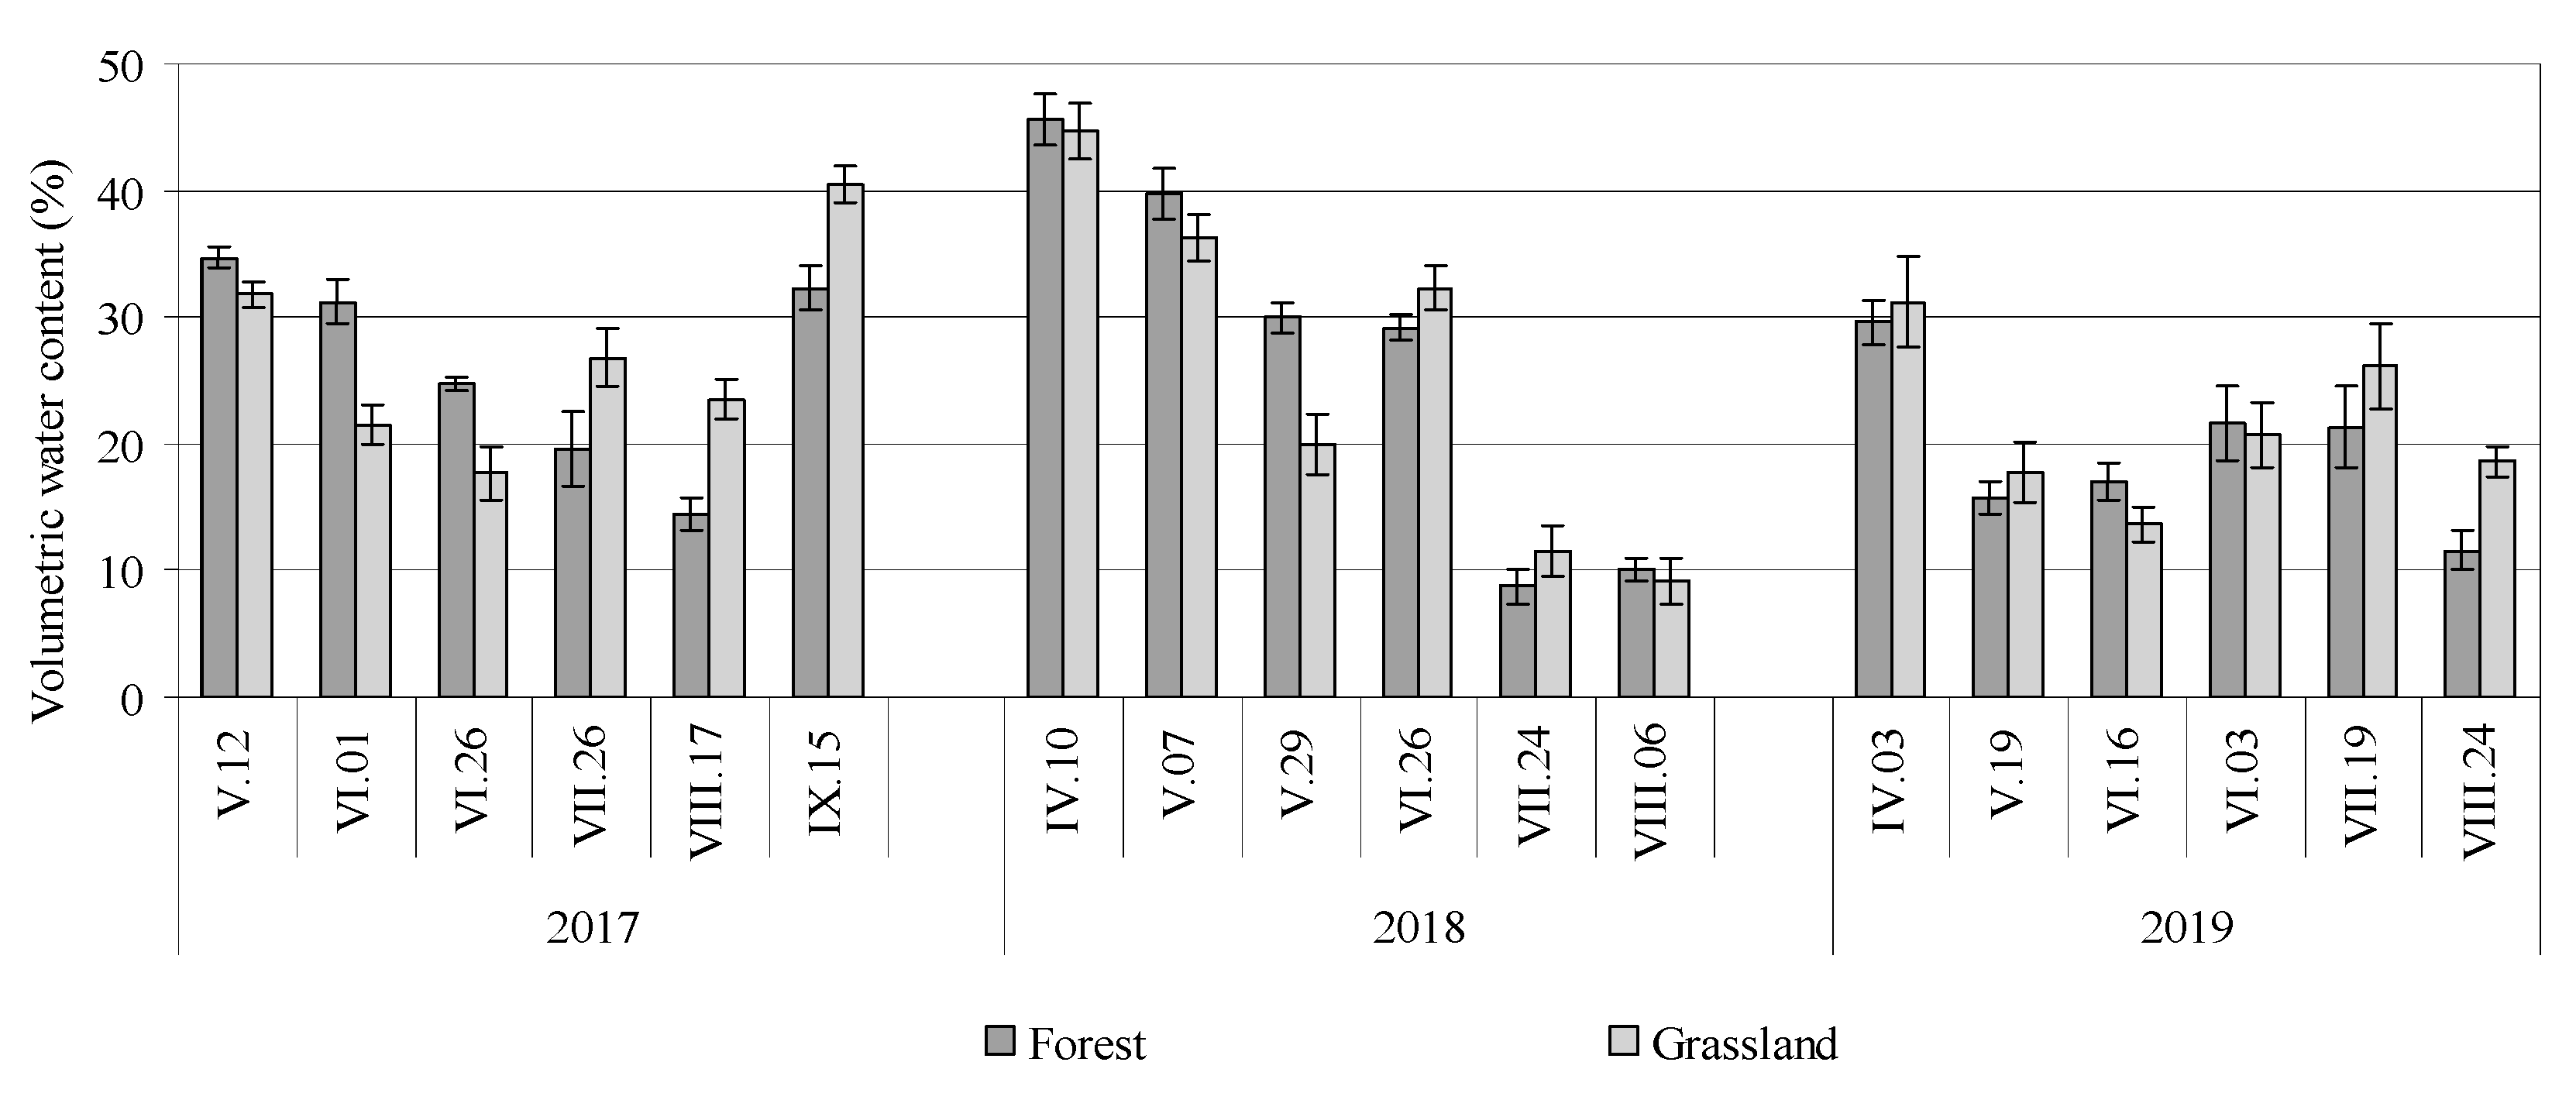
2.3. Measurements of Soil Temperature and Volumetric Water Content

Volumetric water content with soil temperature were measured at the same place and at the same time during CO2 efflux measurement. The volumetric water content with soil temperature were determined at the 0–5 cm soil layer by a portable sensor HH2 WET (Delta-T Devices Ltd., Cambridge, UK).

2.4. Investigations of the Root Network

Plant root samples from grassland and forest experimental sites were collected close to CO2 efflux measuring points in the middle of July, when the plant roots reached the highest biomass. The plant root samples were collected (at a distance of 5 m from the tree and 2 m between sample locations) in three replications by the small soil monoliths method (10 cm3) [27] from the 0–10 cm soil layer (Figure 1c). The fresh samples were put into plastic bags to avoid evaporation and were transported for storage in a freezer at −20 °C until analyzed. In the lab, the roots were carefully separated from the soil by washing them while using small mesh sieves (500 and 250 μm in diameter). The roots after washing were chopped into 2 cm-long pieces and dyed with Neutral Red reagent. The PC software program “WinRhizo” was used for root volume, length, and diameter analyses [28].

2.5. Agrometeorological Conditions

Meteorological conditions were different during the 2017–2019 period (Table 2). In 2017, the mean air temperature and the sum of precipitation during the vegetation period were very close to the long-term mean and amounted to 12.5 °C and 422.3 mm, respectively. The warm and humid weather conditions during the 2017 growing season were favorable for the growth of the grass and woody plants. The 2018 growing season was warm and dry. The mean air temperature for the growth season reached 15.4 °C, which was 2.6 °C higher than the long-term mean (Table 2). The amount of rainfall during the 2018 growing season was 306.4 mm, which was 25.3% lower than the long-term mean. Warmer than usual and dry weather conditions during the vegetation period were unfavorable for the grass and trees to vegetate. The mean air temperature for the 2019 vegetation period was 1.2 °C higher than the long-term mean, while the sum of precipitation was close to the long-term value. These meteorological conditions were favorable for plants to grow (Table 2).

2.6. Statistical Analysis

The data were subjected to the two-way analysis of variance (ANOVA) according to the treatment structure by statistical software package SAS 7.1. The mean values and standard errors were compared by Duncan’s multiple range tests at the probability level of p < 0.05. Pearson’s correlation analyses of the relationship between various parameters were carried out. Correlation-regression analysis was also implemented in this study.

3. Results

3.1. The Dynamics of CO2 Efflux, Soil Temperature, and Volumetric Water Content

Temporal variations of CO2 efflux, soil temperature, and volumetric water content in the grassland and the forest land in 2017–2019 are presented in Figure 2, Figure 3 and Figure 4. The dynamics of soil CO2 efflux are provided in Figure 2.
In the forest land, the CO2 effluxes from the soil increased gradually by reaching the maximum between the end of June and the end of September in 2017, between the beginning of May and the end of June in 2018, and between the end of June and the end of August in 2019 (Figure 2). In the grassland, the CO2 effluxes from the soil increased gradually by reaching the maximum between the end of May and the end of July in 2017, between the beginning of May and the end of July in 2018, and between the end of June and the end of August in 2019 (Figure 2). The soil CO2 efflux averaged across the years in the forest land was 32% lower than in the grassland on Retisol (Table 3). The average CO2 efflux from the soil tended to increase in the following order: 2017 < 2018 < 2019. The average soil CO2 efflux in 2017 was 12% lower than in 2018 and 14% lower than in 2019 (Table 3).
Soil temperature varied from 11.9 °C to 20.4 °C during the growing season in 2017, from 11.9 °C to 25.5 °C in 2018, and from 7.6 °C to 25.1 °C during the vegetation period in 2019, with averages of 16.2 °C, 19.6 °C, and 17.1 °C within the 0–5 cm soil layer in 2017, 2018, and 2019, respectively (Figure 3 and Table 3). The soil temperature average in 2017 was 17% lower than in 2018 and 5% lower than in 2019. The soil temperature averaged across the years revealed that in the grassland soil, the temperature was 3% higher than in the forest land (Table 3).
Volumetric water content in the soil varied from 14.4% to 40.5% during the growing season in 2017, from 8.7 to 45.6% in 2018, and from 11.6 to 31.2% during the vegetation period of 2019, with average values of 26.6%, 26.4%, and 20.4% within the 0–5 cm soil layer in 2017, 2018, and 2019, respectively (Figure 4 and Table 3). The volumetric water content average in 2017 was 1% higher than in 2018 and 23% higher than in 2019. The volumetric water content averaged across years was 1% lower in the forest land than in the grassland soil (Table 3).

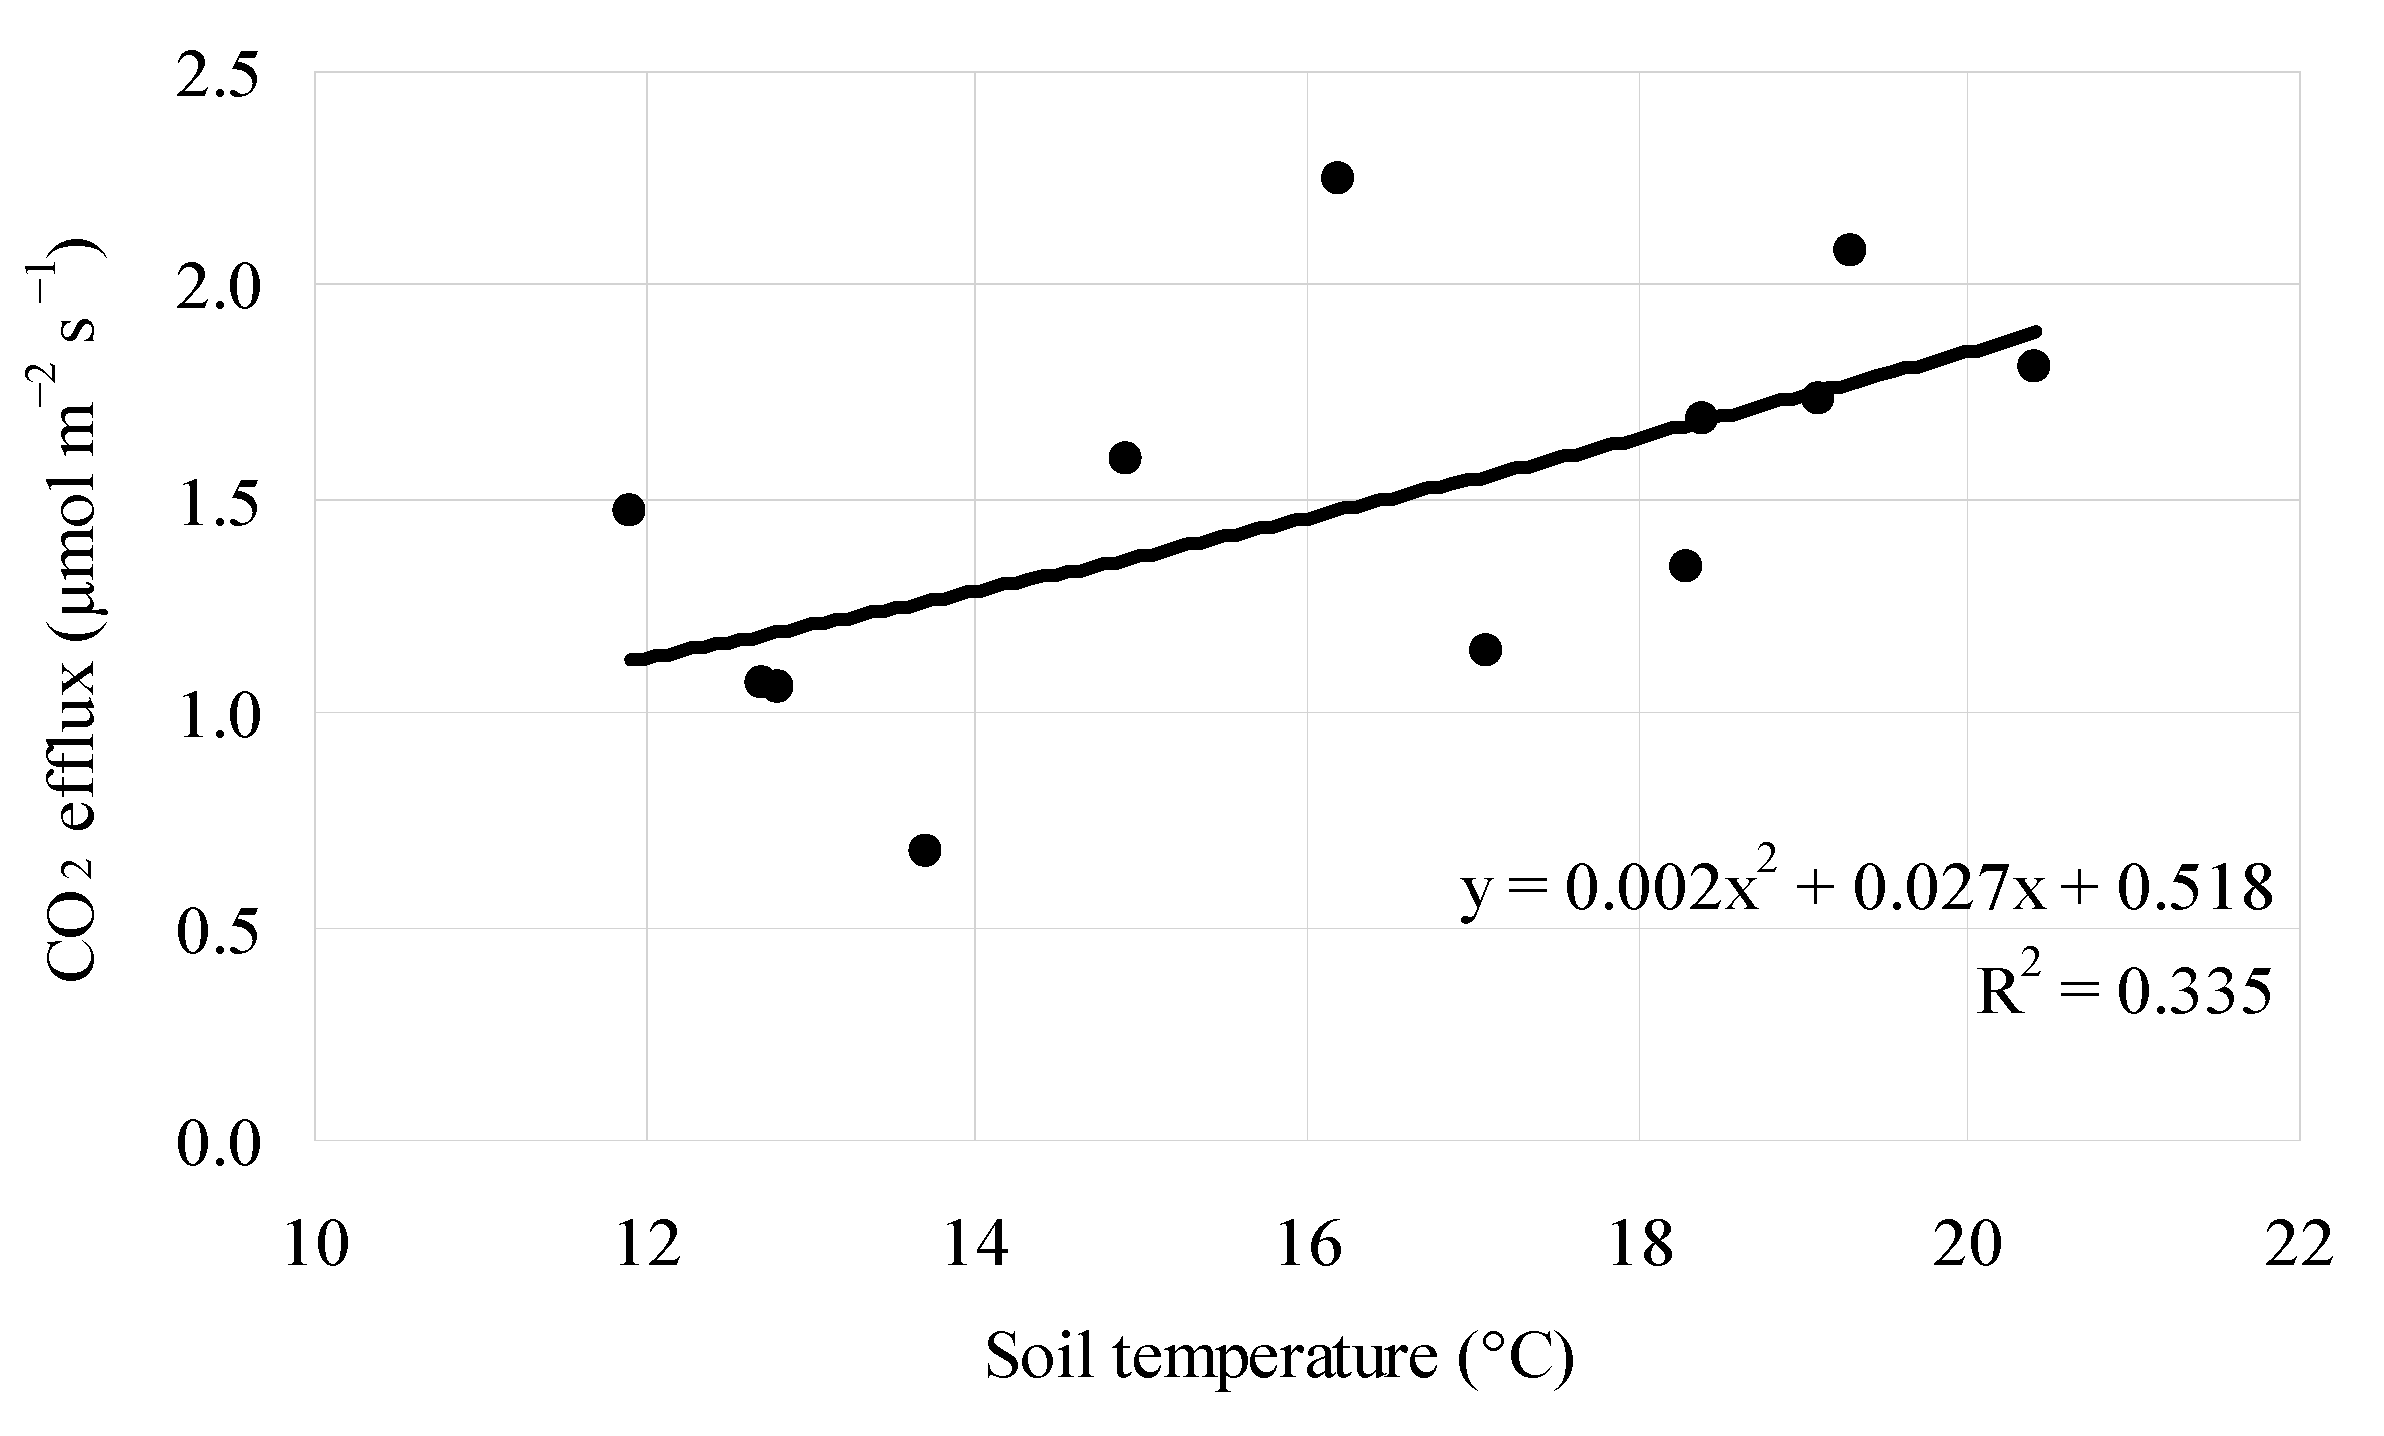
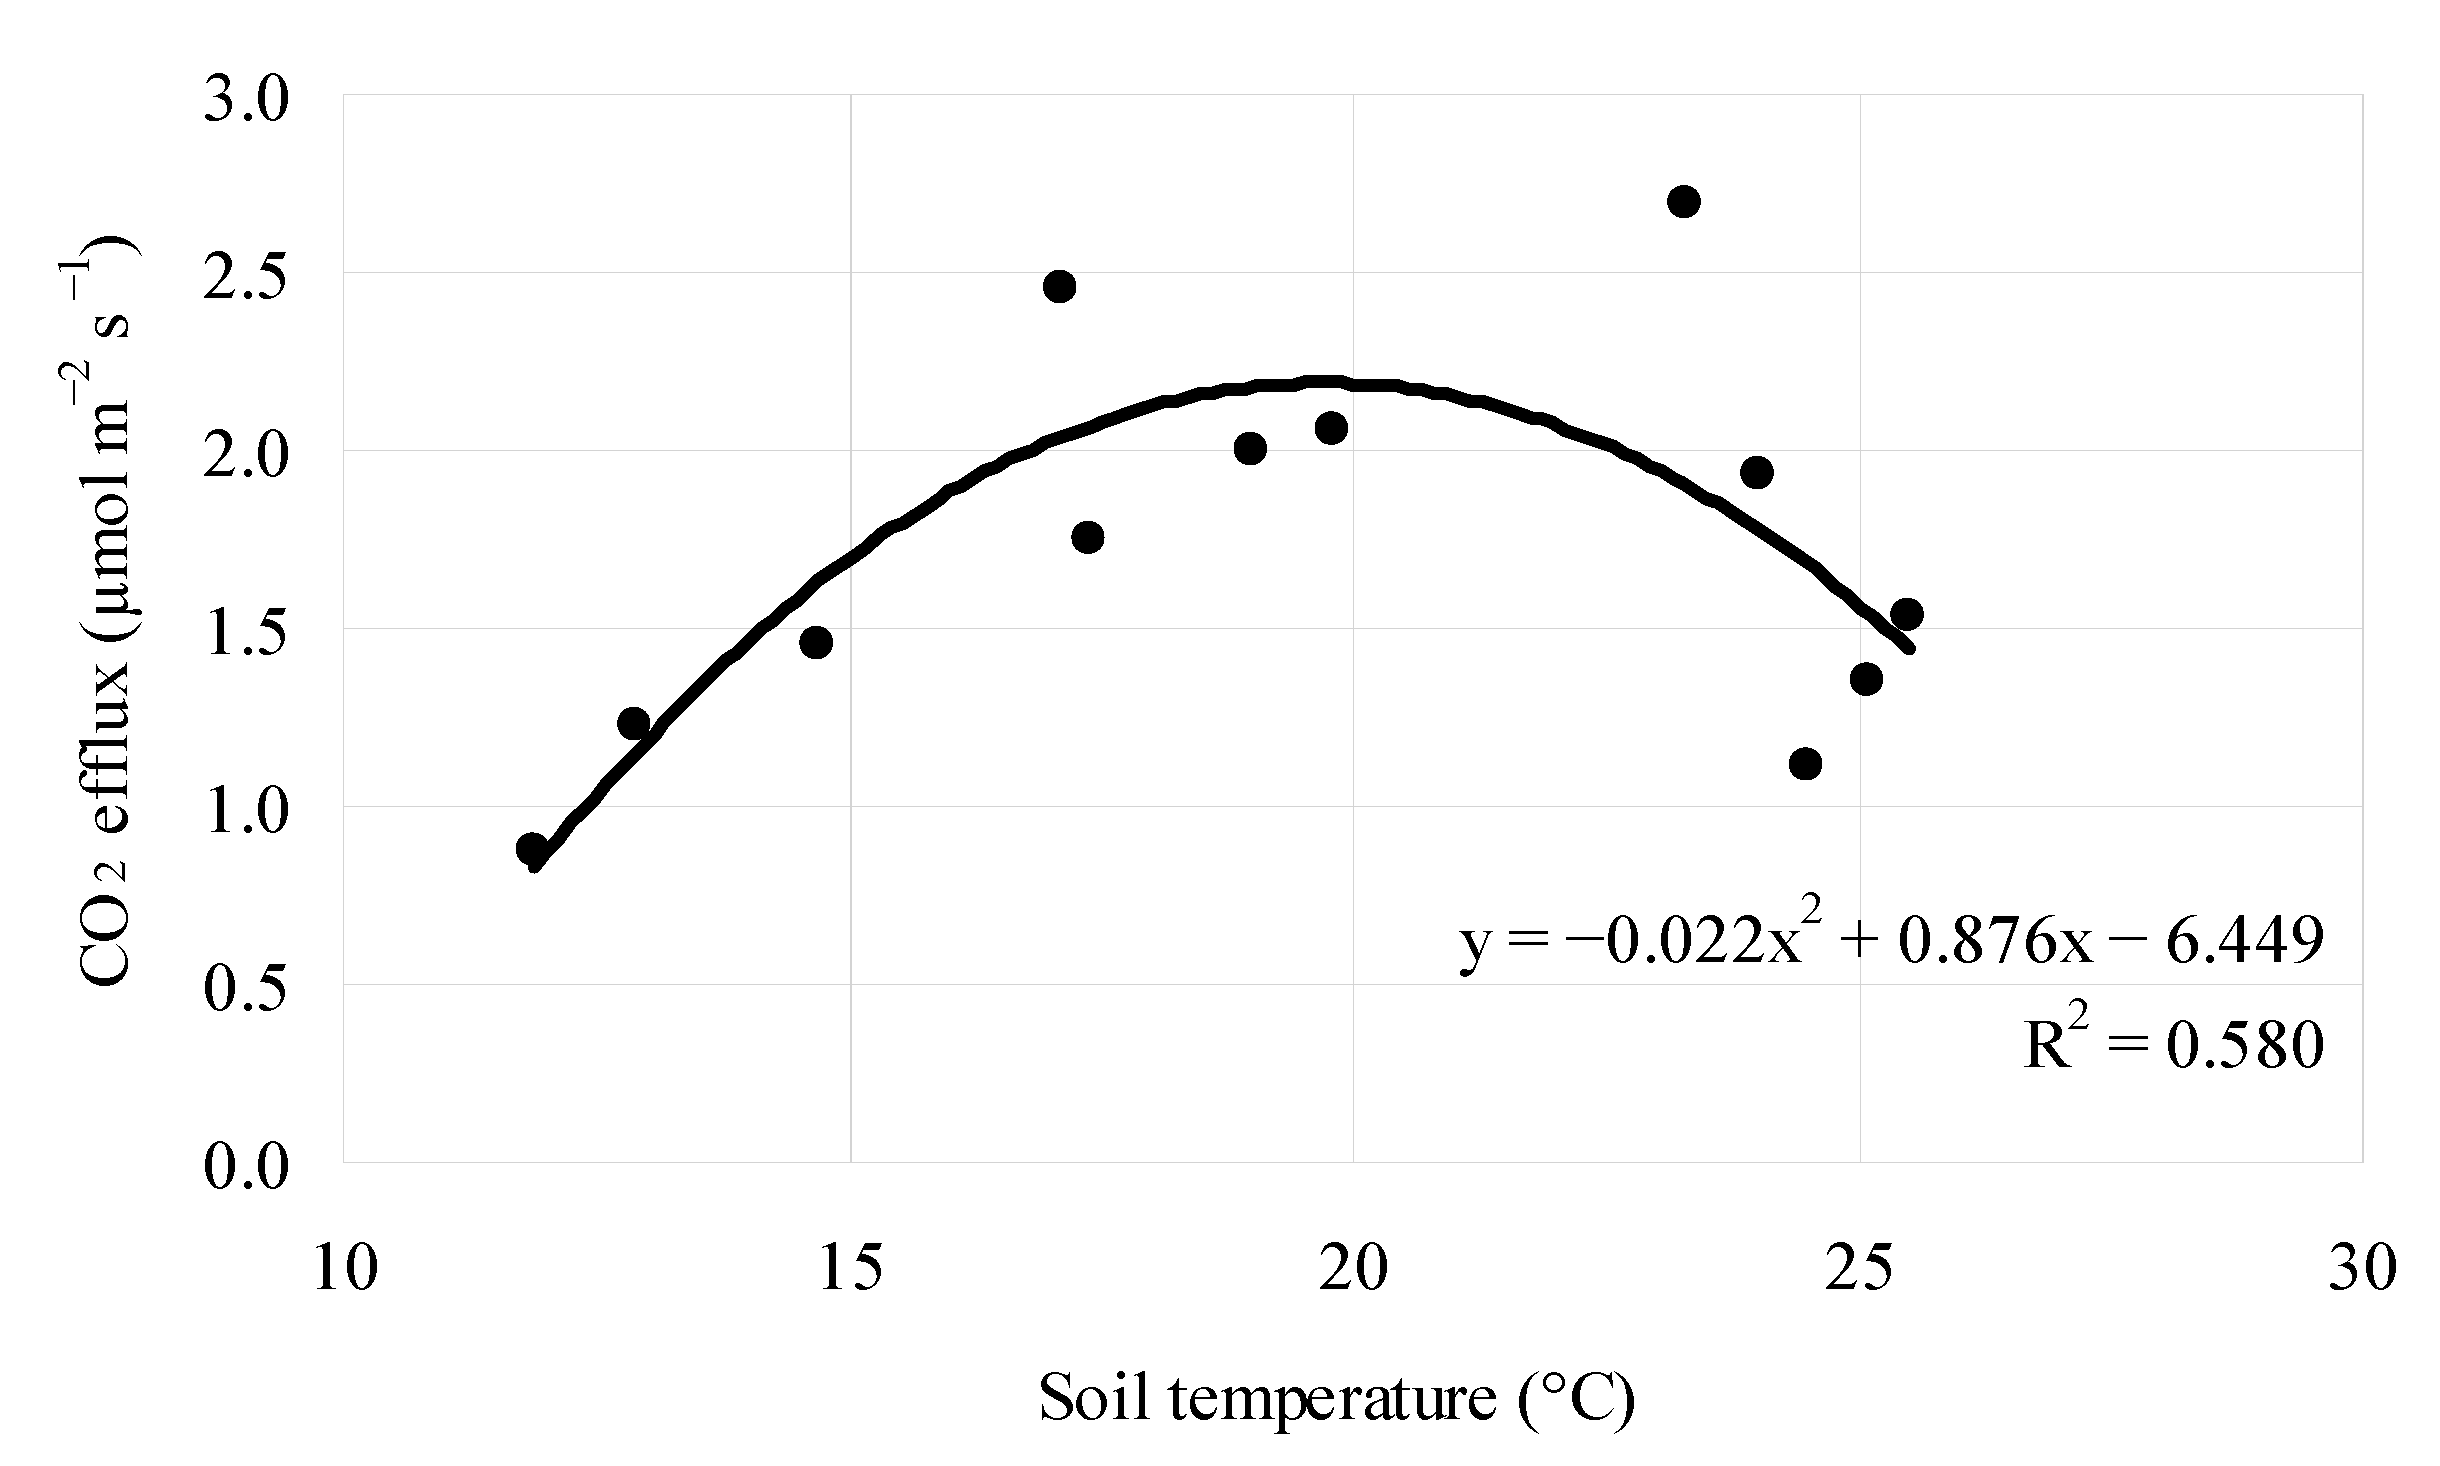
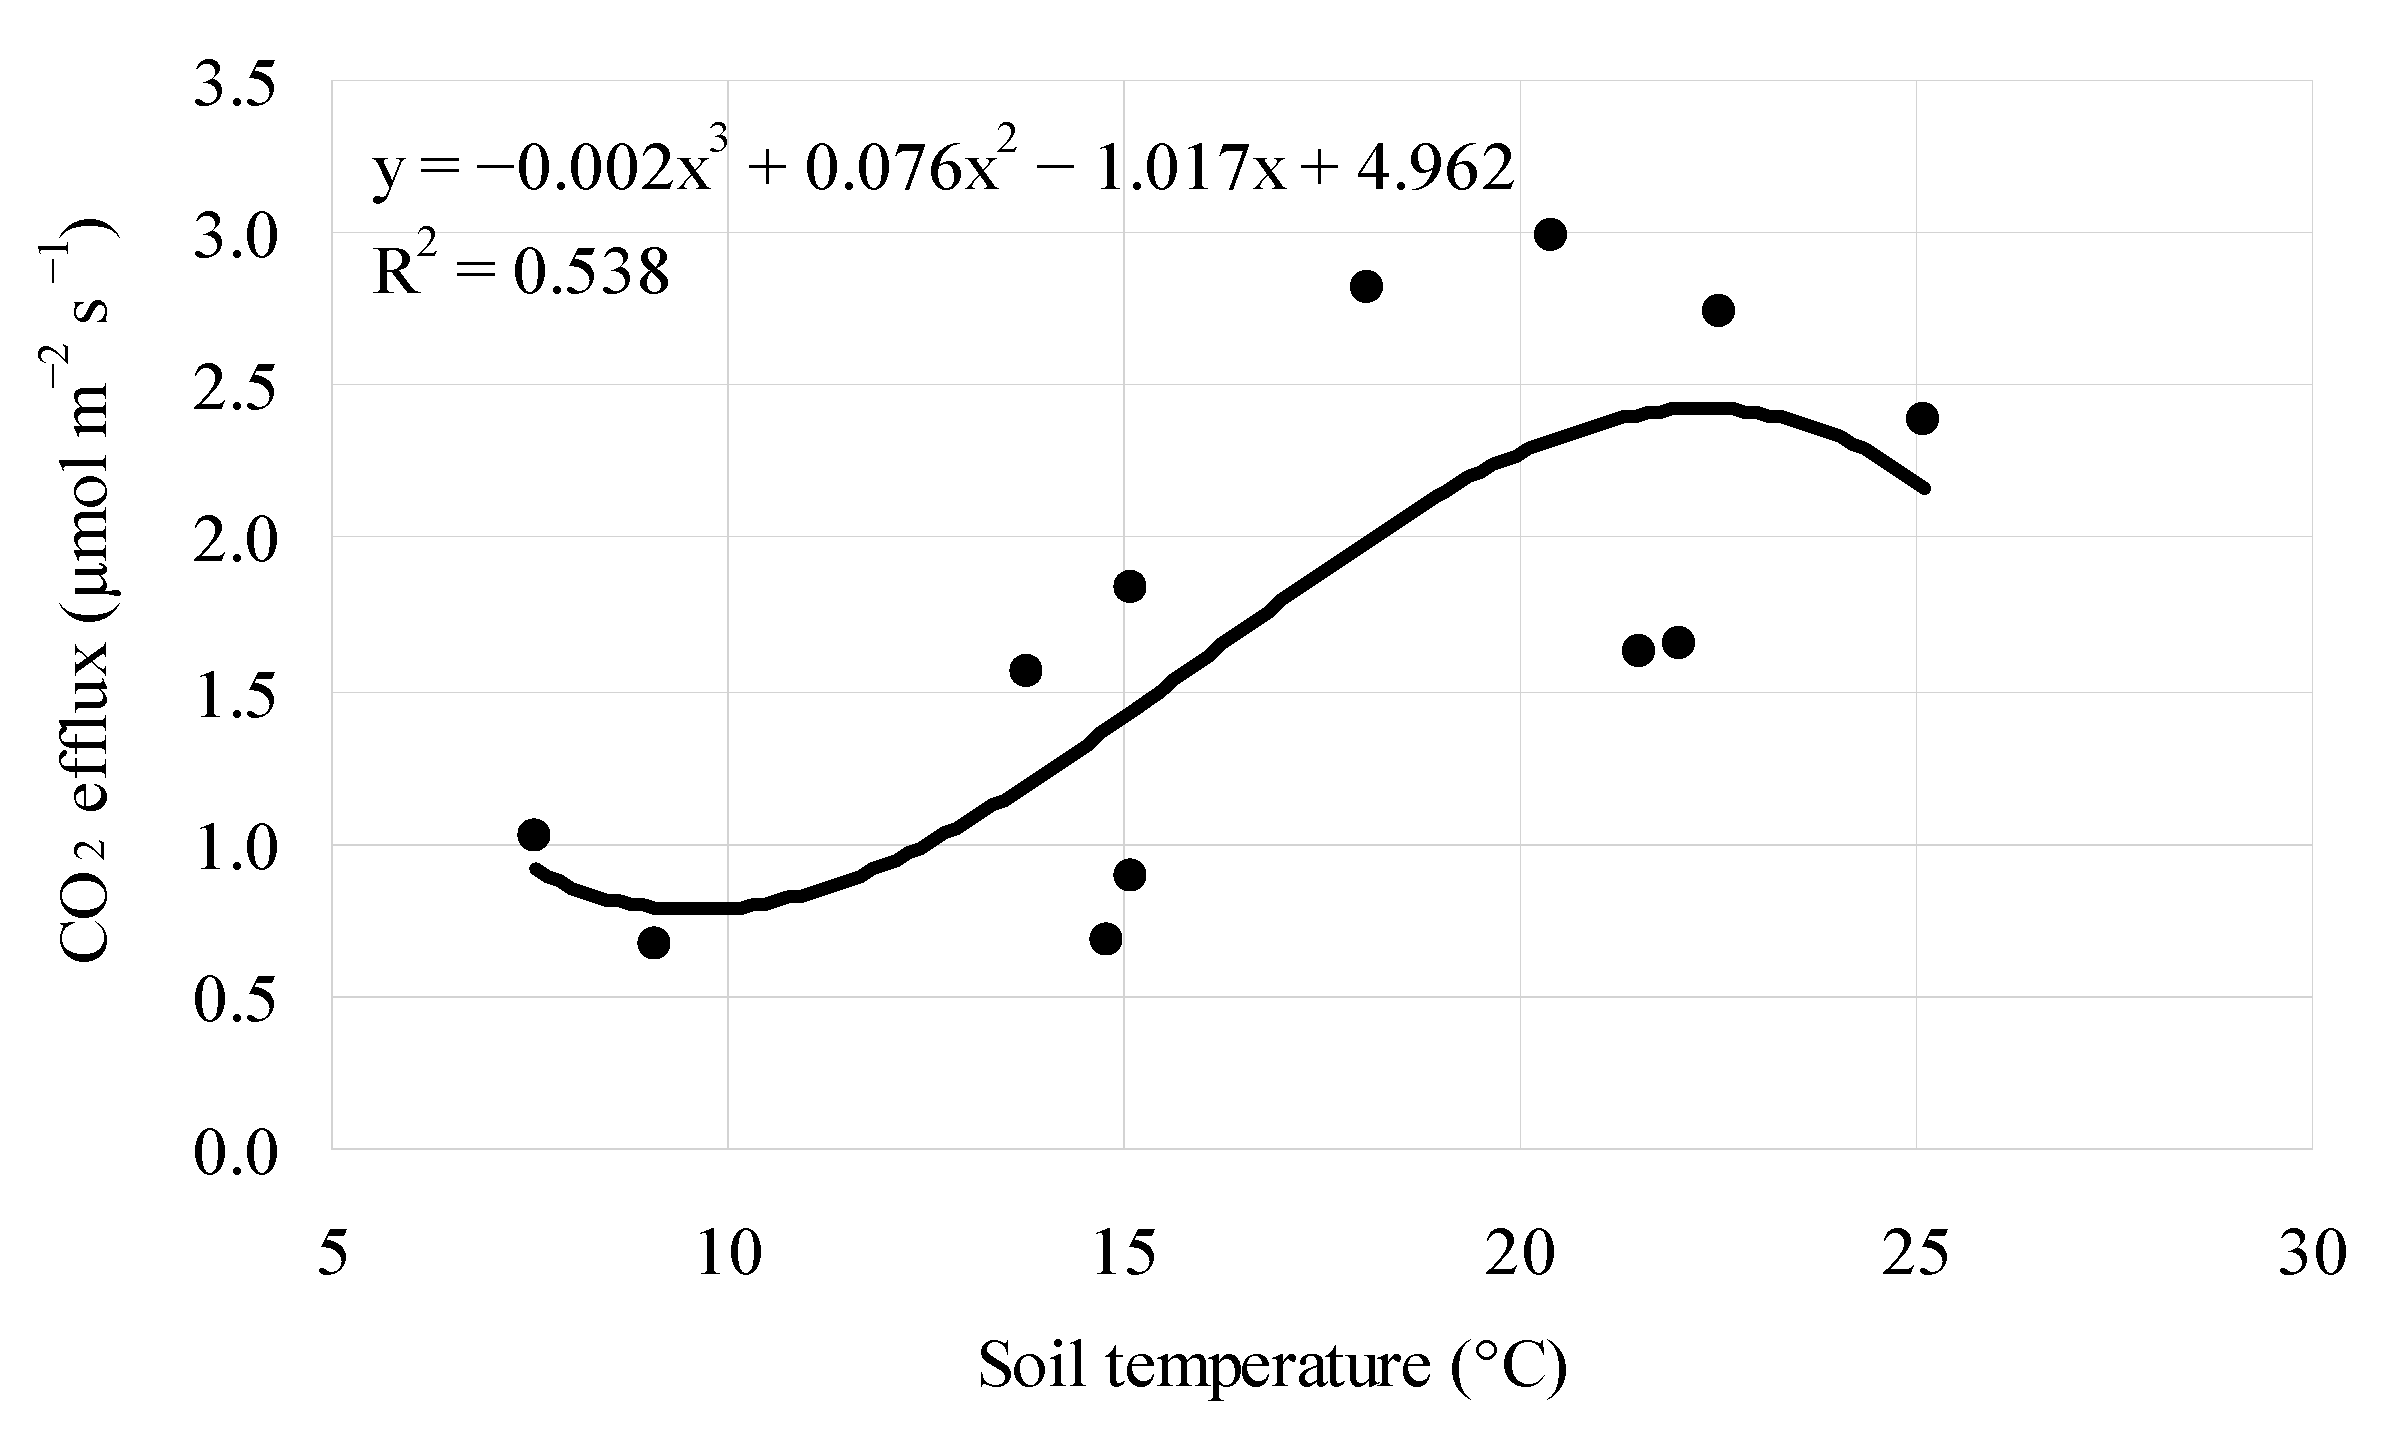
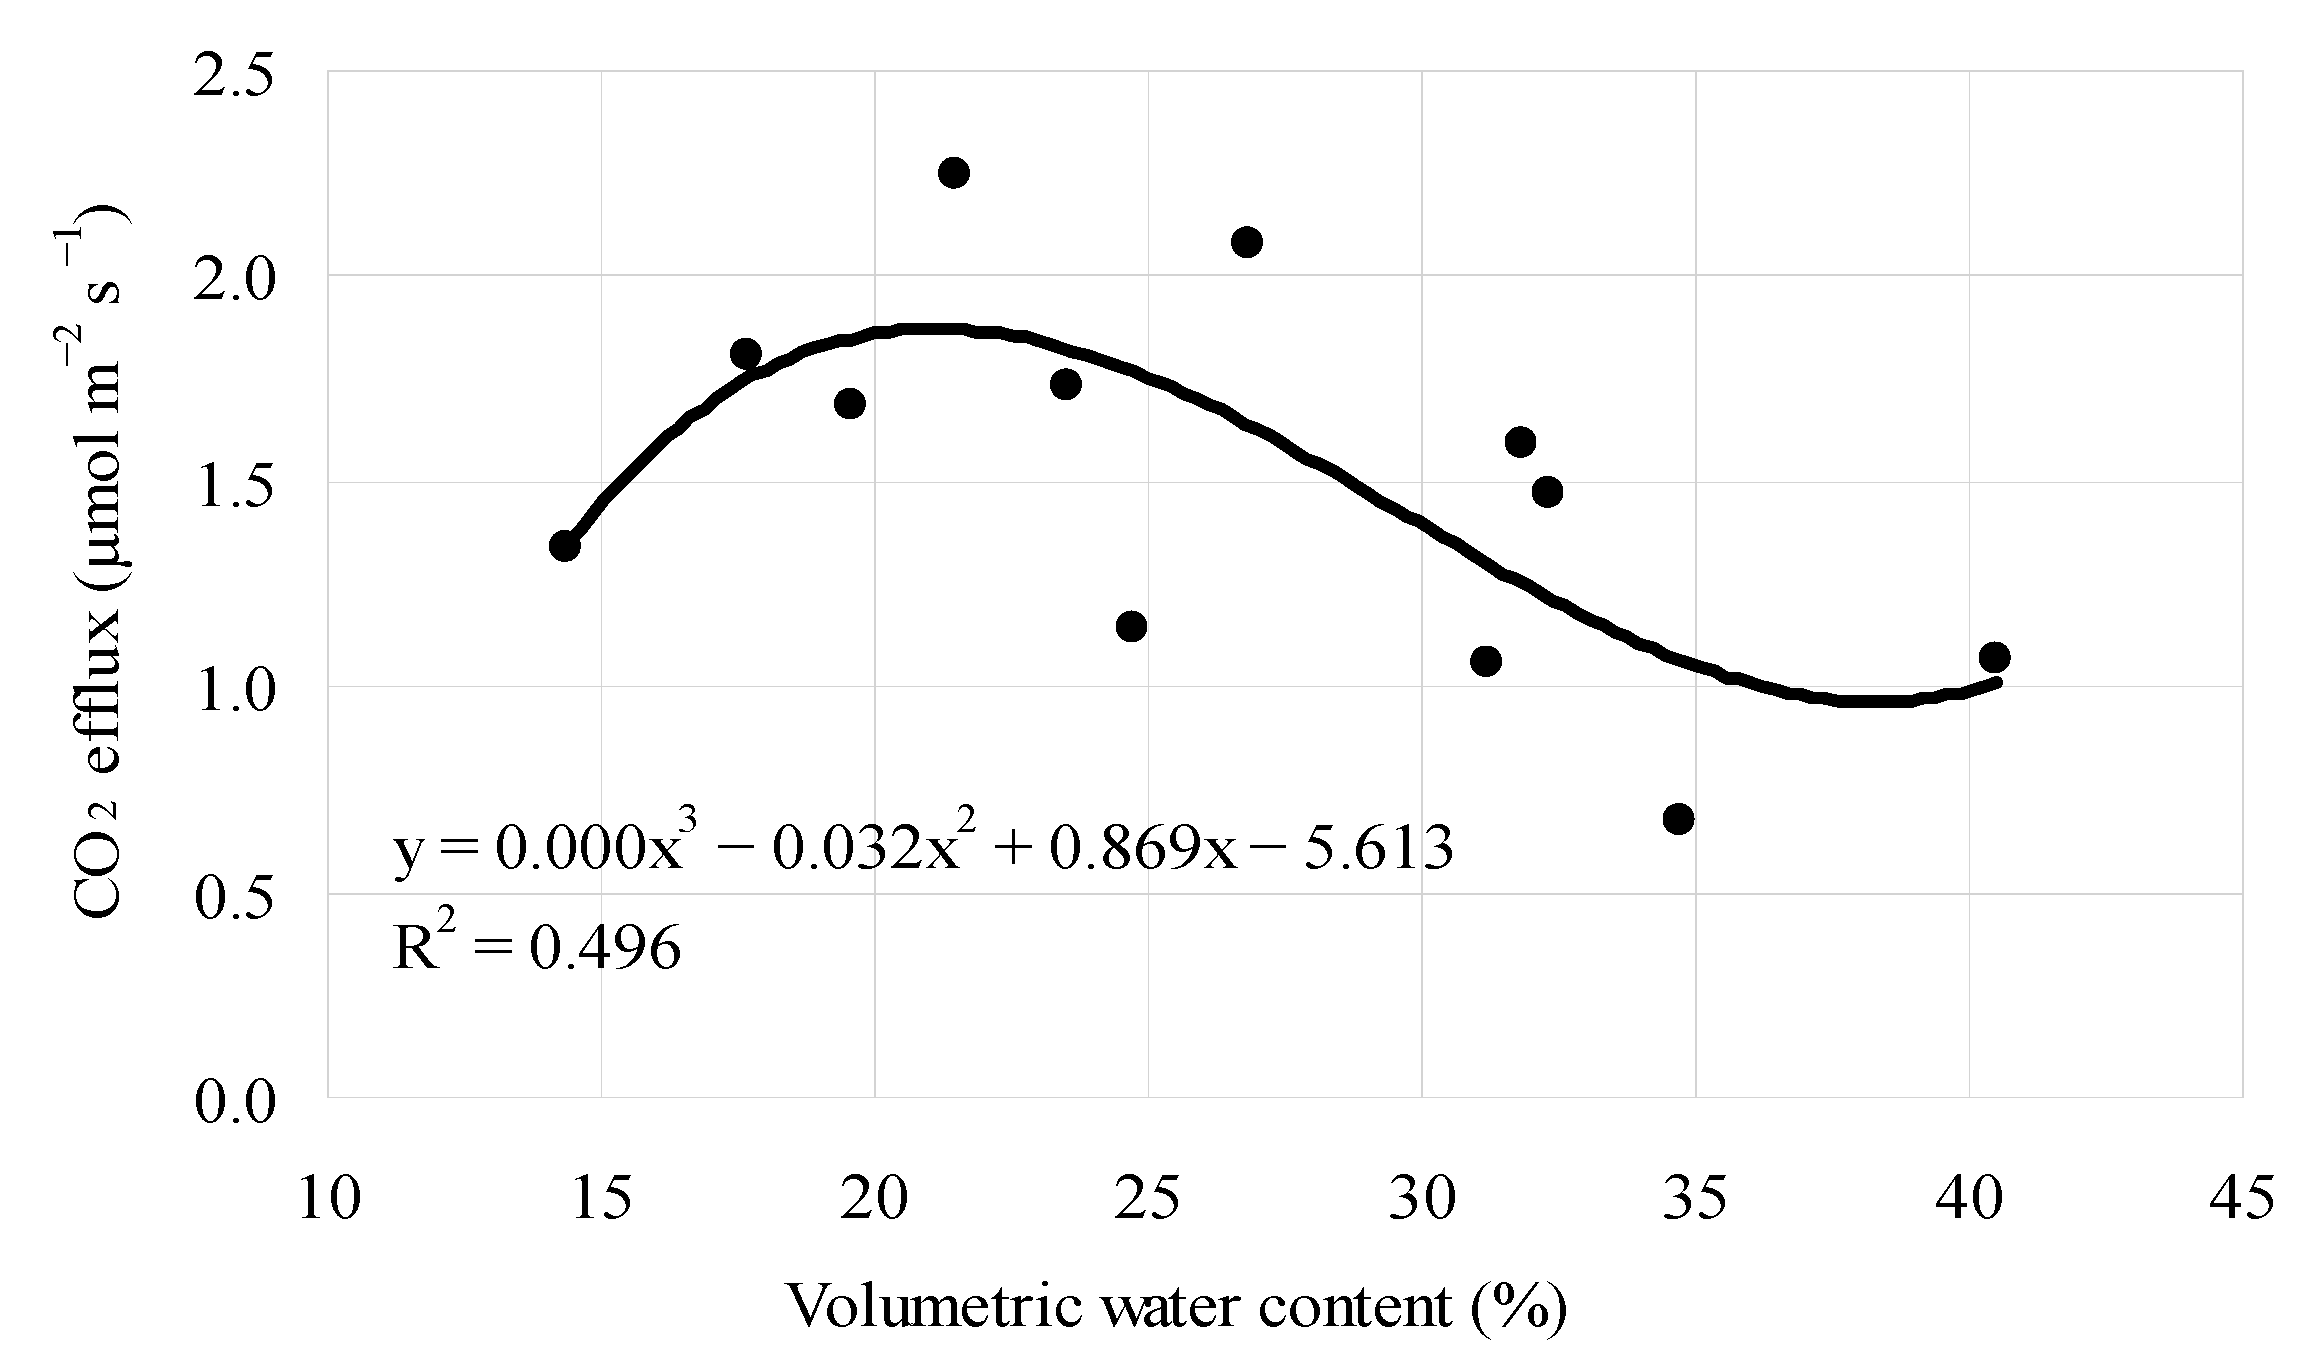
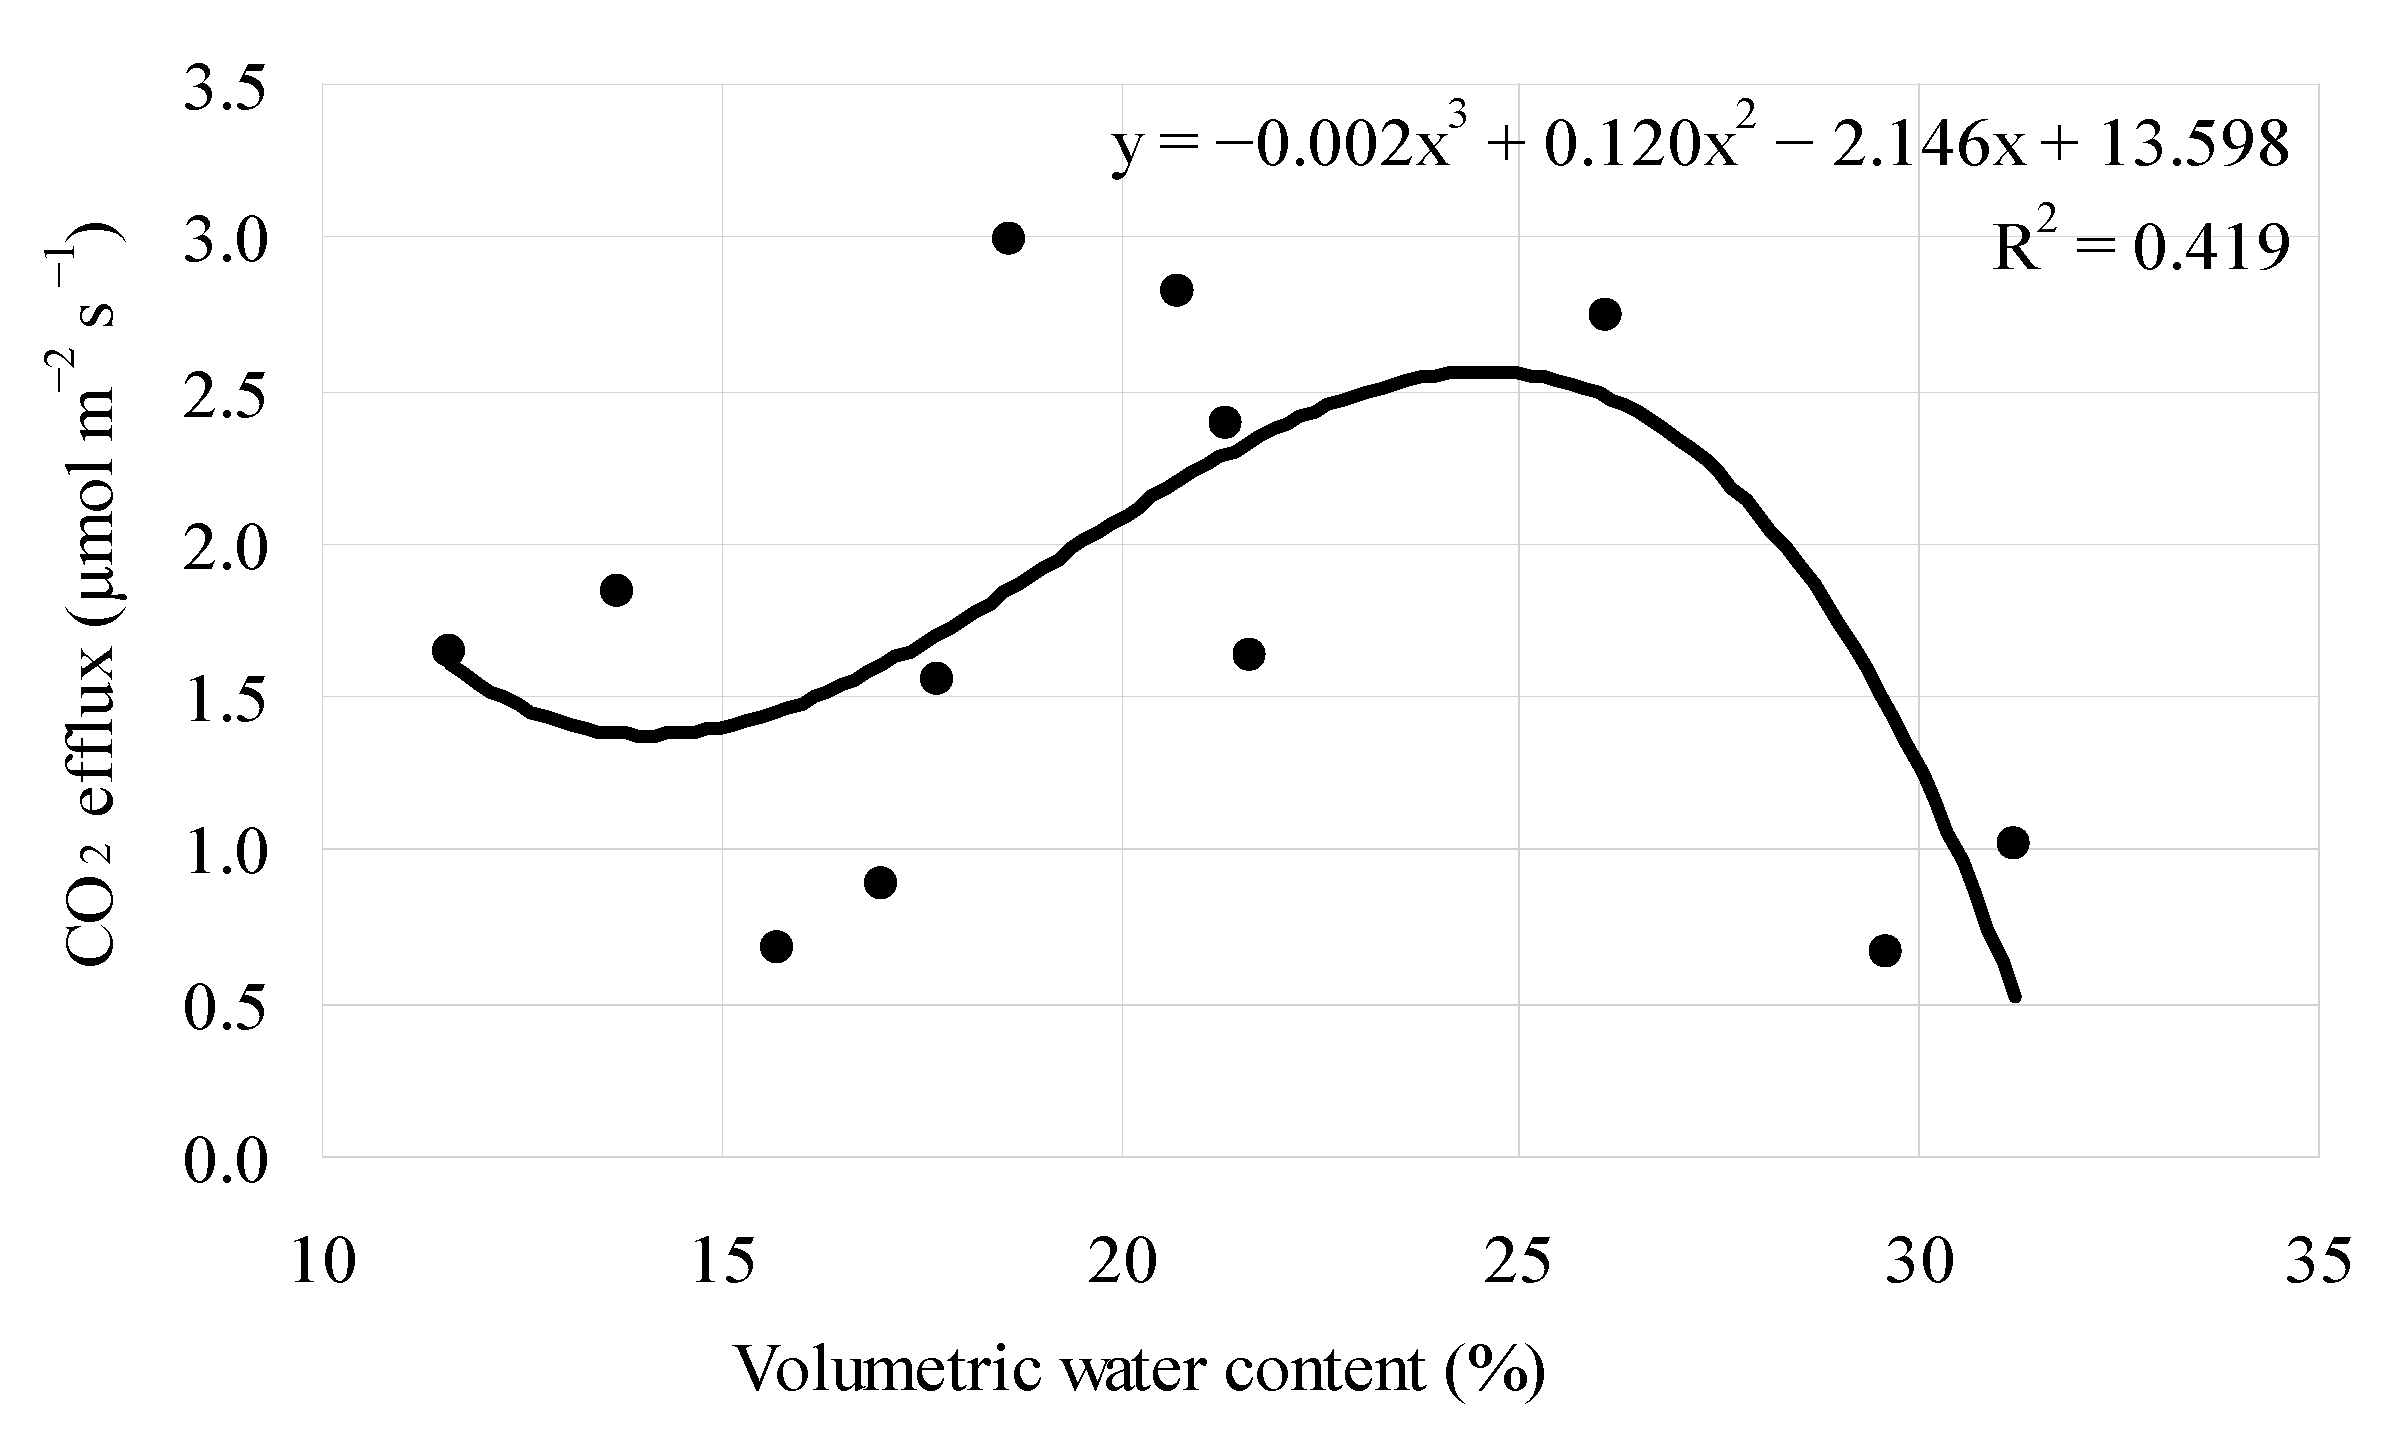
3.2. The Effect of Soil Temperature and Volumetric Water Content on Soil CO2 Efflux

Soil temperature is one of the main indicators for the dynamics of soil CO2 efflux. The relationships between soil CO2 efflux, volumetric water content, and soil temperature under different land use methods are shown in Table 4. The significant (r = 0.51, p < 0.01) relationship between soil CO2 efflux and soil temperature through the whole measurement period was found in the forest land and grassland. It is worth mentioning that a positive correlation between volumetric water content and soil CO2 efflux was not determined under all land use methods investigated on Retisol. The significant (p < 0.01) negative correlations between soil temperature and volumetric water content were registered in the forest land (r = −0.63) and grassland (r = −0.54) (Table 4).
The relationships between soil CO2 efflux and soil temperature and volumetric water content under different land uses in different years are presented in Figure 5, Figure 6, Figure 7, Figure 8, Figure 9 and Figure 10.
During the whole growing season in 2017, the relationship between soil temperature and CO2 efflux within the 0–5 cm soil layer can be described by a simple multiple regression model (y = 0.002x2 + 0.027x + 0.518; R2 = 0.335, p > 0.05) (Figure 5).
During the whole growing season in 2018, the relationship between soil temperature and CO2 efflux at the 0–5 cm soil layer can be described by a simple multiple regression model (y = −0.022x2 + 0.876x − 6.449; R2 = 0.58, p < 0.05) (Figure 6).
During the whole growing season in 2019, the relationship between soil temperature and CO2 efflux within the 0–5 cm soil layer (y = −0.002x3 + 0.076x2 − 1.017x + 4.962; R2 = 0.538, p < 0.05) is shown in Figure 7.
During the whole growing season in 2017, the relationship between volumetric water content and CO2 efflux within the 0–5 cm soil layer (y = 0.000x3 − 0.032x2 + 0.869x − 5.613; R2 = 0.496, p < 0.05) is presented in Figure 8.
During the whole growing season in 2018, the relationship between volumetric water content and CO2 efflux within the 0–5 cm soil layer can be described by a simple multiple regression model (y = −0.003x2 + 0.164x + 0.210; R2 = 0.652, p < 0.05) (Figure 9).
During the whole growing season in 2019, the relationship between volumetric water content and CO2 efflux within the 0–5 cm soil layer (y = –0.002x3 + 0.120x2 − 2.146x + 13.598; R2 = 0.419, p < 0.05) is provided in Figure 10.
The volumetric water content (from 7% to 25%) increased soil CO2 efflux. Volumetric water content (25% higher) decreased soil CO2 efflux.
The activity of microorganisms and roots depends on the water content in the soil. The biological activity of the soil increases when the water content in the soil increases, and this, in turn, causes an increase in soil respiration. This result indicates that soil temperature and volumetric water content were the main factors limiting the rate of soil CO2 efflux from different land uses for the measurement period.

3.3. Effect of Year and Land Use on Parameters of Root

The root parameters in the three (2017–2019) years of two natural land uses (forest and grassland) within the 0–10 cm soil layer are presented in Table 5. The effect of land use was significant (p < 0.01) for root volume and root length density. The effect was not significant for the mean root diameter. The effect of the year was not significant (p > 0.05) for all root parameters.
The root volume in the forest land was 2.2-fold lower than in the grassland on Retisol. The root length density in the grassland was 7.3-fold higher than in the forest (Table 5). The grassland had the greatest root length density (1740 km m−3) and mean root diameter (0.49 mm), while the forest land had the lowest (240 km m−3 ) root length density and mean root diameter (0.44 mm).

3.4. Correlation between Root Characteristics in Different Land Uses

The correlation matrix between root diameter, root volume, and root length density under different land uses within the 0–10 cm soil layer is presented in Table 6.
Significant correlations between root length density and root volume were recorded in the forest land (p < 0.01) and grassland (p < 0.05) at the topsoil (Table 6). The relationship (p < 0.05) between the mean root diameter and root volume were registered in the forest land. Such correlations between the same variables were not established in the grassland (Table 6). The negative relationship between the root length density and mean root diameter was registered in the forest on Retisol.

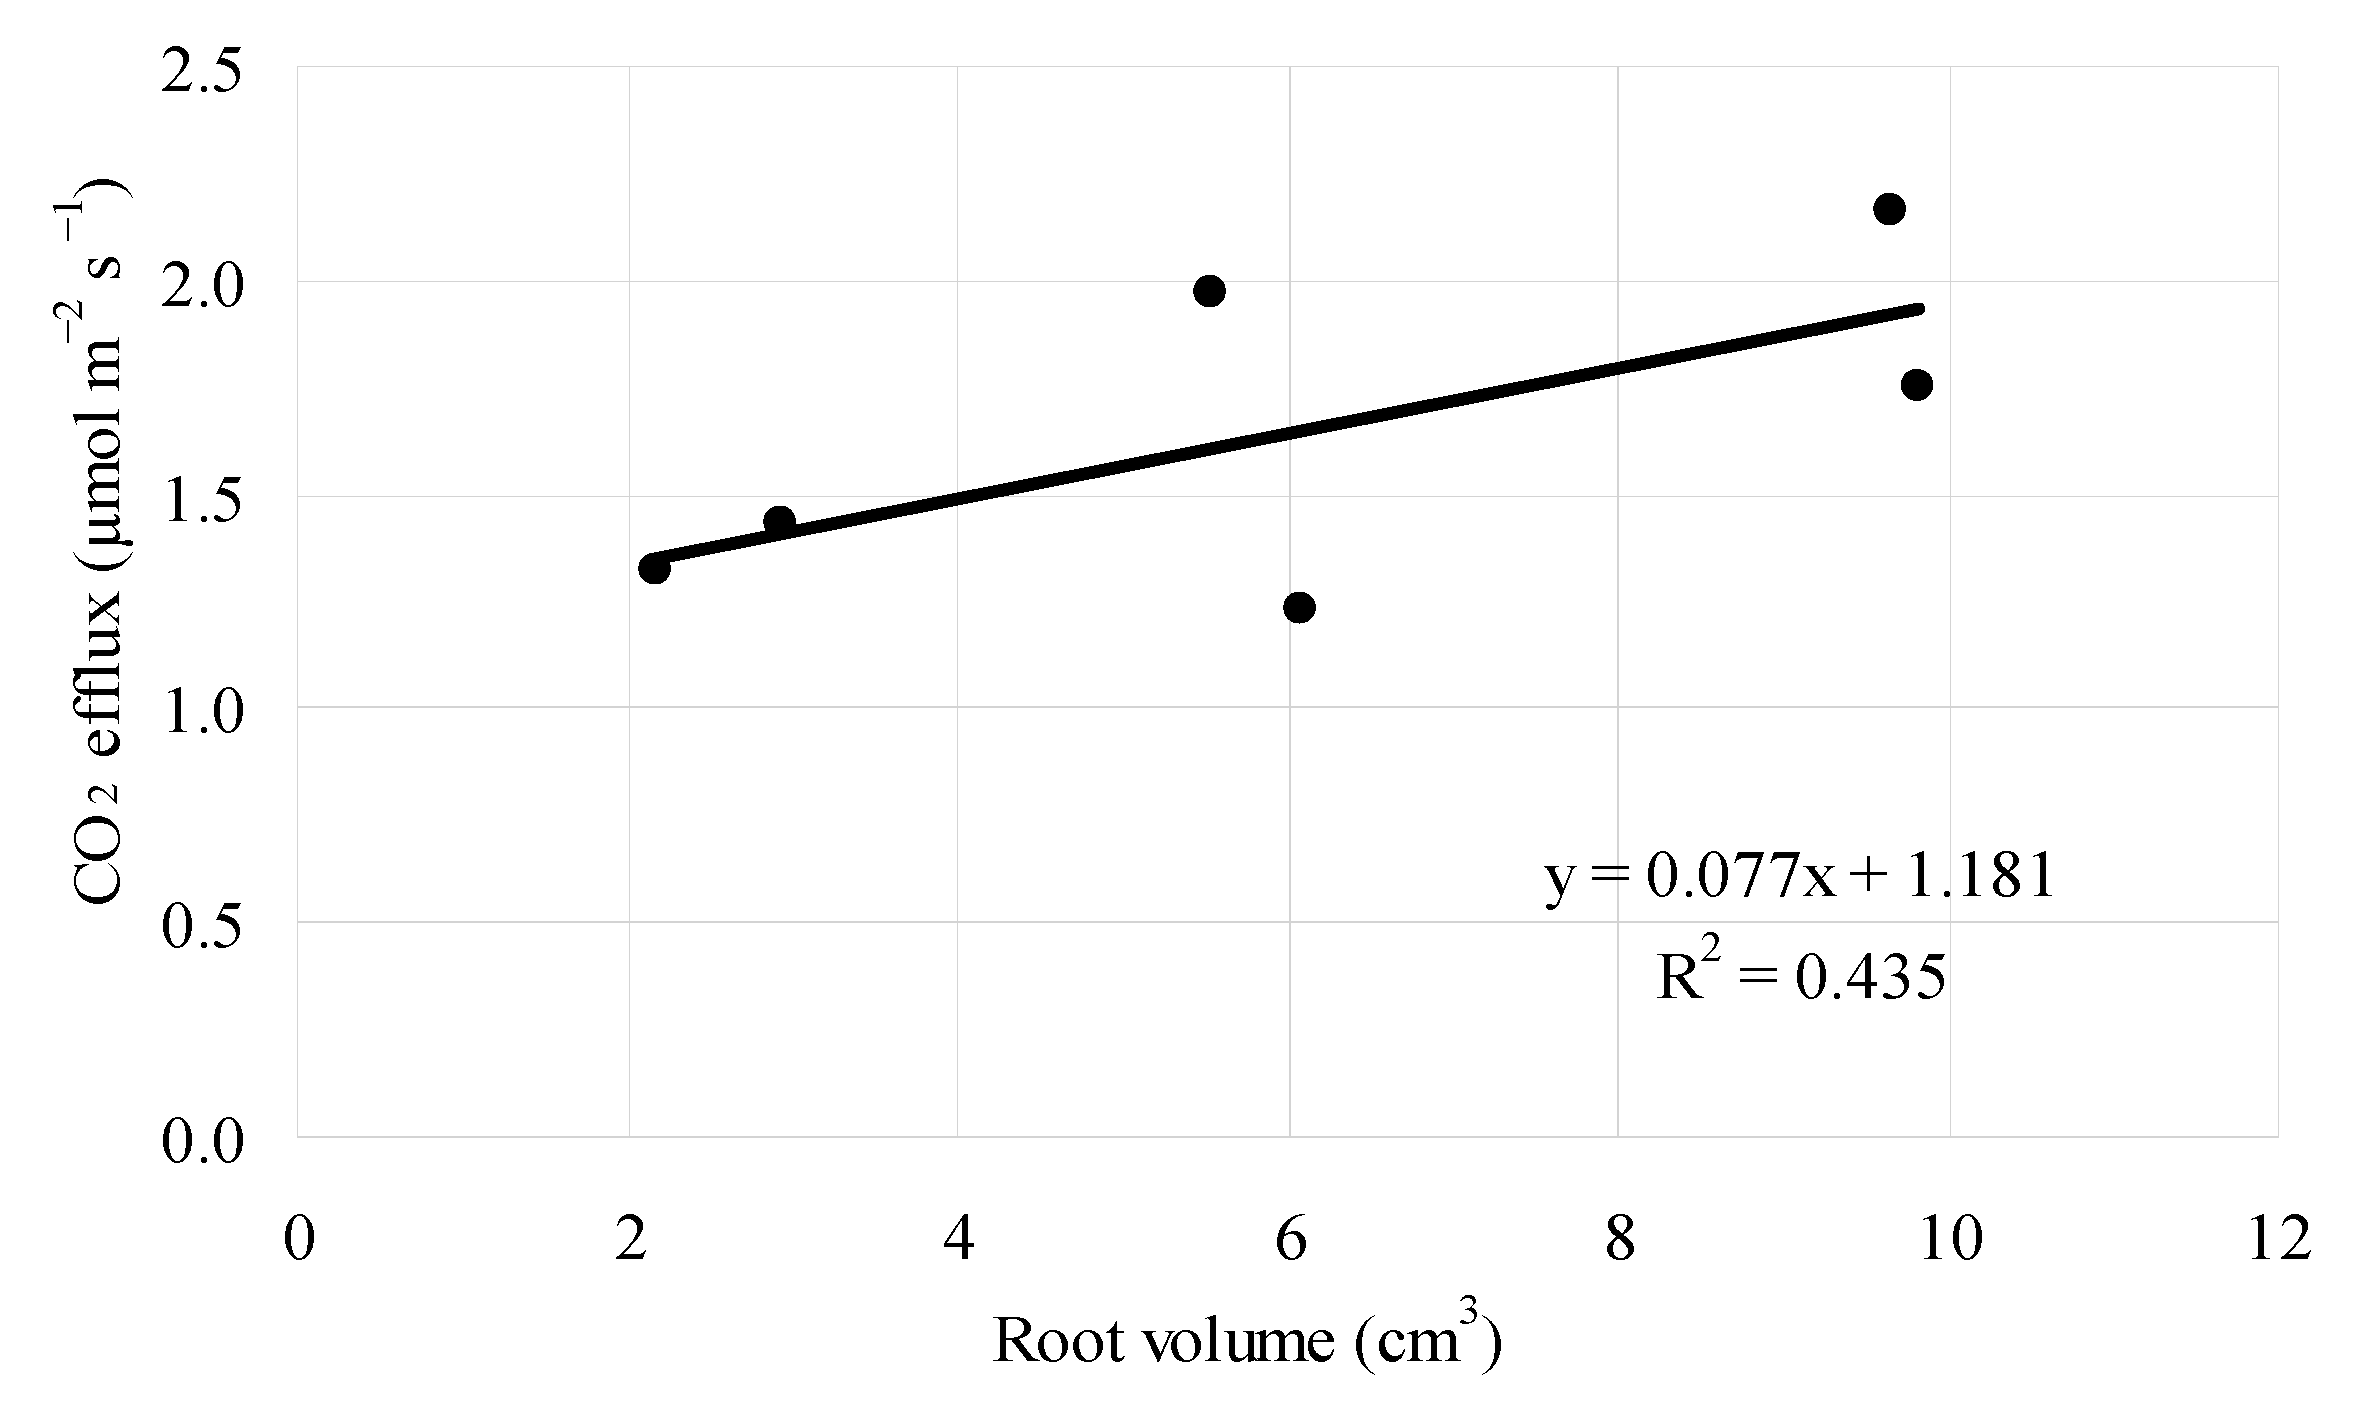
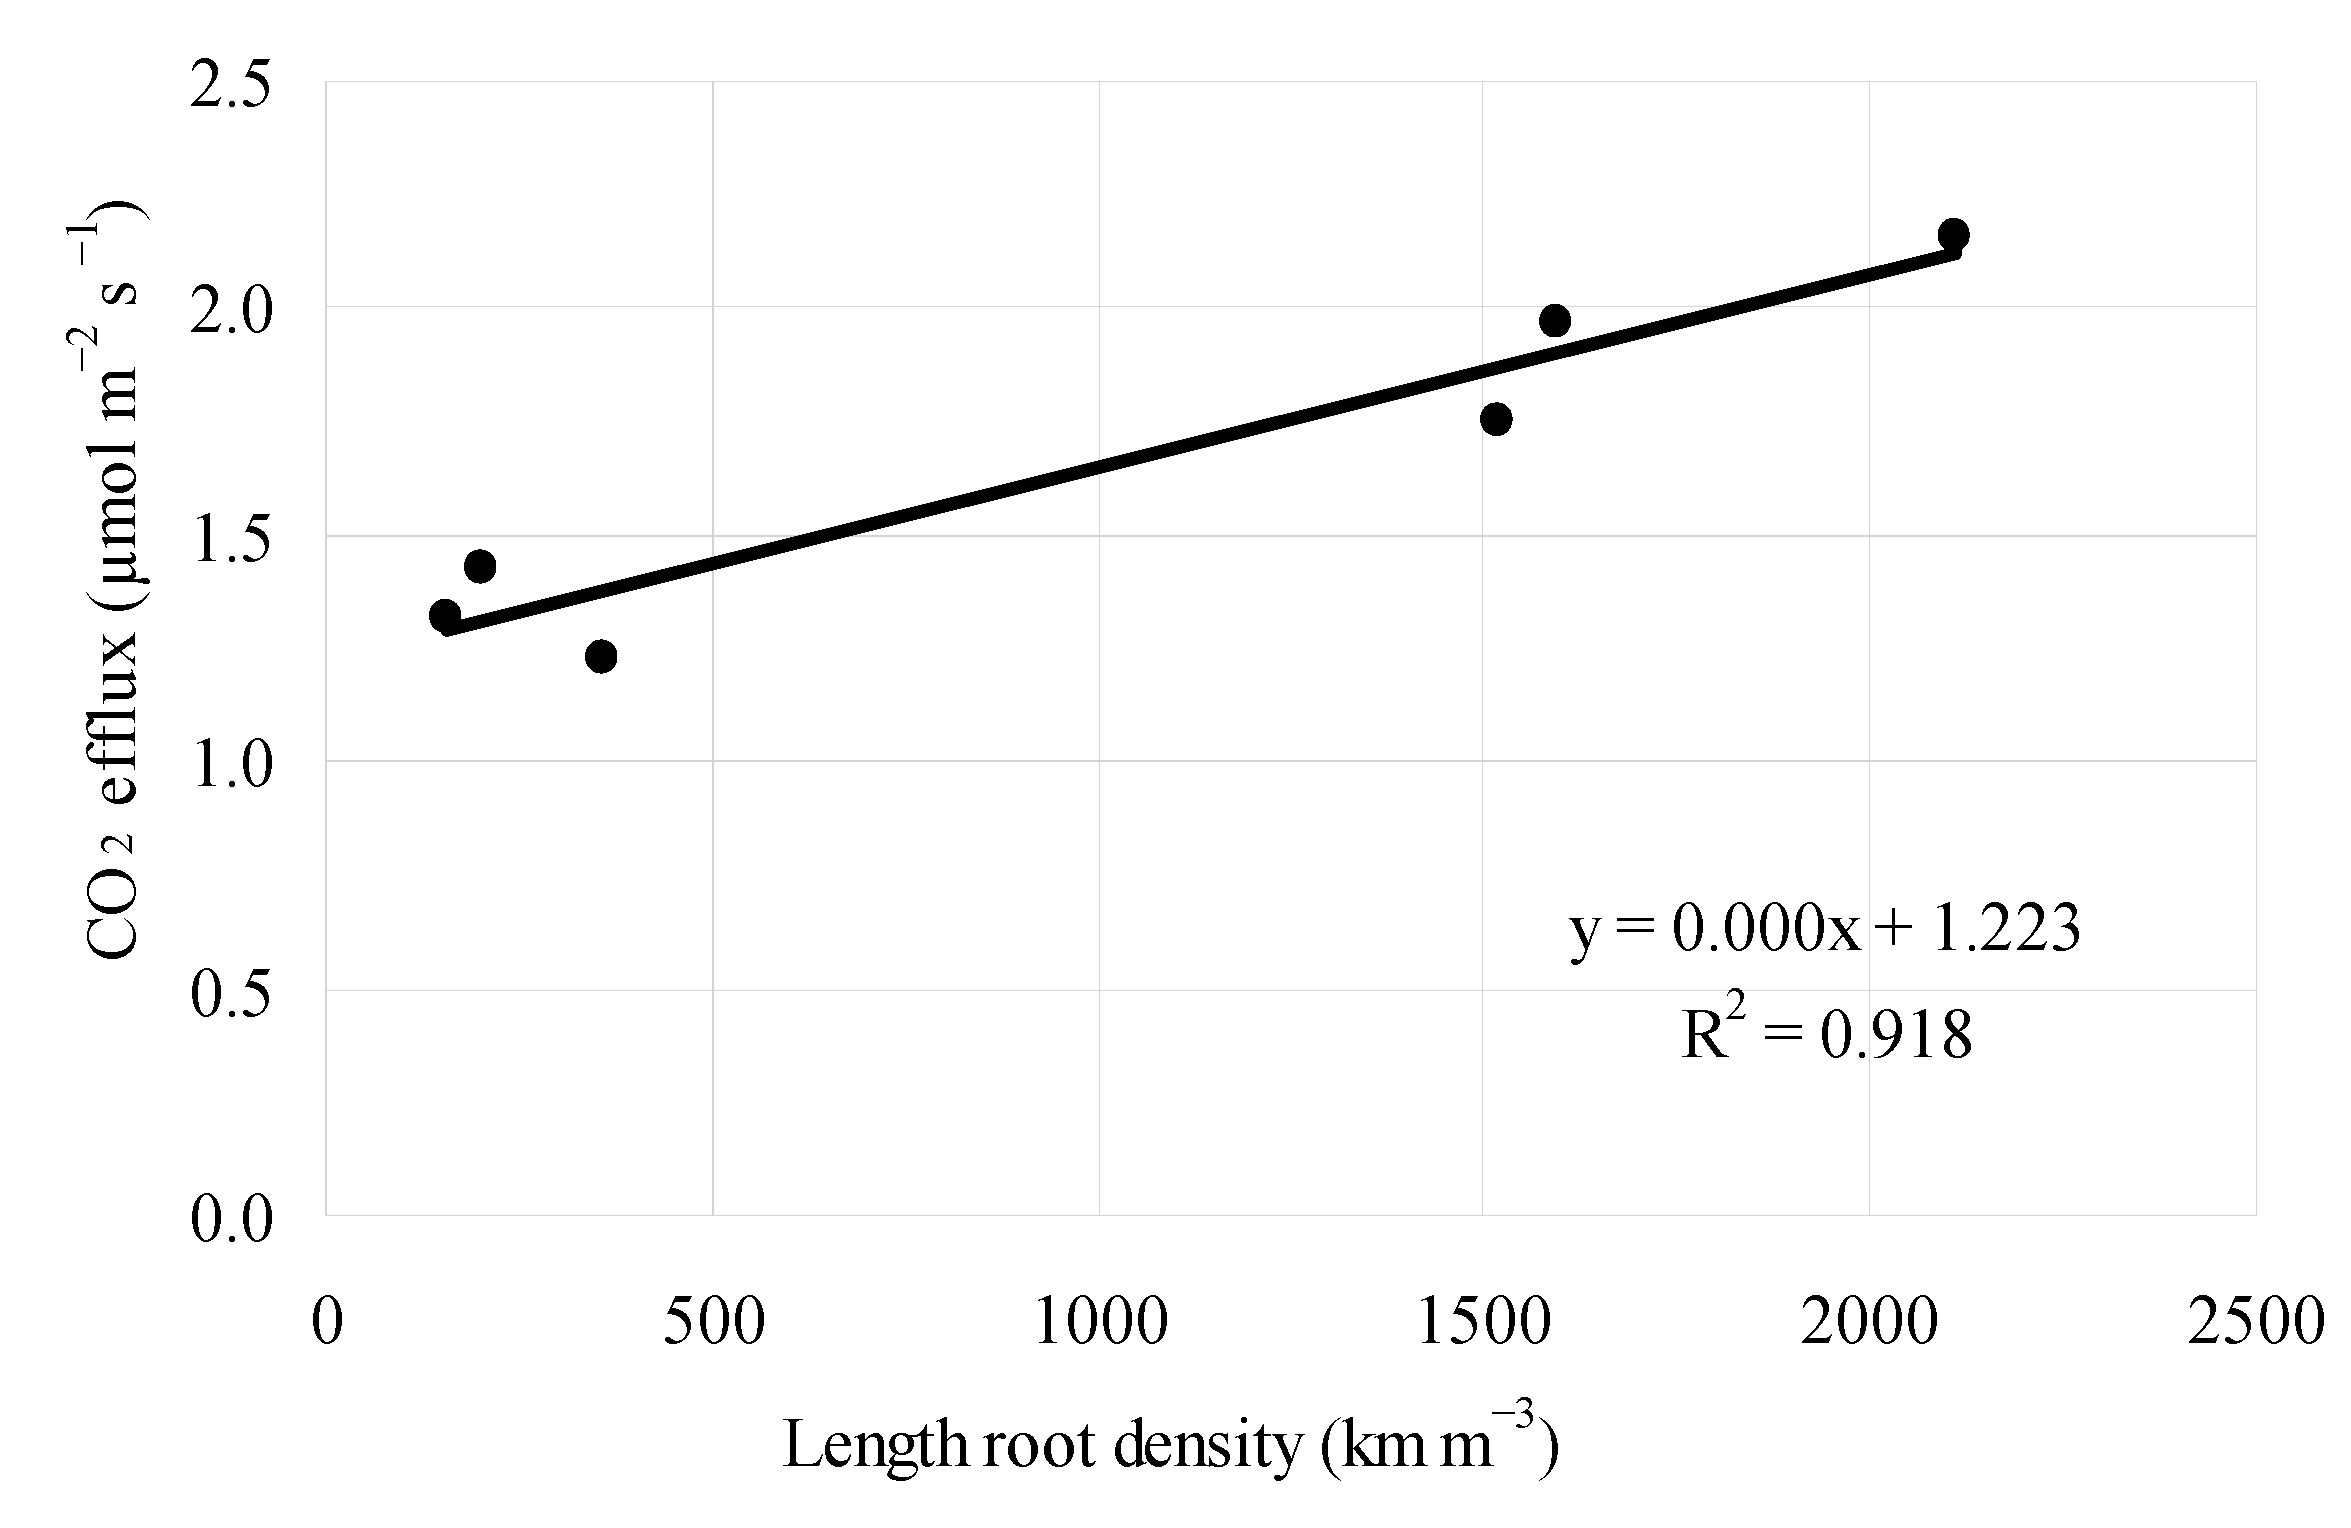
3.5. The Effect Root Network on Soil CO2 Efflux

The CO2 efflux from the soil had a linear relationship with root volume (R2 = 0.435, p < 0.05) within the 0–10 cm soil layer (Figure 11) and with the root length density (R2 = 0.918, p < 0.01) at the same depth (Figure 12).

4. Discussion

Soil temperature and volumetric water content affects CO2 efflux under different land uses. Quantifying CO2 efflux from the soil is a key process for understanding the dynamics of carbon in various ecosystems. However, soil CO2 efflux can change annually, as fluxes respond differently to changing environmental variables, such as soil temperature and water content in the soil [29]. While soil temperature is one of the main indicators of the dynamics of soil CO2 efflux, this temperature influence was suppressed by the effect of soil moisture [14]. In general, there is a shortage of literature published concerning CO2 efflux under different land use (grassland and forest land) methods on Retisol. Some research results published worldwide are in line with our findings as they represent the general relationship between carbon dioxide emissions, air temperature, and soil moisture conditions. Faimon and Lang [30] found that there is a strong positive relationship between the temperature of the soil and soil CO2 efflux during the dry season. The same relationship between CO2 efflux and soil temperature was found by Negassa et al. [31], Chen et al. [32], and Dong et al. [33]. It should be noted that Dossou-Yovo et al. [34] and Pergrina [19] did not find any correlation between these parameters. The consequence of temperature to increase soil CO2 efflux was widely approved by a number of scientists from Japan, the USA, and China [35,36,37]. Schaufler et al. [38] found a nonlinear increase of soil CO2 emissions with increasing soil temperature. The soil temperature (from 7 °C to 20 °C) increased soil CO2 efflux, while soil temperature (from 20 °C) decreased CO2 efflux. Similar results were obtained by Tavares et al. [39], Bogužas et al. [40], and Makhnykina et al. [41]. Pla et al. [42] revealed that when the rain amount increased the soil water content until saturation, the emission of soil CO2 decreased due to the limitation of oxygen diffusion [43]. Pena-Quemba et al. [44] published that soil moisture content ranging from 20 to 70% decreased CO2 efflux from the soil. According to our findings, the volumetric water content (up to 23–25%) increased CO2 efflux. This result is very similar to that obtained in the Czech Republic by Darenova et al. [45], stating that volumetric water content from 7% to 25% has increased soil CO2 efflux.
Our results revealed that soil temperature and volumetric water content were the main factors limiting the rate of soil CO2 efflux from different land uses for the measurement period. The current study provides results on the significant (r = 0.51, p < 0.01) relationship between soil CO2 efflux and soil temperature through the whole measurement period in both land uses. The correlation between soil temperature and volumetric was significantly (p < 0.01) negative in the forest land (r = −0.63) and grassland (r = −0.54). The same results of the relationships between soil CO2 efflux, soil temperature, and volumetric water content were found by Kochiieru et al. [16,46].
The growth of roots depends on the water content in the soil. The respiration of roots as well as the biological activity of the soil increases when the water content in the soil increases. While the current study found a significant effect (p < 0.01) of land use for root volume and root length density, the effect for the mean root diameter was not significant. The significant relationship between the root length density and root volume (p < 0.01) and also between the mean root diameter and root volume (p < 0.05) were observed in the forest land. Correlations between root length density and root volume were also significant in the grassland (p < 0.05), but the correlations between the mean root diameter and root volume were not established in grassland. The similar relationships between the plant root parameters were registered by Kochiieru et al. [46] and Ning et al. [47].
CO2 efflux from the soil is the result of organic matter decomposition, microbial activity, and plant root respiration, which depend on soil moisture and temperature [48,49]. According to Wei et al. [50], soil temperature and soil water not only had an influence on the activity of microorganisms and roots, but also on the diffusion of gases through soil pores. Bortolotto et al. [51] stated that soil temperature is the variable that best explains changes in soil CO2 efflux, while soil water content and root network are also important factors for soil CO2 efflux. Our results confirm the statement that soil CO2 efflux was affected by root length density and root volume in both land uses, indicating that the activity of the root plays one of the main roles in the production of CO2 soil emissions. The relationship between the density of the root and CO2 efflux from the soil (y = 0.61 + 0.07x; R2 = 0.64; p < 0.01) was found by Shibistova et al. [52]. Kochiieru et al. [46] described the relationship between the root volume and soil CO2 efflux within the 0–10 cm soil layer under different land uses and soil types as a linear correlation y = 0.33x + 0.83; R2 = 0.58; p < 0.05.

5. Conclusions

The average soil CO2 efflux in the grassland was 32% higher than in the forest land on Retisol. The CO2 efflux, average across land use, tended to increase in the following order: 2017 < 2018 < 2019. Dry and high-temperature meteorological conditions increased soil CO2 efflux by 14%.
Soil temperature had a positive influence on soil CO2 efflux, but when the soil temperature was higher than 20 °C, the relationship was negative. Volumetric water content (up to 23–25%) increased CO2 efflux. By further increasing volumetric water content in the soil, the soil efflux decreased under both (grassland and forest land) land use methods.
Root volume (55%) and root length density (86%) in the grassland was higher than in the forest land. The CO2 efflux intensity from the soil indicated root activity. Root volume and root length density had a positive effect on soil efflux.

Author Contributions

Conceptualization, M.K.; investigation, M.K.; writing—original draft preparation, M.K. and A.V.; writing—review and editing, M.K., A.V., V.F. and D.F.; project administration, V.F.; funding acquisition, V.F. and D.F. All authors have read and agreed to the published version of the manuscript.

Funding

This work was partly supported by the research program “Productivity and sustainability of agricultural and forest soils” implemented by the Lithuanian Research Center for Agriculture and Forestry. This work was partly supported by the EJP SOIL project “Mechanisms underlying TRAde-offs between Carbon sequestration, greenhouse gas emissions and nutrient losses in Soils under conservation agriculture in Europe (TRACE-Soils) as part of Horizon 2020 Programme”.

Institutional Review Board Statement

Not applicable.

Informed Consent Statement

Not applicable.

Data Availability Statement

Not applicable.

Conflicts of Interest

The authors declare no conflict of interest.

References

  1. Conant, R.; Ogle, S.; Paul, E.; Paustian, K. Measuring and monitoring soil organic carbon stocks in agricultural lands for climate mitigation. Front. Ecol. Environ. 2011, 9, 169–173. [Google Scholar] [CrossRef]
  2. Sánchez-Cañete, E.P.; Scott, R.L.; van Haren, J.; Barron-Gafford, G.A. Improving the accuracy of the gradient method for determining soil carbon dioxide efflux: Accurate Long-Term Fsoil Based on the GM. J. Geophys. Res. Biogeosci. 2017, 122, 50–64. [Google Scholar] [CrossRef]
  3. Liu, Y.; Liu, S.; Wan, S.; Wang, J.; Luan, J.; Wang, H. Differential responses of soil respiration to soil warming and experimental throughfall reduction in a transitional oak forest in central China. Agric. For. Meteorol. 2016, 226, 186–198. [Google Scholar] [CrossRef]
  4. Sainju, U.M.; Barsotti, J.L.; Wang, J. Net global warming potential and greenhouse gas intensity affected by cropping sequence and nitrogen fertilization. Soil Sci. Soc. Am. J. 2014, 78, 248–261. [Google Scholar] [CrossRef]
  5. Sarauskis, E.; Buragiene, S.; Masilionyte, L.; Romaneckas, K.; Avizienyte, D.; Sakalauskas, A. Energy balance, costs and CO2 analysis of tillage technologies in maize cultivation. Energy 2014, 69, 227–235. [Google Scholar] [CrossRef]
  6. Moitinho, M.R.; Padovan, M.P.; Panosso, A.R.; Teixeira, D.D.B.; Ferraudo, A.S.; La Scala, N. On the spatial and temporal dependence of CO2 emission on soil properties in sugarcane (Saccharum spp.) production. Soil Tillage Res. 2015, 148, 127–132. [Google Scholar] [CrossRef]
  7. Daryanto, S.; Wang, L.; Jacinthe, P. Impacts of no-tillage management on nitrate loss from corn, soybean, and wheat cultivation: A meta-analysis. Sci. Rep. 2017, 7, 112–117. [Google Scholar] [CrossRef]
  8. Silva, B.O.; Moitinho, M.R.; Santos, G.A.A.; Teixeira, D.D.B.; Fernandes, C.; La Scala, N., Jr. Soil CO2 emission and short-term soil pore class distribution after tillage operations. Soil Tillage Res. 2019, 186, 224–232. [Google Scholar] [CrossRef]
  9. Feiziene, D.; Feiza, V.; Kadziene, G.; Slepetiene, A. Endocalcari Epihypogleyic Cambisol arable layer agrochemical properties soil changes in a long-term soil management system. Agric. Sci. 2008, 15, 13–23. [Google Scholar]
  10. Bista, P.; Norton, U.; Ghimire, R.; Norton, J.B. Greenhouse Gas Fluxes and Soil Carbon and Nitrogen Following Single Summer Tillage. Environ. Sci. 2015, 6, 183–193. [Google Scholar] [CrossRef]
  11. Ghimire, R.; Norton, U.; Bista, P.; Obour, A.K.; Norton, J.B. Soil organic matter, greenhouse gases and net global warming potential of irrigated conventional, reduced tillage and organic cropping systems. Nutr. Cycles Agroecosyst. 2017, 107, 49–62. [Google Scholar] [CrossRef]
  12. He, J.; Li, H.; Rasaily, R.; Wang, Q.; Cai, G.; Su, Y.; Qiao, X.; Liu, L. Soil properties and crop yields after 11 years of no tillage farming in wheat–maize cropping system in North China Plain. Soil Tillage Res. 2011, 113, 48–54. [Google Scholar] [CrossRef]
  13. Plaza-Bonilla, D.; Cantero-Martínez, C.; Bareche, J.; Arrúe, J.; Álvaro-Fuentes, J. Soil carbon dioxide and methane fluxes as affected by tillage and N fertilization in dryland conditions. Plant Soil 2014, 381, 111–130. [Google Scholar] [CrossRef]
  14. Putramentaitė, A.; Feizienė, D.; Feiza, V.; Antanaitis, Š.; Deveikytė, I.; Seibutis, V.; Janušauskaitė, D. The influence of tillage, fertilization and meteorological conditions on the CO2 exchange rate in a loamy Cambisol. Zemdirb.-Agric. 2014, 101, 227–234. [Google Scholar] [CrossRef]
  15. Fang, C.; Moncrieff, J.B. The dependence of soil CO2 efflux on temperature. Soil Biol. Biochem. 2001, 33, 155–165. [Google Scholar] [CrossRef]
  16. Kochiieru, M.; Lamorski, K.; Feiza, V.; Feiziene, D.; Volungevicius, J. The effect of soil macroporosity, temperature and water content on CO2 efflux in the soils of different genesis and land management. Zemdirb.-Agric. 2018, 105, 291–298. [Google Scholar] [CrossRef]
  17. Buragiene, S.; Sarauskis, E.; Romaneckas, K.; Sasnauskiene, J.; Masilionyte, L.; Kriauciuniene, Z. Experimental analysis of CO2 emissions from agricultural soils subjected to five different tillage systems in Lithuania. Sci. Total Environ. 2015, 514, 1–9. [Google Scholar] [CrossRef]
  18. Rey, A.; Pegoraro, E.; Oyonarte, C.; Were, A.; Escribano, P.; Raimundo, J. Impact of land degradation on soil respiration in a steppe (Stipa tenacissima L.) semi-arid ecosystem in the SE Spain. Soil Biol. Biochem. 2011, 43, 393–403. [Google Scholar] [CrossRef]
  19. Pergrina, F. Surface soil properties influence carbon oxide pulses after precipitation events in a semiarid vineyard under conventional tillage and cover crops. Pedosphere 2016, 26, 499–509. [Google Scholar] [CrossRef]
  20. Jensen, L.S.; Salo, T.; Palmason, F.; Breland, T.A. Influence of biochemical quality on C and N mineralisation from a broad variety of plant materials in soil. Plant Soil 2005, 273, 307–326. [Google Scholar] [CrossRef]
  21. Schoeneberger, M.; Bentrup, B.; de Gooijer, D.; Soolanayakanahally, R.; Sauer, T.; Brandle, J.; Zhou, X.; Current, D. Branching out: Agroforestry as a climate change mitigation and adaptation tool for agriculture. J. Soil Water Conserv. 2012, 67, 128A–136A. [Google Scholar] [CrossRef]
  22. Boone, R.D.; Nadelhoffer, K.J.; Canary, J.D.; Kaye, J.P. Roots exert a strong influence on the temperature sensitivity of soil respiration. Nature 1998, 396, 570–572. [Google Scholar] [CrossRef]
  23. Curiel Yuste, J.; Baldocchi, D.; Gershenson, A.; Goldstein, A.; Mission, A.L.; Wong, S. Microbial soil respiration and its dependency on carbon inputs, soil temperature and moisture. Glob. Chang. Biol. 2007, 13, 2018–2035. [Google Scholar] [CrossRef]
  24. Green, S.; Vogeler, I.; Clothier, B.; Mills, T.; Van Den Dijssel, C. Modelling water uptake by a mature apple tree. Soil Res. 2003, 41, 365–380. [Google Scholar] [CrossRef]
  25. Evers, A.K.; Bambrick, A.; Lacombe, S.; Dougherty, M.C.; Peichl, M.; Gordon, A.M.; Thevathasan, N.V.; Whalen, J.; Bradley, R.L. Potential greenhouse gas mitigation through temperate tree-based intercropping systems. Tree-Based Intercropping Syst. Open Agric. J. 2010, 4, 49–57. [Google Scholar] [CrossRef]
  26. IUSS Working Group WRB. World Reference Base for Soil Resources 2014, Update International Soil Classification System for Naming Soils and Creating Legends for Soil Maps; World Soil Resources Reports No. 106; FAO: Rome, Italy, 2015. [Google Scholar] [CrossRef]
  27. Lapinskienė, N. Ecomorphological, Quantitative and Phytocoenotic Evaluation of the Underground Organs of Grasses of the Lithuanian Agrolandscape Ecosystems. [Lietuvos Agrolandšafto Ekosistemų Žolinių Bendrijų Požeminių Organų Ekomorfologinis, Kiekybinis ir Fitocenotinis Įvertinimas]. Ph.D. Thesis, Vilnius, Lithuanian, 1993; 45p. [Google Scholar]
  28. Bouma, T.J.; Nielsen, K.L.; Koutstaal, B. Sample preparation and scanning protocol for computerized analysis of root length and diameter. Plant Soil 2000, 218, 185–196. [Google Scholar] [CrossRef]
  29. Noh, N.J.; Son, Y.; Lee, S.K.; Yoon, T.K.; Seo, K.W.; Kim, C.; Lee, W.K.; Bae, S.W.; Hwang, J. Influence of stand density on soil CO2 efflux for a Pinus densiflora forest in Korea. J. Plant Res. 2010, 123, 411–419. [Google Scholar] [CrossRef]
  30. Faimon, J.; Lang, M. What actually controls the minute to hour changes in soil carbon dioxide concentrations? Geoderma 2018, 323, 52–64. [Google Scholar] [CrossRef]
  31. Negassa, W.; Price, R.F.; Basir, A.; Snapp, S.S.; Kravchenko, A. Cover crop and tillage systems effect on soil CO2 and N2O fluxes in contrasting topographic positions. Soil Tillage Res. 2018, 154, 64–74. [Google Scholar] [CrossRef]
  32. Chen, W.; Jia, X.; Li, C.; Yu, H.; Xie, J.; Wang, B.; Wu, Y.; Wang, S. Extreme rainfall impacts on soil CO2 efflux in an urban ecosystem in Beijing, China. Can. J. Soil Sci. 2016, 96, 504–514. [Google Scholar] [CrossRef]
  33. Dong, W.; Liu, E.; Wang, J.; Yan, C.; Li, J.; Zhang, Y. Impact of tillage management on the short- and long-term soil carbon dioxide emissions in the dryland of Loess Plateau in China. Geoderma 2017, 307, 38–45. [Google Scholar] [CrossRef]
  34. Dossou-Yovo, E.R.; Bruggemann, N.; Jesse, N.; Huat, J.; Ago, E.E.; Agbossou, E.K. Reducing soil CO2 emission and improving upland rice yield with no-tillage, straw mulch and nitrogen fertilization in northern Benin. Soil Tillage Res. 2016, 156, 44–53. [Google Scholar] [CrossRef]
  35. Dhital, D.; Inoue, T.; Koizumi, H. Seasonal/interannual variations of carbon sequestration and carbon emission in a warm-season perennial grassland. J. Ecosyst. 2014, 2014, 1–13. [Google Scholar] [CrossRef]
  36. Finzi, A.C.; Raymer, P.C.L.; Giasson, M.A.; Orwig, D.A. Net primary production and soil respiration in New England hemlock forests affected by the hemlock woolly adelgid. Ecosphere 2014, 5, 1–16. [Google Scholar] [CrossRef]
  37. Zeng, X.; Gao, Y. Short-term effects of drying and rewetting on CO2 and CH4 emissions from High-Altitude Peatlands on the Tibetan Plateau. Atmosphere 2016, 7, 148–154. [Google Scholar] [CrossRef]
  38. Schaufler, G.; Kitzler, B.; Schindlbacher, A.; Skiba, U.; Sutton, M.A. Greenhouse gas emissions from European soils under different land use: Effects of soil moisture and temperature. Eur. J. Soil Sci. 2010, 61, 683–696. [Google Scholar] [CrossRef]
  39. Tavares, R.L.M.; Souza, Z.M.; Scala, N.L., Jr.; Castioni, G.A.F.; Souza, G.S.; Torres, J.L.R. Spatial and temporal variability of soil CO2 flux in sugarcane green harvest systems. Rev. Bras. Cienc. Solo 2016, 40, 1–14. [Google Scholar] [CrossRef]
  40. Bogužas, V.; Sinkevičienė, A.; Romaneckas, K.; Steponavičienė, V.; Skinulienė, L.; Butkevičienė, L.M. The impact of tillage intensity and meteorogical conditions on soil temperature, moisture content and CO2 efflux in maize and spring barley cultivation. Zemdirb.-Agric. 2018, 105, 307–314. [Google Scholar] [CrossRef]
  41. Makhnykina, A.V.; Polosukhina, D.A.; Koshurnikova, N.N.; Verkhovets, S.V.; Prokushkin, A.S. Influence of precipitation on CO2 soil emission on pine forests of the Central Siberia boreal zone. IOP Conf. Ser. Earth Environ. Sci. 2018, 211, 012043. [Google Scholar] [CrossRef]
  42. Pla, C.; Cuezva, S.; Martinez-Martinez, J.; Fernandez-Cortes, A.; Garcia-Anton, E.; Fusi, N.; Crosta, G.B.; Cuevas-Gonzalez, J.; Canaveras, J.C.; Sanchez-Moral, S.; et al. Role of soil pore structure in water infiltration and CO2 exchange between the atmosphere and underground air in the vadose zone: A combined laboratory and field approach. Catena 2017, 149, 402–416. [Google Scholar] [CrossRef]
  43. Deng, Q.; Hui, D.; Chu, G.; Han, X.; Zhang, Q. Rain-induced changes in soil CO2 flux and microbial community composition in a tropical forest of China. Sci. Rep. 2017, 7, 5539. [Google Scholar] [CrossRef] [PubMed]
  44. Pena-Quemba, D.; Rubiano-Sanabria, Y.; Riveros-Iregui, D. Effects of land use on soil CO2 flux in Paramo de Guerrero 2017, Colombia. Agron. Colomb. 2016, 34, 364–373. [Google Scholar] [CrossRef]
  45. Darenova, E.; Cater, M.; Pavelka, M. Different harvest intensity and soil CO2 efflux in sessile oak coppice forests. iForest-Biogeosci. For. 2016, 9, e1–e7. [Google Scholar] [CrossRef]
  46. Kochiieru, M.; Feiza, V.; Feizienė, D.; Volungevicius, J.; Deveikytė, I.; Seibutis, V.; Pranaitienė, S. The effect of environmental factors and root system on CO2 efflux in different types of soil and land uses. Zemdirb.-Agric. 2021, 108, 3–10. [Google Scholar] [CrossRef]
  47. Ning, S.; Shi, J.; Zuo, Q.; Wang, S.; Ben-Gal, A. Generalization of the root length density distribution of cotton under film mulched drip irrigation. Field Crops Res. 2015, 177, 125–136. [Google Scholar] [CrossRef]
  48. Pumpanen, J.; Kulmala, L.; Linden, A.; Kolari, P.; Nikinmaa, E.; Hari, P. Seasonal dynamics of autotrophic respiration in boreal forest soil estimated by continuous chamber measurements. Boreal Environ. Res. 2015, 20, 637–650. [Google Scholar]
  49. Zhou, Y.; Hagedorn, F.; Zhou, C.; Jiang, X.; Wang, X.; Li, M.H. Experimental warming of a mountas tundra increases soil CO2 effluxes and enhances CH4 and N2O uptake at Changbai mountain, China. Sci. Rep. 2016, 6, 1–8. [Google Scholar] [CrossRef]
  50. Wei, S.; Zhang, X.; McLaughlin, N.B.; Liang, A.; Jia, S.; Chen, X.; Chen, X. Effect of soil temperature and soil moisture on CO2 flux from eroded landscape positions on black soil in Northeast China. Soil Tillage Res. 2014, 144, 119–125. [Google Scholar] [CrossRef]
  51. Bortolotto, R.P.; Amado, T.J.C.; Nora, D.D.; Keller, C.; Roberti, D.; Fiorin, J.E.; Reichardt, K.; Zamberlan, J.F.; Pasini, M.P.B.; Nicoloso, R.S. Soil carbon dioxide flux in a no-tillage winter system. Afr. J. Agric. Res. 2015, 10, 450–457. [Google Scholar] [CrossRef]
  52. Shibistova, O.; Lloyd, J.; Evgrafova, S.; Savushkina, N.; Zrazhevskaya, G.; Arneth, A.; Knohl, A.; Kolle, O.; Detlefschulze, E. Seasonal and spatial variability in soil CO2 efflux rates for a central Siberian Pinus sylvestris forest. Tellus 2002, 54, 552–567. [Google Scholar] [CrossRef]
Figure 1. Measurements of CO2 efflux ((a)—in the grassland; (b)—in the forest) and sampling procedure ((c)—taking sward root samples).
Sustainability 15 07193 g001
Figure 2. The dynamics in the soil CO2 efflux during vegetation stages from 2017 to 2019 in different land uses. The standard error values are presented as error bars.
Sustainability 15 07193 g002
Figure 3. The dynamics in soil temperature during vegetation stages from 2017 to 2019 in different land uses. The standard error values are presented as error bars.
Sustainability 15 07193 g003
Figure 4. The dynamics in the soil volumetric water content during the vegetation period of 2017–2019 under different land uses. The standard error values are presented as error bars.
Sustainability 15 07193 g004
Figure 5. The relationship between soil temperature and CO2 efflux at the 0–5 cm soil layer from grassland and forest land in 2017.
Sustainability 15 07193 g005
Figure 6. The relationship between soil temperature and CO2 efflux at the 0–5 cm soil layer from grassland and forest land in 2018.
Sustainability 15 07193 g006
Figure 7. The relationship between soil temperature and CO2 efflux within the 0–5 cm soil layer from grassland and forest land in 2019.
Sustainability 15 07193 g007
Figure 8. The relationship between volumetric water content and CO2 efflux within the 0–5 cm soil layer from grassland and forest land in 2017.
Sustainability 15 07193 g008
Figure 9. The relationship between volumetric water content and CO2 efflux within the 0–5 cm soil layer from grassland and forest land in 2018.
Sustainability 15 07193 g009
Figure 10. The relationship between volumetric water content and CO2 efflux within the 0–5 cm soil layer from grassland and forest land in 2019.
Sustainability 15 07193 g010
Figure 11. The relationship between root volume and CO2 efflux within the 0–10 cm soil layer under various land uses and years.
Sustainability 15 07193 g011
Figure 12. The relationship between root length density and CO2 efflux within the 0–10 cm soil layer under various land uses and years.
Sustainability 15 07193 g012
Table 1. Soil texture and bulk density (±standard error) at different land use methods on Retisol within 0–10 cm layer.
Land Use
Method
Soil Fraction%TextureBulk Density
Mg m−3
Sand
2.0–0.063 mm
Silt
0.063–0.002 mm
Clay
<0.002 mm
Forest49.5241.139.35loam0.83 ± 0.04
Grassland63.0327.739.24sandy loam1.37 ± 0.07
Table 2. Weather conditions for 2017–2019 (the data from the Laukuva Meteorological Station).
Year201720182019Long Term Mean (1981–2010)
Annual mean air temperature, °C6.97.58.16.3
Difference from long-term mean, °C+0.6+1.2+1.8-
Growing season’s mean air temperature, °C12.515.414.012.8
Difference from long-term mean, °C−0.3+2.6+1.2-
Total annual precipitation, mm958.9615.4819.8816
Total annual precipitation as percentage of the long-term mean, %+17.5−24.6+0.5-
Growing season’s total precipitation, mm422.3306.4369.9410
Difference from long-term mean, mm+12.3−103.6−40.1-
Table 3. Mean content ± standard error of CO2 efflux, soil temperature, and volumetric water content in relation to different years and land uses.
Year
(Factor A)
Land Use
(Factor B)
CO2 Efflux
(µmol m−2 s−1)
Soil Temperature (°C)Volumetric Water Content (%)
2017 1.49 a ± 0.1016.2 b ± 0.626.6 a ± 1.3
2018 1.70 a ± 0.1019.6 a ± 0.826.4 a ± 2.3
2019 1.74 a ± 0.1517.1 b ± 1.020.4 b ± 1.1
Forest1.33 b ± 0.0717.4 a ± 0.724.3 a ± 1.4
Grassland1.96 a ± 0.1017.9 a ± 0.624.6 a ± 1.4
Actions and interactions:
A ns**
B **nsns
A × B ***ns
*, **—the least significant difference at p < 0.05 and p < 0.01, respectively, ns—not significant. Data followed by the same letters are not significantly different at p < 0.05.
Table 4. Correlation matrix of CO2 efflux, soil temperature, and volumetric water content under different land use methods.
Land UseParametersRangeCorrelation Matrix
FromToSoil TemperatureVolumetric Water Content
ForestCO2 efflux µmol m−2 s−10.442.660.51 **−0.15
Soil temperature °C6.729.11.00−0.63 **
Volumetric water content%5.948.8 1.00
GrasslandCO2 efflux µmol m−2 s−10.74.270.51 **−0.22
Soil temperature °C5.727.41.00−0.54 **
Volumetric water content%6.148.7 1.00
**—the least significant difference at p < 0.01.
Table 5. Root parameter (mean ± standard error) in different years and land uses.
Year
(Factor A)
Land Use
(Factor B)
Root Volume cm3Root Length Density km m−3Mean Root Diameter mm
2017 7.95 a ± 1.25939 a ± 2640.58 a ± 0.09
2018 4.24 a ± 1.11897 a ± 4070.49 ab ± 0.08
2019 5.91 a ± 1.731133 a ± 4520.33 b ± 0.04
Forest3.73 b ± 0.63240 b ± 390.44 a ± 0.02
Grassland8.34 a ± 1.121740 a ± 2100.49 a ± 0.09
Actions and interactions:
A nsnsns
B ****ns
A × B ****ns
**—the least significant difference at p < 0.01, ns—not significant. Data followed by the same letters are not significantly different at p < 0.05.
Table 6. Correlation matrix among different root parameters under different land uses (averaged by year).
Root Characteristics RangeCorrelation Matrix
FromToRoot VolumeRoot Length Density
ForestMean root diameter, mm0.380.610.50 *–0.12
root volume, cm31.546.861.000.79 **
root length density, km m−3133445 1.00
Grasslandmean root diameter, mm0.221.010.400.11
root volume, cm31.6013.741.000.63 *
root length density, km m−34242643 1.00
*, **—the least significant difference at p < 0.05 and p < 0.01, respectively.
Disclaimer/Publisher’s Note: The statements, opinions and data contained in all publications are solely those of the individual author(s) and contributor(s) and not of MDPI and/or the editor(s). MDPI and/or the editor(s) disclaim responsibility for any injury to people or property resulting from any ideas, methods, instructions or products referred to in the content.

