2.1. Carbon Dioxide Emissions of Passenger Cars by Fuel Type
Inside the EU, in the last years, the total GHG emissions have dropped, but the transport sector has not followed the same trend. Moreover, in 2019, GHG emissions increased by 0.8% (shipping was not included) [
9]. The emissions of GHGs in the transport industry consist mainly of NOx, CO, and NMVOCs, the bigger share being CO
2 [
10].
In the transport sector, passenger cars and light-duty vehicles are the main pollutants, and together they are responsible for 70% of the total GHG emissions in the EU [
11]. Due to this matter, the EU is obliged to find new ways to address and encourage the acquisition of less polluting passenger cars.
On EU roads, in 2021, the passenger cars by fuel type were as follows: 52.9% petrol; 42.3% diesel; 3.4% alternative fuels; 0.8% hybrid; 0.4% electric cars (BEVs) [
12]. The most used passenger cars are those with internal combustion engines, which are the ones that emit the most GHGs [
13].
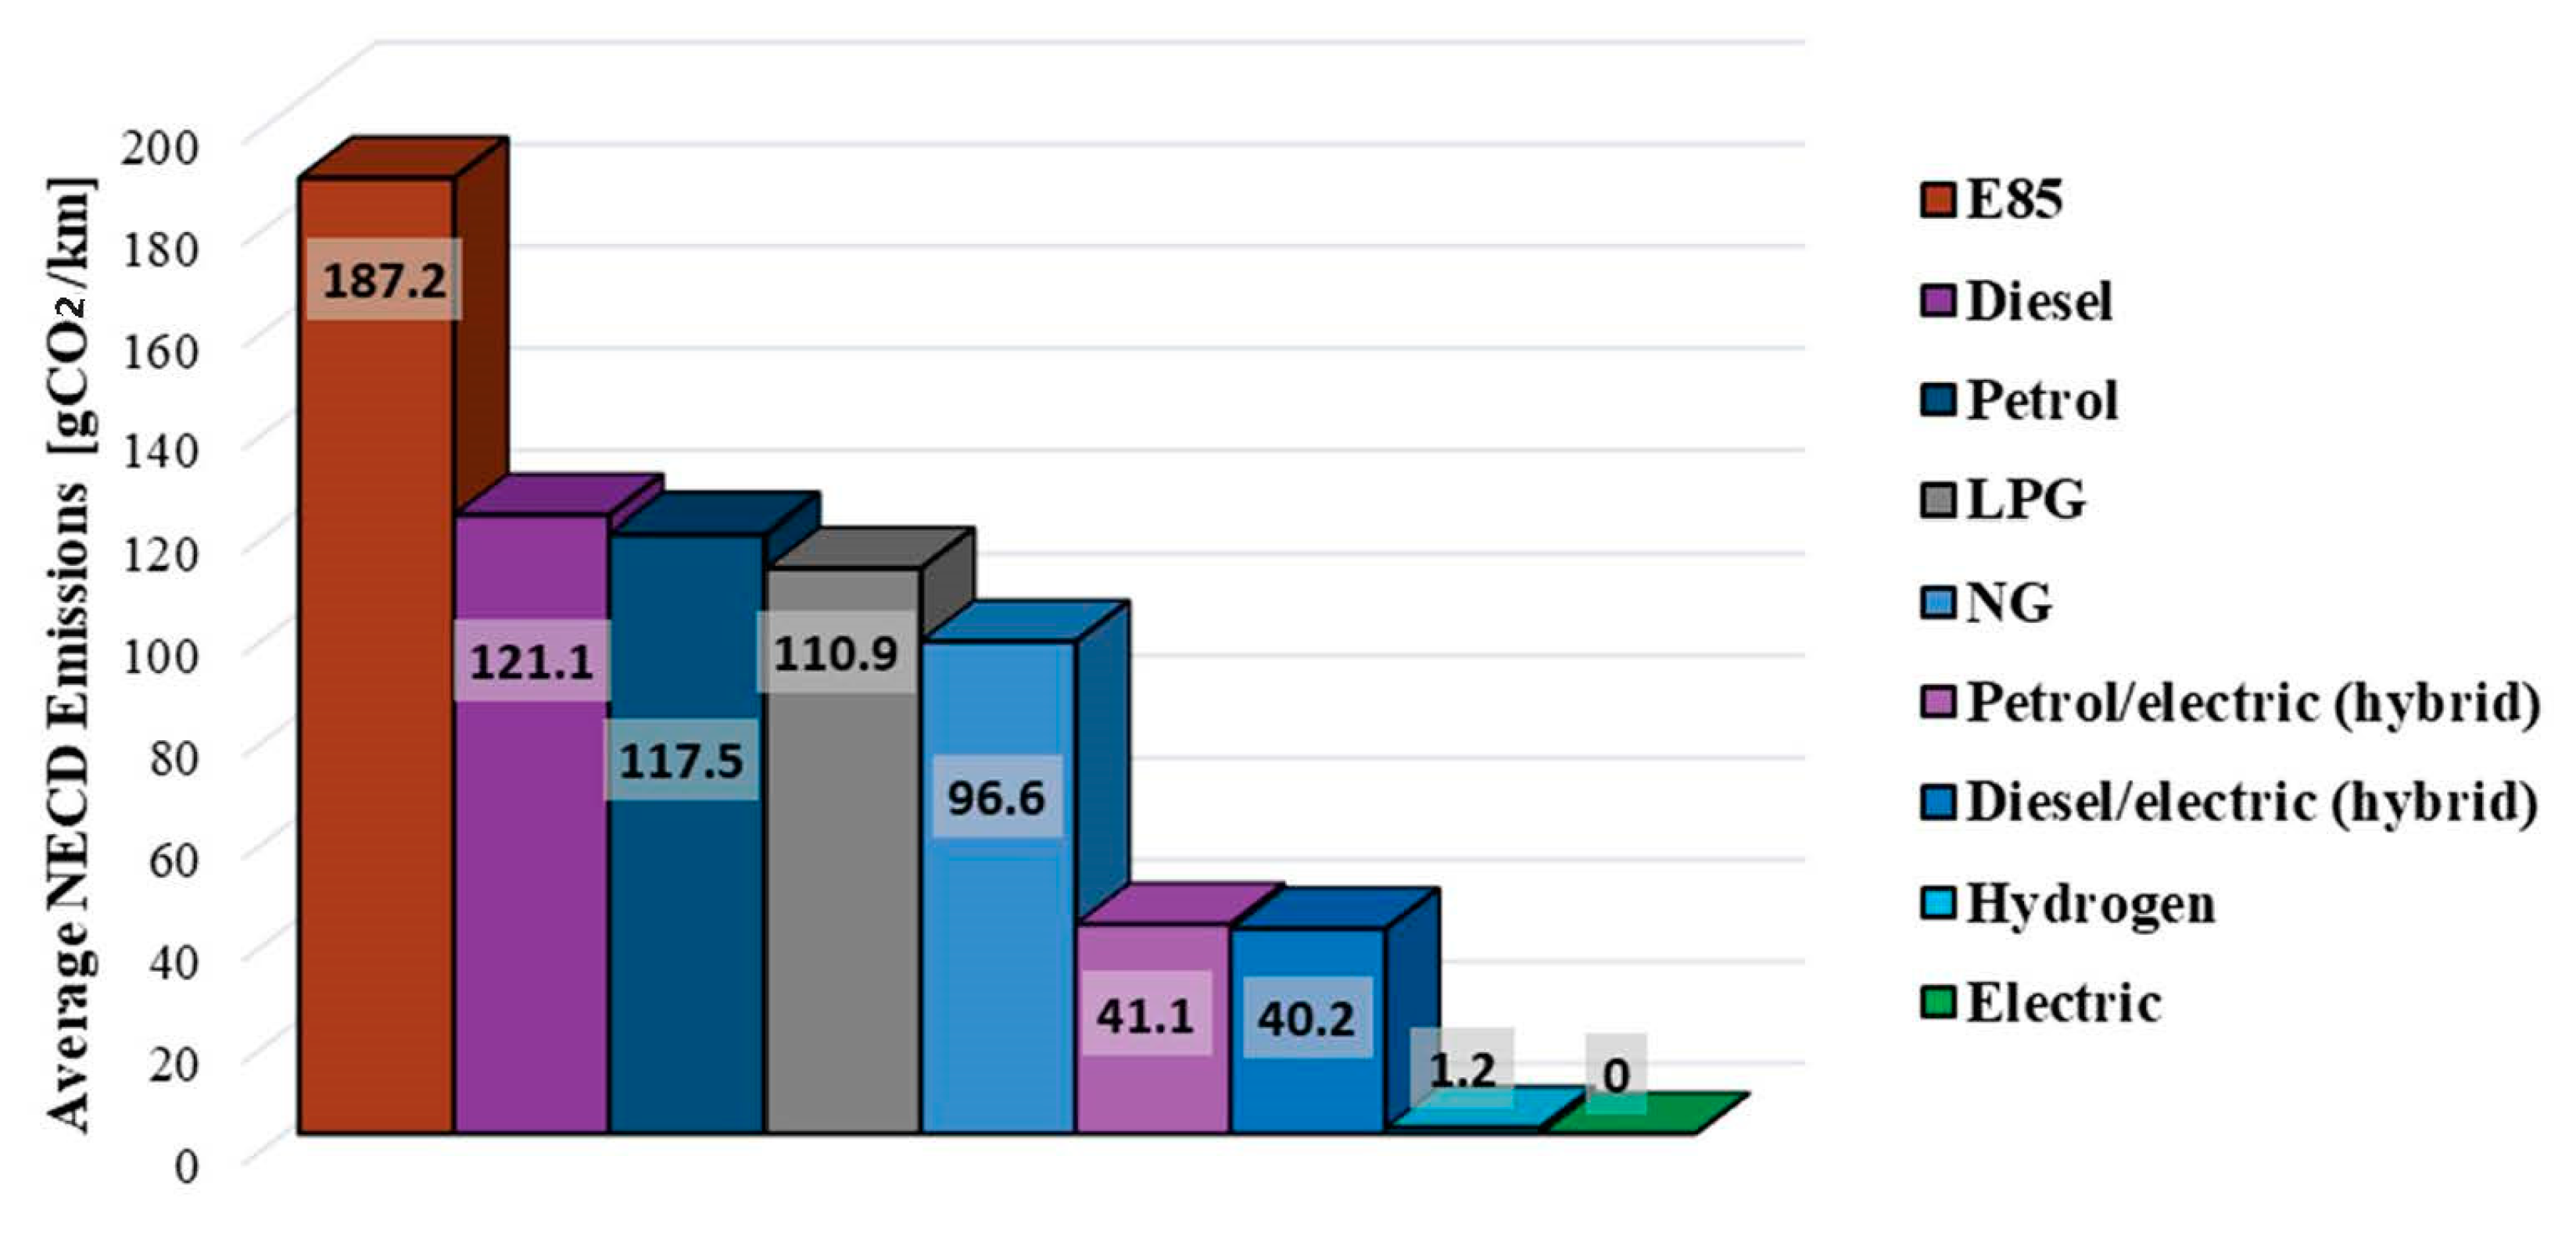
Figure 1, which represents the average CO
2 emissions from different fuel types, shows that BEVs have zero emissions, and that the cars that use E85, LPG, diesel, and petrol as fuel pollute the most.
The literature shows that cars that use bioethanol (E85) have the highest CO
2 emissions (
Figure 1), but they have the lowest total greenhouse effect when sugar cane-based fuel is used. The reason behind this contradiction dwells in the uptake of CO
2 from the air during the growth of sugar cane [
14]. In the EU, the countries with the highest rates of CO
2 emissions from new cars that come from E85 are Germany (292 gCO
2/km) and France (185.5 gCO
2/km) [
15].
Due to the high rate of GHG emissions from diesel cars, many cities in the EU are considering banning them in the central areas [
16]. Diesel cars are mostly used in Lithuania and Latvia (69.2% and 63.2%, respectively, from the total fleets of passenger cars), and they are used the least in Greece (8.1%) [
17]. Petrol is the most used fuel in the EU (52.9%), ranging between 91.1% of the cars in Greece and 26.1% of the cars in Lithuania [
18].The popularity of petrol and diesel cars resides in the range of vehicles being designed for long-distance trips [
18]. However, a 2019 study made in Portugal shows a decrease by up to −27% in emissions when cleaner vehicles are used that comply with the post-Euro 6 standards [
19].
LPG is a colourless gas that is derived from petroleum, and it is most often used when converting the existing technologies of passenger cars to run on cheaper and lower GHG emissions [
20]. From the 9,787,916 passenger cars registered in the EU in 2020, 151,999 used LPG as fuel, which emits, on average, 110.9 NECD (gCO
2/km). In this case, the differences between the CO
2 emissions in EU countries are small, ranging between 121.4
2 /km in Belgium and 102.3 gCO
2/km in Romania [
14]. Most of the registered cars that use LPG are in Italy (93,339 (6.3% of the cars)), with fewer in Luxemburg (only five cars) [
14,
17]. Compressed natural gas (CNG) is used by 0.5% of the passenger car fleet in the EU, being most common in Italy (2.4%) [
17]. In 2020, the average emissions of gCO
22/km from new registered cars ranged between 127.4 (Poland) and 81 (Croatia) [
9]. CNG is described as one of the promising low-emission alternatives for the short- and mid-term decarbonization of road transport in the EU [
21], but studies show that there are no benefits in terms of GNG emissions [
22].
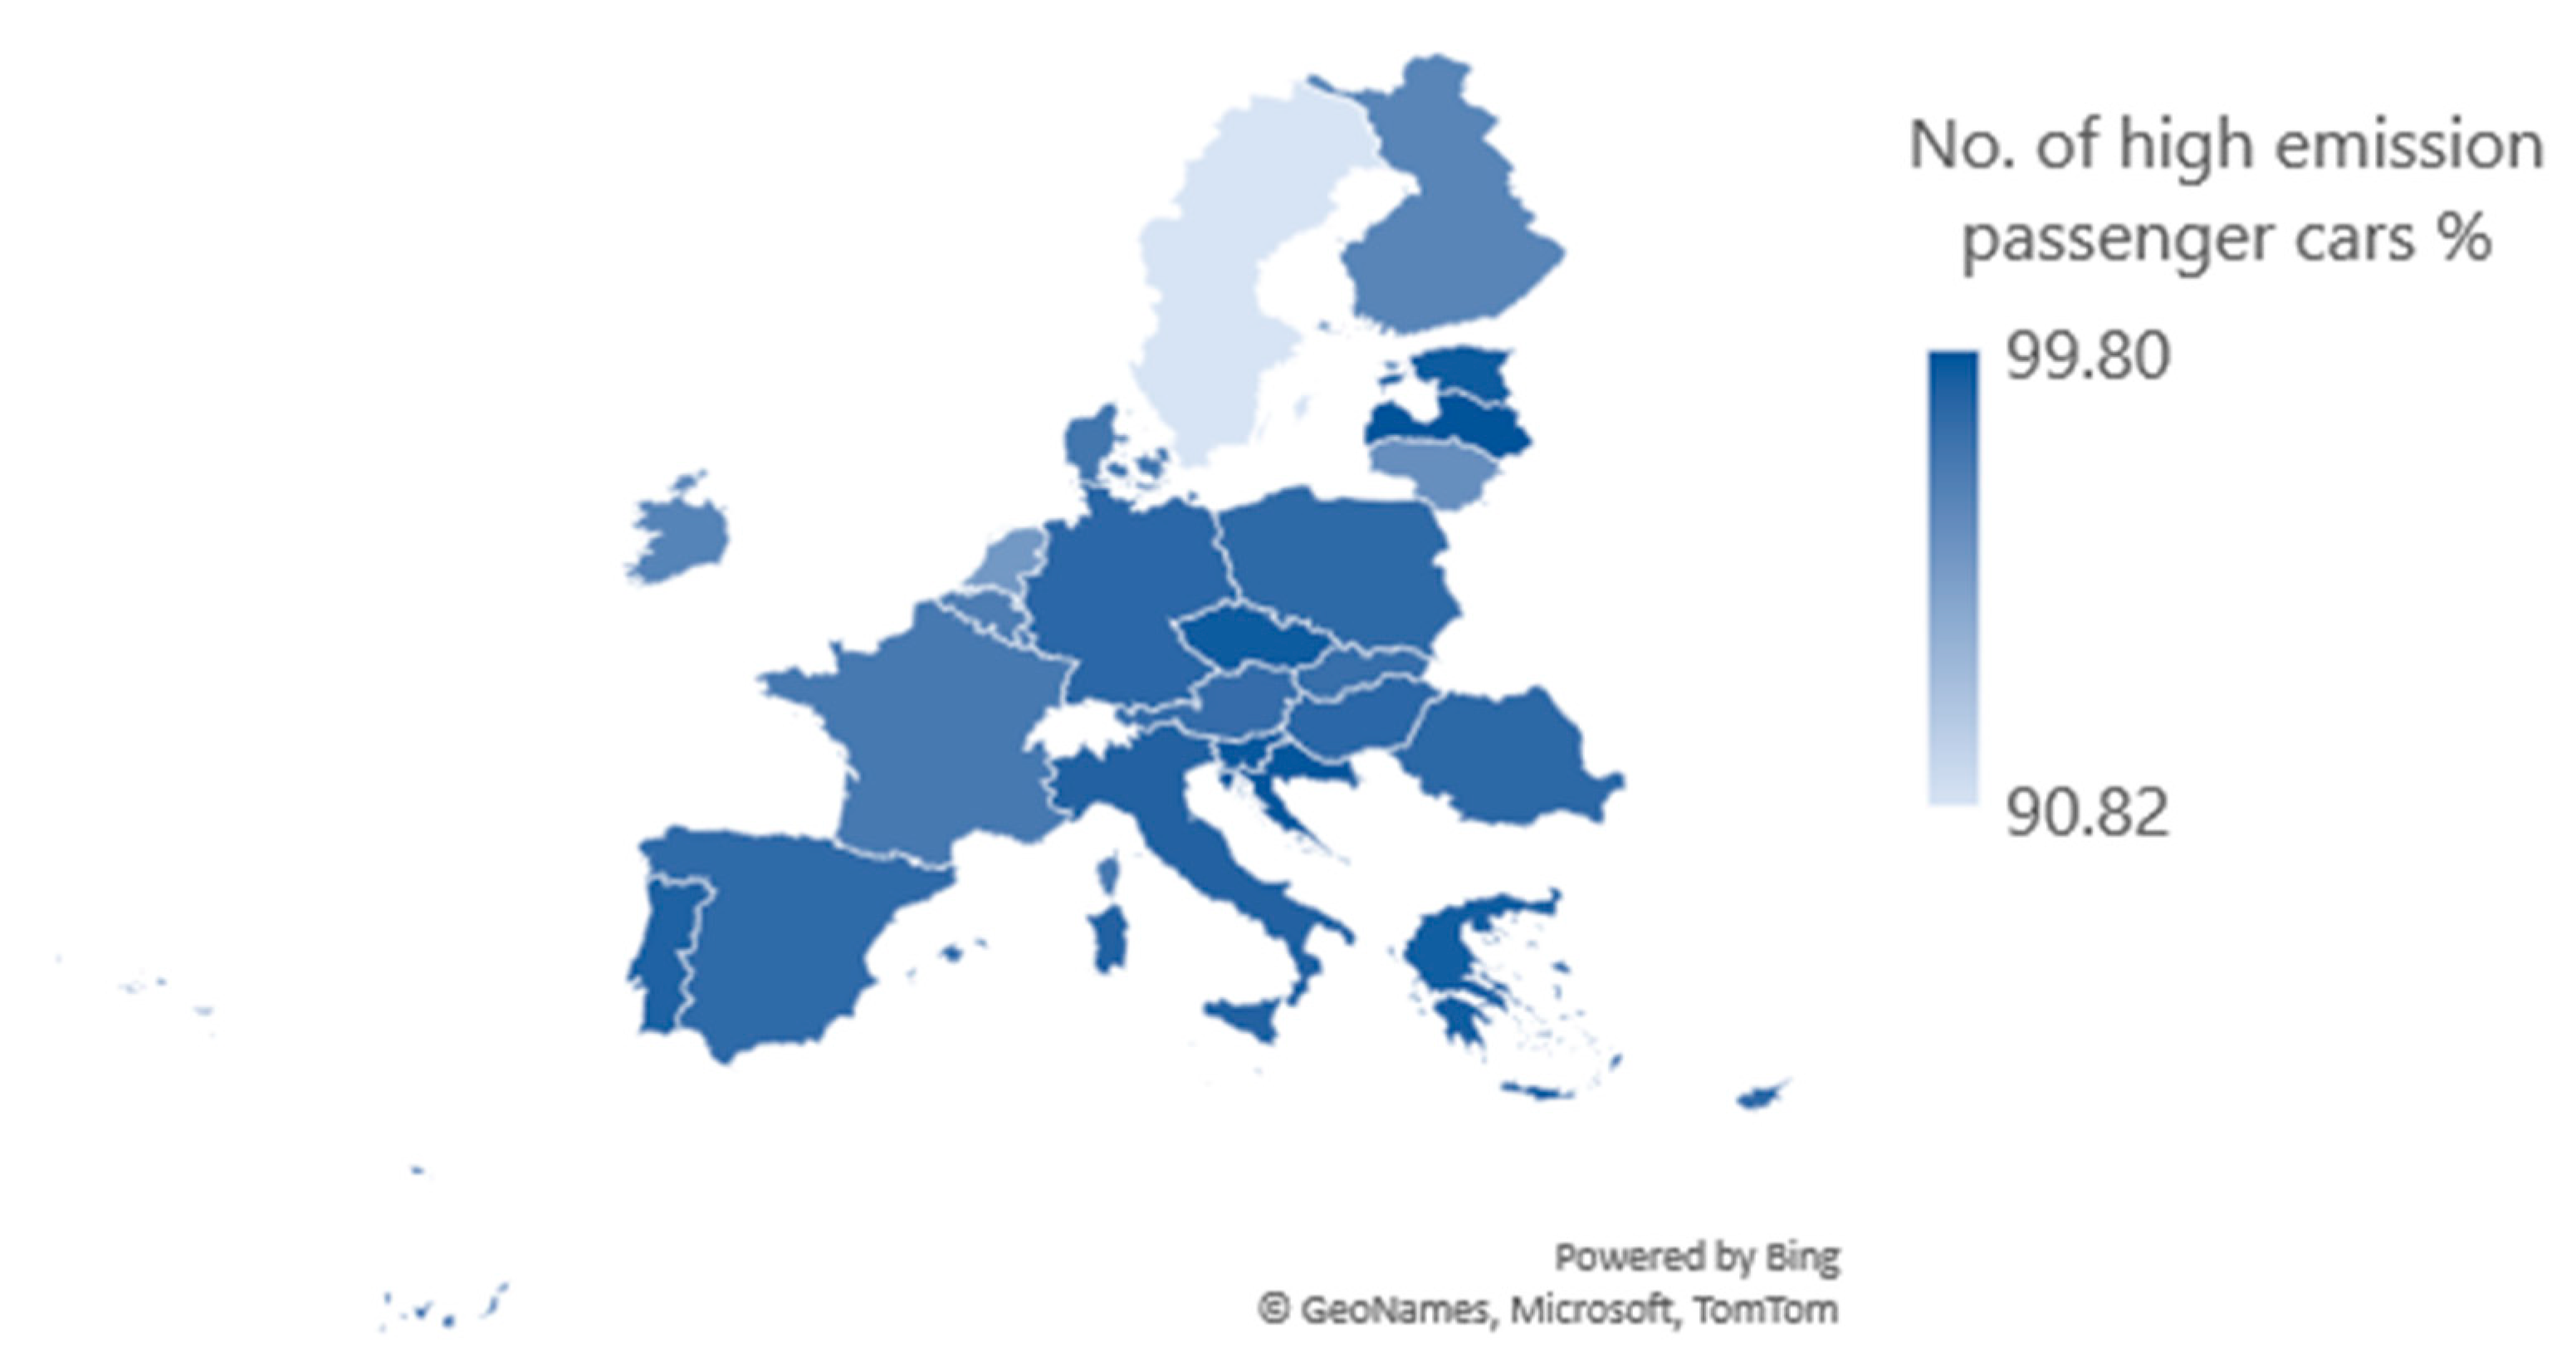
The below figure (
Figure 2) shows the distribution of high-emission passenger vehicles in EU-27. The most passenger cars that use fuels with high polluting rates (petrol, diesel, LPG, GNG) are in Latvia, Croatia, Slovenia, and Estonia, while Sweden, the Netherlands, and Lithuania have less.
The differences between the average emissions from new petrol–electric and diesel–electric cars are small (41.1 and 40.2 gCO
2/km, respectively), being mostly preferred by Germans in the EU [
14]. Hybrid engine cars (HEVs) are a combination of the combustion engine and an electric motor, and they are an intermediate solution between ICVs and BEVs [
18]. These cars are mostly used in Sweden, the Netherlands, and Ireland (2.4% of the total passenger car fleet), and they are less used in Croatia and Romania (0.2% of the total passenger car fleet) [
17]. Another solution is plug-in electric cars (PHEVs), which are cars can be directly charged from the power grid and can be driven at 20–50 km using only electricity [
26]. It is safe to say that, on small trips, the CO
2 emissions of PHEVs are zero.
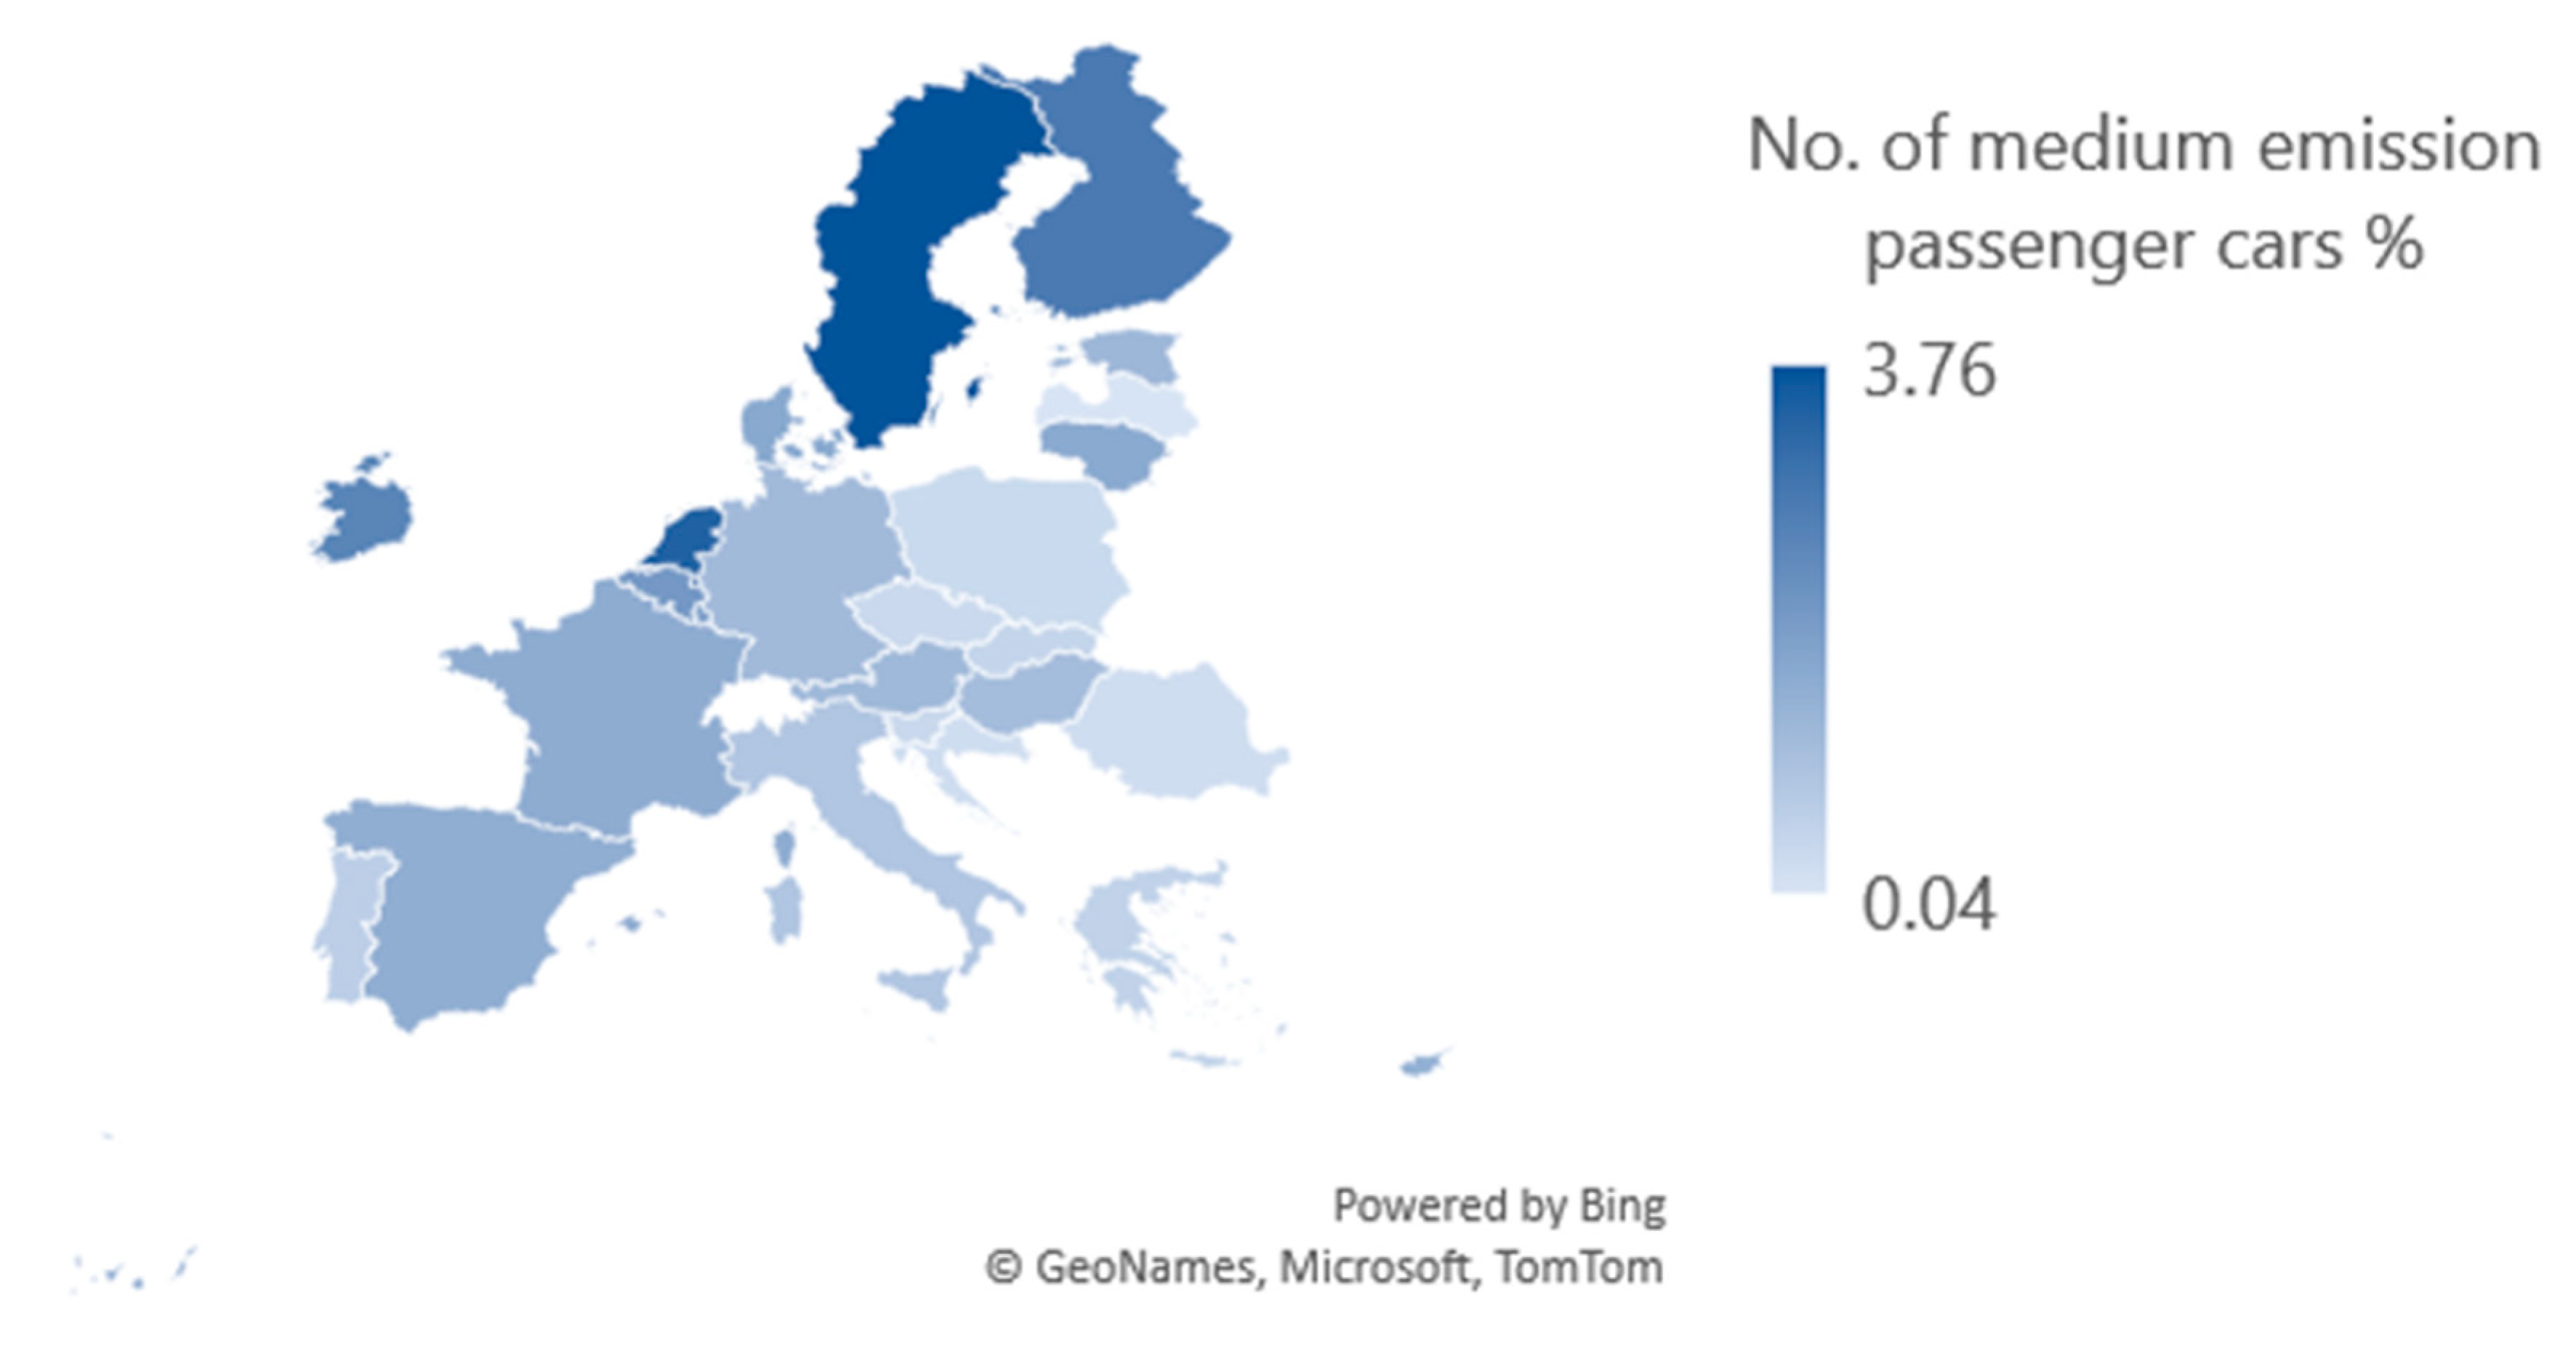
The available data (
Figure 3) show higher rates of registered HEV and PHEV passenger cars in Sweden, the Netherlands, Finland, Ireland, and Belgium, and fewer in Poland, Romania, Croatia, and Latvia.
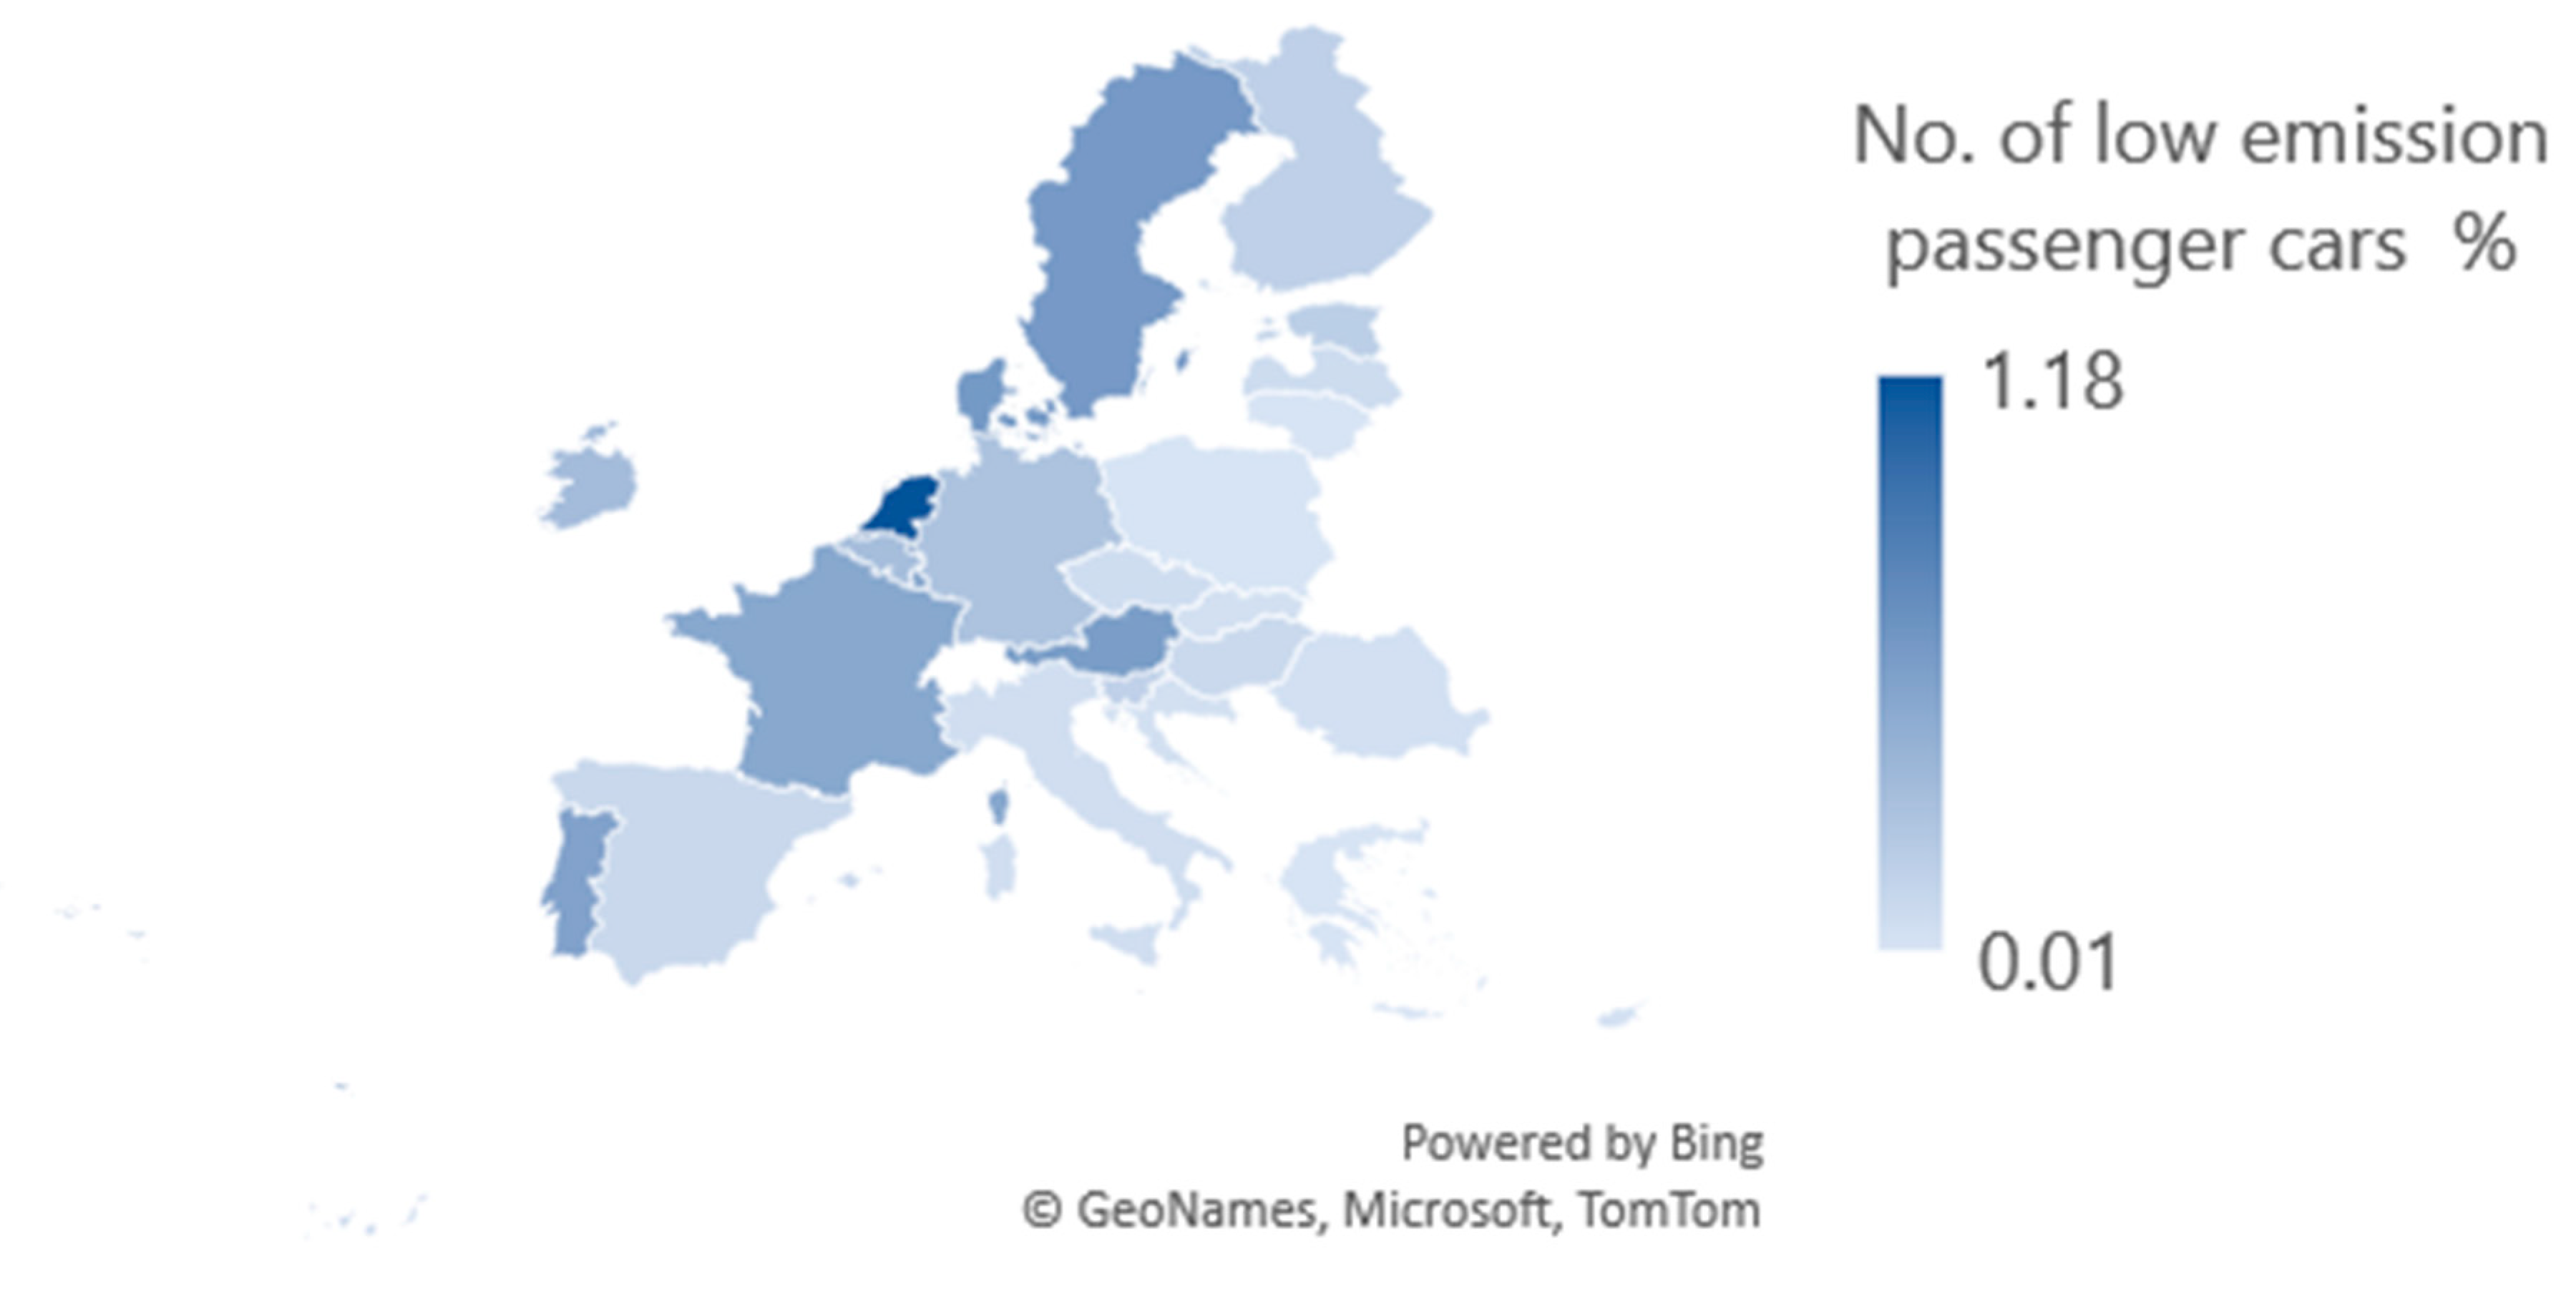
A 2021 study shows that only electric and hydrogen fuel can help in achieving the goals of the Paris Agreement [
27]. As the above figure illustrates (
Figure 4), hydrogen used as a fuel for passenger cars emits only 1.2 g CO
22/km, and BEVs have 0 gCO
22/km emissions. Hydrogen cars use H
2 to generate electricity, the main advantage being that they are easily refuelled at filling stations in 3–5 m and they have a good driving range [
26]. Many studies show that using electricity to power BEVs has the lowest climate impact. The Netherlands has the highest rate of BEVs (1.2%), followed by Austria, Denmark, and Sweden (0.6%) [
17]. A study from 2018 indicates that GHG emissions are reduced by 50–60%, on average, when using BEVs compared with internal combustion engines [
28]. The collected data show that cars that use hydrogen and electricity as fuel are more common in the Netherlands, Sweden, Denmark, and Luxembourg.
To decrease the CO
2 emissions, which are the main component of GHGs, the policy makers in the EU use almost 700 measures to address road transport emissions [
11], and to decrease the demand for polluting cars and promote the use and production of more energy-efficient vehicles [
16,
29,
30]. They use “push” or “pull” strategies, [
31,
32]. The first type of strategy addresses the car manufacturers and fuel suppliers, and the second (pull strategies) applies to the demand side [
11]. EU and national policies related to taxes (on fuel, vehicles, emissions) can decrease the demand for polluting cars and aim to promote the production of more fuel-efficient vehicles. Besides EU and national strategies for low-emission mobility, policy makers must consider the behavioural factors of buyers. Through economic incentives, buyers are motivated only for the period during which they have benefits; afterwards, they will return to their old buying habits [
33,
34,
35]. Another study demonstrates that besides financial help, it is necessary to have a certain level of self-sustainability [
36].
2.2. Cultural Factors Influencing Passenger-Car-Buying Behaviour
Buying behaviour is influenced by cultural, social, personal, and psychological factors [
37]. A large body of literature focuses on the personal, social, and psychological factors that influence passenger-car-buying behaviour when choosing the fuel type of the car, but only a few focus on the cultural characteristics of buyers.
Reviewing the literature, we find many diverse definitions of culture. In 1952, Kroeber and Kluckhohn listed 160 definitions [
38]. Some authors explain culture through empirical studies, while others use more generic formulations [
39]. Kotler and Armstrong explain culture as a cumulus of fundamental values, perceptions, wishes, and learned behaviours, which are different from one society to another [
8]. Moreover, they consider culture as the most profound cause that influences consumer behaviour [
37].
One of the most cited authors, Schwartz, sees culture as a “complex of meanings, beliefs, practices, symbols, norms, and values prevalent among people in a society” [
40]. The model developed by the author introduces seven dimensions that can predict consumer behaviour: intellectual autonomy; affective autonomy; embedded cultures; cultural egalitarianism; cultural hierarchy; harmony; mastery [
40].
Hofstede defines culture as a collective “programming of the mind” phenomenon [
41,
42]. He explains that culture represents a set of elements, such as beliefs, attitudes, collective activities, role models, and the language common to a particular group [
43]. By repeated empirical research, Hofstede created one of the most comprehensive models with which we can characterize national cultures. His model provides a scale from 0 to 100 for all the dimensions, by country [
42].
Hofstede’s six cultural dimensions are as follows: the power distance index (PDI); individualism versus collectivism (IDV); masculinity versus femininity (MAS); the uncertainty avoidance index (UAI); long-term orientation versus short-term normative orientation (LTO); indulgence versus restraint (IND).
The model has been used in various sectors and for various perspectives; for example, for the prediction of proenvironmental behaviour in hospitality and tourism [
44], changing the organisational culture to increase innovation and productivity [
45], understanding the perceived risks related to self-driving cars [
46], etc.
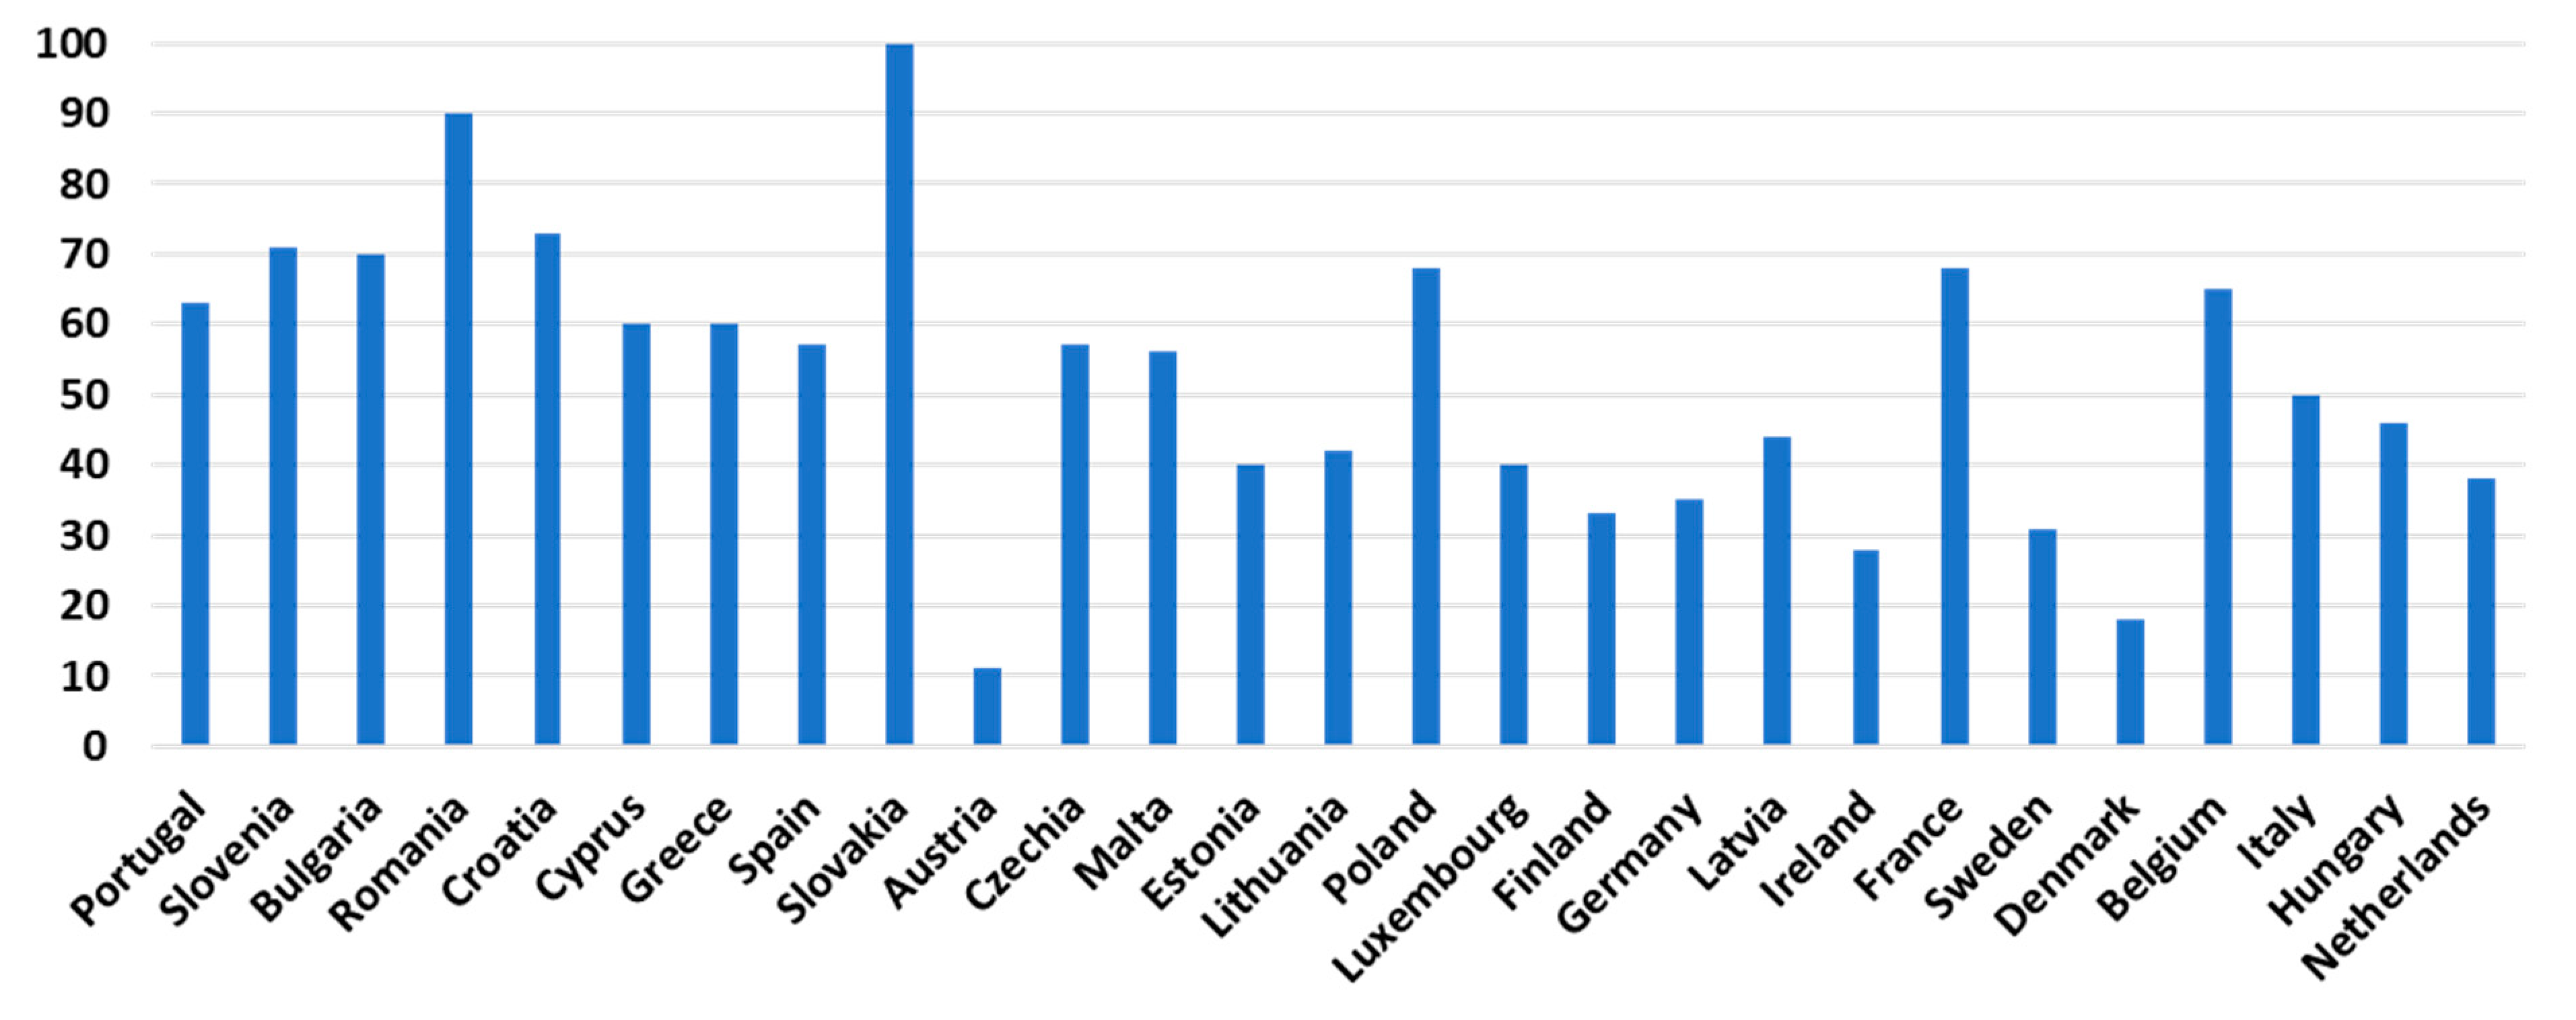
The PDI reflects the acceptance of the power distribution in a society. When a country has a score close to 100, the less powerful members will more easily accept the hierarchy and inequalities [
47,
48]. In countries with high PDIs (
Figure 5), luxury articles, fashion items [
49], and expensive cars [
50] are used to make one’s status clear.
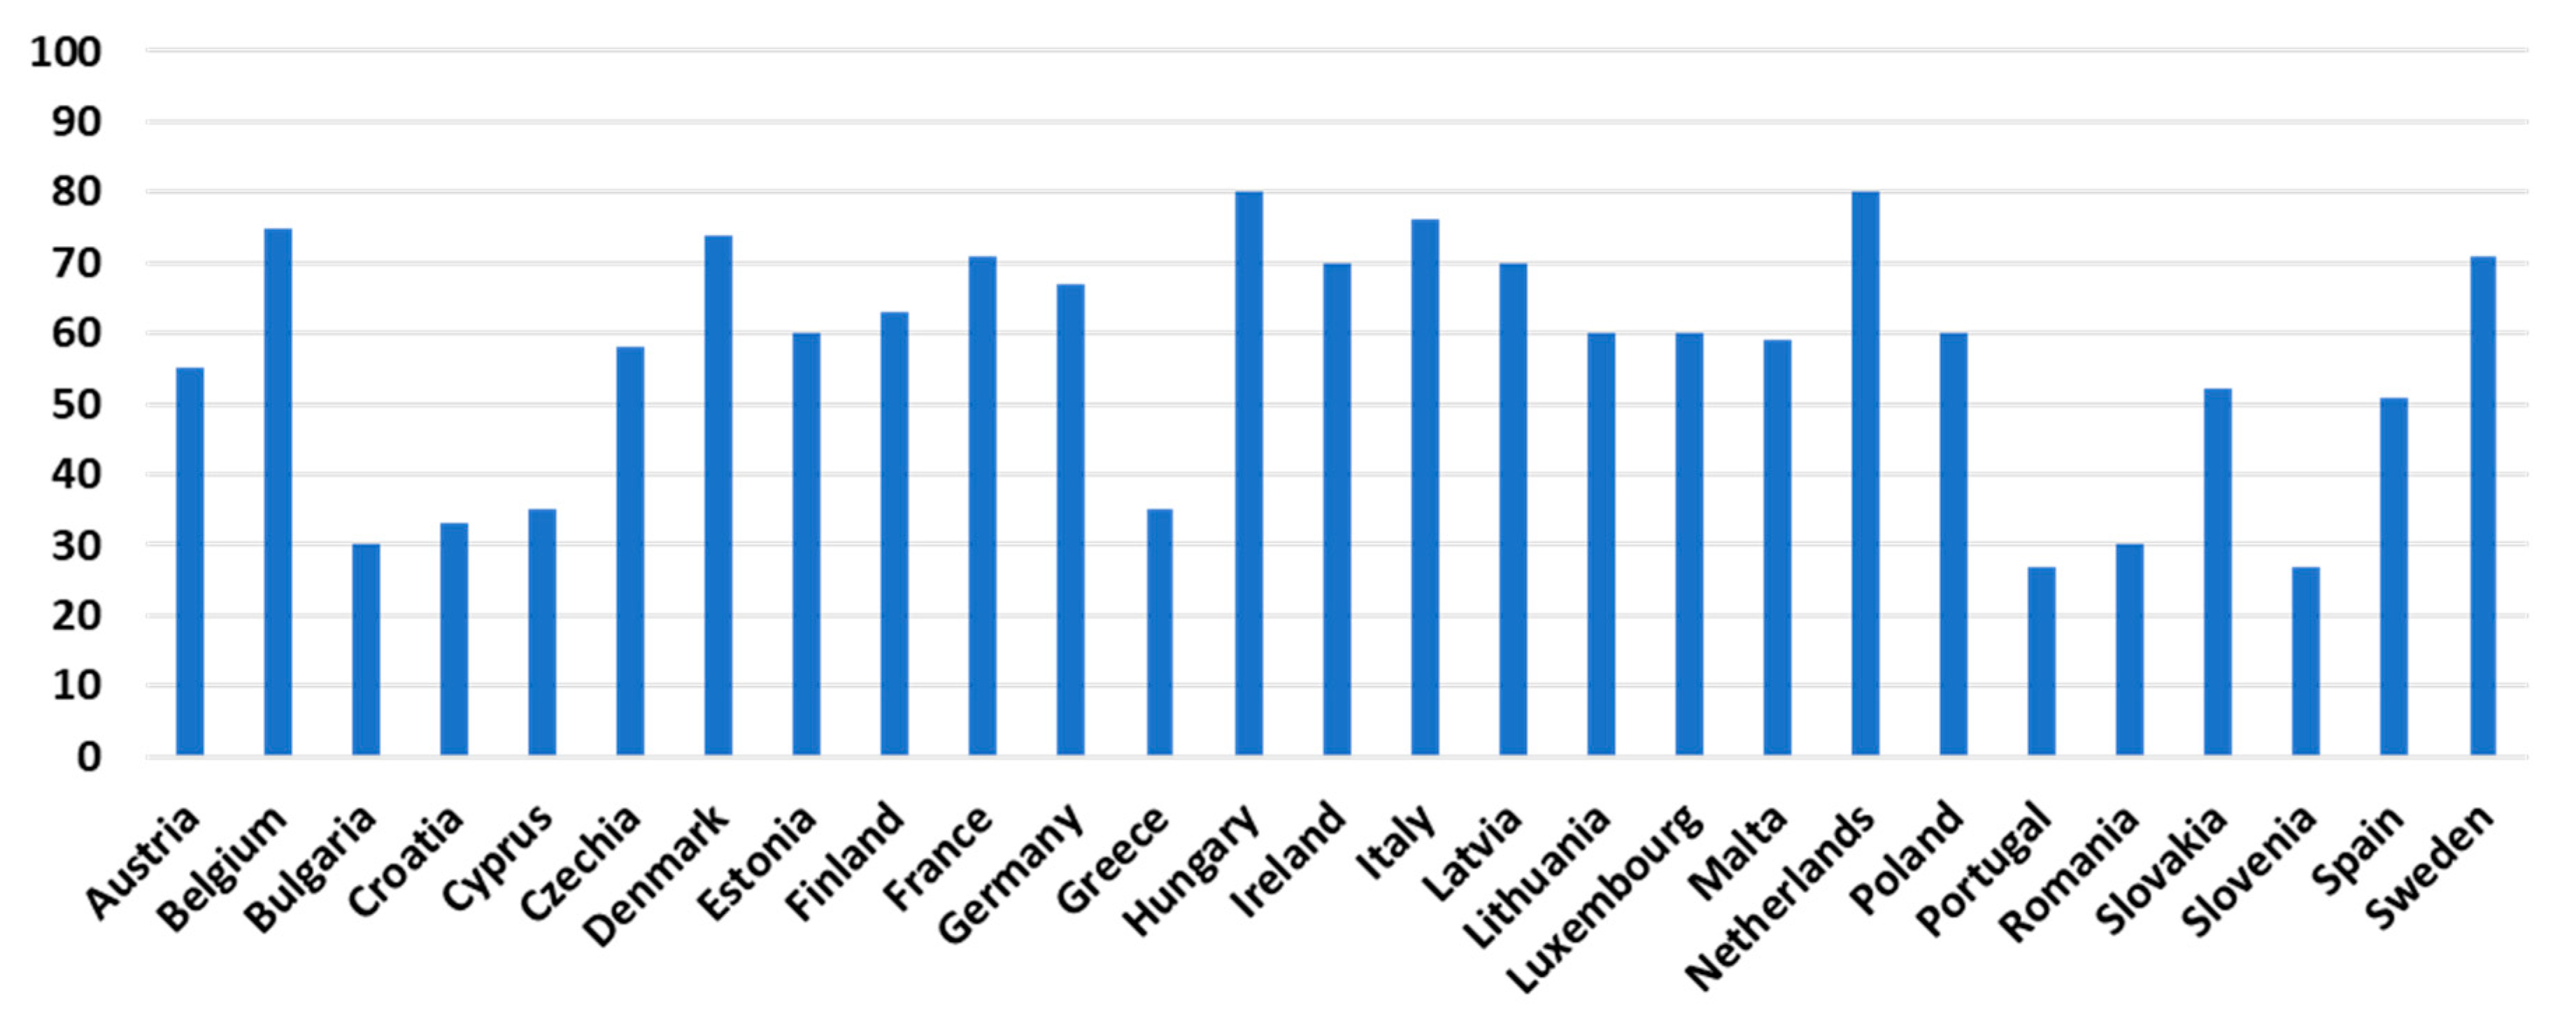
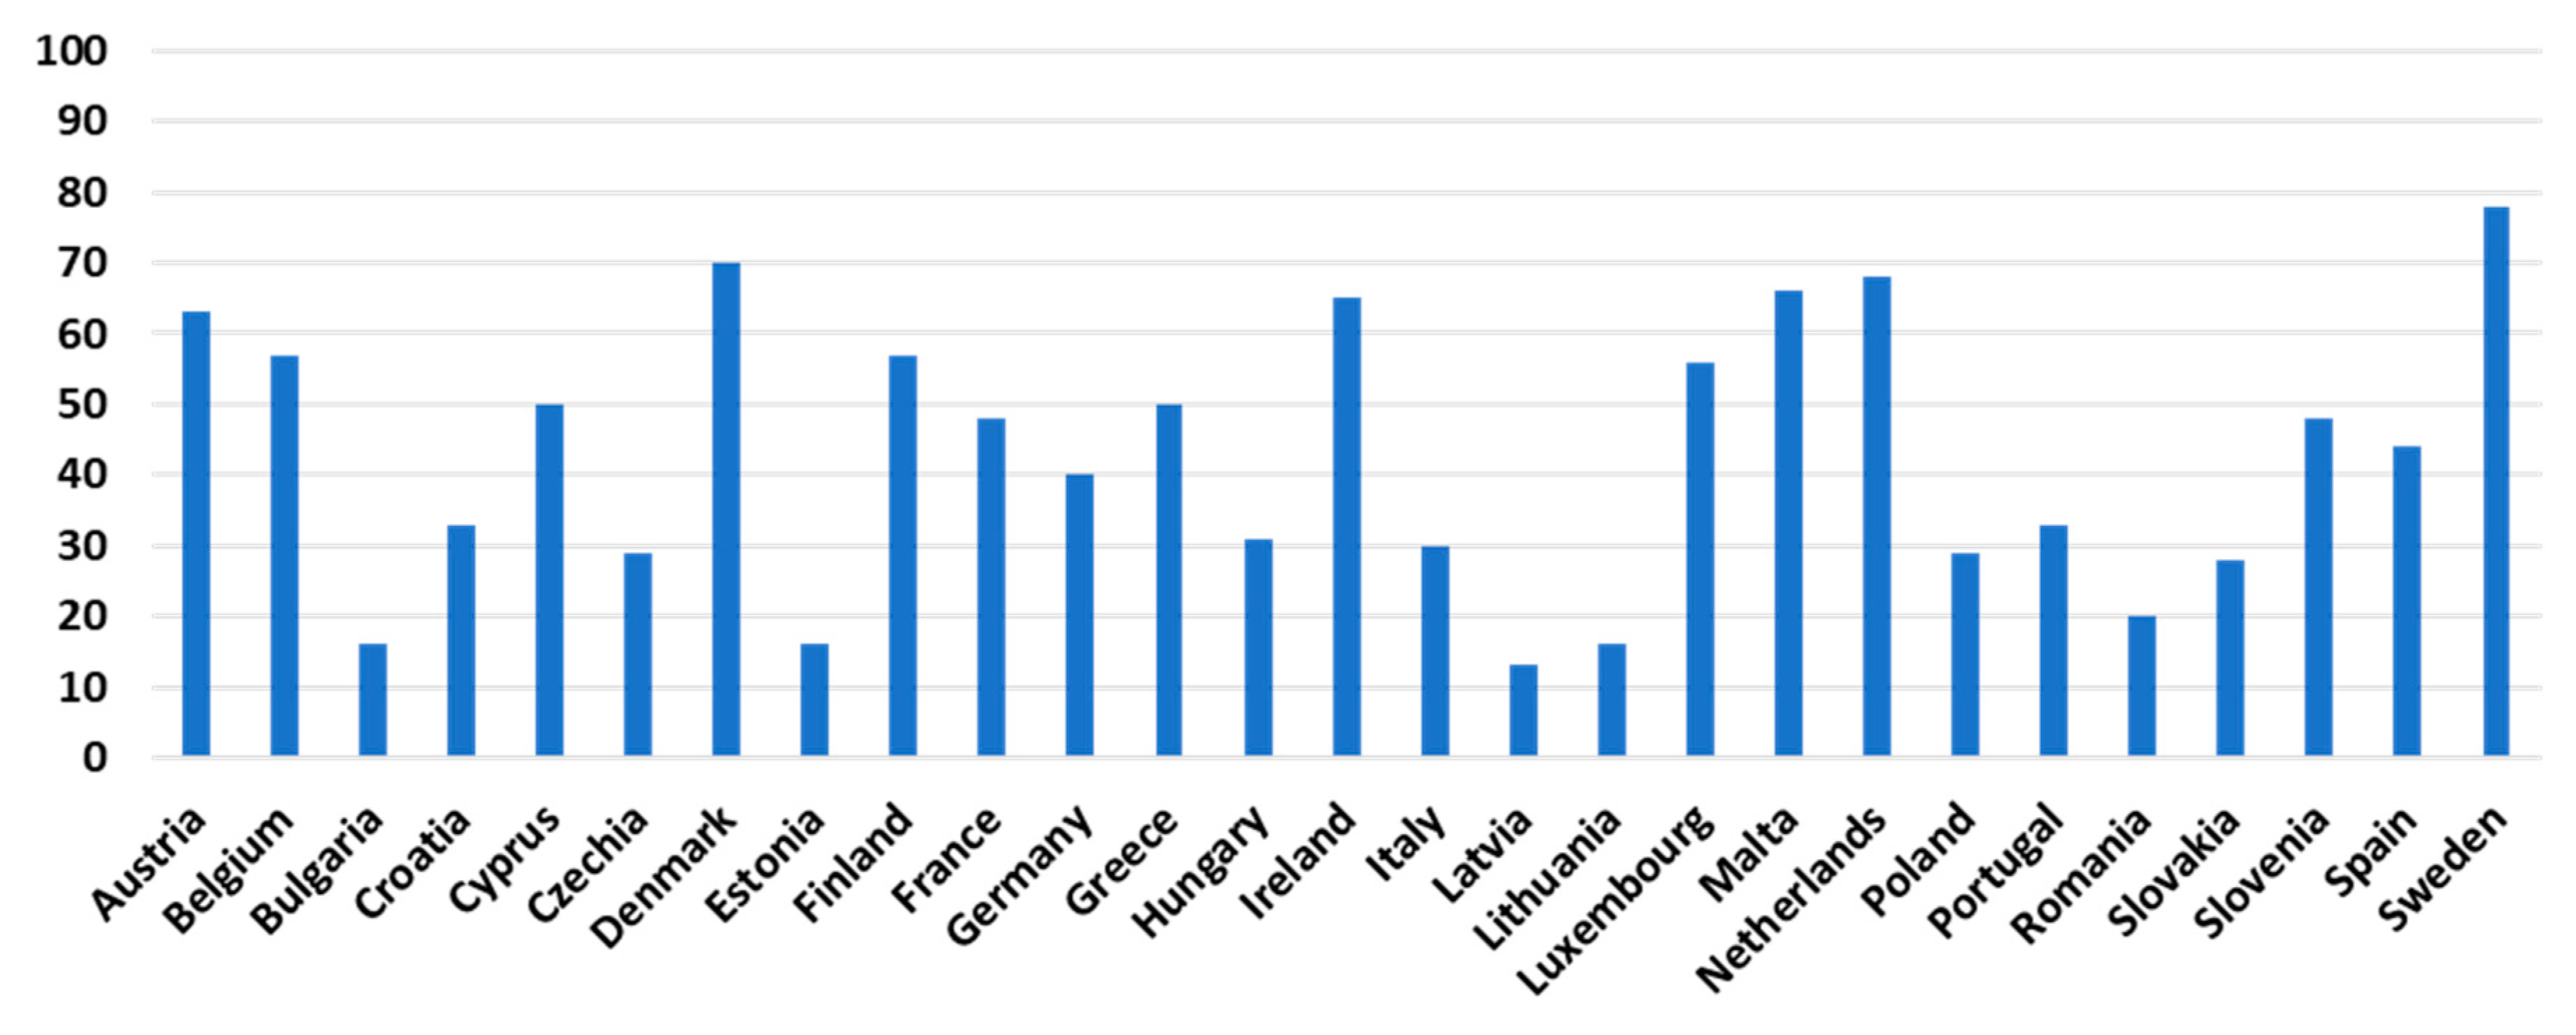
In individualist cultures (
Figure 6), people look after themselves and immediate family, and they are striving for identity [
47]. Furthermore, they use explicit communication, contrary to collectivist cultures. The countries that score low in this dimension consider that to sell something, first you must create trust [
49]. In collective cultures, people are more inclined to develop a pro-environmental attitude, being ready to pay more for the wellbeing of all society [
51]. A study conducted in Germany, Mexico, and Spain shows that a higher level of collectivism develops stronger eco-friendly behaviours, and stronger intentions to adopt renewable energy technologies [
52]. The preferred advertisements in collectivist countries are focussed on the idea of team, collaboration, and the victory of the community [
53].
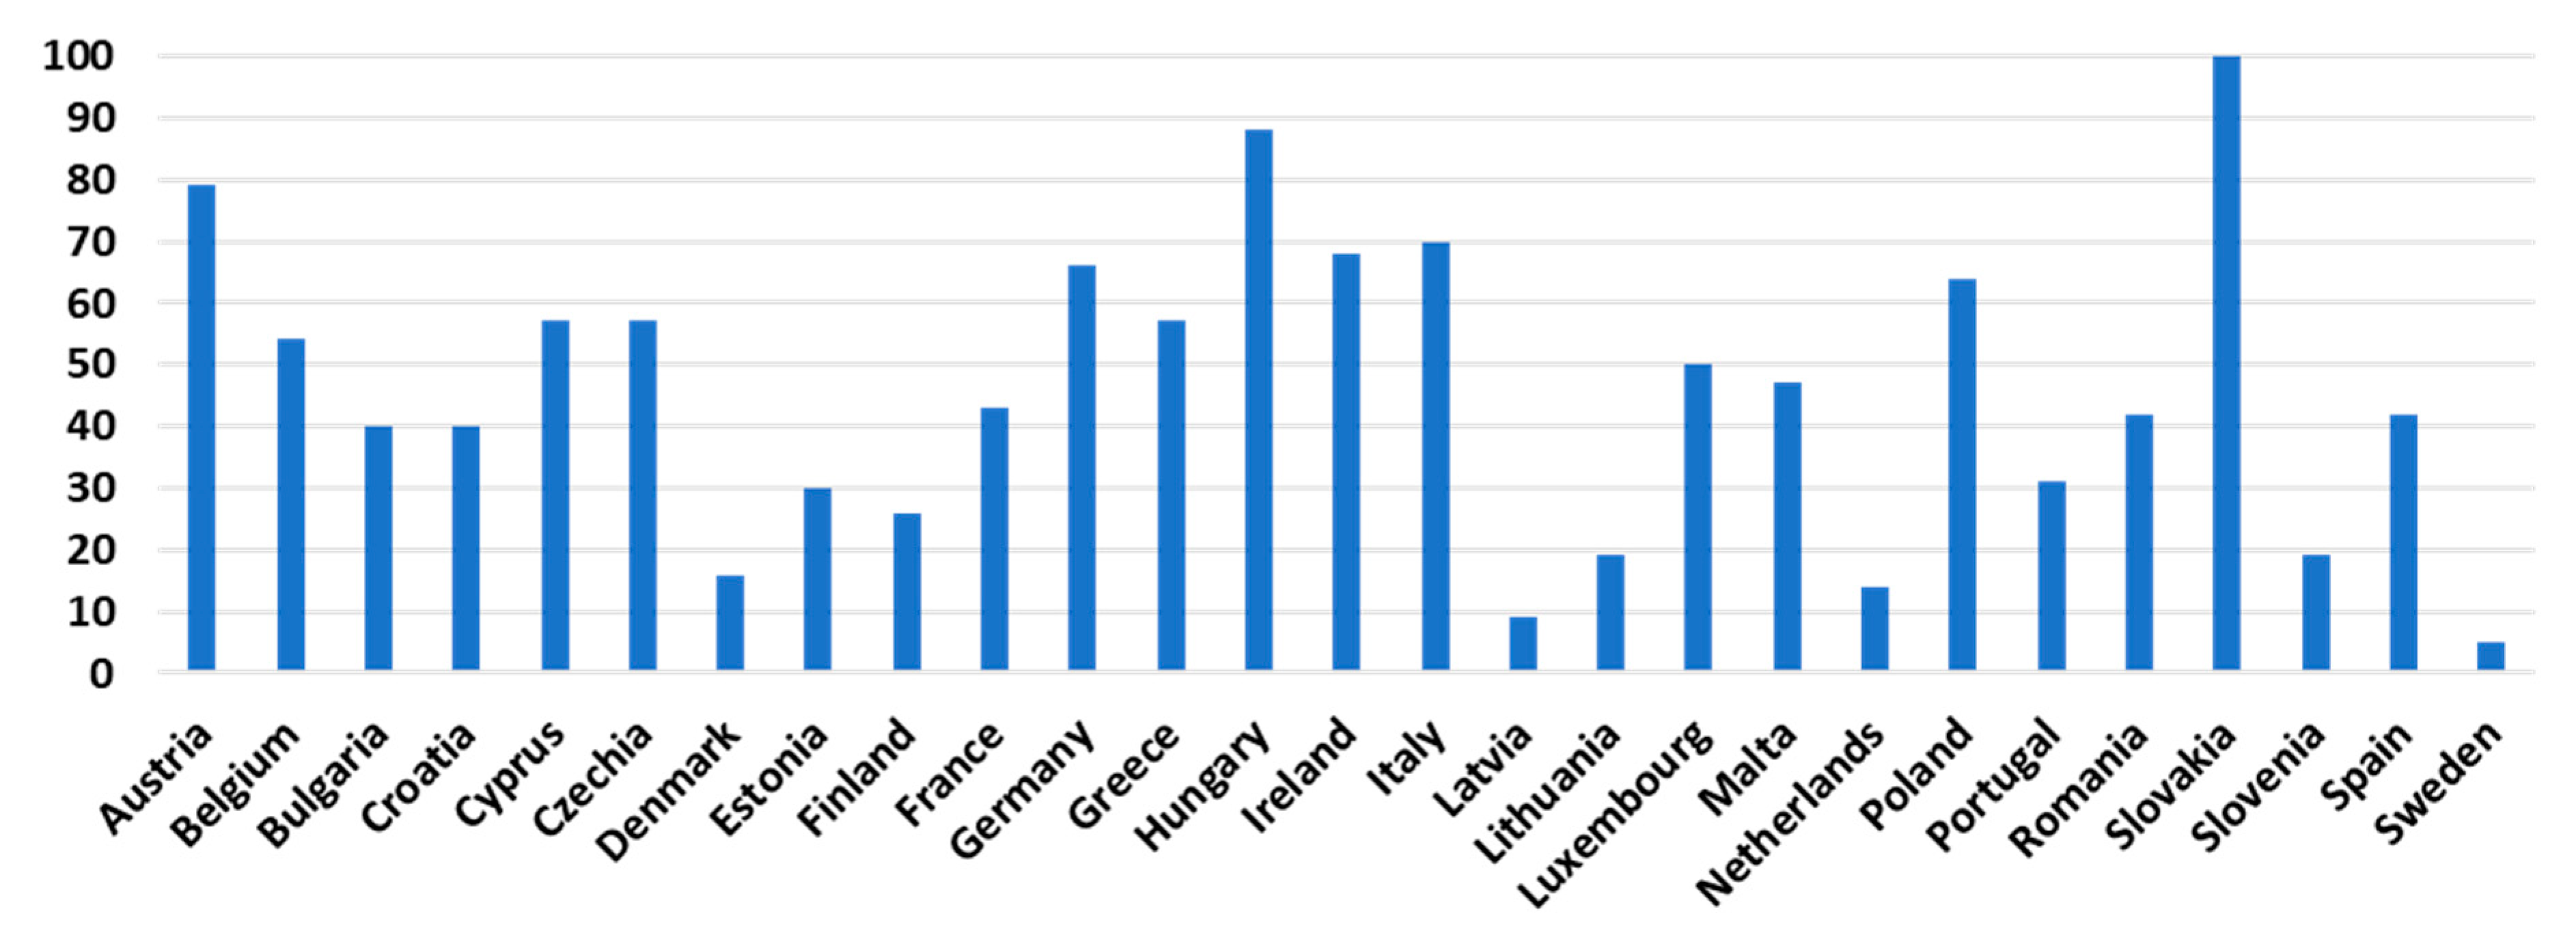
If in a masculine society (
Figure 7), the main drivers are achievement and success, in a feminine society, the values are caring for others and a good life quality [
49]. The same study shows that dimension plays an important role: big in the masculine dominated societies and small in the feminine ones. The advertising in countries dominated by masculine values is focused on success (by showing luxury brands) [
49], competitiveness, dreams, expectations, and nonfictional elements [
54].
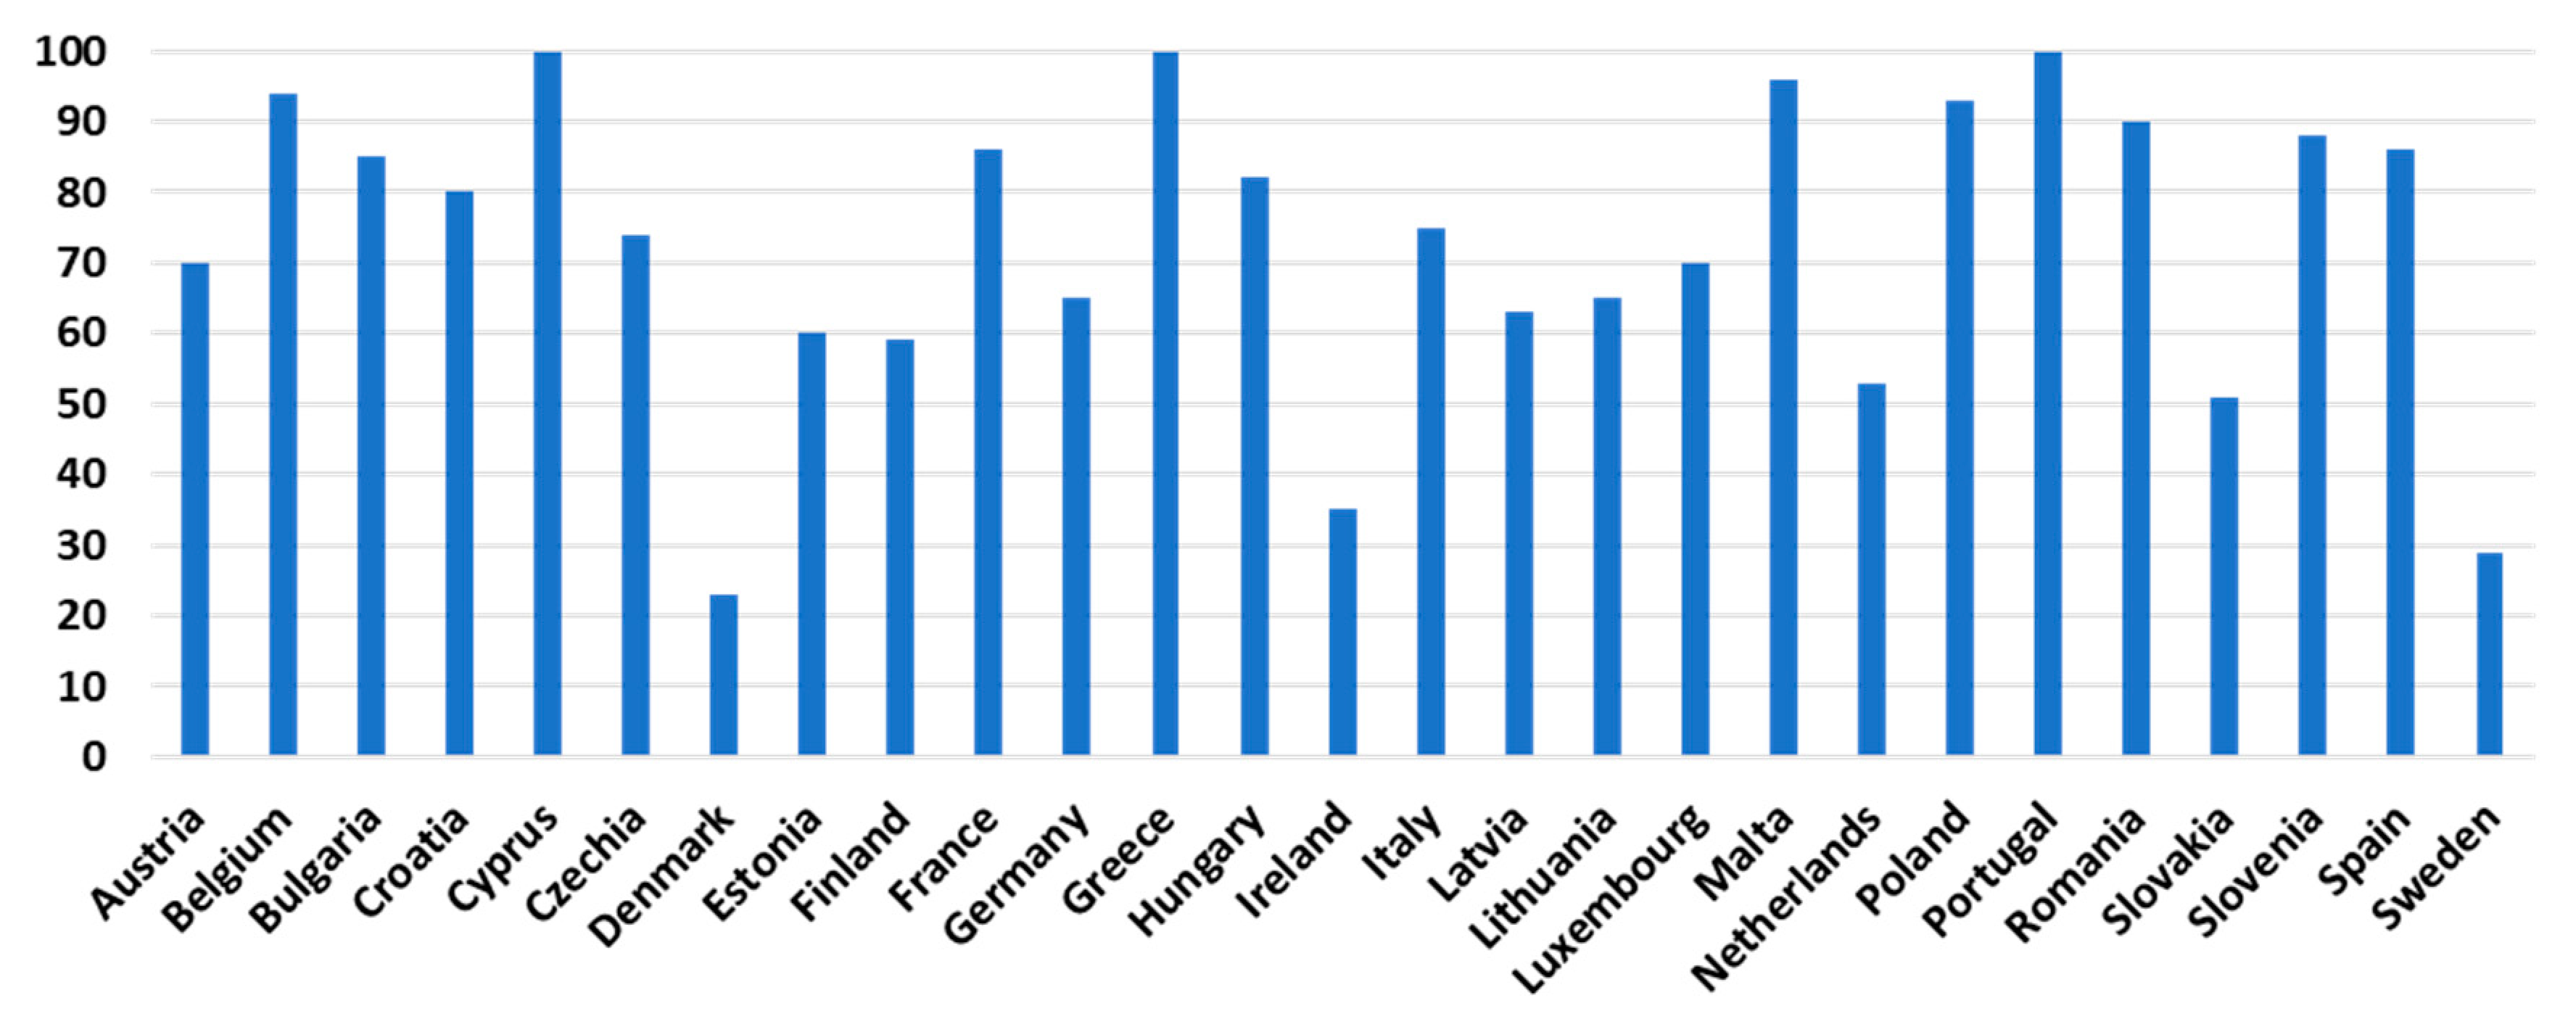
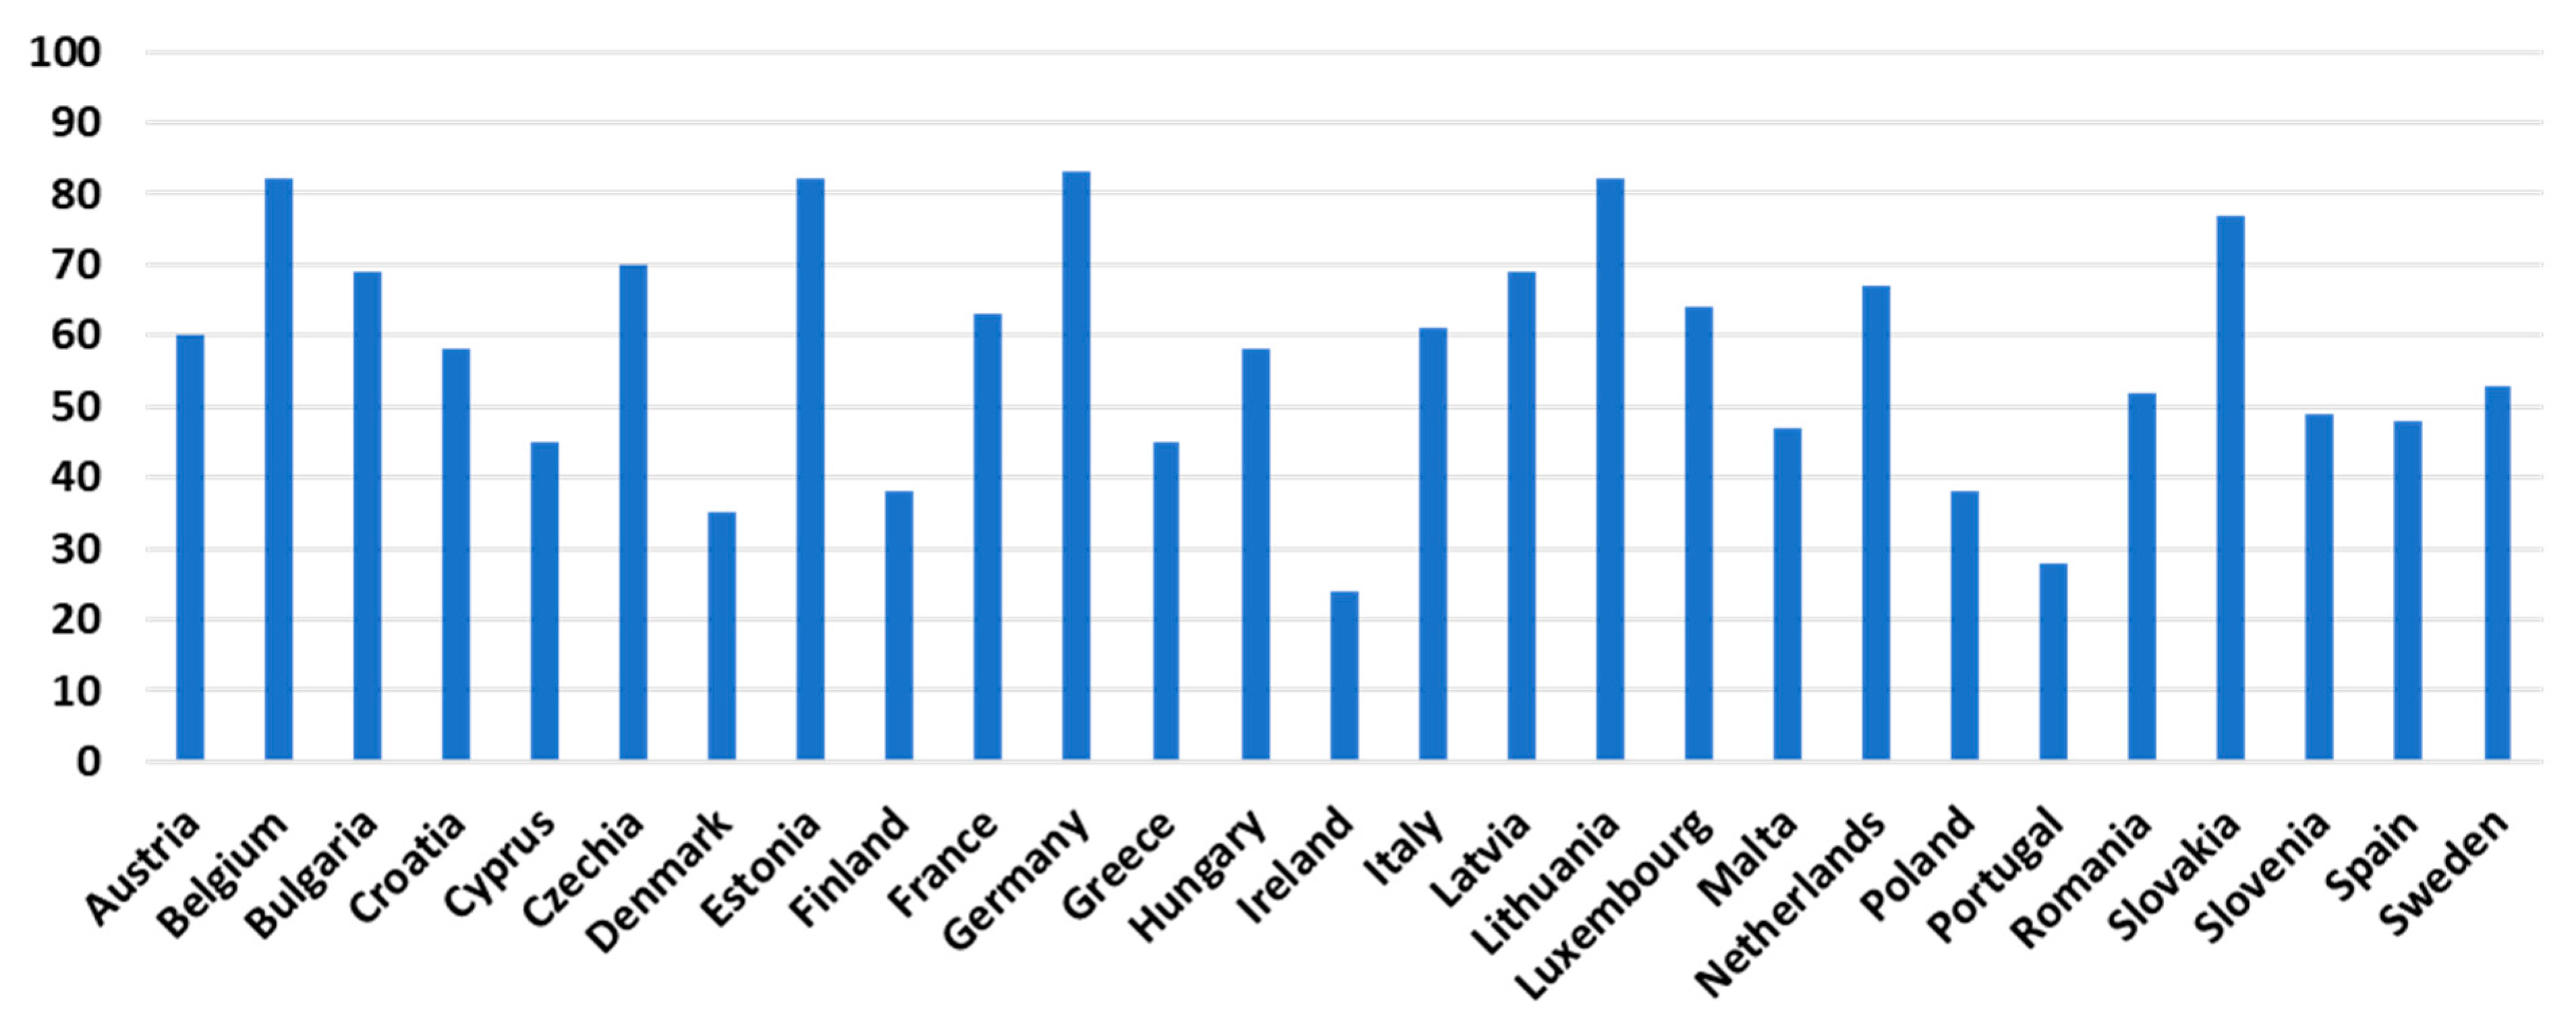
The UAI refers to the ways in which the individuals in a society relate to uncertainty and ambiguity [
54]. In cultures with high scores for this dimension (
Figure 8), the individuals are more resistant to accepting new technologies and innovation [
55], the conflicts are threatening, individuals have an aggressive driving style [
54], and advertisements are structured and serious with a great deal of technical information [
56].
When a society is driven by elements such as perseverance [
49], pragmatism, and a focus on the future [
48], it scores high in the LTO dimension (
Figure 9). Moreover, LTO corelates with pro-environmental behaviours [
57].
The last dimension, IND, was introduced in 2010, and it describes the inclination of a society to enjoy life in opposition to the ones that suppress gratification [
58]. Usually, people living in restraint societies with low IND indexes (
Figure 10) tend to be more cynical and pessimist [
59]. This is the least studied dimension in the literature.
The Hofstede model is debated by some authors because heterogenous groups can live within a state, but we must consider that sharing the same education system, healthcare system, legal system, and institutions makes them share a common goal over a long period [
43], and if it is required, Hofstede’s model could be applied to smaller communities as well. Many articles demonstrate the relevance of this model for cross-cultural studies in marketing, psychology, sociology, or management [
60], as it is the best way to measure national cultures [
61]. The arguments that support the choice of using Hofstede’s cultural dimensions in the present paper are described next. Hofstede’s cultural dimensions have been used for a long time (since 1970) and have an extensive empirical base from all over the world. His research was conducted in the 1970s, and it has been expanded and validated over time, with his dimensions being used in numerous studies across different countries and cultures. Hofstede’s dimensions are recognized and used in the business world so that companies can tailor their marketing strategies to different cultures [
62].
McLeay et al. recommend that future studies on eco-friendly consumption should consider cultural contexts [
63]. Barbarossa et al. compared the EV adoption intentions among consumers in Denmark, Belgium, and Italy using Hofstede’s cultural dimensions to explain cross-national differences [
33]. According to the results, public policy and social marketing campaigns should give greater consideration to the impact of cultural values when promoting environmentally sustainable technologies. It is important to note that promotional efforts should vary based on the specific cultural elements and the level of innovation of the products being promoted [
63].


 ,
, 


