Article

Impact of Financial Inclusion, Globalization, Renewable Energy, ICT, and Economic Growth on CO2 Emission in OBOR Countries

by
Raymondo Sandra Marcelline Tsimisaraka
1,
Li Xiang
1,*,
Andriandafiarisoa Ralison Ny Avotra Andrianarivo
2,
Eric Zonia Josoa
3,
Noheed Khan
4,5,*,
Muhammad Shehzad Hanif
6,7,
Aitzaz Khurshid
6 and
Ricardo Limongi
5
1
Business School, Huanggang Normal University, Huanggang 438000, China
2
Business School, Zhejiang Wanli University, Ningbo 315104, China
3
Public Administration Department, Ecole Normal D’Administration, Antananarivo 101, Madagascar
4
Department of Management Sciences, Alhamd Islamic University, Islamabad 44000, Pakistan
5
Faculty of Business Administration, Accountability and Economics, Federal University of Goias, Goiânia 74690-900, Brazil
6
UCP Business School, University of Central Punjab, Lahore 54590, Pakistan
7
Center for Post Graduate Studies, Infrastructure University Kuala Lumpur, Kajang 43000, Malaysia
*
Authors to whom correspondence should be addressed.
Sustainability 2023, 15(8), 6534; https://doi.org/10.3390/su15086534
Submission received: 17 December 2022 / Revised: 9 March 2023 / Accepted: 27 March 2023 / Published: 12 April 2023

Abstract

:
This study examines the short-term and long-term effects of various important determinants such as financial inclusion (FI), information and communication technology (ICT), renewable energy (RE), globalization (GOB), and economic growth (EG) on CO2 emissions in the top 10 emitter countries in the OBOR region based on the collected data for the years 2004 to 2019. This study employed the CS-ARDL technique. Findings demonstrate a strong relationship between FI, ICT, and CO2 emissions in both the long-term and short-term. Renewable sources of energy have been found to have a CO2 emission reduction effect, both in the long and short term. In the long run, there is a negative connection between globalization and CO2 emissions; however, in the short run, this connection is inconsequential, while economic growth (EG) has a positive association with CO2 emission. The development of ICT infrastructure carries the potential to directly mitigate the detrimental effects of CO2 emissions while also playing an important role in raising people’s environmental consciousness. OBOR countries should welcome and encourage clean and green foreign investment that provides technical skills, environmental technology development, and carbon-free processes.

1. Introduction

Climate change and global warming pose great danger to the long-term viability of life on the planet Earth. Rising global warming and the resulting destruction in worldwide populations may be traced back to greenhouse gas emissions, more specifically to emissions of carbon dioxide [CO2] [1]. In response to this perilous scenario, world leaders convened at UNCOP21 and resolved to take comprehensive actions under the sustainable development goals (SDGs) required by the 70th session of the United Nations General Assembly. The goal of these actions is to reduce carbon dioxide emissions caused by the exponential integrations of energy needs, the polluting environment, and the expansion of global economic development [2], but doing so will require first establishing a thorough familiarity with the factors that have an impact in each geographical area and the dynamics that will be required to be effective [3].
Scholars have carefully studied all variables that directly or indirectly preserve environmental protection. For instance, ref. [4] observed that deteriorating environmental prominence threatens human existence due to GDP, economic decentralization, globalization, innovation, and technology. Fuel-efficient technology might reduce global carbon emissions [5]. Eco-friendly goods and techniques, infrastructure modernization, capturing and conserving carbon, electricity production, sustainable power, and eco-friendly grid operations and power conservation have major environmental impacts [6]. Another school of research has examined aspects including industrial production, technical progress, natural resources, and human resources [7], whereas the latest research has proven the importance of financial growth and monetary inclusion [8] (see for example [8] or [9]).
Technological advances have spread worldwide in the 21st century. Global and regional collaboration and coordination efforts are overlapping geographical boundaries, offering a glimpse of win–win commerce, prosperity, and coordination. The rise of global temperature and worsening climate conditions affect even the developing nations despite their negligible share of these industrial waste productions [3]; however, technological influences and green energy usage can ultimately reduce CO2 emissions creating hope for things to improve. Scholars want to know how these contributing factors impact both developed and developing nations in various areas in the short and long term [10]. One belt one road (OBOR) is a potential worldwide regional cooperation and coordination initiative. Globalization, economic growth, financial inclusion, renewable energy, and technological advances in communication and information affect short-term and long-term CO2 emissions for the top 10 CO2 emitters under the One Belt One Road consortia. The One Belt, One Road (OBOR) initiative, launched by China in 2013, is the largest major initiative by a single country and can dramatically impact global markets and development. The proposed project includes over two-thirds of the world’s population, one-third of the global GDP, and 25% of worldwide commerce. It has two primary parts: The Belt, or new Silk Road, is a land-based initiative including ports, shipping lanes, and marine development linking China’s east coast to south Asia and Europe across the Indian Ocean. Ports, trade channels, and marine infrastructure link Inner China to Europe via Central Asia and the Middle East [11].
The OBOR project, which also originally implicated a direct engagement from the 65 countries in Europe, Asia (including regions such as East Asia, Southeast Asia, Central Asia, and South Asia), and the MENA region, has broad economic objectives to accomplish including integrated and liberalized trade throughout the areas, infrastructural development and unification, and effective resource utilization. This belt and road regime is predicted to grow beyond 65% of the worldwide population and a predicted investment of USD 6 trillion, which represents more than 34% of the global GDP [12].
Given the increasing relevance of multidimensional issues for regional commerce and collaboration from regional communities throughout the globe, researchers are studying regional organizations such as One Belt One Road [13]. Since most of these nations are transitioning, massive infrastructure initiatives and international investment in energy and related businesses are harming the environment [14]. Most OBOR countries’ non-renewable energy usage is rising rapidly, causing massive greenhouse gas emissions. China’s massive investments may lead to environmental damage due to the OBOR nations’ lack of green funding or other methods. OBOR will provide for 60% of global infrastructure expenses and more than half of greenhouse gas emissions in the next decades [11]. Furthermore, many current researchers have analyzed regional communities from the viewpoint of environmental issues and how different features of these cooperative structures may influence the global environmental condition in the OBOR nations [15]. Institutional quality, human resources, capital formation, financial globalization, trade flexibility, economic expansion, energy usage, energy efficiency, and renewable sources are some of the relevant dimensions being studied from the perspective of OBOR nations [11]. This research examines how globalization (GOB), economic growth (EG), renewable energy (RE), financial inclusion (FI), and information and communication technology (ICT) affect CO2 emissions from the top 10 OBOR consortium emitters. This research addresses the following main research questions.
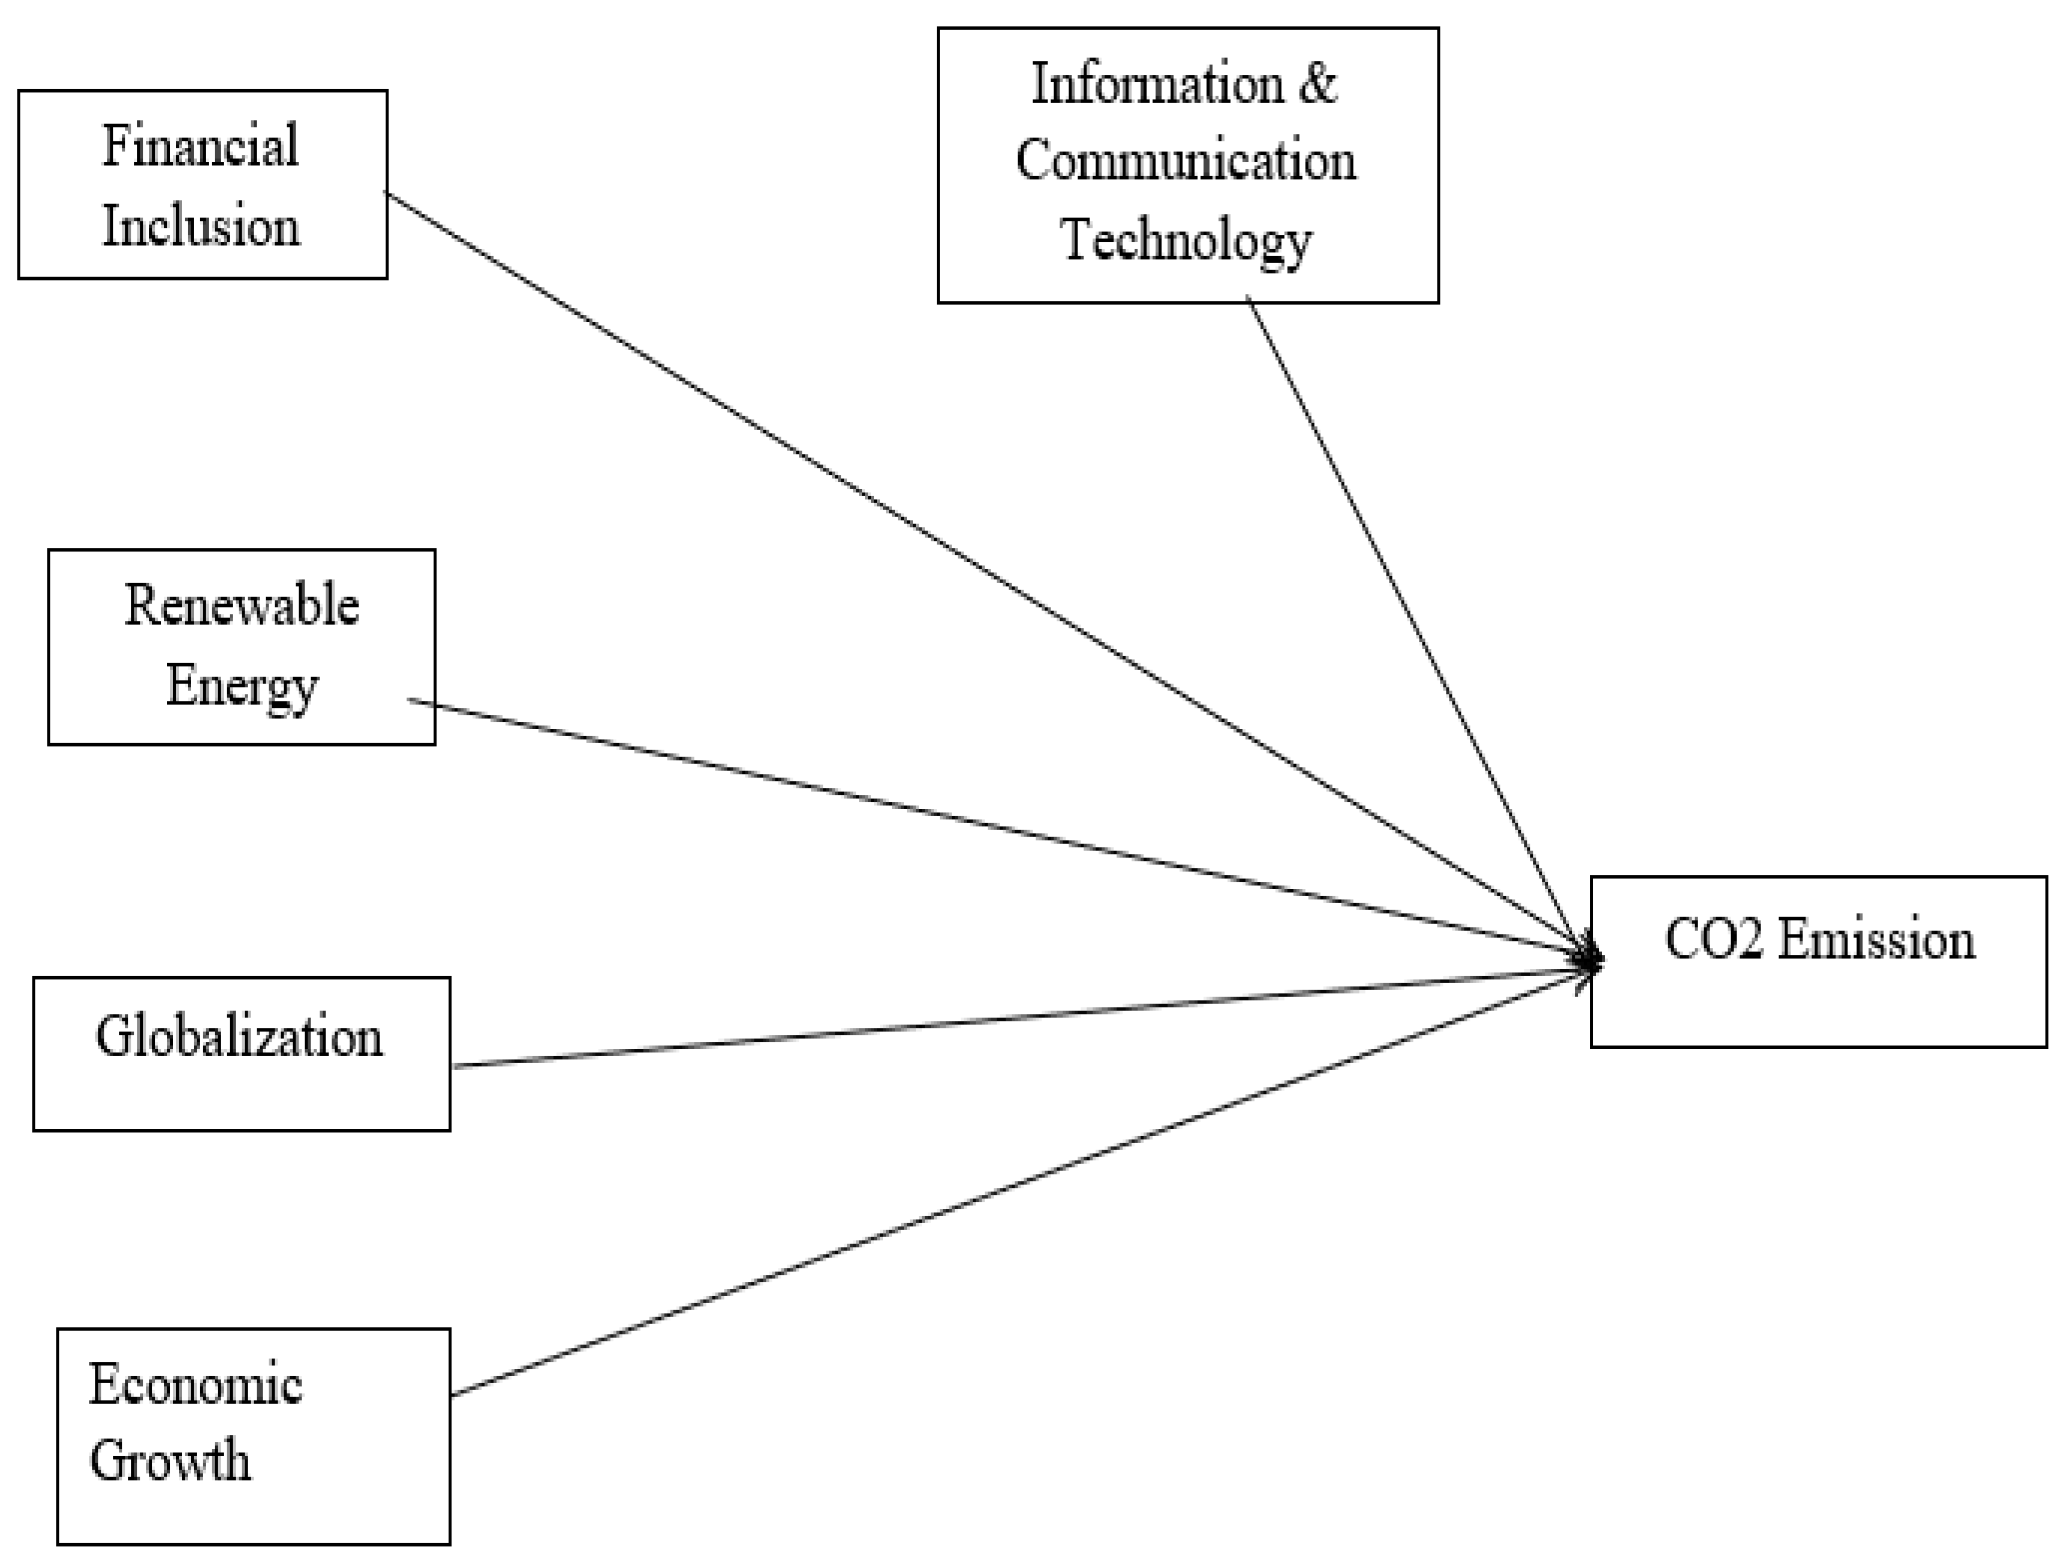
  • How do the five main factors, including financial inclusion, globalization, renewable energy, ICT, and economic growth, create short-term and long-term effects on the CO2 emissions for the top 10 emitter countries in the OBOR region?
  • How does the renewable energies factor influence the emissions for the top 10 emitter countries in the OBOR region?
This work is innovative in several dimensions. Firstly, the extant literature has extensively focused on the top 10 emitter countries across the globe; however, given the changing regional dynamics and upcoming transformational trade and infrastructural developments, not many studies have covered the impact of the top 10 emitter countries in the OBOR region. This research attempts to fill this void in the literature by investigating the influence of various drivers on CO2 emissions over 15 years i.e., from 2004 to 2019. Secondly, this study makes use of the cross-sectional dependence approach for the assessment of cross-sectional dependence in the data. In doing so, the cross-sectional dependence was employed [16,17] along with Im, Pesaran, and CIPS testing methods, in addition to the Westerlund panel cointegration approach. Further, the CS-ARDL method was employed to confirm the robustness check of our results. According to the CS-ARDL study, financial inclusion (FI) has a positive long-term and short-term relationship with CO2 emissions in the top 10 OBOR countries. Furthermore, ICT has a long-term and short-term positive relationship with CO2 emissions. Globalization has a long-term negative relationship with CO2 emissions, but it is insignificant in the short run. Long-term economic growth is associated with lower CO2 emissions. Our findings establish useful implications for the theorists and practitioners interested in policymaking and practices for environmental protection and conservation in the light of the United Nations’ sustainable development goals.
This study continues with an overview of the literature and the research framework for this research in Section 2. Section 3 covers the methodology. Section 4 includes the discussion about the results. Section 5 ends with a conclusion and policy recommendations.

2. Literature Review

The present research attempts to evaluate the role of various contributor factors on the environment in terms of CO2 emissions for the top 10 emitter countries in the OBOR region. For the factors responsible, the framework presented in Figure 1 will present the details of the independent and dependent variables of this study.
In this section, prior work in the areas of financial inclusion, renewable energy, globalization, economic growth, information and communication technology, and carbon emissions are critically evaluated. This section will help us fully comprehend how each of the mentioned factors contributes to CO2 emissions. The literature on each topic is reviewed in the following paragraphs, starting with the illustration of recent facts related to CO2 emission.

2.1. CO2 Emission

Emissions of CO2, which make up the majority of greenhouse gases, significantly contribute to global warming leading to catastrophic impacts on life on the planet. CO2 emissions have increased by 31.79% between the period of 2003 and 2018 and account for 72% of emitted greenhouse gases [18,19], forcing many nations to set reduction targets for carbon emissions.
The relative share of carbon emissions is 3.6% for South and Central America, 3.8% for the African region, 6.2% for the Middle Eastern countries, 6.3% for the Commonwealth of Independent States, 11.2% for the European countries, 16.5% for the North American region, and 52.3% for the Asia Pacific region. During the last decade, South and North American countries and European nations were able to reduce emissions by 1.2, 0.1, and 1.9% respectively due to their effective strategies [20].
Several attempts have been made to identify the major determinants of carbon emissions. Initial work associated numerous energy usage/consumption-related measures with carbon emissions; various measures of economic and financial activity were then linked, and in recent literature we find the role of renewable energy, globalization, and ICT to be the more prominent causes of carbon emissions. Carbon emissions have been measured as consumption-based carbon emissions and territory-based carbon emissions [21] and are normally measured in Kilotons [22]. We have combined both measures to ensure a comprehensive measure of carbon emissions.
After extensively reviewing the literature, we have tried to combine the most prominent causes of carbon emissions in a single study that includes financial inclusion, renewable energy, globalization, and economic growth. Additionally, a graph is provided in Figure 2 to help understand the CO2 emissions in the top 10 OBOR nations. It shows that the Czech Republic had the greatest CO2 emissions at the beginning of the examination period and that they then began to decline. The trend is consistent in Luxembourg.

2.2. Financial Inclusion

One of the credible definitions of financial inclusion states “financial inclusion means that individuals and businesses have access to useful and affordable financial products and services that meet their needs–transactions, payments, savings, credit, and insurance–delivered in a responsible and sustainable way” [8]. Financial inclusion represents the economic stability of a country; however, high economic activity leads to high energy consumption which negatively affects the environmental quality through the emission of carbon dioxide.
Before the introduction of financial inclusion and carbon emissions, financial stability or financial instability has been studied with carbon emissions or with environmental quality [23,24,25,26,27]. Financial inclusion is a more appropriate measure as compared to financial stability since financial inclusion is achieved after financial stability and it is an overarching concept that truly reflects the financial health of a country’s businesses and individuals by measuring the ratio or percentage of the population having access to financial products/services [9,28].
Within the limited literature available, we see mixed results of financial inclusion and carbon emissions. Some studies claim that financial inclusion decreases carbon emissions [29]; however, from the data collection of 31 countries by Le [30] financial inclusion came out to be the most important contributor of carbon emissions as compared to the other four contributing factors. These findings strongly suggest probing the relationship between financial inclusion and carbon emissions. Financial inclusion has been previously measured in terms of bank accounts per 1000 adults [31,32], percentage of bank credit to bank deposits [32], percentage of life insurance premium volume to GDP [33], and percentage of non-life premiums to GDP [34].

2.3. Economic Growth

Economic growth requires energy, and to the extent that this energy is produced using fossil fuels, it results in carbon emissions. A crucial topic for climate change is the nature of this connection between the expansion in economic activity and carbon emissions. The quest to increase economic activity without an increase in carbon emissions is a global challenge. There are parts of the world that also demonstrate an inverse relationship between economic growth and carbon emissions due to which there does not appear to be a widespread consensus among researchers on this relationship. The studies that have concluded a positive relationship between economic growth or energy consumption with carbon emissions include the work of Ehigiamusoe and Lean [35], Mensah et al. [36], and Musah et al. [37].
The studies with an inverse relationship between economic activity and carbon emissions include the work of Sun et al. [38] and Ozcan [39]. A group of academics have asserted a link between CO2 emissions and economic development, claiming that CO2 emissions rise during the early phases of economic development but fall after a particular level of economic development is reached [40,41,42].
These contradicting results could also be the consequence of differences in time and place. Mensah et al. [39] focused on African economies, Musah et al. [37] selected West Africa, Ozcan [39] selected Middle Eastern countries, Sun et al. [38] worked on China and Xu et al. [42] focused their study on G20 countries. There are still many regions of the planet that are not covered, indicating an ongoing discussion on the relationship between economic activity and carbon emissions and the requirement for additional research.
In consideration of the above gap and discussion, we have selected the top 10 countries of the OBOR region for this study. These countries have not been studied for CO2 emissions in particular, and represent an upcoming global classification that needs due attention for research and policy implementation.

2.4. Renewable Energy

Renewable energy in the form of wind, solar, and water is taken very seriously as a source of reducing carbon emissions. The use of renewable energy has been studied in various studies for the reduction in carbon emissions and improvement in the air quality for developing nations [43,44,45,46,47,48] and as well as for developed nations [37,38,39] or for both of them [40,41].
Various techniques have been used to establish the relationship between renewable energy and carbon emissions including panel pooled mean group-autoregressive distributive lag model [39], modified ordinary least squares and vector error correction [42], and the AMG approach [43]. The findings of these techniques and research work complement each other, and in most of the literature renewable energy is claimed to have mitigated carbon emissions. Furthermore, the renewable energy trend is provided in the top 10 OBOR countries below in Figure 3.

2.5. Globalization

Increased cross-border trade in products and services, increased international money flows, and increased labor flows are all signs of globalization, the ongoing process of greater economic interdependence among nations [44]. Several studies have attempted to study the impact of globalization on CO2 emissions and environmental quality. In their investigation of 40 developed and developing nations, Antweiler et al. [45] found that trade liberalization enhances environmental quality. According to research conducted by Sinha and Shahbaz [46] for India between 1971 and 2015, trade is negatively related to carbon dioxide emissions. Acheampong [47] showed how decreased global carbon emissions resulted from trade openness and improved environmental quality.
Although there is a consensus that globalization reduces carbon emissions and improves environmental quality, the relative impact of this relationship is varied across the globe. This was concluded in the research conducted by Shahbaz et al. [48] in which a general trend showed a reduction in carbon emissions due to globalization but with varying effects from country to country in the African region. Trade liberalization decreases carbon dioxide and sulfur dioxide pollutant emissions in OECD countries while increasing emissions in non-OECD countries [49].
Chang et al. [50] attributed the varying effect to the income level of an economy. They concluded that trade liberalization only improved environmental quality in high-income countries while increasing carbon emissions in low-income economies. An improved understanding of this phenomenon is the result of the study by Shahbaz et al. [51] that concluded a bidirectional relationship for middle-income counties between trade and carbon emissions and a unidirectional one for high-income and low-income level countries. Another explanation of the varying effect is provided by Farhani et al. [52], who claimed that trade liberalization’s impact on environmental quality is based on the scale of trade growth, the techniques shared for environmentally friendly technologies, and the techniques of production employed by the host country. These results open avenues for research in upcoming global regions, alliances, and partnerships that believe in trade liberalization and lifting hurdles that hamper globalization.

2.6. Information and Communication Technology

Information and communication technologies (ICTs) have been shown to have a wide range of effects on important global mechanisms. Prior studies have documented the impact of ICT on different environmental and development aspects. ICT has been studied for economic prosperity and development [53,54], sustainable development [55,56], and alongside carbon emissions [57,58]. It has been documented that these technologies increase productivity, lower energy intensity, and may even facilitate production of cheaper renewable energy. Each one of these effects has different implications for CO2 emissions, causing a lack of agreement on how ICTs will affect carbon emissions [59,60].
Some advocate the use of ICT as a strategy to slow down the effects of climate change by enhancing energy efficiency [61,62] and lowering the price of renewable energy sources [63]. Other studies support the significant link between ICT development and economic expansion [64,65,66] which would raise energy consumption and carbon dioxide emissions.
There are different results of ICT on environmental quality in different parts of the world. ICT has been proven to reduce environmental damage and carbon emissions in the BRICS region [67], Pakistan [68], and China [69]. ICT has been associated with increased carbon emissions in sub-Saharan African countries [70]. Comparative studies conclude that ICT increases carbon emissions in low-income countries while the opposite is true for middle and high-income countries [71]. Finally, the studies by Higón et al. [72] and Faisal et al. [73] claim that ICT increases pollution up to a certain level and eventually reduces it later on. Hence, a generally agreed-upon finding on the overall effect of ICTs on the environment has not yet been achieved.

3. Research Methodology

The OBOR top 10 emitter countries were selected based on world bank data available online and retrieved from [74]. The top 10 OBOR emitting countries were identified based on the following criteria: First, all high-income countries participating in the OBOR were picked. Furthermore, the top 10 countries with study variable data were chosen based on CO2 emissions data from 2004 to 2019 on a per capita basis. An econometric equation is presented. CO2 emission was used as the dependent variable, FI, ICT, RE, and GL were used as the independent variables, and EG was used as the control variable (Table 1).
Econometric Equation:
C O = α + β 1 F I + β 2 I C T + β 3 R E + β 4 G L + β 5 E G + µ i t
where
CO2—Carbon dioxide emission
FI—Financial inclusion
ICT—Information Communication Technology
RE—Renewable Energy
GOB—Globalization
EG—Economic Growth

3.1. Cross-Sectional Dependency Test

A cross-sectional dependency issue may arise with the data due to the economic, cultural, and social ties that exist between a select number of neighboring regional countries that are included in the cross-sectional data. As a result, it is not completely impossible to speculate on how a specific macroeconomic event in one of these countries would impact the economies of the others. If the issue of cross-sectional dependency is overlooked, the findings of unit root, cointegration, regression, and causality analyses may be biased. We used the cross-sectional dependency test recommended by [75] for cross-sectional dependence to determine whether or not cross-sectional dependence exists within the OBOR top 10 emitter countries panel data set that is being considered in this study. This was done to determine whether cross-sectional dependence does exist. This methodology gives accurate findings when applied to datasets with finite cross-sectional units and time dimensions. This technique calculates an estimate of a test statistic while taking into consideration the alternative hypothesis of cross-sectional dependence.
C D = 2 N N 1 i = 1 N 1 j = i = 0 n T i j p ^ 2 N ( 0,1 )
Breusch and Pagan developed the Lagrange Multiplier test in 1980, which is used to assess the validity of results about cross-sectional dependency. This conclusion is backed by the fact that the selected OBOR top 10 emitter countries are linked geographically, by socioeconomic engagements and cultural links, and through similarities in several OBOR countries’ macroeconomic policies. Additionally, this conclusion is supported by the fact that the OBOR top 10 emitter countries have similar cultural ties. In addition, these countries are recognized as high-income countries by the World Development Index, which lends credence to the idea that cross-sectional reliance exists.

3.2. Homogeneity Test

Another significant issue with panel data is the availability of differing slope coefficients across different cross-sectional units, which can lead to biased results if not considered in the regression analysis [76,77]. The disparities in the EF levels of the Top 10 OBOR emitter countries are most likely to blame for the slope heterogeneity issues in the data set investigated in this study. The slope homogeneity test developed by Dong, Dong, and Jiang [78]. This test recommends to explore slope homogeneity changes for large panel datasets as per [79] to account for bias and with fixed sample sizes and time dimensions.
The approach of [78] predicts two test statistics that are comparable to the test statistic (and) coefficients of the cross-sectional unit slope under the homogeneous null hypothesis. This statistic resembles the predicted test statistic of, except it has been modified for bias [79]. Due to the finite features of the panel dataset analyzed in this study, slope heterogeneity is determined by the statistical significance of the projected statistic.

3.3. Unit Roots Test

Before developing an appropriate regression technique, the suitable integration order between the variables in the relevant model must be determined. Furthermore, non-stationary data increases the likelihood of anticipating erroneous regression parameters [80]. Conventional unit root estimate procedures cannot be applied to cross-sectionally dependent data sets because they assume cross-sectional independence [81]. The Im–Pesaran–Shin (IPS) method is effective in the absence of cross-sectional dependency concerns. Consequently, it is necessary to research methods of the future able to manage cross-sectionally dependent datasets [82]. Consequently, the Cross-sectionally Augmented IPS (CIPS) approach provided by [16] is a superior option for our data set. As seen below, the CIPS test statistic can be predicted using a generalized regression model.
Δ y i t = i + δ i y i , t 1 + c i   y   t 1 + j = 0 S d i j Δ y t j + j = 0 S δ i j Δ y t j + e i t
where δ and ∂ represent the cross-sectional means of first differences and delayed levels, respectively; and j is the operator for first differences [75]. Using the following equation, the CIPS test statistic is derived:
C I P S N , T = N 1 i = 1 N t i ( N ,   T )
All of the aforementioned methods are utilized in this study to compute the unit root properties.

3.4. Cointegration Analysis by Panel

Typical cointegration techniques, such as those created by [83], perform poorly when applied to cross-sectionally dependent data [82]. In contrast, the proposed panel cointegration estimator of [84] performs better under cross-sectional dependence. [82] state that the method of [84] predicts four distinct test statistics (Gt, Ga, Pt, and Pa), where Gt and Ga represent two group-mean test statistics and Pt and Pa represent two panel-mean test statistics.
G T = 1 N i = 1 N α ^ i / S E α ^ i
G a = 1 N i = 1 N T α ^ i / α ^ i
P t = α ^ i / S E α ^ i
P a =   T   α ^
In addition, because the technique proposed by [84] necessitates slope homogeneity and no structural break, it is inapplicable to data sets with the aforementioned issues, following [82].

3.5. Cross-Sectional of the ARDL Model

We calculated Chudik and Pesaran’s Cross-sectionally Augmented Autoregressive Distributed Lag (CS-ARDL) model for the examination of long- and short-run coefficients [85]. Whether the series is co-integrated or not, and whether the repressors are I0, I1, or a combination of both, the CS-ARDL estimator yields reliable results [86]. It takes cross-sectional dependence into account because it is an ARDL variant of the Dynamic Common Correlated Estimator and is based on individual estimations with lagged dependent variables and lagged cross-section averages [85]. Variable slope coefficients allow for the estimation of group means. The mean group variation of the CS-ARDL model is based on supplementing each cross-ARDL section’s estimations with cross-sectional averages that serve as surrogates for unobserved common components and their lags [86]. This technique also outperforms the moderate endogeneity issue that occurs when the lagged dependent variable is incorporated into the model. The authors contend that augmenting the model with lagged cross-section averages substantially eliminates the endogeneity issue. Using the subsequent regression, the CSARDL is estimated.

4. Result and Discussion

To select more reliable estimates, we employed the cross-sectional dependency and homogeneity assumptions in the first step of the empirical study. The findings of the dependency study with a cross-sectional approach are presented in Table 2. The null hypothesis of cross-sectional independence is rejected at both the 1% and 5% significance levels by the statistical significance of the test statistics from the procedures of [16], which confirms that there are cross-sectional dependency issues in the data. Table 3 displays the results of the slope homogeneity test performed by [78]. At a 1% level of significance, the anticipated test statistic can be proved to be statistically significant. As a result, the null hypothesis that slope homogeneity exists among cross-sectional units cannot be accepted. As a result, the slope heterogeneity problem must be considered in the analysis, as it implies that the panel dataset used in this study is heterogeneous. Then, a panel unit root analysis is performed.
In the second step, a unit root test was employed. The results of the unit root test are shown in Table 4. Except for globalization and economic growth, all variables are stationary at first differences. Globalization and economic growth are stationary at this level. Further, cointegration analysis was employed to check the cointegration between variables. Table 5 indicates that Gt, Ga, Pt, and Pa are significant at a 1% significance level. It shows that all variables are cointegrated. Moreover, the CS-ARDL approach is employed in Table 6. The CS-ARDL approach is suitable when the data showed stationary at several levels. This study’s initial investigation finds multiple orders of stationarity, cross-sectional dependence, and slope heterogeneity which confirm the robustness of the CS-ARDL approach.
Table 6 depicts that financial inclusion (FI) has a 5% positive significance with CO2 emissions in the top 10 OBOR countries in both the long and short run. This means that an increase in financial inclusion also increases CO2 emissions. This result is consistent with [9,87] This finding suggests that citizens in the top 10 OBOR countries purchased more items during the investigation period, such as automobiles, refrigerators, air conditioners, and television sets, owing to increased access to finance, and whose widespread use accelerates domestic fossil-fuel energy use, resulting in higher CO2 emissions in the top 10 OBOR countries. It also indicates that the Top 10 OBOR countries allocate their financial resources to achieve their targeted outcomes. In other words, the resources of the Top 10 OBOR countries are still in their beginning stage. Furthermore, in the long run, ICT has a 5% positive significance with CO2 emissions and a 1% positive significance in the short term. This means that an increase in ICT also increases CO2 emissions. The expansion of ICT infrastructure and the use of ICT goods can help to boost economic growth by increasing productivity and energy efficiency, lowering transportation costs, and reducing CO2 emissions. The results are consistent with [68,71]. According to the data, the top 10 OBOR countries’ corporate operations are based on technology. These countries have high CO2 emissions due to their usage of cutting-edge technologies. To reduce CO2 emissions, renewable energy sources must be used.
Renewable energy has a 5% negative significance with CO2 emissions in both the long and short run. This indicates that renewable energy decreases CO2 emissions. This result is in line with [88,89]. Recent study findings have discovered a negative association between renewable energy and CO2 emissions, referring to the fact that renewable energy allows for the reduction of climate change and greenhouse gas emissions in the top 10 emitter countries [90,91].However, OBOR countries still lag in use of RE as also depicted in Table 7; where the mean value of RE represents the lowest of the figures; thus indicating a need to focus on that more. Furthermore, globalization has a negative 1% significance level association with CO2 emissions in the long run, while it is insignificant in the short run. According to [62], globalization greatly reduces CO2 emissions. Globalization has had a significant detrimental impact according to [11] and Shahbaz et al. [48]. Long-term economic growth has a positive 10% significance threshold with CO2 emissions, but short-term economic growth is irrelevant. These findings are consistent with Ehigiamusoe and Lean [35], Mensah et al. [36], and Musah et al. [37]. A group of researchers asserted a connection between CO2 emissions and economic development, suggesting that CO2 emissions rise during the early stages of economic development but decline after a certain level of economic development is attained [26,27,28]. The findings suggest that the majority of top 10 emitter countries are in the early stages of economic expansion. This is the cause of rapid economic expansion and huge CO2 emissions. The top 10 emitting countries must establish measures to minimize CO2 emissions.

5. Conclusions and Policy Recommendation

The top 10 emitters of CO2 in the OBOR region were examined in this study to determine the short- and long-term impacts of various factors, including financial inclusion, information and communication technology, renewable energy, globalisation, and economic growth. Results from 2004 to 2019 were examined using data from the OBOR top 10 emitter countries. In the top 10 OBOR countries, financial inclusion (FI) has a positive long- and short-term relationship with CO2 emissions, according to the CS-ARDL research. ICT also has a long- and short-term favourable relationship with CO2 emissions. Although globalisation has little impact on CO2 emissions in the short term, it has a negative impact on them over time. Long-term economic expansion is positively related to CO2 emissions.
A lack of investment in renewable energy could explain the rise in CO2 emissions in OBOR countries. The adoption of modern ICT applications such as online shopping, mobile apps, online funds transfer and payments, and efficient power usage will result in further reducing CO2 emissions. Furthermore, several legislative measures should be studied to improve economic advancement and environmental quality while sustaining long-term sustainability. The construction of ICT infrastructure has the potential to strengthen the power of policies while also playing an essential role in boosting people’s environmental consciousness. OBOR countries should promote green and eco-friendly FDA along with technical support and training facilities for the workforce that will enhance the ownership among the workforce to adopt green human practices and closed-loop production practices in the industry.
In many aspects, this study provides a wide range of opportunities for future researchers. For instance, additional research might be conducted by including other variables that have an impact on CO2 emissions. Second, future research may employ all OBOR countries; this analysis only used the top 10 emitter countries. Third, researchers may also employ other econometric methods.

Author Contributions

Conceptualization, M.S.H. and N.K.; methodology, N.K.; software, N.K.; validation, R.S.M.T., A.R.N.A.A. and L.X.; formal analysis, E.Z.J. and N.K.; investigation, A.K. and M.S.H.; resources, L.X.; data curation, R.S.M.T. and E.Z.J.; writing—original draft preparation, A.K. and M.S.H. and N.K.; writing—review and editing, N.K. and M.S.H.; visualization, N.K., A.K and R.L.; supervision, L.X. and R.L.; project administration, L.X. All authors have read and agreed to the published version of the manuscript.

Funding

This research received no external funding.

Institutional Review Board Statement

Not applicable.

Informed Consent Statement

Not applicable.

Data Availability Statement

This research was based on secondary data collected from credible resources and accordingly mentioned in the methodology section.

Conflicts of Interest

The authors declare no conflict of interest.

References

  1. Abbasi, K.R.; Hussain, K.; Haddad, A.M.; Salman, A.; Ozturk, I. The role of Financial Development and Technological Innovation towards Sustainable Development in Pakistan: Fresh insights from consumption and territory-based emissions. Technol. Forecast. Soc. Change 2022, 176, 121444. [Google Scholar] [CrossRef]
  2. Belaïd, F.; Zrelli, M.H. Renewable and non-renewable electricity consumption, environmental degradation and economic development: Evidence from Mediterranean countries. Energy Policy 2019, 133, 110929. [Google Scholar] [CrossRef]
  3. Bilal, A.; Li, X.; Zhu, N.; Sharma, R.; Jahanger, A. Green technology innovation, globalization, and CO2 emissions: Recent insights from the OBOR economies. Sustainability 2022, 14, 236. [Google Scholar] [CrossRef]
  4. Cheng, Y.; Awan, U.; Ahmad, S.; Tan, Z. How do technological innovation and fiscal decentralization affect the environment? A story of the fourth industrial revolution and sustainable growth. Technol. Forecast. Soc. Change 2021, 162, 120398. [Google Scholar] [CrossRef]
  5. Anser, M.K.; Khan, M.A.; Awan, U.; Batool, R.; Zaman, K.; Imran, M.; Sasmoko; Indrianti, Y.; Khan, A.; Bakar, Z.A. The role of technological innovation in a dynamic model of the environmental supply chain curve: Evidence from a panel of 102 countries. Processes 2020, 8, 1033. [Google Scholar] [CrossRef]
  6. Danish; Ulucak, R.; Khan, S.U.D. Determinants of the ecological footprint: Role of renewable energy, natural resources, and urbanization. Sustain. Cities Soc. 2020, 54, 101996. [Google Scholar] [CrossRef]
  7. Qin, L.; Raheem, S.; Murshed, M.; Miao, X.; Khan, Z.; Kirikkaleli, D. Does financial inclusion limit carbon dioxide emissions? Analyzing the role of globalization and renewable electricity output. Sustain. Dev. 2021, 29, 1138–1154. [Google Scholar] [CrossRef]
  8. Mehmood, U. Examining the role of financial inclusion towards CO2 emissions: Presenting the role of renewable energy and globalization in the context of EKC. Environ. Sci. Pollut. Res. 2022, 29, 15946–15954. [Google Scholar] [CrossRef]
  9. Zaidi, S.A.H.; Hussain, M.; Uz Zaman, Q. Dynamic linkages between financial inclusion and carbon emissions: Evidence from selected OECD countries. Resour. Environ. Sustain. 2021, 4, 100022. [Google Scholar] [CrossRef]
  10. Lee, K.-H.; Cin, B.C.; Lee, E.Y. Environmental Responsibility and Firm Performance: The Application of an Environmental, Social and Governance Model. Bus. Strateg. Environ. 2016, 25, 40–53. [Google Scholar] [CrossRef]
  11. Wang, B.; Yan, C.; Iqbal, N.; Fareed, Z.; Arslan, A. Impact of human capital and financial globalization on environmental degradation in OBOR countries: Critical role of national cultural orientations. Environ. Sci. Pollut. Res. 2022, 29, 37327–37343. [Google Scholar] [CrossRef] [PubMed]
  12. Staib, R. Business management and environmental stewardship: Environmental thinking as a prelude to management action. Choice Rev. Online 2009, 47. [Google Scholar] [CrossRef]
  13. SM Hali, T.S.S.I. One Belt and One Road. Strateg. Stud. 2014, 34, 147–164. [Google Scholar]
  14. Li, M.; Ahmad, M.; Fareed, Z.; Hassan, T.; Kirikkaleli, D. Role of trade openness, export diversification, and renewable electricity output in realizing carbon neutrality dream of China. J. Environ. Manag. 2021, 297, 113419. [Google Scholar] [CrossRef]
  15. Saud, S.; Chen, S.; Haseeb, A. Sumayya The role of financial development and globalization in the environment: Accounting ecological footprint indicators for selected one-belt-one-road initiative countries. J. Clean. Prod. 2020, 250, 119518. [Google Scholar] [CrossRef]
  16. Pesaran, M.H. General Diagnostic Tests for Cross Section Dependence in Panels Cambridge Working Papers. Economics 2004, 1240, 1. [Google Scholar]
  17. Breusch, T.S.; Pagan, A.R. The Lagrange multiplier test and its applications to model specification in econometrics. Rev. Econ. Stud. 1980, 47, 239–253. [Google Scholar] [CrossRef]
  18. Sanglimsuwan, K. Carbon dioxide emissions and economic growth: An econometric analysis. Int. Res. J. Financ. Econ. 2011, 67, 97–102. [Google Scholar]
  19. IPONC Change. Report of the Nineteenth Session of the Intergovernmental Panel on Climate Change (IPCC); World Meteorological Organization: Geneva, Switzerland, 17–20 April 2002. [Google Scholar]
  20. BP. 2022. Available online: https://www.bp.com/content/dam/bp/business-sites/en/global/corporate/pdfs/energy-economics/energy-outlook/bp-energy-outlook-2022.pdf (accessed on 24 September 2022).
  21. Friedlingstein, P.; O’sullivan, M.; Jones, M.W.; Andrew, R.M.; Hauck, J.; Olsen, A.; Peters, G.P.; Peters, W.; Pongratz, J.; Sitch, S. Global carbon budget 2020. Earth Syst. Sci. Data 2020, 12, 3269–3340. [Google Scholar] [CrossRef]
  22. Hakimi, A.; Hamdi, H. Trade liberalization, FDI inflows, environmental quality and economic growth: A comparative analysis between Tunisia and Morocco. Renew. Sustain. Energy Rev. 2016, 58, 1445–1456. [Google Scholar] [CrossRef] [Green Version]
  23. Demirgüç-Kunt, A.; Singer, D. Financial Inclusion and Inclusive Growth: A Review of Recent Empirical Evidence. World Bank Policy Research Working Paper. 2017. Available online: https://papers.ssrn.com/sol3/papers.cfm?abstract_id=2958542 (accessed on 16 December 2022).
  24. Yang, B.; Ali, M.; Nazir, M.R.; Ullah, W.; Qayyum, M. Financial instability and CO2 emissions: Cross-country evidence. Air Qual. Atmos. Health 2020, 13, 459–468. [Google Scholar] [CrossRef]
  25. Safi, A.; Chen, Y.; Wahab, S.; Ali, S.; Yi, X.; Imran, M. Financial instability and consumption-based carbon emission in E-7 countries: The role of trade and economic growth. Sustain. Prod. Consum. 2021, 27, 383–391. [Google Scholar] [CrossRef]
  26. Nasreen, S.; Anwar, S.; Ozturk, I. Financial stability, energy consumption and environmental quality: Evidence from South Asian economies. Renew. Sustain. Energy Rev. 2017, 67, 1105–1122. [Google Scholar] [CrossRef]
  27. Baloch, M.A.; Zhang, J.; Iqbal, K.; Iqbal, Z. The effect of financial development on ecological footprint in BRI countries: Evidence from panel data estimation. Environ. Sci. Pollut. Res. 2019, 26, 6199–6208. [Google Scholar] [CrossRef] [PubMed]
  28. Renzhi, N.; Baek, Y.J. Can financial inclusion be an effective mitigation measure? evidence from panel data analysis of the environmental Kuznets curve. Financ. Res. Lett. 2020, 37, 101725. [Google Scholar] [CrossRef]
  29. Murshed, M.; Apergis, N.; Alam, M.S.; Khan, U.; Mahmud, S. The impacts of renewable energy, financial inclusivity, globalization, economic growth, and urbanization on carbon productivity: Evidence from net moderation and mediation effects of energy efficiency gains. Renew. Energy 2022, 196, 824–838. [Google Scholar] [CrossRef]
  30. Le, T.-H.; Le, H.-C.; Taghizadeh-Hesary, F. Does financial inclusion impact CO2 emissions? Evidence from Asia. Financ. Res. Lett. 2020, 34, 101451. [Google Scholar] [CrossRef]
  31. Raza, M.S.; Tang, J.; Rubab, S.; Wen, X. Determining the nexus between financial inclusion and economic development in Pakistan. J. Money Laund. Control 2019, 22. [Google Scholar] [CrossRef]
  32. Paramasivan, C.; Ganeshkumar, V. Overview of financial inclusion in India. Int. J. Manag. Dev. Stud. 2013, 2, 45–49. [Google Scholar]
  33. Arshad, A. Impact of financial inclusion on food security: Evidence from developing countries. Int. J. Soc. Econ. 2022, 49, 336–355. [Google Scholar] [CrossRef]
  34. Nordin, A. The production of financial corporations and price and volume split of financial services and non-life insurance services. In Proceedings of the Prepared by Anders Nordin, OECD Statistics Directorate, Eighteenth Meeting of the IMF Committee on Balance of Payments Statistics, Washington, DC, USA, 27 June–1 July 2005; Volume 1, p. 2005. [Google Scholar]
  35. Ehigiamusoe, K.U.; Lean, H.H. Effects of energy consumption, economic growth, and financial development on carbon emissions: Evidence from heterogeneous income groups. Environ. Sci. Pollut. Res. 2019, 26, 22611–22624. [Google Scholar] [CrossRef] [PubMed]
  36. Mensah, I.A.; Sun, M.; Omari-Sasu, A.Y.; Gao, C.; Obobisa, E.S.; Osinubi, T.T. Potential economic indicators and environmental quality in African economies: New insight from cross-sectional autoregressive distributed lag approach. Environ. Sci. Pollut. Res. 2021, 28, 56865–56891. [Google Scholar] [CrossRef]
  37. Musah, M.; Kong, Y.; Mensah, I.A.; Antwi, S.K.; Donkor, M. The link between carbon emissions, renewable energy consumption, and economic growth: A heterogeneous panel evidence from West Africa. Environ. Sci. Pollut. Res. 2020, 27, 28867–28889. [Google Scholar] [CrossRef]
  38. Sun, Y.; Li, M.; Zhang, M.; Khan, H.S.U.D.; Li, J.; Li, Z.; Sun, H.; Zhu, Y.; Anaba, O.A. A study on China’s economic growth, green energy technology, and carbon emissions based on the Kuznets curve (EKC). Environ. Sci. Pollut. Res. 2021, 28, 7200–7211. [Google Scholar] [CrossRef]
  39. Ozcan, B. The nexus between carbon emissions, energy consumption and economic growth in Middle East countries: A panel data analysis. Energy Policy 2013, 62, 1138–1147. [Google Scholar] [CrossRef]
  40. Chen, P.-Y.; Chen, S.-T.; Hsu, C.-S.; Chen, C.-C. Modeling the global relationships among economic growth, energy consumption and CO2 emissions. Renew. Sustain. Energy Rev. 2016, 65, 420–431. [Google Scholar] [CrossRef]
  41. Kasperowicz, R. Economic growth and CO2 emissions: The ECM analysis. J. Int. Stud. 2015, 8, 91–98. [Google Scholar]
  42. Xu, B.; Zhong, R.; Qiao, H. The impact of biofuel consumption on CO2 emissions: A panel data analysis for seven selected G20 countries. Energy Environ. 2020, 31, 1498–1514. [Google Scholar] [CrossRef]
  43. Hu, H.; Xie, N.; Fang, D.; Zhang, X. The role of renewable energy consumption and commercial services trade in carbon dioxide reduction: Evidence from 25 developing countries. Appl. Energy 2018, 211, 1229–1244. [Google Scholar] [CrossRef]
  44. Apergis, N.; Payne, J.E.; Menyah, K.; Wolde-Rufael, Y. On the causal dynamics between emissions, nuclear energy, renewable energy, and economic growth. Ecol. Econ. 2010, 69, 2255–2260. [Google Scholar] [CrossRef]
  45. Antweiler, W.; Copeland, B.R.; Taylor, M.S. Is free trade good for the environment? Am. Econ. Rev. 2001, 91, 877–908. [Google Scholar] [CrossRef] [Green Version]
  46. Sinha, A.; Shahbaz, M. Estimation of environmental Kuznets curve for CO2 emission: Role of renewable energy generation in India. Renew. Energy 2018, 119, 703–711. [Google Scholar] [CrossRef] [Green Version]
  47. Acheampong, A.O.; Adams, S.; Boateng, E. Do globalization and renewable energy contribute to carbon emissions mitigation in Sub-Saharan Africa? Sci. Total Environ. 2019, 677, 436–446. [Google Scholar] [CrossRef] [PubMed]
  48. Shahbaz, M.; Solarin, S.A.; Ozturk, I. Environmental Kuznets curve hypothesis and the role of globalization in selected African countries. Ecol. Indic. 2016, 67, 623–636. [Google Scholar] [CrossRef] [Green Version]
  49. Managi, S.; Hibiki, A.; Tsurumi, T. Does trade openness improve environmental quality? J. Environ. Econ. Manag. 2009, 58, 346–363. [Google Scholar] [CrossRef]
  50. Chang, C.-P.; Wen, J.; Dong, M.; Hao, Y. Does government ideology affect environmental pollutions? New evidence from instrumental variable quantile regression estimations. Energy Policy 2018, 113, 386–400. [Google Scholar] [CrossRef]
  51. Shahbaz, M.; Nasreen, S.; Ahmed, K.; Hammoudeh, S. Trade openness–carbon emissions nexus: The importance of turning points of trade openness for country panels. Energy Econ. 2017, 61, 221–232. [Google Scholar] [CrossRef] [Green Version]
  52. Farhani, S.; Chaibi, A.; Rault, C. CO2 emissions, output, energy consumption, and trade in Tunisia. Econ. Model. 2014, 38, 426–434. [Google Scholar] [CrossRef]
  53. Bekun, F.V.; Adewale, A.A.; Sarkodie, A.S. Science of the Total Environment toward a Sustainable Environment: Nexus between CO2 Emissions, Resources, Renewable and Nonrenewable Energy in 16-EU Countries. Sci. Total Env. 2019, 657, 1023–1029. [Google Scholar] [CrossRef]
  54. Bhattacharya, M.; Paramati, S.R.; Ozturk, I.; Bhattacharya, S. The Effect of Renewable Energy Consumption on Economic Growth: Evidence from Top 38 Countries. Appl. Energy 2016, 162, 733–741. [Google Scholar] [CrossRef]
  55. Asongu, S.A. Knowledge economy gaps, policy syndromes, and catch-up strategies: Fresh South Korean lessons to Africa. J. Knowl. Econ. 2017, 8, 211–253. [Google Scholar] [CrossRef] [Green Version]
  56. Murphy, J.T.; Carmody, P. Africa’s Information Revolution: Technical Regimes and Production Networks in South Africa and Tanzania; John Wiley & Sons: Hoboken, NJ, USA, 2015; ISBN 1118751302. [Google Scholar]
  57. Byrne, E.; Nicholson, B.; Salem, F. Information communication technologies and the millennium development goals. Inf. Technol. Dev. 2011, 17, 1–3. [Google Scholar] [CrossRef]
  58. Baz, K.; Xu, D.; Ali, H.; Khan, U.; Cheng, J.; Abbas, K.; Ali, I. Nexus of minerals-technology complexity and fossil fuels with carbon dioxide emission: Emerging Asian economies based on product complexity index. J. Clean. Prod. 2022, 373, 133703. [Google Scholar] [CrossRef]
  59. Batool, R.; Sharif, A.; Islam, T.; Zaman, K.; Shoukry, A.M.; Sharkawy, M.A.; Gani, S.; Aamir, A.; Hishan, S.S. Green is clean: The role of ICT in resource management. Environ. Sci. Pollut. Res. 2019, 26, 25341–25358. [Google Scholar] [CrossRef]
  60. Tsaurai, K. The impact of information and communication technology on carbon emissions in emerging markets. Int. J. Energy Econ. Policy 2019, 9, 670216917. [Google Scholar] [CrossRef] [Green Version]
  61. Hilty, L.M.; Coroama, V.; De Eicker, M.O.; Ruddy, T.; Müller, E. The role of ICT in energy consumption and energy efficiency. In Report to the European Commission, DG INFSO, Project ICT ENSURE: European ICT Sustainability Research; Graz University: Graz, Austria, 2009; Volume 1, pp. 1–60. [Google Scholar]
  62. Bastida, L.; Cohen, J.J.; Kollmann, A.; Moya, A.; Reichl, J. Exploring the role of ICT on household behavioural energy efficiency to mitigate global warming. Renew. Sustain. Energy Rev. 2019, 103, 455–462. [Google Scholar] [CrossRef] [Green Version]
  63. Zheng, J.; Wang, X. Can mobile information communication technologies (ICTs) promote the development of renewables?-evidence from seven countries. Energy Policy 2021, 149, 112041. [Google Scholar] [CrossRef]
  64. Nasab, E.H.; Aghaei, M. The effect of ICT on economic growth: Further evidence. Int. Bull. Bus. Adm. 2009, 5, 46–56. [Google Scholar]
  65. Avgerou, C. The link between ICT and economic growth in the discourse of development. In Organizational Information Systems in the Context of Globalization; Springer: Berlin/Heidelberg, Germany, 2003; pp. 373–386. [Google Scholar]
  66. Niebel, T. ICT and economic growth–Comparing developing, emerging and developed countries. World Dev. 2018, 104, 197–211. [Google Scholar] [CrossRef] [Green Version]
  67. Ulucak, R.; Khan, S.U. Does information and communication technology affect CO2 mitigation under the pathway of sustainable development during the mode of globalization? Sustain. Dev. 2020, 28, 857–867. [Google Scholar] [CrossRef]
  68. Godil, D.I.; Sharif, A.; Agha, H.; Jermsittiparsert, K. The dynamic nonlinear influence of ICT, financial development, and institutional quality on CO2 emission in Pakistan: New insights from QARDL approach. Environ. Sci. Pollut. Res. 2020, 27, 24190–24200. [Google Scholar] [CrossRef] [PubMed]
  69. Zhang, C.; Liu, C. The impact of ICT industry on CO2 emissions: A regional analysis in China. Renew. Sustain. Energy Rev. 2015, 44, 12–19. [Google Scholar] [CrossRef]
  70. Avom, D.; Nkengfack, H.; Fotio, H.K.; Totouom, A. ICT and environmental quality in Sub-Saharan Africa: Effects and transmission channels. Technol. Forecast. Soc. Chang. 2020, 155, 120028. [Google Scholar] [CrossRef]
  71. Danish. Effects of information and communication technology and real income on CO2 emissions: The experience of countries along Belt and Road. Telemat. Inform. 2019, 45. [CrossRef]
  72. Higón, D.A.; Gholami, R.; Shirazi, F. ICT and environmental sustainability: A global perspective. Telemat. Inform. 2017, 34, 85–95. [Google Scholar] [CrossRef]
  73. Faisal, F.; Tursoy, T.; Pervaiz, R. Does ICT lessen CO2 emissions for fast-emerging economies? An application of the heterogeneous panel estimations. Environ. Sci. Pollut. Res. 2020, 27, 10778–10789. [Google Scholar] [CrossRef] [PubMed]
  74. World Bank categorization Green Finance & Development Center. Available online: https://greenfdc.org/countries-of-the-belt-and-road-initiative-bri/ (accessed on 16 December 2022).
  75. Chudik, A.; Pesaran, M.H. Large Panel Data Models with Cross-Sectional Dependence: A Survey. Fed. Reserv. Bank Dallas Glob. Monet. Policy Inst. Work. Pap. 2013, 2013. [Google Scholar] [CrossRef] [Green Version]
  76. Murshed, M. An empirical analysis of the non-linear impacts of ICT-trade openness on renewable energy transition, energy efficiency, clean cooking fuel access and environmental sustainability in South Asia. Environ. Sci. Pollut. Res. 2020, 27, 36254–36281. [Google Scholar] [CrossRef]
  77. Rehman, A.; Alam, M.M.; Ozturk, I.; Alvarado, R.; Murshed, M.; Işık, C.; Ma, H. Globalization and renewable energy use: How are they contributing to upsurge the CO2 emissions? A global perspective. Environ. Sci. Pollut. Res. 2022, 30, 9699–9712. [Google Scholar] [CrossRef]
  78. Hashem Pesaran, M.; Yamagata, T. Testing Slope Homogeneity in Large Panels. J. Econom. 2008, 142, 50–93. [Google Scholar] [CrossRef] [Green Version]
  79. Swamy, P.A.V.B. Efficient Inference in a Random Coefficient Regression Model. Econometrica 1970, 38, 311. [Google Scholar] [CrossRef]
  80. Yıldırım, M. Irrational happiness beliefs and subjective well-being of undergraduate students: A longitudinal study. J. Posit. Sch. Psychol. 2021, 5, 65–72. [Google Scholar] [CrossRef]
  81. Im, K.S.; Pesaran, M.H.; Shin, Y. Testing for unit roots in heterogeneous panels. J. Econom. 2003, 115, 53–74. [Google Scholar] [CrossRef]
  82. Xue, L.; Haseeb, M.; Mahmood, H.; Alkhateeb, T.T.Y.; Murshed, M. Renewable energy use and ecological footprints mitigation: Evidence from selected south asian economies. Sustainability 2021, 13, 1613. [Google Scholar] [CrossRef]
  83. Kao, C.; Chiang, M.H. On the estimation and inference of a cointegrated regression in panel data. Adv. Econom. 2000, 15, 179–222. [Google Scholar] [CrossRef] [Green Version]
  84. Westerlund, J. Testing for error correction in panel data. Oxf. Bull. Econ. Stat. 2007, 69, 709–748. [Google Scholar] [CrossRef] [Green Version]
  85. Chudik, A.; Mohaddes, K.; Pesaran, H.; Raissi, M. Cambridge Working Papers in Economics Long-Run Effects in Large Heterogenous Panel Data Models with Cross-Sectionally Correlated Errors. In Essays in Honor of Aman Ullah; Emerald Group Publishing Limited: Bingley, UK, 2016. [Google Scholar]
  86. Chudik, A.; Mohaddes, K.; Pesaran, M.H.; Raissi, M. Is there a debt-threshold effect on output growth? Rev. Econ. Stat. 2017, 99, 135–150. [Google Scholar] [CrossRef] [Green Version]
  87. Liu, D.; Xie, Y.; Hafeez, M.; Usman, A. The trade-off between economic performance and environmental quality: Does financial inclusion matter for emerging Asian economies? Environ. Sci. Pollut. Res. 2022, 29, 29746–29755. [Google Scholar] [CrossRef]
  88. Bilgili, F.; Koçak, E.; Bulut, Ü. The dynamic impact of renewable energy consumption on CO2 emissions: A revisited Environmental Kuznets Curve approach. Renew. Sustain. Energy Rev. 2016, 54, 838–845. [Google Scholar] [CrossRef]
  89. Yu, J.; Tang, Y.M.; Chau, K.Y.; Nazar, R.; Ali, S.; Iqbal, W. Role of solar-based renewable energy in mitigating CO2 emissions: Evidence from quantile-on-quantile estimation. Renew. Energy 2022, 182, 216–226. [Google Scholar] [CrossRef]
  90. Bekun, F.V. Mitigating Emissions in India: Accounting for the Role of Real Income, Renewable Energy Consumption and Investment in Energy. Int. J. Energy Econ. Policy 2022, 12, 188–192. [Google Scholar] [CrossRef]
  91. Khan, U.; Khan, A.M.; Khan, M.S.; Ahmed, P.; Haque, A.; Parvin, R.A. Are the impacts of renewable energy use on load capacity factors homogeneous for developed and developing nations? Evidence from the G7 and E7 nations. Environ. Sci. Pollut. Res. 2022, 1–12. [Google Scholar] [CrossRef] [PubMed]
Figure 1. Research framework of the study.
Sustainability 15 06534 g001
Figure 2. Top 10 emitter OBOR Countries CO2 Emission.
Sustainability 15 06534 g002
Figure 3. Top 10 emitter OBOR Countries Renewable Energy.
Sustainability 15 06534 g003
Table 1. Variable information.
SymbolsVariablesMeasurementSourceTime Period
CO2Carbon Dioxide EmissionCarbon dioxide emission (Kt)World Development Indicators2004 to 2019
Retrieved on 27-10-2022
FIFinancial InclusionCommercial bank branches (per 100,000 adults)World Development Indicators2004 to 2019
Retrieved on 27-10-2022
ICTInternet Communication Technology Individuals using the Internet (% of the population)World Development Indicators2004 to 2019
Retrieved on 27-10-2022
RERenewable EnergyRenewable energy consumption (% of total final energy consumption)World Development Indicators2004 to 2019
Retrieved on 27-10-2022
GOBGlobalizationGOF IndexKOF Globalisation Index2004 to 2019
Retrieved on 27-10-2022
EGEconomic Growth GDP 2015 ConstantWorld Development Indicators2004 to 2019
Retrieved on 27-10-2022
Table 2. Cross-sectional dependency test.
VariablePesaran (2004)Breusch and Pagan (1980)
CO22.87 ***21.11 **
EG19.15 ***44.23 ***
ICT21.44 ***41.15 ***
RE4.69 ***18.34 ***
GOB19.48 ***23.61 **
FI8.48 ***22.50 **
**, *** represents 5%, and 1% significance level, respectively.
Table 3. Homogeneity Test.
Dependent Variable: CO2
StatisticsValue Prob
Delta4.440 *** (0.000)
Adjusted Delta5.921 *** (0.000)
*** represents 1% significance level.
Table 4. Unit root test.
CIPsIm-Pesaran-Shin
VarLevelp-Value1st Diffp-ValueLevelp-Value1st Diffp-Value
CO2−2.238>0.10−2.215<0.050 **−1.57510.3642−2.43680.007 ***
EG−0.949<0.05 **−0.949<0.050 **−1.46770.032 **−2.27010.041 **
ICT−1.794>0.10−1.894<0.050 **−1.16130.123−1.94610.025 **
RE−0.912>0.10−0.912<0.050 **7.43880.1114.86250.021 **
GOB−1.984<0.05 **−2.238<0.050 **−2.14760.016 **−3.53240.002 ***
FI−2.328>0.10−2.467<0.050 **1.52550.9368.11880.032 **
**, *** represents 5%, and 1% significance level respectively.
Table 5. Westerlund test.
Dependent Variable: CO2
StatisticsValuep-Value
G T −2.1440.000
G a −3.6600.000
P t −11.4440.000
P a −5.1640.000
Table 6. CS-ARDL.
Table 6. CS-ARDL.
Short Run
VariablesCoefficientStand Errorp-Value
FI0.987 **0.5030.050
ICT0.003 ***0.4880.004
RE1.197 **1.1700.050
GOB−5.1515.5650.355
EG4.7101.5300.758
Long Run
FI1.062 **0.4600.021
ICT0.003 **0.0020.054
RE−0.034 **0.5410.050
GOB−1.968 ***1.9300.008
EG6.840 *4.1200.097
ECM−0.944 ***0.5450.000
*, **, *** represents 10%, 5%, and 1% significance level respectively.
Table 7. Descriptive statistics.
VariableMeanStd. Dev.MinMax
FI3.0302830.19315152.599613.364495
ICT37.6544135.670069.048199.70149
CO24.4881630.52457493.5132185.752194
RE0.47716231.120934−2.04421.495406
GOB4.07320.25893.12234.4624
EG10.702890.52493829.8894711.83195
Disclaimer/Publisher’s Note: The statements, opinions and data contained in all publications are solely those of the individual author(s) and contributor(s) and not of MDPI and/or the editor(s). MDPI and/or the editor(s) disclaim responsibility for any injury to people or property resulting from any ideas, methods, instructions or products referred to in the content.

