
Strategic Sustainability and Operational Initiatives in Small- and Medium-Sized Manufacturers: An Empirical Analysis


1
College of Urban Transportation and Logistics, Shenzhen Technology University, Shenzhen 518118, China
2
Research Center of Sport Social Sciences, School of Physical Education and Sports, Soochow University China, Suzhou 215006, China
*
Authors to whom correspondence should be addressed.
Sustainability 2023, 15(7), 6330; https://doi.org/10.3390/su15076330
Submission received: 2 February 2023
/
Revised: 14 March 2023
/
Accepted: 30 March 2023
/
Published: 6 April 2023
(This article belongs to the Special Issue Business Digital Transformation Processes toward Circular Economy and Sustainability)
Abstract
:We explored the moderating impacts of product modularity and supply chain visibility for sustainability and operational initiatives, which entails a dramatic rethinking and reorganization of the production processes of manufacturing enterprises. Moderating effects of product modularity and supply chain visibility on links among supply chain pressure, technological pressure, sustainable practices, operational performance, and sustainability performance were included. A conceptual model was developed following the resource-based view and dynamic capability theories. Well-designed questionnaires collected data, and the total sample size for data analysis was 490 responses from small- and medium-sized manufacturing firms in Pakistan. Structural equation modeling was used to examine the proposed hypothesis. The first finding revealed that operational performance and sustainable performance both improve when companies implement sustainable practices. The second finding drawn from the data was that supply chain pressure and technological pressure have a positive effect on sustainable practices. The major finding of this work was grounded in the product modularity perspective, we argue that the relations among supply chain pressure, technological pressure, sustainable practices, operational performance, and sustainability performance are affected and moderated. The moderating effect of supply chain visibility existed and it has a positive moderating effect for the relationships from sustainable practices toward operational and sustainability performance. Surprisingly, moderating impact of visibility on relations from supply chain pressure and technological pressure towards sustainable practices was not significant.
1. Introduction
Sustainable supply chain management (SSCM) considers a company’s environmental, social, and economic challenges [1,2]. For twenty years, SSCM has engaged with firms’ sustainability goals and supply chain operations [3]. Today, in SSCM, sustainability goals have surfaced as a method of improving a business’s effectiveness [4]. SSCM ensures sustained, strategic, and transparent business and project integration [5]. In supply chains, regulating sustainable practices is difficult for businesses due to internal and external operations with information-based applications, for example RFID, blockchain, IoTs, and information and communication technologies (ICTs) [6,7,8]. Modern information-based applications have created greater options for production and service operations mode developments, such as internet-based networked manufacturing, service-oriented manufacturing, and platform-based operations. Information asymmetry, industrialization, and weak management hurt SMEs in uncertain times. Thus, existing research has not effectively documented information-based improvements for small- and medium-sized enterprises (SMEs).
Environmental protection, social development, and economic expansion all need to be considered carefully by SMEs. Nizam et al. (2020) [9] argued that SMEs need information-based technological resources for social development, environmental protection, and economic expansion [8,10]. Information-based technologies can hasten production and service operations model transformations, reducing energy and natural resource use, optimizing material flows, and improving operational efficiencies [10]. Information-based solutions can help manufacturing firms communicate sustainability information to supply chain members [6]. For innovation in products/services, companies are exchanging information about products and supply chain information with external stakeholders. The exchange of information with supply chain partners is the resource of higher transparency. Furthermore, researchers have recommended that SMEs should use knowledge-based technologies to improve transparency [11,12]. Transparency and information exchange should be employed throughout the supply chain to improve firms’ performance [13]. Moreover, information exchange also gives supply chain members a clearer picture of what is happening [8].
Basically, the term “transparency” refers to the practice of providing information between participants in a supply chain [14,15]. Montecchi et al. (2021) [16] argued that visibility, traceability, disclosure, and openness are frequently used as synonyms for supply chain transparency in the current body of literature. Supply chain visibility (SCV) concept is included to provide empirical evidence in the literature to improve supply chain performance [11,12,17,18]. Key challenges for SCV are sharing information and data, interruptions in supply chain, and having ability to combine the data.
Due to the low visibility in the supply chain, organizations are helpless in the face of interruptions. Visibility in the supply chain is relatively low due to the many supply chain participants, such as manufacturers, suppliers, and purchasers [19]. Low visibility is caused by a lack of connection, inflexibility, and reactivity within the supply chain [20,21]. Due to a lack of visibility in the supply chain, it is impossible to predict when companies will enhance their long-term performance [11]. Information-based technologies (RFID, IoT, blockchain technologies, and ICTs) provide visibility resources for partners to meet organizational goals, such as sustainability and operational improvement [8]. For the implementation of business practices, visibility is sharing data, information, and resources across supply chain stakeholders using new technologies [21]. For firms, SCV as information sharing boosts the supply chain operations. SCV’s concept of sharing information is a very important tactic for a firm’s research and development (R&D) department, which performs a vital role in developing a modular design [22]. SMEs cannot handle environmental issues due to a lack of visibility among supply chain participants [17]. Lack of resources, increased CO2 emissions, and non-renewable energy use pose long-term sustainability issues for small businesses [23,24]. SMEs fight to use their resources and skills for long-term growth and competitive advantage. A competitive environment makes it harder for SMEs to rebuild, restructure, and improve manufacturing processes to address sustainability and raise business performance [24]. Furthermore, SMEs struggle to create solid supplier relationships, and supply chain members pressure them to upgrade operations. Large companies have advanced technology for sustainability, but small businesses need it to survive. Small businesses are facing pressures from competitors known as technological pressure (TP) and business partners, known as supply chain pressure (SCP).
In addition, this work suggests new connections between several aspects of the product structure. The concept of modularity develops when a product is broken down into modular parts, which allows a manufacturing firm to produce different varieties of a product. It is frequently stated as a goal for a design of practice, but it has not received the same level of scrutiny as other current design practices, such as design-for-assembly. Product modularity (PM) defines the boundaries of a product design, which refers to an appropriate modular design for manufacturing and assembly lines [25]. The appropriate modular structure varies depending on the life cycle options used; for example, while the modular structure for recycling should be based on material types, the structure for upgrading should be based on obsolete functions [26,27]. The term “product modularity” has recently gained much traction in the academic literature. The PM concept is employed in the literature in different academic areas describing its high impact on manufacturing [28]. High modularity in a product might distract supply chain members, creating hurdles during manufacturing focal members in the supply chain. Whereas the concept of visibility is addressed in the SCM literature concerning sustainable growth, its relationship to a company’s operational performance remains murky. Thus, this unrecognized attempt assists in raising awareness of operational efficiency by including PM and SCV concepts. First, this investigation analyzes the moderating effects of SCV and PM on the relationships between SCP and TP toward sustainable practices. Second, unclear moderating effects of PM and SCV on the effects of SCP and TP for sustainable practices will be investigated. Lastly, considering the mediating role of sustainable practices, we also examine the impact of supply chain and technological pressure towards firm’s performances (operational and sustainability performance). Thus, we formulated the following research questions:
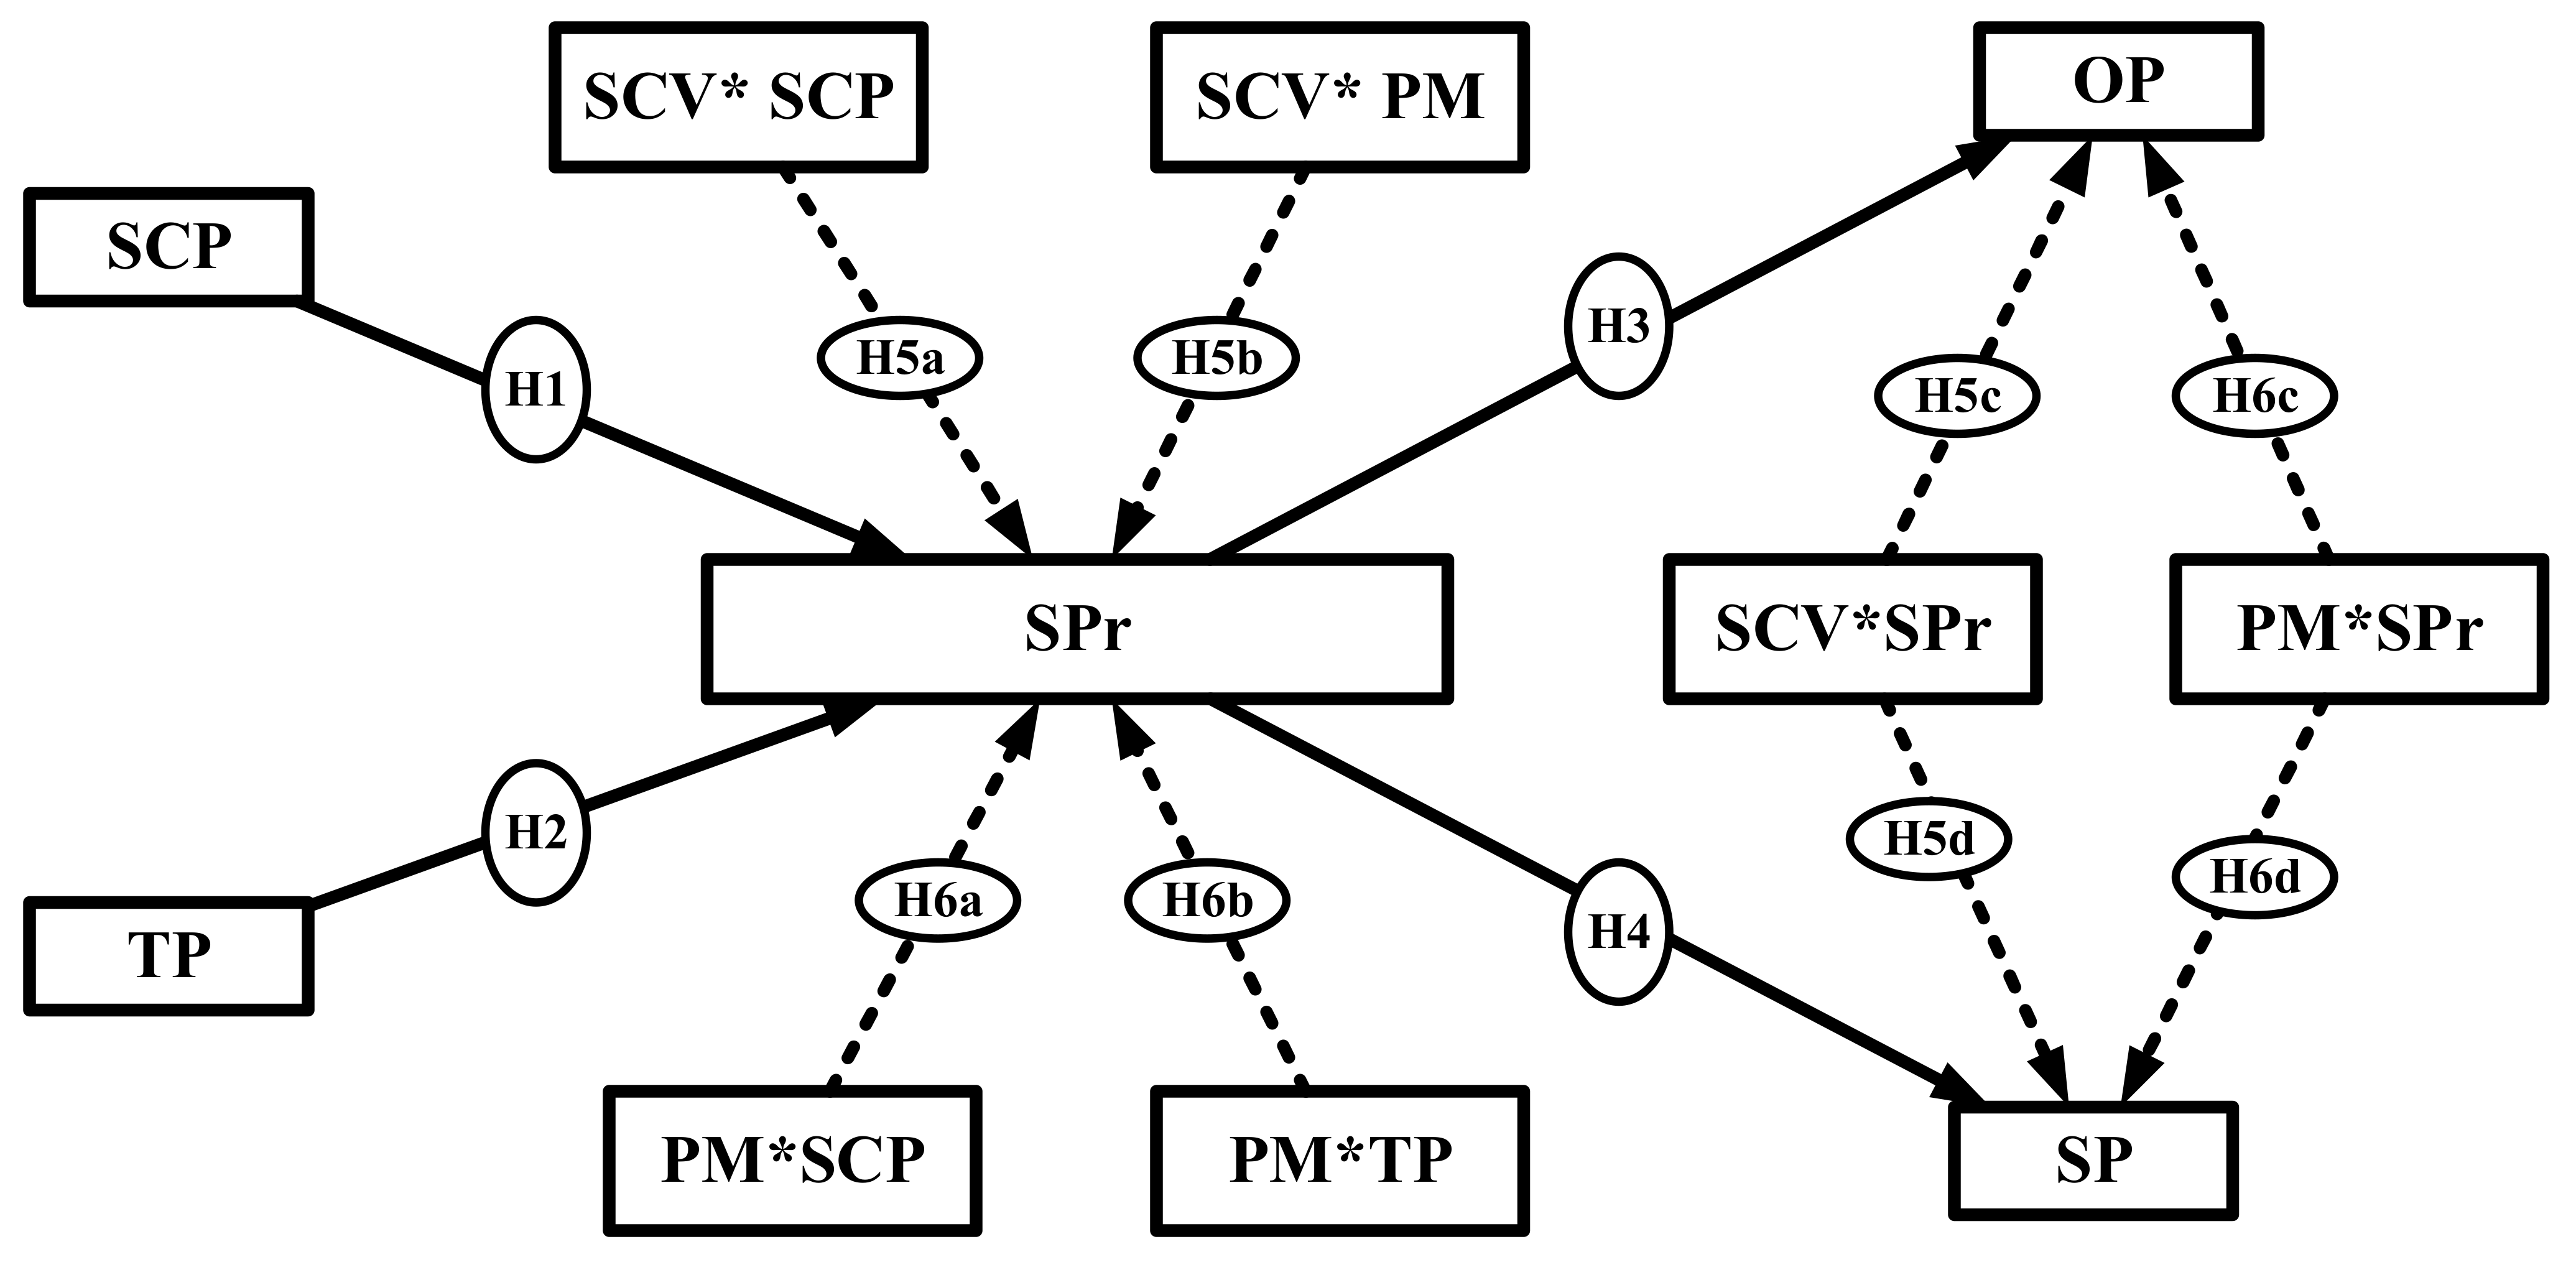
RQ1: Whether product modularity and supply chain visibility moderate the effects of supply chain pressure and technological pressure on sustainable practices.
RQ2: Whether product modularity and supply chain visibility moderate the effects of sustainable practices on operational and sustainable performance.
Based on the resource-based view (RBV) and dynamic capabilities (DC), a conceptual model was developed that includes hypothetical relationships among supply chain pressure, technological pressure, sustainable practices, supply chain visibility, operational performance, sustainable performance, and product modularity. The rest is laid out as follows: The coming part is detailed in developing literature-based hypotheses with the structural model (See Figure 1). The research methodology is presented next, followed by the findings and discussion. Finally, the conclusion is provided, and a discussion of the study’s shortcomings is discussed.
2. Theoretical and Hypothetical Framing
2.1. Theoretical Framing
Due to the unpredictable environment, the resources and capabilities of a firm cannot be solidly configured [24,29]. When constructing competencies, resources, and capacities that require sharing data and knowledge, firms must consider external and internal issues [30]. A firm’s resources and competencies include IT expertise, practices, and ICTs, essential tangible resources that boost its bottom line [31,32]. Brush and Artz, (1999) [30] mention that the resource-based view (RBV) perspective helps firms understand the resources and competencies. On the other side, in the field of organizational theory, “dynamic capability” refers to an organization’s propensity for strategic resource reallocation [33]. DC is the capacity to combine, develop, and reorganize internal and external competencies in response to dynamic conditions [34]. Seles et al. (2022) [29] explained that by using the dynamic capability framework, researchers evaluate how private sector firms generate and retain wealth in the face of fast technological change. RBV and DC theories claim firms can achieve a competitive edge by allocating tangible and immaterial resources [29,35]. DC theory was presented to fill the weakness of RBV theory [35]. The RBV asserts that collaborating with partners on resources, capabilities, and strategic assets may lead to supply chain learning and competitive advantages over competing enterprises, resulting in a sustainable market advantage owing to the advantage’s imitability [24]. Information-based technologies and technology platforms are tangible resources that aid in data management and information sharing across supply chain participants. A firm’s resources and capabilities, sustainable practices, product modularity, and supply chain visibility may be leveraged to make better operational and sustainable performance decisions.
RBV and DC also discuss how external and internal pressures affect product development [34]. According to Zhu et al. (2008), [36] the industry has three habitats: modularity, philanthropy, and uncertainty, which affect the strategic decisions of managers. Uncertainty in supply might not influence strategic decisions due to a firm’s tendency, but high-low modularity/design in a product might affect strategic decisions. By exchanging information in the form of experience, expertise, funds, and resources, visibility converts into an intangible resource or capability for enhancing the sustainability performance of SMEs [21]. This study used the resource-based view (RBV) theory and the dynamic capabilities (DC) theory to explain the nature of technological pressure, supply chain pressure, supply chain visibility, and product modularity in order to better understand the theoretical advantages of supply chain visibility to sustainable performance. By classifying the firm’s resources, RBV and DC logic provides useful perceptions for dealing with internal and external contingencies and capabilities. The SCV concept was defined in this study as tangible and intangible resources, with the PM concept as a capable component. As in a distributed manufacturing framework, product modularity enables a company to accelerate component combinations. Improvements in delivery performance can be ascribed to a modular product architecture, such as concurrent module manufacturing and component swapping. The organizational process is not closed; it is open to the outside world, containing numerous resources that impact its activities.
2.2. Hypothetical Framing
Supply chain pressure refers to external stakeholders’ pressure to exert business partners, supply chain members, government, and customers for any common goal [37]. Sustainable initiatives can also foster cooperation between enterprises, suppliers, and customers, decreasing environmental impacts [38]. Organizations feel pressure from end customers and shoppers because of strong interpersonal relationships in the design process [23]. Stakeholder pressure can be normative, coercive, or mimetic, influencing business choices and actions. Managers make decisions to use business practices out of a desire to appease their stakeholders rather than any intrinsic motivation. External stakeholders have been pressured to adopt sustainable practices, how suppliers respond to stakeholders, and government pressure [39]. According to Singh et al. (2018) [40], the perception of supply chain pressure is not easy to enhance. It needs clearer benefits, and those benefits need to be identified in a transparent shape. Specifically, there has been conflicting research on whether supply chain pressure affects the effectiveness of green supply chain management [23]. Large firms usually take responsibility for activities related to smaller suppliers because they are more visible than smaller suppliers [41]. Smaller suppliers are considered non-organizational stakeholder groups. Non-organizational groups can build high pressure on large firms to identify social and environmental concerns and pressure from stakeholders positively affects SSCM practice adoption [42]. Based on the above discussion about supply chain pressure, we posed the following hypotheses:
H1.
Supply chain pressure positively influences sustainable practices.
Technology is the sum of skills, techniques, processes, methods, and programs to manufacture products or accomplish goals [6,43]. It can be knowledge about procedures, techniques, and programs or machine operations that allows them to work [38]. Low-carbon technical innovation is a new way for manufacturing companies to achieve sustainable development. Technology is a source of conversion of raw material into finished goods [7]. Park and Li (2021) [44] mentioned that digitalization could revolutionize supply chain management. Technology is an invention to control the work of humans by making it very easy and fast [45]. Technology allows firms to remove communication barriers and interact freely [5]. Firms resolve social issues by employing green technologies and producing products by adopting green technology [8,10,46]. Four main features of advanced technology influence the supply chain network (traceability/visibility, reliability/security, cost efficiency, and the Synchronized Transaction Process) [16,44] Our technological pressure concept is grounded in the idea of competitive pressure in the supply chain network for technologically advanced products (sustainable products). The basic assumption is that a sample firm faces technical risk due to the technological progress of its competitors, as measured by the level of its R&D spending. Large companies have superior technology, while small businesses do not, which puts pressure on SMEs. Technological pressure might influence SMEs to adopt sustainable practices, which helps to improve the firm’s overall performance. Thus, the following hypotheses are proposed for technological pressure.
H2.
Technological pressure positively influenced sustainable practices.
This study focuses on advanced sustainable practices that can improve the sustainability effectiveness of a firm. Sustainability is a source of value creation that gives firms a competitive advantage and superior performance [47]. The sustainable practices concept is measured from several perspectives and considered multi-dimensional. Multi-dimensional practices can have a positive social impact and result in a new way of doing business for the firm [37]. Several sub-dimensions practices have been highlighted in the literature, which is helpful for sustainability issues [41,48]. Sub-dimensions of sustainable practices are sustainable procurement, manufacturing, sustainable distribution, and reverse logistics, which are important and integral to enhancing the manufacturing sector’s sustainability problems [49,50]. Those practices are operational strategies for internal environmental management, green information systems, facilitating the consumer’s desires, and eco-design, which are necessary to enhance the firm’s sustainability performance [4]. This study examines the concept of sustainable practice for investigating firms’ operational and sustainable performance under the moderating effect of product modularity and supply chain visibility concepts. Based on the above, the following hypotheses are proposed:
H3.
Sustainable practices have a positive impact on operational performance.
H4.
Sustainable practices have a positive impact on sustainable performance.
Visibility is information transparency, clarity, quality, and follow-up that help solve problems [15,16]. SCV concept refers to providing information across supply chain partners on the specific location of products or goods and product details, such as material quality and flexibility [11,17]. Through visibility, one can track the whereabouts of materials and finished goods from the point of origin all the way to the purchaser [18]. Information sharing is studied in the literature as a component of visibility, and its direct and mediated effects through the SCV notion are examined [16,17]. Moreover, SCV helps a company manage supply chain faults and adjustments in a competitive setting [14]. In the current situation, the management of a supply chain network or network of different suppliers is complex to accomplish with high competition, growing market complexities, and at a globalization level, but the existence of visibility within the whole supply chain network can make it easy for the firm [20] (Busse et al. 2017).
A big challenge is attaining clear visibility within the supply chain [18]. This is a challenge because the concept of SCV is related to collecting information about what is happening within the supply chain, which is not readily achievable [11]. Supply chain information should be trackable in practice and in real-time to attain good supply chain visibility [21,51]. Visibility/transparency purifies the supply chain network to promote sustainable practices. First, this study begins by exploring whether SCV can mediate between sustainable practices and operational performance. Next, we look at how SCV influences the connection between sustainable practices and sustainable performance. For moderating the role of SCV, two hypotheses are proposed.
H5a.
Supply chain visibility positively moderates supply chain pressures’ effect on sustainable practices.
H5b.
Supply chain visibility positively moderates technological pressures’ effect on sustainable practices.
H5c.
Supply chain visibility positively moderates sustainable practices’ effect on operational performance.
H5d.
Supply chain visibility positively moderates sustainable practices’ effect on sustainability performance.
Product modularity concepts have been explained regarding product development [28,52]. Modularity in product development represents the decomposition of a product with its components and subassemblies [22]. PM can provide different configurations, customization, and a longer product life cycle [53]. High modularity can affect product lead time, frequency, on-time introduction, and originality. Components and subassemblies help develop new varieties or models of a product through creativity, innovation, and updating parts [27,54]. Sun and Zhong (2020) [25] explained that PM is a design strategy used to create a comprehensive product line for a single product with numerous variants. According to the literature, modularity enhances product modification, diversity, and development, which should boost a company’s bottom line [55]. The literature has examined PM’s direct effect on supply chain and business performance [56]. Modularity is a moral constant that uses modules to construct multiple product architectures or designs. High modularity might affect sustainable practices, manufacturing, and administration and implementation process. Thus, we proposed a hypothesis for moderating the role of product modularity:
H6a.
Product modularity positively moderates supply chain pressures’ effect on sustainable practices.
H6b.
Product modularity positively moderates technological pressures’ effect on sustainable practices.
H6c.
Product modularity positively moderates sustainable practices’ effect on operational performance.
H6d.
Product modularity positively moderates sustainable practices’ effect on sustainability performance.
3. Research Design and Methodology
In exploratory research studies, researchers usually employ statistical software packages, such as SPSS and smartPLS-SEM [57]. The smartPLS-SEM software deals with vital applications path analysis, explanatory factor analysis (EFA), confirmatory factor analysis (CFA), first-order and second-order factor analysis, various regression-based models, covariance structure models, and correlation structure models [58]. The smartPLS approach outlines a multivariate statistical process to examine a measurement model of this work. It evaluates the linkages among variables of a conceptual model through the structural model to specify the relationship among variables. The structural model of research (see Figure 1) is tested using the PLS-SEM approach. The researcher said PLS-SEM could calculate dependability, trustworthiness, and validity, and smartPLS software helps social sciences and business researchers evaluate research models [57]. As the smartPLS software can handle abnormal statistical datasets due to its flexibility in assumptions linked with variable distribution and normality, this research also determined the significance level by employing a bootstrapping method.
3.1. Questionnaire Administration
A literature-based questionnaire is exercised to examine the structural model. To finalize a questionnaire, this research involved a team of detectives, including six professors and six professionals who belonged to relevant fields. Their feedback improved the questionnaire by eliminating unwanted items. Detectives evaluated the scale in accordance with suggestions and provided trustworthy participants with the questionnaire survey. The final questionnaire is based on 35-item scales of 7 constructs (see Appendix A), and included items adapted from literary works. Five items for sustainable practices were adapted from [1,36], five items were adapted for operational performance [59], six items for supply chain visibility were chosen from [60], four items for supply chain pressure were adopted [59], four items for product modularity were chosen from [54,55], four items for technological pressure [61], and seven items for sustainability performance were adapted from [36]. Participants were requested to return the completed questionnaire after receiving our assurance that their answers would be kept confidential. The final survey had two sections; the first section of the final questionnaire records gender, work experience, job level, job title, number of employees, and industry; feedback on model variables is included in the second section of the final questionnaire. A 5-point Likert scale was used in the second part concerning 35 scale items. Respondents rated their agreement from strongly agree to strongly disagree (strongly agree = 5, agree = 4, neither agree nor disagree = 3, disagree = 2, and strongly disagree = 1).
3.2. Data Collection
For necessary data, the target population belonged to Pakistan’s cities (for example, Faisalabad, Multan, Sargodha, Lahore, and Islamabad); Manufacturing SMEs serve as the unit of analysis. A list of 400 SMEs was picked from online national databases, i.e., SEMDA and Pakistan Bureau of Statistics. Before data collection, 65 responses were collected by online contact to proceed with pre-test analysis. The pre-test results explained that the items’ composite reliability and factor loadings were acceptable and met the threshold value of 0.70 [62].
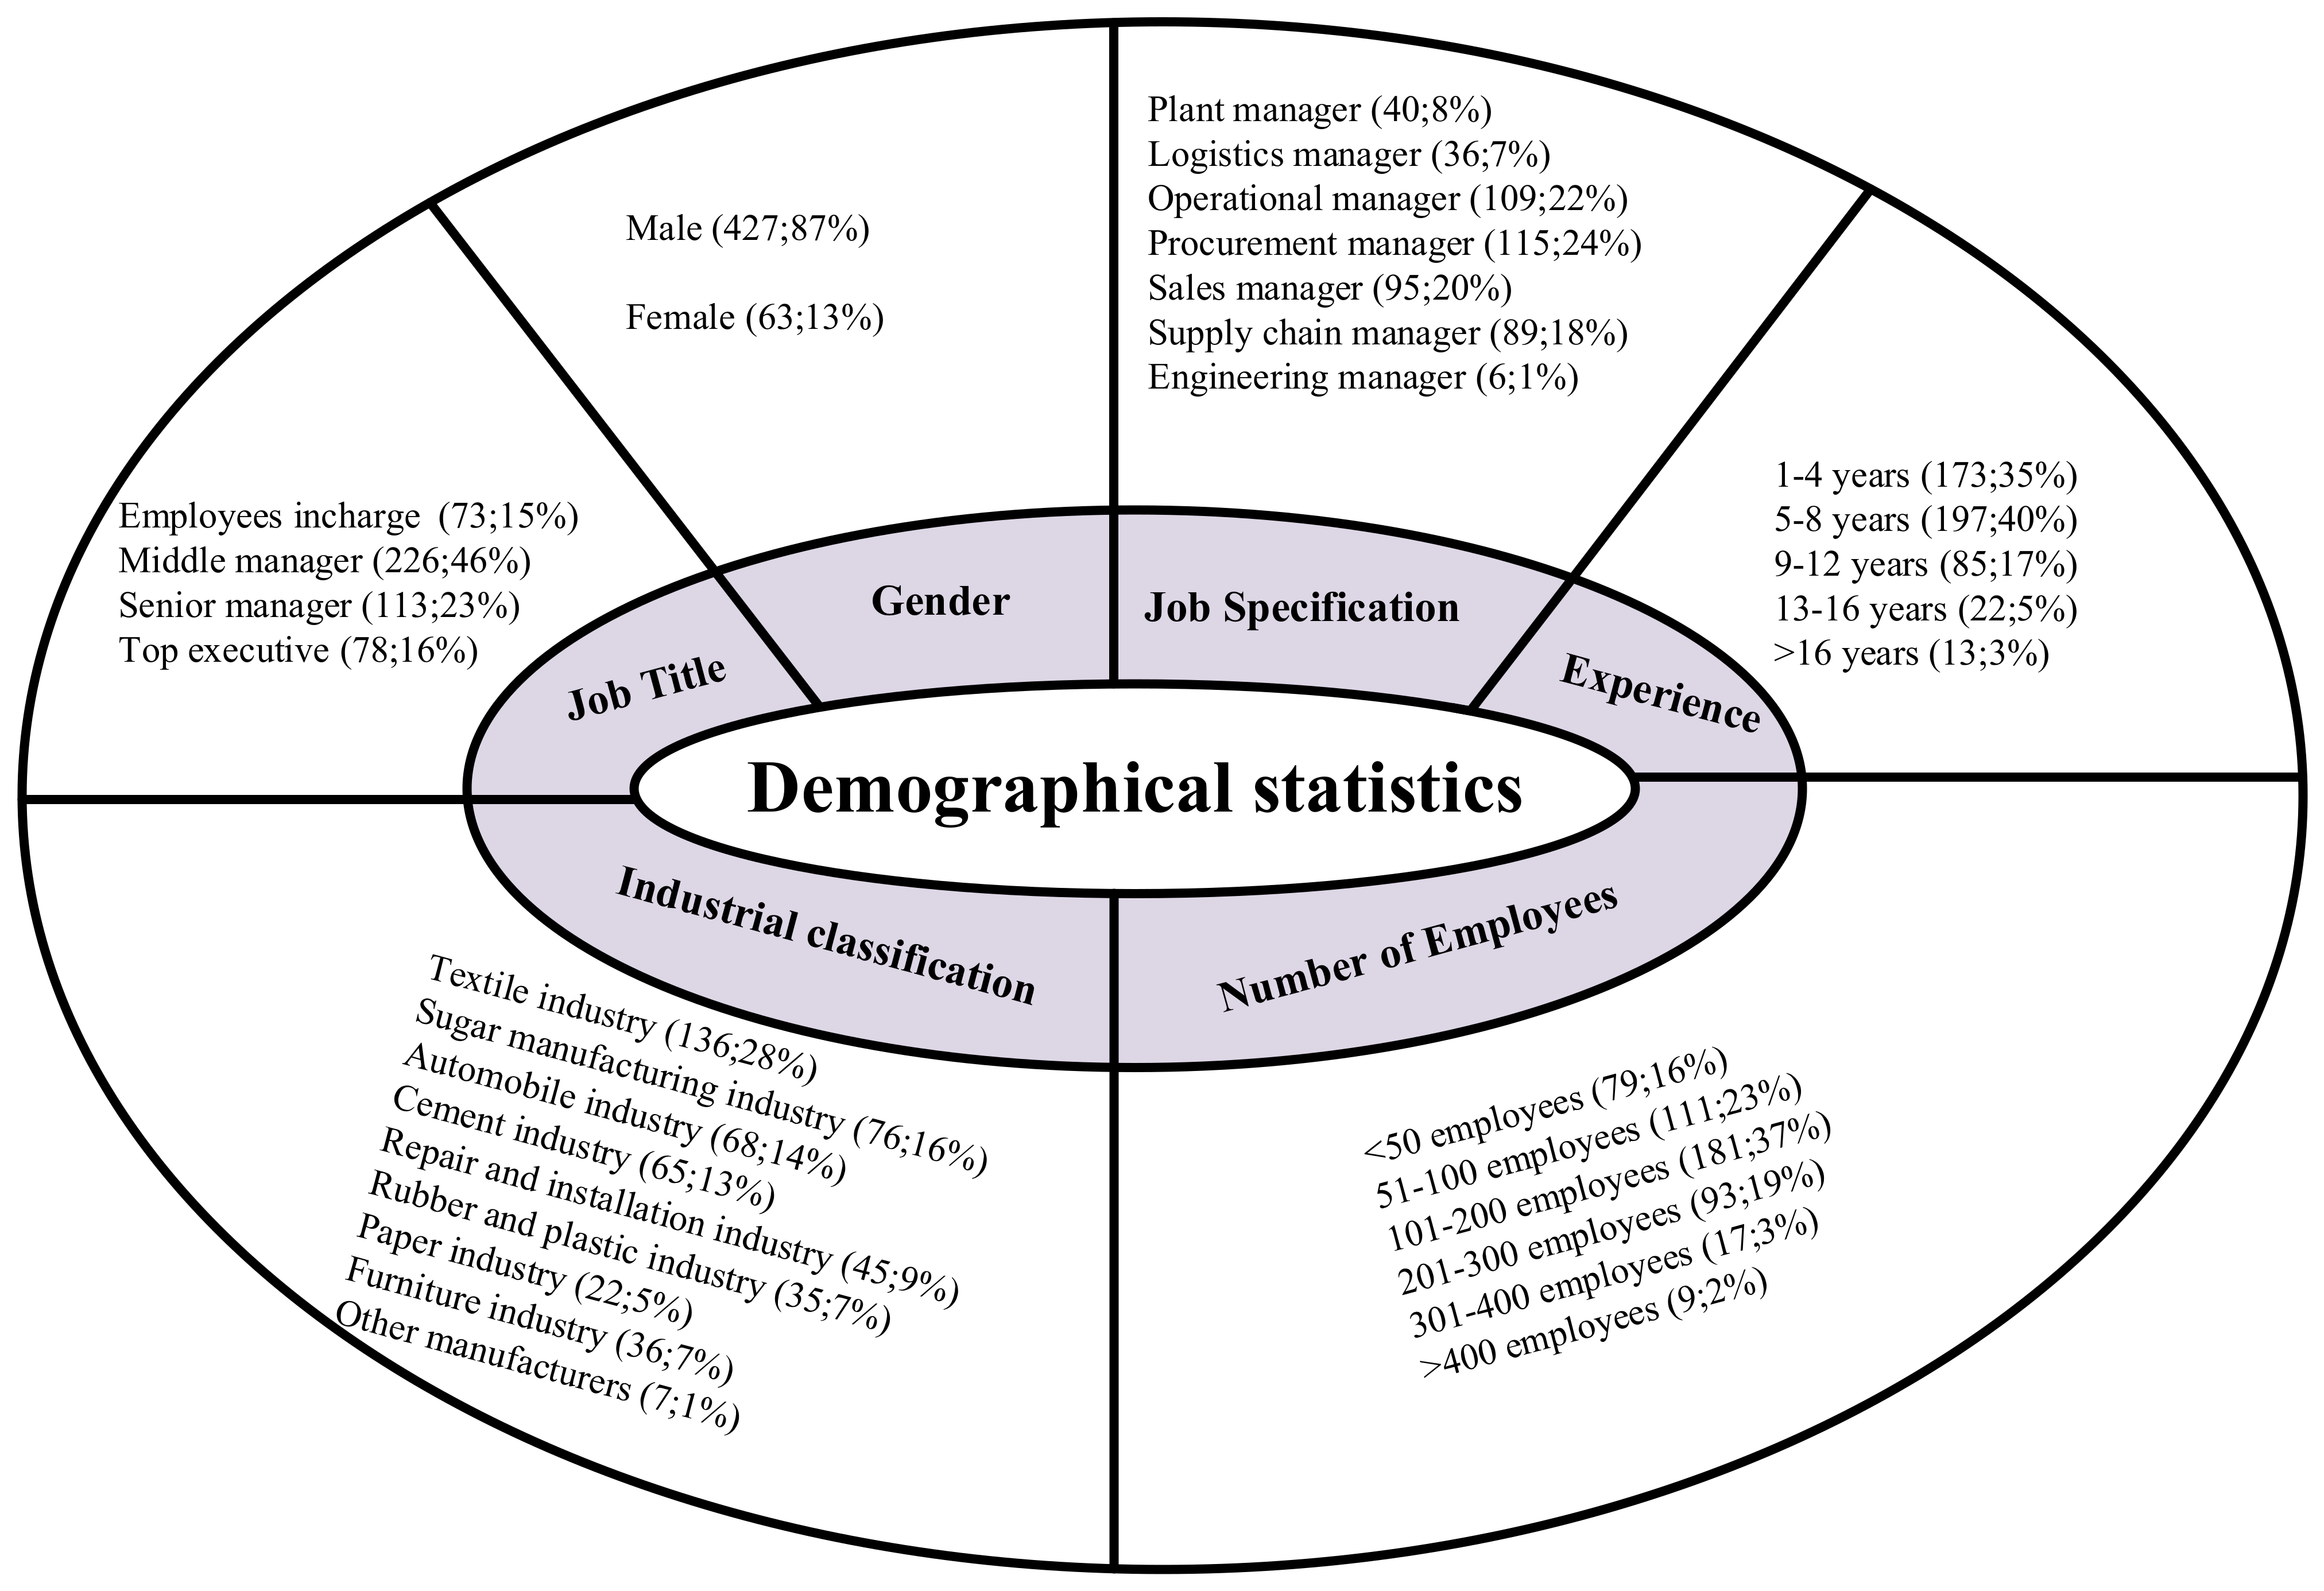
A total of 490 valid responses were collected from 1300 selected respondents. During data collection, we called, emailed, and visited respondents in person to increase the response rate. The final response rate was 37%, suitable for factor and hypothesis analysis in SEM. The demographic presentation of collected data is presented (see Figure 2). Gender information shows that of about 490 responses, 427 were male, and 63 were female. Demographics statistics specified that there were 115 purchasing managers, 109 operations managers, 95 sales managers, 89 supply chain managers, 36 logistic managers, 40 plant managers, and 6 engineering managers out of 490 responses. The working experience range of 197 participants from 490 was 5–8 years, 173 respondents were in the range of 1–4 years, 85 belonged to the working experience range group of 9–12 years, 22 respondents were in 13–16 years group of working experience, and 13 participants have more than 16 years working experience. Furthermore, the respondent’s sample included 226 middle-line managers, 113 senior managers, 78 top executives, and 73 employees. In the demographics table, the number of employees denoted the firm size. Of the 490 responders, 181 worked for firms with 100–200 employees, 111 for companies with 51–100, 93 for firms with 201–400, 79 for companies with 50 or less, and 9 for firms with 400 or more. Eventually, data from factories representing various industries was compiled. For instance, out of 490 responses, 136 belonged to the textile industry, 76 to sugar producers, 68 to auto manufacturers, 65 to cement producers, 45 to those specializing in machinery and equipment repair and installation, 35 to plastic and rubber producers, 36 to those associated with furniture producers, and 7 to other manufacturers.
4. Data Analysis
For factor analysis, the EFA technique was employed to verify the reliability and validity of scale measurement. First, skewness and kurtosis values were calculated to assess constant variance and normality for each item (see Table 1). Items for kurtosis and skewness at their greatest categorical values were evaluated and found to be within acceptable ranges for data reliability. The threshold values for kurtosis (<7) and skewness (<2) were acceptable [57].
For construct validation and scale purification, we ran EFA and calculate reliability values for each construct, such as scale composite reliability (SCR) and average variance extracted (AVE). SCR should be endorsed above 0.70, and the AVE value should be more than 0.50 [58]; AVE and SCR values passed the reliability test, meeting the criterion. Discriminant validity was tested using the square root of AVE values. Fornell–Larcker ratio and Heterotrait–Monotrait ratio of correlations (HTMT) criterion were followed to confirm the discriminant validity (See Table 2). The inter-correlations values between variables should be lower than the square root of AVE [58]. Results confirmed that the square roots of AVEs are higher than inter-correlations values among variables. Next, using factor loadings, we assessed the convergent validity of the scales. Factor loadings for each item were above 0.50, and the SCRs were significant in favor of loading values which were sufficient for convergent validity confirmation (See Table 3).
EFA analysis denoted that the calculation of eigenvalues for each construct is above 1, and the cumulative extracted variance is 65.492% for seven constructs. Kaiser–Meyer–Olkin (KMO) measure of sampling adequacy value is 0.925 with 8815.688 (X2), 595 (degree of freedom), and <0.000 (p-value). The assessment of KMO and Bartlett’s test value meets traditional values of 0.50 and <0.05, respectively. Therefore, the results specify that the instrument is effective for further analysis, and each variable’s dimensionality was determined using EFA. In Table 3, items are included with SCR > 0.70 and factor loading >0.50. The results show multiple cross-loadings do not exist between items, presenting discriminant validity for the developed item scale. Moreover, values were calculated to check multicollinearity. Multicollinearity influences VIFs’ route coefficients, and VIF values should be less than 5.0 to check multicollinearity [57]. VIF values are less than 3.0 (See Table 3), indicating no data multicollinearity. Cronbach’s alpha quantifies the degree of group identity in a set of components. It is used as a measurement of scale reliability; the values for Cronbach’s alpha are given in Table 3.
4.1. Hypothesis Testing
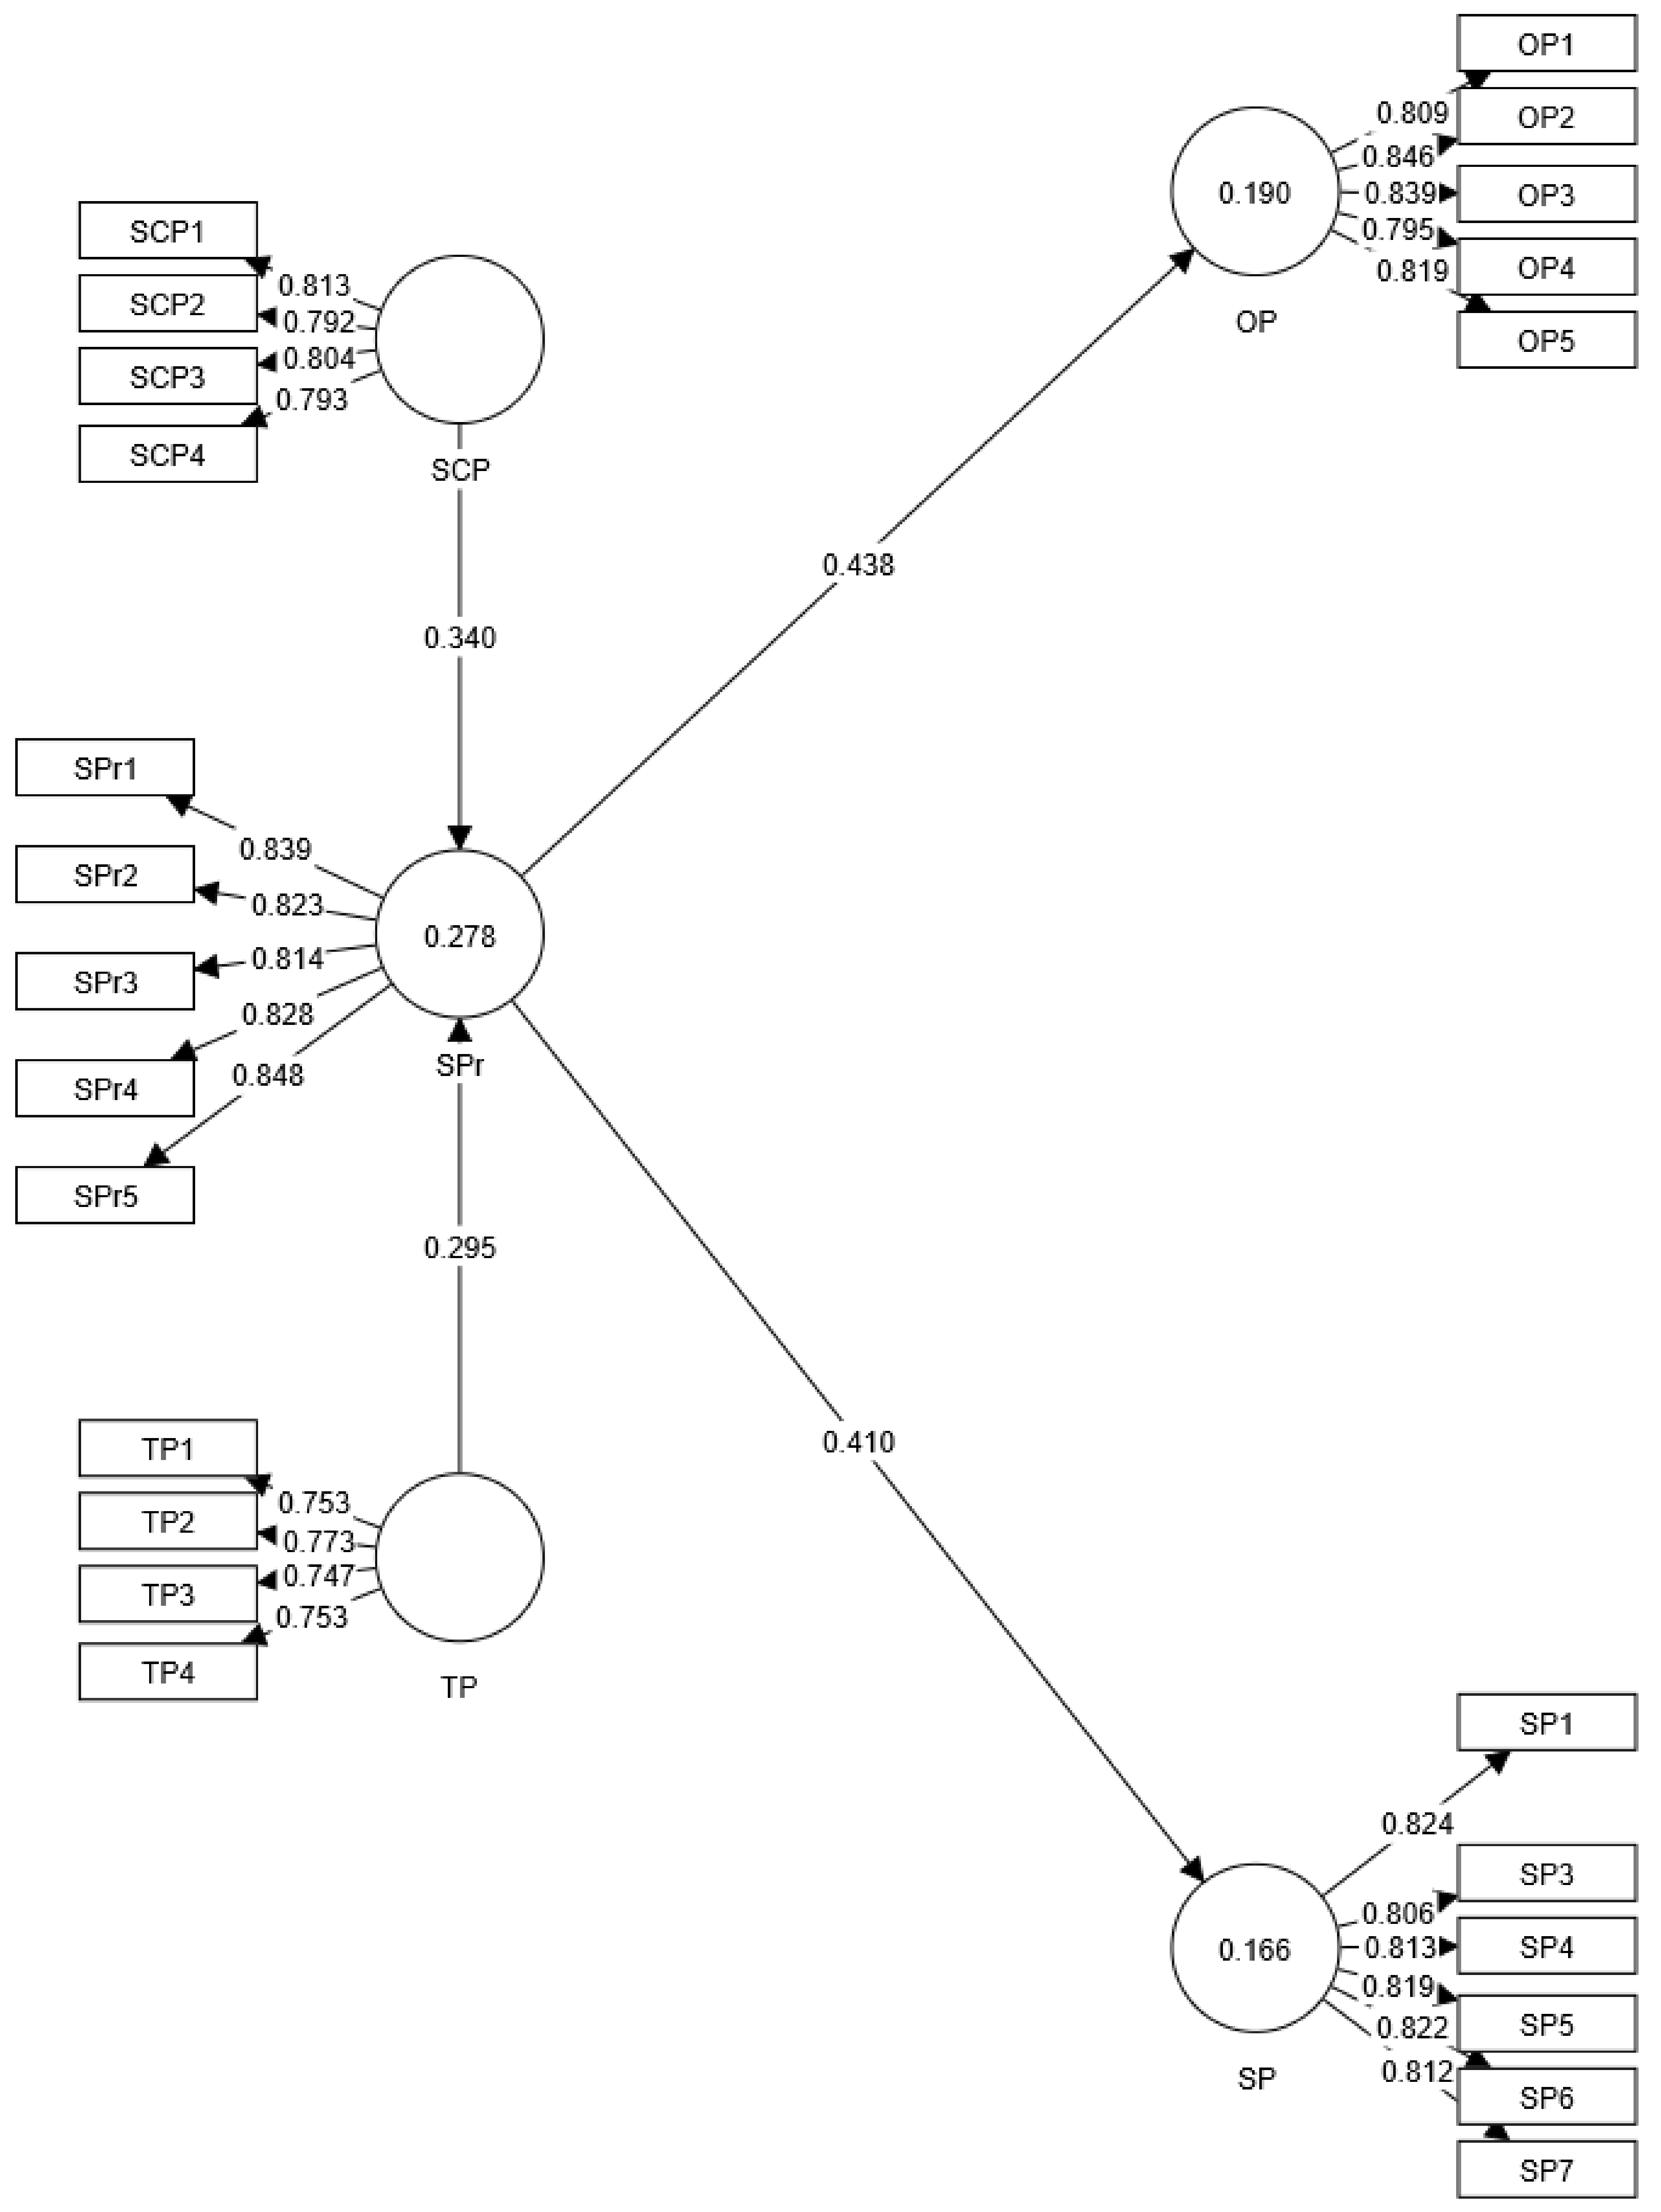
Proposed hypotheses were tested by the structural equation modeling (SEM) method. SEM’s strengths make it suited for this investigation, for example, it can estimate multiple-equation connections, thus the effects of the independent variable on the mediator and dependent variables can be evaluated simultaneously [63]. The SEM structural model is based on four direct hypothetical relationships among TB, SP, SPr, SCP, and OP. Eight hypothetical relationships are based on moderating effects of PM and SCV (see Figure 1). Structural models without moderation (M1) and structural models with moderation (M2) were designed in smartPLS (See Figure 3 and Figure 4). Before performing SEM, for the structural model, we calculate Standardized Root Mean Square Residual (SRMR), Normed Fit Index (NFI), the squared Euclidean distance (d_ULS), the geodesic distance (d_G), and Chi-Square (Chi²) values to evaluate the exact fitness of each structural model. For a good fit index, the threshold value of SRMR is <0.08, and the NFI value should be closer to 1 [64]. The calculated values for SRMR (M1 = 0.046, M2 = 0.048), d-ULS (M1 = 0.626, M2 = 1.377), d_G (M1 = 0.212, M2 = 0.474), Chi-squre (M1 = 606.312, M2 = 1300.855), and NFI (M1 = 0.897, M2 = 0.849) were acceptable (see Table 4).
For path analysis, acceptance or rejection of the hypothesis is based on the criteria of significance level [64]. Path coefficients (β), p-values, standard deviation, and T-values are reported in Table 5, where the beta coefficient is the change in outcome variable due to the predictor variable for every 1-unit, T-value is the coefficient divided by its standard error, and p-value is a significance level. By using SEM, two path structural models were tested. In the first structural model, direct hypothesis relations were tested, while product modularity and supply chain visibility were used as moderators in the second structural model. Overall, results indicate that a moderating influence of PM and SCV exist among SCP, TP, SPr, OP, and SP (see Figure 4).
Statistical results for H1 show the positive effect of SCP towards SPr with (M1 = 0.34 coefficients (β) value, 4.939 t-value, and p =< 0.000) and (M1 = 0.19 coefficients (β) value, 2.61 t-value, and p =< 0.01), confirming the proposed relationship. For M1 and M2, calculated coefficients (β), t-value, and p-value are (β = 0.30, T = 7.012, p =< 0.000) and (β = 0.25, T = 4.772, p =< 0.000), which claimed a significant link between TP and SPr for hypothesis H2. Sustainable practices had a favorable impact on OP (hypothesized relation H3) and SP (hypothesized relation H4), which are supported by calculated coefficients for M1 = β (0.438), t-value (8.837), p-value (<0.000); M2= β (0.287), t-value (7.039), p-value (<0.000); and M1 = β (0.410), t-value (8.339), p-value (<0.000); M2 = β (0.255), t-value (6.292), p-value (<0.000, respectively.
Moderating effects of PM and SCV were tested in structural model M2 (See Figure 3 and Table 4). Unfortunately, SCV’s moderating effects for (H5a) and (H5b) were marginal because of the high probability value. For SCV’s moderating effects, data provide significant evidence to support the H5c and H5d. Study find that SCV moderates the relations from SPr to OP (H5c) with M2 = β (0.192), t-value (4.507), p-value (<0.000); and SPr to SP (H5d) with M2 = β (0.186), t-value (4.185), p-value (<0.000), which were positive and significantly supported. Moderating impacts of product modularity were clearly supported by the collected data. From four hypotheses of PM, H6a, H6c, and H6d were positively supported with (β = 0.141, T = 5.268, p =< 0.000), (β = 0.124, 2.856, p =< 0.010), and (β = 0.136, T = 3.241, p =< 0.010), respectively, and H6b was negatively supported with (β = −0.272, T = 3.693, p =< 0.000) because of high innovation in product.
4.2. Results Discussions
The importance of sustainable products is widely emphasized, and new product development is involving manufacturers to adopt new strategies. In the current digital era, the development for sustainable product has become a highly complex task which has problems and need to be solved. In a supply chain, manufacturers should perform the role of problem solvers. This study evaluates PM and SCV’s moderating effects on relations from TP and SCP towards SPr, but also relations from SPr concept towards operational and sustainable performance. Findings show that the moderating effects of SCV and PM is existed to improve a firm’s overall performance. Modular designs in a product perform a key role in component manufacturing process and quality control. It means that modularity breaks systems into different degrees of interconnectedness to reduce complexity. Moreover, modularity is beneficial for business because, when businesses can simplify their operations by reducing complexity, they may invest more resources into technology installment for operational and sustainability issues. In that way, firms can gain high focus towards high transparency and buy distinct components from manufacturers, such as skids or modules, to uncover component issues in collaboration with suppliers. On the other hand, high-modular items make it harder for small manufacturers in Pakistan to develop sustainable practices since modular design requires extraordinary parts and components from suppliers. Anyhow, by allowing functional units to align their goals, modularity boosts visibility across departments. This study offers fresh perspectives on the moderating role of product modularity in the connections between sustainable practices and the success of the firm’s operations and sustainability. Furthermore, this investigation clarifies the boundary requirements for PM concept as a contingent factor for manufacturing firm because the moderated influence of PM on operational and sustainable performance is pretty optimistic. H11 and H12 provide a positive moderating impact of PM on two relationships from sustainable practices towards operational performance and sustainability performance. Final outcomes reveal that moderating effect of product modularity solid than the idea of Wang et al. (2022) [65] that modularity enables more autonomous and efficient reconfiguration, and thus, can magnify the sustainable and operational role by focal firms. Moreover, SCV supports those firms that have high modularity in products. Even high modularity in a product may affect the speed and accuracy of operations and procedures for manufacturing firms [66]. Higher modularity in a product might not be advantageous for adopting and implementing SPr. This study recommended manufacturers implement SCV tactics at a high level to reduce modularity’s adverse effects. Modularity has been shown to improve company performance by influencing the integration of supply chain members for higher visibility. A positive effect of SCV shows that moderating influence of high visibility and innovation for high-modular design becomes informal. High visibility may handle any product modularity when using sustainable practices to boost company operations. Outcomes comprehended that the visibility tactic facilitates the SPr to improve the firm’s operations and sustainable issues by a high sharing rate. Visibility is particularly advantageous for businesses with more modular product designs. Sustainable business practices had a greater impact on OP than SP, indicating that performance in terms of sustainability will rise as business operations get more sophisticated and improved. Consequently, the availability of SCV would be a quick approach for a company to adopt and apply sustainable practices. Thus, findings support supply chain sustainability and contribute to SSCM literature on sustainability strategies and outcomes.
Overall hypothesized direct interactions between supply chain pressure, technological pressure, sustainable practices, operational performance, and sustainability performance are confirmed. SEM analysis and results were relatively favorable to the proposed model. However, this research explores PM and SCV’s moderating role in the link between SPr, OP, and SP in the literature of SSCM. To sum up the findings, the moderating effect of SCV on the associations from SCP (H5a) and TP (H5b) towards sustainable practices was insignificant and not supported. As SCV deals with information sharing among supply chain participants, the effect was limited. This occurred because of heated competition; supply chain members hid crucial information from their collaborators. Moreover, SCP and TP’s effects on SPr, OP, and SP are understudied, and this study explored those effects. Thus, this survey shows that sustainable practices improve operational and sustainability performance under moderating effect of modularity and visibility. An additional contribution of study is to assessed SCP and TP’s ability to adopt sustainable practices and found favorable links to SPr. SCP and TP support sustainable practices which means supply chain partners can pressure small firms to implement practices. Similar to previous studies, adopting sustainable practices benefits the firm’s sustainability and operational performance [4]. Manufacturing enterprises’ key concern is sustainability in emerging economies, and larger firms can pressurize small businesses. For example, for sustainable development, large companies can implement sustainability rules if they realize sustainable practices are advantageous. Sustainability development promotes adopting sustainable practices in a supply chain network, all focus enterprises may benefit from reducing external pressures. TP influences sustainable practices more than SCP. Therefore, if large companies install more advanced technology, small businesses will experience more pressure.
5. Research Implications
5.1. Theoretical Implications
Theoretically, this study is an addition to the literature by focusing on effect of product modularity and visibility notion in supply chain for the operational and sustainability performance of manufacturing SMEs in Pakistan. The current investigation contributes theoretically by employing RBV and DC theories that focus on a firm’s internal resources and capabilities, such as people, technology, and infrastructure. Our work highlights how SMEs create significant SCV to implement sustainable practices to improve sustainable and operational difficulties under high/low modularity in a product. First, this study can help SMEs by including SCV as a strategic resource. Second, our study provides better insights into SCV and PM on how companies can manage operational and sustainable problems with high modularity and visibility during sustainable practices. For example, SCV allows a company to track sustainable and operational concerns, clarifying the link between sustainable practices and operational and sustainable performance. PM enables a firm to handle high modularity by reducing uncertainties and risks in operations. Thus, SMEs should have high information sharing to handle the higher impact of modularity to achieve better overall firm performance. Third, this investigation reveals supply chain and technology pressures for implementing sustainable practices to improve the firm’s performance. Sustainable practices help SMEs handle operational and sustainability issues, so implementing SPr is essential for small firms. For example, SCP and TP’s sustainability initiatives may provide a sustainable competitive advantage if related benefits are more considerable than costs.
5.2. Managerial Implications
For managers, the findings offer different kinds of recommendations. First, current work explored sustainable practices and proposed that corporate administrations outline their ideas for SPE’s impacts. The management implication stems from a study assessing sustainable practices’ effect on a firm’s performance outcomes [50]. Second, this work helps managers recognize SCP and TP’s assistance. Practically, managers are responsible for their organizations’ performance. They must understand pressures by keeping up with competitors, supply chain members, etc. Third, sustainable practices require managers with strong SCV and PM skills. This is because SCV and PM have moderating effect for operational and sustainability performances, which should be tackled creatively for long-term success. Lastly, modularity, operational, and sustainability challenges can be solved through sharing information. Managers should learn about the SPr, SCV, PM, SCP, and TP innovation on performance measurements may generate hurdles for managers’ firms.
6. Conclusions
According to final outcomes, this investigation concludes that product modularity and supply chain visibility moderates all direct relationship among SCP, TP, SPr, OP, and SP constructs. The national manufacturing sector of Pakistan is concerned about operational and sustainable problems. The manufacturing sector needs an impulse behavior to adopt all those policies, which help improve the firm’s performance. Furthermore, a sustainable economy needs a strong manufacturing sector. Small companies should gather knowledge and information from business partners to strengthen the manufacturing sector. Small producers with a high degree of modularity should be given more exposure. Moreover, media awareness is required to raise and comprehend the environmental protection measures for society.
This investigation does have some limitations. First, this work is chosen the manufacturing sector for data collection. In the future, other sectors of Pakistan or any country can be chosen, such as banking, oil, gas, and transport. Second, data were collected from the Punjab region, Pakistan. This work could be extended to explore the scope of research to other regions for extensive results. Third, in this work, supply chain and technological pressure (external pressure) were considered to investigate the impacts on sustainable practices. This research model could be improved by including internal pressures for sustainability performance for future work. The final limitation of this work is the product modularity concept. In the future, Additional ideas about the product, such as its innovativeness and complexity, can be researched.
Author Contributions
Z.A.S. conceptualized, investigated, data curation, and designed the study. L.Q. supervised, review, edited, and funded the study. Z.A.S., G.L. and R.M. conducted the survey. L.Q. performed the statistical analysis. R.M. and G.L. review and edit the final draft. L.Q. and G.L. also provide funding for the current study. All authors have read and agreed to the published version of the manuscript.
Funding
This work is supported by the Stability support fund of Shenzhen colleges and universities, Shenzhen Technology University (SZWD2021014); Research on Guidance Management of Travel Demand in the Metropolitan Bay Area based on Travel Pattern (Philosophy and Social Science Planning Project of Guangdong Province under Grant No. GD20CGL30); and Development and Application of Simulation System of Travel Behavior based on Data Fusion in the Context of V2X (Natural Science Foundation of Top Talent of SZTU under Grant No. 20200218).
Institutional Review Board Statement
Not applicable.
Informed Consent Statement
Informed consent was obtained from all subjects involved in the study.
Data Availability Statement
Data will be available upon reasonable request from Corresponding Authors.
Conflicts of Interest
The authors declare no conflict of interest.
Appendix A. Measurement Scales Items
| Variables | Code | Scale Items |
| Sustainable practices | SPr1 | Our firm is supporting sustainable practices to produce environmentally friendly products. |
| SPr2 | Our firm has a clear environmental policy statement | |
| SPr3 | Our firm has adopted sustainable practices for the procurement process | |
| SPr4 | Our firm has adopted sustainable practices for the manufacturing process | |
| SPr5 | Our firm has adopted sustainable practices for product distribution | |
| Operational performance | OP1 | Increase amount of goods delivered on time |
| OP2 | Decrease inventory levels | |
| OP3 | Decrease scrap rate | |
| OP4 | Promote products’ quality | |
| OP5 | Increased product line | |
| Supply Chain Visibility | SCV1 | Share information and different points regular meetings with the supplier |
| SCV2 | Shares information on upcoming product-related changes with the supplier | |
| SCV3 | Shares information on market trends and forecasts with the supplier | |
| SCV4 | Shares information about ordering with supplier | |
| SCV5 | Shares information about production schedules with supplier | |
| SCV6 | Shares information about material requirements with supplier. | |
| Sustainable performance | SP1 | Our firm has reduced the greenhouse gases |
| SP2 | our firm pays significant attention to the sanitation at the workplace, offices, and lavatories | |
| SP3 | Our firm has reduced the wastes | |
| SP4 | Our firm has decreased the cost for materials purchasing | |
| SP5 | Our firm has decreased the cost for disposal of hazardous materials | |
| SP6 | Our firm has decreased the cost for disposal of hazardous materials | |
| SP7 | Our organization believes in gender equality | |
| Product modularity | PM1 | Our product uses a modularized design |
| PM2 | Our production process can be adjusted by adding new process modules | |
| PM3 | Production process modules can be adjusted for changing production needs | |
| PM4 | Production process modules can be rearranged so that the customization sub-process occur last | |
| Supply chain pressure | SCP1 | Supplier’s advances in developing environmentally friendly goods |
| SCP2 | Supplier’s advances in developing environmentally-friendly packages | |
| SCP3 | Environmental partnership with suppliers | |
| SCP4 | Enterprise’s environmental mission of suppliers | |
| Technological pressure | TP1 | We have incorporated real-time process control into our production systems. |
| TP2 | We utilize production technology that is among the most flexible in our industry. | |
| TP3 | We apply computer-enhanced technology to improve the flexibility of manufacturing | |
| TP4 | We reorganize our facilities as necessary to increase our manufacturing flexibility. |
References
- Adekunle, S.A.; Dakare, O. Sustainable Manufacturing Practices and Performance of the Nigerian Table Water Industry: A Structural Equation Modeling Approach. Manag. Environ. Qual. Int. J. 2020, 31, 1003–1022. [Google Scholar] [CrossRef]
- Hashim, M.; Nazam, M.; Zia-Ur-Rehman, M.; Abrar, M.; Baig, S.A.; Nazim, M.; Hussain, Z. Modeling Supply Chain Sustainability-Related Risks and Vulnerability: Insights from the Textile Sector of Pakistan. Autex Res. J. 2022, 22, 123–134. [Google Scholar] [CrossRef]
- Koberg, E.; Longoni, A. A Systematic Review of Sustainable Supply Chain Management in Global Supply Chains. J. Clean. Prod. 2019, 207, 1084–1098. [Google Scholar] [CrossRef]
- Hong, J.; Zhang, Y.; Ding, M. Sustainable Supply Chain Management Practices, Supply Chain Dynamic Capabilities, and Enterprise Performance. J. Clean. Prod. 2018, 172, 3508–3519. [Google Scholar] [CrossRef]
- Ghobakhloo, M. The Future of Manufacturing Industry: A Strategic Roadmap toward Industry 4.0. J. Manuf. Technol. Manag. 2018, 29, 910–936. [Google Scholar] [CrossRef] [Green Version]
- Khan, S.A.R.; Godil, D.I.; Jabbour, C.J.C.; Shujaat, S.; Razzaq, A.; Yu, Z. Green Data Analytics, Blockchain Technology for Sustainable Development, and Sustainable Supply Chain Practices: Evidence from Small and Medium Enterprises. Ann. Oper. Res. 2021, 1–25. [Google Scholar] [CrossRef]
- Cole, R.; Stevenson, M.; Aitken, J. Blockchain Technology: Implications for Operations and Supply Chain Management. Supply Chain. Manag. 2019, 24, 469–483. [Google Scholar] [CrossRef] [Green Version]
- Silveira, C.; Reis, L. Sustainability in Information and Communication Technologies; IGI Global: Hershey, PA, USA, 2022; Volume 2, ISBN 9781668438862. [Google Scholar]
- Nizam, H.A.; Zaman, K.; Khan, K.B.; Batool, R.; Khurshid, M.A.; Shoukry, A.M.; Sharkawy, M.A.; Aldeek, F.; Khader, J.; Gani, S. Achieving Environmental Sustainability through Information Technology: “Digital Pakistan” Initiative for Green Development. Environ. Sci. Pollut. Res. 2020, 27, 10011–10026. [Google Scholar] [CrossRef]
- Kahouli, B.; Nafla, A.; Trimeche, H.; Kahouli, O. Understanding How Information and Communication Technologies Enhance Electric Power Consumption and Break Environmental Damage to Reach Sustainable Development. Energy Build. 2022, 255, 111662. [Google Scholar] [CrossRef]
- Somapa, S.; Cools, M.; Dullaert, W. Characterizing Supply Chain Visibility—A Literature Review. Int. J. Logist. Manag. 2018, 29, 308–339. [Google Scholar] [CrossRef]
- Wei, H.-L.; Wang, E.T.G. Creating Strategic Value from Supply Chain Visibility-the Dynamic Capabilities View. In Proceedings of the 2007 40th Annual Hawaii International Conference on System Sciences (HICSS’07), Waikoloa, HI, USA, 3–6 January 2007; p. 7. [Google Scholar]
- Kamble, S.S.; Gunasekaran, A.; Gawankar, S.A. Achieving Sustainable Performance in a Data-Driven Agriculture Supply Chain: A Review for Research and Applications. Int. J. Prod. Econ. 2020, 219, 179–194. [Google Scholar] [CrossRef]
- Swift, C.; Guide, V.D.R.; Muthulingam, S. Does Supply Chain Visibility Affect Operating Performance? Evidence from Conflict Minerals Disclosures. J. Oper. Manag. 2019, 65, 406–429. [Google Scholar] [CrossRef]
- Gualandris, J.; Longoni, A.; Luzzini, D.; Pagell, M. The Association between Supply Chain Structure and Transparency: A Large-Scale Empirical Study. J. Oper. Manag. 2021, 67, 803–827. [Google Scholar] [CrossRef]
- Montecchi, M.; Plangger, K.; West, D.C. Supply Chain Transparency: A Bibliometric Review and Research Agenda. Int. J. Prod. Econ. 2021, 238, 108152. [Google Scholar] [CrossRef]
- Baah, C.; Agyeman, D.O.; Acquah, I.S.K.; Agyabeng-Mensah, Y.; Afum, E.; Issau, K.; Ofori, D.; Faibil, D. Effect of Information Sharing in Supply Chains: Understanding the Roles of Supply Chain Visibility, Agility, Collaboration on Supply Chain Performance. Benchmarking Int. J. 2021, 29, 434–455. [Google Scholar] [CrossRef]
- Papert, M.; Rimpler, P.; Pflaum, A. Enhancing Supply Chain Visibility in a Pharmaceutical Supply Chain: Solutions Based on Automatic Identification Technology. Int. J. Phys. Distrib. Logist. Manag. 2016, 46, 859–884. [Google Scholar] [CrossRef]
- Song, M.L.; Fisher, R.; Wang, J.L.; Cui, L.B. Environmental Performance Evaluation with Big Data: Theories and Methods. Ann. Oper. Res. 2018, 270, 459–472. [Google Scholar] [CrossRef]
- Busse, C.; Schleper, M.C.; Weilenmann, J.; Wagner, S.M. Extending the Supply Chain Visibility Boundary: Utilizing Stakeholders for Identifying Supply Chain Sustainability Risks. Int. J. Phys. Distrib. Logist. Manag. 2017, 47, 18–40. [Google Scholar] [CrossRef]
- Maghsoudi, A.; Pazirandeh, A. Visibility, Resource Sharing and Performance in Supply Chain Relationships: Insights from Humanitarian Practitioners. Supply Chain. Manag. 2016, 21, 125–139. [Google Scholar] [CrossRef]
- Martin, D.M.; Leeuw, T.; de Haefliger, S. The Product Modularity Paradox: Collaboration and Innovation in R&D Teams. Acad. Manag. Proc. 2019, 1, 14051. [Google Scholar] [CrossRef]
- Huang, Y.C.; Borazon, E.Q.; Liu, J.M. Antecedents and Consequences of Green Supply Chain Management in Taiwan’s Electric and Electronic Industry. J. Manuf. Technol. Manag. 2021, 32, 1066–1093. [Google Scholar] [CrossRef]
- Prieto-Sandoval, V.; Jaca, C.; Santos, J.; Baumgartner, R.J.; Ormazabal, M. Key Strategies, Resources, and Capabilities for Implementing Circular Economy in Industrial Small and Medium Enterprises. Corp. Soc. Responsib. Environ. Manag. 2019, 26, csr.1761. [Google Scholar] [CrossRef] [Green Version]
- Sun, Y.; Zhong, Q. How Modularity Influences Product Innovation: The Mediating Role of Module Suppliers’ Relationship-Specific Investments. Manag. Decis. 2020, 58, 2743–2761. [Google Scholar] [CrossRef]
- Wang, S.; Li, J.; Song, J.; Li, Y.; Sherk, M. Institutional Pressures and Product Modularity: Do Supply Chain Coordination and Functional Coordination Matter? Int. J. Prod. Res. 2018, 56, 6644–6657. [Google Scholar] [CrossRef]
- Larsen, M.S.S.; Andersen, A.L.; Nielsen, K.; Brunoe, T.D. Modularity in Product-Service Systems: Literature Review and Future Research Directions. IFIP Adv. Inf. Commun. Technol. 2018, 535, 150–158. [Google Scholar] [CrossRef]
- Piran, F.A.S.; Lacerda, D.P.; Camargo, L.F.R.; Dresch, A. Effects of Product Modularity on Productivity: An Analysis Using Data Envelopment Analysis and Malmquist Index. Res. Eng. Des. 2020, 31, 143–156. [Google Scholar] [CrossRef]
- Seles, B.M.R.P.; Mascarenhas, J.; Lopes de Sousa Jabbour, A.B.; Trevisan, A.H. Smoothing the Circular Economy Transition: The Role of Resources and Capabilities Enablers. Bus. Strategy Environ. 2022, 31, 1814–1837. [Google Scholar] [CrossRef]
- Brush, T.H.; Artz, K.W. Toward a Contingent Resource-Based Theory: The Impact of Information Asymmetry on the Value of Capabilities in Veterinary Medicine. Strateg. Manag. J. 1999, 20, 223–250. [Google Scholar] [CrossRef]
- Yuen, K.F.; Wang, X.; Wong, Y.D.; Ma, F. A Contingency View of the Effects of Sustainable Shipping Exploitation and Exploration on Business Performance. Transp. Policy 2019, 77, 90–103. [Google Scholar] [CrossRef]
- Sirmon, D.G.; Hitt, M.A. Contingencies within Dynamic Managerial Capabilities: Interdependent Effects of Resource Investment and Deployment on Firm Performance. Strateg. Manag. J. 2009, 30, 1375–1394. [Google Scholar] [CrossRef]
- Stoyanova, V. An Analysis of David J. Teece’s Dynamic Capabilites and Strategic Management: Organizing for Innovation and Growth. In An Analysis of David J. Teece’s Dynamic Capabilities and Strategic Management; Routledge: Milton Park, UK, 2018. [Google Scholar] [CrossRef]
- Teece, D.J. Business Models and Dynamic Capabilities. Long Range Plan. 2018, 51, 40–49. [Google Scholar] [CrossRef]
- Barney, J. Firm Resources and Sustained Competitive Advantage. J. Manag. 1991, 17, 99–120. [Google Scholar] [CrossRef]
- Zhu, Q.; Sarkis, J.; Lai, K.H. Green Supply Chain Management Implications for “Closing the Loop”. Transp. Res. E Logist. Transp. Rev. 2008, 44, 1–18. [Google Scholar] [CrossRef]
- Vidal, N.G.; Spetic, W.; Croom, S.; Marshall, D. Supply Chain Stakeholder Pressure for the Adoption of Sustainable Supply Chain Practices: Examining the Roles of Entrepreneurial and Sustainability Orientations. Supply Chain. Manag. 2022. ahead-of-print. [Google Scholar] [CrossRef]
- Samad, S.; Nilashi, M.; Almulihi, A.; Alrizq, M.; Alghamdi, A.; Mohd, S.; Ahmadi, H.; Syed Azhar, S.N.F. Green Supply Chain Management Practices and Impact on Firm Performance: The Moderating Effect of Collaborative Capability. Technol. Soc. 2021, 67, 101766. [Google Scholar] [CrossRef]
- Shafiq, A.; Ahmed, M.U.; Mahmoodi, F. Impact of Supply Chain Analytics and Customer Pressure for Ethical Conduct on Socially Responsible Practices and Performance: An Exploratory Study. Int. J. Prod. Econ. 2020, 225, 107571. [Google Scholar] [CrossRef]
- Singh, H.; Garg, R.; Sachdeva, A. Investigating the Interactions among Benefits of Information Sharing in Manufacturing Supply Chain. Uncertain Supply Chain Manag. 2018, 6, 255–270. [Google Scholar] [CrossRef]
- Cousins, P.D.; Lawson, B.; Petersen, K.J.; Fugate, B. Investigating Green Supply Chain Management Practices and Performance: The Moderating Roles of Supply Chain Ecocentricity and Traceability. Int. J. Oper. Prod. Manag. 2019, 39, 767–786. [Google Scholar] [CrossRef]
- Marshall, D.; McCarthy, L.; Claudy, M.; McGrath, P. Piggy in the Middle: How Direct Customer Power Affects First-Tier Suppliers’ Adoption of Socially Responsible Procurement Practices and Performance. J. Bus. Ethics 2019, 154, 1081–1102. [Google Scholar] [CrossRef] [Green Version]
- Matthews, P.; Greenspan, S. Technology Definitions. In Automation and Collaborative Robotics; Springer: Berlin/Heidelberg, Germany, 2020; pp. 45–67. [Google Scholar]
- Park, A.; Li, H. The Effect of Blockchain Technology on Supply Chain Sustainability Performances. Sustainability 2021, 13, 1726. [Google Scholar] [CrossRef]
- Kot, S. Sustainable Supply Chain Management in Small and Medium Enterprises. Sustainability 2018, 10, 1143. [Google Scholar] [CrossRef] [Green Version]
- Francisco, K.; Swanson, D. The Supply Chain Has No Clothes: Technology Adoption of Blockchain for Supply Chain Transparency. Logistics 2018, 2, 2. [Google Scholar] [CrossRef] [Green Version]
- Bacinello, E.; Tontini, G.; Alberton, A. Influence of Corporate Social Responsibility on Sustainable Practices of Small and Medium-Sized Enterprises: Implications on Business Performance. Corp. Soc. Responsib. Environ. Manag. 2021, 28, 776–785. [Google Scholar] [CrossRef]
- Saqib, Z.A.; Zhang, Q. Impact of Sustainable Practices on Sustainable Performance: The Moderating Role of Supply Chain Visibility. J. Manuf. Technol. Manag. 2021, 32, 1421–1443. [Google Scholar] [CrossRef]
- Silva, G.M.; Gomes, P.J.; Sarkis, J. The Role of Innovation in the Implementation of Green Supply Chain Management Practices. Bus. Strategy Envrion. 2019, 28, 819–832. [Google Scholar] [CrossRef]
- Schmidt, C.G.; Foerstl, K.; Schaltenbrand, B. The Supply Chain Position Paradox: Green Practices and Firm Performance. J. Supply Chain. Manag. 2017, 53, 3–25. [Google Scholar] [CrossRef]
- Yu, J.; Lo, C.W.-H.; Li, P.H.Y. Organizational Visibility, Stakeholder Environmental Pressure and Corporate Environmental Responsiveness in China. Bus. Strategy Environ. 2017, 26, 371–384. [Google Scholar] [CrossRef]
- Wang, Z.; Zhang, M. Linking Product Modularity to Supply Chain Integration and Flexibility. Prod. Plan. Control 2019, 31, 1149–1163. [Google Scholar] [CrossRef]
- Saeed, K.A.; Malhotra, M.K.; Abdinnour, S. How Supply Chain Architecture and Product Architecture Impact Firm Performance: An Empirical Examination. J. Purch. Supply Manag. 2019, 25, 40–52. [Google Scholar] [CrossRef]
- Caridi, M.; Pero, M.; Sianesi, A. Linking Product Modularity and Innovativeness to Supply Chain Management in the Italian Furniture Industry. Int. J. Prod. Econ. 2012, 136, 207–217. [Google Scholar] [CrossRef]
- Lau, A.K.W.; Yam, R.C.M.; Tang, E. The Impact of Product Modularity on New Product Performance: Mediation by Product Innovativeness. J. Prod. Innov. Manag. 2011, 28, 270–284. [Google Scholar] [CrossRef]
- Seyoum, B. Product Modularity and Performance in the Global Auto Industry in China: The Mediating Roles of Supply Chain Integration and Firm Relative Positional Advantage. Asia Pac. Bus. Rev. 2020, 27, 651–676. [Google Scholar] [CrossRef]
- Hair, J.J.F.; Howard, M.C.; Nitzl, C. Assessing Measurement Model Quality in PLS-SEM Using Confirmatory Composite Analysis. J. Bus. Res. 2020, 109, 101–110. [Google Scholar] [CrossRef]
- Cheung, G.W.; Wang, C. Current Approaches for Assessing Convergent and Discriminant Validity with SEM: Issues and Solutions. Acad. Manag. Proc. 2017, 2017, 12706. [Google Scholar] [CrossRef]
- Zhu, Q.; Sarkis, J.; Geng, Y. Green Supply Chain Management in China: Pressures, Practices and Performance. Int. J. Oper. Prod. Manag. 2005, 25, 449–468. [Google Scholar] [CrossRef] [Green Version]
- Wei, H.-L.L.; Wang, E.T.G.G. The Strategic Value of Supply Chain Visibility: Increasing the Ability to Reconfigure. Eur. J. Inf. Syst. 2010, 19, 238–249. [Google Scholar] [CrossRef]
- Tracey, M.; Vonderembse, M.A.; Lim, J.-S. Manufacturing Technology and Strategy Formulation: Keys to Enhancing Competitiveness and Improving Performance. J. Oper. Manag. 1999, 17, 411–428. [Google Scholar] [CrossRef]
- Carmines, E.G.; Zeller, R.A. Reliability and Validity Assessment, 17th ed.; Sage Publications: New York, NY, USA, 1979; Volume 17, ISBN 1452207712. [Google Scholar]
- Hair, J.J.F.; Ringle, C.; Sarstedt, M.; Gudergan, S.P. Advanced Issues in Partial Least Square Structural Equation Modeling; Sage Publications: New York, NY, USA, 2017. [Google Scholar]
- Dijkstra, T.K.; Henseler, J. Consistent and Asymptotically Normal PLS Estimators for Linear Structural Equations. Comput. Stat. Data Anal. 2015, 81, 10–23. [Google Scholar] [CrossRef] [Green Version]
- Wang, Y.; Jia, T.; Chen, J.; Chen, Q. Does supplier involvement enhance financial performance? The encapsulation effects of product modularity and smartness. Supply Chain. Manag. 2022, 27, 144–161. [Google Scholar] [CrossRef]
- Chhetri, P.; Hashemi, A.; Lau, K.H.; Lim, M.K. Aligning supply chain complexity with product demand and design characteristics. Int. J. Logist. Res. Appl. 2022, 25, 1137–1163. [Google Scholar] [CrossRef]
Figure 1.
Combine Structural Model; where OP = operational performance, PM = product modularity, SCP = supply chain pressure, SCV = supply chain visibility, SP = sustainability performance, SPr = sustainable practices, TP = technological pressure.
Figure 1.
Combine Structural Model; where OP = operational performance, PM = product modularity, SCP = supply chain pressure, SCV = supply chain visibility, SP = sustainability performance, SPr = sustainable practices, TP = technological pressure.

Figure 2.
Demographical presentation of 490 responses.

Figure 3.
SEM results for the structural model without moderation (M1).

Figure 4.
SEM results for the structural model with moderation (M2). Red color numbers are insignificant.
Figure 4.
SEM results for the structural model with moderation (M2). Red color numbers are insignificant.


Table 1.
Descriptive statistics.
| Items | Mean | Standard Deviation | Excess Kurtosis | Skewness |
|---|---|---|---|---|
| TP1 | 4.018 | 0.784 | 1.52 | −0.773 |
| TP2 | 4.049 | 0.786 | 0.704 | −0.643 |
| TP3 | 4.027 | 0.786 | 0.974 | −0.679 |
| TP4 | 4.047 | 0.8 | 1.133 | −0.756 |
| SPr1 | 3.988 | 0.969 | 1.84 | −1.259 |
| SPr2 | 3.969 | 0.942 | 1.16 | −1.013 |
| SPr3 | 3.99 | 0.953 | 0.932 | −0.973 |
| SPr4 | 3.992 | 0.926 | 1.322 | −1.052 |
| SPr5 | 3.963 | 0.953 | 1.562 | −1.146 |
| OP1 | 3.967 | 0.951 | 1.068 | −0.976 |
| OP2 | 3.912 | 0.94 | 1.285 | −0.991 |
| OP3 | 3.976 | 0.921 | 1.425 | −1.052 |
| OP4 | 3.986 | 0.92 | 1.285 | −1.012 |
| OP5 | 4.027 | 0.92 | 1.513 | −1.11 |
| PM1 | 2.071 | 0.913 | 1.504 | 1.036 |
| PM2 | 2.053 | 0.909 | 1.33 | 0.992 |
| PM3 | 1.992 | 0.915 | 1.301 | 1.027 |
| PM4 | 2.051 | 0.912 | 1.115 | 0.935 |
| SCP1 | 4.188 | 0.817 | 1.737 | −1.058 |
| SCP2 | 4.153 | 0.774 | 2.469 | −1.093 |
| SCP3 | 4.173 | 0.791 | 1.983 | −1.064 |
| SCP4 | 4.118 | 0.82 | 1.702 | −0.981 |
| SCV1 | 4.276 | 0.619 | 3.44 | −0.936 |
| SCV2 | 4.308 | 0.62 | 0.966 | −0.631 |
| SCV3 | 4.271 | 0.631 | 3.894 | −1.024 |
| SCV4 | 4.267 | 0.679 | 3.31 | −1.096 |
| SCV5 | 4.282 | 0.644 | 0.191 | −0.526 |
| SCV6 | 4.269 | 0.62 | 3.981 | −0.977 |
| SP1 | 3.959 | 0.94 | 1.381 | −1.056 |
| SP2 | 3.969 | 0.937 | 1.476 | −1.087 |
| SP3 | 3.978 | 0.929 | 1.047 | −0.967 |
| SP4 | 3.949 | 0.932 | 1.467 | −1.066 |
| SP5 | 3.931 | 0.949 | 1.137 | −0.981 |
| SP6 | 3.961 | 0.922 | 1.676 | −1.115 |
| SP7 | 3.99 | 0.900 | 1.125 | −0.957 |
Note: OP = operational performance, PM = product modularity, SCP = supply chain pressure, SCV = supply chain visibility, SP = sustainability performance, SPr = sustainable practices, TP = technological pressure.
Table 2.
Discriminant validity.
| Fornell–Larcker Criterion | |||||||
| OP | PM | SCP | SCV | SP | SPr | TP | |
| OP | 0.822 | ||||||
| PM | 0.468 | 0.834 | |||||
| SCP | 0.354 | 0.309 | 0.800 | ||||
| SCV | 0.202 | 0.213 | 0.033 | 0.746 | |||
| SP | 0.48 | 0.451 | 0.417 | 0.188 | 0.816 | ||
| SPr | 0.437 | 0.413 | 0.456 | 0.137 | 0.408 | 0.830 | |
| TP | 0.397 | 0.425 | 0.393 | 0.313 | 0.431 | 0.428 | 0.757 |
| Heterotrait–Monotrait ratio of correlations (HTMT) criterion | |||||||
| OP | PM | SCP | SCV | SP | SPr | TP | |
| OP | |||||||
| PM | 0.539 | ||||||
| SCP | 0.416 | 0.368 | |||||
| SCV | 0.205 | 0.223 | 0.072 | ||||
| SP | 0.539 | 0.513 | 0.486 | 0.188 | |||
| SPr | 0.493 | 0.475 | 0.535 | 0.155 | 0.456 | ||
| TP | 0.486 | 0.532 | 0.503 | 0.364 | 0.522 | 0.524 | |
Note: OP = operational performance, PM = product modularity, SCP = supply chain pressure, SCV = supply chain visibility, SP = sustainability performance, SPr = sustainable practices, TP = technological pressure.
Table 3.
EFA presentation.
| Items | OP | PM | SCP | SCV | SP | SPr | TP | SCR | AVE | Alpha | VIF |
|---|---|---|---|---|---|---|---|---|---|---|---|
| OP1 | 0.816 | 0.912 | 0.675 | 0.880 | 1.978 | ||||||
| OP2 | 0.839 | 2.135 | |||||||||
| OP3 | 0.836 | 2.198 | |||||||||
| OP4 | 0.802 | 1.889 | |||||||||
| OP5 | 0.816 | 2.021 | |||||||||
| PM1 | 0.846 | 0.902 | 0.696 | 0.854 | 1.987 | ||||||
| PM2 | 0.841 | 1.972 | |||||||||
| PM3 | 0.837 | 1.984 | |||||||||
| PM4 | 0.812 | 1.838 | |||||||||
| SCP1 | 0.815 | 0.877 | 0.641 | 0.813 | 1.743 | ||||||
| SCP2 | 0.791 | 1.657 | |||||||||
| SCP3 | 0.804 | 1.625 | |||||||||
| SCP4 | 0.792 | 1.658 | |||||||||
| SCV1 | 0.757 | 0.881 | 0.556 | 0.848 | 1.723 | ||||||
| SCV2 | 0.852 | 2.299 | |||||||||
| SCV3 | 0.810 | 2.167 | |||||||||
| SCV4 | 0.785 | 1.830 | |||||||||
| SCV5 | 0.650 | 1.788 | |||||||||
| SCV6 | 0.588 | 1.660 | |||||||||
| SP1 | 0.818 | 0.923 | 0.666 | 0.900 | 2.149 | ||||||
| SP3 | 0.820 | 2.180 | |||||||||
| SP4 | 0.808 | 2.101 | |||||||||
| SP5 | 0.817 | 2.202 | |||||||||
| SP6 | 0.820 | 2.187 | |||||||||
| SP7 | 0.813 | 2.094 | |||||||||
| SPr1 | 0.839 | 0.917 | 0.690 | 0.887 | 2.264 | ||||||
| SPr2 | 0.823 | 2.060 | |||||||||
| SPr3 | 0.814 | 1.994 | |||||||||
| SPr4 | 0.828 | 2.074 | |||||||||
| SPr5 | 0.848 | 2.331 | |||||||||
| TP1 | 0.752 | 0.843 | 0.573 | 0.751 | 1.406 | ||||||
| TP2 | 0.772 | 1.442 | |||||||||
| TP3 | 0.743 | 1.417 | |||||||||
| TP4 | 0.759 | 1.447 |
Note: OP = operational performance, PM = product modularity, SCP = supply chain pressure, SCV = supply chain visibility, SP = sustainability performance, SPr = sustainable practices, TP = technological pressure, alpha = Cronbach Alpha.
Table 4.
Model fitness presentation.
| Fitness Values | M1 | M2 |
|---|---|---|
| SRMR | 0.046 | 0.048 |
| d_ULS | 0.626 | 1.377 |
| d_G | 0.212 | 0.474 |
| Chi-square | 606.312 | 1300.855 |
| NFI | 0.897 | 0.849 |
Note: SRMR = Standardized Root Mean Square Residual, d_ULS = the squared Euclidean distance, d_G = the geodesic distance, and NFI = Normed Fit Index.
Table 5.
SEM results for both structural models.
| Paths | Coefficients (β) | Standard Deviation (STDEV) | T Statistics (|O/STDEV|) | p Values |
|---|---|---|---|---|
| Structural Model (M1) | ||||
| SCP -> SPr | 0.340 | 0.070 | 4.837 | 0.000 |
| SPr -> OP | 0.438 | 0.050 | 8.837 | 0.000 |
| SPr -> SP | 0.410 | 0.049 | 8.339 | 0.000 |
| TP -> SPr | 0.295 | 0.042 | 7.012 | 0.000 |
| Structural Model (M2) | ||||
| SCP -> SPr | 0.191 | 0.073 | 2.612 | 0.009 |
| SPr -> OP | 0.287 | 0.041 | 7.039 | 0.000 |
| SPr -> SP | 0.255 | 0.041 | 6.292 | 0.000 |
| TP -> SPr | 0.248 | 0.052 | 4.772 | 0.000 |
| SCV × SPr -> OP | 0.192 | 0.043 | 4.507 | 0.000 |
| SCV × SPr -> SP | 0.186 | 0.044 | 4.185 | 0.000 |
| SCV × SCP -> SPr | 0.045 | 0.041 | 1.098 | 0.273 |
| PM × SPr -> OP | 0.124 | 0.044 | 2.856 | 0.004 |
| PM × SPr -> SP | 0.136 | 0.042 | 3.241 | 0.001 |
| PM × TP -> SPr | −0.272 | 0.074 | 3.693 | 0.000 |
| PM × SCP -> SPr | 0.141 | 0.027 | 5.268 | 0.000 |
| SCV × TP -> SPr | 0.028 | 0.039 | 0.725 | 0.469 |
Note: OP = operational performance, PM = product modularity, SCP = supply chain pressure, SCV = supply chain visibility, SP = sustainability performance, SPr = sustainable practices, TP = technological pressure.
Disclaimer/Publisher’s Note: The statements, opinions and data contained in all publications are solely those of the individual author(s) and contributor(s) and not of MDPI and/or the editor(s). MDPI and/or the editor(s) disclaim responsibility for any injury to people or property resulting from any ideas, methods, instructions or products referred to in the content. |
© 2023 by the authors. Licensee MDPI, Basel, Switzerland. This article is an open access article distributed under the terms and conditions of the Creative Commons Attribution (CC BY) license (https://creativecommons.org/licenses/by/4.0/).
Share and Cite
MDPI and ACS Style
Saqib, Z.A.; Qin, L.; Menhas, R.; Lei, G. Strategic Sustainability and Operational Initiatives in Small- and Medium-Sized Manufacturers: An Empirical Analysis. Sustainability 2023, 15, 6330. https://doi.org/10.3390/su15076330
AMA Style
Saqib ZA, Qin L, Menhas R, Lei G. Strategic Sustainability and Operational Initiatives in Small- and Medium-Sized Manufacturers: An Empirical Analysis. Sustainability. 2023; 15(7):6330. https://doi.org/10.3390/su15076330
Chicago/Turabian StyleSaqib, Zulkaif Ahmed, Luo Qin, Rashid Menhas, and Gong Lei. 2023. "Strategic Sustainability and Operational Initiatives in Small- and Medium-Sized Manufacturers: An Empirical Analysis" Sustainability 15, no. 7: 6330. https://doi.org/10.3390/su15076330
Note that from the first issue of 2016, this journal uses article numbers instead of page numbers. See further details here.