Article

Evaluation, Regional Disparities and Driving Mechanisms of High-Quality Agricultural Development in China

1
School of Economics, Hunan Agriculture University, Changsha 410125, China
2
Bangor College, Central South University of Forestry and Technology, Changsha 410004, China
*
Author to whom correspondence should be addressed.
Sustainability 2023, 15(7), 6328; https://doi.org/10.3390/su15076328
Submission received: 1 March 2023 / Revised: 2 April 2023 / Accepted: 4 April 2023 / Published: 6 April 2023

Abstract

:
Based on China’s new development philosophy and the connotation of high-quality agricultural development, this study constructed a six-dimensional comprehensive evaluation framework: innovation-effectiveness-sustainability-coordination-openness-sharing. The spatio-temporal-range-improved entropy approach and the Dagum Gini coefficient were applied to evaluate and analyze the level of regional disparities and the dynamic distribution characteristics of high-quality agricultural development in China in the period from 2010 to 2018. The result shows that the level of high-quality agricultural development in China has steadily improved in general, but there exist prominent structural problems. Concerning regional differences, it indicated a pattern dominated by the pattern of “high in the east and low in the west”, mainly arising from the inter-regional disparity, with a gradual downward trend during the selected period. This study also comprehensively explored the four-dimensional driving mechanisms (production conditions, productivity, production relations, and production efficiency), and further examined the driving paths of various variables and regional heterogeneity using a panel Tobit model.

1. Introduction

From quantity to quality, from speed to structure, from economy to the “five-in-one” of economy, society, politics, culture, and ecology [1,2], the concept of development has gradually been expanded in multiple dimensions, and the world has entered a new development stage. In China, high-quality economic development and people’s high quality of life have formed a new “double high” system. This has posed new requirements and challenges to the country’s agricultural development. In 2021, China’s total agricultural output amounted to RMB 18,441.9 billion, an increase of 4.5% year-on-year. The total national grain production was 683 million tons and it had achieved 18 consecutive years of good yields. However, while the total agricultural output is high and stable, weaknesses such as the lagging adjustment of the agricultural industry structure, the insufficient integration of the agriculture, manufacturing, and service industries in rural areas, and the increasing cost but low international competitiveness of agriculture are becoming increasingly prominent. Under the dual pressure of resource scarcity and environmental conflicts, the low production and operational efficiency urgently call for a change in the agricultural development mode and growth momentum. At this important stage of China’s development, high-quality agricultural development has become the core support of domestic and international dual circulation and a key engine in promoting agricultural and rural modernization.
Considerable research efforts have been devoted to the high-quality agricultural development (HQAD) of countries. Great progress has been made in the connotation traits, the evaluation and analysis of the measurement, influencing factors, and pathways, with more qualitative analysis than quantitative research. First, regarding the connotation of high-quality agricultural development, scholars have widely agreed upon a set of basic ideas. The systematic discussion mainly focuses on “high”, “quality”, “multi-dimensionality”, “new functions” [3,4,5], etc. The dilemmas of agricultural development have intensified, ranging from high cost versus efficiency, poor foundations versus rapid development, to high yield versus environmental protection [6]. Therefore, more scholars have proposed multidimensional optimization paths based on land, science, technology, judiciary, and fiscal policy [5,7,8,9] in the institutionalized manner. Second, in terms of quantitative research, there is relatively limited exploration that directly addresses high-quality agricultural development. However, the concept of quality development embedded in the quantitative assessment of agricultural modernization [10], sustainable agricultural development [11], and agricultural productivity [12] has far-reaching implications for subsequent research. With specific regard to the measurement and evaluation of HQAD, early scholars used a single indicator, e.g., TFP, or selected a sub-dimension as the focus [13]. Other scholars have generally constructed the comprehensive analytical framework [3,14], and further conducted analysis of variability among regions, spatial-temporal dynamic distribution, and evolutionary forecasts based on the measurement results [15,16,17]. Third, research on the influencing factors of HQAD shows the characteristics of diversity. Using a spatial econometric model, Liu et al. (2020) selected seven categories of variables, including urbanization and economic development, to conduct an analysis of the influencing factors [18]. Ji (2021) has conducted the measurement and diagnosis of provincial spatial differences, and examined factors affecting HQAD in six aspects, confirming that the driving effects are spatially heterogeneous [19]. Additionally, many scholars believe that foreign direct investment, digital technology, a socialized service system, industrial integration, and industry innovation [20,21,22,23,24] have significant positive impacts on HQAD.
Given the current state of the research literature discussed above, this study is expected to develop breakthroughs and make several vital contributions in the following three aspects. First, we systematically summarize the intrinsic philosophy of high-quality agricultural development to construct a multi-dimensional and comprehensive evaluation framework, by balancing the perspectives of micro and macro, long-term and short-term, speed and efficiency, economic growth, and social development. All the indicators selected are result-oriented. This is because, from one perspective, criteria for determining the quality of agriculture should be the final output, thereby capturing the statistical substance accurately. On another perspective, it avoids process indicators with high inputs that would obscure the undesired results of low outputs. Second, regarding the research methodology, the study applied the spatio-temporal range entropy-based approach. This method is more suitable for panel data processing, to compensate for the limitations of the traditional entropy method in the time dimension, reflecting the dynamic spatial and temporal variations and distributions. Although regional comparisons based on measurement results are not found infrequently in the previous literature, there exist some gaps. By adopting the Dagum Gini coefficient, the study further investigates the spatial variability and the sources of HQAD in China, revealing the dynamic distribution characteristics of agricultural quality across regions. Finally, the existing kinds of literature on the influencing factors of HQAD are mainly focused on a single variable or a few variables. Little consideration has been given to the categorization of the factors, and there is a lack of exploration of the driving mechanisms. Therefore, this study comprehensively explores the driving mechanisms of HAQD from four dimensions, including production conditions, productivity, production relations, and production efficiency. The panel Tobit model was also used to further examine the driving paths of various variables and regional heterogeneity. Taken together, the purpose of this paper is to provide effective suggestions for exploring possible paths to promote high-quality and sustainable agriculture in the rapid development stage of the world economy.

2. Conceptual Framework

2.1. Concept and Composition of HQAD

High-quality agricultural development (HQAD) is a reflection of the inherent nature and laws of the development of the agricultural economy. It refers to the transformation and upgrading of agriculture with new systems, mechanisms, dynamics, subjects, and new business models, to achieve a high degree of consistency in the “efficiency, sustainability and balance” of agriculture.
High quality in efficiency refers to high production efficiency, high industrial effectiveness and high returns for farmers. By improving the efficiency of agricultural resource allocation and enhancing the driving role of science and technology innovation, total factor productivity will be strongly improved and a modern agricultural system will be constructed. The added value of agricultural products will be increased, the industrial chain will be extended, and a new pattern of diversification and better integration of industries will be formed. Ultimately, farmers could share the value-added benefits of the agricultural industry chain, such as high quality in sustainability, which includes sustainable supply, sustainable ecology, and sustainable competitiveness. This guarantees a stable scale and quality of agricultural output, with consistent enhancement of the added value of agricultural products and services. Agriculture can be developed continuously at a moderate pace, and transformed from a resource-dependent traditional model to an intensive and sustainable one, with high quality in balance, which involves a balance between industrial structure, factor mix, and trading structure. The rationalization of the agricultural structure is the foundation of economic performance improvement and high-quality development. The balance within and between the various proportional relationships affects the overall coordination of the agricultural economy.
From the system engineering perspective, high-quality agricultural development can be seen as an organic whole. With the new development philosophy [25] of the Chinese government as a guideline, HQAD can be divided into six dimensions: innovation-effectiveness-sustainability-coordination-openness-sharing. Table 1 shows this best, reflecting intrinsic implications.
The Innovation dimension is reflected in the following three areas. First, organizational innovation: optimizing the new system of agricultural operation by developing diversified forms of moderate scale operation and socialized services modern operation. Second, scientific and technological innovation: through the development and promotion of agricultural technology, superior varieties, and new processing methods, enhancing production capacity with resource consumption reduction. Third, industrial and business innovation: transforming and upgrading traditional agriculture through big data and information technology, and developing new agricultural products; new industries, such as leisure agriculture; and new models, such as customized agriculture and e-commerce sales.
Effectiveness: first, this reflects the structural optimization and efficiency enhancement of production factor inputs, where the economic performance of agriculture can be further improved. Second, it indicates the supply of high-quality agricultural products to consumers, which enables it to meet the diversified expectations of the market for agricultural products, including green safety, variety diversification, branding, scarcity, and multi-functionality. Third, the growth rate of the agricultural economy should be consistent and stable, without drastic fluctuations.
Sustainability refers to accelerating the greenization of whole industrial chains and production patterns, promoting the realization of agro-ecological values, and creating a livable and comfortable environment. This dimension considers resource utilization and environmental safety.
Coordination: first, this is the coordination of industrial structure, which refers to the promotion of the integrated development of agriculture, manufacturing, and service industries in rural areas. Second, it is urban–rural coordination, which refers to promoting a balanced urban–rural relationship through high value-added agriculture and improving rural economic and social development.
Openness: this refers to facilitating the dynamic flow and aggregation of production factors across regions by adopting market mechanisms, so as to resolve the issue of the uneven distribution of resource endowments for agricultural development in part. It also includes the degree of dependence of agricultural products on foreign trade, reflecting the international competitiveness of agricultural products.
Sharing represents the development of rural infrastructure and the increased supply of rural public goods, which enable the improvement of farmers’ quality of life and the development of the rural areas. The expansion of market capacity and the widening of income generation channels allow farmers to access a more multifaceted stream of income activities, in addition to operational income.

2.2. Four-Dimensional Driving Mechanisms for HQAD

Differences in the production conditions of core resource element inputs exist in different regions. The synergistic evolution and upgrading of productivity, production relations, and production efficiency occur at all layers within and across industries. These constitute the entire dynamic mechanism for the development of the agricultural economy towards high quality (Figure 1).

2.2.1. Input–Output Mechanism: Production Efficiency Improvement

The primary driving force of agricultural economic development comes from the development of agricultural production and the factors of production (people, land, money, technology, information, infrastructure, etc.). The authors of [26] lay out the essential foundations which determine the performance and speed of HQAD. Specifically, agriculture is highly reliant on geographical location, climatic environment, and factor endowments. For example, regional disparities in arable land resources determine either decentralized or moderate-scale agricultural production patterns. Due to the scarcity and relative permanence of land resources, HQAD is increasingly dependent on the optimal allocation of agricultural labor productivity (new professional farmers, specialized agricultural technicians, etc.) and the guarantee of large amounts of capital input.

2.2.2. Regional Realization Mechanism: Production Condition Adaptation

China has followed an unbalanced path in its regional economic development strategy. Riding on the policy wind, the eastern region, with its advantageous location, has accelerated the process of regional industrialization, attracting a large number of capital and labor factors for concentration, and has become the development pole in China. However, there is a difficult and thorny road from “first to be rich” to “common prosperity”. There are significant variations between regions in terms of the economic development foundation, the factor endowment of rural agriculture, the construction of public infrastructure, the coordination of industrial structure, and the integration of urban and rural development [27]. The evolution of the spatial pattern of the agricultural industry has an influential effect on the efficiency of factor allocation, and there is an optimal interval for the contribution of industrial structural transformation to total factor productivity. In accordance with regional economic, social, and ecological conditions, it is required to establish a differentiated promotion mechanism with zone-based planning, step-by-step implementation, and hierarchical management. It is important to implement different strategies for integrated urban and rural development, in order to fully release the scale effect of industrial clusters, gathering momentum and empowering the high-quality development of regional agriculture.

2.2.3. Institutional Incentive Mechanism: Production Relations Optimization

The farmers’ demand for profit maximization induces institutional transformation into a highly efficient system, with more clearly defined property rights, more efficient production agents, better information channels, more scientific and effective decision-making methods, more equitable and reasonable distribution methods, and more comprehensive legal and market systems, which greatly liberate social productivity. These elements are closely linked and constitute an “incentive field” with internal interactions and feedback, thus producing a significant incentive effect on the entire production system.
HQAD includes not only the content of productivity, such as the industrial system, industrial structure and organization structure, but also the content of production relations, including the income distribution system, ownership forms of production means and resource allocation methods. Therefore, production relations and the corresponding institutional mechanisms have to be adjusted and restructured. In practice, the institutional environment of China’s agricultural development is mutually constructed by two mechanisms: the market mechanism and the government mechanism.

2.2.4. Technological Innovation Mechanism: Productivity Progress

Since the industrial revolution, market competition and the use of machinery have led to rapid improvements in agricultural technology, and have contributed to leaps in agricultural productivity [28]. Scientific and technological innovation can improve the efficiency of agricultural output while reducing environmental pollution, and can leverage positive externalities to drive coordinated regional agricultural development. The momentum of Chinese agricultural production has shifted from resource endowment inputs in the initial development stage and capital factor inputs in the deepening stage, to a reliance on modern technological innovation in agriculture. Agricultural productivity can be boosted by optimizing the resource allocation and production operations. The organic embedding of advanced factors in agricultural production can be achieved through the emergence and diffusion of technology, reducing the constraints on agricultural production imposed by traditional resource endowments [29], such as land constraints, labor shortages, and a lack of capital for innovative agents.

3. Evaluation and Regional Disparities of HQAD in China

3.1. Data

This paper measures the level of HQAD in China from 2010 to 2018 using provincial data (excluding Tibet, Taiwan, Hong Kong, and Macao). Data are obtained from the China Rural Statistical Yearbook, China Agricultural Yearbook, China Rural Management Statistical Annual Report, China Agricultural Machinery Industry Yearbook, China Leisure Agriculture Yearbook, as well as statistics from the Chinese Ministry of Agriculture and Rural Affairs and statistical bulletins from provinces, autonomous regions, and municipalities. Missing data were supplemented by the linear interpolation method.
To conduct a regional comparison and analysis, we classify the 30 provinces, municipalities, and autonomous regions in China into four regions: The east, northeast, central, and west. The east region refers to the nine eastern coastal provinces and municipalities, including Beijing, Tianjin, Shanghai, and Guangdong, with developed economies and higher levels of urbanization. The northeast region includes three provinces of Liaoning, Jilin, and Heilongjiang, which are China’s old industrial bases and major grain-producing regions. The central region includes six provinces including Jiangxi, Hunan, and Hubei. The west region includes 12 provinces, autonomous regions, and municipalities, including Inner Mongolia, Guangxi, Yunnan, and Xinjiang (excluding Tibet, due to data deficiency). The central and west regions are also known as the interior region. These regions are mostly less-developed and developing areas.

3.2. Methods

3.2.1. Multidimensional Evaluation Model

Based on the above theoretical connotation and relevant indicator frameworks in the existing literature [30,31], this study constructs a comprehensive evaluation framework for high-quality agricultural development (Table 1). Taking the new development philosophy as the guideline, this paper top-down reconstructs the overall goal of China’s HQAD into six primary subsystems, and further breaks down these subsystems into a total of 12 criterion layers. Following this, indicators are added and subtracted from the bottom up, taking into account the availability and consistency of the data. Finally, 29 specific quantifiable indicators are shown in Table 1. All the indicators selected in the evaluation system are result-oriented, because the criteria for determining the quality of agriculture should be the final output.
Among them, agricultural total factor productivity (TFP) was measured using the SFA-Malmquist model. The output index is the total agricultural output value (AOV), while the input index includes agricultural labor input, the sown area of crops, chemical fertilizer usage, agricultural mechanical input, and irrigation area. The nominal provincial AOV data are converted to real AOV data at constant 2000 prices.
In the Sustainability dimension, the agricultural disaster rate, the degree of air pollution, and the degree of water pollution in agriculture are selected to measure the results of environmental protection and safety in agriculture. The agricultural disaster rate indicator is subject not only to ‘natural attributes’, but also to the social attributes of agriculture’s own disaster-bearing systems, which can reflect the results of biodiversity conservation. The factors “degree of air pollution in agriculture” and “degree of water pollution in agriculture” examine whether agricultural development is sustainable in terms of environmental costs, following Han and Wei [30,31].
In measuring the degree of air pollution in agriculture, total agricultural carbon emissions include four aspects: the sum of carbon emissions from fertilizer, agriculture, mulch, diesel, and irrigation; nitrous oxide ( N 2 O ) emissions from agricultural soils (converted to CO 2 ); carbon emissions from livestock; and CH 4 emissions from rice paddies (converted to CO 2 ) [32].
The degree of agricultural water pollution is measured using agricultural non-point source pollution emissions. This includes three types of pollution discharges: TN, TP, and COD. As there are differences in the impact of different pollutants on water bodies, emissions are normalized and converted into equivalent pollution loads for comparative analysis [33]. The equivalent pollution load is given by:
P i = W i C i 0
where Pi is the equivalent pollution load of the ith agricultural non-point source pollutant, and Wi is the emission of the ith agricultural non-point source pollutant. Ci0 is the standard concentration value of the ith pollutant, referring to the National Environmental Quality Standard for Surface Water (GB3838-2002) for Class III water, where COD is 20 mg/L, TN is 1 mg/L, and TP is 0.2 mg/L.
The indicators selected are all results-oriented to guarantee the objectivity and reasonableness of the evaluation. The data used are generally given as ratios or averages to reduce the variation in economic volume between regions. The selection of indicators is irreplaceable, complementary, and supportive. The data are not excessively difficult to obtain and the overall workload for the comprehensive measurement is moderate.

3.2.2. Spatio-Temporal Range Entropy-Based Approach

Based on the multidimensional evaluation model above, an appropriate multi-index measurement method needs to be selected for converting various indicators into a comprehensive evaluation index.
According to the classic model of the entropy weight method [34,35,36], and following Yang et al. (2015) [37], an improved entropy method with the addition of time variables was used to objectively assign weights to each indicator in the panel data. It is possible to avoid the interference of subjective assignments and to eliminate the influence of time differences in certain ways. Therefore, the results can be compared between years and objectively reflect the development gaps among the research subjects. The method is explained below.
First, the range method is conducted for the raw data normalization. Positive and inverse indicators are standardized as below:
Positive   indicators :   y θ i j = x θ i j x j m i n x j m a x x j m i n
Inverse   indicators :   y θ i j = x j m a x x θ i j x j m a x x j m i n
where x θ i j is the j t h original value for province i in year θ ,   y θ i j is the standardized outcome value, and x j m i n and x j m a x are the minimum and maximum values of the j t h statistical indicator, respectively.
Second, since the base needs to be greater than 0 in logarithmic operations, the equation is made an overall translation, avoiding negative values or zeros in the normalization process [38]:
  y θ i j = y θ i j + a
Next, determine the weight of indicator j for the ith province and municipality in year θ:
P θ i j = y θ i j / θ i y θ i j   θ = 1 , 2 , , r ; i = 1 , 2 , , n
where r represents the number of years in the sample and n represents the number of provinces and municipalities. The sample includes data from China and its 30 provinces and municipalities from 2010–2018, so r = 9 and n = 31.
Following this, calculate the value of entropy and coefficient of variation for the j t h indicator.
  e j = k θ = 1 r i = 1 n P θ i j ln P θ i j
where k > 0, k = 1/ln(r × n). e j is the entropy value of the jth indicator, 0 e j 1.
d j = 1 e j
where d j is the coefficient of variation in indicator j. Larger values for d j indicate the relative importance of jth evaluation indicator and imply larger values for the entropy weight of jth indicator.
Fifth, we calculate the weight w j for the jth indicator.
w j = d j / j = 1 n d j
Finally, the multi-objective linear weighting function method was used to weigh all evaluation indicators. Calculate the comprehensive index and dimensional index for each subject:
F θ i = j w j y θ i j

3.2.3. Dagum Gini Coefficient

This study adopts the Dagum Gini coefficient and its decomposition proposed by Dagum C (1997). This model [39] is used to compensate for the shortcomings of the traditional Gini and Thiel coefficients in terms of the sources of regional differences and the description of sample overlap.
The overall Gini coefficient G is decomposed into the contribution of intra-regional variation G w , the contribution of inter-regional net differences G nb and the contribution of hyper variable density G t , and satisfies G = G w + G nb + G t . The formula is as follows:
G = j = 1 k h = 1 k i = 1 n j r = 1 n h y j i y h r   2 n 2 μ
where y ji and y hr are the HQAD levels of any province i and r in regions j and h, respectively; μ is the national average; n is the sum of the number of provinces and municipalities in the region; k is the number of regional divisions; and n j , n h are the number of provinces in regions j and h.
In performing the Gini coefficient decomposition, it is necessary to first rank region k according to the mean of the HQAD measure (Equation (11)). Y ¯ refers to the mean evaluation level value within the study area.
  Y h ¯ Y j ¯ Y k ¯
Equations (12) and (13) represent the Gini coefficient G j j for region j and the intra-regional gap contribution G W , respectively. The formulae for the inter-regional Gini coefficient G jh , the inter-regional net value gap contribution G nb and the hypervariable density contribution G t are given in (14–16), respectively, where p j = n j n , s j = n j   ×   Y j ¯ ( n × Y ¯ ) , and j = 1 ,   2 , k .     S j refers to the j th region HQAD evaluation level value share [40]. D j h is the effect of relative HQAD levels between regions j and h; see Equation (17). d j h is defined as the difference in HQAD levels between regions, which is the mathematical expectation of the sum of all sample values in regions j, h with y j i y hr > 0 , as shown in Equation (18). p j h is the hypervariable first-order distance, when μ j > μ h , p j h is the weighted average of all ( y h r y ji ) under the condition of y h r y ji > 0 (Equation (19)). F j , F h are the cumulative density distribution functions for regions j and h, respectively.
G j j = i = 1 n j r = 1 n j y j i y j r 2 n j 2 y j ¯
G w = j = 1 k G j j p j s j
G j h i = 1 n j r = 1 n h y j i y h r n j n h Y j ¯ + Y h ¯
G n b = j = 2 k h = 1 j 1 G j h p j s h + p h s j D j h
G t = j = 2 k h = 1 j 1 G j h p j s h + p h s j ( 1 D j h )
D j h = d j h p j h d j h + p j h
d j h = 0 d F j y 0 y y x d F h x
p j h = 0 d F h   y 0 y y x d F j y

3.3. Measures and Analysis

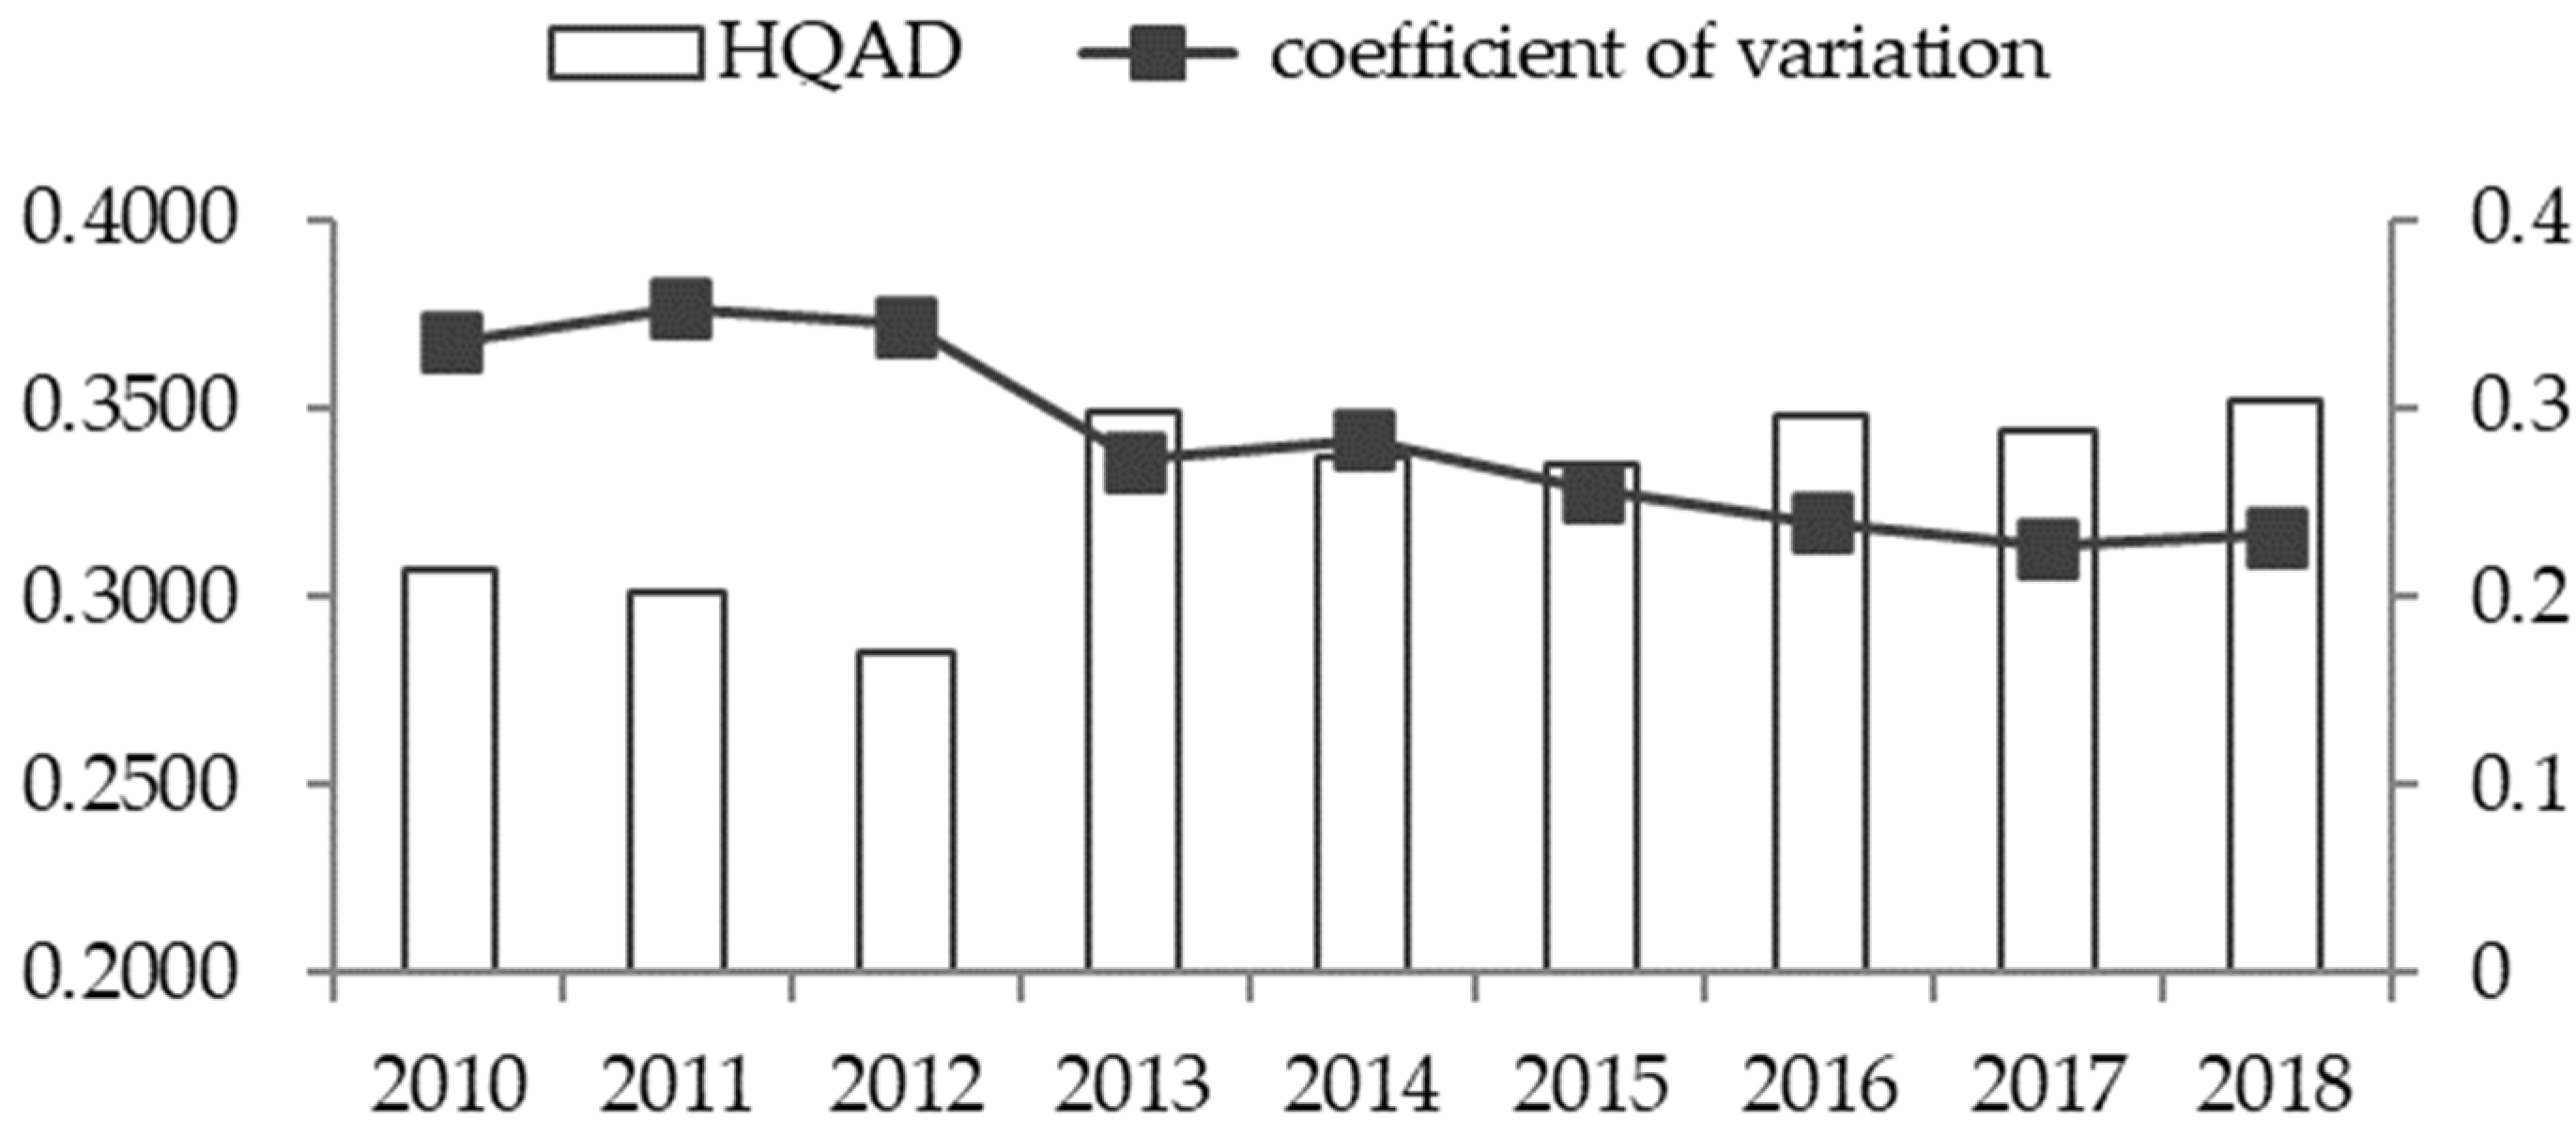
3.3.1. Spatio-Temporal Evolution of HQAD in China

The spatio-temporal range entropy-based approach was used to measure the overall level and sub-dimensional index of HQAD in China’s 30 provinces, municipalities, and autonomous regions from 2010 to 2018.
At the national level (Table 2), the level of HQAD in China showed a steady increase during the sample period. The comprehensive index increased from 0.3077 in 2010 to 0.3520 in 2018, with an average annual improvement rate of 0.55%. All sub-dimensional indices have improved to varying degrees, with differences in the degree of contribution to the comprehensive index. The improvement in the composite index over the selected period relied mainly on Innovation and Openness, with Sustainability and Effectiveness being relatively weak. The Coordination dimension saw the largest increase, from 0.0465 in 2010 to 0.0611 in 2018, with an average annual increase of 0.18%. The Sharing dimension increased the least, by 0.44% from 2010–2017, and even retreated in 2018.
The coefficient of variation of HQAD follows an ‘M’-shaped trend over the selected period (Figure 2). The value rose from 0.3362 in 2010 to 0.3541 in 2011, followed by a slight fluctuation in the next three years, then a steady decline from 2015 onwards, and basically remained the same as that of 2017 in 2018. It can be seen that the relative differences between HQAD values in each area show a dynamic pattern of “widening-shrinking-widening-steady” during the period 2010–2018.
Comparative analysis of the indexes between the different dimensions of the four regions show that not all of the strengths in the sub-dimensions remain in the east (Table 3). For example, in 2018, the northeast region performed best in both the Effectiveness and Sustainability dimensions, while the central region achieved a high level of Innovation and rapid growth in the index. Thus, different regions have great potential for development and need to follow differentiated paths.
At the provincial level, the coefficient of variation reveals an M-shaped dynamic process of “widening-shrinking-reversing-stable” in the relative differences between provinces. The mean value (E) of the composite index for provinces during 2010–2018 is 0.329 and the standard deviation (SD) is 0.090. Based on the relationship between the mean value (E) and the standard deviation (SD), four levels can be distinguished [41]. The cross-sectional data of five of the time points were selected to reflect the characteristics of the spatio-temporal evolution, as shown in Figure 3. In general, a more obvious “high in the east and low in the west” spatial distribution pattern is presented.
Specifically, Level I (≥E+0.5SD) of the HQAD level continues to contain the six eastern provinces and municipalities of Jiangsu, Zhejiang, Beijing, Shanghai, Shandong, and Tianjin, with Guangdong, Fujian, and Hebei fluctuating above and below the national average. Among the three northeastern provinces in China, Liaoning province is representative of Level II [E+0.5SD, E), with a stable composite index of around 0.36 during the sample period. It has the momentum to jump into the superior category, while the other two provinces also exceed the national average. The central region, represented by Jiangxi and Shanxi provinces, mostly remained in Level III [E, E−0.5SD), with a mediocre composite level of performance. Anhui province has made a significant amount of progress, leaping into Level I in 2014; Hunan and Hubei provinces are on a steady upward trend, successfully entering Level II in 2018. It is worth noting that Henan province, a major agricultural province in central China, has been lagging in the provincial rankings during the selected period. Among the 12 provinces in the western region (except for Sichuan and Chongqing, which have made significant improvement), the average level of the remaining 10 provinces was below 0.3, mostly in Level III or IV(≤E−0.5SD).

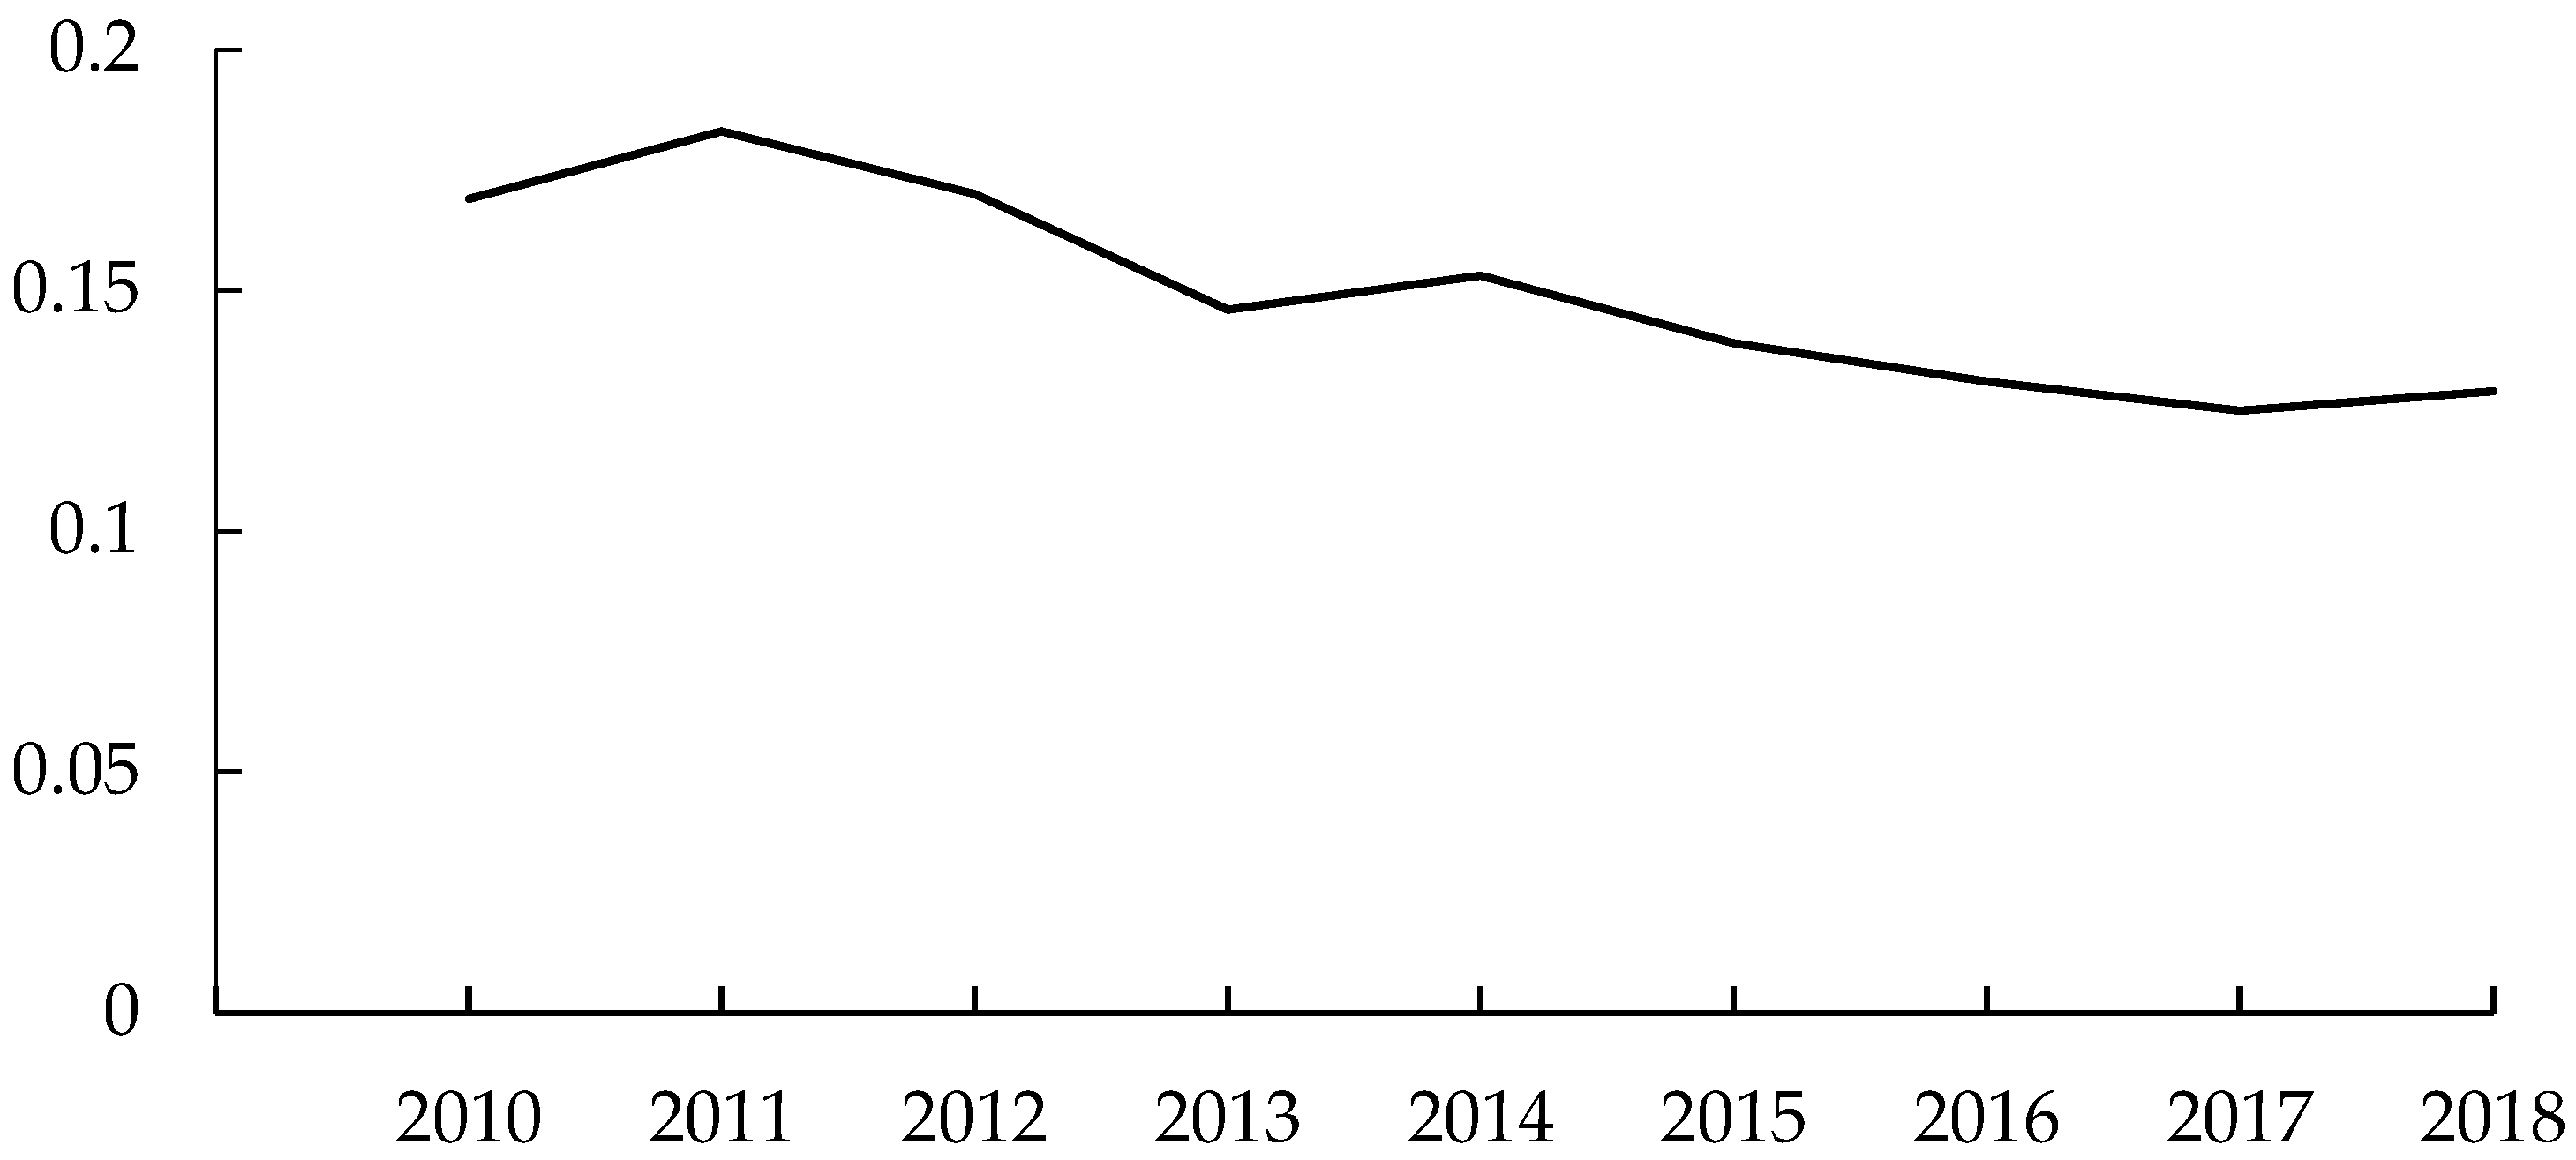
3.3.2. Regional Disparities and Sources of HQAD in China

Based on the method mentioned in Section 3.2.3, the Gini coefficient of the regional HQAD composite index in China was measured by Matlab. The results are shown in Table 4.
Aggregate regional disparities and dynamic evolution. During the selected period of 2010–2018, the aggregate disparities in HQAD in China showed a fluctuating downward trend, with a decline of 23.7%. The overall declining trend of “slight increase−sharp decrease−rebound−decrease” indicates that there is a gradual reduction in regional disparities in the HQAD index. According to Figure 4, the fluctuations are within a reasonable range. The inflections occurred in 2011 and 2014 (Figure below), at the beginning and end of China’s 12th Five-Year Plan period. The variation in the implementation of the newly adjusted agricultural policies in different regions may be the cause of the fluctuations.
  • Intra-regional disparities and dynamic evolution. There are clear differences in the trends of change among the four regions. In contrast, the east region has the greatest intra-regional variations, followed by the west and central regions, while the northeast region has the least. Except for the east region, where there was a fluctuating decline, the other three regions all experienced a small upward trend. Most of the central and western provinces have seen an increase in HQAD levels, but this has been quite gentle. Hunan and Hubei in the central region and Chongqing and Sichuan in the west region are developing at a rapid pace, resulting in intra-regional variation in the two regions generally appearing in the trend of expansion year by year.
  • Inter-regional disparities and dynamic evolution. Generally speaking, both the northeast–west and northeast–central inter-regional differences show a trend of repeated minor oscillations up and down. The eastern and western inter-regional disparities are the largest, with a mean value of 0.2517. The remaining inter-regional disparities have a comparatively noticeable decline. The reason for this is that most provinces have escaped from the low-level category to catch up with the superior one, and the coefficient of inter-regional disparity has been shrinking. However, the west is limited by its resource endowment, and the pace of agricultural development is relatively slow.
  • Sources of regional disparity and contributions. The inter−regional hyper-variance density contribution has a rise of over 7%, but it still accounts for the smallest share of the three main sources, with a sample cross-over issue of minor effects between regions. The mean contribution of intra-regional disparity to aggregate disparity is 16.51%, while the contribution of inter-regional disparity is far higher than the other two. Thus, it shows that the achievement of a coordinated and balanced development of the agricultural economy in China is still a matter of reducing inter-regional differences.

4. Driving Mechanism Analysis of HQAD

4.1. Variables

Guided by the theoretical analysis in Section 2.2, and regarding existing research [12,18,19,42,43,44], a total of eight driving factors in four areas were selected in this paper. The response variable is the HQAD level, denoted by dev. The specific indicators are described as follows:
  • Factor inputs. Labor input is reflected by educational attainment per rural person (lab), and capital input is reflected by investment in fixed assets per rural farm household (fai).
  • Regional realization foundation. The three factors representing the social, economic, and ecological conditions of the region are selected, respectively. The urbanization rate (urb), used to measure the level of urbanization and the industrial structure, is represented by the proportion of non-agricultural industries (ind). Environmental regulation can create a push-back effect on green development and quality development, promoting the emergence and diffusion of green innovations. The proportion of investment in environmental pollution control (env) is selected as the measure.
  • Institutional incentives. Market demand regulation is expressed in terms of social consumption levels, with the total retail sales of consumer goods per capita (mar) selected as the specific variable. Government support and guidance are expressed in terms of financial inputs to agriculture and use an indication of agricultural water expenditure per capita in local finance (gov).
  • Technological innovation. Technology innovation is a strong driving force in the new stage of agricultural development, and a key to promoting the efficient integration of the three industries. It is expressed as a percentage of investment in research and development (tec).
The data are obtained from the China Agricultural Yearbook, China Foreign Investment Report, China Transport Yearbook, China National Bureau of Statistics database, China Ministry of Ecology and Environment database, and local statistical yearbooks from 2010–2018.

4.2. Methodology

The HQAD level value, used as explanatory variable, has the characteristics of non-negative truncation, ranging between 0 and 1 (Table 5). This paper, therefore, uses panel Tobit regression for driving factor analysis to avoid biased estimates of the restricted explanatory variables under the OLS method [45,46].
The following analytical model was constructed.
d e v i j = a 0 + a 1 l a b i j + a 2 f a i i j + a 3 u r b i j + a 4 i n d i j + a 5 e n v i j + a 6 m a r i j + a 7 g o v i j + a 8 t e c i j + γ i + ε j
where d e v i j is the HQAD index for province i in year j. a 1 ~ a 8 are the estimated coefficients for each factor, a 0 represents the intercept term, γ i is the individual effect, and ε j represents the random disturbance term.

4.3. Results

Considering the possibility of heteroskedasticity in the cross−sectional data, the data of the selected variables were standardized and subjected to correlation analysis and VIF multicollinearity tests [47] (Table 6).
The results indicate that there are no multicollinearity issues with the independent variable data and further analysis can be conducted. Table 7 shows the results of the multiple regression of the driving mechanism of high-quality agricultural development based on the China−wide sample.

4.3.1. Nation-Wide Analysis

In this paper, three regression models were selected and variables were gradually added for comparative purposes [48]. The likelihood ratio test results strongly reject the original hypothesis of H 0 : β = β 0 , indicating the existence of individual effects. The random effects panel Tobit model is selected reasonably and the results of the regression analysis are significant. Regression (1) examines the impact of internal factor inputs on HAQD and the results pass the significance test, indicating positive contributions of both labor input and capital input. Regression (2) adds three factors to the regional realization foundation, which are significant at the 1% and 5% levels, respectively. Among them, the urbanization level and environmental regulation show positive effects on the level of quality agricultural development, while industrial structure shows a negative effect. Regression (3) is further expanded and the estimation results of the included factors are consistent with those of regression (1) (2), with all the newly investigated variables passing the significance test.
Further analysis was performed based on the results of regression (3). Most of the explanatory variables, except industrial structure and the level of financial support to agriculture, positively drive high-quality agricultural development. The urbanization level (0.205), capital input (0.142), and labor input (0.028) were in the top three in terms of intensity of impact on the response variable. On the one hand, urbanization promotes the development of rural industries and farmers’ income through the expansion of market demand for agricultural products [49]; on the other hand, it promotes the flow and exchange of labor, capital, technology, information, and other factors between urban and rural areas, and strengthens the foundation of agricultural and rural development. The results of the factor input regressions indicate that the stable supply of high-quality agricultural development under existing technological conditions is still reliant on the number of inputs of production factors.
Worthy of attention are the two variables that have negative effects: the advanced industrial structure and the level of government financial support to agriculture. The reason for the former may lie mainly in the fact that the total factor production contribution and return rates of the agricultural industry are in a state of fluctuation pending a breakthrough. Productivity differences among industry sectors can create a magnetizing effect, resulting in labor turnover and higher production costs in agriculture. To some extent, this weakens the agricultural development potential and production efficiency. The reason for the latter may lie mainly in the unreasonable structure of financial support for agriculture. First of all, agricultural fiscal expenditure places excessive emphasis on the basis of agricultural production and this has a crowding-out effect on other input funds. According to the data published by the China Finance Yearbook, it was found that from 2010 to 2018, the scale of various subsidies for agriculture in fiscal agricultural expenditure was very substantial, accounting for maintaining around 15%. The total amount in 2018 was RMB 267.7 billion, with the highest amount being agricultural production support subsidies, amounting to RMB 135.1 billion [50].
Stimulated by subsidies and other preferential policies, farmers are obsessed with pursuing high yields and incomes, heavily relying on the expansion of cultivated areas and the excessive application of chemical fertilizers, pesticides, and agricultural films, which has negatively affected the quality of agricultural products, the balance of the supply structure and the agro-ecological environment. Second, government financial support for agricultural marketization, agricultural infrastructure construction, vocational skills training for farmers, and the agricultural ecological environment is seriously insufficient. After 2016, with rural revitalization and poverty-alleviation policies, expenditure in areas such as the construction of ecological projects and rural poverty alleviation has increased significantly, but the promotion of HQAD in these areas suffers from a prolonged cycle [51]. Finally, there is limited fiscal expenditure on agricultural scientific research and technology promotion, with the proportion basically remaining at around 10%. In general, although financial support for agriculture has a positive impact on the total value of agricultural output, it does not play a role in the Innovation, Sustainability, Coordination, and Openness aspects, and therefore has a significant restraining effect on the aggregated HQAD.

4.3.2. Regional Heterogeneity Analysis

The regional regression results in Table 8 show that the “urban back-feeding effects” and the “capital-factor driving force” have the most significant positive contribution to HQAD in the east and northeast regions. As the leading urbanization area in China, the spillover effect from the urban areas can promote urban–rural linkages, creating the necessary foundation for agricultural transformation on both the supply and demand sides. In addition, the demand for labor in eastern and northeastern China, which has a core tendency towards scale development, industrialization, and modernization, has fallen. In the transformation and upgrading of agriculture, movements such as land transfer and contract management, technology promotion, the upgrading of farm equipment, infrastructure construction, and training of new professional farmers heavily rely on capital investment.
In the eastern region, the regression results for driving factors are largely consistent with the national result. However, as agricultural development in the region has entered the “deep-water zone” and maturity stage, the distance to the development ceiling under existing productivity is relatively narrow, resulting in a reduction in the marginal contribution effectiveness of the factors. Science, technology, and innovation inputs in northeastern China show significant negative effects on HQAD. As the major grain-producing area, agricultural science and technology in the northeast region are in urgent need of change and innovation. However, the cost of reformation and the probability of risk during the bottleneck period lead to inefficiencies and low matching between research inputs and outputs, resulting in a short-term downward pressure on agricultural development.
In the central and western regions, “structural transformation” and “technological innovation” are the most typical negative constraints and positive drivers, respectively. First, the sectoral development gap in structural transformation has an adsorption effect on agricultural resources. In the current stage, the trickle-down effect of the new “agriculture+” model need to be enhanced, industrial integration and upgrading needs to be completed, and mechanisms for benefiting farmers need to be further strengthened. This has led to a side-effect of the optimization of the industrial structure on the high-quality development of agriculture. Secondly, since China’s 12th Five−Year Plan, a new round of national policies for supporting central and western regional development and technology innovation has led to a gradual improvement in agricultural technology resource investment and the innovation environment. The rate of technology achievement transferring and comprehensive capacity enhancement has shown a late-stage advantage, becoming an important engine for the upgrading of agricultural production factors and the transformation of production efficiency.
In addition, government support and market demand have made significant contributions to agricultural development in the central and west regions, respectively. In the central region, with relatively inferior initial agricultural endowments, financial support for agriculture has not reached saturation within the “threshold”, showing greater welfare and marginal effects. At the same time, in implementing the “Rise of Central China” strategy, the government of the central region has played an active and effective leading role in areas, including capital scale expansion, intervention management, and urban–rural coordination. The western region is currently in a buyer’s market, where supply exceeds demand. Market demand is forcing continuous adjustments in agricultural production efficiency, business practices, and industrial structure in the western region. A pull-type supply chain reformation promotes the optimization of agriculture in the direction of high efficiency and quality.

5. Conclusions and Discussion

The major findings of this paper are summarized as follows. Firstly, the comprehensive level of HAQD in China has been steadily improving, showing a significant spatial and temporal dynamic pattern of being high in the east and low in the west. The structural inequality highlights the fact that HAQD enhancement is mainly driven by Innovation and Openness dimensions, while Sustainability and Effectiveness are areas of relative weakness. Secondly, there is a gradual narrowing of regional disparities, with a clear trend of low-level regions catching up with high-level regions, and inter-regional disparities contribute most to the aggregate disparities. Third, the multiple regression results show that factor inputs, technological innovation, market demand, urbanization, and environmental regulations all play positive roles in China’s high-quality agricultural development, while the industrial structure and government support have a negative impact, with regional heterogeneity in the driving effects of each factor.
Therefore, this paper gives the following recommendations. (1) Emphasis should be placed on improving the overall plan for high-quality agricultural development, coordinating the regional agricultural layout from a global perspective, and managing each region hierarchically and categorically according to its development progress and functional differences. (2) Given the regional disparities, it is crucial to encourage the formulation and implementation of differentiated strategies for agricultural development and to give full play to comparative advantages. Different modes of collaboration should be adopted among regions according to the HQAD categories, such as regional sharing alliances, cross-regional coordination and complementarity, and advanced regions radiating backwardness, to strengthen agricultural exchanges and cooperation. (3) It is important to improve the incentive mechanism for upgrading agricultural labor capital and enhance the willingness and capabilities of participating subjects. It is also crucial to accelerate the industrial application and promotion of agricultural technology, take advantage of the supporting role and integration effect of scientific and technological resources, and optimize the competitive market environment, narrowing the “information gap” through digital platforms and promoting the effective matching of production supply with market demand. We must remove the institutional barriers that prevent the autonomous flow and optimal allocation of factors between urban and rural areas, and promote the integration of urban and rural social security systems, as well as accelerating the practical application of green production methods through multilateral cooperation and strengthening the leading role of ecological development concepts in the upgrading of the agricultural industry.

Author Contributions

Conceptualization, Y.W. and Y.K.; methodology, Y.W.; software, Y.W.; validation, Y.W. and Y.K.; formal analysis, Y.W. and Y.K.; data curation, Y.W.; writing—original draft preparation, Y.W.; writing—review and editing, Y.W. and Y.K.; visualization, Y.W.; supervision, Y.K.; funding acquisition, Y.K. All authors have read and agreed to the published version of the manuscript.

Funding

This research was funded by the National Natural Science Foundation of China, grant number 71973042.

Data Availability Statement

The original report data comes from the China Rural Statistical Yearbook, China Agricultural Yearbook, China Rural Management Statistical Annual Report, China Agricultural Machinery Industry Yearbook, China Leisure Agriculture Yearbook. All the aforementioned data were purchased by Hunan Agriculture University and Central South University of Forestry and Technology, where the authors study or work.

Conflicts of Interest

The authors declare no conflict of interest.

References

  1. Gillis, M.; Vincent, J.R. National self-interest in the pursuit of sustainable development. In Sustainable Development: The Challenge of Transition; Ward, C.H., Schmandt, J., Eds.; Cambridge University Press: Cambridge, UK, 2000; pp. 11–62. [Google Scholar]
  2. Mlachila, M.; Tapsoba, R.; Tapsoba, S.J.A. A Quality of Growth Index for Developing Countries: A Proposal. Soc. Indic. Res. 2016, 134, 675–710. [Google Scholar] [CrossRef]
  3. Qin, S.; Han, Z.; Chen, H.; Wang, H.; Guo, C. High-Quality Development of Chinese Agriculture under Factor Misallocation. Int. J. Environ. Res. Public Health 2022, 19, 9804. [Google Scholar] [CrossRef] [PubMed]
  4. Xu, J.; Zhang, Z.; Zhang, X.; Ishfaq, M.; Zhong, J.; Li, W.; Zhang, F.; Li, X. Green Food Development in China: Experiences and Challenges. Agriculture 2020, 10, 614. [Google Scholar] [CrossRef]
  5. Lu, X.; Li, Z.; Wang, H.; Tang, Y.; Hu, B.; Gong, M.; Li, Y. Evaluating Impact of Farmland Recessive Morphology Transition on High-Quality Agricultural Development in China. Land 2022, 11, 435. [Google Scholar] [CrossRef]
  6. Jiao, X.; Lyu, Y.; Wu, X.; Li, H.; Cheng, L.; Zhang, C.; Yuan, L.; Jiang, R.; Jiang, B.; Rengel, Z.; et al. Grain production versus resource and environmental costs: Towards increasing sustainability of nutrient use in China. J. Exp. Bot. 2016, 67, 4935–4949. [Google Scholar] [CrossRef] [PubMed] [Green Version]
  7. Shen, J.; Cui, Z.; Miao, Y.; Mi, G.; Zhang, H.; Fan, M.; Zhang, C.; Jiang, R.; Zhang, W.; Li, H.; et al. Transforming agriculture in China: From solely high yield to both high yield and high resource use efficiency. Glob. Food Secur. 2013, 2, 1–8. [Google Scholar] [CrossRef]
  8. Bender, S.F.; Wagg, C.; van der Heijden, M.G.A. An Underground Revolution: Biodiversity and Soil Ecological Engineering for Agricultural Sustainability. Trends Ecol. Evol. 2016, 31, 440–452. [Google Scholar] [CrossRef]
  9. Jiao, X.-q.; He, G.; Cui, Z.-l.; Shen, J.-b.; Zhang, F.-s. Agri-environment policy for grain production in China: Toward sustainable intensification. China Agric. Econ. Rev. 2018, 10, 78–92. [Google Scholar] [CrossRef]
  10. Guo, B.; He, D.; Zhao, X.; Zhang, Z.; Dong, Y. Analysis on the spatiotemporal patterns and driving mechanisms of China’s agricultural production efficiency from 2000 to 2015. Phys. Chem. Earth 2020, 120, 102909. [Google Scholar] [CrossRef]
  11. Deng, Y.; Zeng, F. Sustainable Path of Food Security in China under the Background of Green Agricultural Development. Sustainability 2023, 15, 2538. [Google Scholar] [CrossRef]
  12. Chen, Y.; Fu, W.; Wang, J. Evaluation and Influencing Factors of China’s Agricultural Productivity from the Perspective of Environmental Constraints. Sustainability 2022, 14, 2807. [Google Scholar] [CrossRef]
  13. Bao, B.; Jiang, A.; Jin, S.; Zhang, R. The Evolution and Influencing Factors of Total Factor Productivity of Grain Production Environment: Evidence from Poyang Lake Basin, China. Land 2021, 10, 606. [Google Scholar] [CrossRef]
  14. Wang, D.; Abula, B.; Lu, Q.; Liu, Y.; Zhou, Y. Regional Business Environment, Agricultural Opening-Up and High-Quality Development: Dynamic Empirical Analysis from China’s Agriculture. Agronomy 2022, 12, 974. [Google Scholar] [CrossRef]
  15. Cui, X.; Cai, T.; Deng, W.; Zheng, R.; Jiang, Y.; Bao, H. Indicators for Evaluating High-Quality Agricultural Development: Empirical Study from Yangtze River Economic Belt, China. Soc. Indic. Res. 2022, 164, 1101–1127. [Google Scholar] [CrossRef] [PubMed]
  16. Zhou, M.; Sun, H.; Ke, N. The Spatial and Temporal Evolution of Coordination Degree Concerning China’s Cultivated Land Green Utilization Efficiency and High-Quality Agricultural Development. Land 2022, 12, 127. [Google Scholar] [CrossRef]
  17. Chi, M.; Guo, Q.; Mi, L.; Wang, G.; Song, W. Spatial Distribution of Agricultural Eco-Efficiency and Agriculture High-Quality Development in China. Land 2022, 11, 722. [Google Scholar] [CrossRef]
  18. Liu, T.; Li, J.; Cui, J. Spatial-temporal pattern and influencing factors of high-quality agricultural development in China. J. Quant. Tech. Econ. 2020, 97, 104794. [Google Scholar]
  19. Ji, Z. Spatial Differences and Driving Mechanism of High-Quality Development in China’s Agriculture and Rural Areas. J. Quant. Tech. Econ. 2021, 38, 25–44. [Google Scholar]
  20. Wang, Y.; Xie, L.; Zhang, Y.; Wang, C.; Yu, K. Does FDI Promote or Inhibit the High-Quality Development of Agriculture in China? An Agricultural GTFP Perspective. Sustainability 2019, 11, 4620. [Google Scholar] [CrossRef] [Green Version]
  21. Qin, T.; Wang, L.; Zhou, Y.; Guo, L.; Jiang, G.; Zhang, L. Digital Technology-and-Services-Driven Sustainable Transformation of Agriculture: Cases of China and the EU. Agriculture 2022, 12, 297. [Google Scholar] [CrossRef]
  22. Chen, T.; Rizwan, M.; Abbas, A. Exploring the Role of Agricultural Services in Production Efficiency in Chinese Agriculture: A Case of the Socialized Agricultural Service System. Land 2022, 11, 347. [Google Scholar] [CrossRef]
  23. Tchouamou Njoya, E.; Nikitas, A. Assessing agriculture–tourism linkages in Senegal: A structure path analysis. GeoJournal 2020, 85, 1469–1486. [Google Scholar] [CrossRef]
  24. Shen, Z.; Wang, S.; Boussemart, J.-P.; Hao, Y. Digital transition and green growth in Chinese agriculture. Technol. Forecast. Soc. Chang. 2022, 181, 121742. [Google Scholar] [CrossRef]
  25. Pang, J.; Jiao, F.; Zhang, Y. An Analysis of the Impact of the Digital Economy on High-Quality Economic Development in China—A Study Based on the Effects of Supply and Demand. Sustainability 2022, 14, 16991. [Google Scholar] [CrossRef]
  26. Zhu, X.; Li, C.; Zhou, H. Cost Changes and Technical Efficiency of Grain Production in China against a Background of Rising Factor Prices. Sustainability 2022, 14, 12852. [Google Scholar] [CrossRef]
  27. Yang, Y.; Ma, H.; Wu, G. Agricultural Green Total Factor Productivity under the Distortion of the Factor Market in China. Sustainability 2022, 14, 9309. [Google Scholar] [CrossRef]
  28. King, A. Technology: The Future of Agriculture. Nature 2017, 544, S21–S23. [Google Scholar] [CrossRef] [Green Version]
  29. Qu, D.; Wang, X.; Kang, C.; Liu, Y. Promoting agricultural and rural modernization through application of information and communication technologies in China. Int. J. Agric. Biol. Eng. 2018, 11, 1–4. [Google Scholar] [CrossRef] [Green Version]
  30. Wei, Q.Z.B.; Jin, S. A Study on Construction and Regional Comparison of Agricultural Green Development Index in China. Issues Agric. Econ. 2018, 11, 11–20. [Google Scholar]
  31. Han, H.L.G.; He, A. Spatial-temporal Characteristics and Dynamic Evolution of Agricultural Growth Quality in China from 2000 to 2015. J. Guangdong Univ. Financ. Econ. 2017, 32, 95–105. [Google Scholar]
  32. Wu, X.; Zhang, J.; Tian, Y.; Li, P. Provincial Agricultural Carbon Emissions in China: Calculation, Performance Change and Influencing Factors. Resour. Sci. 2014, 36, 129–138. [Google Scholar]
  33. Li, G.; Fan, L.; Min, R. The Coordination of Agricultural Development with Environment and Resource. J. Quant. Tech. Econ. 2011, 28, 21–36+49. [Google Scholar]
  34. Zhu, X.W.G. Exploration of the merit criteria for the nondimensionalization in the entropy method. Stat. Decis. 2015, 2, 12–15. [Google Scholar]
  35. Wang, Z.X.; Li, D.D.; Zheng, H.H. The External Performance Appraisal of China Energy Regulation: An Empirical Study Using a TOPSIS Method Based on Entropy Weight and Mahalanobis Distance. Int. J. Environ. Res. Public Health 2018, 15, 236. [Google Scholar] [CrossRef] [Green Version]
  36. Bai, L.; Wang, H.; Huang, N.; Du, Q.; Huang, Y. An Environmental Management Maturity Model of Construction Programs Using the AHP-Entropy Approach. Int. J. Environ. Res. Public Health 2018, 15, 1317. [Google Scholar] [CrossRef] [Green Version]
  37. Yang, L.; Sun, Z. The Development of Western New- type Urbanization Level Evaluation Based on Entropy Method. Econ. Prob. 2015, 3, 115–119. [Google Scholar]
  38. Li, X.X.S. The Measurement of the Level of Agricultural High-Quality Development and the Study of the Spatial Distribution Characteristics: On the Basis of the New Development Concept. J. Jiangxi Univ. Financ. Econ. 2020, 6, 78–94. [Google Scholar]
  39. Dagum, C. A new approach to the decomposition of the Gini income inequality ratio. Empir. Econ. 1997, 22, 515–531. [Google Scholar] [CrossRef]
  40. Zhou, R.; Jin, J.; Cui, Y.; Ning, S.; Zhou, L.; Zhang, L.; Wu, C.; Zhou, Y. Spatial Equilibrium Evaluation of Regional Water Resources Carrying Capacity Based on Dynamic Weight Method and Dagum Gini Coefficient. Front. Earth Sci. 2022, 9, 1342. [Google Scholar] [CrossRef]
  41. Chen, J.; Chen, Y.; Chen, M. China’s High-quality Economic Development Level, Regional Differences and Dynamic Evolution of Distribution. J. Quant. Tech. Econ. 2020, 37, 108–126. [Google Scholar]
  42. Zhao, Z.; Peng, P.; Zhang, F.; Wang, J.; Li, H. The Impact of the Urbanization Process on Agricultural Technical Efficiency in Northeast China. Sustainability 2022, 14, 12144. [Google Scholar] [CrossRef]
  43. Asli, G.K.; Yonggong, L.; Feng, B. Factors limiting the potential impacts of organic agriculture on rural development in China. Org. Agric. 2017, 7, 339–352. [Google Scholar] [CrossRef]
  44. Qiao, Y.; Martin, F.; He, X.; Zhen, H.; Pan, X. The changing role of local government in organic agriculture development in Wanzai County, China. Can. J. Dev. Stud./Rev. Can. d’Études Dév. 2018, 40, 64–77. [Google Scholar] [CrossRef]
  45. Mao, J.; Wu, Q.; Zhu, M.; Lu, C. Effects of Environmental Regulation on Green Total Factor Productivity: An Evidence from the Yellow River Basin, China. Sustainability 2022, 14, 2015. [Google Scholar] [CrossRef]
  46. Amemiya, T. The estimation of a simultaneous-equation Tobit model. Int. Econ. Rev. 1979, 20, 169–181. [Google Scholar] [CrossRef]
  47. Vittinghoff, E.; Glidden, D.V.; Shiboski, S.; McCulloch, C.E. Regression Methods in Biostatistics: Linear, Logistic, Survival, and Repeated Measures Models; Springer: Berlin/Heidelberg, Germany, 2005. [Google Scholar]
  48. Wang, B.Z.W. Cross-provincial Differences in Determinants of Agricultural Eco-efficiency in China: An Analysis Based on Panel Data from 31 Provinces in 1996–2015. Chin. Rural. Econ. 2018, 1, 46–62. [Google Scholar]
  49. Peng, C.L.H. Agriculture and Rural Modernization during the 14th Five- Year Plan Period: The Situation, Problems and Countermeasure. Reform 2020, 2, 20–29. [Google Scholar]
  50. Yang, L. China’s Public Spending on Agriculture in the Past Seventy Years: The Transition of Its Volume, Structure and Distribution. China Stud. 2022, 1, 101–128+339. [Google Scholar]
  51. Zhang, W.O.J. Vertical Fiscal Imbalance, Public Finance Supporting Agriculture Bias and High-Quality Agricultural Development. Contemp. Financ. Econ. 2023, 3, 41–54. [Google Scholar]
Figure 1. Four−Dimensional Driving Mechanisms For HQAD.
Sustainability 15 06328 g001
Figure 2. Temporal evolution and the coefficient of variation of HQAD.
Sustainability 15 06328 g002
Figure 3. HQAD Provincial Classification in China 2010−2018.
Sustainability 15 06328 g003
Figure 4. Aggregate Regional Disparities and Dynamic Evolution of HQAD.
Sustainability 15 06328 g004
Table 1. Evaluation framework of HAQD and index weights.
Dimension
Index
Factor IndexBasic IndexAttribute
Innovation
(0.3062)
Foundation of
innovation (0.1236)
Number of agrotechnicians (ten thousand people) (0.0383)+
Degree of agricultural information services (0.0732)+
Education level of rural residents (0.0121)+
Innovative mode
(0.1826)
Participation rate of farmers in cooperatives (0.1124)+
Leisure agriculture output ratio (0.0702)+
Effectiveness
(0.132)
High-efficiency
(0.039)
Agricultural value-added rate (0.0107)+
Agricultural total factor productivity (0.0283)+
High-quality
(0.093)
Green produce level (0.0567)+
Stable level of food supply (0.0363)+
Sustainability
(0.2132)
Resource utilization
(0.0636)
Water consumption (RMB 10,000 of agricultural GDP) (0.0148)
Electricity consumption (RMB 10,000 of agricultural GDP) (0.0341)
Arable land replanting index (0.0147)
Environment Safety
(0.1496)
Agricultural disaster rate (0.077)
Degree of air pollution in agriculture (0.0275)
Degree of water pollution in agriculture (0.0451)
Coordination
(0.1866)
Urban–rural coordination
(0.1426)
Ratio of per capita consumption expenditure between urban and rural residents (0.1046)
Ratio of per capita disposal income between urban and rural residents (0.038)
Industrial coordination
(0.044)
Agro-processing industry output ratio (0.0332)+
Agro-service industry output ratio (0.0055)+
Industry restructuring index (0.0053)+
Openness
(0.0555)
Factor liberalization
(0.0456)
Level of marketisation of capital factors (0.0167)+
Level of marketisation of labor factors (0.0235)+
Land turnover rate (0.0054)+
Foreign trade (0.0099)Agricultural export dependency (0.0099)+
Sharing
(0.1065)
Welfare distribution
(0.0612)
Public health level (0.0199)+
Level of rural social security (0.0216)+
Incidence of rural poverty (0.0197)
Life quality
(0.0453)
Volatility in the rural consumer price index (0.019)
Engel coefficient for rural households (0.0262)
Table 2. HQAD Composite and Dimensional Indexes in China 2010−2018.
Index 201020112012201320142015201620172018
Composite indexHQAD0.3077 0.3009 0.2856 0.3495 0.3375 0.3355 0.3487 0.3439 0.3520
Dimensional indexInnovation0.0627 0.0596 0.0569 0.0687 0.0708 0.0684 0.0736 0.0673 0.0689
Effectiveness0.0466 0.0458 0.0434 0.0539 0.0516 0.0522 0.0536 0.0537 0.0569
Sustainability0.0432 0.0405 0.0381 0.0507 0.0453 0.0468 0.0494 0.0477 0.0507
Coordination0.0465 0.0468 0.0470 0.0580 0.0520 0.0536 0.0598 0.0582 0.0611
Openness0.0536 0.0544 0.0523 0.0621 0.0604 0.0573 0.0582 0.0575 0.0615
Sharing0.0551 0.0538 0.0480 0.0561 0.0573 0.0571 0.0539 0.0595 0.0530
Table 3. HQAD sub-dimensional indexes for four regions in China 2010 and 2018.
InnovationEffectivenessSustainabilityCoordinationOpennessSharing
201020182010201820102018201020182010201820102018
Northeast0.0550.060.0660.0990.0380.060.050.0510.0360.0450.0630.054
East0.1070.0780.0460.0490.0460.0580.0560.0720.110.1250.070.071
Central0.0430.0710.0530.070.0410.0440.0490.070.0280.0430.0480.05
West0.0420.0670.0390.0470.0430.0480.0370.0510.0290.0270.0460.049
Table 4. Gini Coefficient and Decomposition Results for HQAD In China 2010−2018.
201020112012201320142015201620172018
Aggregate0.1690.1830.170.1460.1530.1390.1310.1250.129
Intra-Regional DisparitiesNortheast0.0170.0260.0190.030.0430.0240.0230.0250.028
East0.1230.1230.1310.0950.0960.0960.090.0820.086
Central0.0330.0520.0430.0360.060.0620.0490.0590.056
West0.0540.080.0610.0710.0850.0820.0870.0780.081
Inter-Regional DisparitiesNortheast/East0.1780.1610.1640.1190.1290.1260.1190.1120.104
Northeast/West0.1340.1680.1380.1440.1450.1140.1250.1130.132
Northeast/Central0.0810.1090.0990.0890.0760.080.0480.0590.061
East/West0.2980.3130.2920.2520.2560.2240.2150.2050.21
East/Central0.2480.2580.2550.1990.180.1810.150.1510.13
West/Central0.0630.0840.0620.0780.1080.0920.1030.090.12
Contribution (%)Intra−Regional13.97514.97415.0915.04617.55617.98218.07417.79618.128
Inter−Regional84.96283.05283.04982.58678.71175.26873.88875.59573.529
Hyper−Variance Density1.0631.9741.8612.3683.7336.7518.0386.6088.343
Table 5. Variable Descriptive Statistics Results.
NMeanSDMinMax
dev2700.3290.0930.1780.58
lab2707.850.6586.1329.898
fai2700.1840.0780.0230.466
urb2700.5740.1330.350.917
ind2700.9070.0480.7690.996
mar2702.0941.280.4436.019
gov2700.1260.070.0420.398
tec2701.7441.3780.466.985
env2701.5380.8150.363.83
Table 6. VIF Test Results.
VariableVIF1/VIF
mar7.560.132309
urb5.380.185723
tec5.10.196054
edu2.120.471186
ind2.070.483476
env1.520.656906
fai1.510.664388
gov1.340.747237
Mean VIF3.32
Table 7. Regression results of the HQAD driving factors in China.
CategoriesVariablesRegression (1)Regression (2)Regression (3)
Factor inputsLabor input0.068 *** (0.005)0.034 *** (0.005)0.028 *** (0.005)
Capital input0.152 *** (0.033)0.169 *** (0.035)0.142 *** (0.033)
Realization foundationUrbanization level 0.328 *** (0.046)0.205 *** (0.055)
Industrial structure −0.259 *** (0.056)−0.297 *** (0.054)
Environmental regulation 0.008 ** (0.003)0.010 *** (0.003)
Institutional incentivesMarket demand 0.014 *** (0.005)
Government support −0.116 ** (0.046)
Technological innovationInvestment in R&D 0.014 ** (0.006)
_cons0.073 * (0.083)0.069 ** (0.067)0.181 *** (0.067)
Sigma u0.081 *** (0.011)0.055 *** (0.008)0.043 *** (0.006)
Sigma e0.026 *** (0.001)0.021 *** (0.001)0.020 *** (0.001)
N270270270
LR419.520352.076205.497
LLV539.204598.067615.983
Standard errors in parentheses. * p < 0.1, ** p < 0.05, *** p < 0.01.
Table 8. Regional Regression Results.
VariablesEastNortheastCentralWest
Labor input0.023 ** (0.009)0.062 *** (0.011)0.027 ** (0.012)0.024 *** (0.009)
Capital input0.198 *** (0.064)0.189 *** (0.061)0.105 (0.090)−0.004 (0.055)
Urbanization level0.405 ** (0.162)0.234 ** (0.111)−0.064 (0.158)0.002 (0.119)
Industrial structure−1.790 *** (0.604)0.152 * (0.090)−0.261 ** (0.119)−0.289 *** (0.055)
Environmental regulation0.016 *** (0.006)0.012 * (0.006)0.011 ** (0.005)0.010 ** (0.004)
Market demand0.023 *** (0.008)0.005 (0.009)−0.016 (0.011)0.037 *** (0.013)
Government support−0.387 *** (0.139)0.070 (0.093)0.735 *** (0.204)−0.033 (0.058)
Investment in R&D0.005 (0.009)−0.052 *** (0.016)0.059 *** (0.013)0.026 * (0.014)
_cons1.531 *** (0.506)−0.459 *** (0.157)0.184 (0.114)0.263 *** (0.092)
N812754108
LLV180.40487.976139.210263.628
Standard errors in parentheses. * p < 0.1, ** p < 0.05, *** p < 0.01.
Disclaimer/Publisher’s Note: The statements, opinions and data contained in all publications are solely those of the individual author(s) and contributor(s) and not of MDPI and/or the editor(s). MDPI and/or the editor(s) disclaim responsibility for any injury to people or property resulting from any ideas, methods, instructions or products referred to in the content.

